1. Introduction
The development of Information Technologies (ITs) has emerged in various paradigms such as Artificial Intelligence (AI), blockchain, and the Internet of Things (IoT), and the smart energy environment represented by the smart grid is one of them. The energy cloud refers to an infrastructure in which energy can be used flexibly and efficiently by organically connecting energy producers and consumers to realize a smart energy environment. In the energy cloud, users exist as prosumers, meaning they are simultaneously consumers and producers, and each user consumes, generates, and trades energy for his or her own needs. This infrastructure is connected in an organic form, and it flexibly responds to energy demand and maximizes the overall energy efficiency by devising a plan that can optimally respond to the energy demand.
The advancement of various ITs technologies has brought the side effect of the advancement of cyberattacks. Currently, various IT technologies have been applied in people’s daily lives. As a result, critical assets such as personal information, corporate confidentiality, and essential elements for life, such as energy and transportation, are managed based on ITs. This aspect means that the damage caused by cyberattacks can gradually directly impact people’s lives.
Furthermore, since national infrastructures such as the electricity grid and nuclear power are also managed based on ITs, cyberattacks on these targets can cause severe damage. Cyberattacks against infrastructure have been steadily increasing, starting with Stuxnet, which occurred in 2010. A cyberattack by the Energetic Bear group in 2014 destroyed approximately 2800 power industry-related systems. The Black Energy attack, which attacked Ukraine’s grid in December 2015, resulted in an energy loss of about 73 MWh and 225,000 victims [
1]. Attacks on these countries’ underlying energy infrastructure can destroy the energy supply chain, leading to national disasters such as blackouts.
Since the energy cloud environment is part of a country’s critical infrastructure, it must satisfy a rigid security level. However, since the energy cloud environment and the AMI that compose the base infrastructure have different compositions compared to the general IT system, there are limits in applying a general security software [
2]. Thus, the energy cloud system’s security framework must consider the diversity and limitations of hardware resources, the real-time characteristics of the devices constituting the infrastructure, and the utility of energy data [
3].
Cyber threat intelligence is a security system for actively responding to cyberattacks by forming contextual knowledge information about cyber threats that may exist based on data observed from various sources. In addition to general security systems such as anti-virus programs, Intrusion Detection Systems (IDSs), and firewalls, CTI analyses a cyberattack’s characteristics and infers patterns by collecting data related to various types of cyberattacks and analyzing their correlations [
4]. This method enables an effective response to high-level cyber threats and zero-day attacks with unknown vulnerabilities [
5]. Moreover, CTI analyzes cyberattack trends to predict possible future attack patterns and their techniques [
6].
In this paper, we propose an energy cloud security framework based on cyber threat intelligence to improve the security capabilities of the energy cloud environment and to respond to advanced cyber threats. Cyber threat intelligence infers countermeasures against cyber threats using various types of data. To reflect the specificity of the energy cloud environment properly, the proposed framework consists of three layers: the local AMI layer, the station layer, and the cloud layer.
The AMI layer includes various prosumer client devices that make up the energy cloud environment. These clients operate certain necessary security systems, such as the anti-virus and firewall systems, considering the performance capabilities of each device. Moreover, these devices collect indicators of compromises related to networks and systems to identify the presence of cyber threats. The collected indicator information is transmitted to the station layer with the device behavior information.
The station layer consists of management servers that are in charge of the lower energy cloud network. A sub-network is a network configured for a specific purpose, such as for an organization’s IT environment or solar panel cluster. Each management server builds a security model and policy suitable for various types of sub-AMI networks. The station layer forms a hierarchical structure to encompass various network environments. This structure increases the overall compatibility of the energy cloud environment, composed of various devices and power generation systems. Each management server can also construct a security system specialized for each system and network by building a security model optimized for the sub-network. Such a system can provide higher performance than a general security system covering a wide area against advanced cyberattacks.
The central CTI server in the cloud layer generates a CTI by synthesizing Indicators of Compromises (IoCs) collected in the AMI layer and data related to cyberattacks analyzed in the station layer. The central CTI server also collects various types of data collected from lower layers and data related to cyber threats collected from external Open-Source Intelligence (OSINT) [
7]. The central server analyzes all types of collected data to generate high-level CTIs and then shares these CTIs with the station layer servers so that the entire system can respond to zero-day attacks.
The CTI-based security framework for the energy cloud environment makes the following contributions.
Representation and creation of energy cloud-specific CTI data: The proposed framework identifies and collects IoC data specialized for the AMI layer’s energy cloud environment. Through this process, data can be selected to suit the characteristics of the AMI layer in which various devices are included, and this forms the basis of practical security functions for responding to cyberattacks targeting AMIs.
Applying the optimal security model through a hierarchical CTI architecture: The central CTI server creates a CTI to counter common and general cyber threats. On the other hand, the station layer’s CTI server generates a CTI suitable for the lower AMI network using the threat-related data provided from the cloud layer to counter targeted and advanced threats. This hierarchical CTI structure copes with both cyberattacks that attack a wide area and those that attack a specific target.
The structure of this paper is as follows.
Section 2 describes cyber threats and CTI-related studies in the energy cloud environment.
Section 3 describes the specific contents and operation of the proposed CTI framework, and
Section 4 presents a plan for implementing the proposed CTI architecture.
Section 5 presents experimental results that demonstrate the effectiveness of the proposed CTI framework.
Section 6 discusses the meaning and contribution of the proposed framework and concludes the paper.
3. Proposed Cyber Threat Intelligence Framework for Energy Cloud Environments
This section proposes a cyber threat intelligence-based security framework that can improve the cyber threat response capabilities of the existing energy cloud and smart grid environment.
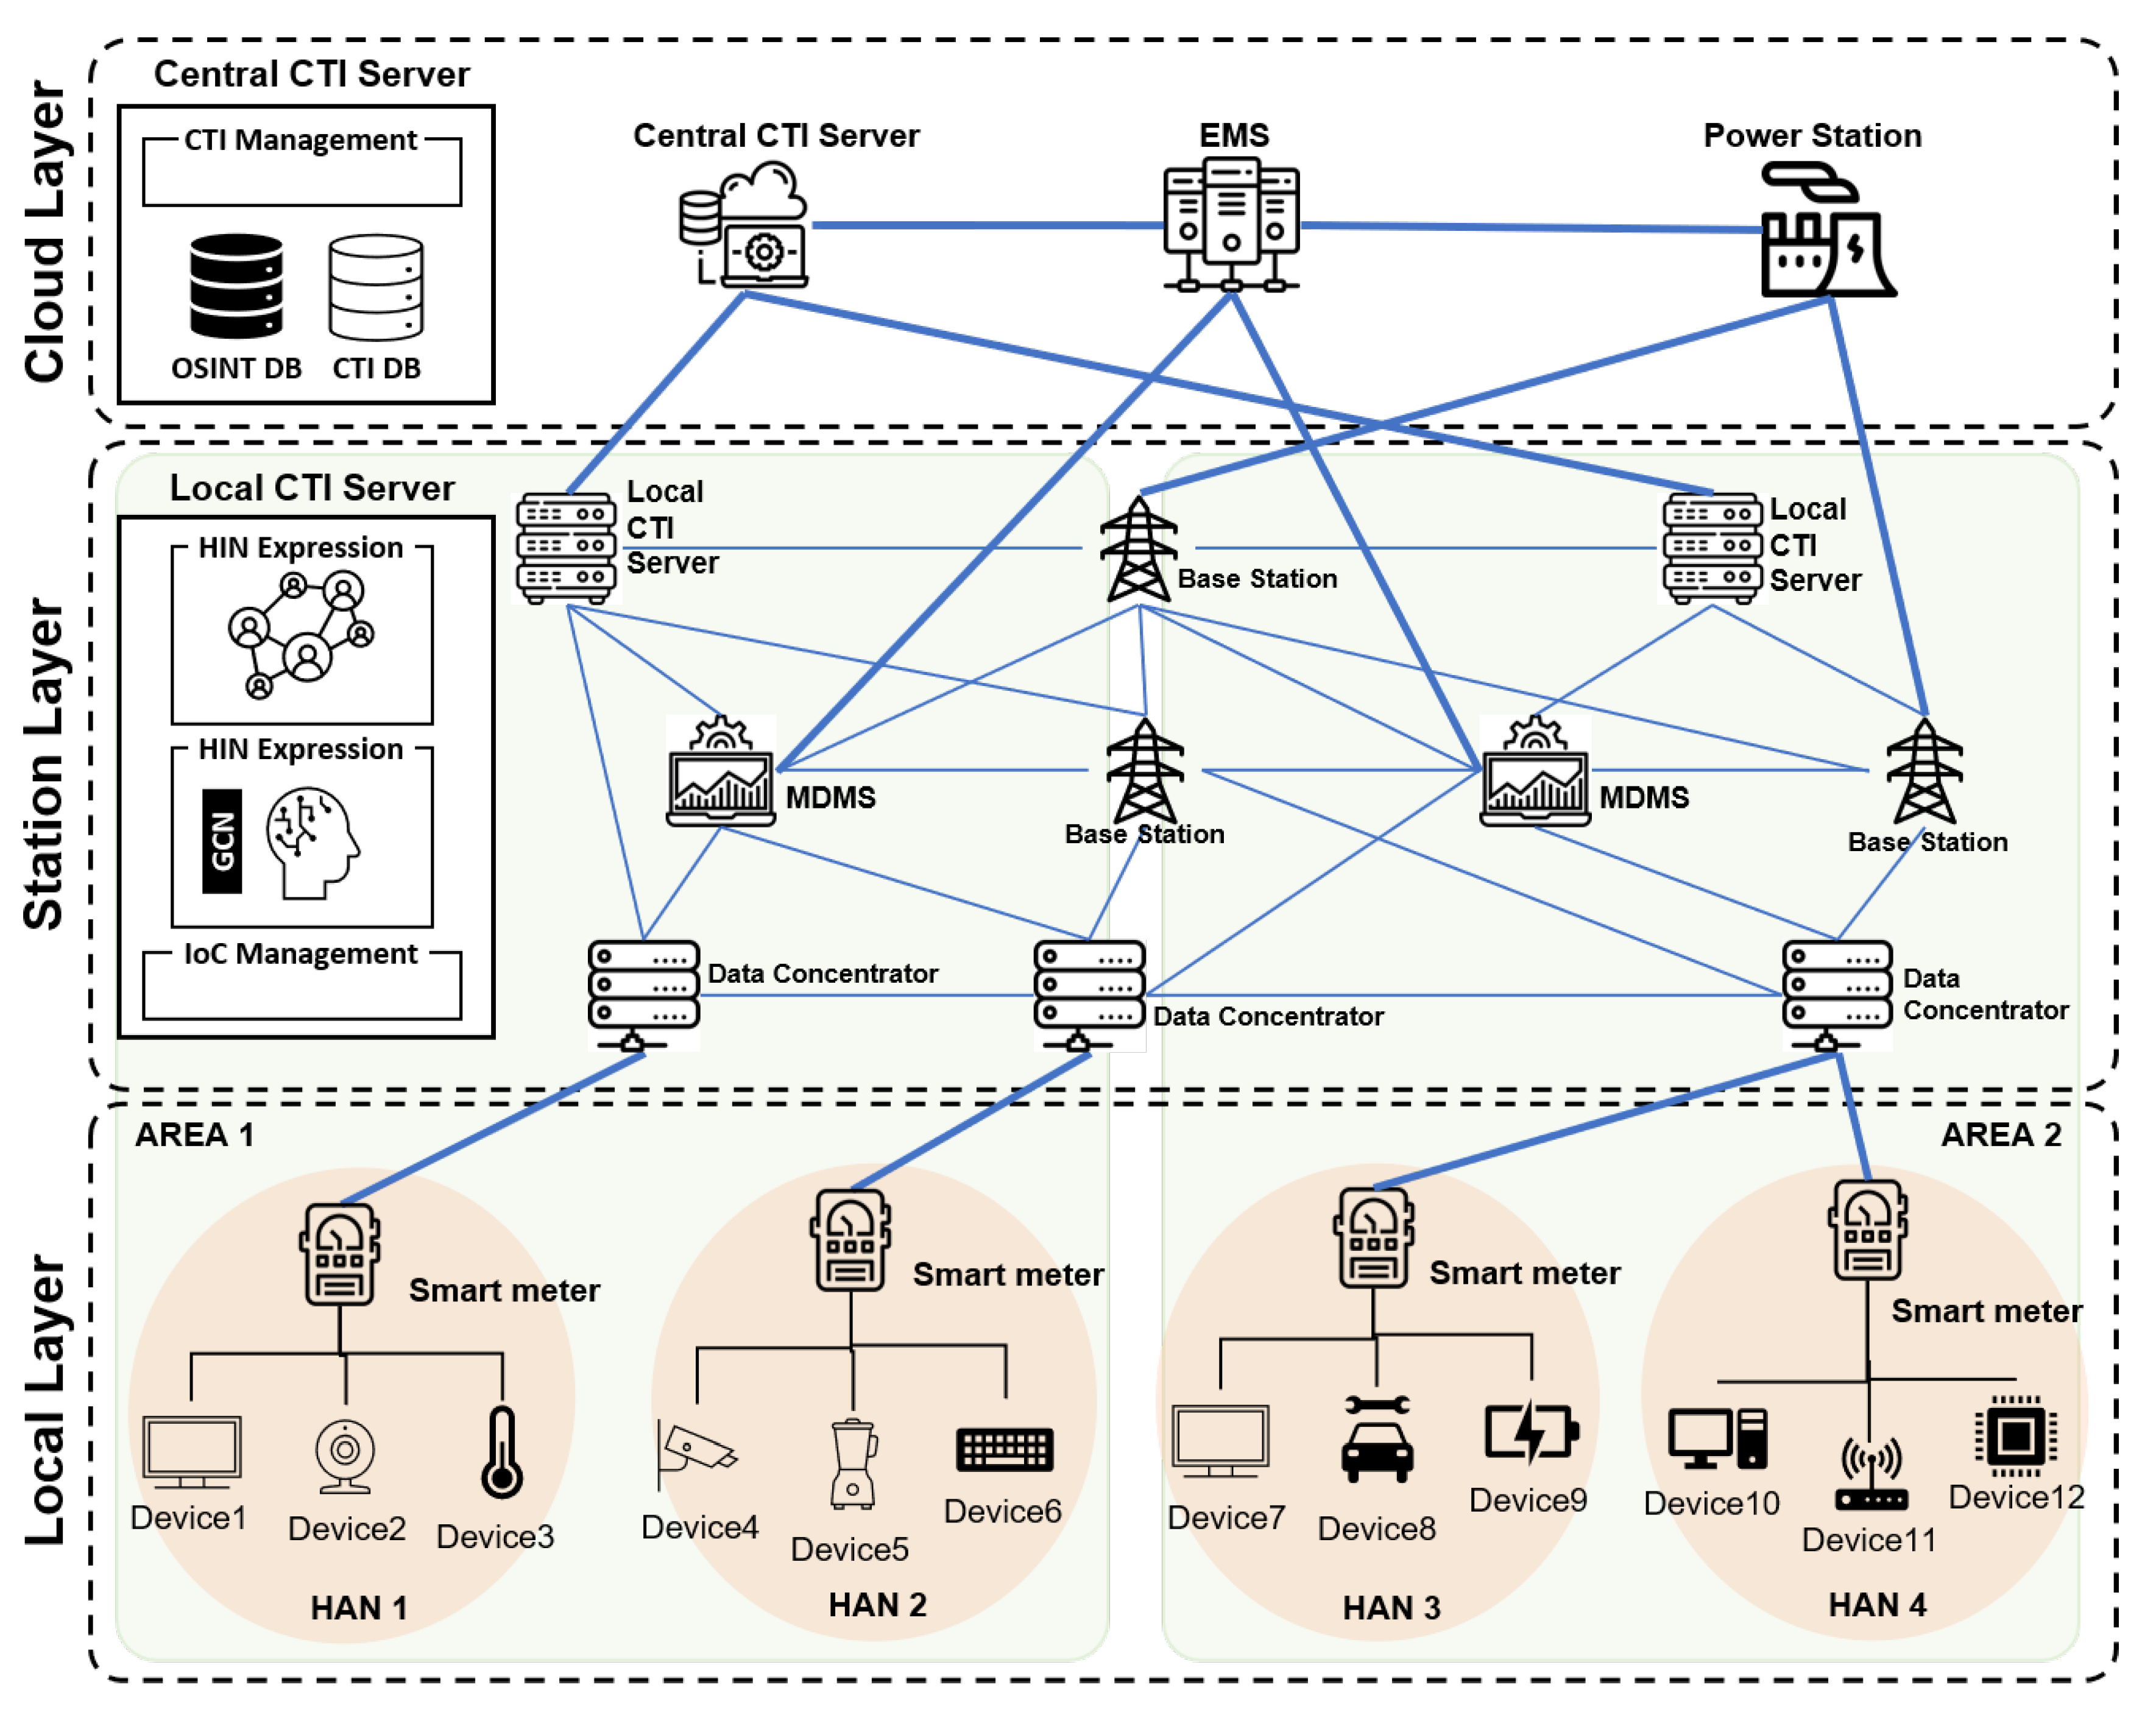
Figure 1 shows the architecture of the security framework proposed in this paper. The proposed framework consists of nodes that perform essential functions for the energy cloud demand response and nodes that generate cyber threat intelligence based on IoCs observed in the demand response process. The proposed framework also uses a strategy to respond to cyber threats of various types and patterns through a hierarchical structure.
3.1. Architecture of the Proposed Framework
The proposed framework is divided into three layers: the local layer, the station layer, and the backbone layer.
The first layer, the local layer, is where the prosumers responsible for the actual supply and demand of energy are located. Prosumers are devices located in each home, building, and factory that consume energy. Examples include computers, servers, lighting devices, and devices that generate energy, such as solar panels and wind turbines. These prosumer devices fluidly consume and supply energy according to the state of energy required. Smart meters existing in the local layer constitute an AMI environment and manage the energy demand responses of prosumer devices. Each device transmits energy object data related to energy consumption and outputs data to smart meters in real time. Moreover, prosumer devices transmit different status information to smart meters according to device resources and capabilities. Status information includes simple indicators such as timestamps, firmware hash values that identify whether the firmware installed on a device has been tampered with, CPU utilization status indications, and complex indicators such as a list of processes currently running and a list of ports and IP addresses engaged in communication. Prosumer devices periodically transmit device state information to provide data for CTI generation of the local layer. At this time, the amount of state information provided and the transmission period are set to suit the device’s resources.
The second layer, the station layer, comprises the Meter Data Management System (MDMS) that manages smart meters of the local layer, the base station in charge of actual energy transmission, and the local CTI server. The MDMS calculates the power demand of the Home Area Network (HAN) based on the energy object data received from the smart meter. The MDMS delivers the calculated power demand data to the base station, and the base station delivers energy to places where energy is needed based on the received data. The essential functions of the MDMS and base stations operate as fundamental elements of the smart grid. The MDMS and base station in each case serve a geographical area, and each area can contain devices with a specific purpose and general prosumer devices. For example, an area containing devices related to wind power or nuclear power has different characteristics from those of typical residential areas containing devices located in such an area. Different characteristics lead to different behavior patterns for each prosumer device. Cyberattacks that focus on energy cloud infrastructure generally target specific Industrial Control Systems (ICSs), Supervisory Control And Data Acquisition (SCADA) systems, or specific Programmable Logic Controllers (PLCs). Therefore, in cyberattacks targeting such environments, the observed indicators and patterns differ from those of traditional cyberattacks. The role of the local CTI server in the station layer is to create cyber threat intelligence specialized for prosumer devices located in each region. Cyber threat intelligence uses a large amount of IoCs to build contextual knowledge about cyberattacks. This method enables comprehensive detection and prediction of a cyberattack through deep inference about the attack, but if the attack pattern is fixed, the odds of false positives and false positives may increase. The type of cyberattack targeting the energy cloud environment depends on the target environment and device. Therefore, it is possible to reduce the ratio of false positives and false positives for cyberattack detection in the energy cloud environment by using a security model trained on an AMI-specific intrusion accident index on the local CTI server.
The third layer, the backbone layer, refers to the site that responds to energy demand requests in a wide area. It consists of a high-voltage transmission center, an energy management system (EMS), and a central CTI server. The EMS analyzes the energy demand flow of the entire energy cloud by synthesizing the energy demand generated by analyzing the energy object data in the MDMS of the station layer. The demand flow analyzed by the EMS leads to the policy to respond to the physical energy demand level, and the high-voltage transmission center transmits energy to each region according to the policy created by the EMS. The EMS and high-voltage transmission center are responsible for the energy cloud’s essential functions at the wide-area level. The central CTI server calculates a comprehensive cyber threat response plan for the entire energy cloud environment. Countermeasures against cyber threats generated by the central CTI server include specific IP and domain blocking policies, firewalls, and antivirus software update policies to identify malicious codes quickly. The central CTI server generates cyber threat intelligence by collecting all IoCs collected by general IT systems and AMIs in the local layer and all cyber threat-related data collected by OSINT. The central CTI server abstracts and classifies cyber threat types based on metadata pertaining to various types of IoCs. Based on the classified results, the central CTI server trains a deep learning-based security model that can detect zero-day attacks and that predicts possible future attack types based on the observed attack patterns. Furthermore, the metadata used here serve as data for the classification and identification of attacker groups. This method comprehensively improves the security capabilities of the entire energy cloud environment composed of various systems, from the general computing environment to prosumer devices.
3.2. CTI Generation and Sharing Process
This section describes the collection of the IoC data for the generation of a CTI for each layer of the proposed framework.
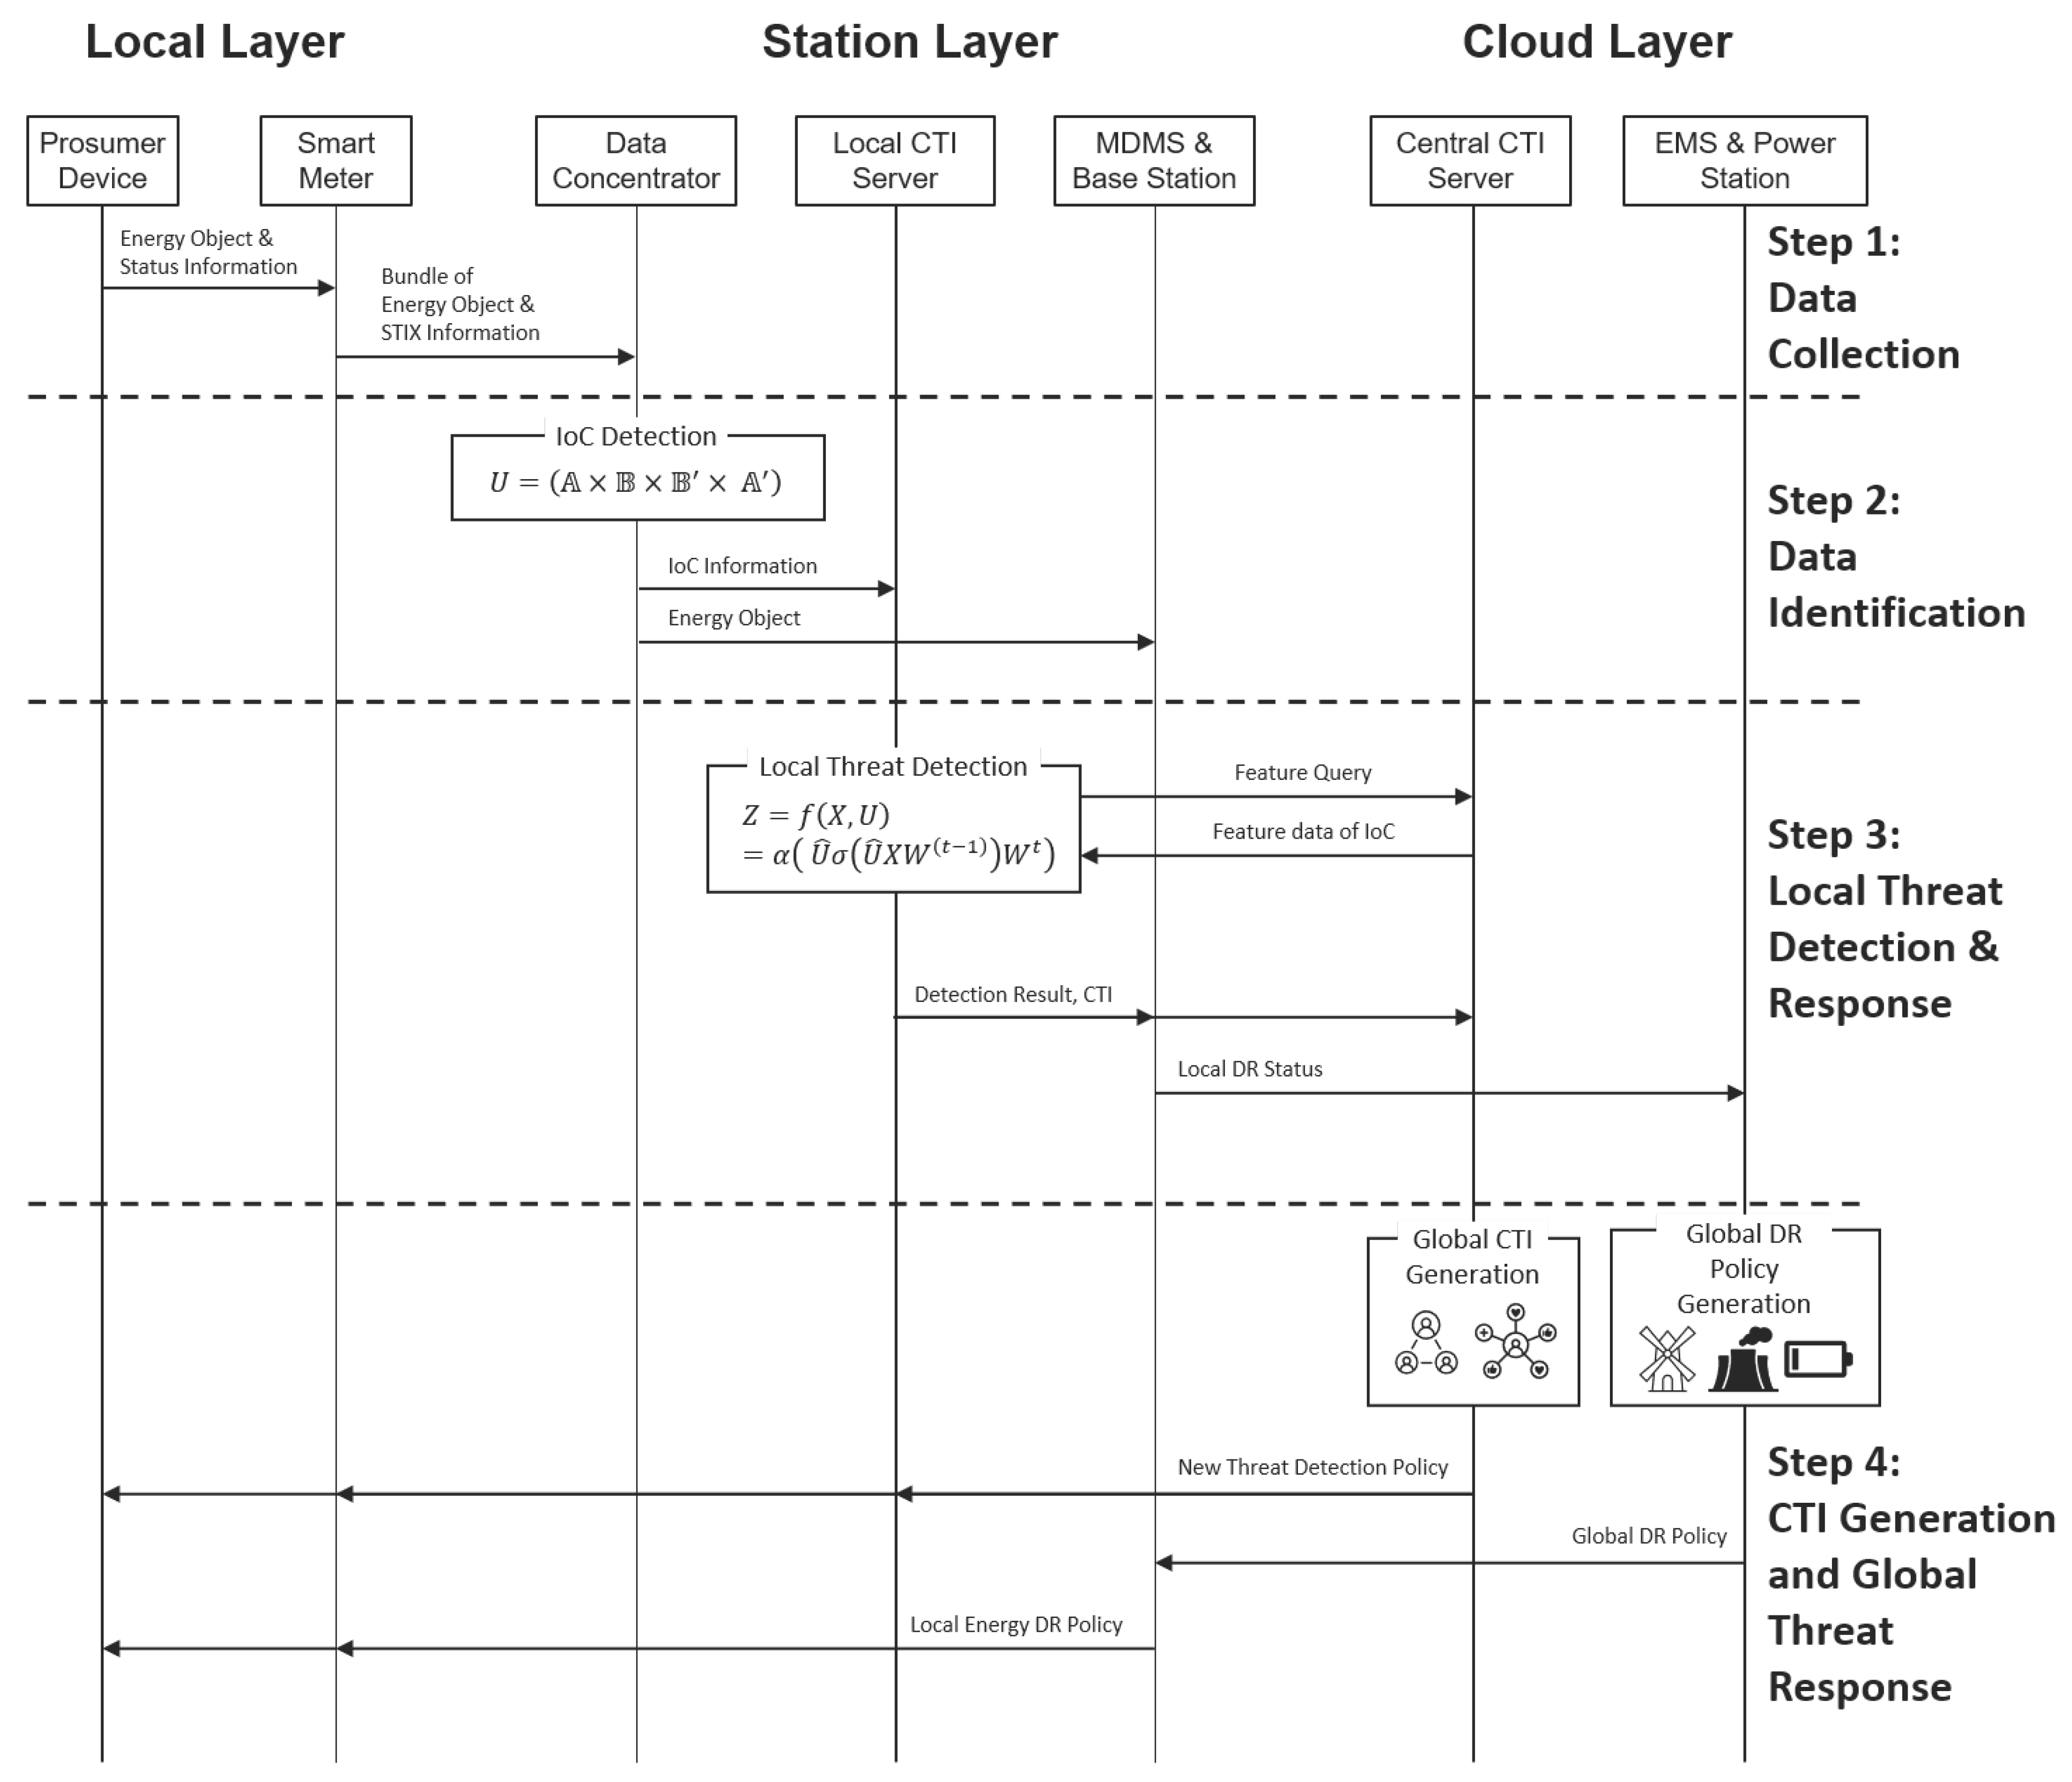
Figure 2 describes the overall process of the CTI generation and sharing mechanism.
Step 1 (data collection from prosumer devices): Prosumer devices in the local layer’s HAN transmit their operating status information to smart meters along with energy object data, including information about energy consumption and production status. The smart meter collects energy object data and status information of various prosumer devices in the HAN and transmits them to the connected data concentrator. For communication between prosumer devices, smart meters, and data concentrators, short-range communication based on wired or wireless communication is used.
Step 2 (energy object data and IoC identification): Data concentrators that receive data from smart meters separate each device’s energy object data and state information from the received data. The separated energy object data are transmitted to the MDMS of the station layer to respond to the energy demands of prosumer devices. Simultaneously, the data concentrators identify the network information and device operation statuses included in the device status information received from the smart meter and convert these data to CTI data based on the STIX expression method. The converted CTI data are transmitted to the local CTI server along with the energy objects.
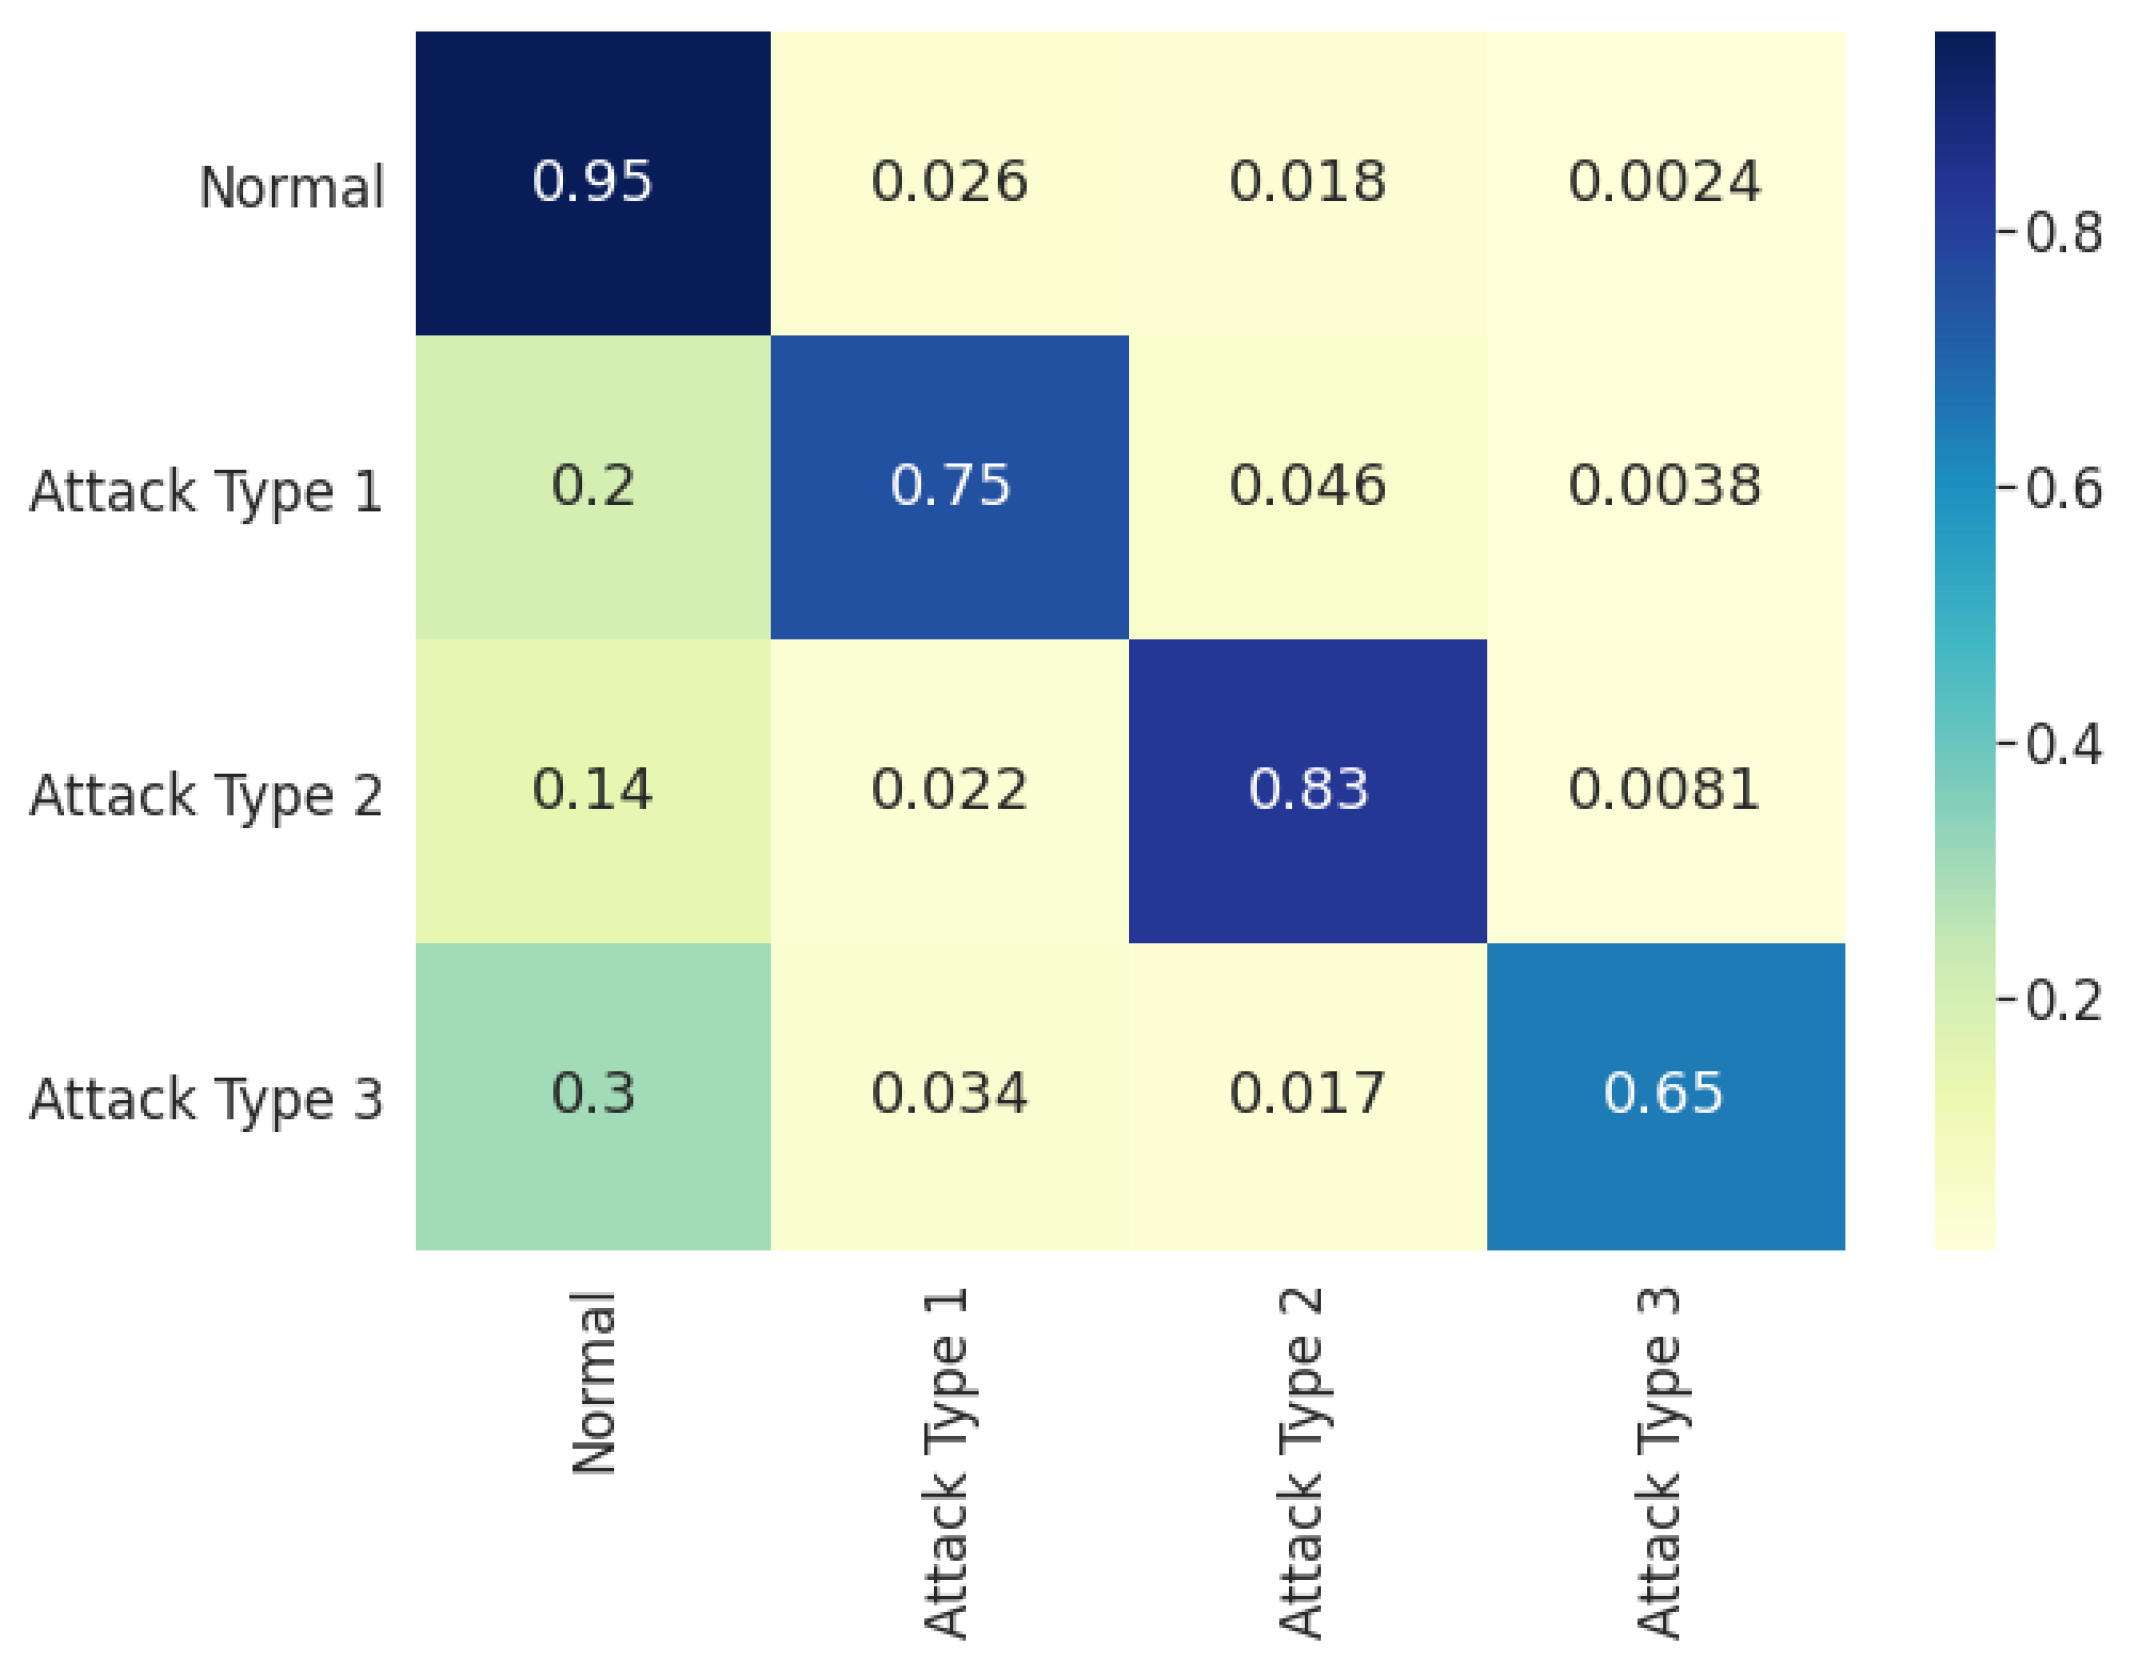
Step 3 (local threat detection and response): The local CTI server learns a deep learning model to detect cyber threats in the area based on the energy object data and CTI data received from the data concentrator. First, the local CTI server identifies the IoC from the CTI data received from the data concentrator. Subsequently, the local CTI server queries the central CTI server’s database to obtain feature data for the identified IoC data. After securing the IoC feature data, the local CTI server converts the CTI data into the HIN (Heterogeneous Information Network) format and evaluates whether the CTI data indicate the existence of a cyber threat using a pre-learned Graph Convolutional Network (GCN) model. If it is found to be a cyber threat, the local CTI server transmits the result and CTI data to the central CTI server while simultaneously transmitting the corresponding CTI data to the MDMS. The MDMS then identifies the information on smart meters and prosumer devices included in the CTI data to respond to abnormal behaviors in the energy demand response process.
Step 4 (CTI generation and global threat response): The central CTI server aggregates all CTI data received from multiple local CTI servers. The central CTI server also collects additional data from OSINT using the CTI’s IoC resources delivered to collect various cyber threat-related data. Data collection through OSINT improves the quantity and quality of metadata related to IoC resources, which means an improvement in the quality of feature data required to learn GCN-based detection models in local CTI servers. The central CTI server also generates an action policy in a form that can be directly used by smart meters and prosumer devices by synthesizing the cyber threat analysis results received from the local CTI server. These behavioral policies are delivered in the form of a blacklist of IPs and domains or updates of antivirus programs. The CTI generated by the central CTI server is delivered to each local CTI server, smart meter, and prosumer device. At this stage as well, information related to the energy demand response from the MDMS is delivered to the EMS and the highest energy management station. The EMS synthesizes energy demand-related information and the reported CTI and creates a demand response policy for the entire energy cloud system reflecting the response to the cyber threat. This demand response policy is delivered to the MDMS of the station layer and acts as a practical response to the energy demand of smart meters and prosumer devices.
4. Implementation of the Proposed Framework
This section describes the implementation plan of the proposed security framework. The proposed framework is divided into the process of collecting data from a prosumer device, the method by which to generate and learn the local CTI, and the process of generating the global CTI.
4.1. IoC Data Collection from Prosumer Devices
The CTI system’s performance when responding to cyber threats is determined by the type and quality of the collected IoC data. Therefore, during the data collection process, data in a form that can express the state of the system to be analyzed in detail must be collected, and similarly, data in a form that can be associated with a cyberattack must be collected. The proposed framework collects data, as shown in
Table 1 below, from prosumer devices. These data are collected at regular time intervals considering the resources and performance capabilities of each device.
4.2. Local Threat Detection
Among the data collected in
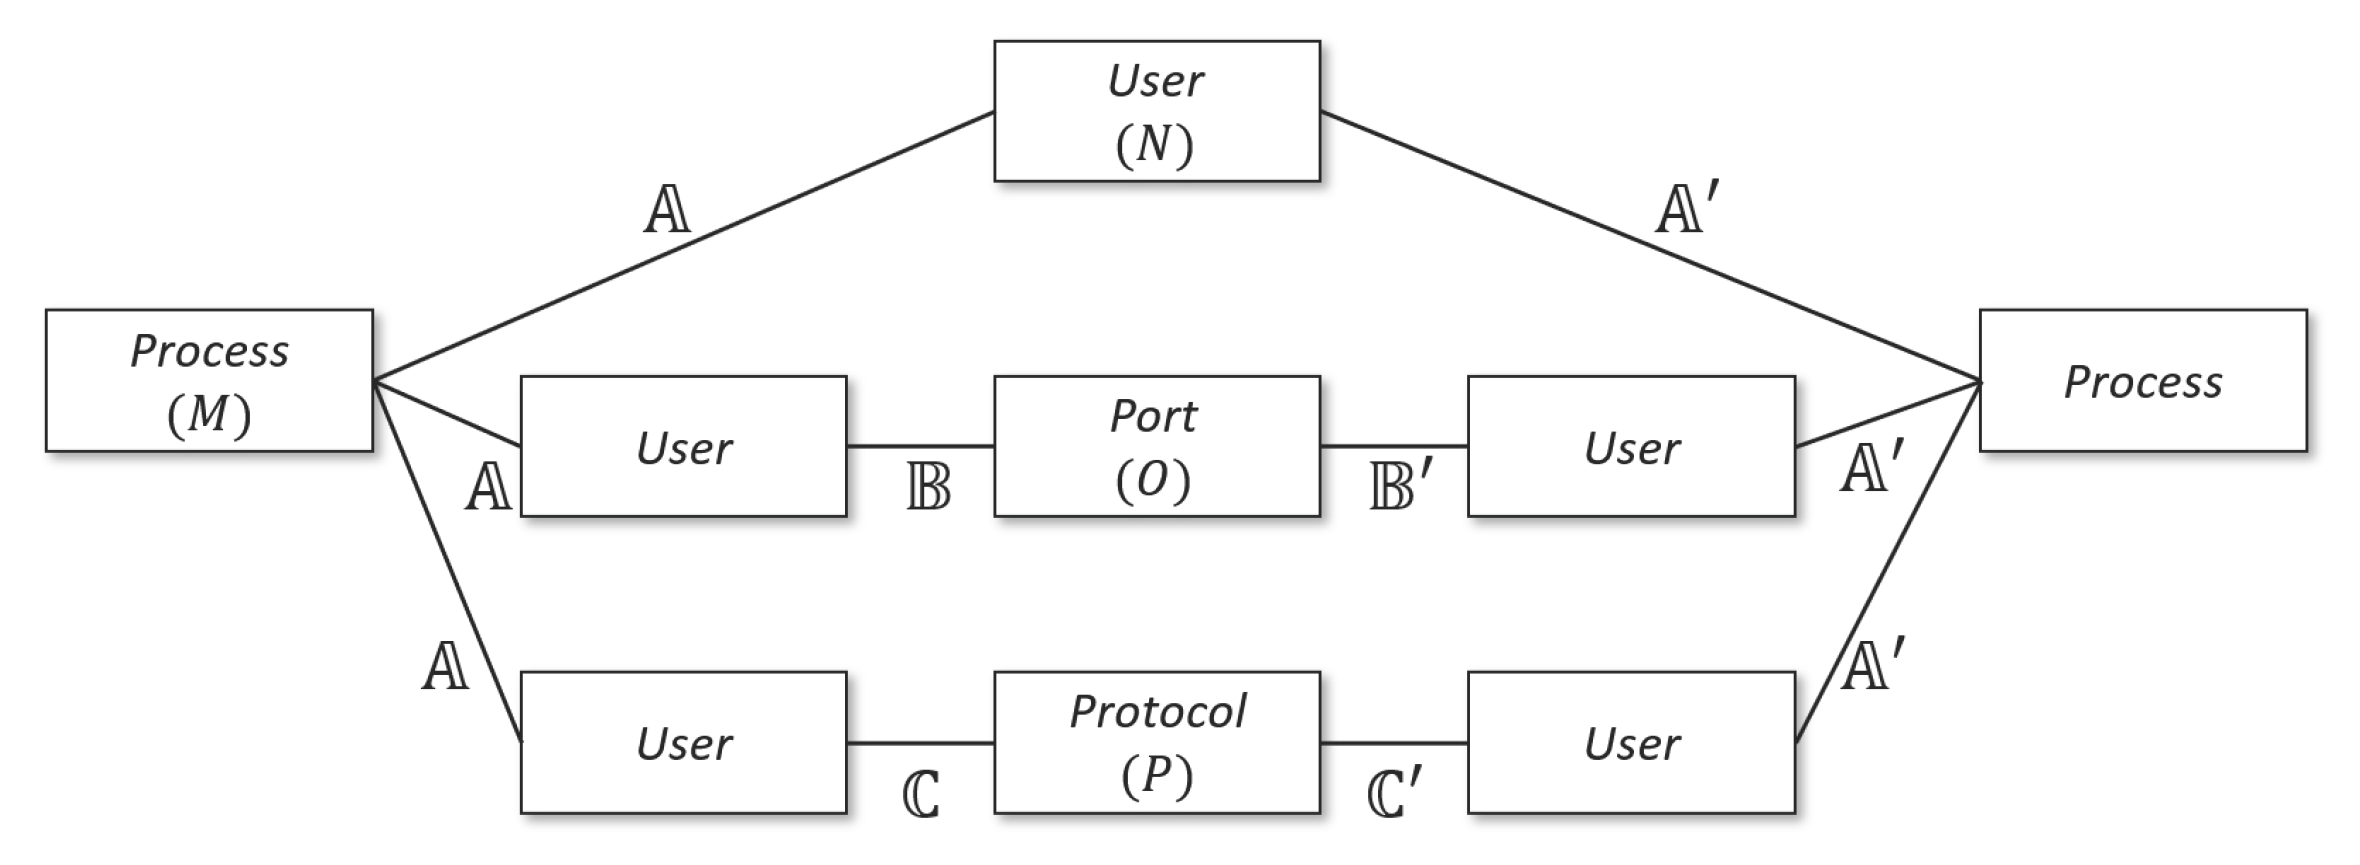
Table 1, process information is used as the primary data to indicate the device status information. Processes running on the system are related to the user who executed the process. If the user is a specific user other than the administrator, the user communicates with the prosumer device using a communication protocol and port number. That is, the user information is related to the protocol and port information. Additionally, external users’ actions on prosumer devices leave traces of IP address information about external users. Inspired by the results of HinCTI’s research [
31], this paper uses the CTI data model shown in
Figure 3 for regional threat detection.
Data types having a connection relationship can be expressed as a matrix of the connection relationship between each data instance. For example, the connection relationship between M processes and N users can be expressed as an adjacency matrix having a size of , and each element of the adjacency matrix indicates whether the two data instances are connected (1) or not connected (0). For each type of data collected by the prosumer device, an adjacency matrix indicating the relationship between the data instances can be expressed as follows.
Adjacent matrix representing the relationship between M processes and N users: ;
Adjacent matrix representing the relationship between N users and O port information: ;
Adjacent matrix representing the relationship between N users and P protocol information: .
Using the relationship data in
Figure 3, three types of relationships can be inferred using process information, user information, port information, and protocol information. The relationship
can be expressed through the diagonal matrices of
and
, and the resulting
matrix can represent the relationship between the process and the process owner. The relationship
can be derived from the calculation result of
, and this result indicates the relationship between the process and port information used in the prosumer device. Furthermore, the relationship
can be derived as a calculation result of
, and this result may indicate the current communication state of the prosumer device. Inspired by earlier work [
32], given that the calculation results of the three associations above are all matrices of the same form, the corresponding Hadamard product (
·) yields a matrix
U including all relationships that can be considered in a prosumer device. The equation for expressing all of the relationships of the data of the prosumer devices as an adjacency matrix
U is shown below.
The process resource information delivered from the prosumer device is information on the CPU and memory resource consumption of each process running on the device. This information can be viewed as information of the physical layer of the device’s operating state, and through this information, the normal operating state of the device can be inferred. The proposed framework uses the device’s process resource information as feature matrix X for the process. X is a matrix with a size of , and w indicates the dimension of information in the process of gathering the resource.
The state information of the device observed at each specific period in the prosumer device constructs the feature matrix
X. The following is a description of the feature matrix using device-related data mentioned in
Table 1.
The process information includes the PID (Process Identification Number) and the PPID (Parent Process Identification Number) of the process running in the prosumer device. Because a prosumer device dedicated to the energy cloud environment continuously performs a predetermined operation, it can be expected that the process’s state will not change significantly. Accordingly, it is possible to determine a white list of expected processes in a normal device state. In the Raspberry Pi-based prosumer device configured for this research, on average, eighty-six processes operate. We limit all possible types of processes to 100, including unknown processes, and use the process list as an element of the feature matrix through one-hot encoding.
The prosumer device can use the white list to determine the legitimacy of the User Identifier (UID) that runs the process. A previously known user may be recognized as a legitimate user, and an unknown user identifier may be recognized as not being legitimate. In this research, for a given process list, one binary data instance, indicated as one when all UIDs are registered on the white list, and zero otherwise, was used as an element of the feature matrix.
Port information is expressed depending on whether or not some well-known ports are used among the device’s ports. In this research, eleven features expressing 11 ports with a high frequency of use (20, 21, 22, 23, 69, 80, 161, 443, 990, 992, and others) were used as elements of the feature matrix through one-hot encoding.
Communication protocol information is expressed as binary data pertaining to whether TCP communication is utilized or whether UDP communication is utilized. In this research, two data instances on two protocols were used as elements of the feature matrix.
Process resource information is expressed as the average, variance, maximum, and minimum values of the CPU and memory usage of each specific time interval. In this research, eight numerical data instances for these data were used as elements of the feature matrix.
Energy object statistics are expressed as the average, variance, maximum, and minimum values of the energy produced for each specific time interval. In this research, four numerical data instances for these data were used as elements of the feature matrix.
Communication IP address information can be expressed depending on whether the corresponding device exists on the white list for other devices currently communicating. In this research, one binary data instance expressing whether all communication exponents exist on the white list was used as an element of the feature matrix.
A total of 127 features were used to construct feature matrix
X. The local CTI server trains the GCN model using the state information
U of the prosumer device received from the data concentrator and the feature matrix
X, which is process resource information. First, the state information
U is calculated as
with a self-loop added and then normalized with
. The normalized
is used to train the GCN model, as shown below in Equation (
2).
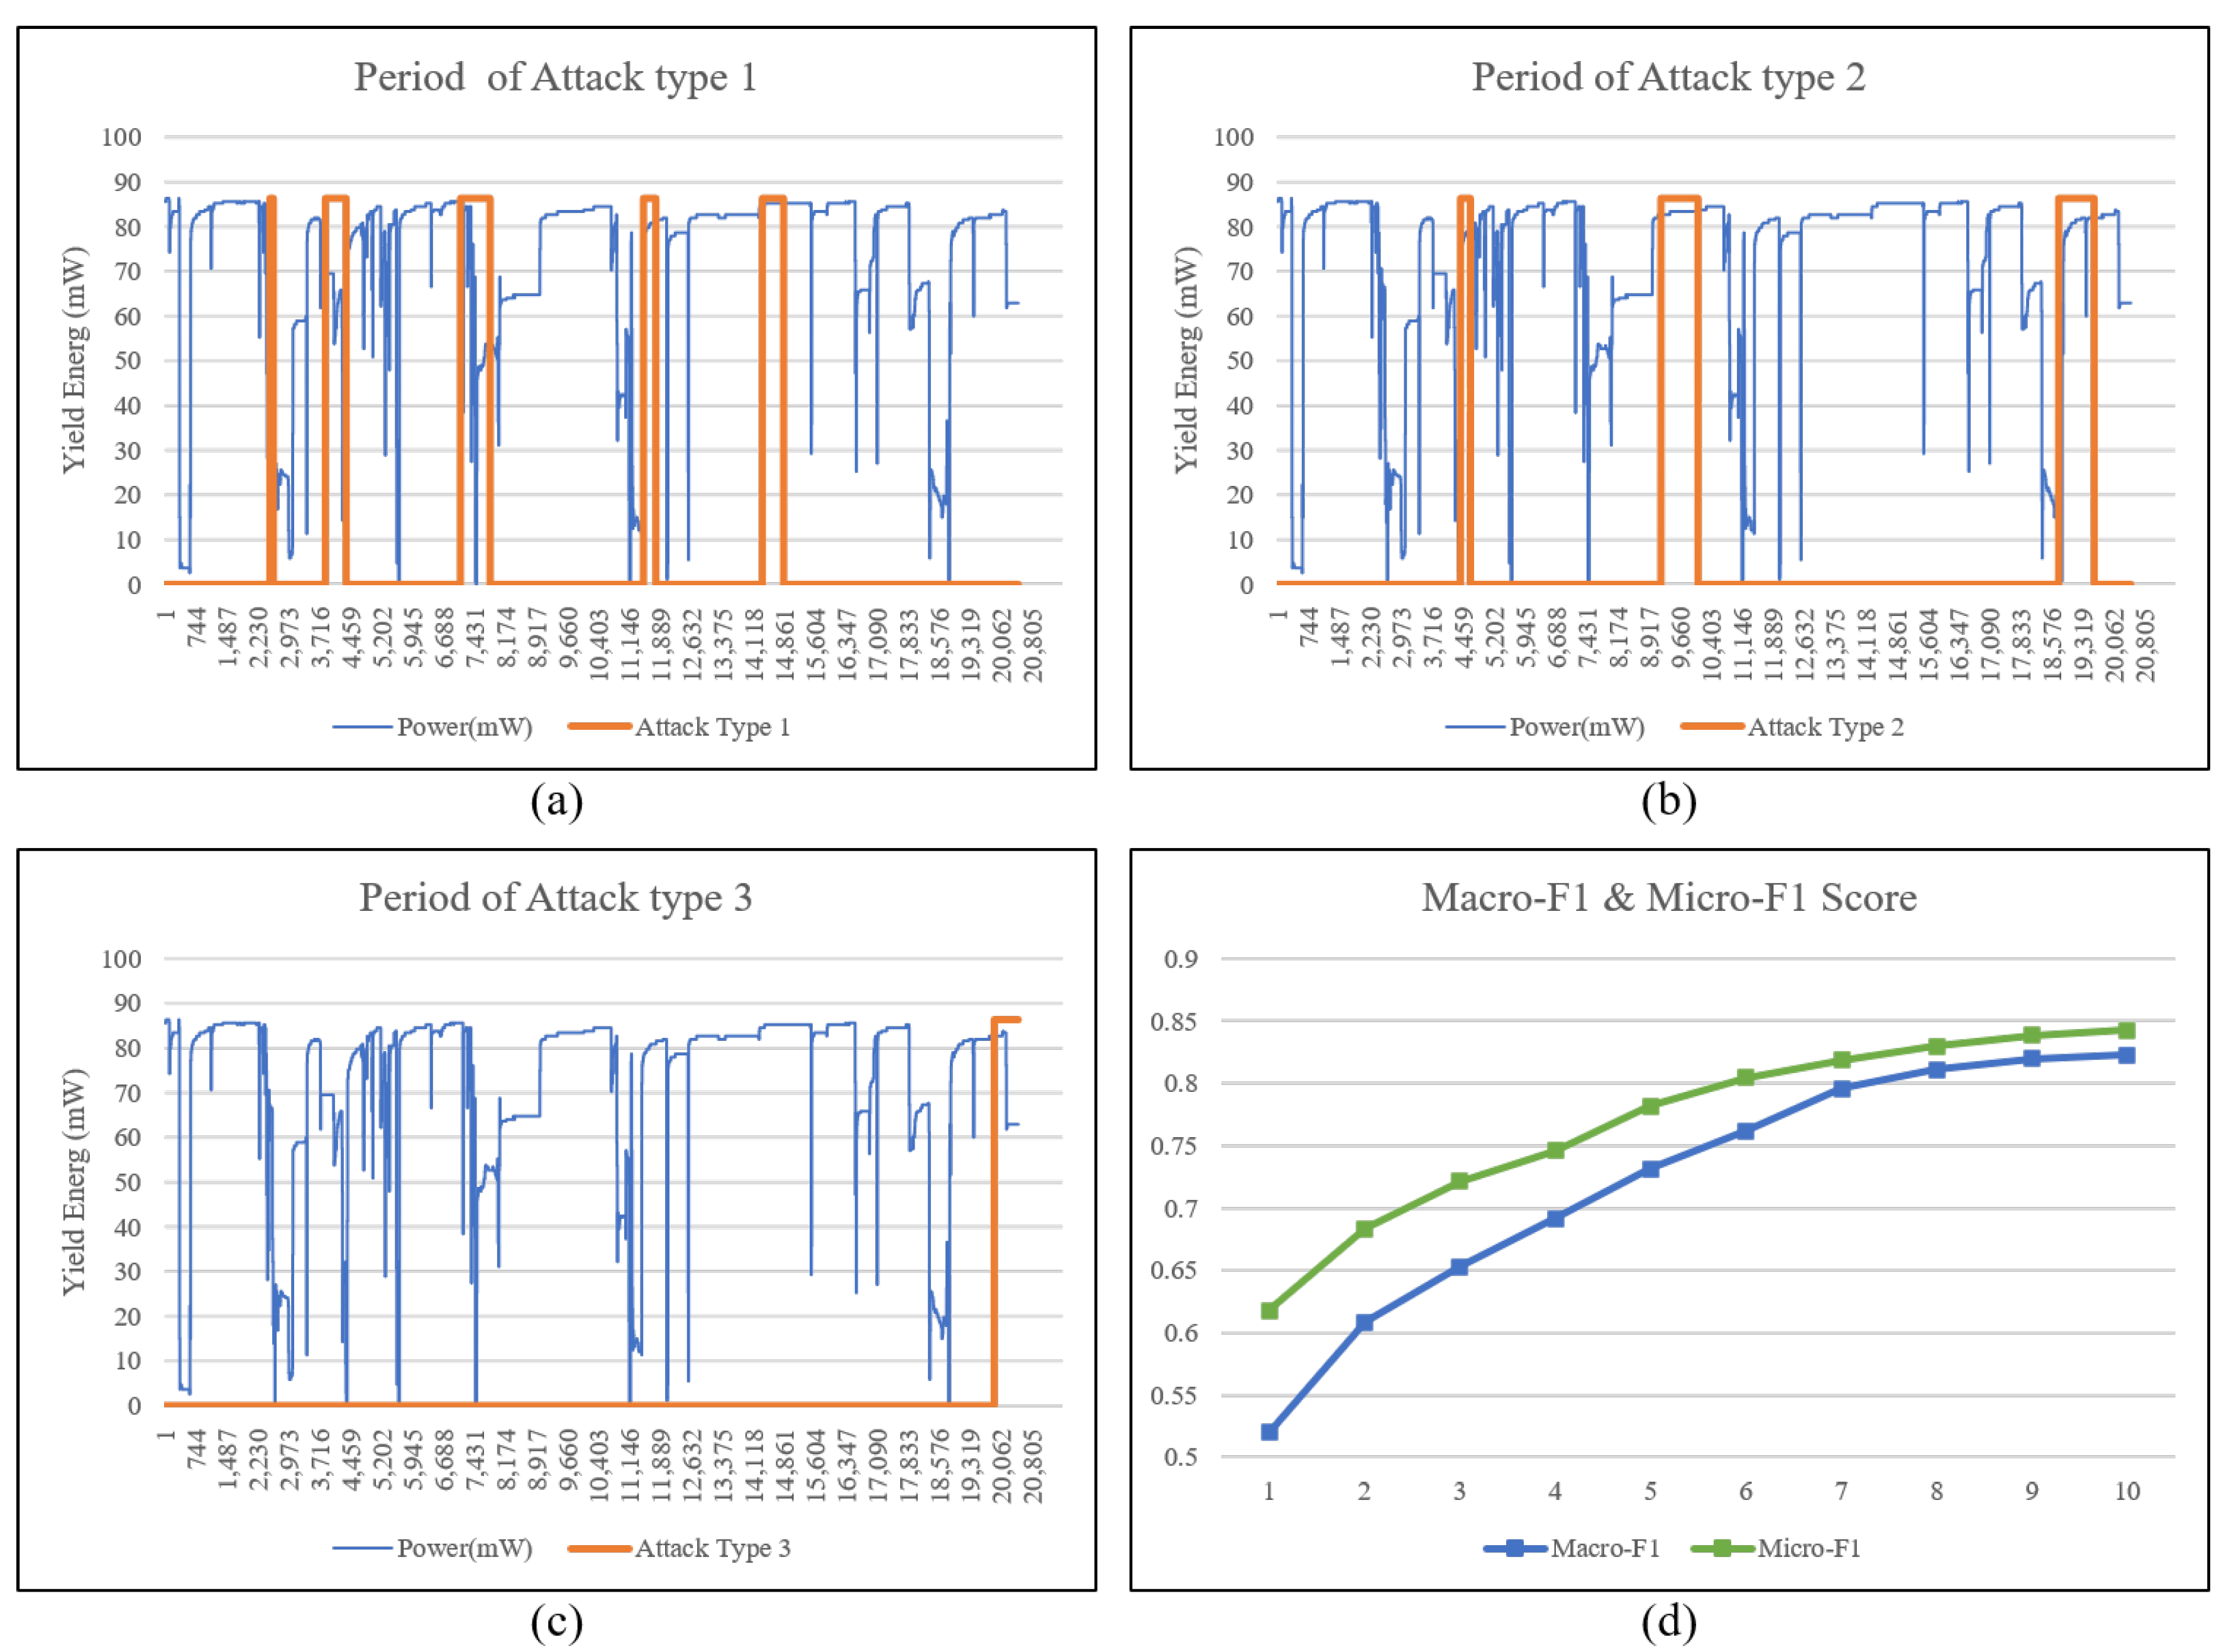
refers to the degree matrix of . The feature matrix X is input as of the deep learning model and trains the weight matrix W. ReLU as used in the above model is an activation function defined as , and softmax is an activation function defined as . This model receives the state information matrix of the device and the feature matrix for resource consumption and performs multiple classifications for various device states. For multiple classifications, a categorical cross-entropy function is used as a cost function, and the Adam optimizer is used.
4.3. Generation and Dissemination of CTI
The local CTI server at the station layer detects and identifies the local AMI layer’s cyber threats by conducting local threat detection using IoC data from the prosumer devices. The local CTI server performs a direct security function for the prosumer device based on the threat analysis result. For this security function, a communication blocking policy or device isolation policy is used to quarantine the attacked prosumer device or block the node identified as an attacker. The communication blocking policy protects the device from cyberattacks by delivering commands and security policies that can control the behavior of prosumer devices, such as the Yara rule or Snort rule. Additionally, device isolation blocks the operation of malicious processes by temporarily stopping or rebooting the attacked device.
For example, feature matrix X, which is the core element of local CTI generation, uses a whitelist of IP information of the opposite device communicating with the prosumer device as a feature during the process of local threat detection. In this process, the opponent’s (or attacker’s) IP address is transmitted to the local CTI server, and the server creates a CTI related to the Snort rule that blocks the IP according to the local threat detection result. Likewise, process information such as the PID used as an element of the feature matrix can be used for the CTI to form a command to control the prosumer device.
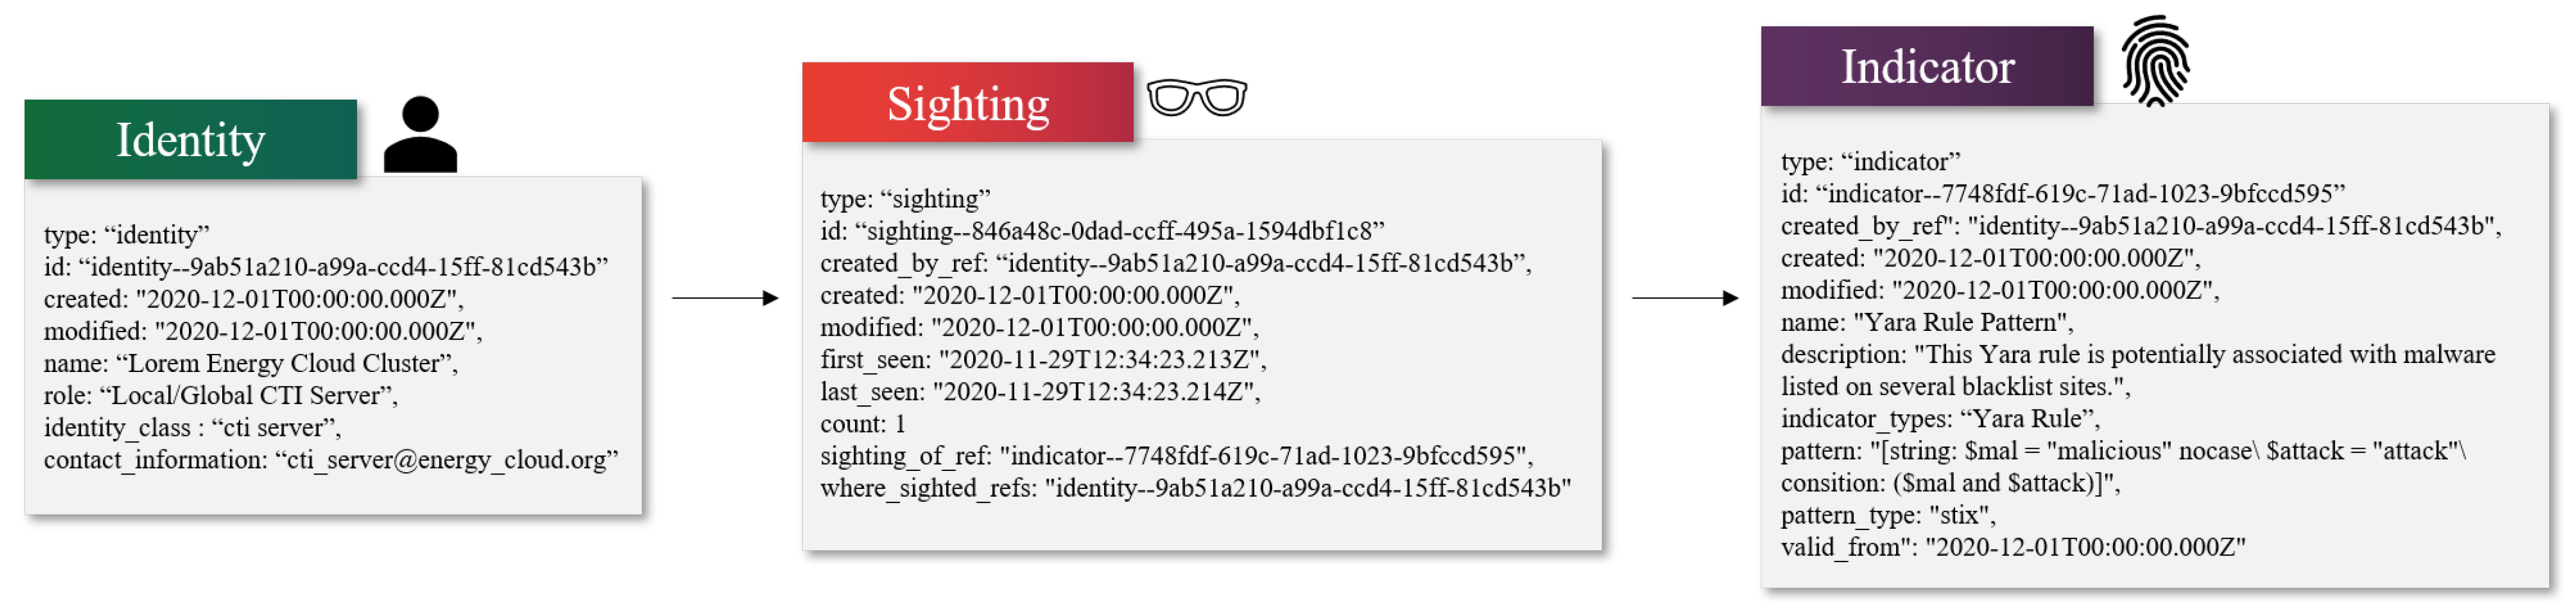
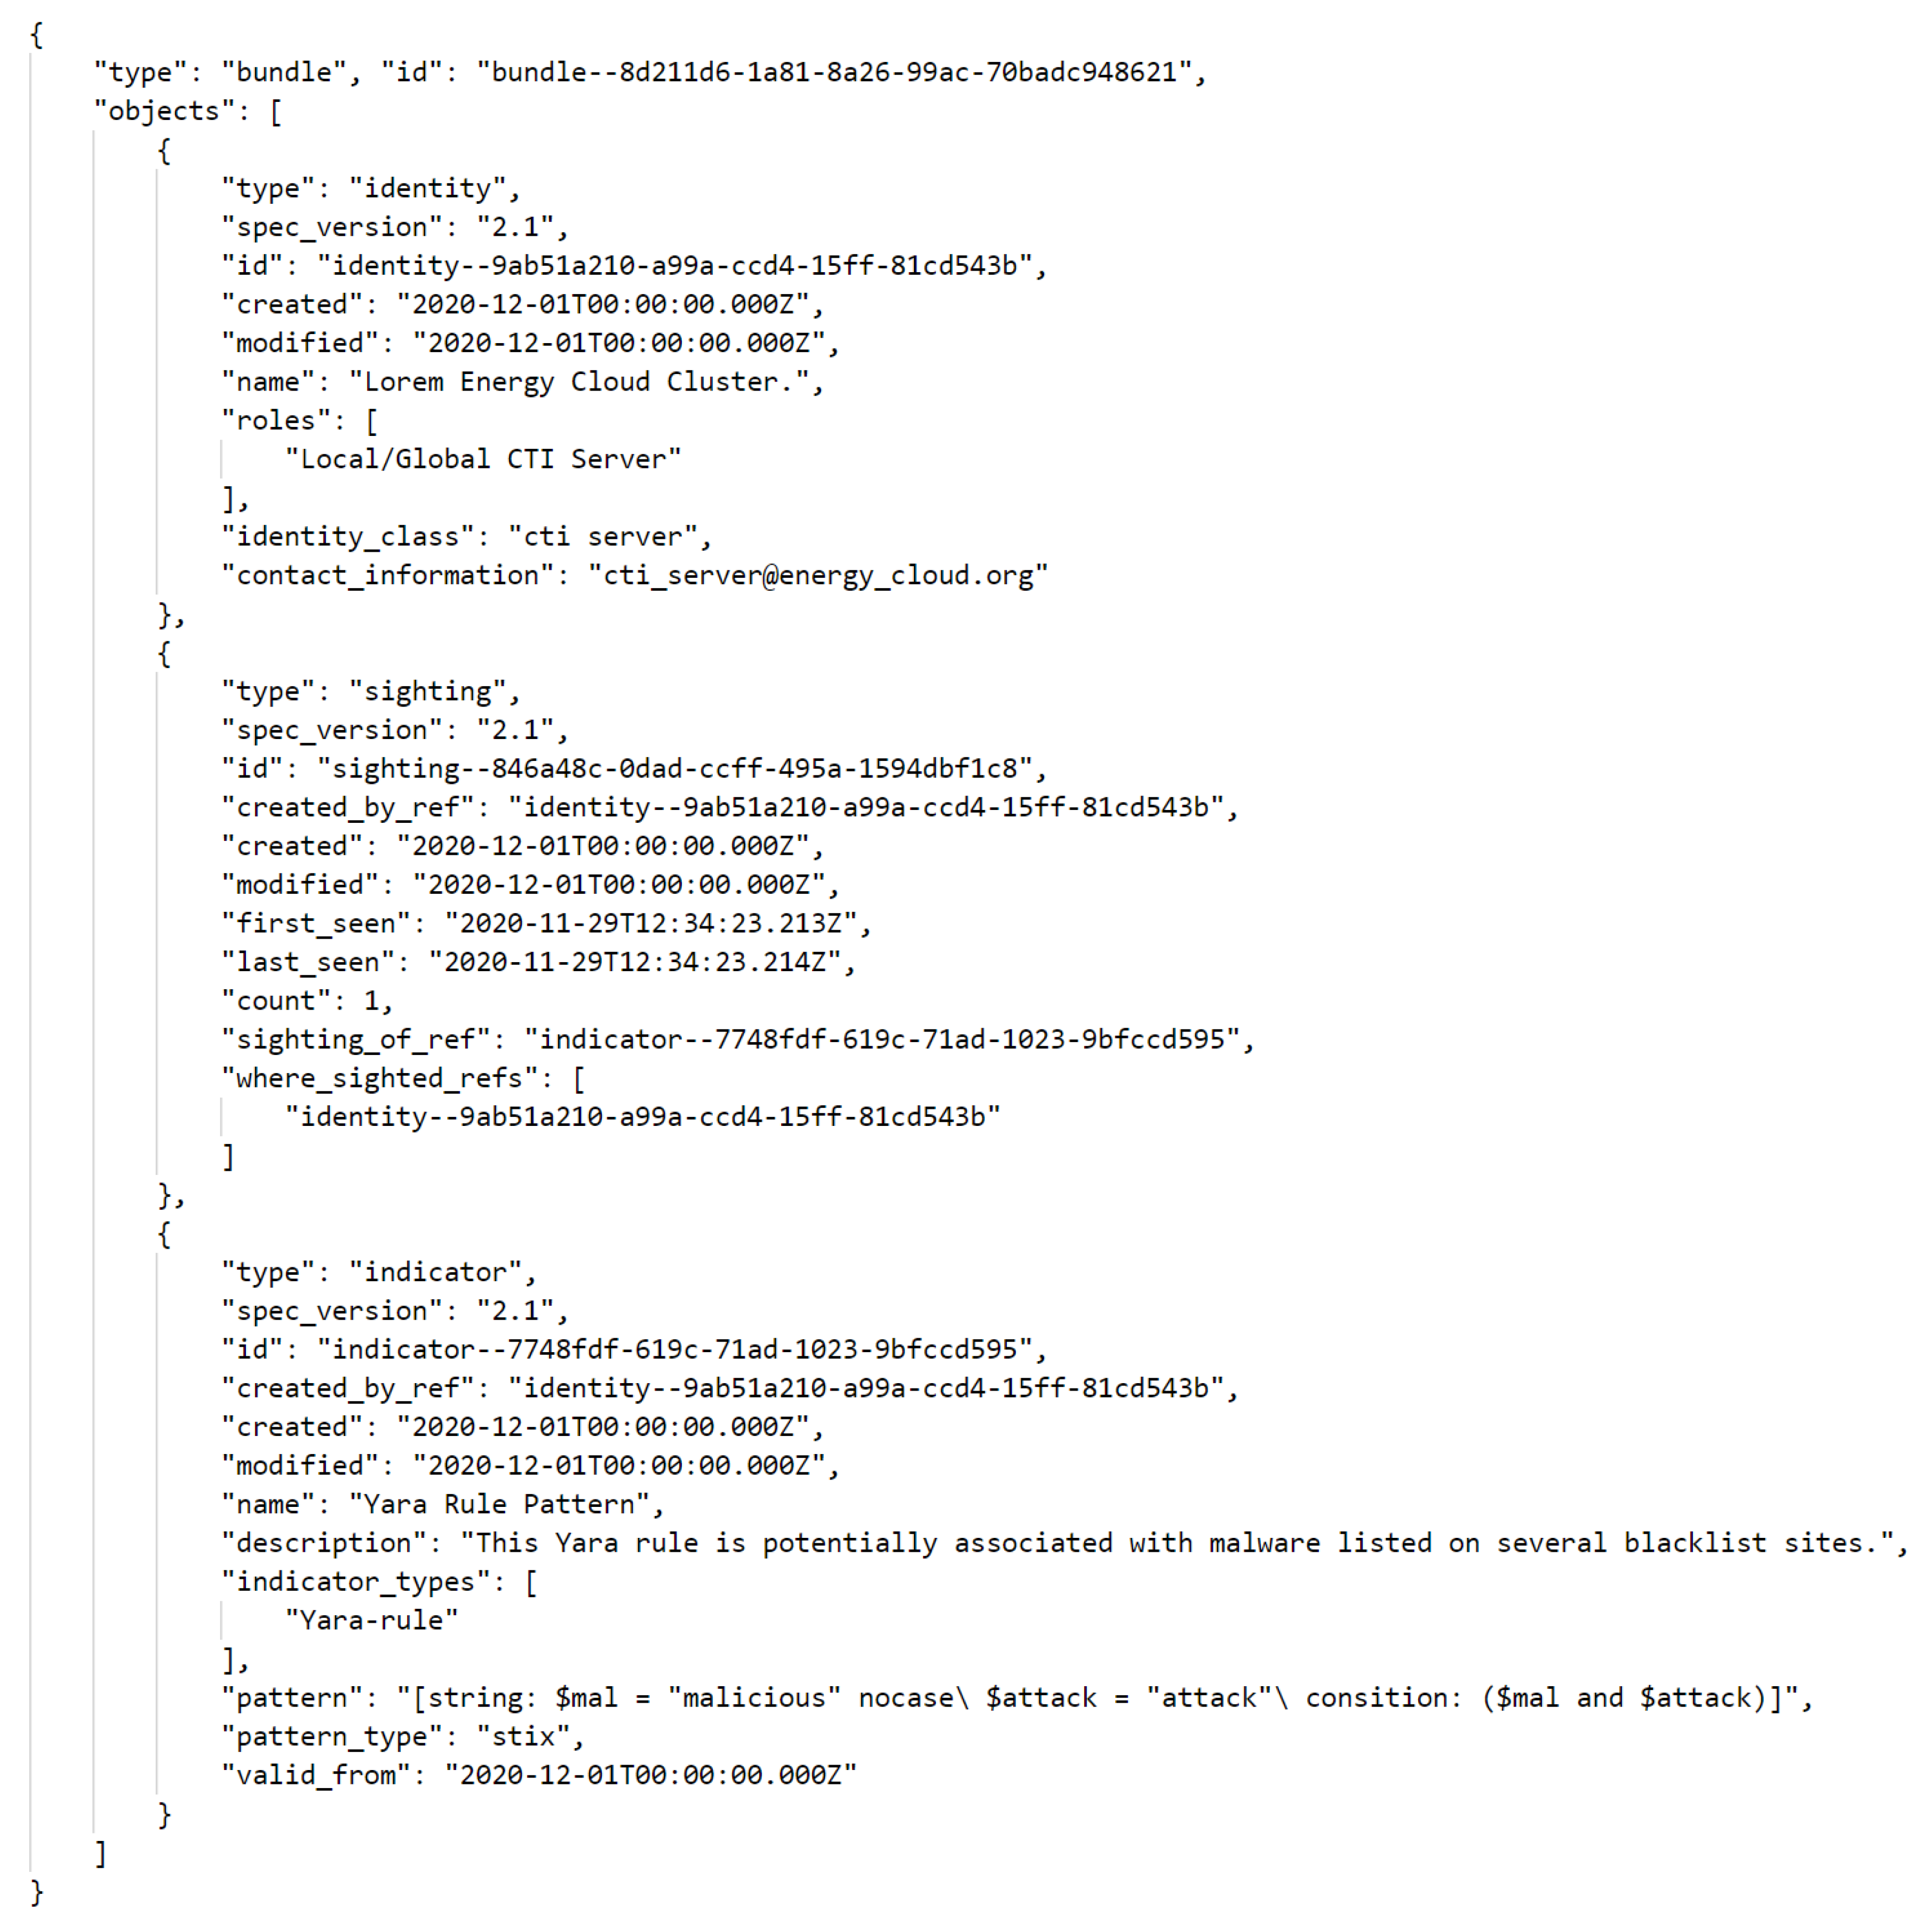
Furthermore, the threat analysis result of the local CTI server is transmitted to the global CTI server. The global CTI server analyzes vulnerabilities and attack types related to the cyberattack in the National Vulnerability Database (NVD) provided by the National Institute of Standards and Technology (NIST) using the transmitted threat-related data. The NVD provides threat-related information through databases, such as Common Vulnerabilities and Exposures (CVE), Common Weakness Enumeration data (CWE), and Common Attack Pattern Enumeration and Classification (CAPEC) data. As shown in the
Figure 4 and
Figure 5, this knowledge information is used to create STIX-based security policies, and these security policies are disseminated to local CTI servers and prosumer devices to be used as practical guidelines for countering cyberattacks.
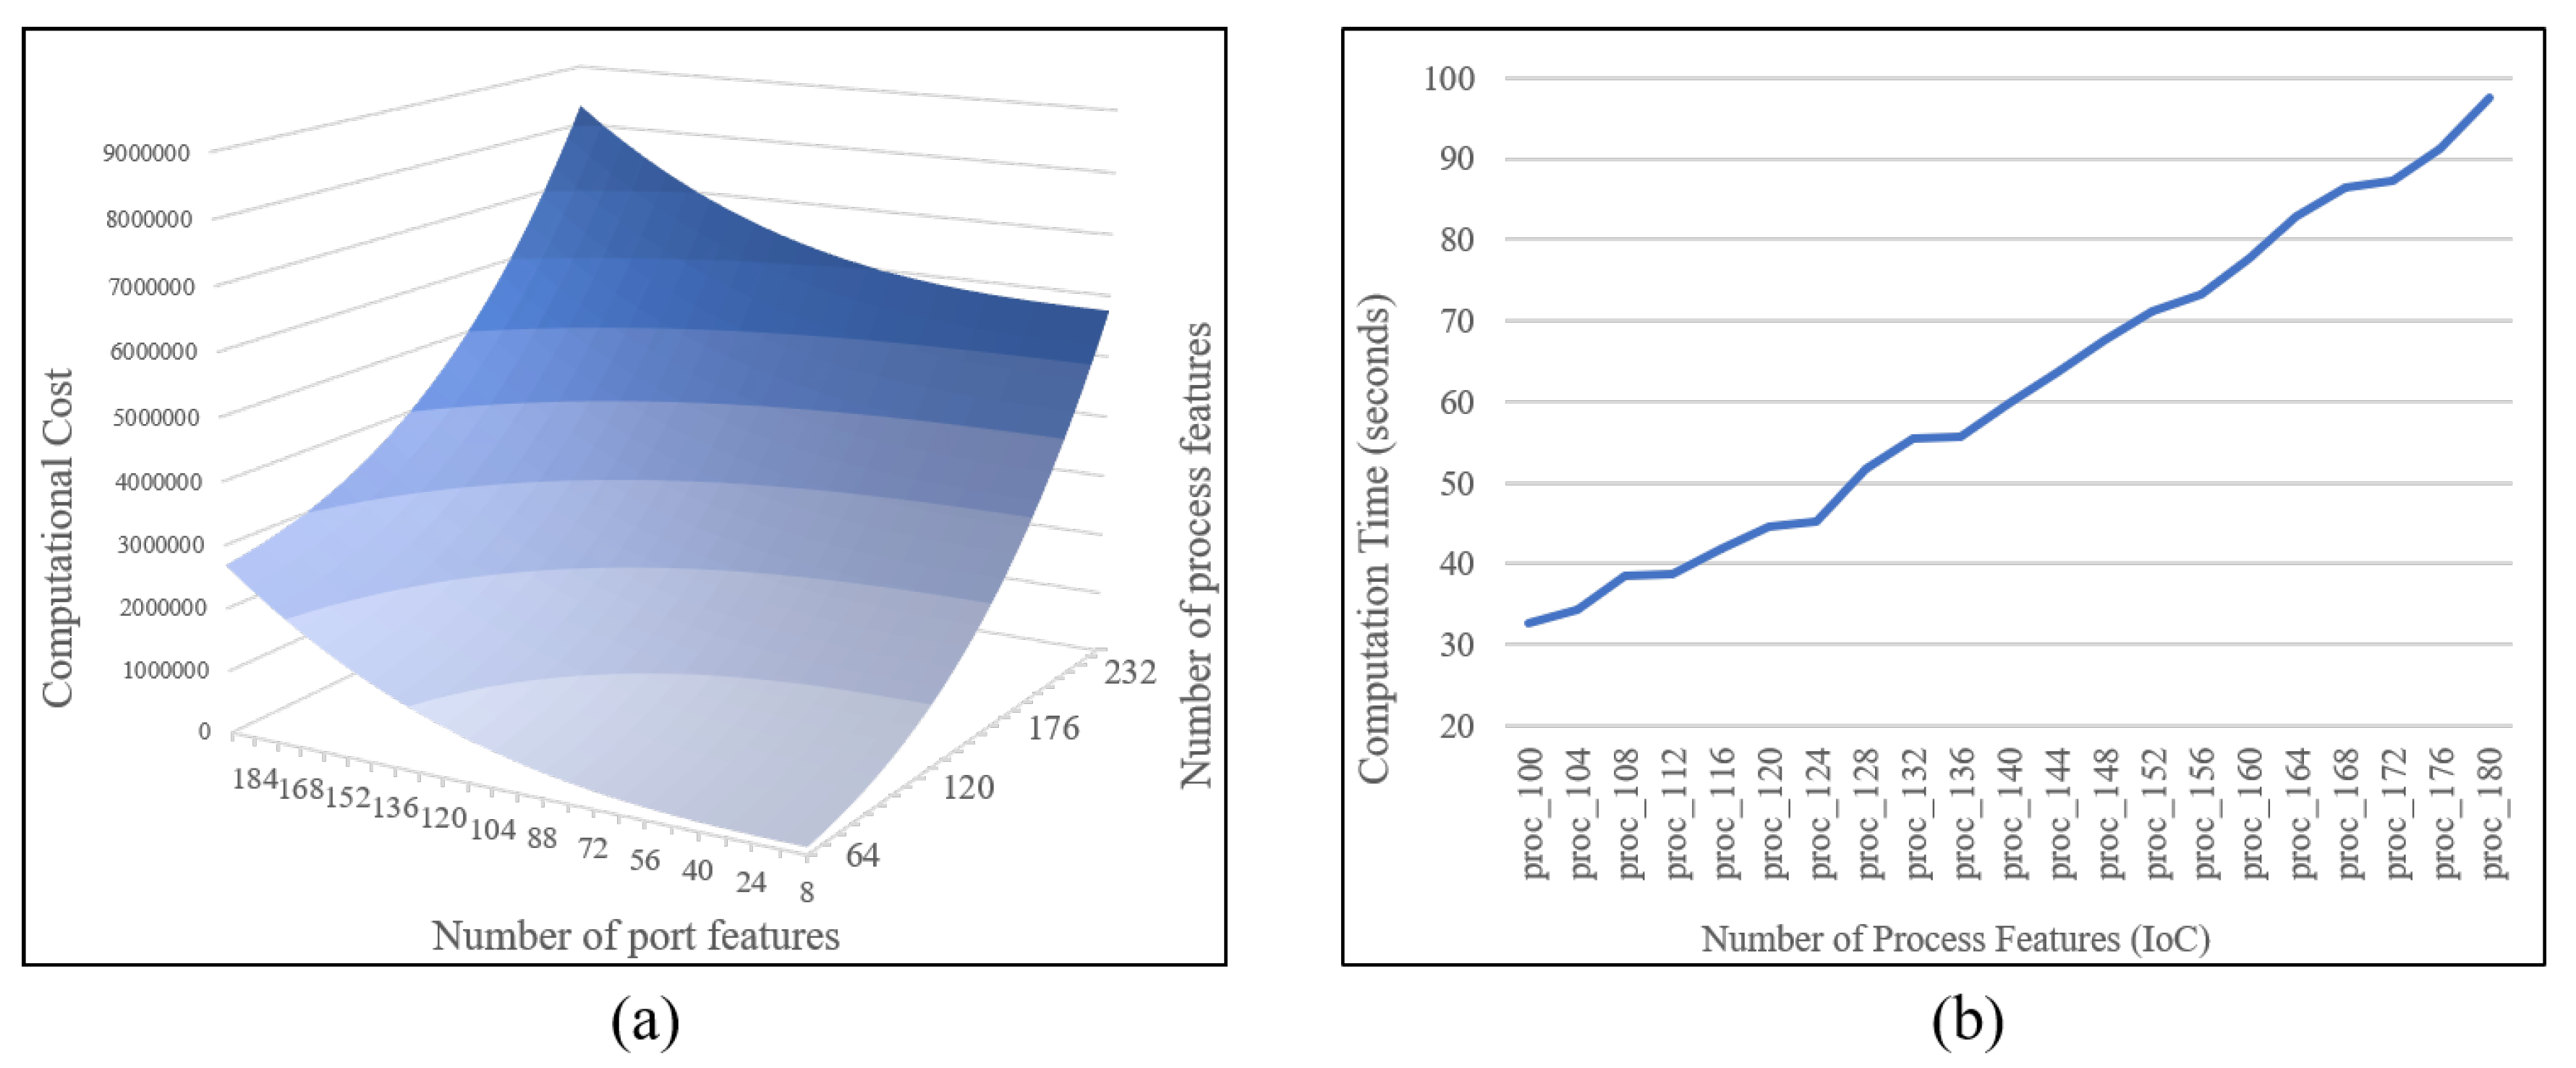
4.4. Computational Complexity and Implementation Cost
The proposed framework should consider computational complexity and the data traffic cost when it undertakes anomaly detection. During the process of training the GCN model for local threat detection, the adjacency matrix
A is the result of multiplying the adjacency matrices for IoC data. The size of the input data is greatly influenced by the size of the IoC data handled by the GCN model. Because the process of outputting and transmitting information for forming feature matrix
X in a prosumer device is not a large operation compared to the device’s performance, the time complexity for data operation is determined by the size of IoC data to be observed. The IoC data’s complexity as described in
Section 4.2 and
Figure 3 is determined by the number of processes expected to run on a prosumer device. The number of processes is an indicator affected by the prosumer device’s role and performance. As more prosumer devices are connected to a complex network and play various roles, more processes are expected to operate, leading to an exponential load of multiplication operations in the adjacency matrix for IoC data. The time complexity of the general matrix multiplication operation is
[
33], which is the time complexity of Strassen’s algorithm, and the time complexity of the fastest algorithm known to date is the method proposed by Josh and Virginia:
[
34]. During the GCN model’s learning process, matrix multiplication is used in the graph convolutional layer and the fully connected layer, but the order of the matrix is lower than that of the adjacency matrix for IoT data, which does not affect the time complexity.
Another consideration with regard to the implementation cost is network traffic. The proposed framework requires near real-time threat detection to respond to cyberattacks in the energy cloud environment. To this end, each prosumer device shares its device status information in a short period. If the number of prosumer devices constituting the energy cloud environment is very large, the energy cloud network must accurately accommodate a large amount of device status information transmitted every second.
6. Conclusions
In this paper, we proposed a CTI framework suitable for energy cloud environments. The proposed framework collects state information and IoC data from prosumer devices in the local layer where the AMI is configured. The collected data are used as a dataset for a deep learning-based threat detection technique in the middle station layer, and the detection result is fused with IoC data to create a security policy specialized for the local environment. In this process, a heterogeneous information network and a graph convolutional network generate contextual knowledge about cyber threats based on various types of data collected from various devices. This method detects cyber threats through contextual knowledge about the device by learning the relationship between the prosumer device’s state information and the surrounding environment. Moreover, the detection result of the intermediate station layer is used to generate a global CTI in the cloud layer, and the generated CTI data are used to improve the threat response capability of the entire system. This hierarchical CTI technology forms the ability to respond to both targeted attacks targeting a specific environment and general attacks targeting a wide range of areas. Simultaneously, learning the security model at the local layer can reduce the possibility of overfitting that can occur when simultaneously detecting various types of cyberattacks. This feature is a beneficial security response method in an energy infrastructure environment where system constancy is important. Furthermore, through experiments, we showed that the proposed security framework could realistically ensure the capability to respond to cyber threats.
However, the process of deriving a countermeasure and a security policy for cyberattacks using CTI should be performed only after a cost-perspective analysis. By modeling the behavior of attackers and general users in a given environment and calculating the cost associated with the behavior of each entity and predicting each outcome, the resulting security policy can be used and evaluated from a quantitative perspective.
In future research, we intend to study how the security framework can cope with more long-term and large-scale targeted attacks, model the interaction between attackers and defenders, and derive optimal solutions for each situation. Through this subsequent study, we will analyze the time series characteristics of cyberattacks and the costs of countermeasures and study an advanced framework that can simultaneously consider user privacy during the process of collecting and sharing data.


