Article

SpotFuzz: Fuzzing Based on Program Hot-Spots

School of Cyber Science and Engineering, Zhengzhou University, Zhengzhou 450001, China
*
Author to whom correspondence should be addressed.
Electronics 2021, 10(24), 3142; https://doi.org/10.3390/electronics10243142
Submission received: 16 November 2021 / Revised: 9 December 2021 / Accepted: 13 December 2021 / Published: 17 December 2021
(This article belongs to the Special Issue Data-Driven Security)

Abstract

:
AFL is the most widely used coverage-guided fuzzer, which relies on rough execution information to assign seeds energy, which can lead to waste. We track the program executed by AFL and discover that the hit counts of each edge might vary greatly when using different seeds as inputs. Some seeds, which are continuously given too much energy, experience very high hit counts of several edges without new crashes or edges being explored, which results in invalid execution and waste of performance. We also define time-consuming edges and discover that they only occupy a small part of the program. In this paper, we define invalid execution edges and time-consuming edges as hot-spots and propose a fuzzing solution SpotFuzz to solve energy waste caused by the above hot-spot phenomenon. It allocates seeds with more hot-spots during execution and uses less energy to reduce energy waste. Moreover, it preferentially selects seeds with less time-consuming edges as test cases, allowing for more edges to be explored in a limited time. We implement an SpotFuzz prototype based on AFL and test it on several real programs for 600 CPU days. The experimental results show that minimizing the invalid and time-consuming execution of edges can improve the fuzzing efficiency. On average, SpotFuzz could find 42.96% more unique crashes and 14.25% more edges than AFL on GNU Binutils and tcpdump.

1. Introduction

Vulnerability mining technology mainly includes fuzzing, taint analysis, and symbolic execution [1]. Fuzzing generates numerous random inputs automatically for triggering vulnerabilities in programs. Taint analysis detects whether key points in programs are tainted by marking data from untrusted channels as “contaminated” and analyzing their flow at run-time. Symbolic execution simulates the program by replacing variables with abstract symbols. Both symbolic execution and taint analysis require testers to understand the source code or binary code of the target program. Compared with them, fuzzing, which is universal, efficient, and can be easily scaled up to large applications [2], is a relatively accurate vulnerability detection method preferred by many researchers [3]. In recent years, researchers have made many improvements to American Fuzzy Lop(AFL) [4], e.g., libFuzzer [5] and honggfuzz [6], which are coverage-guided fuzzing tools released by Google.
Code coverage is a metric used to evaluate and improve the fuzzing process. libFuzzer and honggfuzz track basic block coverage, while AFL first proposes more accurate edge coverage. AFL allocates energy to seeds according to the code coverage, which might allocate too much energy to seeds that exercise high-frequency paths and limit the exploration of low-frequency paths. To cope with this problem, AFLFast [7] proposes more priority for low-frequency paths to find more paths in a short time. EcoFuzz [8] point out that the power schedule strategy proposed by AFLFast cannot flexibly adjust to the energy allocation in fuzzing process, which increases the average energy cost to discover new paths. It proposes the SPEM method to estimate the probability of finding new paths. An adaptive power schedule algorithm is proposed, which significantly reduces the average cost of discovering new paths.
Another problem is that the code coverage of AFL is not accurate. AFL uses a 64 KB bitmap to store the edge’s execution, which can cause hash collisions especially for large programs that lead to inaccurate code coverage. CollAFL [9] expand the bitmap to 128 KB, with a new hash calculation formula to solve the hash collision problem in AFL with lower instrumentation overhead. Based on CollAFL, Yan et al. [10] propose an execution path hash method for code coverage accuracy and allot more energy to the seed with a high–weight path to increase fuzzing performance. In 2019, Efuzz [11] proposed the concept of edge coverage heat, which is almost the same as the concept of high-frequency paths proposed by AFLFast. Both refer to the number of times an edge has been exercised by all seeds. Efuzz scores paths according to the heat of the edge coverage. The higher the heat, the lower the frequency to test the seed.
Previous researchers have been devoted to solving the problems of inaccurate coverage or low-frequency path testing. However, none of them have focused on the low fuzzing efficiency caused by the hot-spots of the program. Based on AFL, PerfFuzz [12] first proposed how to find various inputs while running different hot-spots in the program, to find the complex vulnerabilities in the algorithm. In this paper, we analyze the hot-spots of each input and try to reduce the time spent on them during executions to improve the fuzzing efficiency. Unlike PerfFuzz, which only takes the edge with the most execution times among all the inputs as hot-spots, we recognize the edge as a hot-spot if it iterates certain amounts or consumes plenty of CPU time during a run-time of target program testing. Too many hot-spots would reduce the performance of the testing process. If a seed invokes too many hot-spots without any new paths or crashes found, it is recognized as an invalid execution. Based on reducing the hot-spots ratio, we propose a method to reduce those invalid executions to guide fuzzing.
We define two kinds of hot-spots of the seed by the hit counts or the CPU time to execute the edge. Specifically, we directly obtain the execution information of each seed from the shared memory. It records when the edges are hit during the test by this seed, and the corresponding counts. We calculate the threshold to define hot-spots by comparing the same edges among all the seeds. We then calculate the ratio of hot-spots in this seed, that is, the hit ratio of the seed. This value can be used to reflect the quality of the seed. In addition, we add a time instrumentation function to the AFL source code to obtain the execution time of each edge at run-time. We store the execution time of each edge in memory to find the time-consuming edges. By comparing the coverage of each seed, we can find the number of time-consuming edges among all hit edges and get the time hot-spot probability value of the seed. The ratio of hit hot-spots and time hot-spots are used as indicators to improve power schedule strategy and favored seed selection algorithm. More energy and priority are given to those seeds with low hot-spots ratio to improve fuzzing efficiency.
We implement three fuzzers based on the coverage-guided AFL to evaluate the effects of hit and time hot-spots on the efficiency of AFL. SpotFuzz-h aims to improve the issue of hit hot-spots, while SpotFuzz-t corresponds to time hot-spots. SpotFuzz combines those two methods together to comprehensively improve the overall performance. We then compare our fuzzer with AFL and AFLFast on the YAML-CPP data-set [13], GNU Binutils [14], and some other public tools to prove its efficiency. This paper makes the following primary contributions:
  • We study the hot-spot issues in the program and prove that different inputs cause varying distributions of hot-spots in the program, thus affecting the fuzzing efficiency of AFL.
  • We propose a new favored seed selection algorithm and power schedule strategy based on the hot-spots ratio of each seed. The seeds with a high ration will be tested less and delayed.
  • We implement two modules in our coverage-guided fuzzer SpotFuzz. SpotFuzz-h studies the influence of program hot-spots caused by the hit counts of edge, while SpotFuzz-t focuses on the time-consuming edge. We combine those two strategies together and optimize the final result.
  • Our fuzzer find 45.86% more unique crashes than AFL and prove that reducing the occurrence of hot-spots in test cases can improve the efficiency of the fuzzer.

2. Background

2.1. Coverage-Guided Fuzzing

Miller et al. [15] conduct system testing on utility programs running on the UNIX operating system by constructing random inputs. They propose fuzz testing technology for the first time, which solves the problem that traditional program verification technology is challenging to apply to large-scale systems. Fuzzing is divided into three categories: black box, white box, and grey box testing. Among them, greybox fuzz testing has high efficiency, which has become the most scalable and practical method in software testing [16]. AFL is a widely used coverage-based grey-box fuzzer. Researchers make many improvements based on AFL in recent years, and our fuzzer also builds on AFL. Figure 1 shows the general workflow of AFL and the critical function called at each process. The fuzzing process of AFL is divided into two stages. The stage of checking seed file is as follows:
(1) Instrument target application. _afl_maybe_log is used to record code coverage.
(2) Read initial inputs to the seed queue by r e a d _ t e s t c a s e s function.
(3) Run perform_dry_run to test seed file and ensure software usually runs. The perform_dry_run function calls calibrate_case function to test seed file; the process is shown in the Figure 2. The program is executed and traced by the run_target function.
Figure 1. The workflow of AFL.
Electronics 10 03142 g001
When all the initial seed files are tested, AFL starts the formal testing stage. It will continuously perform the main loop.
(4) Select entry seed and trim seed. Call the run_target function to test whether the trimming impacts the execution path; if not, save the trimmed seed, which can reduce the input size and save time.
(5) Score the quality of this test. AFL uses a power schedule algorithm to score the seed. The higher the score, the more chances of mutation.
(6) Mutate seed. AFL uses various mutation algorithms to mutate seeds to generate many test cases.
(7) Test and trace. Take test case as input to monitor the instrumented program execution.
(8) Track code coverage and report vulnerabilities if security violations are detected.
(9) Save interesting test case as seed. Add the test case to the seed queue if new edge is detected or hit counts of the edge have changed. Otherwise, go to step 6.
(10) Calibrate new seed and rearrange the seed queue. If the program finds a new favored seed, set the score_changed variable of the update_bitmap_score function to 1.
(11) Cull seed queue to reduce inputs. The cull_queue function will be executed only when score_changed is 1, and the cull_queue function will be executed to pick out favored seeds with the seed selection algorithm.
(12) If all test cases generated by the seed are finished, go to step 4.
The main loop only end when it is manually terminated.

2.2. Code Coverage

Code coverage is a standard used to evaluate and improve the fuzzing process. AFL gains code coverage by instrumenting the source code at compile-time and monitoring at run-time. Generally, the compiler provides three levels of coverage detection: function, basic block, and edge. Specifically, AFL uses tuple to record edge information. Figure 3 is a partial disassembly of arrange.c, which is a full alignment algorithm, using C language. In AFL, tuple (AB) indicates that the program hit the edge between block A and block B. AFL uses a 64 KB shared memory to store the edges and the hit counts of edge. The algorithm pseudocode for recording code coverage is as follows:
(1) cur_location = < C O M P I L E _ T I M E _ R A N D O M > ;
(2) shared_mem [ c u r _ l o c a t i o n p r e v _ l o c a t i o n ] + + ;
(3) prev_location = cur_location ≫ 1.
C O M P I L E _ T I M E _ R A N D O M means that a random number between 0 and 65,536 is generated at compile time, which is used to mark the current basic block. XOR the current block and the previous block, use the XOR value as the edge index, and store the hit counts of edge to the shared memory. The purpose of shifting cur_location to the right by 1 bit is to distinguish the jump A A , D E and E D .

2.3. Seed Selection & Power Schedule

AFL maintains a list of t o p _ r a t e d [ ] with 65,536 bytes to select a favored seed set that can cover all execution edges. The seed with shorter execution time and smaller size will be added to t o p _ r a t e d [ ] , and then AFL will traverse the seeds in t o p _ r a t e d [ ] and mark the seeds with new edges as favored. In the next test, these seeds will have more chances to fuzz.
AFL allocates energy to seeds according to their execution time and code coverage. Seeds with shorter execution time and higher code coverage will have more energy. Moreover, seeds with more energy will have more chances of mutation in the havoc stage.

2.4. Motivation of SpotFuzz

The quality of test cases will directly affect the execution efficiency of the program under test. So, we analyze the execution of different inputs and observe that hit counts of different inputs fluctuate on the same edges, and the discrepancy of the execution times vary greatly depending on different edges in program. Therefore, we assume that the two phenomenons might affect the fuzzing efficiency. The following examples exhibit how the two phenomenons affect efficiency.

2.4.1. The Seeds Repeatedly Exercise Certain Edges and Cause Energy Waste

We use AFL to test the arrange.c and record real and detailed execution information of each seed. By analyzing the execution of seeds in the queue, we discover some interesting edge information, as shown in Figure 4.
We use two-dimensional coordinates to represent the edge information of each seed. The horizontal axis represents the key value of each tuple that used to identify the edge. For instance, 115 is used to identify the edge represented by the tuple (AB). The vertical axis denotes the hit counts of the edge. +, x, and ▴ symbols indicate the edge information of s 6 , s 8 , and s 9 respectively. We can intuitively see that the abscissa values of these three seeds are the same. The ordinate values of them are different, which means that although they exercise the same edges, the hit counts of edge are different.
We can also see that the ordinate values of s 8 and s 9 are higher than s 6 . We can analyze the crash file in AFL and find that s 8 and s 9 neither find new edge nor new crash, so it is reasonable to consider that it is invalid for s 8 and s 9 to exercise the same edges multiple times. Finally, we record the overall execution time of each seed in the queue based on the original AFL statistics, and we calculate the scores of s 6 , s 8 , and s 9 to be 200, 150, and 100, according to the power schedule of AFL. The initial score of all seeds is 100. s 8 and s 9 do not contribute to code coverage and the number of crashes, so their scores should be lower. However, the scores of s 8 and s 9 have increased, which will lead to energy waste. Besides the above particular case where the edges of seeds are the same, it is more common that only partial edges of the seeds are the same, but different seeds hit the same edges at different times. Seed exercises on the same edge repeatedly are invalid execution and might cause energy waste. Our goal is to reduce this energy waste and improve the fuzzing efficiency.

2.4.2. Time-Consuming Edges Are Executed Excessively, Which Affect the Fuzzing Efficiency

We suppose that there is a significant difference in the execution time of edges of the program. If the seed always executes the time-consuming edges, the program might be tested fewer times at the same time, which might decrease code coverage. In order to verify our conjecture, we test on YAML-CPP for 24 h. We instrument it to record the time required of each edge in the program, as shown in Figure 5.
The horizontal axis is the key value of the edge, and the vertical axis represents the CPU clock cycles required to execute the corresponding edge. From the time distribution of the edges in the figure, it can be seen that the consumption times of different edges are different. Only a few edges are in the higher time consumption area. A large number of edges are concentrated in the lower time consumption area. Therefore, we hope to explore areas where the program edges are densely distributed first and find more edges in a limited time. We want to improve the fuzzing efficiency by reducing the execution of time-consuming edges.
We solve the above problems through the strategy we proposed in Section 3 and evaluate our strategy in Section 4.

3. Methodology

This section proposes a hot-spots ratio model to discuss which seeds are over-exercising certain edges, and the time-consuming edges in the program. Ratio of hot-spots, ether hit hot-spots or time hot-spots, is an essential indicator to evaluate the quality of the seed and to improve the algorithm of the favored seed selection set and the power schedule strategy.

3.1. Definition of Seed Hot-Spots

We obtain detailed execution information from shared memory and record the time consumption of each edge into a 64 KB buffer. Statistics show only a slight difference in the time for different inputs to exercise the same edge. Because the values are relatively stable, we use their mean value as CPU time cost by this edge. For each seed, if the seed triggers a certain edge multiple times in the program, we define such an edge as hits hot-spot. If the execution of the edge is quite time-consuming, such an edge is called the time hot-spot. For instance, seeds s 1 and s 2 , if s 1 hits tuple (AB) 1000 times, and s 2 hits tuple (AB) 10 times, then tuple (AB) is a hit hot-spot for s 1 . Similarly, if s 1 executes tuple (AB) takes 1000 us, tuple (AC) only takes 10us, then tuple (AB) is a time hot-spot for s 1 .

3.2. Seed Hot-Spots Ratio Model

Seed hot-spots ratio refers to the ratio of over-exercised edges against all edges covered by the seed. We use it as an indicator to measure the quality of the seed.
Hit hot-spots ratio of seed. For each fuzzing test, we record the execution of the program. The specific data to be recorded are shown in Table 1. s i represents the i-th seed in the seed queue, where i N . e j represents the edge corresponding to j, j is the key value of edge, where j ( 0 , 65536 ) . h i . j represents the number of times that the seed s i hits the edge e j , h i . j ( 0 , 256 ) . Seed hits hot-spot probability calculation steps are as follows.
(1) Calculate the mean hit counts of each edge.
e j ¯ = i = 0 h i . j / s u m
where s u m is the number of seeds that hit e j .
(2) Determine which edges are hits hot-spots. Compare the hit counts of each edge with the mean hit counts of the edge, if the h i . j > e j ¯ , then e j is a hits hot-spot for s i .
(3) Calculate the ratio of hit hot-spots.
p e i = h e / b i t m a p _ s i z e
p e i denotes hit hot-spots ratio of s i , h e is the total number of hit hot-spots of s i , and bitmap_size is the total number of edges hit by s i . Then hit hot-spots ratio of seed s i is calculated.
Time hot-spots ratio of seed. We discover that time-consuming edges occupy only a small part in the program. Most of edges are relatively low time consumption. We intend to find the location of the time-consuming edges, and seeds whose hit edges are in the time-consuming region. We reduce the mutation chance of these seeds, which are without new edges discovered, to improve fuzzing efficiency.
(1) Divide the edges into three regions: (highly) time-consuming, medium time-consuming, and low time-consuming regions.
t = M a x ( t j ) ( M a x j ( 0 , 65536 ) ( t j ) M i n j ( 0 , 65536 ) ( t j ) ) / 3
where t is a threshold that divides the time-consuming region from other regions and t j denotes the time consumption to execute the edge e j . We define the region of t j > t into time-consuming region.
(2) We define the edges in time-consuming region as time hot-spots.
(3) Similarly, we define the ratio of time hot-spots to the edges covered by the seed s i as p t i . In Formula (4), h t denotes time hot-spots count in the seed s i .
p t i = h t / b i t m a p _ s i z e

3.3. Challenges of Schedule Algorithms

AFL generates many test cases through seed mutation and adds test case to seed queue in turn, if it finds new edge or the hit counts of edge changed. As the seed queue grows, the e j ¯ and t will change, as will hit and time hot-spots counts of each seed correspondingly, resulting in change of p e i and p t i . So, we need to update the value of p t i and p e i in real-time. At the beginning, we update p t i and p e i of seed every time we test program, which increases computation overhead. To cope with this challenge, we give a more reasonable hot-spots ratio update strategy, as shown in Algorithm 1. Note: m i n [ ] records the minimum distance between h i . j and e j ¯ , m i n [ j ] = m i n { f a b s ( h i . j e j ¯ ) } . e _ a v g [ ] is the mean hit counts of the current edge. l a s t _ a v g [ ] is the mean hit counts of the edge when the hot-spots ratio of seed was calculated last time.
Algorithm 1 Hot-spots ratio update strategy
1:
functionupdate_hp( )
2:
    for  i = 0 i = M A P _ S I Z E  do
3:
        if trace_bits[i] then
4:
           e_sum[i]+=trace_bits[i]
5:
           e_avg[i]=e_sum[i]/sum
6:
           if fabs(e_avg[i]-last_avg[i])>min[i] then
7:
               e++;
8:
           end if
9:
        end if
10:
    end for
11:
    if e/total_bitmap_size > threshold then
12:
        Calculate_hp(queue);
13:
    end if
14:
    memcpy(last_avg, e_avg, MAP_SIZE);
15:
end function
We check the edges covered by current seed and calculate e _ a v g [ ] every time we test program. If the difference between e _ a v g [ ] and l a s t _ a v g [ ] is more remarkable than m i n [ ] , the current hot-spots standard of the edge will change hot-spots counts of the seed and record it. If the ratio of the changed edges to the total hit edges reaches the update threshold, which is a variable we set to 0.25, we call the Calculate_hp(queue) function to recalculate the hot-spots ratio of all seeds in the queue. After the calculation, we need to save the mean hit counts of edges to the l a s t _ a v g [ ] .
Another challenge is that basic block instrumentation, which is used to acquire execution time, affects the fuzzing efficiency. We instrument the program with time stamp to obtain the mean time consumption of the edge but only when a new edge appears. In this way, we can sharply reduce instrumentation calls.

3.4. Seed Selection Algorithm

We still adopt the original seed selection mechanism of AFL when the test case finds a new edge and adds it to the queue. When AFL rearranges the seed queue to select the favored seed set, we add a new measurement indicator, the detailed algorithm shown in Algorithm 2. Among them, factor1 is the original measurement indicator of AFL; seeds are added with short execution time and small size to t o p _ r a t e d [ ] . Based on this, factor2 is added as another indicator. The seeds with low hit hot-spots ratio and time hot-spots ratio are added to t o p _ r a t e d [ ] . The purpose is to select a favored seed set with less invalid execution.
Algorithm 2 Favored seed selection algorithm
Input: Seed s;
1:
factor1=s->len*s->exec;
2:
factor2= s > p e * s > p t ;
3:
for i = 0 i = M A P _ S I Z E do
4:
    if trace_bits[i] then
5:
        if top_rate[i] then
6:
           if factor1> top_rated[i]->len* top_rated[i]->exec then
7:
               continue;
8:
           end if
9:
           if factor2> top_rated[i]->pe* top_rated[i]->pt then
10:
               continue;
11:
           end if
12:
        end if
13:
        top_rated[i]=s;
14:
    end if
15:
end for
Output: Favored seed set F

3.5. Power Schedule Strategy

AFL allocates energy based on the rough execution time of the seed and the code coverage. The seed has more energy, which means it has more chance to mutate. We propose new power schedule strategy based on power schedule of AFL and allocate more energy to seeds with a low hot-spots ratio. We suppose that the fewer program hot-spots, the faster the execution speed, which could improve the fuzzing efficiency. In this section, we introduce the power schedule strategy proposed based on the hot-spots ratio of seed.
The Table A1 records the detailed edges information of arrange.c in the form of Table 1, and time consumption of each edge. Substituting the data of s 4 in the appendix into the seed hot-spot model, p e 4 is 0/3, that is, the ratio of hit hot-spots of s 4 is 0%. Similarly, we can calculate that p e 6 is 21.74%, p e 8 is 60.87%, and p e 9 is 56.52%. In the same way, p t 4 is 1/3, that is 33.33%, p t 6 is 4.35%, p t 8 is 4.35%, and p t 9 is 4.35%. The hit hot-spots ratio and time hot-spots ratio of all seeds in the queue as shown in Figure 6.
The blue line is the distribution of hot-spots ratio, and the yellow line denotes the average of hot-spots ratio. We measure the quality of the seed according to the distance between the hot-spots ratio of seed and the average of hot-spots ratio. Taking the average of hot-spots ratio as the baseline, the distance is divided into upward and downward distances. We suppose that seeds farther down from the baseline produce fewer hot-spots, which have better quality and get more energy. Conversely, the farther up the seed is from the baseline, the more hot-spots can arise and the less energy is obtained. We define the hit hot-spots coefficient c e ( i ) and the time hot-spots coefficient c t ( i ) to express the relationship between distance and energy. d i s t ( s > p e , p e _ a v g ) denotes the distance between hit hot-spots ratio of the seed s i and average of hit hot-spots ratio.
c e ( i ) = d i s t ( p e _ a v g , s > p e ) u p D s > p e > p e _ a v g d i s t ( p e _ a v g , s > p e ) d o w n D s > p e < p e _ a v g
where
u p D = M a x s S ( s > p e ) p e _ a v g
d o w n D = p e _ a v g M i n s S ( s > p e )
u p D denotes the maximum distance upwards. Correspondingly, d o w n D is the maximum distance downwards, and s belongs to the seed set S. When the hit hot-spots ratio of the seed s i is the maximum value, many hot-spots can arise during the fuzzing, and the value of c e ( i ) is the smallest. When the s > p e is higher than the baseline, the bigger is the ratio of d i s t ( s > p e , p e _ a v g ) to u p D , the more hot-spots in edges are covered by the seed s i , and the smaller is the value of c e ( i ) . On the contrary, when the s > p e is lower than baseline, the smaller is the ratio of d i s t ( s > p e , p e _ a v g ) to d o w n D ; then, the fewer hot-spots in edges that are covered by the seed s i , the smaller the value of s > p e and the higher the c e ( i ) value. When the value of s > p e is the smallest, the value of c e ( i ) is the largest.
The calculation method of time hot-spots coefficient c t ( i ) is the same as c e ( i ) , and final hot-spot coefficient of the seed is
C = [ c e ( i ) w + c t ( i ) ( 1 w ) ]
where w is a weight coefficient for hit hot-spots. To allow seeds with high hot-spots ratio to have a few execution opportunities and seeds with low hot-spots ratio get energy within a reasonable range, the final performance score of seed is defined as
p e r f _ s c o r e ( i ) = ( C + 0.5 ) 2 C > 0 ( 1 0.6 C ) C < 0
That is, we take the multiple of the original performance score. Since hit hot-spots and the time hot-spots have different effects on the program, we assign different weight coefficients to them. After many trials, we found that the test result is better when w is set to 0.65.
We calculated the energy of all seeds using the above method and discovered that the energy of s 8 and s 9 obtained is less than the original energy after adjusting our power schedule strategy, effectively solving energy waste in motivation of Section 2.4.1.

4. Implementation

In this paper, the 2.57b open-source version of AFL is used and extended, as shown in the blue part of Figure 1. We also use compile-time instrumentation and run-time monitoring to obtain detailed execution information of each edge. We use the obtained edge information to adjust favored seed set selection algorithm and power schedule strategy. The code implementation mainly uses c language and assembly language.
Time instrumentation. We add __afl_time_f instrumentation function to afl-as.h to calculate time consumption of edge and use the rdtsc function to count the CPU clock cycles required for each edge. We store time consumption of edge to expanded shared memory. When we run_target function to test target program, if a new edge appears, time instrumentation function will be called to record the time consumption of the edge.
Edge coverage: we obtain the hit counts of each edge and its execution time at run-time, and compress and store it in the memory. These data are used to calculate the hot-spots ratio of seed. After the calculation, it is written to the memory uniformly. When updating the hot-spots ratio of seed in the queue next time, read data from memory.
Favored seed set selection: this part mainly improves the update_bitmap_score function, which maintains the favored seed queue of AFL. We take hit hot-spots and time hot-spots ratio of each seed as two attributes in the seed structure. They are used to adjust the seed queue. The smaller the hot-spots ratio of seed, the more competitive it will be.
Power schedule strategy: we implement our power schedule strategy in the calculate_score function and calculate two hot-spots coefficient values for each seed according to Formulas (4) and (7). We obtain the final energy of each seed by multiplying hot-spots coefficient based on the original energy of AFL.

5. Evaluation

5.1. Configuration of Evaluation

Program under test. This section uses some real-world programs to evaluate our proposed improvement strategy based on the hot-spots ratio of seed; the program configuration is shown in Table 2. The experiment design should take into account factors such as the instability of the results caused by few short-time experiments and the unscientific of single test case [17]. So, we test each group of experiments at least ten times, each for 24 h, and provide two different test cases for each target program.
Empty file refers to text file that contains only one space, test denotes test cases provided by target program, and AFL−test denotes test cases provided by AFL.
Baseline and metrics. We compare our fuzzers with AFL and AFLFast. Generally, the higher the code coverage, the higher the number of crashes [18]. Laura et al. pointed out that the correlation between the two might not be significant [19]. It is more valuable to measure the number of crashes directly. We use the number of unique crashes as the primary metric. If no crashes are found, we will regard code coverage as a metric.
Platform. Our experiments are conducted on two 64-bits machines: one machine with eight cores of 1.80 GHz Intel CPU and 16 GB of main memory and another machine with 3.00GHz Intel CPU and 32 GB of main memory. Both of them run Ubuntu 20.04.

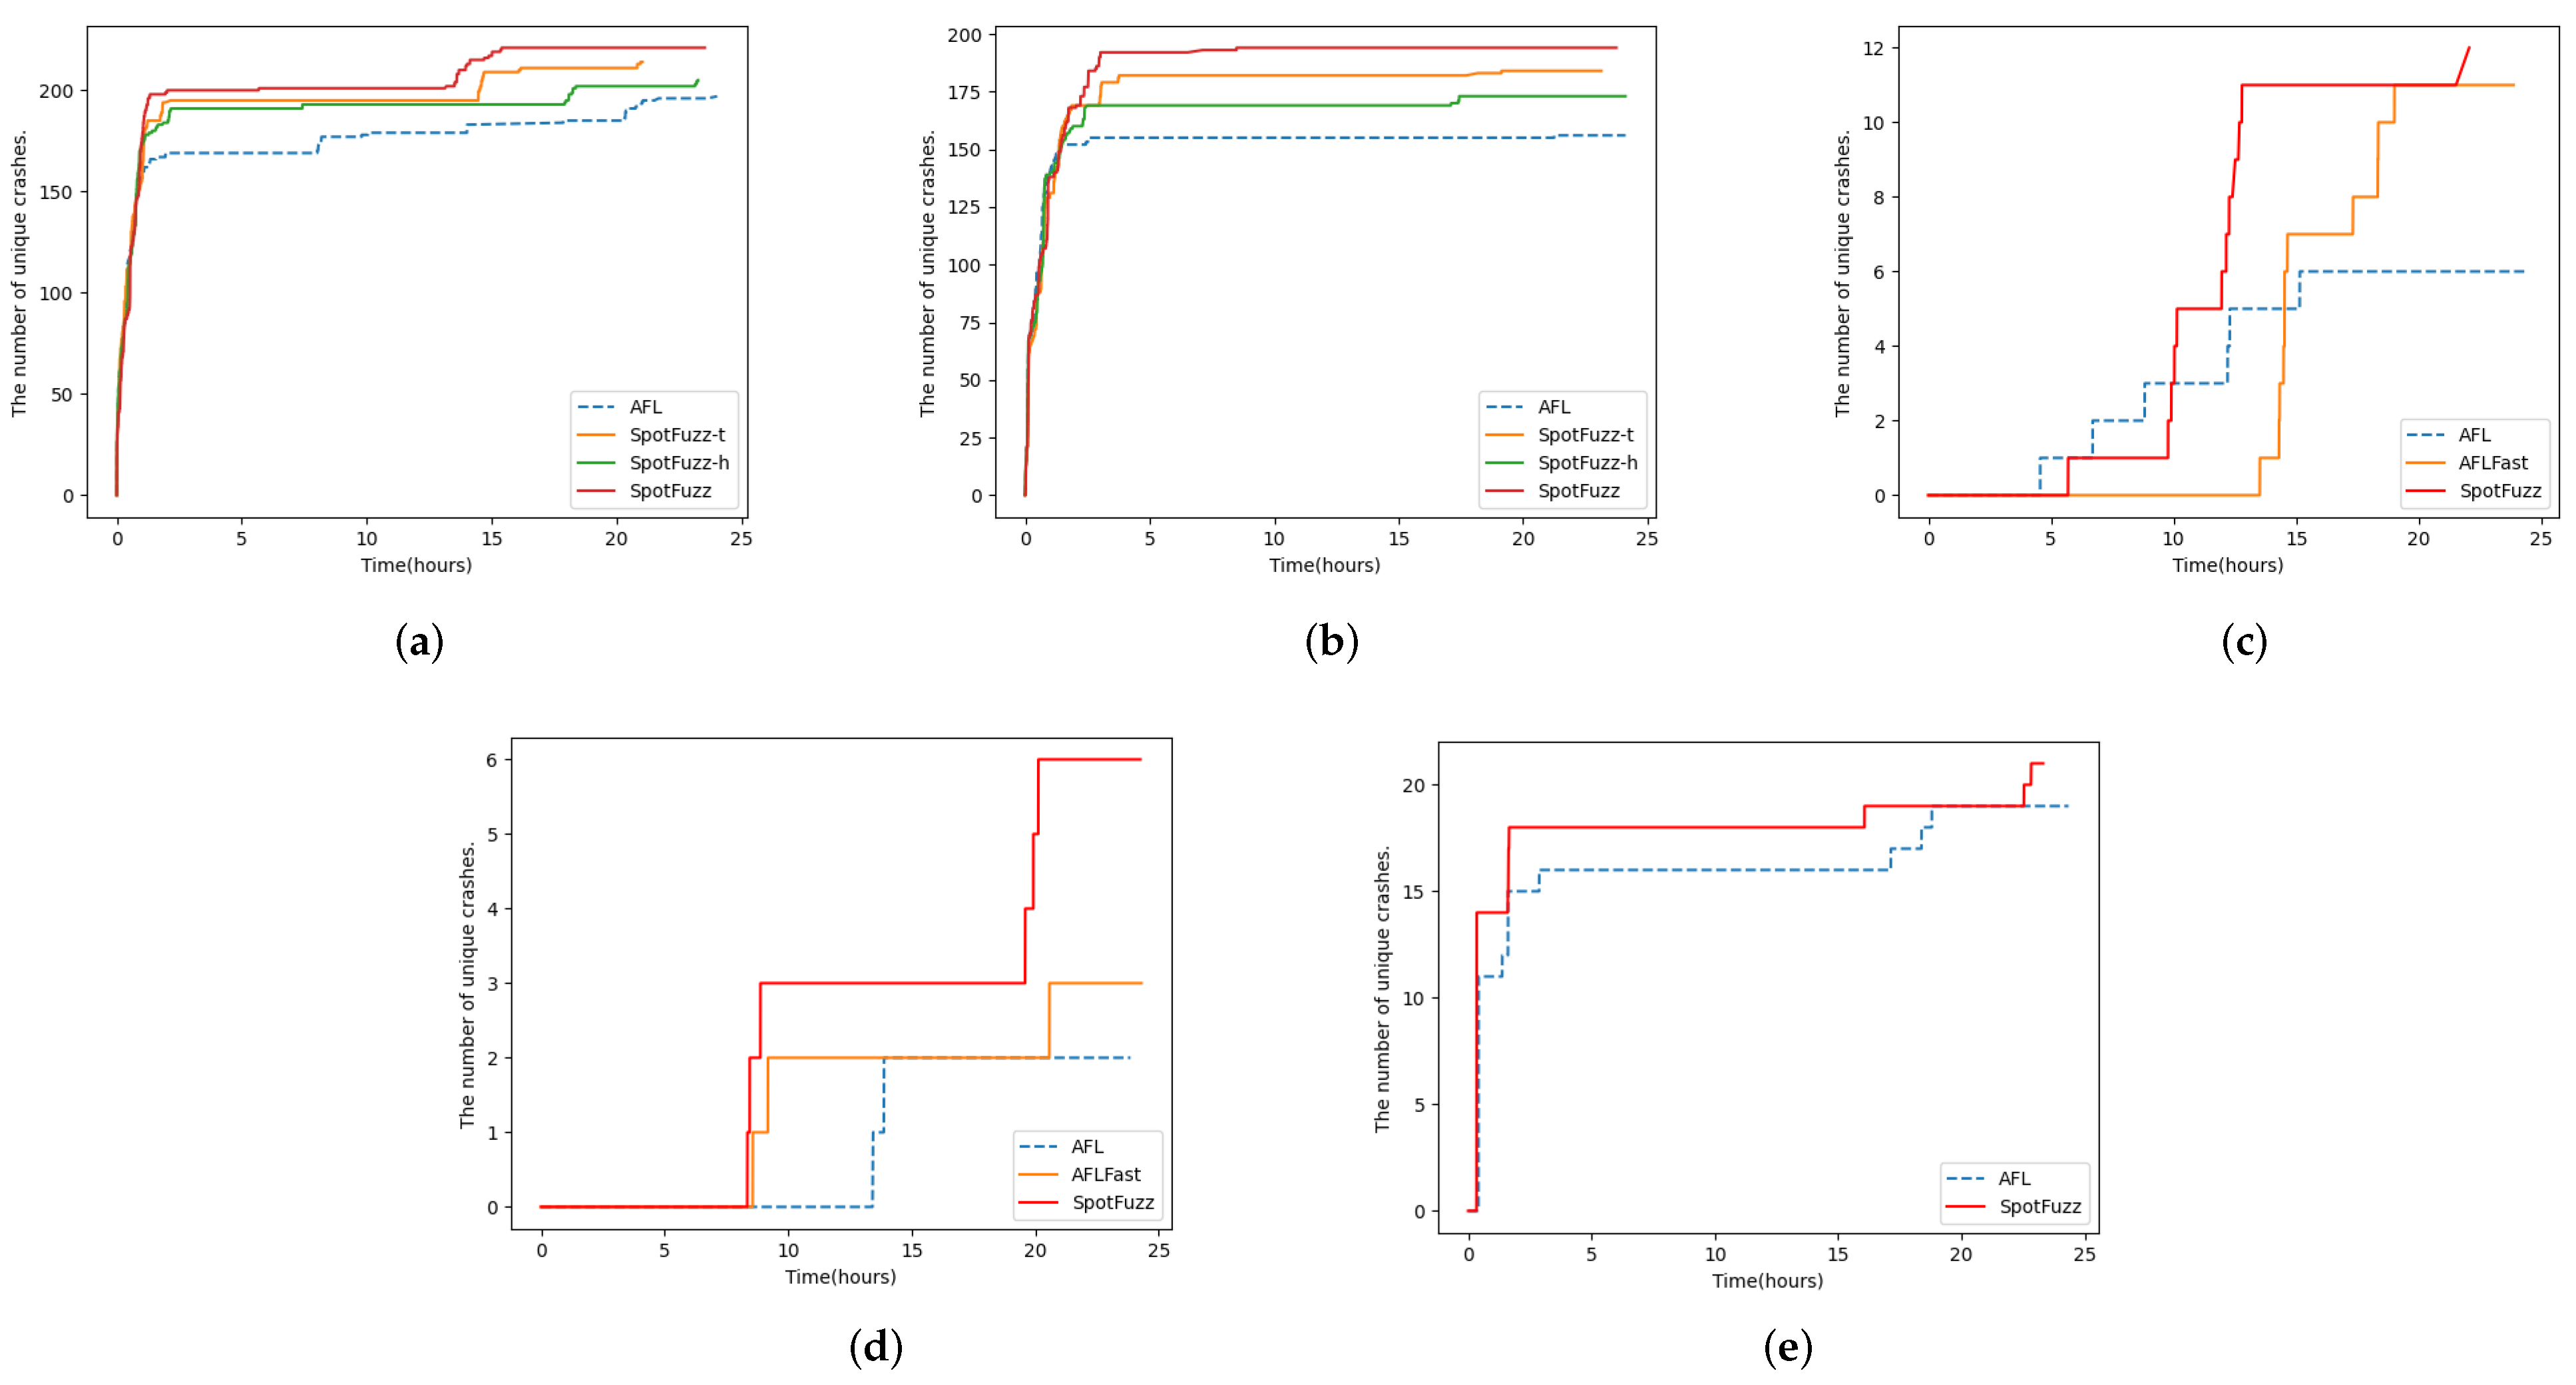
5.2. Evaluation on YAML-CPP

YAML-CPP is a tool used to parse and generate YAML files. We test it on AFL and our three fuzzers. We use the original 43 test cases and empty file as input. We use this data set to evaluate the effect of hit hot-spots and time hot-spots on fuzzing. Table 3 is the result of unique crashes.
When we use empty file as input, both our fuzzers and AFL can find more unique crashes. Our three fuzzers find more crashes on average in ten experiments, and the maximum value of crashes is also higher than AFL in a single time experiment. The average number of crashes found by SpotFuzz-h increased by 6.98% compare to AFL, and SpotFuzz-t increased by 8.04%. Testing effect of SpotFuzz is better, and the average number of crashes increased to 10.23%. When using the test cases given by YAML-CPP, the result is more prominent. The average number of crashes of our three fuzzers are, respectively, increased by 11.79%, 12.04%, and 22.55% than AFL. The experimental results show that exercising some edges multiple times is indeed invalid execution. It also proves that our time hot-spots strategy is reasonable. If one makes the seed avoid the time-consuming region first, then testing the region with more dense edges can improve fuzzing efficiency. This also proves that the power schedule strategy we proposed is reasonable, and it is more effective to consider both hit hot-spots and time hot-spots.

5.3. Evaluation on GNU Binutils and Other Tools

GNU Binutils is a collection of binary tools used to process object files in many formats. We use the 2.28 version of objdump, readelf, and nm for testing. The experiment condition settings are similar to the previous subsection. We also use AFLFast and AFL as benchmarks. AFL, AFLFast, and our fuzzer only found some unique crashes in nm tool, and no crash was found in objdump and readelf.
It can be seen from Table 4 that when our empty file is used as the initial input, in 10 experiments, the average number of crashes found by SpotFuzz is 67.69% higher than that of AFL and 7.92% higher than AFLFast. However, when testing with the initial input given by the AFL test file, the result is unstable. The average number of crashes is lower than AFLFast. In the experimental process, we find that both SpotFuzz and AFL sometimes cannot find the crash, but AFLFast can find crash in every experiment, and it is more stable than our fuzzer. Generally, our fuzzer has a more obvious improvement than AFL.
In addition to the above two data sets, we tested the network data analysis tool tcpdump [20], but the results were not very satisfactory. Compared with AFL, the average number of crashes found by SpotFuzz only increased by 4.66%. The maximum value was the same as AFL. Table 4 only records the programs that can find the crash. For those programs in which no crash was found, we record their code coverage in Table 5.
The average number of edges found by SpotFuzz is higher than that of AFL. There is a slight difference between the different programs. On average, SpotFuzz finds 14.25% more edges than AFL. According to the execution results in all tables, different inputs indeed do make some differences in the experimental results, but overall our fuzzer does have a certain improvement compared with AFL, which proves that our power schedule strategy might be more reasonable.

5.4. Evaluation Summery

This subsection summarizes the unique crashes discovered by fuzzers in 24 h. We chose the middle level of ten experiments to study the situation in which unique crashes discovered by fuzzer in 24 h. The red line in Figure 7 denotes the unique crashes discovered by SpotFuzz. On YAML-CPP, we can see that our three strategies outperform AFL over time. The efficiency is maximized while reducing hit and time hot-spots. The second only takes into account time hot-spots, and the third only takes into account hit hot-spots. (c) and (d) show the changes in the number of crashes found on the GUN Binutils nm program over time. The number of unique crashes found on this program by our fuzzer is higher than AFL. In (c), the performance of our fuzzer and AFLFast is not as fast as AFL in the early stages but significantly better than AFL after a few hours. We can see from (e) that the experimental result of SpotFuzz on tcpdump is minimal, only slightly better than AFL. In general, our fuzzer has clear advantages in terms of speed and number of unique crashes found after a few hours than AFL, and it also meets our goal of finding more crashes in a limited time.

6. Related Work

In this paper, we propose new seed selection algorithm and power schedule strategy based on hits and time hot-spots to solve the low fuzzing efficiency caused by program hot-spots. We improve fuzzing efficiency by reducing the energy of seed with the high hot-spots ratio. However, Perffuzz discussed in the previous section only finds the complexity vulnerabilities in the algorithm by looking for the hot-spot input during the running program. Next, we will discuss the methods researchers have used to improve some problems in AFL in the past five years.

6.1. Unscientific Power Schedule Strategy & Improve Seed Selection Algorithm

AFLFast and Ecofuzz point out that AFL has the problem of wasting too much energy on the high-frequency path. AFLFast proposes to allocate more energy to the path with lower seed exercising frequency, reducing energy waste on the high frequency path. After that, Ecofuzz points out the power schedule strategy of AFLFast is not flexible enough and proposes an adaptive power schedule algorithm. In 2017, AFLGO [21] optimizes the seed selection of AFL by giving more energy to seeds closer to the target position so that AFLGO can cover the target faster to test the places we are interested in. AFLGo only selects the shortest path to the target, so it might not be able to exploit a vulnerability. Hawkeye [22] considers all possible paths to the target position, prioritizes and schedules the seeds that could reach the target quickly, uses an adaptive mutation strategy, and reduces the time it takes to reach the target point and find crash.

6.2. AFL Is Harder to Break through Special Boundaries

The authors of [23,24,25,26] are devoted to solving the magic bytes comparison problem. Driller [23] adds concolic execution technology based on AFL. When fuzzing encounters a bottleneck, it will perform concolic execution, which can solve the problem of magic bytes comparison to a certain extent. VUzzer [25] points out that Driller makes the tool inefficient due to the explosion of symbolic execution paths and other reasons. Static analysis and dynamic taint analysis are used to reduce the mutation of invalid format seeds and prioritize seeds that cover deeper paths and test cases that cover error processing blocks and frequent paths. Steelix [24] proposes a binary fuzzing method based on program state to execute the path protected by magic bytes and uses lightweight static analysis and binary instrumentation to collect coverage and comparison information as dynamic feedback to guide mutation. Both Steelix and VUzzer have the problem that they do not apply to the comparison of discontinuous magic bytes and function return values. Based on VUzzer, V-Fuzz [26] proposes to use a neural network-based vulnerability prediction model to pre-estimate which parts of the software are more vulnerable to attacks and then use vulnerability-oriented evolutionary fuzzers to generate input to the vulnerable position under the guidance of the vulnerability prediction result. The input of location can find errors efficiently and quickly in a limited amount of time. T-fuzz [27] points out that Driller has difficulty handling CRC comparisons. When no new path is found, T-fuzz removes sanity check to improve the fuzzing ability to find new paths and bugs, but removing the check will result in false positives.

6.3. AFL Has High Overhead for No Source Code Fuzzing

Kernel fuzzing is more difficult, and there are relatively few tools. AFL cannot directly fuzz the kernel. KAFL [28] proposes to combine VT-x virtualization technology and PT-Trace tracking function with AFL to fuzz the closed-source kernel. The vulnerability discovery ability and efficiency are good, and the additional overhead is less than 5%. PTFuzzer [29] is a fuzzing tool for applications. PTFuzz removes the dependency of instrumentation based on AFL and uses PT hardware to collect more abundant path information. It can directly fuzz the target program without source code support. PTFuzzer solves the problem that using QEMU mode of AFL for no source code fuzzing is too much overhead. The disadvantage is that it needs to use Intel chips that include PT functions. The kernel version is limited and must be used in Linux. These limitations ensure that PTFuzz is not widely used.

6.4. Inaccurate Path Coverage Information

The authors of [9,10,11] discussed in the previous section have made different improvements to inaccurate AFL coverage. Collafl [9] designs a new hash calculation formula through static analysis and solves inaccurate coverage caused by a hash collision in AFL with low instrumentation overhead. Three seed selection strategies are proposed. PathAFL [10] points out that AFL and CollAFL only use edge coverage information, which leads to inaccurate coverage information. Path coverage information could not be fully tracked. It proposes that only “h-Paths” with high weights are added to the seed queue to balance path tracking granularity and fuzzing performance. It gives more energy to the seeds with more path weights. Efuzz [11] scores paths according to the number of times the edges are covered by all paths to adjust the number of tests.

6.5. Invalid Test Cases

The authors of [30,31,32,33,34,35] all improve the seed mutation algorithm. FairFuzz [30] proposes to use the input that hits the rare branch for mutation. The mutation identified those less executed branch paths to improve coverage. The limitation is that it is not very helpful to the branches that are not hit in fuzzing. MOPT-AFL [31] uses a customized particle swarm optimization algorithm to select the next best mutation operator for a given run-time context to improve the mutation process of test cases. The authors of [32,33,34,35] point out that AFL generate many invalid test cases, reducing the fuzzing efficiency. ProFuzzer [32] proposes a fuzzing technology based on run-time type sniffing to automatically infer the type information of the input field. It can find out the places that need to be mutated and intelligently adapts the corresponding mutation strategy, thereby improving the path coverage and vulnerability triggering probability. AFLSmart [33] uses the high-level structural representation of seed files to generate new files to find deeper vulnerabilities. With the help of ANTLR grammar, the authors of [34] generate test cases with valid syntax and semantics to test structured input programs. Neuzz [35] uses a forward feedback neural network to train the corpus generated by AFL, simulating the program’s branching behaviour. Then, the input byte with the highest gradient value is identified and mutated to generate a new test case, which reduces fruitless random mutations. The difference is that UnTracer [36] does not improve the mutation algorithm. It integrates AFL with UnTracer to effectively track test cases whose coverage increased, reducing the waste of resources caused by the fuzzer tracking useless test cases.

6.6. Waste Too Many Resources in a Bug-Free Place

SAVIOR [37] proposes a hybrid fuzzing framework based on bug-driven principles, which combines AFL with symbolic execution and other technologies. It focuses on testing the code with bugs, which improves the speed of vulnerability detection. Unlike SAVIOR, TortoiseFuzz [38] uses coverage accounting technology to determine the number of security-sensitive branches. It calculates the possibility of code vulnerabilities and gives priority to execute high-probability inputs.

7. Conclusions

In this paper, we study the fuzzing efficiency affected by different inputs. By tracing and analyzing the execution of different inputs, we discover that hit counts of different inputs that exercise the same edge can vary greatly, and that a few time-consuming edges exist in the target program. We define over-exercising and time-consuming edges as hot-spots and assume that program hot-spots might cause energy waste. We design a hot-spots ratio model to calculate the hot-spots ratio of the seed at run-time. Based on this model, we propose a new power schedule strategy and seed priority selection algorithm and implement SpotFuzz prototype. SpotFuzz improves the fuzzing efficiency by giving seeds with fewer hot-spots more chances to mutate and be preferentially selected. We evaluate our fuzzer on several common data sets in a limited time interval. The experimental results show that SpotFuzz can find 42.96% more unique crashes and 14.25% more edges in average than AFL on GNU Binutils and tcpdump.

Author Contributions

Conceptualization, H.P., J.J. and Y.Z.; methodology, H.P. and J.J.; software, J.J. and Y.Y.; validation, J.J. and Y.Y.; writing—original draft preparation, J.J.; Writing—review and editing, Y.Z. and Z.L.; supervision, H.P., Y.Z. and Z.L. All authors have read and agreed to the published version of the manuscript.

Funding

This research was funded by National Key Research and Development Project (2018******4402), Zhengzhou University Young Backbone Teacher Project in 2019 (2019ZDGGJS029), Zhengzhou University Research and Practice Project of Education and Teaching Reform in 2019 (2019ZZUJGLX224), Zhengzhou University Offline Excellent Course Project in 2019 (2019ZZUXXKC023) and Henan Province Postgraduate Excellent Online Course Project in 2022.

Conflicts of Interest

The authors declare no conflict of interest.

Appendix A

Table A1. The execution information of seeds.
s i s 1 s 2 s 3 s 4 s 5 s 6 s 7 s 8 s 9 t j /us
e j
e 115 11111111190.509
e 1749 140002064120720.014
e 3091 41600181144231820.014
e 3110 0000001001.996
e 3628 0001000007.165
e 4495 312001602481052230.012
e 8454 1110111111.982
e 10695 0010000001.049
e 10751 312001601921042160.167
e 11121 4160018064225400.013
e 17953 0000011447501.354
e 22657 1700038174231850.995
e 24056 010006343742.035
e 26845 140002072120731.018
e 27161 010005145302101.952
e 30683 41710186335360.023
e 32119 010006333740.013
e 32986 312001601921042160.165
e 37595 0000011447501.285
e 42132 012001602481052230.010
e 45040 1400020128121800.014
e 46460 1111111111.205
e 58092 000001806421.218
e 58808 41700186335360.031
e 61841 010006333741.019
e 64210 41600181144231820.012

References

  1. Wang, X.J.; Hu, C.Z.; Ma, R. A Survey of the Key Technology of Binary Program Vulnerability Discovery. Netinfo Secur. 2017, 17, 1–13. [Google Scholar] [CrossRef]
  2. Li, J.; Zhao, B.; Zhang, C. Fuzzing: A survey. Cybersecurity 2018, 1, 6. [Google Scholar] [CrossRef]
  3. Liang, H.; Pei, X.; Jia, X.; Shen, W.; Zhang, J.G. Fuzzing: State of the Art. IEEE Trans. Reliab. 2018, 67, 1199–1218. [Google Scholar] [CrossRef]
  4. American Fuzzy Lop. Available online: https://lcamtuf.coredump.cx/afl/ (accessed on 1 September 2020).
  5. A Library for Coverage-Guided Fuzz Testing. Available online: http://llvm.org/docs/LibFuzzer.html. (accessed on 4 September 2020).
  6. Security Oriented Software Fuzzer. Supports Evolutionary, Feedback-Driven Fuzzing Based on Code Coverage (SW and HW Based). Available online: https://honggfuzz.dev/ (accessed on 4 September 2020).
  7. Böhme, M.; Pham, V.T.; Roychoudhury, A. Coverage-Based Greybox Fuzzing as Markov Chain. IEEE Trans. Software Eng. 2019, 45, 489–506. [Google Scholar] [CrossRef]
  8. Yue, T.; Wang, P.; Tang, Y.; Wang, E.; Yu, B.; Lu, K.; Zhou, X. EcoFuzz: Adaptive Energy-Saving Greybox Fuzzing as a Variant of the Adversarial Multi-Armed Bandit. In Proceedings of the 29th USENIX Security Symposium, Boston, MA, USA, 12–14 August 2020. [Google Scholar]
  9. Gan, S.; Zhang, C.; Qin, X.; Tu, X.; Li, K.; Pei, Z.; Chen, Z. CollAFL: Path Sensitive Fuzzing. In Proceedings of the 2018 IEEE Symposium on Security and Privacy (SP), San Francisco, CA, USA, 20–24 May 2018; pp. 679–696. [Google Scholar]
  10. Yan, S.; Wu, C.; Li, H.; Shao, W.; Jia, C. PathAFL: Path-Coverage Assisted Fuzzing. In Proceedings of the 15th ACM Asia Conference on Computer and Communications Security, Taipei, Taiwan, 5–9 October 2020. [Google Scholar]
  11. Ji, C.; Ya, S.; Wa, Z.; Wu, C.; Li, H. Method to improve edge coverage in fuzzing. J. Commun. 2019, 40, 76–85. [Google Scholar] [CrossRef]
  12. Lemieux, C.; Padhye, R.; Sen, K.; Song, D.X. PerfFuzz: Automatically generating pathological inputs. In Proceedings of the 27th ACM SIGSOFT International Symposium on Software Testing and Analysis, Amsterdam, The Netherlands, 16–21 July 2018. [Google Scholar]
  13. A YAML Parser and Emitter in C++ Matching the YAML. Available online: https://github.com/jbeder/yaml-cpp (accessed on 10 November 2020).
  14. Binutils Source Code. Available online: https://ftp.gnu.org/gnu/binutils (accessed on 5 May 2021).
  15. Miller, B.P.; Fredriksen, L.; So, B. An empirical study of the reliability of UNIX utilities. Commun. ACM 1990, 33, 32–44. [Google Scholar] [CrossRef]
  16. Wang, P.; Zhou, X. SoK: The Progress, Challenges, and Perspectives of Directed Greybox Fuzzing. arXiv 2020, arXiv:2005.11907. [Google Scholar]
  17. Klees, G.; Ruef, A.; Cooper, B.; Wei, S.; Hicks, M.W. Evaluating Fuzz Testing. In Proceedings of the 2018 ACM SIGSAC Conference on Computer and Communications Security, Toronto, ON, Canada, 15–19 October 2018. [Google Scholar]
  18. Gopinath, R.; Jensen, C.; Groce, A. Code coverage for suite evaluation by developers. In Proceedings of the 36th International Conference on Software Engineering, Hyderabad, India, 31 May–7 June 2014. [Google Scholar]
  19. Inozemtseva, L.; Holmes, R. Coverage is not strongly correlated with test suite effectiveness. In Proceedings of the 36th International Conference on Software Engineering, Hyderabad, India, 31 May–7 June 2014. [Google Scholar]
  20. Tcpdump Source Code. Available online: http://www.tcpdump.org/release/ (accessed on 24 September 2021).
  21. Böhme, M.; Pham, V.T.; Nguyen, M.D.; Roychoudhury, A. Directed Greybox Fuzzing. In Proceedings of the 2017 ACM SIGSAC Conference on Computer and Communications Security, Dallas, TX, USA, 30 October–3 November 2017. [Google Scholar]
  22. Panwar, A.; Bansal, S.; Gopinath, K. HawkEye: Efficient Fine-grained OS Support for Huge Pages. In Proceedings of the Twenty-Fourth International Conference on Architectural Support for Programming Languages and Operating Systems, Providence, RI, USA, 13–17 April 2019. [Google Scholar]
  23. Stephens, N.; Grosen, J.; Salls, C.; Dutcher, A.; Wang, R.; Corbetta, J.; Shoshitaishvili, Y.; Krügel, C.; Vigna, G. Driller: Augmenting Fuzzing Through Selective Symbolic Execution. In Proceedings of the NDSS 2016, San Diego, CA, USA, 21–24 February 2016. [Google Scholar]
  24. Li, Y.; Chen, B.; Chandramohan, M.; Lin, S.W.; Liu, Y.; Tiu, A. Steelix: Program-state based binary fuzzing. In Proceedings of the 2017 11th Joint Meeting on Foundations of Software Engineering, Paderborn, Germany, 4–8 September 2017. [Google Scholar]
  25. Rawat, S.; Jain, V.; Kumar, A.; Cojocar, L.; Giuffrida, C.; Bos, H. VUzzer: Application-aware Evolutionary Fuzzing. In Proceedings of the NDSS 2017, San Diego, CA, USA, 26 February–1 March 2017. [Google Scholar]
  26. Li, Y.; Ji, S.; Lv, C.; Chen, Y.; Chen, J.; Gu, Q.; Wu, C. V-Fuzz: Vulnerability-Oriented Evolutionary Fuzzing. arXiv 2019, arXiv:1901.01142. [Google Scholar]
  27. Peng, H.; Shoshitaishvili, Y.; Payer, M. T-Fuzz: Fuzzing by Program Transformation. In Proceedings of the 2018 IEEE Symposium on Security and Privacy (SP), San Francisco, CA, USA, 20–24 May 2018; pp. 697–710. [Google Scholar]
  28. Schumilo, S.; Aschermann, C.; Gawlik, R.; Schinzel, S.; Holz, T. kAFL: Hardware-Assisted Feedback Fuzzing for OS Kernels. In Proceedings of the USENIX Security Symposium 2017, Vancouver, BC, Canada, 16–18 August 2017. [Google Scholar]
  29. Zhang, G.; Zhou, X.; Luo, Y.; Wu, X.; Min, E. PTfuzz: Guided Fuzzing with Processor Trace Feedback. IEEE Access 2018, 6, 37302–37313. [Google Scholar] [CrossRef]
  30. Lemieux, C.; Sen, K. FairFuzz: A Targeted Mutation Strategy for Increasing Greybox Fuzz Testing Coverage. In Proceedings of the 2018 33rd IEEE/ACM International Conference on Automated Software Engineering (ASE), Montpellier, France, 3–7 September 2018; pp. 475–485. [Google Scholar]
  31. Lyu, C.; Ji, S.; Zhang, C.; Li, Y.; Lee, W.H.; Song, Y.; Beyah, R.A. MOPT: Optimized Mutation Scheduling for Fuzzers. In Proceedings of the USENIX Security Symposium 2019, Santa Clara, CA, USA, 14–16 August 2019. [Google Scholar]
  32. You, W.; Wang, X.; Ma, S.; Huang, J.; Zhang, X.; Wang, X.; Liang, B. ProFuzzer: On-the-fly Input Type Probing for Better Zero-Day Vulnerability Discovery. In Proceedings of the 2019 IEEE Symposium on Security and Privacy (SP), San Francisco, CA, USA, 19–23 May 2019; pp. 769–786. [Google Scholar]
  33. Pham, V.T.; Böhme, M.; Santosa, A.E.; Caciulescu, A.R.; Roychoudhury, A. Smart Greybox Fuzzing. IEEE Trans. Softw. Eng. 2021, 47, 1980–1997. [Google Scholar] [CrossRef]
  34. Wang, J.; Chen, B.; Wei, L.; Liu, Y. Superion: Grammar-Aware Greybox Fuzzing. In Proceedings of the 2019 IEEE/ACM 41st International Conference on Software Engineering (ICSE), Montreal, QC, Canada, 25–31 May 2019; pp. 724–735. [Google Scholar]
  35. She, D.; Pei, K.; Epstein, D.; Yang, J.; Ray, B.; Jana, S.S. NEUZZ: Efficient Fuzzing with Neural Program Smoothing. In Proceedings of the 2019 IEEE Symposium on Security and Privacy (SP), San Francisco, CA, USA, 19–23 May 2019; pp. 803–817. [Google Scholar]
  36. Nagy, S.; Hicks, M. Full-Speed Fuzzing: Reducing Fuzzing Overhead through Coverage-Guided Tracing. In Proceedings of the 2019 IEEE Symposium on Security and Privacy (SP), San Francisco, CA, USA, 19–23 May 2019; pp. 787–802. [Google Scholar]
  37. Chen, Y.; Li, P.; Xu, J.; Guo, S.; Zhou, R.; Zhang, Y.; Wei, T.; Lu, L. SAVIOR: Towards Bug-Driven Hybrid Testing. In Proceedings of the 2020 IEEE Symposium on Security and Privacy (SP), San Francisco, CA, USA, 18–21 May 2020; pp. 1580–1596. [Google Scholar]
  38. Wang, Y.; Jia, X.; Liu, Y.; Zeng, K.; Bao, T.; Wu, D.; Su, P. Not All Coverage Measurements Are Equal: Fuzzing by Coverage Accounting for Input Prioritization. In Proceedings of the NDSS 2020, San Diego, CA, USA, 23–26 February 2020. [Google Scholar]
Figure 2. The process of calibration.
Electronics 10 03142 g002
Figure 3. The disassembly result of the arrange function of the arrange.c.
Electronics 10 03142 g003
Figure 4. Some interesting path information of arrange.c.
Electronics 10 03142 g004
Figure 5. The edges covered of YAML-CPP in 24 h, and the time consumption of the corresponding edges.
Electronics 10 03142 g005
Figure 6. Distribution of hot-spots ratio. (a) Hits hot-spots ratio. (b) Time hot-spots ratio.
Electronics 10 03142 g006
Figure 7. Number of unique crashes found over time in 24 h. (a) Test yaml with empty file. (b) Test yaml with test case of yaml. (c) Test nm with empty file. (d) Test nm with test case of AFL. (e) Test tcpdump with test case of AFL.
Electronics 10 03142 g007
Table 1. The execution information storage format of seeds.
e j e 1 e 2 e j
s i
s 1 h 1.1 h 1.2 h 1 . j
s 2 h 2.1 h 2.2 ... h 2 . j
s i h i . 1 h 1 . j h i . j
Table 2. The configuration of program under test.
TargetVersionSeed 1Seed 2Options
parseYAML-CPP-0.60empty filetest@@
nmBinutils-2.28empty fileAFL-test-C @@
objdumpBinutils-2.28AFL-testtest-d @@
readelfBinutils-2.28AFL-testtest-a @@
tcpdumptcpdump-4.9.0AFL-test\-e-r @@
tcpdumptcpdump-4.9.0\test-nr @@
Table 3. The number of unique crashes found by four fuzzers on YAML-CPP.
Test CaseFuzzerAverageMaxGrow
empty fileAFL196.4231
SpotFuzz-h210.1239+6.98%
SpotFuzz-t212.2254+8.04%
SpotFuzz216.5255+10.23%
testAFL156.1162
SpotFuzz-h174.5198+11.79%
SpotFuzz-t174.9205+12.04%
SpotFuzz191.3229+22.55%
Table 4. The number of unique crashes found by fuzzers.
ProgramTest CaseFuzzerAverageMaxGrow
nmempty fileAFL6.518
AFLFast10.131+55.38%
SpotFuzz10.929+67.69%
AFL-testAFL2.312
AFLFast3.710+60.87%
SpotFuzz3.610+56.52%
tcpdumpAFL-testAFL19.322
SpotFuzz20.222+4.66%
Table 5. The number of edges explored by fuzzers.
ProgramTest CaseFuzzerAverageMaxGrow
objdumptestAFL2593.73335
SpotFuzz3092.84265+19.24%
AFL-testAFL3900.94798
SpotFuzz4750.85383+21.79%
readelftestAFL1553.81712
SpotFuzz1727.41825+11.17%
AFL-testAFL9729.811,600
SpotFuzz11,23011,800+15.42%
tcpdumptestAFL5910.46371
SpotFuzz6124.16563+3.62%
Publisher’s Note: MDPI stays neutral with regard to jurisdictional claims in published maps and institutional affiliations.

