Abstract
Smart cities support the enhancement of the quality of life of their residents, for which the use of a robust integrated platform of information and communication technology is required. However, not all cities have similar technology infrastructure and a similar understanding of the quality of life. Therefore, holistic planning, resource support, security, continuous updates, and dynamic operational enhancements should be considered while planning smart cities. However, a smart city could be vulnerable to security threats and a loss of personal or classified information due to the complexity of technology integration. Therefore, understanding and assessing different risks and embedding risk management mechanisms would be required to minimize vulnerability exposure in smart cities. This paper proposes a risk assessment method using the Dempster–Shafer theory for smart city planning. The Dempster–Shafer theory is used here to analyze the risks perceptions of experts. The principal component analysis method is used to analyze the data obtained from risk assessment. The application of this method is determined through a smart city test case in Qatar.
1. Introduction
The smart city concept was introduced in the early 1990s to integrate advanced information and communication technology (ICT) [1] to facilitate different processes and services in the cities. The primary goals considered for a smart city project were the enhancements in quality of life, economy, transport and traffic, clean and sustainable environment, and access to interaction with the government’s relevant authorities [2]. The smart city concept is now considered in terms of dimensions, such as smart mobility [3], smart governance, smart living, smart people, and smart environment [4,5,6].
Smart city systems are complex and multifunction oriented, making them vulnerable to operational, strategic, and external risks [6]. Risks can also be associated with socio-political, financial, technical, and resource requirements [7,8]. The most serious among these are the risks related to security and privacy [9,10,11]. Current smart city risk assessments methods focus on an individual smart city system, such as smart mobility and transportation systems [10] and smart home applications [11]. However, the mitigation of the effects of technological risks, such as interoperability, network connectivity, security, and privacy, and non-technical risks, such as managerial, political, environmental, and user trust and adoption, can only be attained by holistic risk assessment [12].
A review of the literature exposes a lack of comprehensive risk assessment methodologies for consideration by smart city planners. This paper contributes to the literature by proposing and demonstrating a smart city risk analysis method using the Dempster–Shafer theory for technical and non-technical risks.
Smart city concepts are being adopted in many parts of the work as ICT acquisition, installation, and operations costs are becoming affordable to the countries and the people. It should also be understood that the requirements for a smart city might be different in different countries. The risks, therefore, may be perceived differently in different smart city applications depending on factors such as the education level, economic advancement, and technology absorption. Therefore, the primary motivation for the research work is to focus on developing a generic and planner-oriented methodology to assess the risk for inputs to smart city planning.
Risk assessment methodologies that can be used in different contexts are mentioned in Section 1.1. Based on the description and the summary mentioned in Table 1, the Dempster–Shafer theory is used in this paper. The theory provides a mathematical representation of risks and uncertainties and can be used for discrete and interval data [13]. The Dempster–Shafer theory is widely used in risk assessment in areas like finance for fraud risk assessment [14], sensor fusion [15], engineering decision making [16,17,18], radioactive waste risk assessment [17], information technology and IoT fault detection [18], security assessment of information systems [19], offshore applications [20], and risk assessment in the medical field [21]. The advantages of this theory are its diverse applications, relation to traditional probability theory and set theory, and ability to combine various evidence types from several sources [13]. Therefore, this paper contributes by developing a risk assessment method to model technical and non-technical risk assessment using the Dempster-Shafer theory.

Table 1.
Summary of potential methods for risk assessment.
1.1. Potential Risk Assessment Methods
Some methods considered for risk assessments, technical or non-technical, are reviewed below. A summary of the methods is given in Table 1. The table provides the general characteristics, advantages, and disadvantages of the methods.
1.1.1. Failure Mode and Effect Analysis (FMEA) Method
The basic FMEA method is a qualitative method used for risk mitigation during the design phase [22]. It focuses on failure modes, causes, and effects during and before their occurrence [23]. Subriadi and Najwa [24] used an improved FMEA method with four phases for ICT risk assessment: determining risk assessment requirements, identifying risks, assessing risks, and analyzing and evaluating risks. The exact parameters used in this technique are based on the risk impact category and are aligned with the failure effect.
The FMEA method is also used in the smart city context [25]. The main advantage of FMEA is in evaluating critical and potential risks to support risk management [22]. The main limitation of FMEA is its qualitative approach and is based on other techniques to obtain values for occurrence, severity, and detection of risks [23].
1.1.2. Monte Carlo Simulation Method
The Monte Carlo simulation method presents the outcome from a sequence of events. The method is based on a mathematical formula that provides the result based on random variables that affect the outcome. Each variable derives its value from a defined range, then the outcome is calculated [26]. This method is suitable for estimating outcomes from the product of multiple random variables, including sources of uncertainty. It has been used to evaluate the quality of IT security investment in organizations [27]; therefore, it may be applied to a smart city. The authors suggest combining the Monte Carlo method, Markov chain, and Bayesian model to achieve a detection model applied to e-mail intrusion detection. The method is hindered by the high computational requirements for running even a simple simulation [27].
1.1.3. Fuzzy Logic Theory
Fuzzy logic theory, unlike Boolean logic (which always results in 0 or 1), strictly defines some transitional values between (0,1). Thus, no precise true or false evaluation is obtained from this theory. Fuzzy logic is based on fuzzy sets containing elements with membership levels. An element can be a member of different sets with different values. The main difference between probability and fuzzy logic is that probability estimates values about specific reality, whereas fuzzy logic denotes membership of an indistinct set [28].
The fuzzy logic theory is also used in smart city risk assessment [29], focusing on underground applications in smart cities, including underground railways, water supply systems, sewerage systems, parking, and electricity lines. In this approach, a risk index is developed for all systems. Three models are used to measure the risk index [29]: linear approximation, hierarchal fuzzy logic, and a hybrid model based on an arrangement of both models. The resulting model can perform automatic clustering based on the risk index and assist maintenance teams in prioritizing their tasks.
Alawad, An, and Kaewunruen [32] investigated smart risk assessment methods in railway applications through an intelligent system for managing risks (ISFMR). The authors used an adaptive neuro-fuzzy inference system (ANFIS) as a model to enhance risk management. AI is trained through artificial neural networks (ANN) to predict risks and uncertainties based on actual values and risk information. This method allows learning, making predictions, and capturing risk level values in real-time. However, this method is limited by the time needed for machine training and linearity assumptions for the input parameters.
1.1.4. Game Theory
Game theory may be applicable for assessing risk, as it can encompass the contrasting objectives of the two main decision-makers (players). The game includes interactions, constraints, payoffs, and actions the players take. The analysis is ended when all players consider that the obtained solution is the best one (called Nash equilibrium) for the given condition [30]. Game theory is flexible in its application, but it is not widely used in the smart city context as the security context requires comprehensive information during planning. Still, such information can change during the operation stage, thus rendering a one-time decision impractical.
1.1.5. Dempster–Shafer Theory
The Dempster–Shafer theory is an evidence-based theory proposed by Shafer (1976) as an extension to the work of Dempster (1967). This theory can be considered a generalized probability theory in a finite space that should be discrete. In this theory, the probability is assigned to mutually exclusive sets [13].
Traditional theories assign a probability to one possible event, but in the Dempster–Shafer Theory, probabilities can be correlated with multiple possible events. The main advantage of using the Dempster–Shafer theory is its flexible design for handling different levels of information precision and representing the uncertainty of systems without making further assumptions [13].
Further discussion in this paper is organized as follows. Research methods are discussed in Section 2. In this section, details of Qatar’s smart city project and the research method are also given. The details of the Dempster–Shafer theory are also given in this section. The analysis results obtained from the Dempster–Shafer theory are given in Section 3. The Principal Component Analysis (PCA) method analyzes the results obtained from Dempster–Shafer theory on the case study, given in Section 4. The discussion on the model’s application and the implications is made in Section 5. The paper’s conclusions are represented in Section 6.
2. The Smart City Case and the Research Method
This section gives the background on a smart city in Qatar. The identification of the smart city has been concealed and is only referred to as City W in this paper. The details of the research method, research questions, data collection, and the Dempster–Shafer theory are also provided.
2.1. Case Study: Qatar’s Smart City (City W)
The City W project involves experts from different disciplines: architects, master planners, engineers, designers, and specialists from Harvard, Princeton, Yale, and MIT. The project started in the last decade and was divided into four construction stages. The project includes more than 800 housing units, 10,000 parking places, and more than 100 buildings [33]. The smart living dimension in City W considers healthcare applications (e-health), education applications (e-learning), and smart building applications. The smart mobility dimension covers smart vehicles and transportation systems. The smart environment dimension covers waste discarding, pollution control, energy management, quality of air and water, increased green spaces, and controlled emissions. The smart governance dimension covers applications related to e-government and services and public participation. The risks that are considered for this city are illustrated in Table 2.
Table 2.
Risks related to the smart city in Qatar.
2.2. Research Method
Figure 1 illustrates the research method adopted in this paper. A description of the method is given in the following sub-sections.

Figure 1.
Research method used in this paper.
2.2.1. Research Questions
Two research questions, as mentioned below, are considered in this paper to develop insights into risks and risk analysis.
- RQ1: What risks are essential for the analysis of a smart city?
- RQ2: What are the expert perceptions of risks in a smart city in Qatar?
2.2.2. Data Collection
A focus group meeting, including subject matter experts from the City W project and the associated ICT company, was used to provide information on the planned risks and incidents [34]. The project documents and published brochures were also studied to extract information. These types of document analysis and focus groups discussions are considered qualitative analysis techniques [35]. Based on the extracted information, City W’s risks and incidents and their validity, as expressed by the two experts, are provided in Table 3. The expert inputs are needed to apply the Dempster–Shafer theory, which can consider multiple sources of evidence such as sensors, surveys, models, and experts [36]. In Table 3, for example, the values expressed by Expert 1 represent the belief that the cybersecurity risk will occur mainly due to cyberattacks (85% chance) and due to operator error (15%). These values will be expressed through mathematical notations later.
Table 3.
The incidents causing risks and experts’ results.
2.2.3. The Application of Dempster–Shafer Theory
There are three crucial functions of the Dempster–Shafer theory: the basic probability assignment function (m), the belief function (Bel), and the plausibility function (Pl). The basic probability assignment (m) is based on improvised evidence theory. This function does not state the probability in its usual definition but as a function of power set P(X) that represents all potential states of the set, for the interval between 0 and 1; that is, m(0) and the sum of (m) for all subsets, which equals to 1. Applying this definition to set A, for instance, the basic probability assignment for set A is represented as m(A), which articulates the fraction of relevant evidence supporting the assumption that a specific element of X (universal set) belongs to set A. Another basic probability assignment, (m), will represent more evidence in the subset.
The representation of basic probabilities with Dempster-Shafer theory can be written as:
where P(X) is the power of set X and is the null set.
The interval (0,1) is bounded by two measures: the belief and the plausibility. The belief function of set A: Bel(A) is the sum of all basic probability assignments (m) of a subset (B) of set A. For example, in the data presented in Table 3, Bel(A) for Expert 1 = + = 1. The plausibility: Pl(A) is the sum of the basic probability assignments of a set (B) that intersects with set A [13]. For example, in the data presented in Table 3, Pl(A) = 0 since there is no subset intersecting with the main set, which means intersection =
The belief function and plausibility function values are nonadditive. Accordingly, it is not required that the sum of all belief measures be 1, and the same applies to plausibility measures [13]. Additionally, the two functions can be derived from each other as follows:
where (not A) complements A. This definition comes from the sum of basic probability assignments is 1.
For aggregating the information from multiple sources, the Dempster combination rule is used in this paper. This rule highlights the agreement between different sources and ignores conflicting evidence by using a normalization factor. The rule represents a new basic probability assignment, designated , that is a strict AND operation and is calculated by the formula:
where:
In Equation (7), K represents the basic probability function of conflict and is determined by summing all basic probability assignment (m) sets when a basic probability function has a value of 0 or null. The denominator (1 − K) in Equation (7) is a normalizing factor to avoid the conflict between basic probability assignments. Using the Dempster combination rule, basic probability functions related to conflict are assigned to the null set [13].
2.2.4. Application of the Dempster–Shafer Theory
Table 4 presents risks and associated incidents of risks. Let represents the basic probability function assigned by Expert 1 and represents that for Expert 2. Components from A to L shown in Table 4 are incidents causing risks, denoted in the equations as subsets. The data provided in Table 3 shows that for Expert 1, cybersecurity risk (CR) occurs due to cyberattacks (component A) with a probability of 0.85 or due to operator error (component B) with a probability of 0.15. For Expert 2, cybersecurity risk (CR) occurs due to component (A) with a probability of 0.9 and due to component (B) with a probability of 0.1. Based on this information, the functions are developed as follows:
Table 4.
Definition of risk components.
Expert 1:
Expert 2:
The following steps are followed to obtain the values with Equation (7).
- The combined basic probability assignment function is calculated for each cell by multiplying the basic probability function from the related column and row.
- The basic probability function for each set from each expert is multiplied.
- The resulted values from combining similar components appearing in two cells are added.
- According to the collected data, the two experts did not provide conflicting answers to one question, which means one expert assigns 0 basic probability for an incident. No zero values result from the multiplication. For a zero value to result, for instance, Expert 1 may believe that Cybersecurity risk will not be from cyberattacks (component (A)) and will have a belief of 0. In this case. In this way, the plausibility function is calculated.
According to Table 5, the combined basic probability assignment that cybersecurity risk is due to component A is 0.7650, The combined basic probability assignment that cybersecurity risk is due to component B is 0.0150, and the combined belief function that the cybersecurity risk is due to components A and B is 0.0850 + 0.1350 = 0.22.
The following section demonstrates the application of the Dempster–Shafer theory and the Dempster combination rule on each risk.
3. Results from the Application of the Dempster–Shafer Theory
The demonstration of the Dempster–Shafer theory and the Dempster combination rule is discussed here.
3.1. Cybersecurity Risk (CR) Analysis
The analysis shows that the combined basic probability assignment of cybersecurity risk (CR) due to component A is 0.7650 based on Equation (7). The combined basic probability assignment of CR due to component B is 0.0150. The CR’s combined basic probability assignment due to Component A and B is 0.0850 + 0.1350 = 0.22. It means that the proportion of cyberattack and operator error together causing cybersecurity risk based on the combined basic probability function for both experts is equal to 0.22. Therefore, as shown in Table 5:
Table 5.
Dempster combination of Expert 1 and Expert 2 for cybersecurity risk.
3.2. Technical Data and Application Risk (TR) Analysis
The combined basic probability assignment of technical data and application risk (TR) due to component A (cyberattack) is 0.6580, as per Equation (7). The combined basic probability assignment that TR is due to component C (wrong design) is 0.0020, and component D (power outage) is 0.01. The table also illustrates that TR’s combined basic probability assignment due to component C and component A is 0.0070 + 0.1880 = 0.195.
The combined basic probability assignment of (TR) due to component A and component D is 0.13, while component C and component D is 0.011.
Table 6 illustrates the results of the combined belief function from Expert 1 and Expert 2:
Table 6.
Dempster combination of Expert 1 and Expert 2 for technical data and application risk.
3.3. Network Infrastructure Risk (NR)
Applying the Dempster combination rule on the basic probability assignment representing the components causing network infrastructure risk (NR) leads to the combined basic probability assignments in Table 7.
Table 7.
Dempster combination of Expert 1 and Expert 2 for network infrastructure risk.
3.4. Energy Consumption Risk (ER)
Application of the Dempster combination rule shows that the Energy consumption risk (ER), which is similar to components causing Network infrastructure risk, leads to the combined basic probability assignments in Table 8.
Table 8.
Dempster combination of Expert 1 and Expert 2 for energy consumption risk.
3.5. Policies, Laws, and Rules Risks (PLR)
Non-technical risks related to Qatar’s smart city are investigated using the Dempster combination rule. The rule is applied on the basic probability assignment representing the components causing policies, laws, and rules risks (PLR), components E and F. They result in the combined basic probability assignments in Table 9.
Table 9.
Dempster combination of Expert 1 and Expert 2 for policies, laws, and rules risk.
- (Lack of awareness of policies, laws, and rules) = 0.0225
- (Lack of awareness of applications of policies, laws, and rules in your business) = 0.7225
- (Lack of awareness of policies, laws and rules and lack of awareness of applications of policies laws and rules in your business) = 0.255
3.6. Approvals and Resource Management Risks (AR)
Four components, (G), (H), (I), and (J), cause these risks. Each component has its basic probability assignment based on the experts’ beliefs. Applying the Dempster combination rule will identify this risk’s combined basic probability assignment as follows (Table 10).
Table 10.
Dempster combination of Expert 1 and Expert 2 for approvals and resource management risk.
3.7. Strategic Risks (SR)
Components causing strategic risk (SR) are mainly the change of management (K) and insufficient relationships with stakeholders (L). The Dempster combination rule is used to construct each component’s combined basic probability assignment. Table 11 provides the calculations for the following combined belief functions:
Table 11.
Dempster combination of Expert 1 and Expert 2 for strategic risks.
4. Analysis of the Results
The PCA method is a multivariate analysis technique used to analyze data variations when there are highly correlated variables and a large number of independent variables [37]. The PCA method is used for risk analysis in different fields such as machine learning and artificial intelligence [38], banking risk management. In this paper, the results obtained from the Dempster–Shafer theory analysis are further analyzed through the PCA method, which is performed through four steps: standardization, covariance matrix calculation, identifying principal components, and graphically presenting significant and non-significant components.
Descriptive statistics are calculated for standardization purposes before performing PCA. The primary values are the mean, maximum, and standard deviation with α= 0.05, the threshold value representing the accepted error probability. Table 12 shows these values. The values presented in Table 13 show that the combined basic probability for the studied value is proportional with values believed by Expert 1 and Expert 2.
Table 12.
Summary of statistics.
Table 13.
Correlation matrix.
The correlation matrix presents how values vary from the mean value concerning each other (Table 13). Values are different from 0, with a significance level α = 0.05 being the accepted error probability. The correlation coefficient differs between 1 and −1; significant correlations are closer to 1 or −1, while values near 0 show no correlation. The analysis shows that basic probability assignment for incidents causing risks believed by Expert 1, Expert 2, and the combined basic probability assignment resulting from the Dempster combination rule are highly correlated.
The correlation of Experts’ beliefs (circle) and principal components (lines) are presented with the correlation circle in Figure 2. In the figure, the principal components are represented by the experts and Combined DS values. The horizontal and vertical axes in Figure 2 represent the variance of data provided by the principal components. The value 99.19% results from combining the percentages at the horizontal and vertical axis; that is, experts believe there is a 99.19% f probability that the identified incidents cause the risks mentioned. The principal component lines in the circle represent the correlation between any two experts’ beliefs. The acute angle between the lines shows that expert beliefs and Combined DS values are highly correlated. It means that the risk values obtained from the assessment are highly reliable.
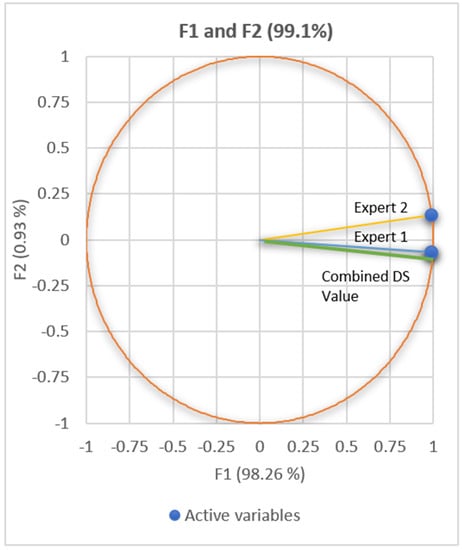
Figure 2.
Shows the correlation circle with the principal components.
The observed risk incidents designated by components A, B, C, D, E, G, H, and K are causing the risks in City W.
5. Discussion
Smart city planning and implementation projects require the integration of multiple isolated systems. Due to the technology involved and the technology integration required, we need to assess the risks during the planning process to minimize their effect during operation.
The first research question is related to essential risks in a smart city context. Six technical risks were identified from the literature review: cybersecurity risk, technical data and applications risk, network infrastructure risk, data privacy and protection risk, low productivity risk in blockchain, and energy consumption risk. The non-technical risks such as policies, laws, rules, approvals and resource management, strategic risks, and data privacy and protection risks were identified. There may be data privacy and protection risk; however, it requires the use of blockchain technology, which was not considered for the planning of City W; however, it will be necessary when a large amount of data is generated.
The second research question is related to the experts’ perceptions of risks. The analysis shows that cybersecurity risk is considered the most critical technical risk in City W. The cyberattacks component has a high value of basic probability assignment (0.7650), whereas risks due to operators’ error are considered low. It is believed that as the operator’s learning curve is assumed to be high, the impact could be minimized through associated training and simulation. Cyberattack is believed to be the leading cause of this risk in City W, with a high value of basic probability assignment (0.658) for data analysis and application risk. That means the management needs to consider high-security measures to mitigate this risk. The analysis also shows that other risk components such as wrong design and power outage have minor effects. City W’s power supply system design and operation are robust and built with a different captive generation [33]. Therefore, the expert group’s opinion reflects this in their basic probability assignment value.
As an example, the analysis of the values obtained from the experts shows that in City W, network infrastructure and energy consumption risks are considered to be related to wrong design, operators’ errors, and power outages. The operator’s error component is assumed to cause network infrastructure risk due to a high value of basic probability assignment value (0.7742). In contrast, the operator’s error has a higher basic probability assignment value (0.9604) related to energy consumption risks. Planners knowing this perception of risks, should aim for highly trained technical resources for energy applications during both the development and operation of the city. When there is an employee turnover, this risk can be avoided through proper documentation and orientation of the incoming technical person. The analysis shows a smaller chance (low basic probability assignment) of wrong design and power outage in City W.
This study highlights three leading non -technical risks: policies, laws and rules risk, approvals and resource management risk, and strategic risks. Policies, laws, and rules risk are caused due to two main components: a lack of awareness of policies, laws, and rules and a lack of awareness of policies, laws, and rules in the business. The combined basic probability assignment function indicates that the lack of awareness of policies, laws, and rules in the business has a relatively high value of 0.7225 for City W. The above results indicate that fault applications for policies, laws, and rules due to a lack of knowledge will lead to the policies, laws, and rules. The low basic probability assignment value of the lack of awareness of policies, laws, and rules indicates that the organization continuously provides critical awareness.
Four components of approvals and resource management risk are analyzed in this study: the lack of critical resources, employee burnout, escalated project cost, and outsourcing. The lack of critical resources has the highest basic probability assignment value (0.7225). The main incident to cause resources management risk is the lack of critical resources.
Other combinations do not have significant basic probability assignment value to be considered in the decision-making process. Therefore, securing critical resources for different applications in a smart city is crucial. For operating and maintaining different systems, recruits or next-line employees must be trained to avoid this risk when critical employees are present.
This analysis provided that the combined basic probability assignment of having the risk due to a change of management and insufficient relationship with stakeholders have a value of (0.5). It means that the probability of this risk is high if a change of management and insufficient relationships occur simultaneously. This analysis shows a need for the stakeholders to have a clear view of the potential risks in smart cities so that appropriate mechanisms can be developed as a part of the risk response strategy.
6. Conclusions
Risk identification and management are crucial in the planning and implementing of a smart city. Smart cities use state-of-the-art technologies and applications to provide services to enhance the quality of life of their citizens. However, such technologies and applications bring a host of technical and non-technical risks, and their assessment becomes important to plan for impact mitigation. Smart applications create a large amount of data, leading to security, privacy, and legal challenges. Therefore, the scope of the paper is limited to the assessment and providing an understanding of the risk impact so that the planners can consider it for smart city development.
The paper contributes by developing a risk assessment methodology and demonstrating its use in a smart city planning situation. The paper also provides a list of risks perceived by the planners for analysis through the Dempster-Shafer theory and the principal component analysis. The beliefs perceived by the planners provide a basis for assessing risk occurrence, which is usually based on the technology absorption in the country, availability of technology, legislation, and skills. The PCA shows that incidents like cyberattacks, operators’ errors; a lack of awareness of policies, laws, and rules; a lack of critical resources, and; change management have a higher probability of occurrence. It should be noted that these risks can create secondary or residual risks, which might be challenging to identify and address. The method is scalable to the application to the higher number of inputs from the planners or experts through the pairwise comparisons of the analysis. As the methodology is not based on the scale of the city, it should be applicable in other smart city planning.
The review shows no comparable comprehensive and generic risk assessment models for smart city applications. There are different models for specific risk assessments; however, they do not consider experts’ perceptions. As the perceptions are based on the country’s current socio-technical and economic situation, their visualization of potential risks may be closely aligned to the actual situation.
The risk assessment method developed in this paper is the first step towards developing a larger risk assessment framework for smart city planning and operation. The perception analyzed through the Dempster-Shafer theory is scalable and dynamic.
Further research could also be considered studying the interrelations between risks and their effect on other risks in smart city projects. The methodology presented here may be extended by combining it with artificial intelligence, as mentioned in [30], which can consider dynamic decision-making abilities to eliminate or mitigate the impact of risk within a small window. This type of combination can also support efficient risk prediction capabilities.
Author Contributions
R.A.S.: conceptualization, writing, data collection, reviewing, and editing. S.P.: inception, supervision, writing, reviewing, editing. All authors have read and agreed to the published version of the manuscript.
Funding
This research received no external funding.
Informed Consent Statement
Informed consent was obtained from all subjects involved in the study.
Data Availability Statement
The data presented in this study are available on request from the corresponding author. The data are not publicly available due to confidentiality reasons.
Conflicts of Interest
The authors declare no conflict of interest.
References
- Bibri, S.E.; Krogstie, J. On the social shaping dimensions of smart sustainable cities: A study in science, technology, and society. Sustain. Cities Soc. 2017, 9, 219–246. [Google Scholar] [CrossRef]
- Israilidis, J.; Odusanya, K.; Mazhar, M.U. Exploring knowledge management perspectives in smart city research: A review and future research agenda. Int. J. Inf. Manag. 2021, 56, 101989. [Google Scholar] [CrossRef]
- Apostol, D.; Bălăceanu, C.; Constantinescu, E.M. Smart—Economy Concept—Facts and Perspectives. HOLISTICA J. Bus. Public Adm. 2015, 6, 67–77. [Google Scholar]
- Allam, Z.; Dhunny, Z.A. On big data, artificial intelligence and smart cities. Cities 2019, 89, 80–91. [Google Scholar] [CrossRef]
- Arroub, A.; Zahi, B.; Sabir, E.; Sadik, M. A literature review on Smart Cities: Paradigms, opportunities and open problems. In Proceedings of the 2016 International Conference on Wireless Networks and Mobile Communications (WINCOM), Fez, Morocco, 26–29 October 2016; pp. 180–186. [Google Scholar] [CrossRef]
- Mikes, A. Managing Risks: A New Framework. Harv. Bus. Rev. 2012. Available online: https://ora.ox.ac.uk/objects/uuid:b7f8eecb-9d51-4301-9999-01385bdd0284/download_file?safe_filename=Kaplan_and_Mikes_Managing_risks.pdf&type_of_work=Journal+article (accessed on 5 September 2021).
- Techatassanasoontorn, A.A.; Suo, S. Exploring risks in smart city infrastructure projects: Municipal broadband initiatives. In Proceedings of the PACIS 2010—14th Pacific Asia Conference on Information Systems 2010, Taipei, Taiwan, 9–12 July 2010; pp. 13–24. [Google Scholar]
- Čolić, N.; Manić, B.; Niković, A.; Brankov, B. Grasping the framework for the urban governance of smart cities in Serbia. The case of interreg SMF project clever. Spatium 2020, 4, 26–34. [Google Scholar] [CrossRef]
- Neshenko, N.; Nader, C.; Bou-Harb, E.; Furht, B. A survey of methods supporting cyber situational awareness in the context of smart cities. J. Big Data 2020, 7, 1–41. [Google Scholar] [CrossRef]
- Paiva, S.; Ahad, M.A.; Tripathi, G.; Feroz, N.; Casalino, G. Enabling technologies for urban smart mobility: Recent trends, opportunities and challenges. Sensors 2021, 21, 2143. [Google Scholar] [CrossRef] [PubMed]
- Sovacool, B.K.; del Rio, D.D.F. Smart home technologies in Europe: A critical review of concepts, benefits, risks and policies. Renew. Sustain. Energy Rev. 2020, 120, 109663. [Google Scholar] [CrossRef]
- Ismagilova, E.; Hughes, L.; Rana, N.P.; Dwivedi, Y.K. Security, Privacy and Risks Within Smart Cities: Literature Review and Development of a Smart City Interaction Framework. Inf. Syst. Front. 2020, 21, 1–22. [Google Scholar] [CrossRef]
- Sentz, K.; Ferson, S. Combination of Evidence in Dempster-Shafer Theory. Contract 2002, 4015, 1–96. Available online: http://citeseerx.ist.psu.edu/viewdoc/download?doi=10.1.1.122.7929&rep=rep1&type=pdf (accessed on 10 September 2021).
- Srivastava, R.P.; Mock, T.J.; Gao, L. The Dempster-Shafer Theory: An Introduction and Fraud Risk Assessment Illustration. Aust. Account. Rev. 2011, 21, 282–291. [Google Scholar] [CrossRef]
- Koksalmis, E.; Kabak, Ö. Sensor fusion based on Dempster-Shafer theory of evidence using a large scale group decision making approach. Int. J. Intell. Syst. 2020, 35, 1126–1162. [Google Scholar] [CrossRef]
- Beynon, M.; Curry, B.; Morgan, P. The Dempster-Shafer theory of evidence: An alternative approach to multicriteria decision modelling. Omega 2000, 28, 37–50. [Google Scholar] [CrossRef]
- Baraldi, P.; Zio, E. A comparison between probabilistic and dempster-shafer theory approaches to model uncertainty analysis in the performance assessment of radioactive waste repositories. Risk Anal. 2010, 30, 1139–1156. [Google Scholar] [CrossRef][Green Version]
- Ghosh, N.; Paul, R.; Maity, S.; Maity, K.; Saha, S. Fault Matters: Sensor data fusion for detection of faults using Dempster-Shafer theory of evidence in IoT-based applications. Expert Syst. Appl. 2020, 162, 113887. [Google Scholar] [CrossRef]
- Sun, L.; Srivastava, R.P.; Mock, T.J. An information systems security risk assessment model under the Dempster-Shafer theory of belief functions. J. Manag. Inf. Syst. 2006, 22, 109–142. [Google Scholar] [CrossRef]
- Neumann, T.; Weintrit, A. Zeszyty Naukowe Expert systems based on Dempster—Shafer theory of evidence in maritime—Characteristic and applications. Zesz. Nauk. Akad. Morska W Szczec. 2012, 32, 141–147. [Google Scholar]
- Dutta, P.; Ali, T. Fuzzy Focal Elements in Dempster-Shafer Theory of Evidence: Case study in Risk Analysis. Int. J. Comput. Appl. 2011, 34, 975–8887. [Google Scholar]
- Domingos, P.; Rita, A.; Terra, T.; Ignácio, S.R. FMEA as a Tool for Managing Risks in ICT Projects, based on the PMBOK. Asian J. Bus. Manag. Sci. 2008, 3, 1–24. [Google Scholar]
- Roghanian, E.; Mojibian, F. Using fuzzy FMEA and fuzzy logic in project risk management. Iran. J. Manag. Stud. 2015, 8, 373–395. [Google Scholar]
- Subriadi, A.P.; Najwa, N.F. The consistency analysis of failure mode and effect analysis (FMEA) in information technology risk assessment. Heliyon 2020, 6, e03161. [Google Scholar] [CrossRef] [PubMed]
- Kandasamy, K.; Srinivas, S.; Achuthan, K.; Rangan, V.P. IoT cyber risk: A holistic analysis of cyber risk assessment frameworks, risk vectors, and risk ranking process. EURASIP J. Inf. Secur. 2020, 2020, 8. [Google Scholar] [CrossRef]
- Ayres, D.; Schmutte, J.; Stanfield, J. Expect the unexpected: Risk assessment using Monte Carlo simulations. J. Acc. 2017. Available online: https://www.journalofaccountancy.com/issues/2017/nov/risk-assessment-using-monte-carlo-simulations.html (accessed on 1 September 2021).
- Hemantha, S.B.H.; Herathb, T.C. Post-audits for managing cyber security investments: Bayesian post-audit using Markov Chain Monte Carlo (MCMC) simulation. J. Account. Public Policy 2018, 37, 545–563. [Google Scholar] [CrossRef]
- Kayacan, E.; Khanesar, M.A. Fundamentals of Type-1 Fuzzy Logic Theory. In Fuzzy Neural Networks for Real Time Control Applications; Elsevier: Amsterdam, The Netherlands, 2016; pp. 13–24. [Google Scholar]
- Ullah, I.; Fayaz, M.; Kim, D. Applied sciences Analytical Modeling for Underground Risk Assessment in Smart Cities. Appl. Sci. 2018, 8, 921. [Google Scholar] [CrossRef]
- Song, X.; Jiang, W.; Liu, X.; Lu, H.; Tian, Z.; Du, X. A Survey of Game Theory as Applied to Social Networks. Tsinghua Sci. Technol. 2020, 25, 734–742. [Google Scholar] [CrossRef]
- Gan, D.; Yang, B.; Tang, Y. An extended base belief function in Dempster-Shafer evidence theory and its application in conflict data fusion. Mathematics 2020, 8, 2137. [Google Scholar] [CrossRef]
- Alawad, H.; An, M.; Kaewunruen, S. Utilizing an adaptive neuro-fuzzy inference system (ANFIS) for overcrowding level risk assessment in railway stations. Appl. Sci. 2020, 10, 5156. [Google Scholar] [CrossRef]
- Msheireb. 2021. Available online: https://www.msheireb.com/msheireb-downtown-doha/about-msheireb-downtown-doha/ (accessed on 1 March 2021).
- Gill, P.; Stewart, K.; Treasure, E.; Chadwick, B. Methods of data collection in qualitative research: Interviews and focus groups. Br. Dent. J. 2008, 204, 291–295. [Google Scholar] [CrossRef]
- Awasthi, A.; Chauhan, S.S. Using AHP and Dempster-Shafer theory for evaluating sustainable transport solutions. Environ. Model. Softw. 2011, 26, 787–796. [Google Scholar] [CrossRef]
- Glosten, L.; Rauterberg, G. 4. High Frequency Trading. In Disrupting Finance; Lynn, T., Moony, J.G., Rosati, P., Cummins, M., Eds.; Palgrave Macmillan: New York, NY, USA, 2018; pp. 95–128. [Google Scholar] [CrossRef]
- Shi, X.; Yu, W. Analysis of Chinese Commercial Banks’ Risk Management Efficiency Based on the PCA-DEA Approach. Math. Probl. Eng. 2021, 2021, 7306322. [Google Scholar] [CrossRef]
- Alkarkhi, A.F.M.; Alqaraghuli, W.A.A. Principal Components Analysis. In Easy Statistics for Food Science with R; Elsevier: Amsterdam, The Netherlands, 2019; pp. 125–141. [Google Scholar] [CrossRef]
Publisher’s Note: MDPI stays neutral with regard to jurisdictional claims in published maps and institutional affiliations. |
© 2021 by the authors. Licensee MDPI, Basel, Switzerland. This article is an open access article distributed under the terms and conditions of the Creative Commons Attribution (CC BY) license (https://creativecommons.org/licenses/by/4.0/).