Article

Functional Connectivity of EEG in Encephalitis during Slow Biphasic Complexes

Mathematical Biology and Physiology, Department Electronics and Telecommunications, Politecnico di Torino, 10129 Turin, Italy
*
Author to whom correspondence should be addressed.
Electronics 2021, 10(23), 2978; https://doi.org/10.3390/electronics10232978
Submission received: 2 November 2021 / Revised: 26 November 2021 / Accepted: 26 November 2021 / Published: 30 November 2021

Abstract

:
The electroencephalogram (EEG) of patients suffering from inflammatory diseases of the brain may show specific waveforms called slow biphasic complexes (SBC). Recent studies indicated a correlation between the severity of encephalitis and some features of SBCs, such as location, amplitude and frequency of appearance. Moreover, EEG rhythms were found to vary before the onset of an SBC, as if the brain was preparing to the discharge (actually with a slowing down of the EEG oscillation). Here, we investigate possible variations of EEG functional connectivity (FC) in EEGs from pediatric patients with different levels of severity of encephalitis. FC was measured by the maximal crosscorrelation of EEG rhythms in different bipolar channels. Then, the indexes of network patterns (namely strength, clustering coefficient, efficiency and characteristic path length) were estimated to characterize the global behavior when they are measured during SBCs or far from them. EEG traces showed statistical differences in the two conditions: clustering coefficient, efficiency and strength are higher close to an SBC, whereas the characteristic path length is lower. Moreover, for more severe conditions, an increase in clustering coefficient, efficiency and strength and a decrease in characteristic path length were observed in the delta–theta band. These outcomes support the hypothesis that SBCs result from the anomalous coordination of neurons in different brain areas affected by the inflammation process and indicate FC as an additional key for interpreting the EEG in encephalitis patients.

1. Introduction

Encephalitis is an important brain inflammation disease. It is caused by immune or vascular disorders, infections or cancer [1] and is associated with severe neurological problems [2,3,4,5]. It has a high lethal rate (e.g., 5–20% in the case of the most common etiologic agent, herpes simplex, and it could increase up to 70% in patients not treated with an antiviral [6]) and an important incidence in children (about 1 out of 10,000 [7]).
In order to reduce hospitalization burden [8], morbidity and mortality [1,3,9], the diagnosis should be accurate and rapid. On the other hand, empirical assessment is often applied, integrating information from different clinical observations (e.g., body temperature), subjective evaluations (e.g., level of consciousness) and measurements (e.g., imaging, blood tests and analysis of the cerebrospinal fluid).
A noninvasive and economic diagnostic tool is the EEG, which has found applications for the assessment of different encephalopathies [10,11,12] and also in the case of encephalitis [13]. It could be applied in emergency conditions and in the follow–up. However, the clinical interpretation of EEG traces is subjective and thus dependent on the experience of the neurologist. Moreover, only qualitative information on the possible presence of anomalous waveforms is extracted.
Automated processing could support the evaluation of EEG [14,15], providing objective and quantitative information, which could be useful to document the patient’s condition, to select a therapy and to investigate the response.
The slow biphasic complex (SBC) has been observed for decades in the EEG of patients with different brain inflammations [16,17,18]: Rasmussen’s syndrome [19,20,21,22,23,24], human immunodeficiency virus (HIV) [25,26,27], West syndrome [17,18] and encephalitis [25]. Interesting properties of SBCs have been recently discovered, based on an automated method to identify them [28], which has allowed the quantifying of their appearance, amplitude, distribution and their relation with the severity of encephalitis [28,29], localization of lesions [30] and EEG rhythms [31]. Specifically, it was found that their number and cumulative amplitude increase with severity [28,29] and that the distribution of their sources is related to the regions in which lesions are detected in magnetic resonance images [30]. Moreover, it was recently observed that the EEG is slower in short epochs before the onset of an SBC than in the rest of the trace [31]. This indicates that the brain is preparing for the coordinated discharge of neurons resulting in an SBC by increasing the relative power of low–frequency rhythms. Similar effects have been observed as well after the SBC, during the recovery of the brain after the discharge. This local variation raises the question of whether other dynamics of brain activity change when measured close to or far from the onset of an SBC.
Functional connectivity (FC) investigates the flow of neural information between brain areas sampled by the EEG electrodes. The coupling between oscillations is thought to reflect synchronized rhythmic excitability fluctuations of neuronal ensembles exchanging information [32]. They can be quantified by different bivariate indexes (e.g., coherence [33], phase locking value [34] and Granger causality [35]) [36], and the resulting network of connections (actually, a graph) can be characterized to assess possible variations among conditions [37]. In this paper, this network of connections (quantified by crosscorrelation of EEG rhythms) is investigated by some topological graph indexes (i.e., clustering coefficient, efficiency, strength and characteristic path length), to explore its possible variations in correspondence to the onset of an SBC. This could contribute to further exploring the SBCs, with the objective of better characterizing brain dynamics of encephalitis patients from electrophysiological data.

2. Methods

2.1. Experimental Data

Spontaneous EEGs were recorded from 10 controls (age 1–15 years; 5 males and 5 females) and 10 pediatric encephalitic patients (age 2–14 years; 5 males and 5 females) using a Micromed system (band–pass filter at 0.5–70 Hz and sampling frequency 256 Hz; different setups with either 10 or 18 differential channels were used). We considered the same retrospective dataset as in [28,29,31] (to which the reader is invited to refer for more details). In total, 128 traces were recorded (as follow–up of the patients was also included). The severity of the pathology was assessed by neurologists integrating different information about level of consciousness, body temperature, possible seizures or focal neurological deficits, lesions on either magnetic resonance or computerized tomography, pleiocytosis of the cerebrospinal fluid and the EEG traces. The following scores were given:
  • 0—normal condition (22 traces, from either controls or patients when they presented no sign of disease);
  • 1—mild disease (29 traces);
  • 2—moderate disease (25 traces);
  • 3—severe condition (22 traces);
  • 4—serious pathology (20 traces);
  • NC—not classified EEG traces, considered as unmanageable (10 traces).
The 96 traces which were manageable and showed at least a mild manifestation of the disease were included in this study (thus, excluding unmanageable traces and those recorded during normal conditions, in which a few false SBCs were identified by our algorithm [28]).

2.2. Automated Detection of SBCs

SBCs are low–frequency biphasic waveforms clearly emerging from the background EEG, separated from each other (i.e., not repetitive neither periodic appearance), including two phases [19]. They can have different durations, with longer SBCs usually having larger amplitudes: this way, the waveforms of different complexes are quite similar in shape, but with different magnitude, as both amplitude and time are scaled.
The automated identification of SBCs was based on this preliminary information [38,39]. Specifically, different match filters were applied to each channel of the EEG traces to compare it with 10 time–scaled versions of a prototype waveform [28], imposed as threshold for the matching a crosscorrelation of 90%. The prototype waveform was based on SBCs manually identified in decades of clinical observations. After the identification by match filtering, the complexes were automatically reviewed, excluding repetitive discharges and those with extreme values of amplitude (i.e., either very large or small, as they could be due to either artifacts or noise, respectively; specifically, the waveforms with amplitudes farther from the mean than 3 times the standard deviation were excluded [28]).

2.3. Functional Connectivity Indexes

The maximum of the absolute value of the normalized crosscorrelation (CC) was used as index of connectivity between different EEG channels. It was computed on time windows of duration 3 s. Notice that we measured the FC indexes in very low–frequency bands (as detailed below). Hence, it was necessary to process long epochs. Indeed, consider that the delta band starts from 0.5 Hz, so that 2 s is the minimum time duration of an epoch required to capture this low–frequency component. In order to obtain a better frequency resolution, we opted for a bit longer epochs. The time windows of interest were selected either centered on SBCs or far from them. The two conditions were called as follows: During–SBC and Far–SBC, respectively. For each SBC, assumed to be centered at t = t S B C , a time window from t S B C − 4.5 to t S B C + 1.5 s was selected. All epochs which had some intersection with others were removed. Then, the residual time windows were split into two adjacent, not superimposed portions: the first 3 s were considered as Far–SBC and the last 3 s as During–SBC. In this way, every 3 s of Far–SBC epoch was coupled with the next 3 s During–SBC window, and pairwise comparisons could quantify the SBC–induced changes from the previous baseline.
The CC was estimated within the ranges of frequency of EEG rhythms: the delta (0.5–4 Hz), theta (4–8 Hz), and alpha (8–13 Hz) rhythms were estimated, using band–pass Chebyshev type I filters of order 6. They were run in both directions to remove phase shifts and distortion. Then, the CC was computed for each rhythm and for the sum of delta and theta.

2.4. Topological Indexes of Network Patterns

Once extracted connectivity indexes (i.e., the CC in each time window of interest and for different rhythms), for each of them a graph G ( V , E ) was built, where the nodes V are the considered EEG channels and the set of edges E is given by the FC index. It is a undirected weighted graph, providing some insight on the coupling between different brain regions. Many indexes have been proposed to characterize the topological organization of networks represented by a graph [40], finding many applications in the interpretation of EEG [37]. The following topological indexes are considered here.
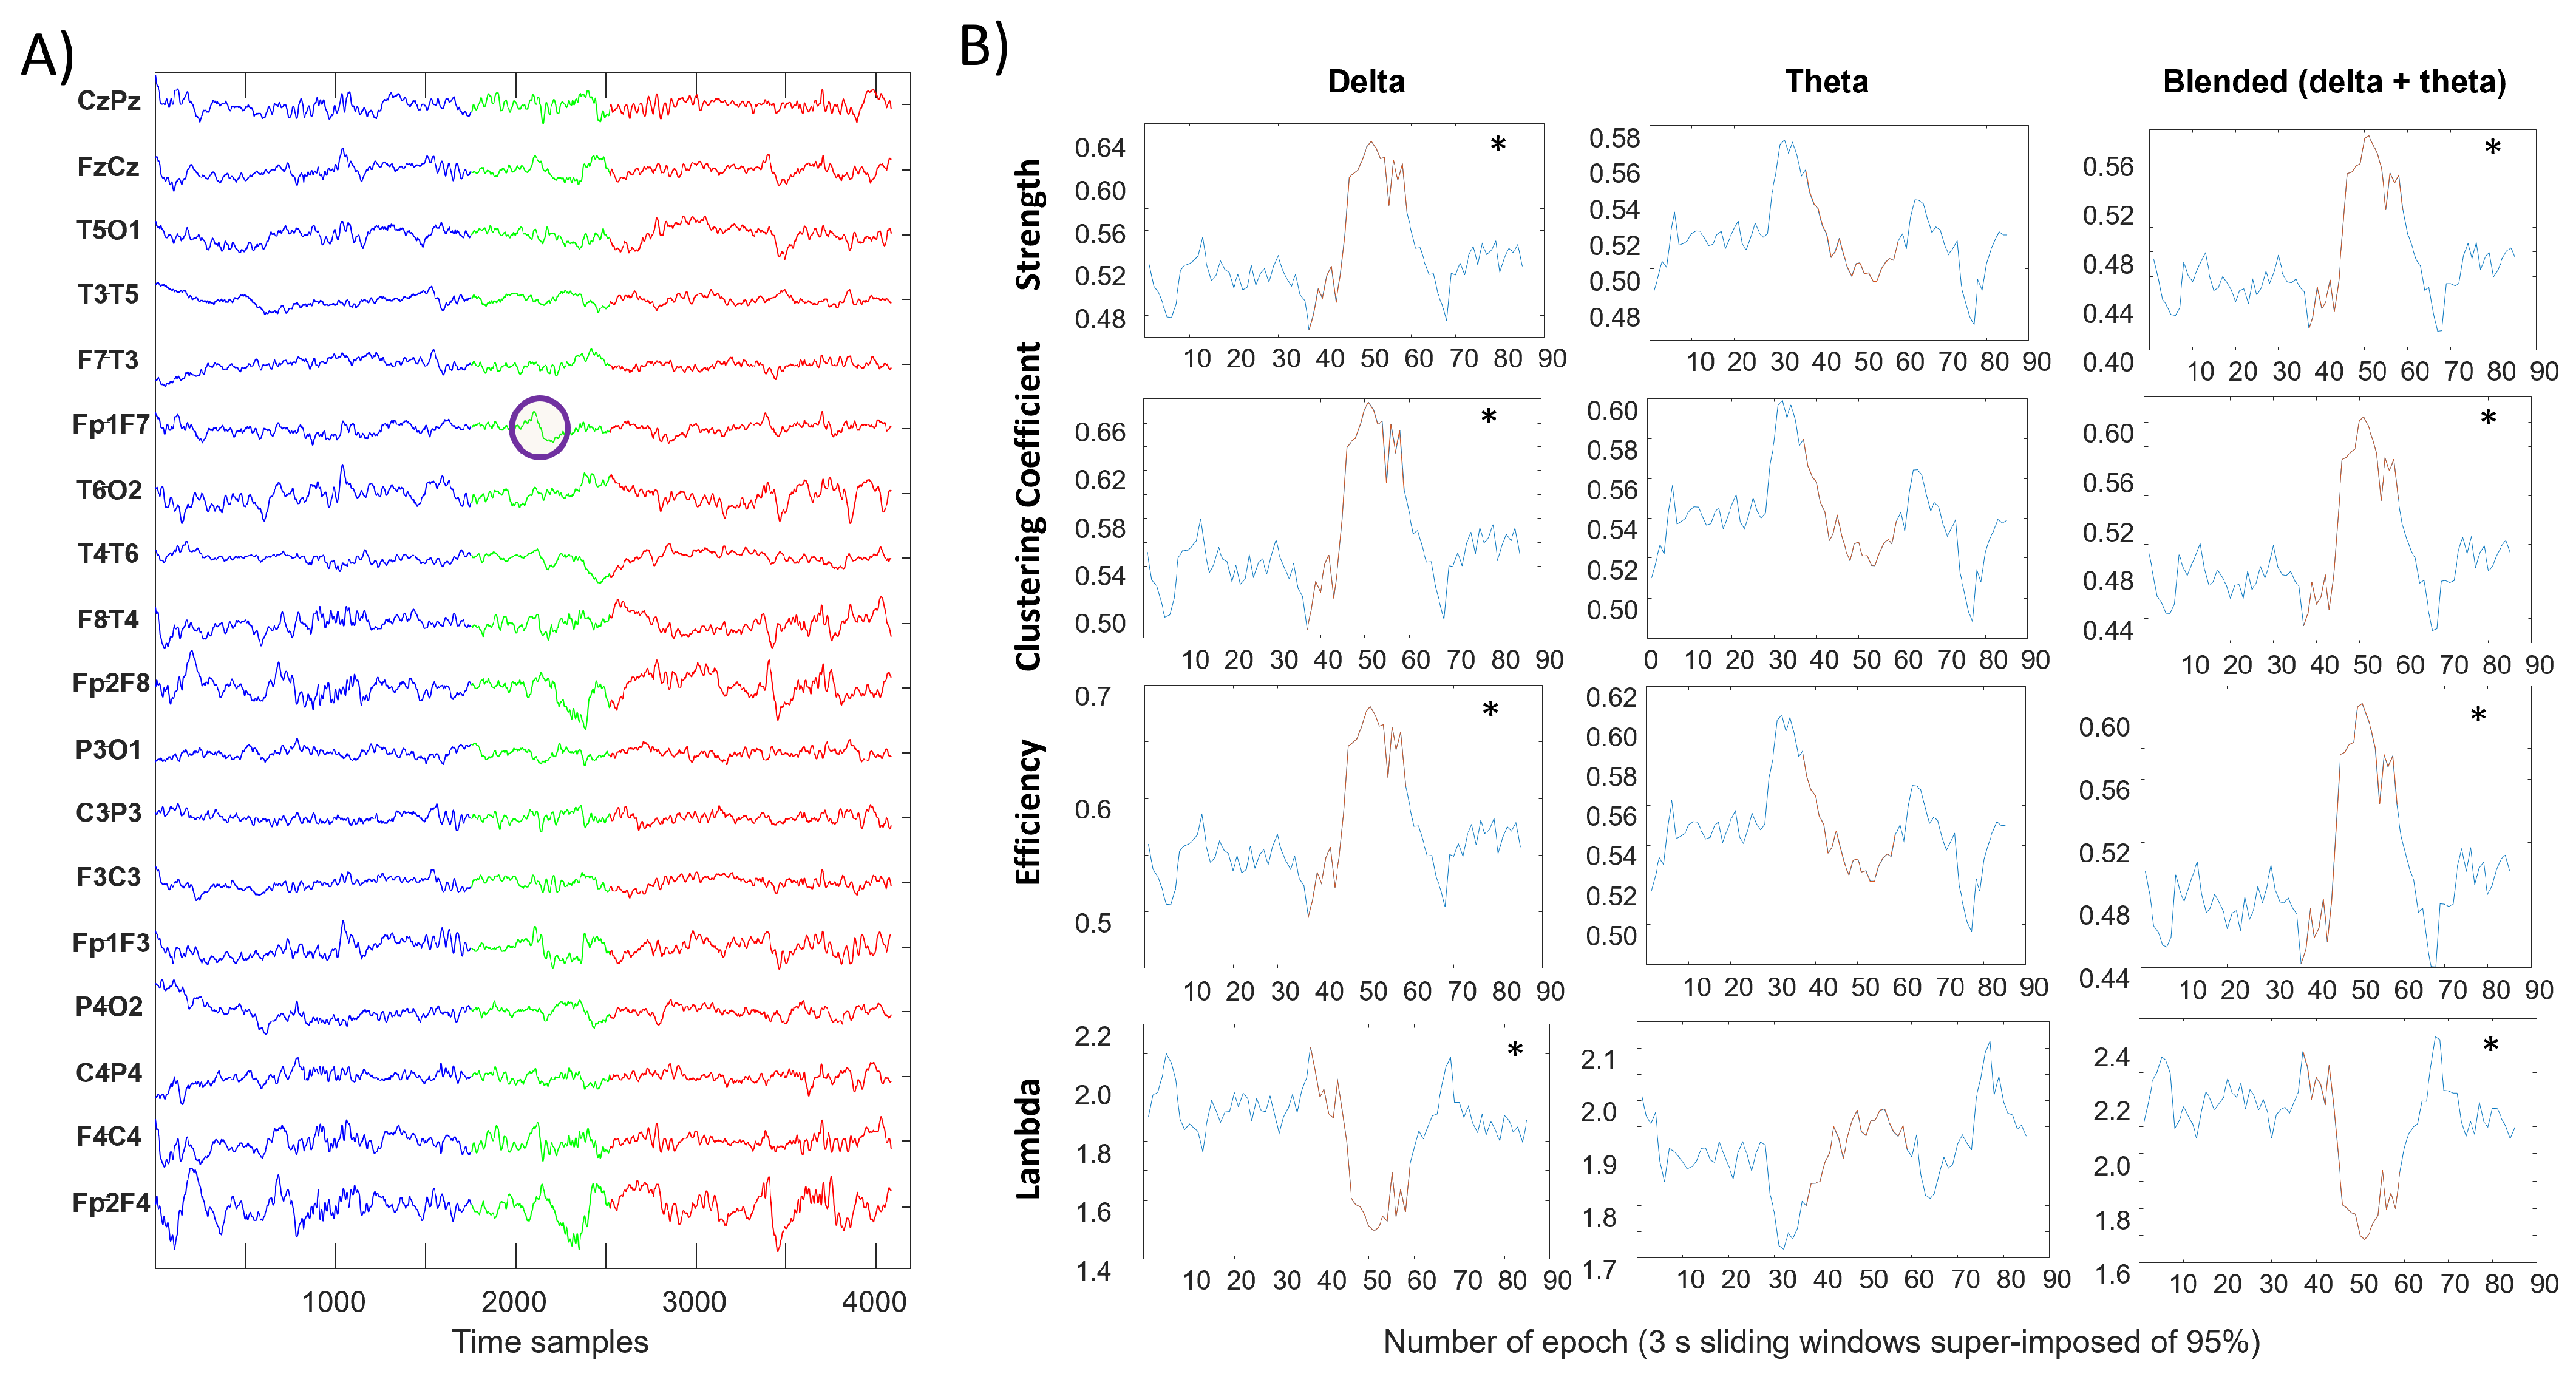
  • Strength is the sum of the connections to a node
    k i = i N a i j
    where a i j is an element of the adjacency matrix indicating the connection status between nodes i and j. We used the average strength, defined as
    K = 1 n i N k i
    (where n is the number of nodes in the graph) to provide an overall characterization of how much the network was connected.
  • Clustering coefficient of the network [41]
    C = 1 n i N C i = 1 n i N 2 t i k i ( k i 1 )
    where t i is the geometric mean of triangles around a node i
    t i = 1 2 j , h N ( a i j a i h a j h ) 1 3
    and C i is the clustering coefficient of the ith node ( C i = 0 for k i < 2). It is a measure of the degree to which nodes in a graph cluster together.
  • Global efficiency of the network [42]
    E = 1 n i N E i = 1 n i N j N , j i d i j 1 n 1
    where E i is the efficiency of node i and d i j is the shortest path length between nodes i and j
    d i j = a u v g i j a u v
    where g i j is the geodesic path between nodes i and j (with d i j = for disconnected pairs). It measures the efficiency of the network to exchange information.
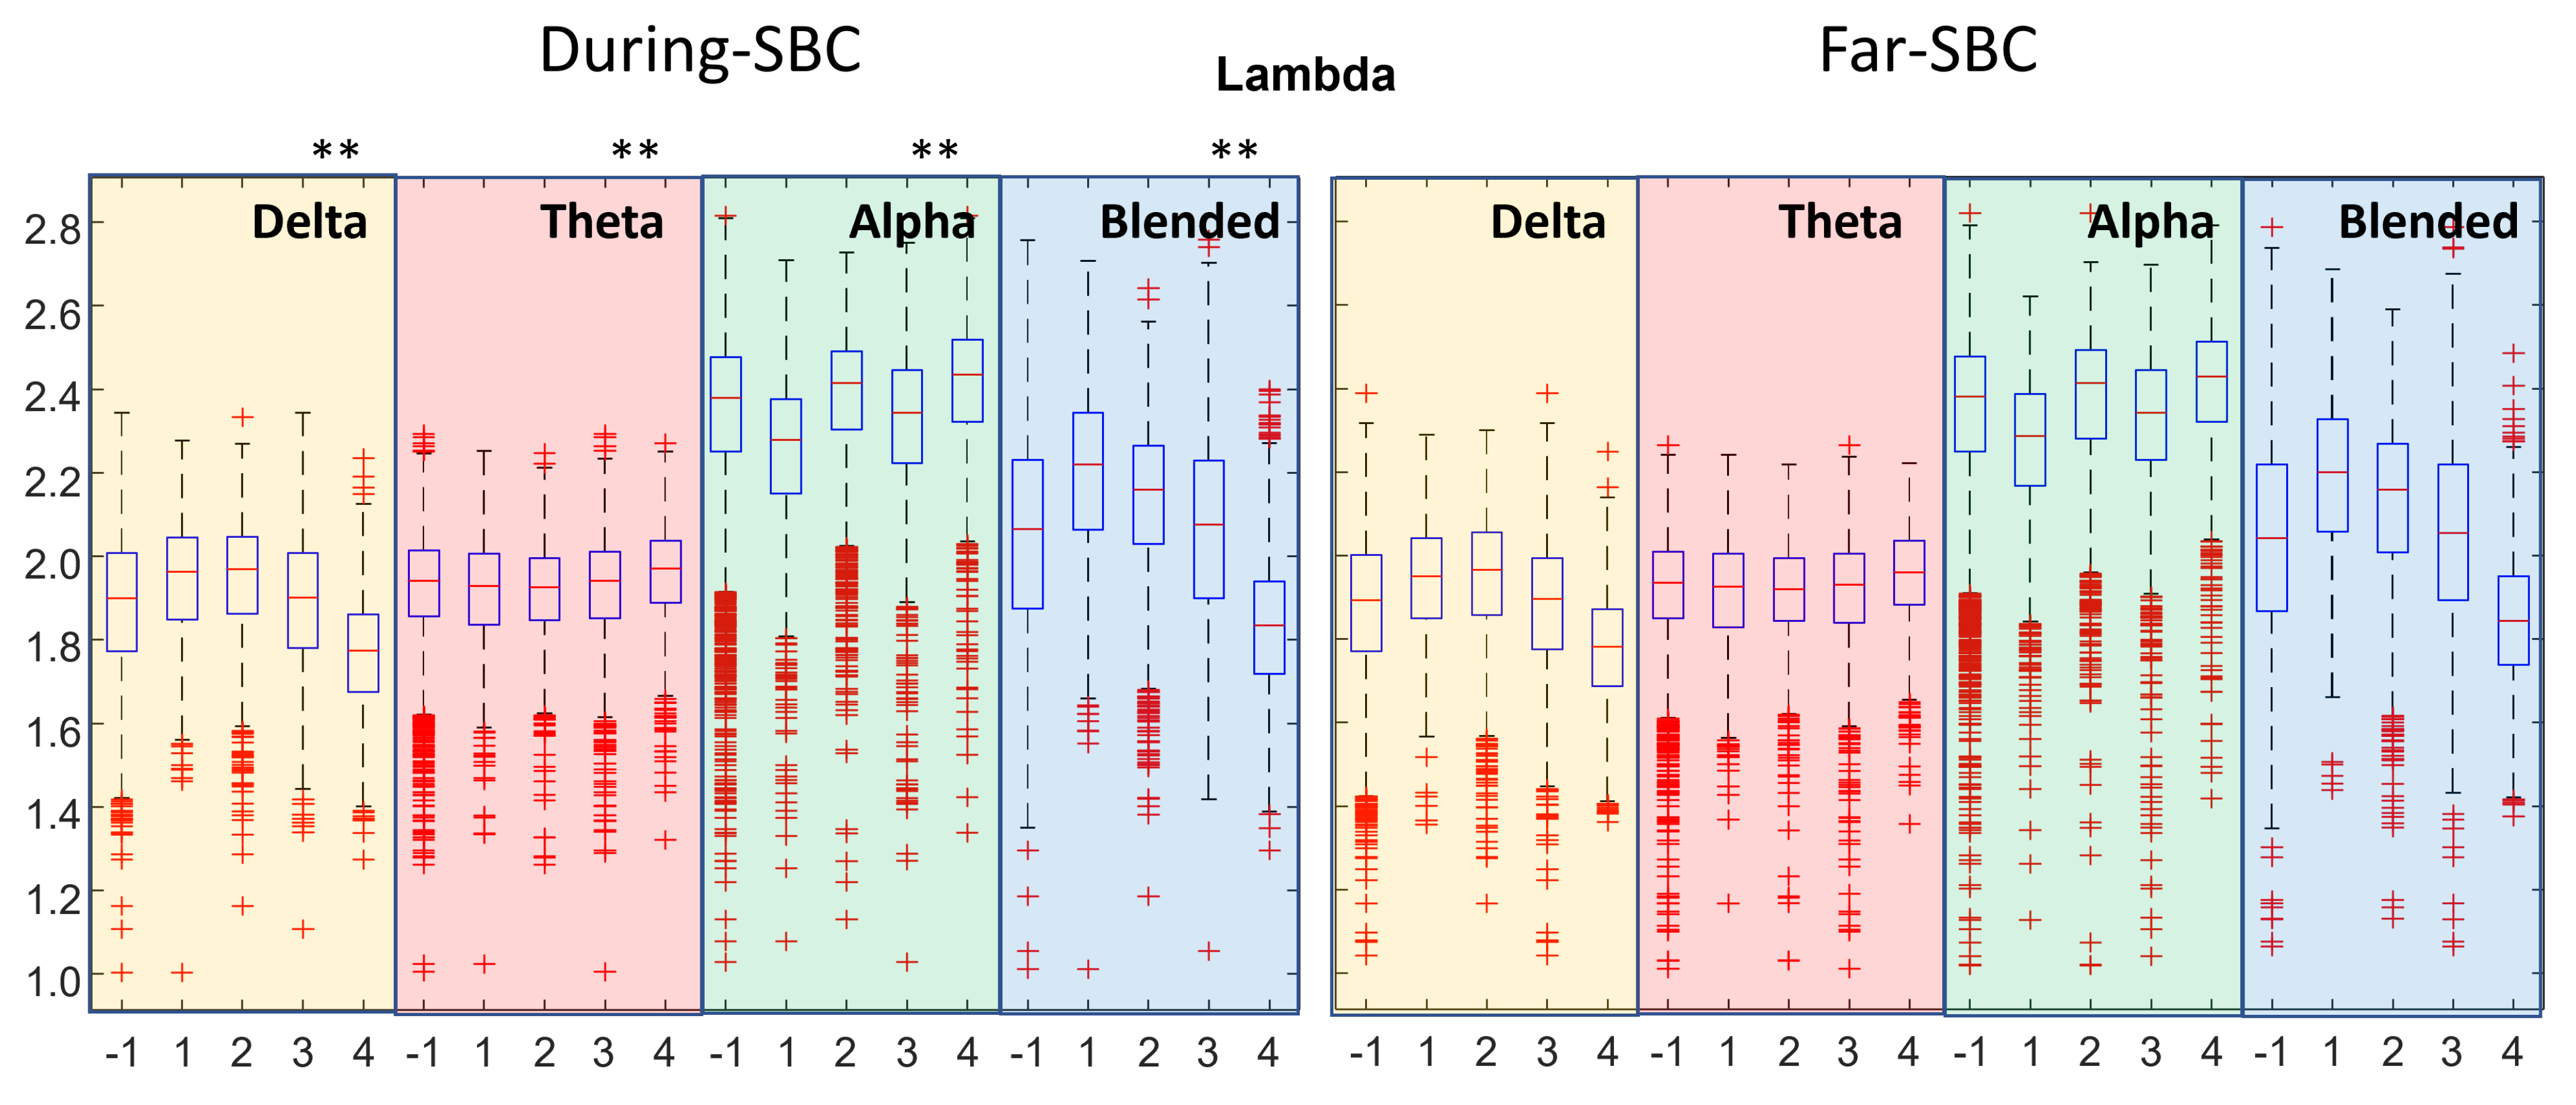
  • Characteristic path length of the network (indicated as lambda in the following)
    λ = 1 n i N L i = 1 n i N j N , j i d i , j n 1
    where L i is the average distance between node i and all other nodes. As for the previous index, it is also a measure of information transport in the network (with the opposite trend with respect to the efficiency), as a short average path length between nodes indicates a better overall connection.

2.5. Statistical Analysis

Nonparametric Scheirer–Ray–Hare (SRH) two–way analysis of variance (ANOVA) was performed [43] to check for possible variations in the topological indexes, due to the following factors: condition, i.e., far or during SBC, and severity of the pathology. The windows Far–SBC and During–SBC were coupled in pairs (as each Far–SBC was immediately preceding a During–SBC epoch), so that paired statistics could be used as post hoc to compare indexes extracted from them: the Wilcoxon signed rank test was employed. On the other hand, to check for differences among pairs of severity conditions, the Wilcoxon rank sum test was used.

3. Results

Figure 1 shows a portion of the recording from a patient with diagnosis 1, focused on an identified SBC in the channel Fp1–F7. This particular SBC was taken as an example, seeing as both before and after the SBC, there were relatively long parts of data not overlapped with any other SBC (Far–SBC segments). For the evaluation of each of the four topological indexes described before, sliding windows of 3 s with 95% overlap were considered. Each window was filtered with a zero–phase band–pass filter with different ranges: delta band (0.5–4 Hz), theta rhythm (4–8 Hz) and a blended band (0.5–8 Hz, including delta and theta rhythms). For every channel pair and each window, the maximum of the absolute value of the normalized crosscorrelation was evaluated to create the correspondent adjacency matrix, from which different topological indexes (i.e., strength, clustering coefficient, efficiency and lambda) were obtained.
A dramatic change in each metric can be appreciated near the SBC both in delta and blended frequency bands. Theta and alpha bands instead show mild (not statistical) variations.
Figure 2, Figure 3, Figure 4 and Figure 5 display with the same format the distributions of different topological indexes, considering different EEG rhythms and grouping either same severity condition or all data together. The SRH test indicated statistically significant variations for all indexes. However, notice that the distributions of the indexes far and close to SBC appear to be very similar. Nonetheless, as detailed below, some differences emerge considering paired data (i.e., comparing the windows During–SBC with the corresponding Far–SBC immediately preceding them).
Figure 2 shows the topological strength, separating the data with respect to the location of the windows (either far or during the SBCs) and the severity of the pathological condition. There is a statistically significant increase in the index computed on the blended delta–theta rhythms with the worsening of the pathological condition. Comparing the distributions of Far–SBC and During–SBC by the sign rank test, strong statistical differences (with p < 0.01) were found (with higher value During–SBC) in all the distributions, with only three exceptions: severity condition 1 in theta and blended (delta–theta) frequency bands and severity condition 4 in alpha band.
Figure 3 shows the clustering coefficient. There is an increase with the severity of the condition for the delta rhythm and the mixture of delta and theta. Far–SBC and During–SBC showed strong statistically different values of clustering coefficients (higher During–SBC) in all the distributions, with three exceptions: severity condition 1 in theta and blended frequency bands and severity condition 4 for the alpha rhythm.
Figure 4 shows the efficiency. There is an increase with the severity of the pathology for the delta rhythm and the mixture of delta and theta. Strong statistical differences in Far–SBC and During–SBC were disclosed (with higher value During–SBC) in all the distributions, with two exceptions: severity condition 1 in blended frequency band and severity condition 4 in alpha band.
Figure 5 shows the characteristic path length (lambda). There is a decrease with the severity of the condition for the mixture of delta and theta. Moreover, there is a decrease in lambda in the range of severity conditions 2–4, as well as for the delta rhythm. Far–SBC and During–SBC were statistically different (with lower value During–SBC) in all the distributions, with three exceptions: severity condition 1 of theta rhythm and blended frequency band and severity condition 4 in alpha band.
Comparing the distributions of Far–SBC and During–SBC by a paired test (Wilcoxon signed rank test), all indexes showed many statistically significant variations. However, a large number of cases were available for each statistical test, which helped in obtaining significance; thus, further tests were performed with a lower numerosity, considering separately each patient, grouping together data with same severity conditions. In such a case, only some variations were significant.
Specifically, grouping the same conditions for each patient (i.e., from severity 1 to 4, plus the sum of all conditions), we obtained 35 cases (notice that not all patients experienced all four severity conditions). Thus, we had 35 cases, evaluated within four bandwidths (i.e., delta, theta, alpha and delta–theta) using four topological indexes, obtaining a total of 560 (= 35 × 4 × 4) comparisons (Far–SBC versus During–SBC). A different number of statistically different distributions of indexes were obtained comparing the During–SBC and the Far–SBC windows on different bands: 73 cases for the delta rhythm, 91 for theta, 54 for alpha and 52 for the blended delta–theta band. Considering these 270 statistically significant variations, 66 cases concern the strength; 67, the clustering coefficient; 66, the efficiency; and 71, the lambda.
Considering all these statistically significant cases, we observe a consistent behavior: the windows During–SBC shows larger strength, clustering coefficient and efficiency and lower values of lambda than Far–SBC, with only two exceptions (subject 2 with severity condition 3 and subject 9 with severity condition 4, in which, however, the number of samples was low, i.e., 41 and 52 windows, respectively).
Notice that this analysis of patient–specific cases, in which significant variations of During–SBC and Far–SBC conditions were found, is consistent with that based on the overall dataset detailed above (where strength, clustering coefficient and efficiency were also found to be larger in During–SBC conditions, whereas lambda was larger in Far–SBC windows).

4. Discussion

A fast and reliable diagnosis of encephalitis is needed to reduce morbidity and mortality [1,3,9]. This would also reduce the hospitalization costs, which represent a serious additional concern [8]. Moreover, the follow–up of patients is important to assess the progress of the pathology and the responsiveness to treatments. A noninvasive, operator–independent, stable, accurate and economic technique should be used in the diagnosis and follow–up of encephalitis. On the other hand, the identification of symptoms and evaluation of vital functions are currently obtained from multiple serological and instrumental examinations, and invasive or expensive methods are used to investigate specific clinical problems. Furthermore, empirical strategies are often employed in emergency conditions, usually by administering massive doses of antiviral drugs, antibiotics and steroids.
EEG is noninvasive and low cost, and in principle, it could help supporting the diagnosis and assessment of encephalitis. However, it is usually evaluated subjectively, extracting qualitative information about low–frequency contributions or possible anomalous waveforms.
On the other hand, automated EEG processing could provide objective information on different pathologies [14,15,44,45,46,47,48,49,50,51] and was found to be useful, as well as supporting the diagnosis of encephalitis [52,53]. We focused on the SBC, which is a selective EEG marker found in many inflammatory diseases of the brain [19,25,26,54]. Our automated method allows one to identify very quickly the SBCs (even those which are small and covered by noise), providing quantitative information and removing subjective interpretations [28]. In this paper, we explored the functional connections of different brain regions (monitored by the different EEG channels). We found some variations of topological indexes characterizing the network of connections considering different levels of severity of the pathology. Moreover, we compared time epochs which were either far or including an SBC. We have found statistical differences between the two conditions, supporting the hypothesis that the brain dynamics change during the onset of an SBC. Notice that, as the epochs centered on SBCs included more than 1 s before and 1 s after its onset, they reflect also the preparation and the recovery phases. A previous study by our group indicated that the local EEG oscillations (i.e., for each EEG channel) slow down before and after an SBC [31]; here, we found some indication that the connections between different brain regions, measured in terms of crosscorrelation, also change close to an SBC with respect to the distance from it. Specifically, the following statistically significant differences were disclosed:
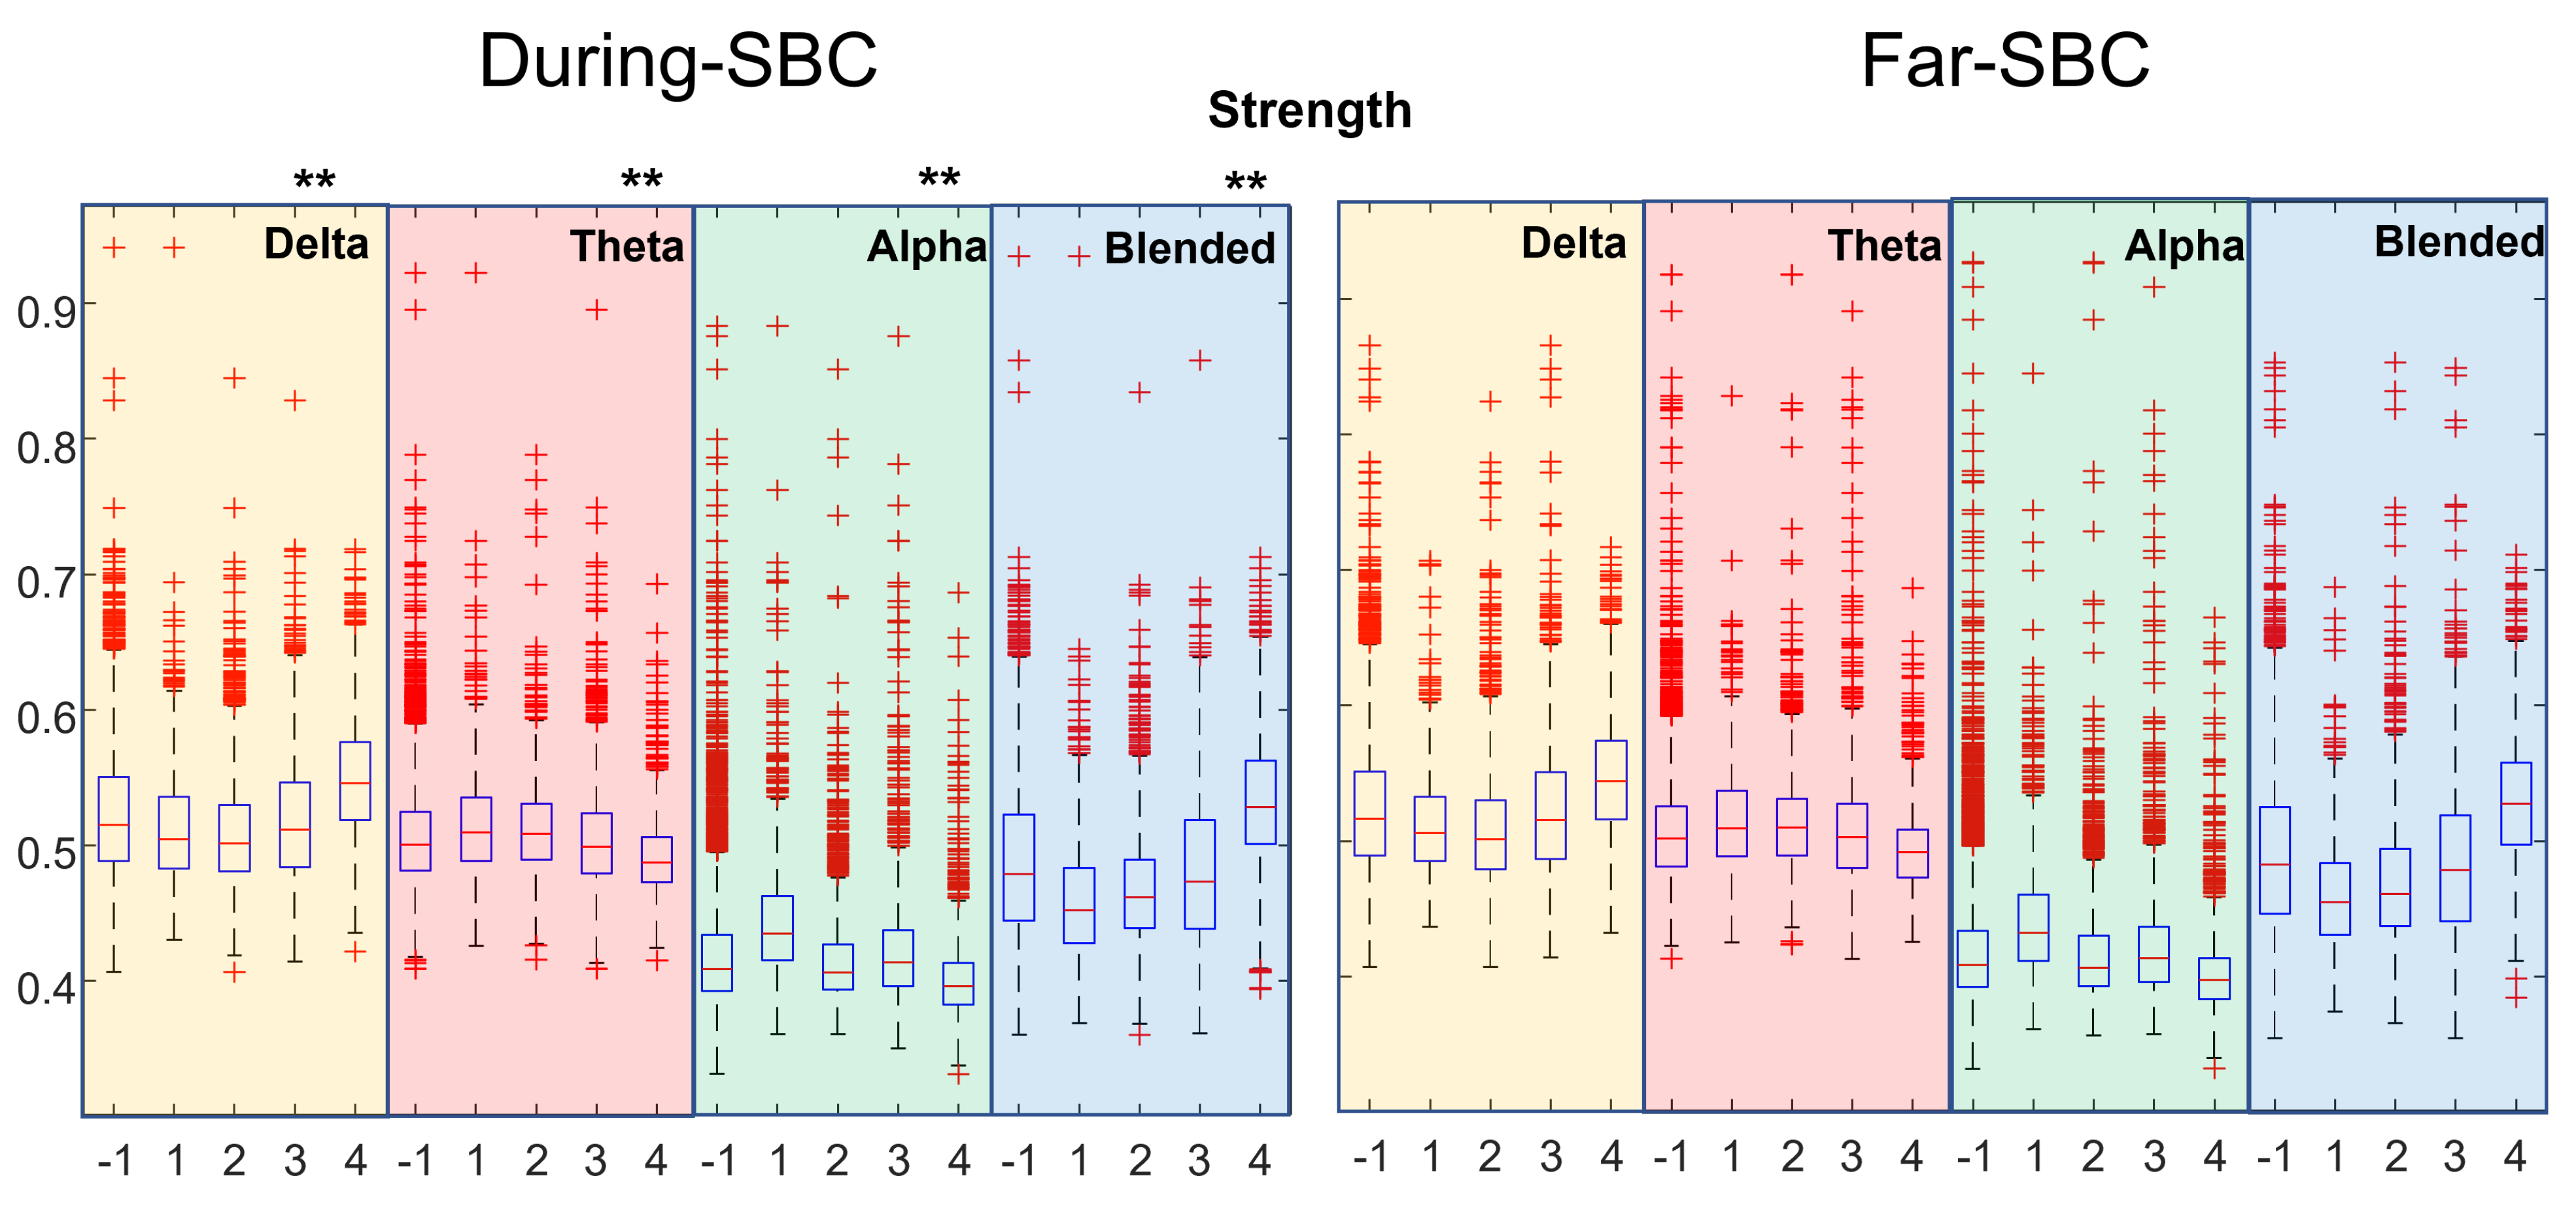
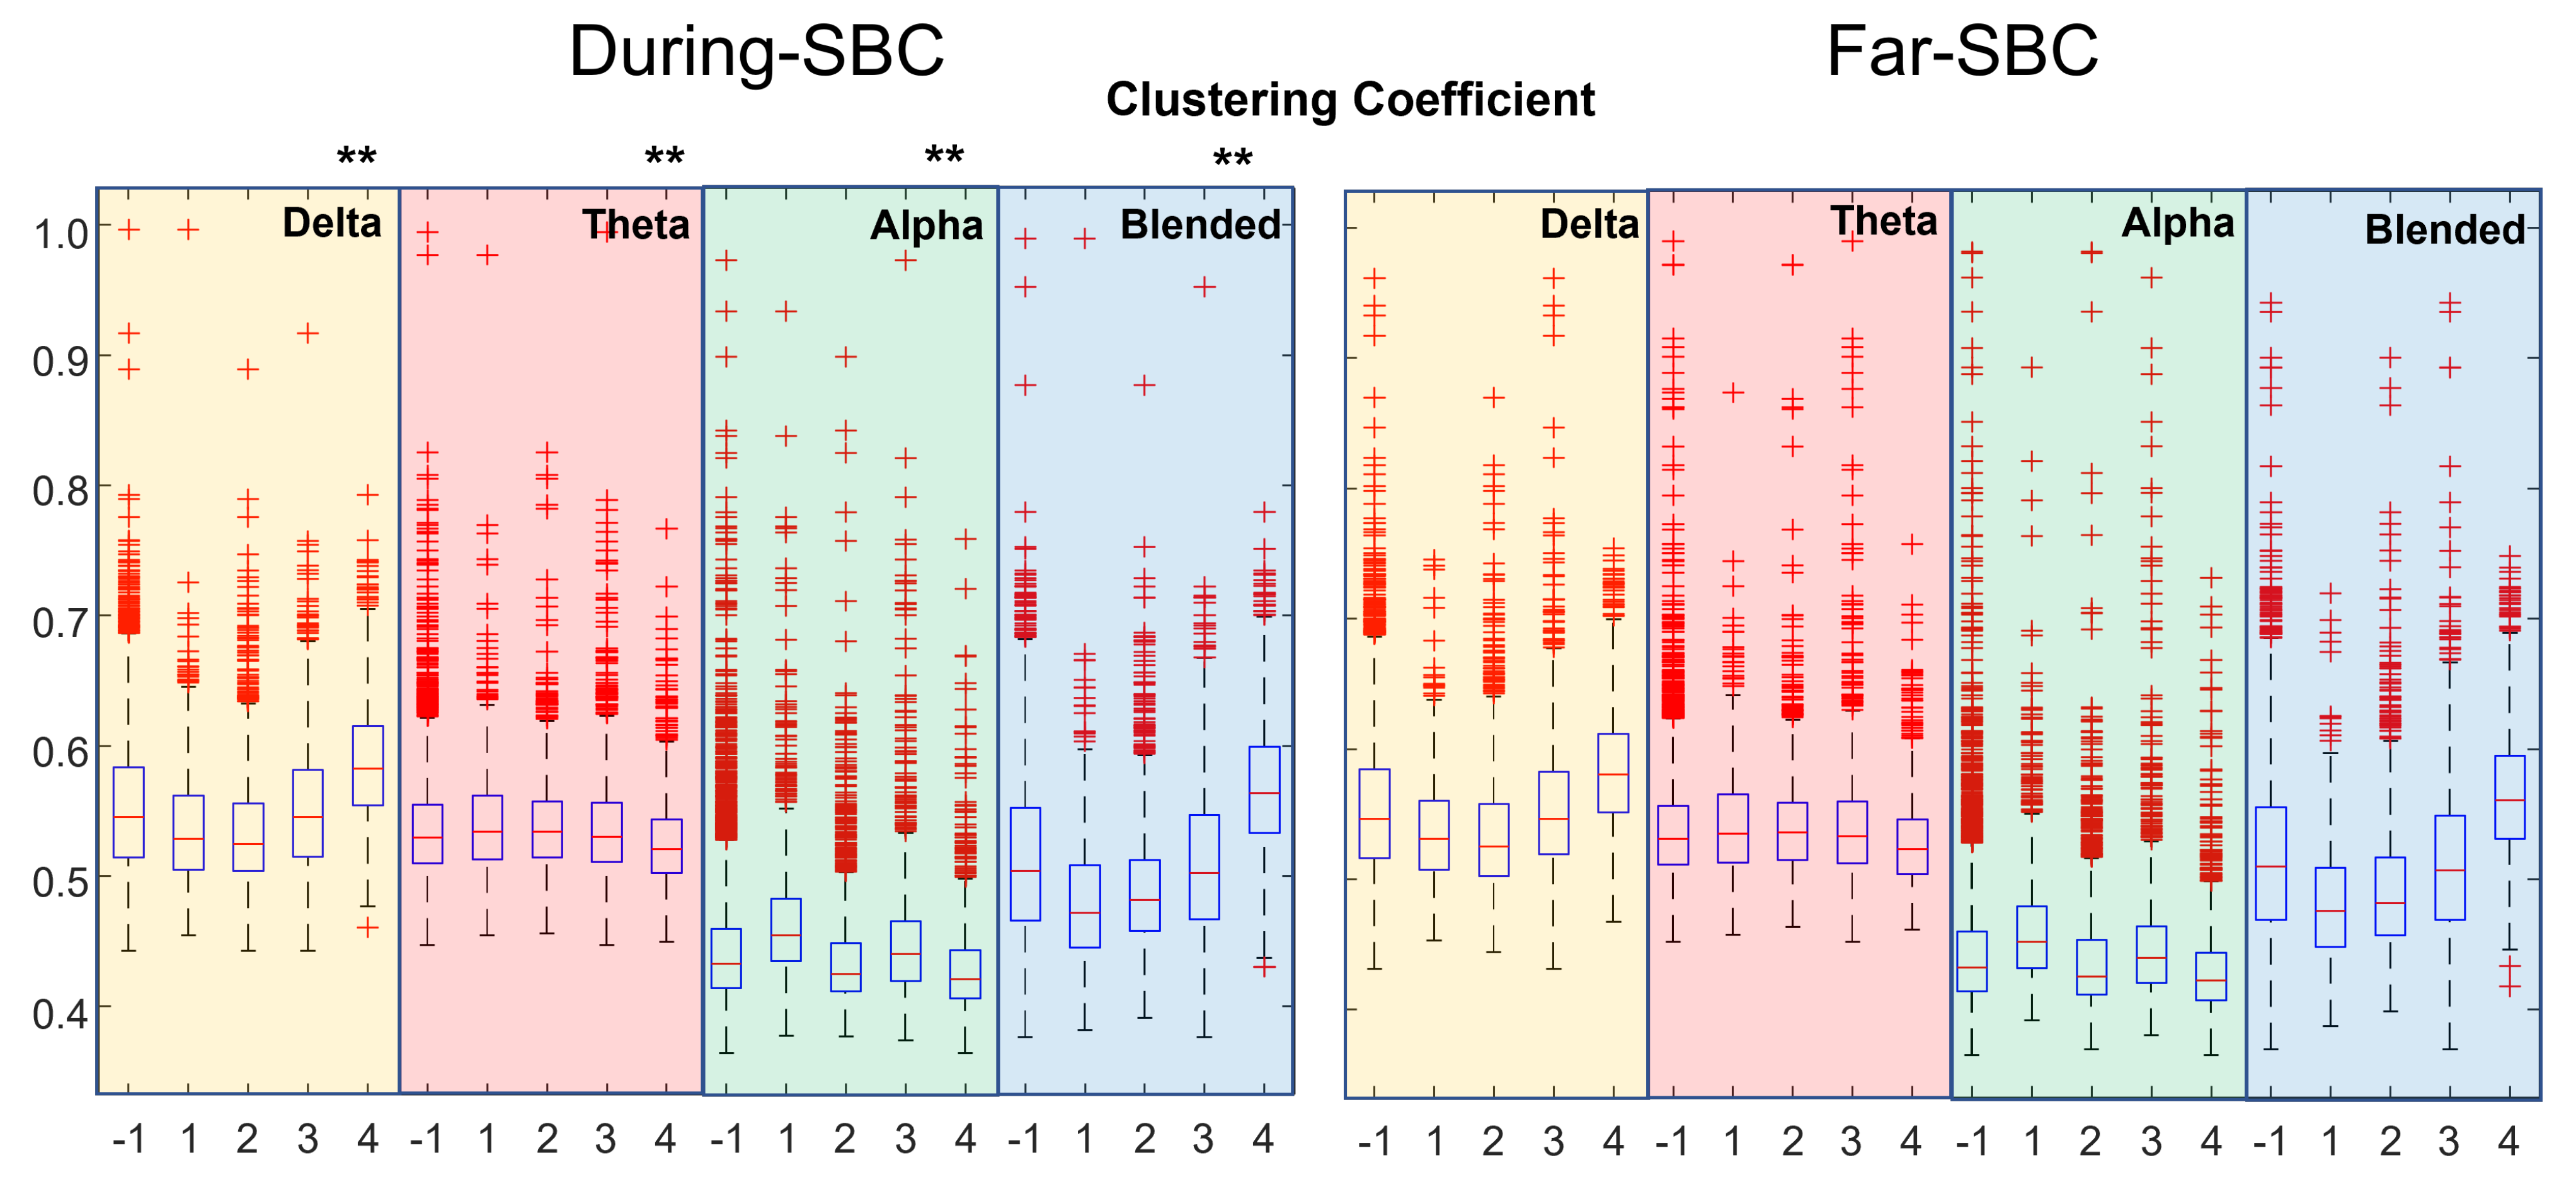
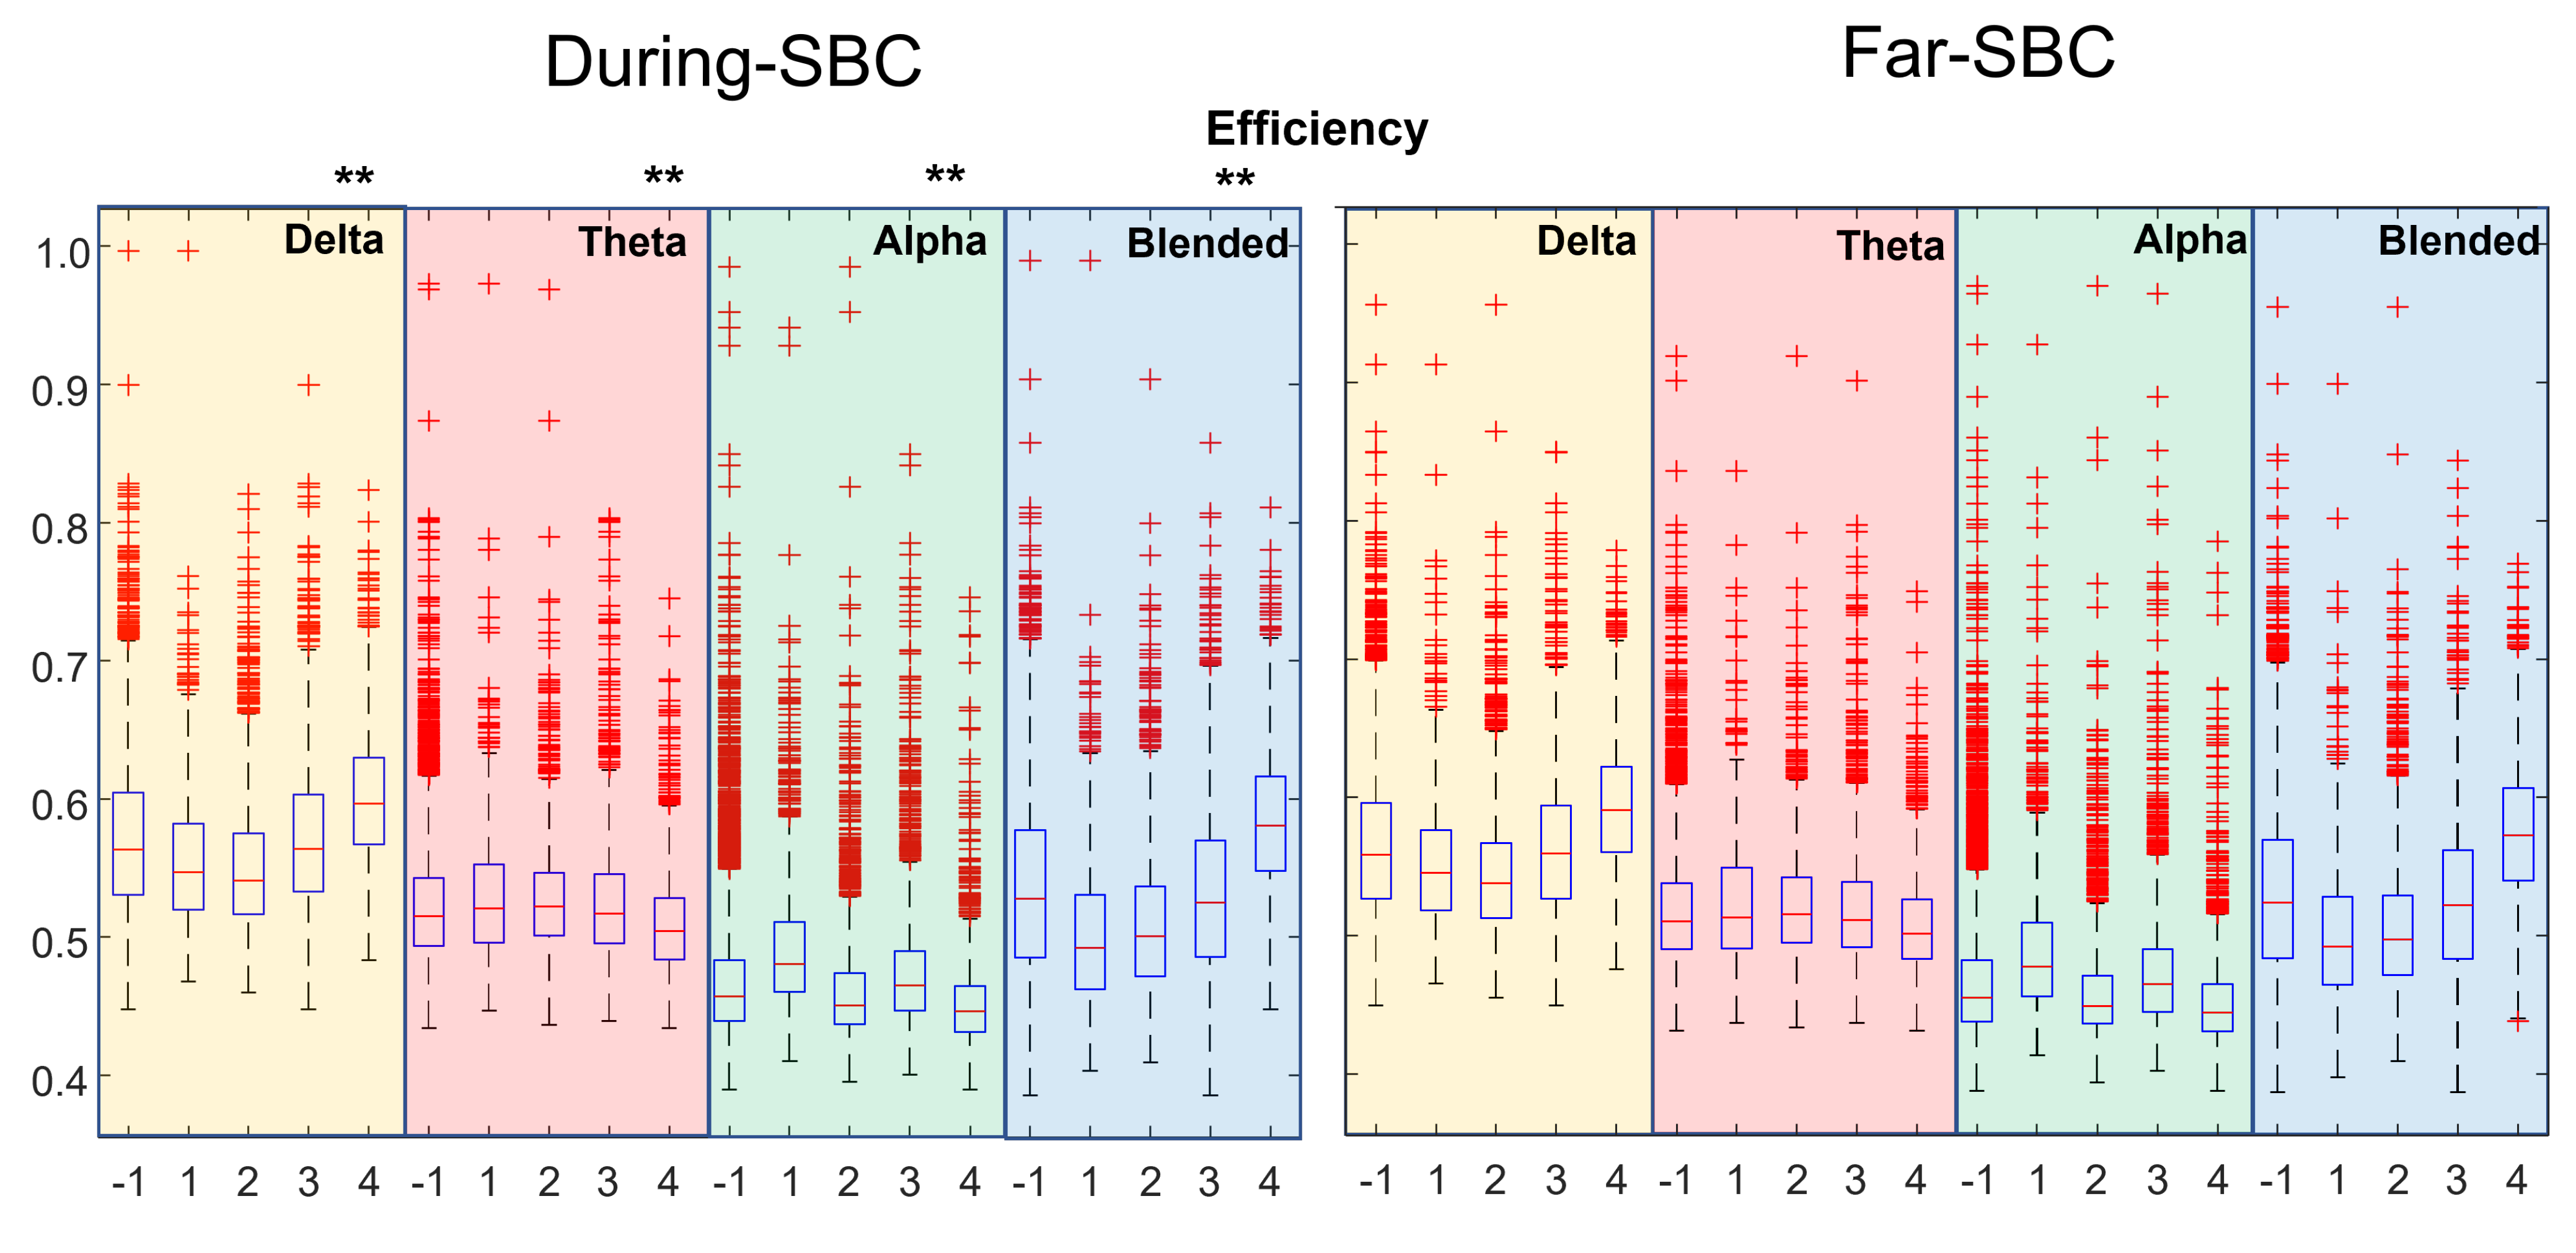
  • clustering coefficient, efficiency and strength tend to be higher when closer to an SBC;
  • the characteristic path length (lambda) is lower when near an SBC.
These results show a tendency for the brain network to organize itself as a small–world topology in the vicinity of an SBC (as the clustering coefficient tends to increase and lambda to decrease [55]). A small–world topology is a well–designed anatomical network [40], which combines functionally segregated modules (specialized for managing different tasks) with robust intermodular links (integrating the activity of the different modules). It was found in healthy controls, and it increased in the case of better intellectual performances, whereas it is altered in the case of fatiguing tasks or pathology [56]. Since being closer to a small–world topology indicates a healthier condition, we could hypothesize that the SBC results from an attempt by patients to react to the disease, as if the discharge could reset the brain from a background condition in which the interactions of different brain regions are disorganized (as they show a low value of small–worldness).
These results should be analyzed with caution, keeping in mind the limitations of our work.
  • This is a retrospective clinical study, including also data recorded in emergency conditions or quick checkups, considering a different number of channels. Thus, the processed EEGs are not very clean, and the experimental conditions were not kept under control. Moreover, young children with a large range of ages were included. Hence, the investigated brains were under development, with large differences, beyond the effect of the pathology.
  • Our automated method for SBC detection is based on the subjective experience of neurologists. The identified waveforms are sometimes small, raising doubts on their correctness, and some of them are not correct in the opinion of the expert neurologist (as shown in some examples reported in [28]). Due to the long duration of the traces, a complete comparison of the automated and manual identification is not available, but based on sampled portions of traces, we could expect that our algorithm makes about 25% of false positive and 10% of false negatives, with a large variability of accuracy depending on the quality of the recording.
  • The distributions of topological indexes far from and close to SBCs are quite similar. Only paired comparisons of the indexes during the SBC and in the preceding time window show statistically significant variations. Thus, the brain behavior changes during the SBC with respect to the previous baseline, but the variations between the overall epochs taken during SBCs and far from them are less clear.
  • Only the crosscorrelation of EEG rhythms was considered as a measure of functional connectivity.
In summary, even bearing in mind the above limitations, clear changes in the brain connectivity were found during the SBC with respect to baseline, indicating that this EEG marker reflects some variations in the topological organization of the brain. These promising results indicate that this is a good research path to be deepened to promote the EEG as a reliable tool for the diagnosis and follow–up of encephalitis patients.

5. Conclusions and Further Work

Rapid diagnosis of encephalitis is needed, but currently, either empirical or invasive and expensive examinations are used in the clinical practice. The slow biphasic complex (SBC) found in the EEG of patients could possibly provide additional information to support diagnosis and follow–up. It was shown to be a reliable EEG marker of encephalitis in previous studies. Here, functional EEG connectivity was investigated, showing that it is affected by the onset of SBCs. This is an important characterization of the SBC, indicating a change in the dynamics of the flow of information between the different regions of the brain that ultimately results in the complex. Future studies in an extended dataset or in a prospective clinical trial are needed to further investigate these promising results. Different brain inflammation pathologies could also be investigated (as SBCs were observed in different pathologies). This would also allow one to further test our automated method for SBC identification and to improve it, in order to increase its accuracy in the detection of this important waveform. Different FC indexes could also be investigated, and they could be applied on estimated sources, instead of EEG channels. Finally, more topological indexes could be used to characterize the network of connection.

Author Contributions

Conceptualization, L.M.; methodology, L.M. and G.C.; software, G.C.; validation, L.M. and G.C.; data preparation, L.M.; investigation, L.M. and G.C.; writing—original draft preparation, L.M. and G.C.; writing—review and editing, L.M.; visualization, L.M. and G.C.; supervision, L.M. All authors have read and agreed to the published version of the manuscript.

Funding

This research received no external funding.

Acknowledgments

The authors are indebted to A. Beaumanoir, G. Capizzi and M. Valerio, who provided the data and helped them in the analysis of the clinical literature.

Conflicts of Interest

The authors declare no conflict of interest.

Abbreviations

The following abbreviations are used in this manuscript:
EEGElectroencephalogram
FCFunctional Connectivity
SBCSlow Biphasic Complex
CCCrosscorrelation

References

  1. Barbadoro, P.; Marigliano, A.; Ricciardi, A.; D’Errico, M.M.; Prospero, E. Trend of hospital utilization for encephalitis. Epidemiol. Infect. 2012, 140, 753–764. [Google Scholar] [CrossRef]
  2. Falchek, S.J. Encephalitis in the Pediatric Population. Pediatr. Rev. 2012, 33, 122–133. [Google Scholar] [CrossRef] [Green Version]
  3. Piquet, A.L.; Cho, T.A. The Clinical Approach to Encephalitis. Curr. Neurol. Neurosci. Rep. 2016, 16, 45. [Google Scholar] [CrossRef]
  4. Thompson, C.; Kneen, R.; Riordan, A.; Kelly, D.; Pollard, A.J. Encephalitis in children. Arch. Dis. Child. 2012, 97, 150–161. [Google Scholar] [CrossRef]
  5. Venkatesan, A. Epidemiology and outcomes of acute encephalitis. Curr. Opin. Neurol. 2015, 28, 277–282. [Google Scholar] [CrossRef]
  6. Boucher, A.; Herrmann, J.L.; Morand, P.; Buzelé, R.; Crabol, Y.; Stahl, J.P.; Mailles, A. Epidemiology of infectious encephalitis causes in 2016. Med. Mal. Infect. 2017, 47, 221–235. [Google Scholar] [CrossRef] [PubMed]
  7. Weingarten, L.; Enarson, P.; Klassen, T. Encephalitis. Pediatr. Emerg. Care 2013, 29, 235–241. [Google Scholar] [CrossRef]
  8. Vora, N.M.; Holman, R.C.; Mehal, J.M.; Steiner, C.A.; Blanton, J.; Sejvar, J. Burden of encephalitis-associated hospitalizations in the United States, 1998–2010. Neurology 2014, 82, 443–451. [Google Scholar] [CrossRef]
  9. Kneen, R.; Michael, B.D.; Menson, E.; Mehta, B.; Easton, A.; Hemingway, C.; Klapper, P.E.; Vincent, A.; Lim, M.; Carrol, E.; et al. National Encephalitis Guidelines Development and Stakeholder Groups. Management of suspected viral encephalitis in children—Association of British Neurologists and British Paediatric Allergy, Immunology and Infection Group national guidelines. J. Infect. 2012, 64, 449–477. [Google Scholar] [CrossRef] [PubMed]
  10. Drislane, F.W. Overlap of encephalopathies and epileptic seizures. J. Clin. Neurophysiol. 2013, 30, 468–476. [Google Scholar] [CrossRef] [PubMed]
  11. Sutter, R.; Kaplan, P.W. Clinical and electroencephalographic correlates of acute encephalopathy. J. Clin. Neurophysiol. 2013, 30, 443–453. [Google Scholar] [CrossRef]
  12. Tauber, S.C.; Eiffert, H.; Bruck, W.; Nau, R. Septic encephalopathy and septic encephalitis. Expert Rev. Anti Infect. Ther. 2017, 15, 121–132. [Google Scholar] [CrossRef] [PubMed]
  13. Sutter, R.; Kaplan, P.W.; Cervenka, M.C.; Thakur, K.T.; Asemota, A.O.; Venkatesan, A.; Geocadin, R.G. Electroencephalography for diagnosis and prognosis of acute encephalitis. Clin. Neurophysiol. 2015, 126, 1524–1531. [Google Scholar] [CrossRef] [PubMed]
  14. Mesin, L.; Costa, P. Prognostic value of EEG indexes for the Glasgow outcome scale of comatose patients in the acute phase. J. Clin. Monit. Comput. 2014, 28, 377–385. [Google Scholar] [CrossRef]
  15. Jacob, J.E.; Nair, G.K.; Iype, T.; Cherian, A. Diagnosis of encephalopathy based on energies of EEG subbands using discrete wavelet transform and support vector machine. Neurol. Res. Int. 2018, 2, 1613456. [Google Scholar] [CrossRef] [PubMed]
  16. Burquier, V.; Koralnik, I.J.; Vibert, D.; Burkhard, P.; Beaumanoir, A.; Jallon, P.; Mayer, E.; Hirschel, B. Effect of antiretroviral treatment on early electroencephalographic and otoneurologic manifestations in HIV infection and prognostic importance of verified perturbations. Neurophysiol. Clin. 1997, 27, 508–519. (In French) [Google Scholar] [CrossRef]
  17. Chen, L.; Zhu, M.; Zhou, H.; Liang, J. Clinical study of West syndrome with PS and late-onset epileptic spasms. Epilepsy. Res. 2010, 89, 82–88. [Google Scholar] [CrossRef]
  18. Tanoue, K.; Oguni, H.; Nakayama, N.; Sasaki, K.; Ito, Y.; Imai, K.; Osawa, M. Focal epileptic spasms, involving one leg, manifesting during the clinical course of west syndrome (WS). Brain Dev. 2008, 30, 155–159. [Google Scholar] [CrossRef]
  19. Beaumanoir, A.; Grioni, D.; Kullmann, G.; Tiberti, A.; Valseriati, D. EEG anomalies in the prodromic phase of Rasmussen’s syndrome. Report of two cases. Neurophysiol. Clin. 1997, 27, 25–32. (In French) [Google Scholar] [CrossRef]
  20. Bien, C.G.; Granata, T.; Antozzi, C.; Cross, J.H.; Dulac, O.; Kurthen, M.; Lassmann, H.; Mantegazza, R.; Villemure, J.G.; Spreafico, R.; et al. Pathogenesis, diagnosis and treatment of Rasmussen encephalitis: A European consensus statement. Brain 2005, 128, 454–471. [Google Scholar] [CrossRef] [Green Version]
  21. Capovilla, G.; Paladin, F.; Dalla Bernardina, B. Rasmussen’s syndrome: Longitudinal EEG study from the first seizure to epilepsia partialis continua. Epilepsia 1997, 38, 483–488. [Google Scholar] [CrossRef] [Green Version]
  22. Granata, T.; Gobbi, G.; Spreafico, R.; Vigevano, F.; Capovilla, G.; Ragona, F.; Freri, E.; Chiapparini, L.; Bernasconi, P.; Giordano, L.; et al. Rasmussen’s encephalitis: Early characteristics allow diagnosis. Neurology 2003, 60, 422–425. [Google Scholar] [CrossRef]
  23. Longaretti, F.; Dunkley, C.; Varadkar, S.; Vargha–Khadem, F.; Boyd, S.G.; Cross, J.H. Evolution of the EEG in children with Rasmussen’s syndrome. Epilepsia 2012, 53, 1539–1545. [Google Scholar] [CrossRef]
  24. Granata, T.; Andermann, F. Rasmussen encephalitis. Handb Clin Neurol. 2013, 111, 511–519. [Google Scholar]
  25. Beaumanoir, A.; Burkhard, P.; Gauthier, G.; Le Floch-Rohr, J.; Ochsner, F.; Waldvogel, F. EEG recordings in 19 cases of AIDS with encephalic involvement. Neurophysiol. Clin. 1988, 18, 313–322. (In French) [Google Scholar] [CrossRef]
  26. Beaumanoir, A.; Nahory, A. EEG in HIV infection. Neurophysiol. Clin. 1992, 22, 355–368. (In French) [Google Scholar] [CrossRef]
  27. Koralnik, I.J.; Beaumanoir, A.; Hausler, R.; Kohler, A.; Safran, A.B.; Delacoux, R.; Vibert, D.; Mayer, E.; Burkhard, P.; Nahory, A.; et al. A controlled study of early neurologic abnormalities in men with asymptomatic human immunodeficiency virus infection. N. Engl. J. Med. 1990, 323, 864–870, Erratum in 1990, 323, 1716. [Google Scholar] [CrossRef] [PubMed]
  28. Mesin, L.; Valerio, M.; Beaumanoir, A.; Capizzi, G. Automatic identification of Slow Biphasic Complexes in EEG: An effective tool to detect Encephalitis. Biomed. Phys. Eng. Express 2019, 5, 045006. [Google Scholar] [CrossRef]
  29. Mesin, L.; Valerio, M.; Capizzi, G. Detection and Assessment of Encephalitis from EEG. In Proceedings of the IEEE Conference on Computational Intelligence in Bioinformatics and Computational Biology, Siena, Italy, 9–11 July 2019. [Google Scholar]
  30. Valerio, M.; Rivera, S.; Mesin, L. Relation between lesions and localization of sources of slow biphasic complexes in encephalitis. Neuroimmunol. Neuroinflamm. 2020, 8, 42–49. [Google Scholar] [CrossRef]
  31. Mesin, L.; Valerio, M.; Capizzi, G. Automated diagnosis of encephalitis in pediatric patients using EEG rhythms and slow biphasic complexes. Phys. Eng. Sci. Med. 2020, 43, 997–1006. [Google Scholar] [CrossRef]
  32. Bastos, A.M.; Schoffelen, J.M. A Tutorial Review of Functional Connectivity Analysis Methods and Their Interpretational Pitfalls. Front. Syst. Neurosci. 2016, 9, 175. [Google Scholar] [CrossRef] [PubMed] [Green Version]
  33. Lehembre, R.; Marie-Aurélie, B.; Vanhaudenhuyse, A.; Chatelle, C.; Cologan, V.; Leclercq, Y.; Soddu, A.; Macq, B.; Laureys, S.; Noirhomme, Q. Resting-state EEG study of comatose patients: A connectivity and frequency analysis to find differences between vegetative and minimally conscious states. Funct. Neurol. 2012, 27, 41–47. [Google Scholar] [PubMed]
  34. Lachaux, J.P.; Rodriguez, E.; Martinerie, J.; Varela, F.J. Measuring phase synchrony in brain signals. Hum. Brain Mapp. 1999, 8, 194–208. [Google Scholar] [CrossRef] [Green Version]
  35. Granger, C.W.J. Investigating causal relations by econometric models and cross-spectral methods. Econometrica 1969, 37, 424–438. [Google Scholar] [CrossRef]
  36. Wang, H.E.; Bénar, C.G.; Quilichini, P.P.; Friston, K.J.; Jirsa, V.K.; Bernard, C. A systematic framework for functional connectivity measures. Front. Neurosci. 2014, 8, 405. [Google Scholar] [CrossRef]
  37. Ismail, L.E.; Karwowski, W. A Graph Theory-Based Modeling of Functional Brain Connectivity Based on EEG: A Systematic Review in the Context of Neuroergonomics. IEEE Access 2020, 8, 155103–155135. [Google Scholar] [CrossRef]
  38. Boashash, B.; Azem, G. A review of time–frequency matched filter design with application to seizure detection in multichannel newborn EEG. Digit. Signal Process. 2014, 28, 28–38. [Google Scholar] [CrossRef]
  39. Stamoulis, C.; Richardson, A.G. Application of matched filtering to identify behavioral modulation of brain oscillations. J. Comput. Neurosci. 2010, 29, 63–72. [Google Scholar] [CrossRef] [PubMed] [Green Version]
  40. Rubinov, M.; Sporns, O. Complex network measures of brain connectivity: Uses and interpretations. Neuroimage 2010, 52, 1059–1069. [Google Scholar] [CrossRef]
  41. Watts, D.; Strogatz, S. Collective dynamics of ‘small-world’ networks. Nature 1998, 393, 440–442. [Google Scholar] [CrossRef]
  42. Latora, V.; Marchiori, M. Efficient behavior of small-world networks. Phys. Rev. Lett. 2001, 87, 198701. [Google Scholar] [CrossRef] [Green Version]
  43. Scheirer, C.J.; Ray, W.S.; Hare, N. The analysis of ranked data derived from completely randomized factorial designs. Biometrics 1976, 32, 429–434. [Google Scholar] [CrossRef]
  44. Adamczyk, M.; Genzel, L.; Dresler, M.; Steiger, A.; Friess, F. Automatic sleep spindle detection and genetic influence estimation using continuous wavelet transform. Front. Hum. Neurosci. 2015, 19, 624. [Google Scholar] [CrossRef]
  45. Amodio, P.; Marchetti, P.; Del Piccolo, F.; de Tourtchaninoff, M.; Varghese, P.; Zuliani, C.; Campo, G.; Gatta, A.; Guérit, J.M. Spectral versus visual EEG analysis in mild hepatic encephalopathy. Clin. Neurophysiol. 1999, 110, 1334–1344. [Google Scholar] [CrossRef]
  46. Azuma, H.; Hori, S.; Nakanishi, M.; Fujimoto, S.; Ichikawa, N.; Furukawa, T.A. An intervention to improve the interrater reliability of clinical EEG interpretations. Psychiatry Clin. Neurosci. 2003, 57, 485–489. [Google Scholar] [CrossRef]
  47. Ji, Z.; Sugi, T.; Goto, S.; Wang, X.; Ikeda, A.; Nagamine, T.; Shibasaki, H.; Nakamura, M. An automatic spike detection system based on elimination of false positives using the large–area context in the scalp EEG. IEEE Trans. Biomed. Eng. 2011, 58, 2478–2488. [Google Scholar]
  48. Mohammad, S.S.; Soe, S.M.; Pillai, S.C.; Nosadini, M.; Barnes, E.H.; Gill, D.; Dale, R.C. Etiological associations and outcome predictors of acute electroencephalography in childhood encephalitis. Clin. Neurophysiol. 2016, 127, 3217–3224. [Google Scholar] [CrossRef]
  49. Scheuer, M.L.; Bagic, A.; Wilson, S.B. Spike detection: Inter–reader agreement and a statistical Turing test on a large data set. Clin. Neurophysiol. 2017, 128, 243–250. [Google Scholar] [CrossRef] [Green Version]
  50. Stevenson, N.J.; Korotchikova, I.; Temko, A.; Lightbody, G.; Marnane, W.P.; Boylan, G.B. An automated system for grading EEG abnormality in term neonates with hypoxic-ischaemic encephalopathy. Ann. Biomed. Eng. 2013, 41, 775–785. [Google Scholar] [CrossRef] [Green Version]
  51. Stroink, H.; Schimsheimer, R.J.; de Weerd, A.W.; Geerts, A.T.; Arts, W.F.; Peeters, E.A.; Brouwer, O.F.; Boudewijn Peters, A.; van Donselaar, C.A. Interobserver reliability of visual interpretation of electroencephalograms in children with newly diagnosed seizures. Dev. Med. Child. Neurol. 2006, 48, 374–377. [Google Scholar] [CrossRef]
  52. Cooray, G.K.; Sengupta, B.; Douglas, P.; Englund, M.; Wickstrom, R.; Friston, K. Characterising seizures in anti–NMDA–receptor encephalitis with dynamic causal modelling. Neuroimage 2015, 118, 508–519. [Google Scholar] [CrossRef] [Green Version]
  53. Dobleand, M.; Narayan, S.K. Mathematical analysis of EEG of patients with non–fatal nonspecific diffuse encephalitis. Int. J. Biol. Med. Sci. 2008, 3, 4. [Google Scholar]
  54. Beaumanoir, A.; Magistris, M.; Nahory, A. Sporadic slow biphasic complex: Description and clinical correlations. Electroenceph. Clin. Neurophysiol. 1985, 61, S142. [Google Scholar] [CrossRef]
  55. Bassett, D.S.; Bullmore, E.T. Small-World Brain Networks Revisited. Neuroscientist 2017, 23, 499–516. [Google Scholar] [CrossRef] [Green Version]
  56. Liao, X.; Vasilakos, A.V.; He, Y. Small-world human brain networks: Perspectives and challenges. Neurosci. Biobehav. Rev. 2017, 77, 286–300. [Google Scholar] [CrossRef]
Figure 1. Evaluation of four topological indexes in three different frequency ranges for each sliding window of 3 s with a 95% overlap. (A) Signal before the SBC in blue, During–SBC in green (with the identified SBC circled in purple) and after the SBC in red. Blue and red signals can be considered as Far–SBC. (B) Trend of four topological indexes computed in each sliding window; the asterisk represents a significant difference (Wilcoxon rank sum test, p-value < 0.05) between the distributions of values computed in Far–SBC and During–SBC conditions (indicated in blue and red color, respectively).
Electronics 10 02978 g001
Figure 2. Distribution of strength index estimated in During–SBC and Far–SBC conditions, for various rhythms and EEG traces showing different pathological conditions. Each box and whiskers plot shows the distribution of a set of recordings of different patients with a specific severity condition reported in the x-axis (−1 indicates all the recordings grouped, independently from the patients clinical condition). Different background colors represent different frequency ranges: yellow for delta rhythm, red for theta, green for alpha and blue for the delta–theta blended frequency range. Double asterisks (**) highlight strong statistical differences (p < 0.01) between the During-SBC and the correspondent Far–SBC distributions (paired comparisons) for each frequency band, considering all the subjects’ recordings together.
Electronics 10 02978 g002
Figure 3. Distribution of clustering coefficient (same format as Figure 2).
Electronics 10 02978 g003
Figure 4. Distribution of efficiency (same format as Figure 2).
Electronics 10 02978 g004
Figure 5. Distribution of lambda, i.e., the characteristic path length of the network (same format as Figure 2).
Electronics 10 02978 g005
Publisher’s Note: MDPI stays neutral with regard to jurisdictional claims in published maps and institutional affiliations.

