
Data Mining to Identify Anomalies in Public Procurement Rating Parameters


Abstract
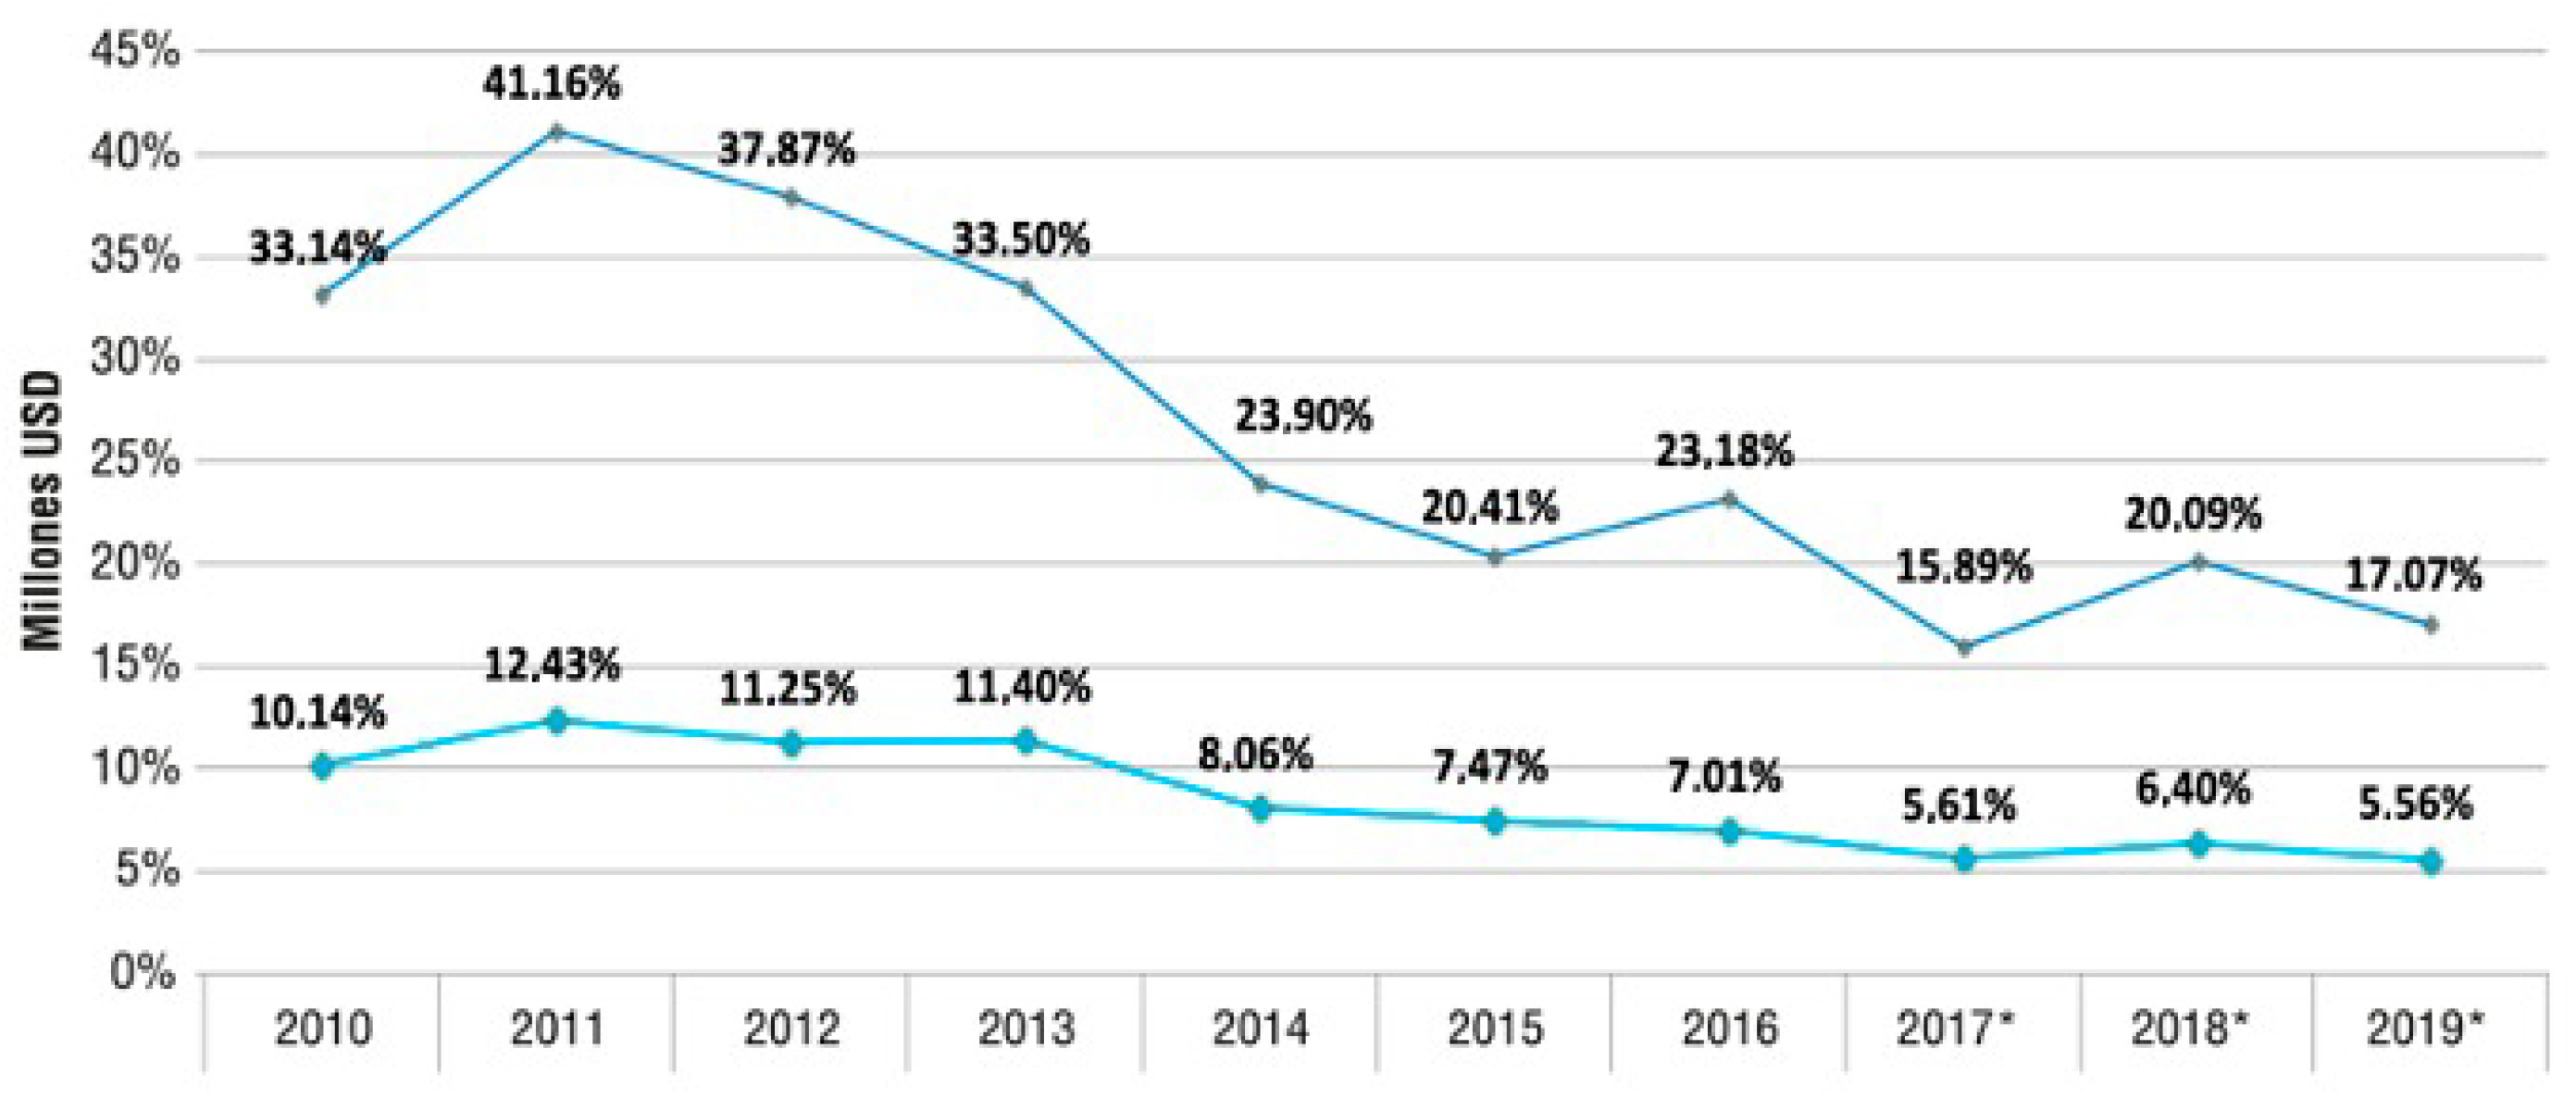
1. Introduction
- Execution of works.
- Purchase of products and services.
- Consultancy contracting
2. Methodology
2.1. Data Set Description
2.2. Data Pre-Processing
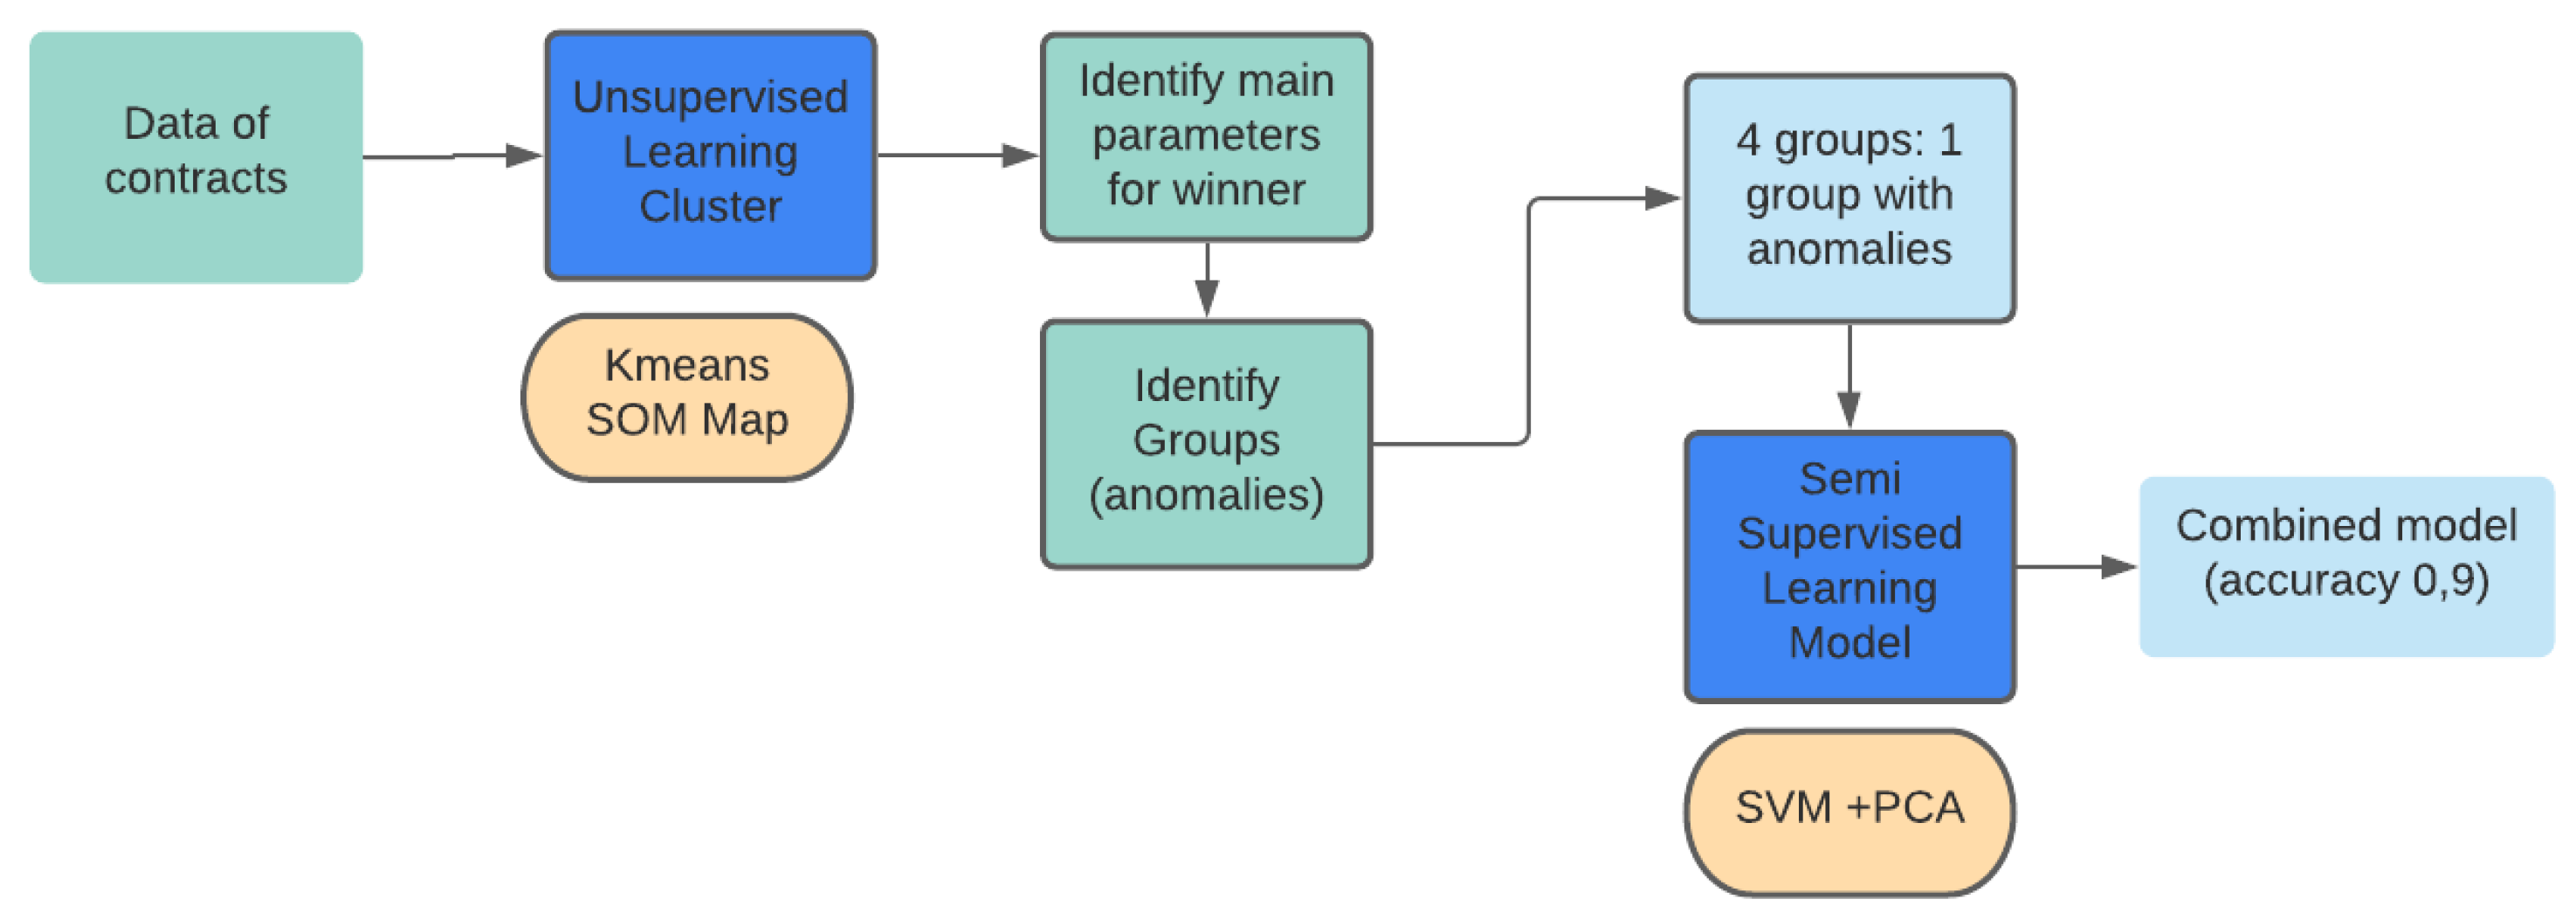
2.3. Proposed System
2.4. Training and Learning Phase
2.4.1. Self-Organizing Maps
2.4.2. Clustering Algorithm
2.4.3. Support Vector Machine
2.4.4. Principal Component Analysis
2.5. Tools
3. Experimental Results
3.1. System Implementation
3.2. Unsupervised Learning Cluster
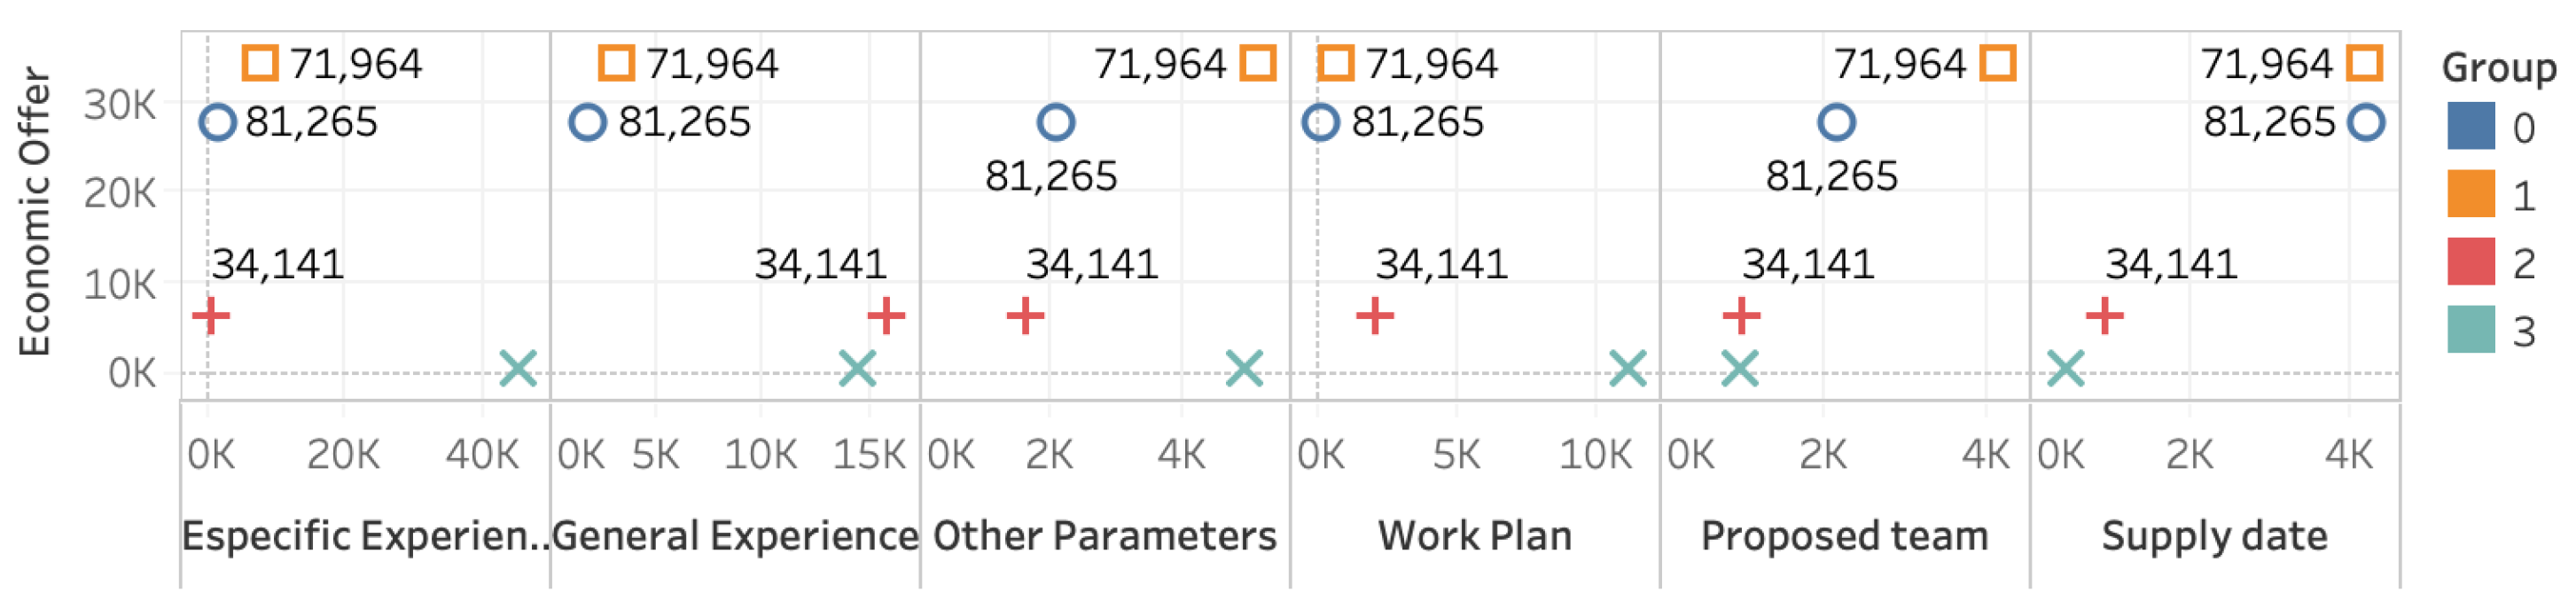
3.3. Cluster Analysis for Process Variables Not Involved in Purchasing Qualifications
3.4. Semi-Supervised Learning Model
4. Discussion and Conclusions
5. Future Work
Author Contributions
Funding
Data Availability Statement
Conflicts of Interest
References
- Bramoullé, Y.; Goyal, S. Favoritism. J. Dev. Econ. 2016, 122, 16–27. [Google Scholar] [CrossRef]
- Martinez Fernandez, J.M. Transparencia Versus Corrupción en la Contratación pública. Medidas de Transparencia en Todas las Fases de la Contratación Pública Como Antídoto Contra la Corrupción. 2015. Available online: https://dialnet.unirioja.es/servlet/dctes?codigo=50035 (accessed on 1 October 2021).
- Cordova Vinueza, J.; Vaca Ojeda, P.; Hernandez Jaramillo, M. Las Compras Gubernamentales como Política Pública; Servicio Nacional de Contratación Pública-SERCOP: Quito, Ecuador, 2015; p. 43. [Google Scholar]
- Dávid-Barrett, E.; Fazekas, M. Grand corruption and government change: An analysis of partisan favoritism in public procurement. Eur. J. Crim. Policy Res. 2020, 26, 411–430. [Google Scholar] [CrossRef]
- Servicio Nacional de Contratacion Publica del Ecuador. Análisis Anual de Contratación Pública. 2020. Available online: https://portal.compraspublicas.gob.ec/sercop/wp-content/uploads/2020/01/analisisanual20192.pdf (accessed on 1 October 2021).
- Hermawati, F.A. Data Mining. Min. Massive Datasets 2005, 2, 5–20. [Google Scholar] [CrossRef]
- Ferreira, I.; Camões, P.J.; Cunha, S.; Amaral, L.A. Electronic platforms and transparency in public procurement. In Proceedings of the 30th International Business Information Management Association Conference, IBIMA 2017-Vision 2020: Sustainable Economic Development, Innovation Management, and Global Growth, Madrid, Spain, 8–9 November 2017; Volume 2017, pp. 3898–3906. [Google Scholar]
- Hyytinen, A.; Lundberg, S.; Toivanen, O. Politics and Procurement: Evidence from Cleaning Contracts. SSRN Electron. J. 2011, 233. [Google Scholar] [CrossRef]
- Auriol, E.; Straub, S.; Flochel, T. Public Procurement and Rent-Seeking: The Case of Paraguay. World Dev. 2016, 77, 395–407. [Google Scholar] [CrossRef]
- Alzate, C.; Monreale, A.; Assem, H.; Bifet, A.; Sandra Buda, T.; Caglayan, B.; Drury, B.; García-Martín, E.; Gavaldà, R.; Kramer, S.; et al. SALER: A Data Science Solution to Detect and Prevent Corruption in Public Administration; Springer: London, UK, 2019; pp. 103–117. [Google Scholar] [CrossRef]
- Kehler, M.E.K.; Paciello, J.; Fernandez, J.I.P. Anomaly Detection in Public Procurements using the Open Contracting Data Standard. In Proceedings of the 2020 Seventh International Conference on eDemocracy & eGovernment (ICEDEG), Buenos Aires, Argentina, 22–24 April 2020. [Google Scholar]
- Liu, F.T.; Ting, K.M.; Zhou, Z.H. Isolation forest. In Proceedings of the IEEE International Conference on Data Mining ICDM, Sorrento, Italy, 15–19 December 2008; pp. 413–422. [Google Scholar] [CrossRef]
- Wirth, R.; Hipp, J. CRISP-DM: Towards a standard process model for data mining. In Proceedings of the 4th International Conference on the Practical Applications of Knowledge Discovery and Data Mining; Springer: London, UK, 2000; pp. 29–39. [Google Scholar]
- Torres Berru, Y.; López Batista, V.F.; Torres-Carrión, P.; Jimenez, M.G. Artificial Intelligence Techniques to Detect and Prevent Corruption in Procurement: A Systematic Literature Review. In Communications in Computer and Information Science; Springer: London, UK, 2020; Volume 1194, pp. 254–268. [Google Scholar] [CrossRef]
- Saurkar, A.V.; Gode, S.A. An Overview On Web Scraping Techniques And Tools. Int. J. Future Revolut. Comput. Sci. Commun. Eng. 2018, 4, 363–367. [Google Scholar]
- Chu, X.; Ilyas, I.F.; Krishnan, S.; Wang, J. Data cleaning: Overview and emerging challenges. In Proceedings of the ACM SIGMOD International Conference on Management of Data; Association for Computing Machinery: New York, NY, USA, 2016; Volume 26, pp. 2201–2206. [Google Scholar] [CrossRef]
- Akinduko, A.A.; Mirkes, E.M. Initialization of Self-Organizing Maps: Principal Components Versus Random Initialization. A Case Study. 2012. Available online: http://xxx.lanl.gov/abs/1210.5873 (accessed on 1 October 2021).
- Ultsch, A.; Mörchen, F. ESOM-Maps: Tools for Clustering, Visualization, and Classification with Emergent SOM; Technical Report Dept. of Mathematics and Computer Science, University of Marburg: Marburg, Germany, 2005; pp. 1–7. [Google Scholar]
- Solorio-Fernández, S.; Carrasco-Ochoa, J.A.; Martínez-Trinidad, J.F. A review of unsupervised feature selection methods. Artif. Intell. Rev. 2020, 53, 907–948. [Google Scholar] [CrossRef]
- Guo, J.; Li, T.; Li, Y. SVM Based on Gaussian and Non-Gaussian Double Subspace for Fault Detection. IEEE Access 2021, 9, 66519–66530. [Google Scholar] [CrossRef]
- Kohonen, T. The Self-Organizing Map. Proc. IEEE 1990, 78, 1464–1480. [Google Scholar] [CrossRef]
- Kapil, S.; Chawla, M. Performance evaluation of K-means clustering algorithm with various distance metrics. In Proceedings of the 1st IEEE International Conference on Power Electronics, Intelligent Control and Energy Systems, ICPEICES 2016, Delhi, India, 4–6 July 2016. [Google Scholar] [CrossRef]
- Kotsiantis, S.B. Supervised Machine Learning: A Review of Classification Techniques. Informatica 2007, 160, 3–24. [Google Scholar]
- Vettigli, G. MiniSom, a minimalistic and Numpy based implementation of the Self Organizing Maps Giuseppe. J. Open Source Softw. 2021, 1–2. Available online: http://xxx.lanl.gov/abs/1806.02199 (accessed on 1 October 2021).


| Condition | Description |
|---|---|
| Timeline of the procedure | It emphasises important dates in the process. |
| Duration of the offer | Item used to determine the number of days the process will remain in effect. |
| Purchase price | Is the price of the process (purchase), which the institution lists on the public procurement portal. |
| Type of purchase | The classification used by the institution for the purchase carried out can be: goods, consultancy, work, insurance and service. |
| Recruitment Types | It is the method used to contract the acquisition is classified in: bidding, quotation, special publication, short list and direct contracting. |
| Payment method | The forms of payment are: advance payment, remaining value of the contract and at the end of the contract. |
| Status of the process | Is the state in which the contracting process is currently running two general statuses are obtained: correct (to be awarded, awarded, finalised and in execution) and not executed (unilaterally terminated, terminated by mutual agreement, cancelled and deserted). |
| Parameters | Description |
|---|---|
| General experience | Experience of the bidder in the general domain. |
| Specific experience | Experience in specific projects in the area of sourcing. |
| Similar works | Number of similar projects executed by the supplier. |
| Subcontracting | The supplier is able to partially subcontract the execution of the project. |
| Financial ratios | The solvency and debt ratios of the participating companies are assessed. |
| Methodology, Work Plan | Parameters for evaluating the bidder’s presentation of the project. |
| Supply date | Estimated delivery date stated in the offer. |
| Economic offer | Value submitted by the bidder |
| Proposed team | Characteristics of the team that executes the work. |
| Inclusion parameters | They aim to include people and companies with disabilities. |
| Instruments equipment | Referring to models and brands of the products available. |
| Specification compliance | Technical product specifications and characteristics |
| Technical guarantee | Technical product guarantee. |
| National partnership | Priority is given to international suppliers who partner with local producers. |
| National SMEs | Priority to national micro-enterprises |
| Local participation | Priority to suppliers from the place of purchase |
| Ecuadorian participation | Priority to national companies |
| Bonus awarded by lottery | Bonus awarded by lot in case of a tie between bidders |
| Other qualification parameters | Defined by the procuring entity |
| Variable scoring | According to the requirements presented. |
| Technology transfer | Added value to processes that are born as a technology transfer from educational institutions. |
| Parameter | 1 | 2 | 3 | 4 |
|---|---|---|---|---|
| Instruments-equipment | 0.18% | 0.21% | 1.63% | 4.94% |
| Specification compliance | 46.66% | 1.61% | 5.22% | 3.09% |
| Other qualification parameters | 2.55% | 7.16% | 4.71% | 5.61% |
| Specific experience | 1.83% | 10.73% | 2.66% | 51.03% |
| Similar works | 0.27% | 0.78% | 1.09% | 0.20% |
| General experience | 2.12% | 4.37% | 46.46% | 16.36% |
| Economic offer | 33.99% | 47.43% | 18.63% | 0.45% |
| Proposed team | 2.68% | 5.75% | 2.93% | 1.12% |
| Technical guarantee | 2.22% | 3.72% | 3.42% | 0.59% |
| Supply date | 5.21% | 5.85% | 2.79% | 0.50% |
| Methodology and work plan | 0.17% | 0.95% | 6.00% | 12.70% |
| Number of records | 81,261 | 71,959 | 34,141 | 88,358 |
| Type of Purchase | Equipment | Technical Guarantee | Work Plan | Supply Date | Proposed Team | Other Parameters | General Experience | Specification Compliance | Specific Experience | Economic Offer | Number of Process |
|---|---|---|---|---|---|---|---|---|---|---|---|
| “Moderate Economic offer” Cluster | |||||||||||
| Product | 0.1% | 2.7% | 0.0% | 5.7% | 3.4% | 2.0% | 1.24% | 46.8% | 0.9% | 35% | 46,928 |
| Consultancy | 0.4% | 1.1% | 1.4% | 4.6% | 3.5% | 2.7% | 4.6% | 47.3% | 7.2% | 23.4% | 102 |
| Work | 0.2% | 1.7% | 0.1% | 4.1% | 7.6% | 2.1% | 2.5% | 43.3% | 3.6% | 28.6% | 388 |
| Assurance | 0.0% | 0.4% | 0.1% | 0.2% | 0.5% | 8.6% | 4.6% | 34.2% | 3.8% | 33.2% | 823 |
| Service | 0.2% | 1.3% | 0.3% | 4.7% | 1.5% | 3.1% | 3.3% | 47.3% | 3.0% | 32.7% | 29,187 |
| “High Economic offer” Cluster | |||||||||||
| Product | 0.2% | 8.9% | 2.3% | 11% | 10.5% | 8.9% | 2.2% | 1.79% | 2.9% | 46.8% | 23,024 |
| Consultancy | 0.9% | 1.6% | 3.0% | 10.2% | 8.9% | 16.0% | 1.9% | 1.02% | 8.5% | 37.6% | 59 |
| Work | 0.0% | 0.0% | 0.0% | 0.4% | 2.0% | 1.9% | 5.5% | 0.3% | 17.7% | 47.6% | 14,814 |
| Assurance | 0.0% | 0.2% | 0.0% | 0.0% | 0.8% | 11.8% | 9.1% | 2.4% | 15.1% | 50.4% | 2313 |
| Service | 0.3% | 2.3% | 0.5% | 7.0% | 5.7% | 10.4% | 4.0% | 2.2% | 10.5% | 47.3% | 20,373 |
| “Low Economic offer” Cluster | |||||||||||
| Product | 0.2% | 6.9% | 0.3% | 4.8% | 5.0% | 2.4% | 45.5% | 6.34% | 0.4% | 23.4% | 9932 |
| Consultancy | 5.4% | 0.0% | 22.5% | 0.0% | 0.0% | 9.8% | 48.5% | 0.24% | 8.2% | 0.2% | 5799 |
| Work | 1.1% | 1.3% | 0.5% | 4.3% | 3.7% | 1.3% | 42.6% | 7.58% | 2.2% | 23.8% | 384 |
| Assurance | 0.0% | 1.2% | 0.0% | 0.8% | 2.0% | 14.3% | 32.0% | 11.8% | 4.4% | 19.6% | 72 |
| Service | 0.3% | 3.0% | 0.7% | 2.0% | 2.9% | 3.4% | 46.4% | 7.10% | 0.9% | 25.7% | 14,563 |
| “Null Economic offer” Cluster | |||||||||||
| Product | 0.6% | 4.6% | 0.8% | 3.1% | 7 % | 3.3% | 9.9% | 17.8% | 48.0% | 1.3% | 4866 |
| Consultancy | 5.7% | 0.0% | 15.0% | 0.0% | 0.0% | 5.8% | 18.0% | 0.05% | 51.7% | 0.0% | 49,523 |
| Work | 0.9% | 0.8% | 0.8% | 1.6% | 7.3% | 1.9% | 6.6% | 7.10% | 45.7% | 11.5% | 458 |
| Assurance | 0.0% | 1.1% | 0.0% | 1.1% | 2.9% | 18.6% | 10.3% | 13.8% | 37.6% | 9.7% | 34 |
| Service | 1.3% | 2.7% | 1.9% | 2.6% | 5.3% | 5.4% | 8.6% | 17.0% | 47.6% | 2.3% | 9895 |
| Recruitment Type | Equipment | Technical Guarantee | Work Plan | Supply Date | Proposed Team | Other Parameters | General Experience | Specification Compliance | Specific Experience | Economic Offer | Number of Process |
|---|---|---|---|---|---|---|---|---|---|---|---|
| “Moderate Economic offer” Cluster | |||||||||||
| Quotation | 0.2% | 1.6% | 0.1% | 1.7% | 1.3% | 1.9% | 3.0% | 30.7% | 3.0% | 28.9% | 2423 |
| Bidding | 0.0% | 0.4% | 0.0% | 0.3% | 0.5% | 8.2% | 4.6% | 34.8% | 3.8% | 33.2% | 1105 |
| Special | 0.1% | 2.2% | 0.1% | 5.4% | 2.7% | 2.4% | 2.0% | 47.4% | 1.6% | 34.3% | 76,216 |
| “High Economic offer” Cluster | |||||||||||
| Quotation | 0.1% | 0.1% | 0.0% | 0.4% | 1.6% | 1.9% | 6.5% | 1.5% | 16.3% | 48.0% | 27,233 |
| Bidding | 0.1% | 0.1% | 0.0% | 0.5% | 1.4% | 2.9% | 6.4% | 0.8% | 22.8% | 49.0% | 5950 |
| Assurance bidding | 0.0% | 0.2% | 0.0% | 0.1% | 0.8% | 12.0% | 9.3% | 2.4% | 14.7% | 50.1% | 2913 |
| Special | 0.2% | 7.3% | 1.8% | 11.0% | 10.0% | 11.0% | 1.9% | 1.7% | 4.0% | 46.5% | 35,570 |
| “Low Economic offer” Cluster | |||||||||||
| Direct contracting | 5.6% | 0% | 22.9% | 0.0% | 0.0% | 9.9% | 48.6% | 0.0% | 8.1% | 0.0% | 8120 |
| Special | 0.3% | 4.6% | 0.6% | 3.5% | 3.7% | 3.0% | 46.2% | 6.8% | 0.8% | 24.8% | 24,800 |
| “Null Economic offer” Cluster | |||||||||||
| Direct contracting | 5.9% | 0.0% | 16.0% | 0.0% | 0.0% | 6.0% | 18.1% | 0.0% | 50.3% | 0.0% | 61,722 |
| Short List | 5.2% | 0.0% | 9.0% | 0.0% | 0.0% | 2.5% | 17.2% | 0.0% | 60.9% | 0.0% | 8960 |
| Special | 1.1% | 3.3% | 1.8% | 2.6% | 5.9% | 4.6% | 9.3% | 17.0% | 47.8% | 1.9% | 15,536 |
| Technique | Precision | Recall | AUC | Accuracy | FScore |
|---|---|---|---|---|---|
| SVM | 0.95% | 0.92 | 0.90 | 0.92 | 0.96 |
| PCA | 0.92% | 0.89 | 0.91 | 0.90 | 0.93 |
Publisher’s Note: MDPI stays neutral with regard to jurisdictional claims in published maps and institutional affiliations. |
© 2021 by the authors. Licensee MDPI, Basel, Switzerland. This article is an open access article distributed under the terms and conditions of the Creative Commons Attribution (CC BY) license (https://creativecommons.org/licenses/by/4.0/).
Share and Cite
Torres-Berru, Y.; López Batista, V.F. Data Mining to Identify Anomalies in Public Procurement Rating Parameters. Electronics 2021, 10, 2873. https://doi.org/10.3390/electronics10222873
Torres-Berru Y, López Batista VF. Data Mining to Identify Anomalies in Public Procurement Rating Parameters. Electronics. 2021; 10(22):2873. https://doi.org/10.3390/electronics10222873
Chicago/Turabian StyleTorres-Berru, Yeferson, and Vivian F. López Batista. 2021. "Data Mining to Identify Anomalies in Public Procurement Rating Parameters" Electronics 10, no. 22: 2873. https://doi.org/10.3390/electronics10222873
APA StyleTorres-Berru, Y., & López Batista, V. F. (2021). Data Mining to Identify Anomalies in Public Procurement Rating Parameters. Electronics, 10(22), 2873. https://doi.org/10.3390/electronics10222873