
Prognostics and Health Management of Renewable Energy Systems: State of the Art Review, Challenges, and Trends †


Abstract
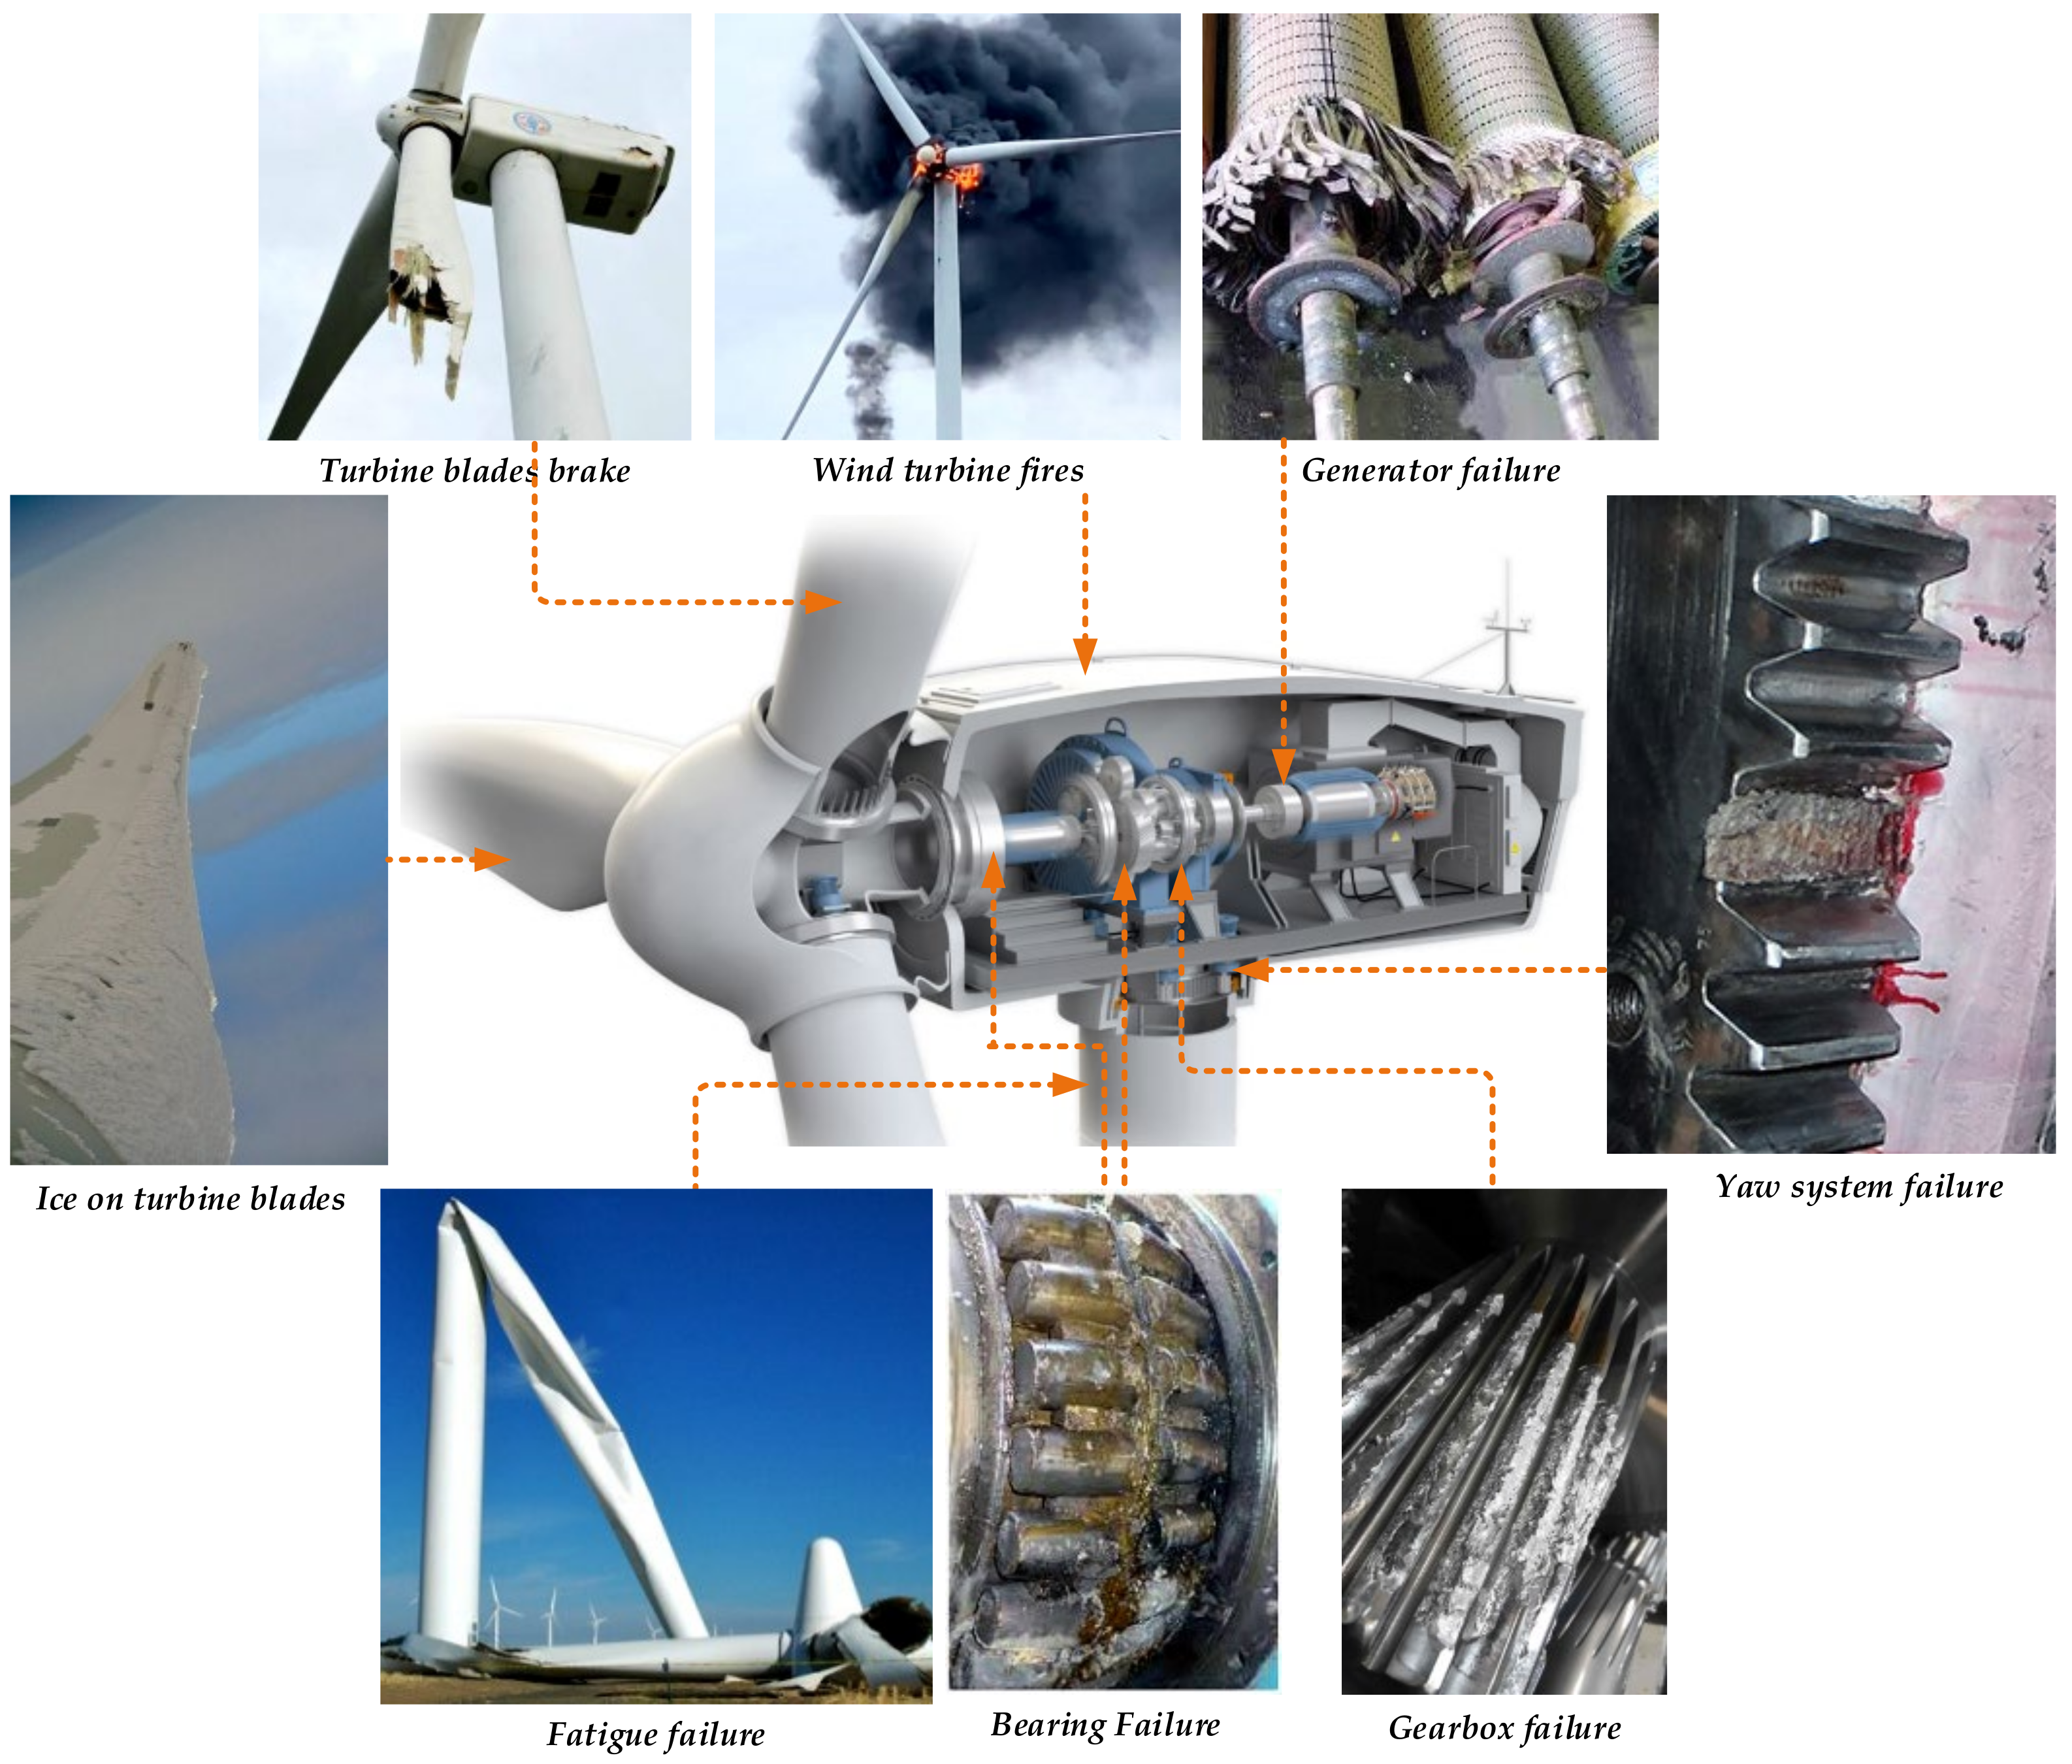
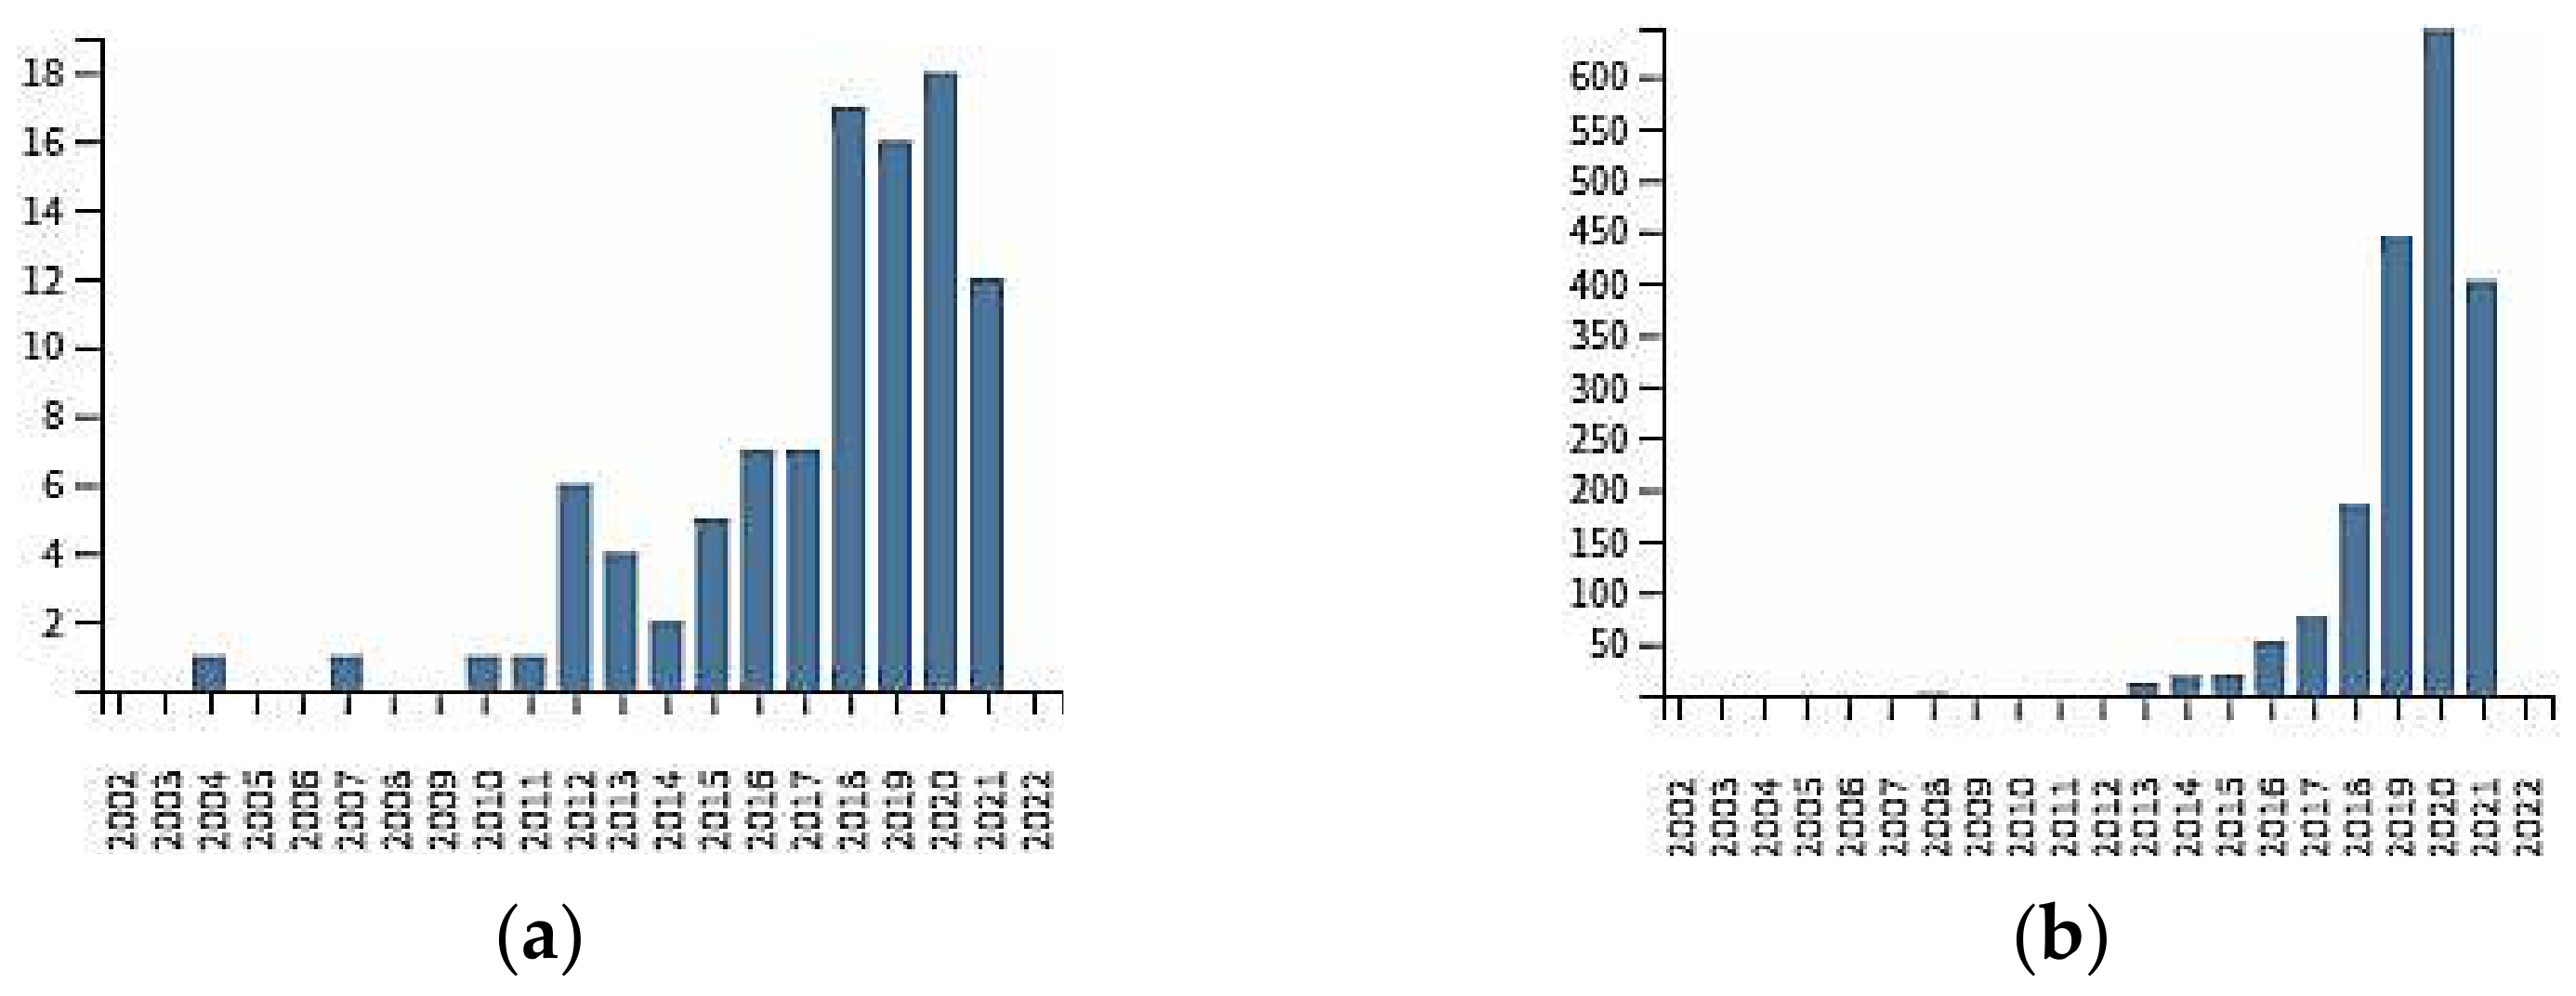
:1. Introduction
2. Prognostics and Health Management
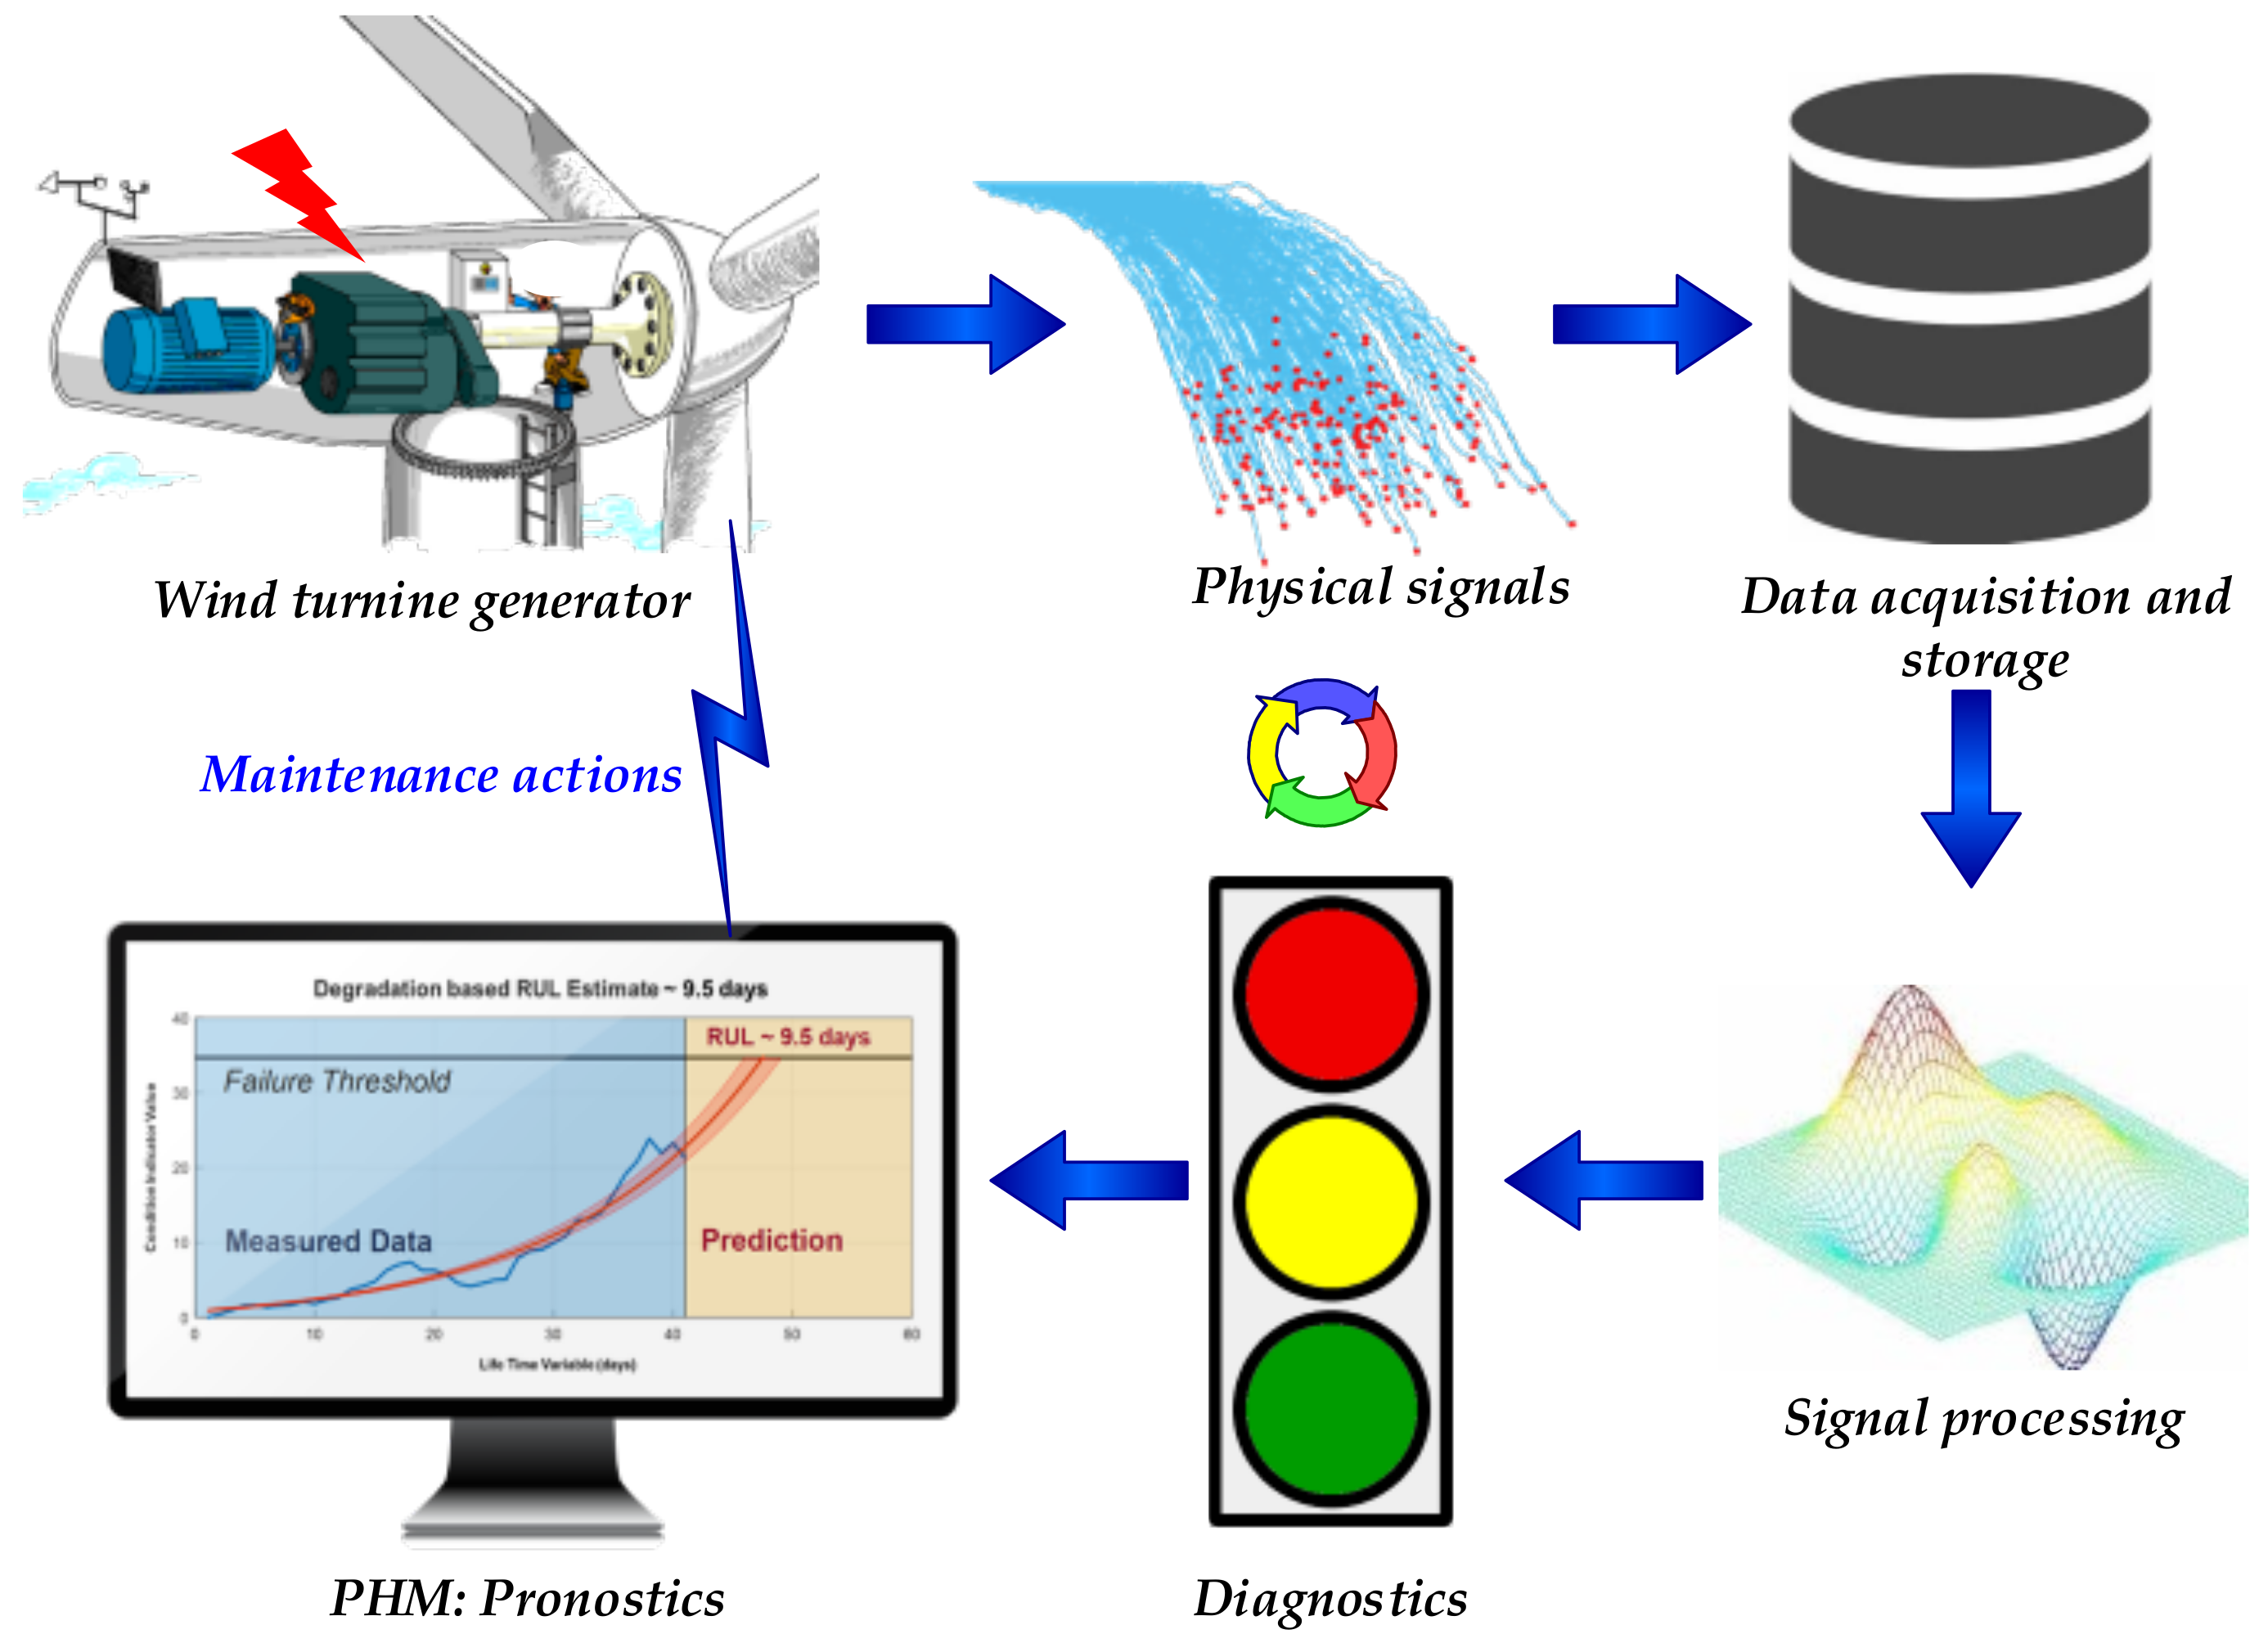
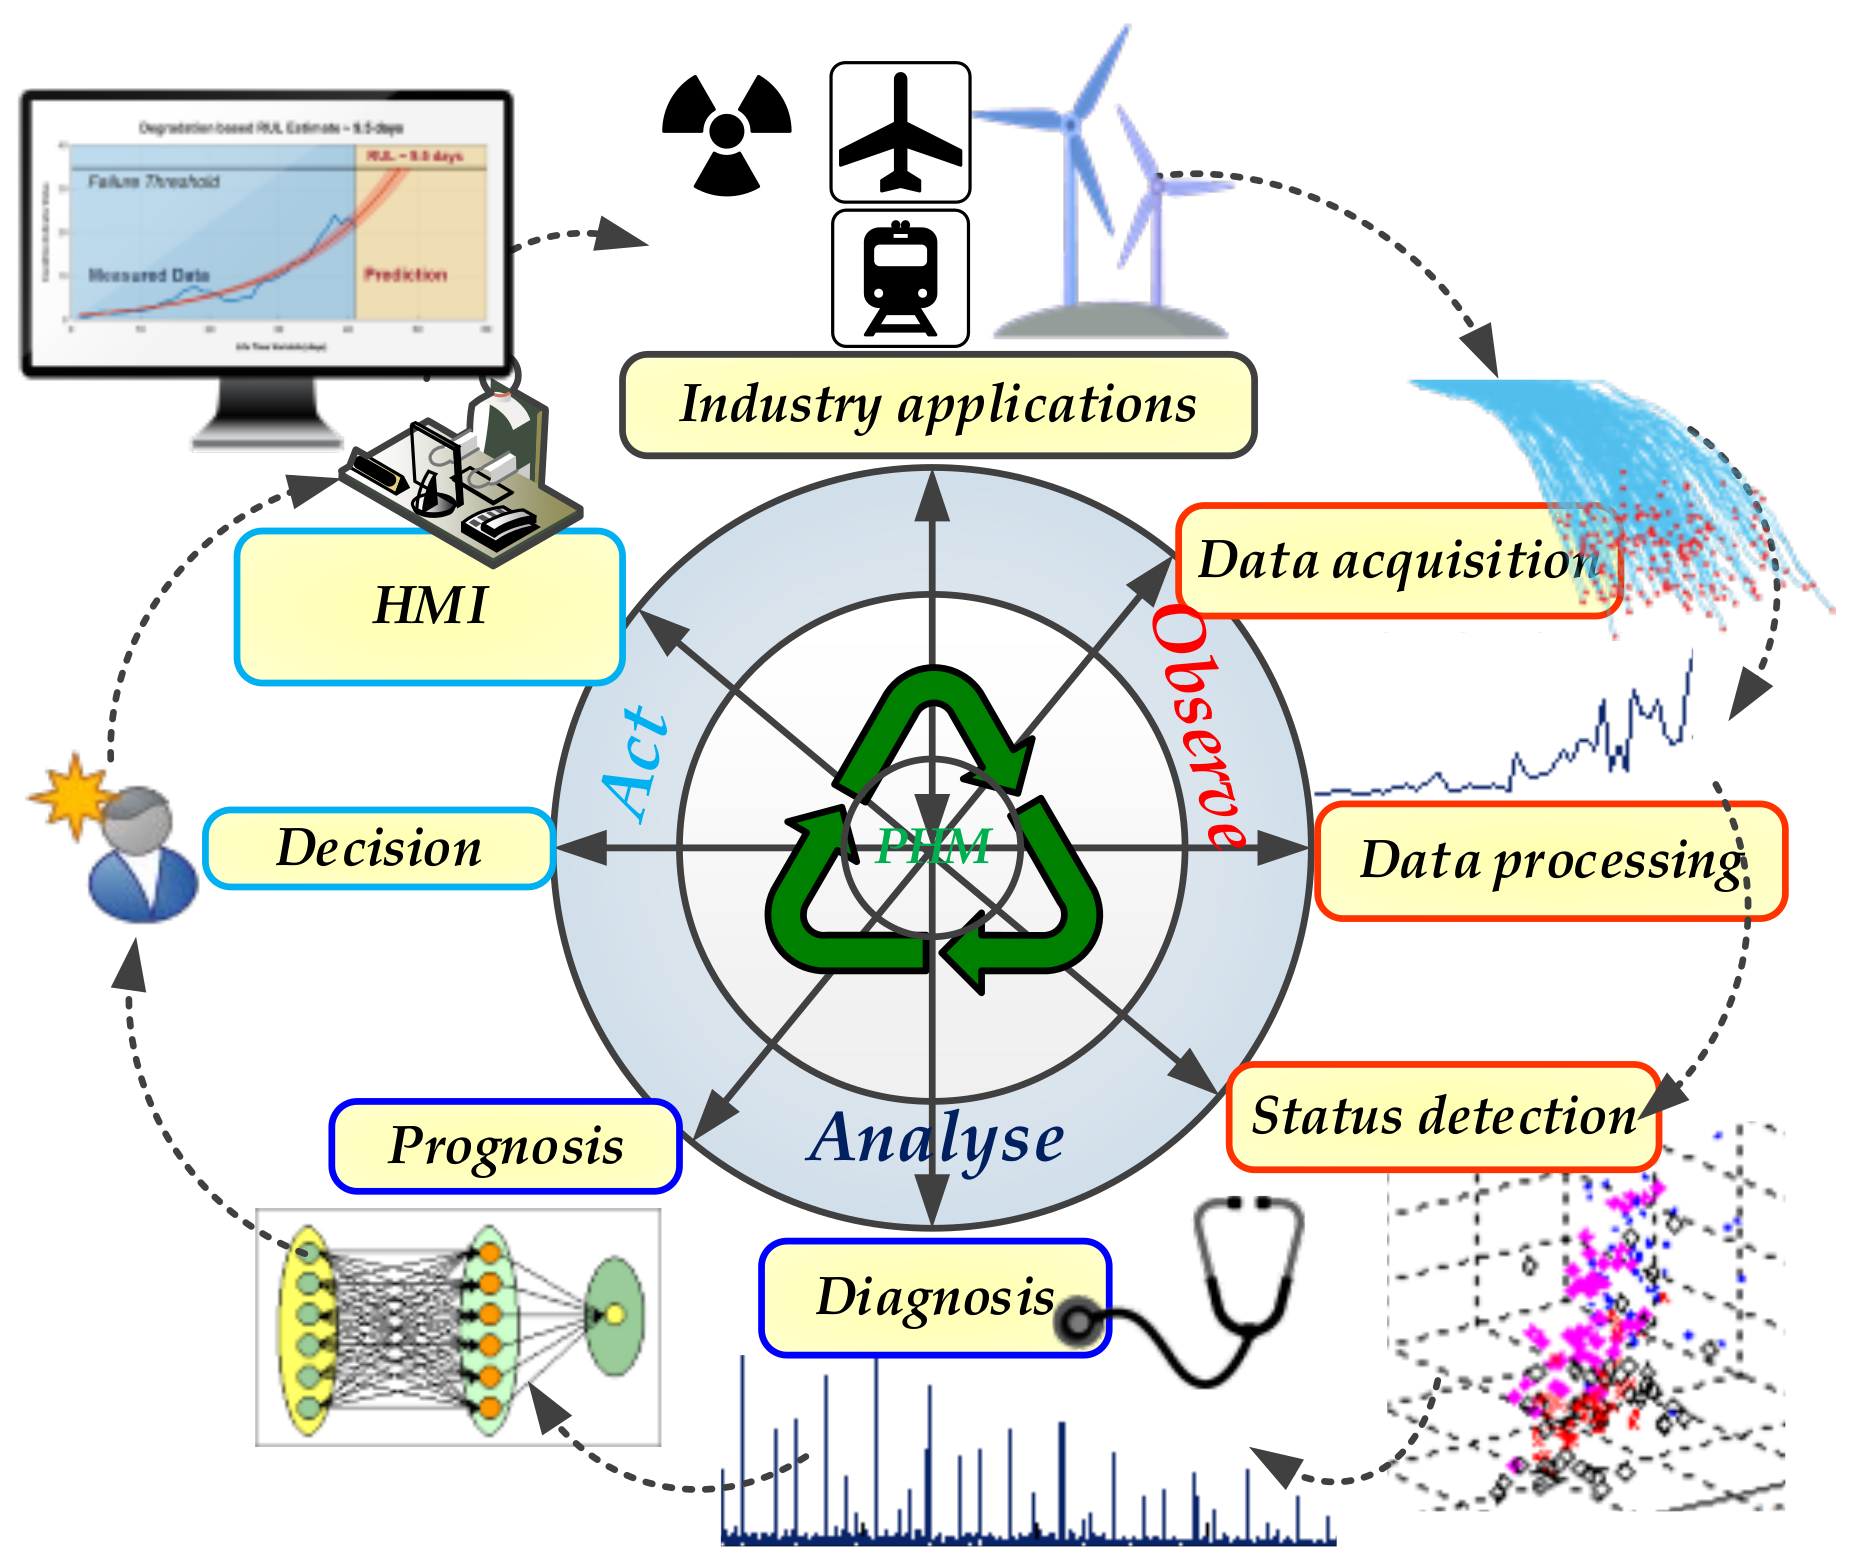
2.1. PHM Cycle
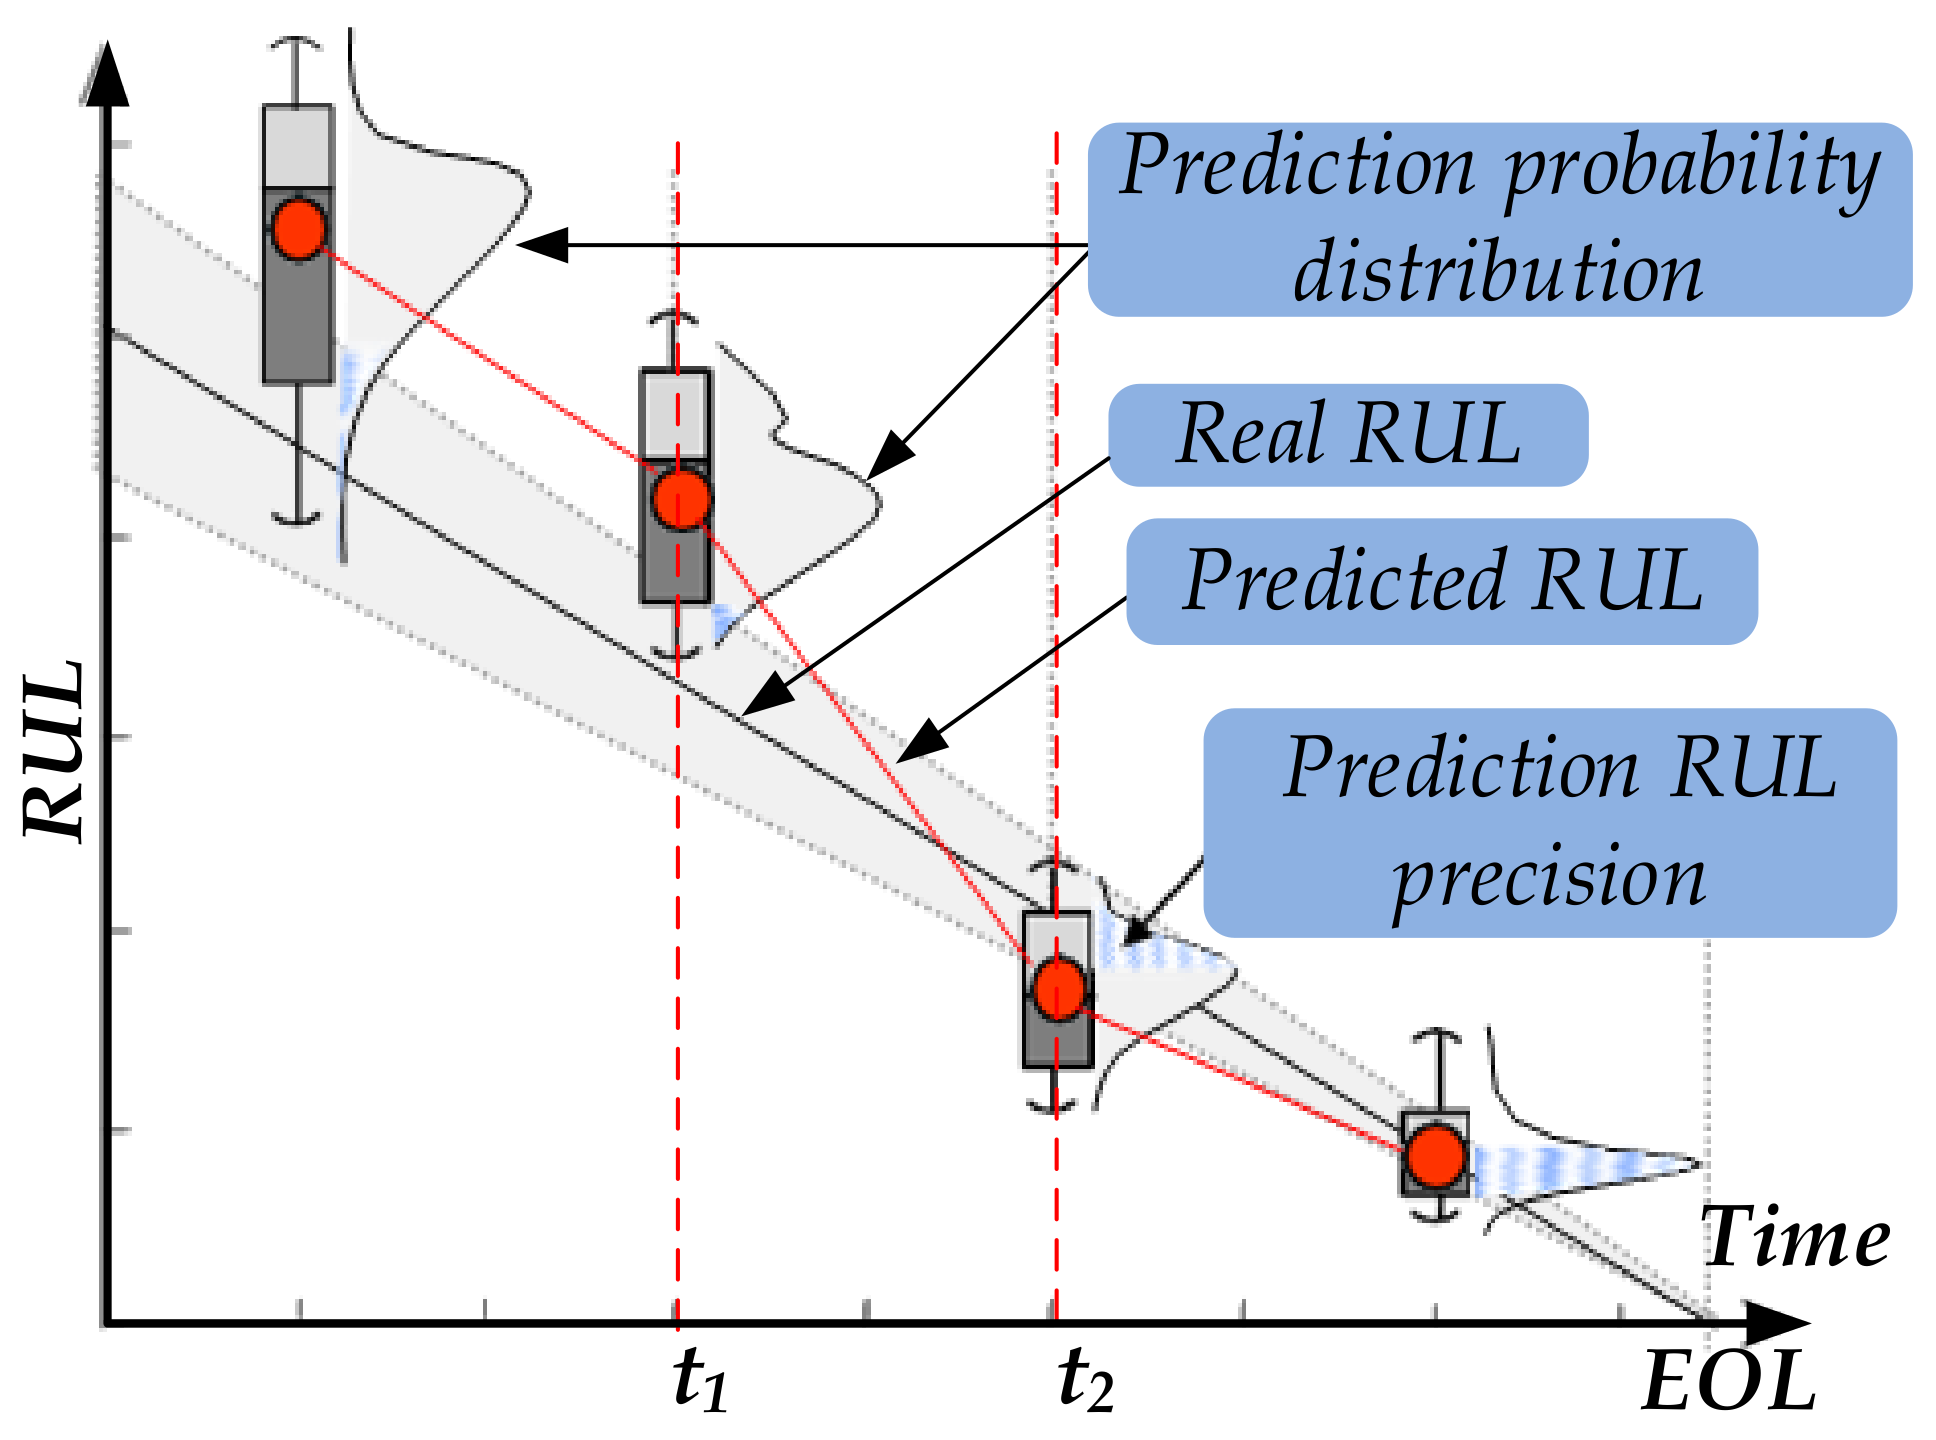
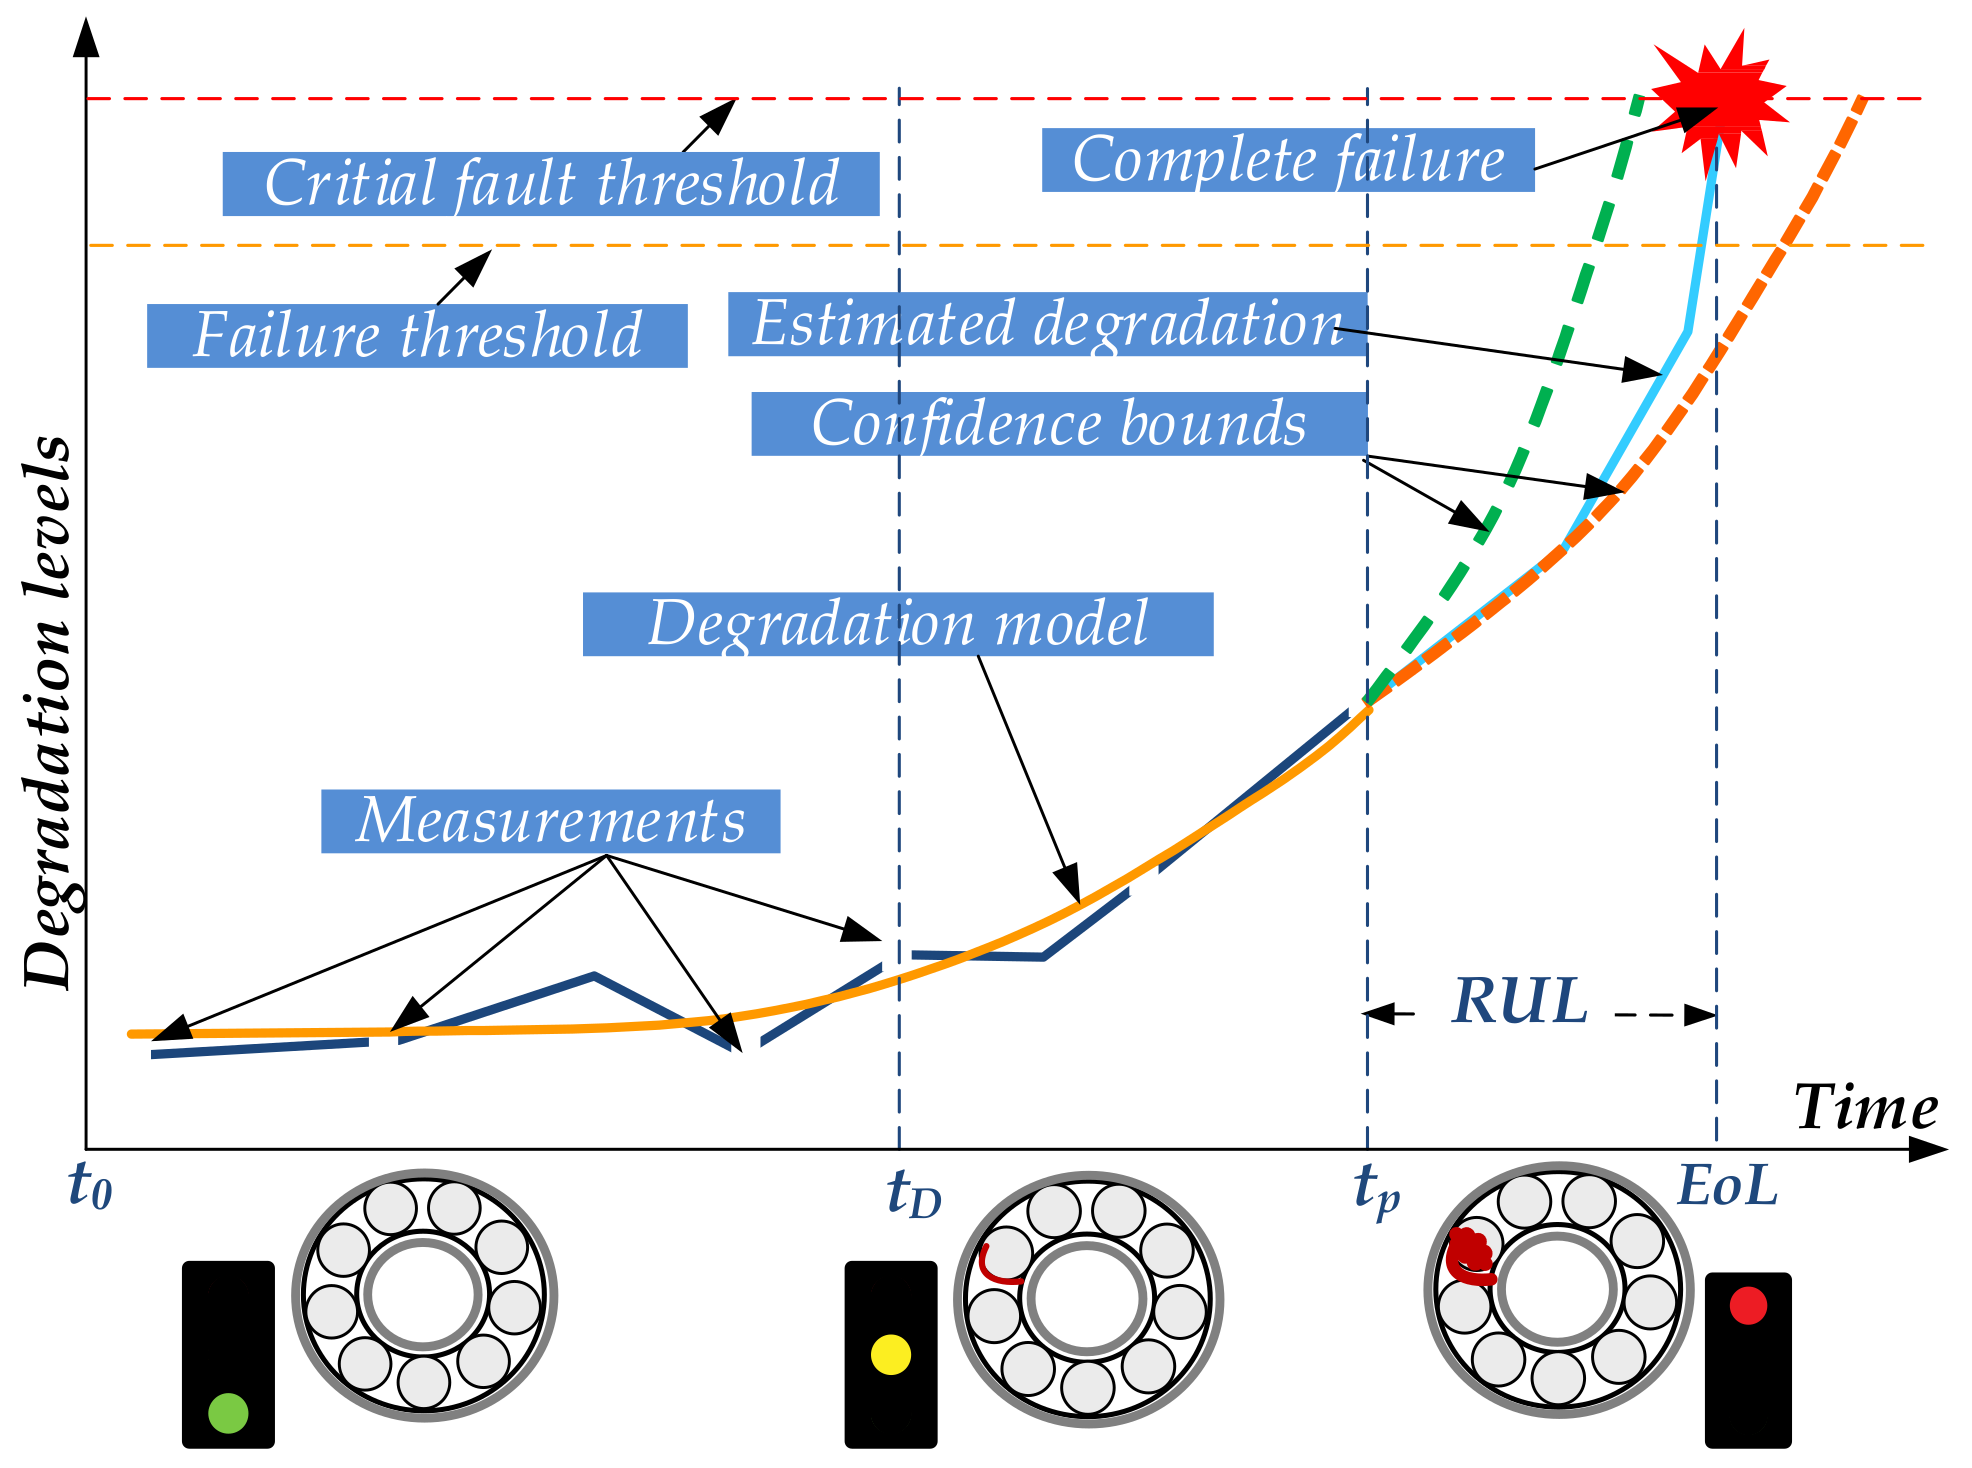
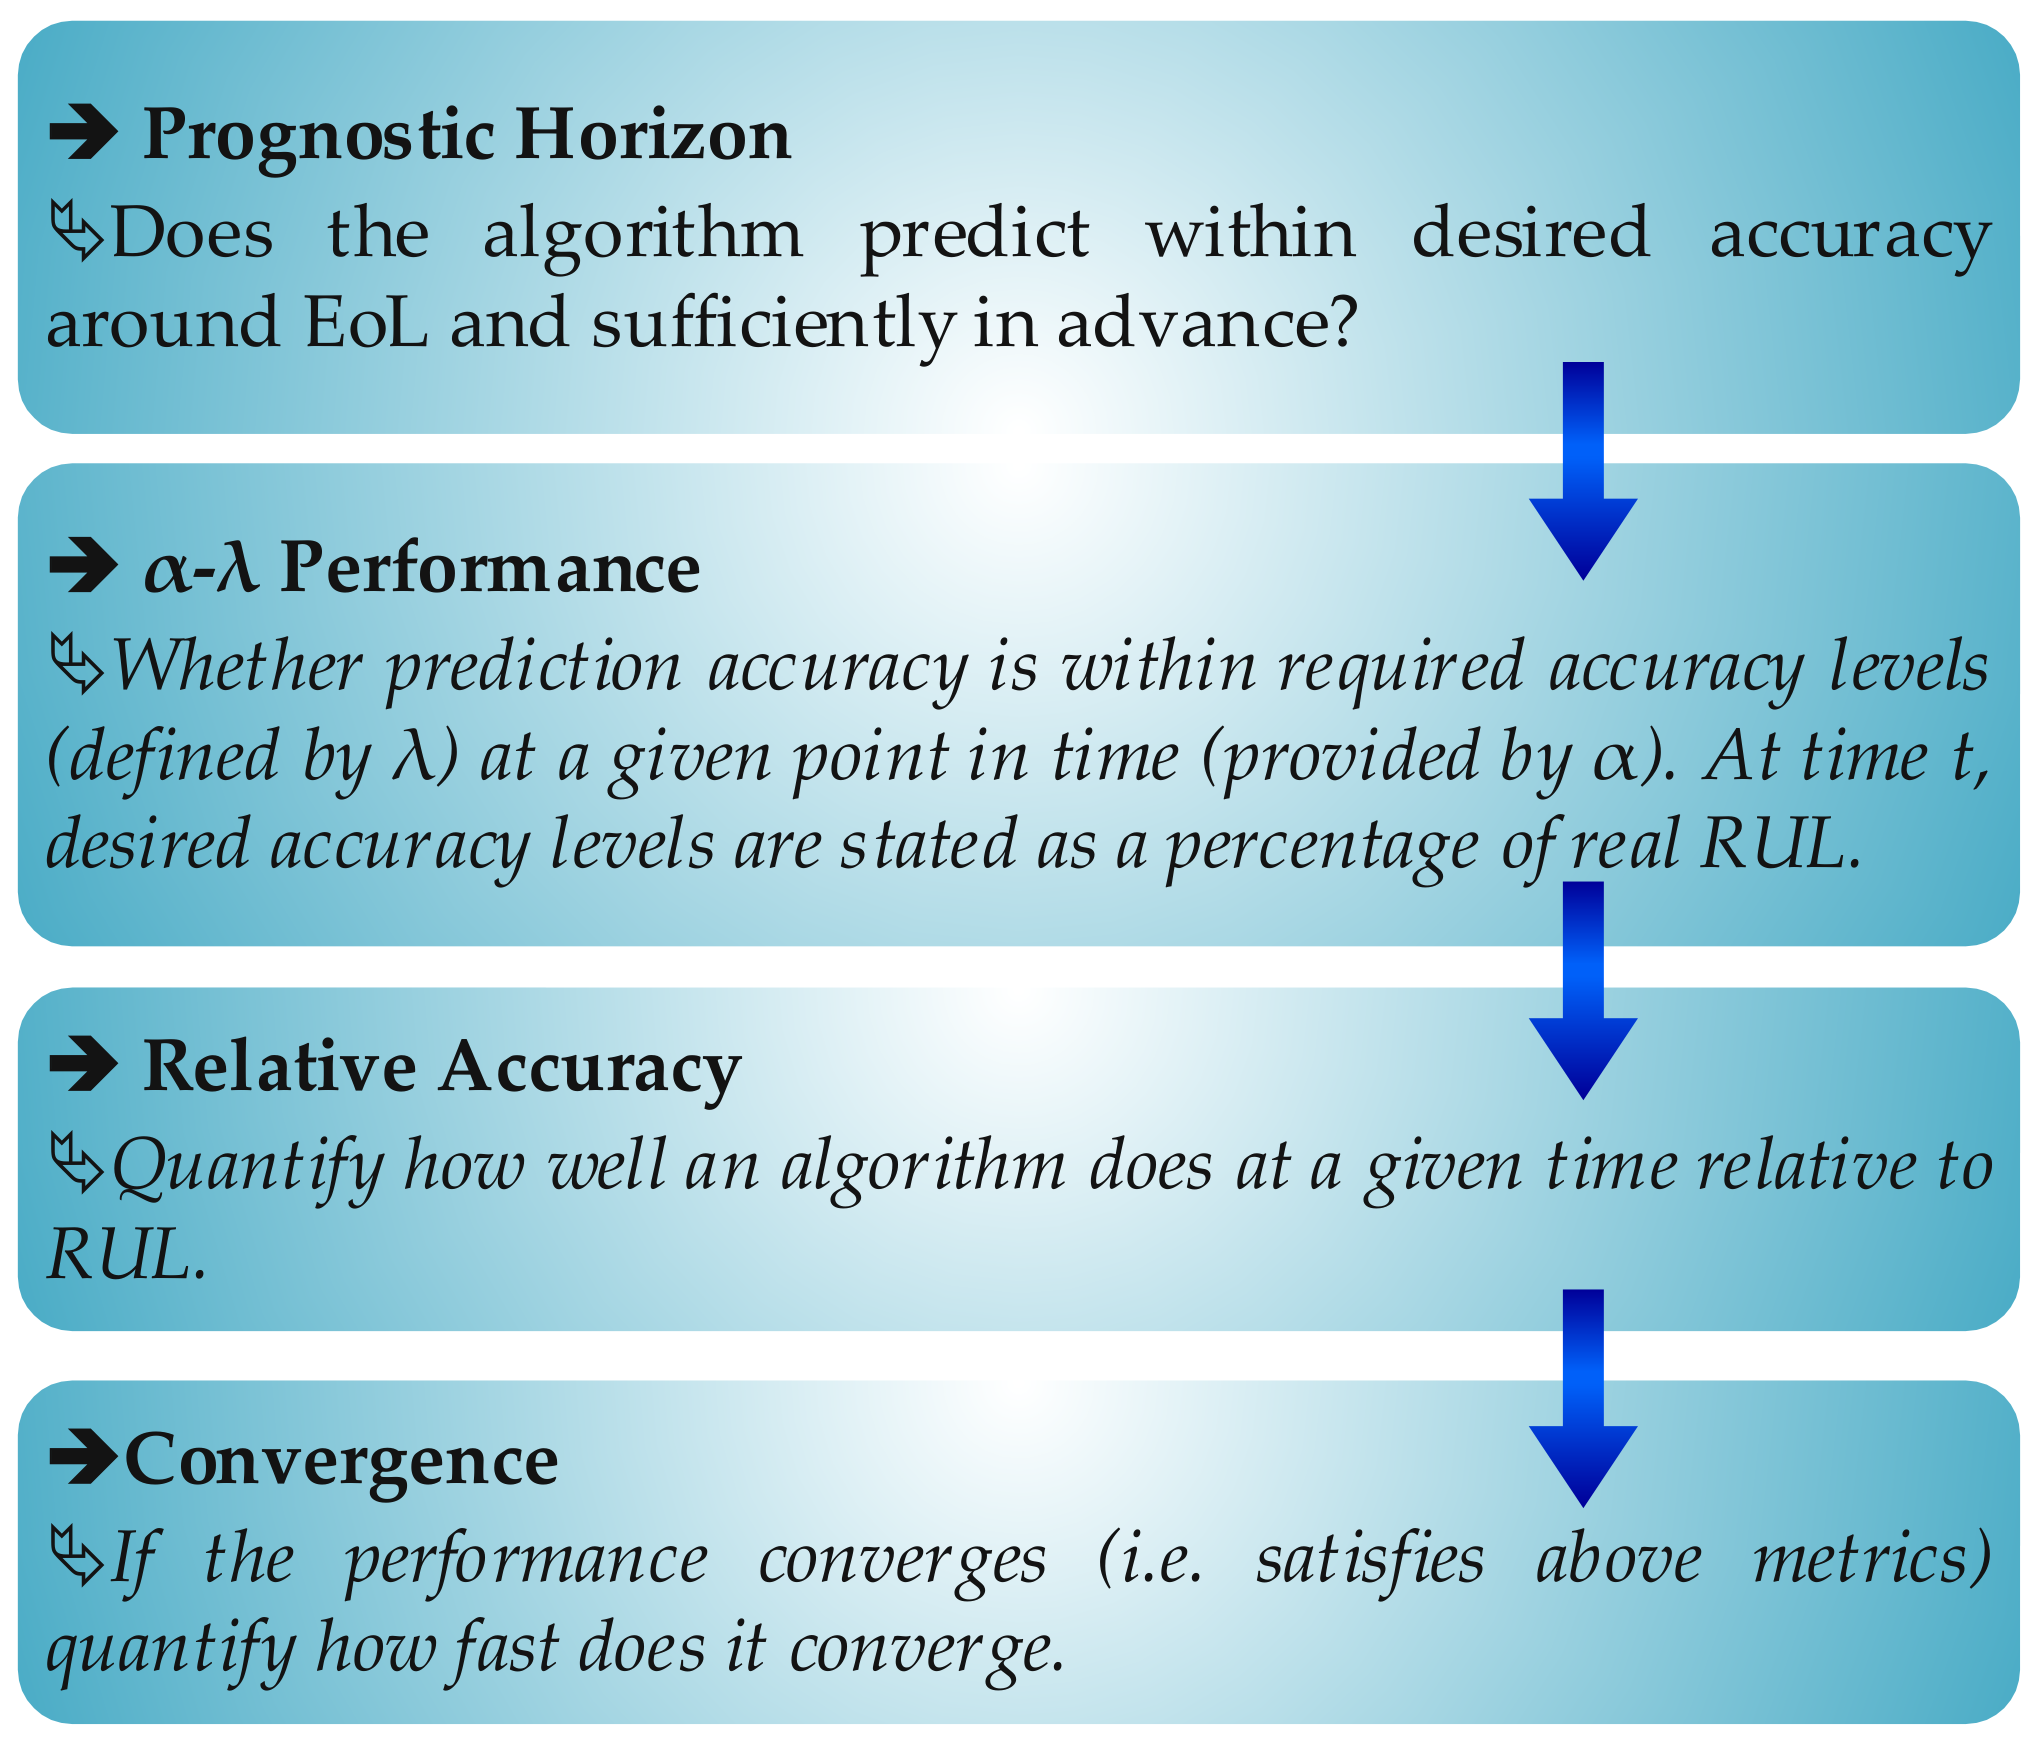
2.2. Prognostic Metrics
3. Review of Prognostics Approaches
3.1. Prognosis Based on Physical Models
3.2. Data-Driven Prognosis
3.3. Hybrid Prognosis
- -
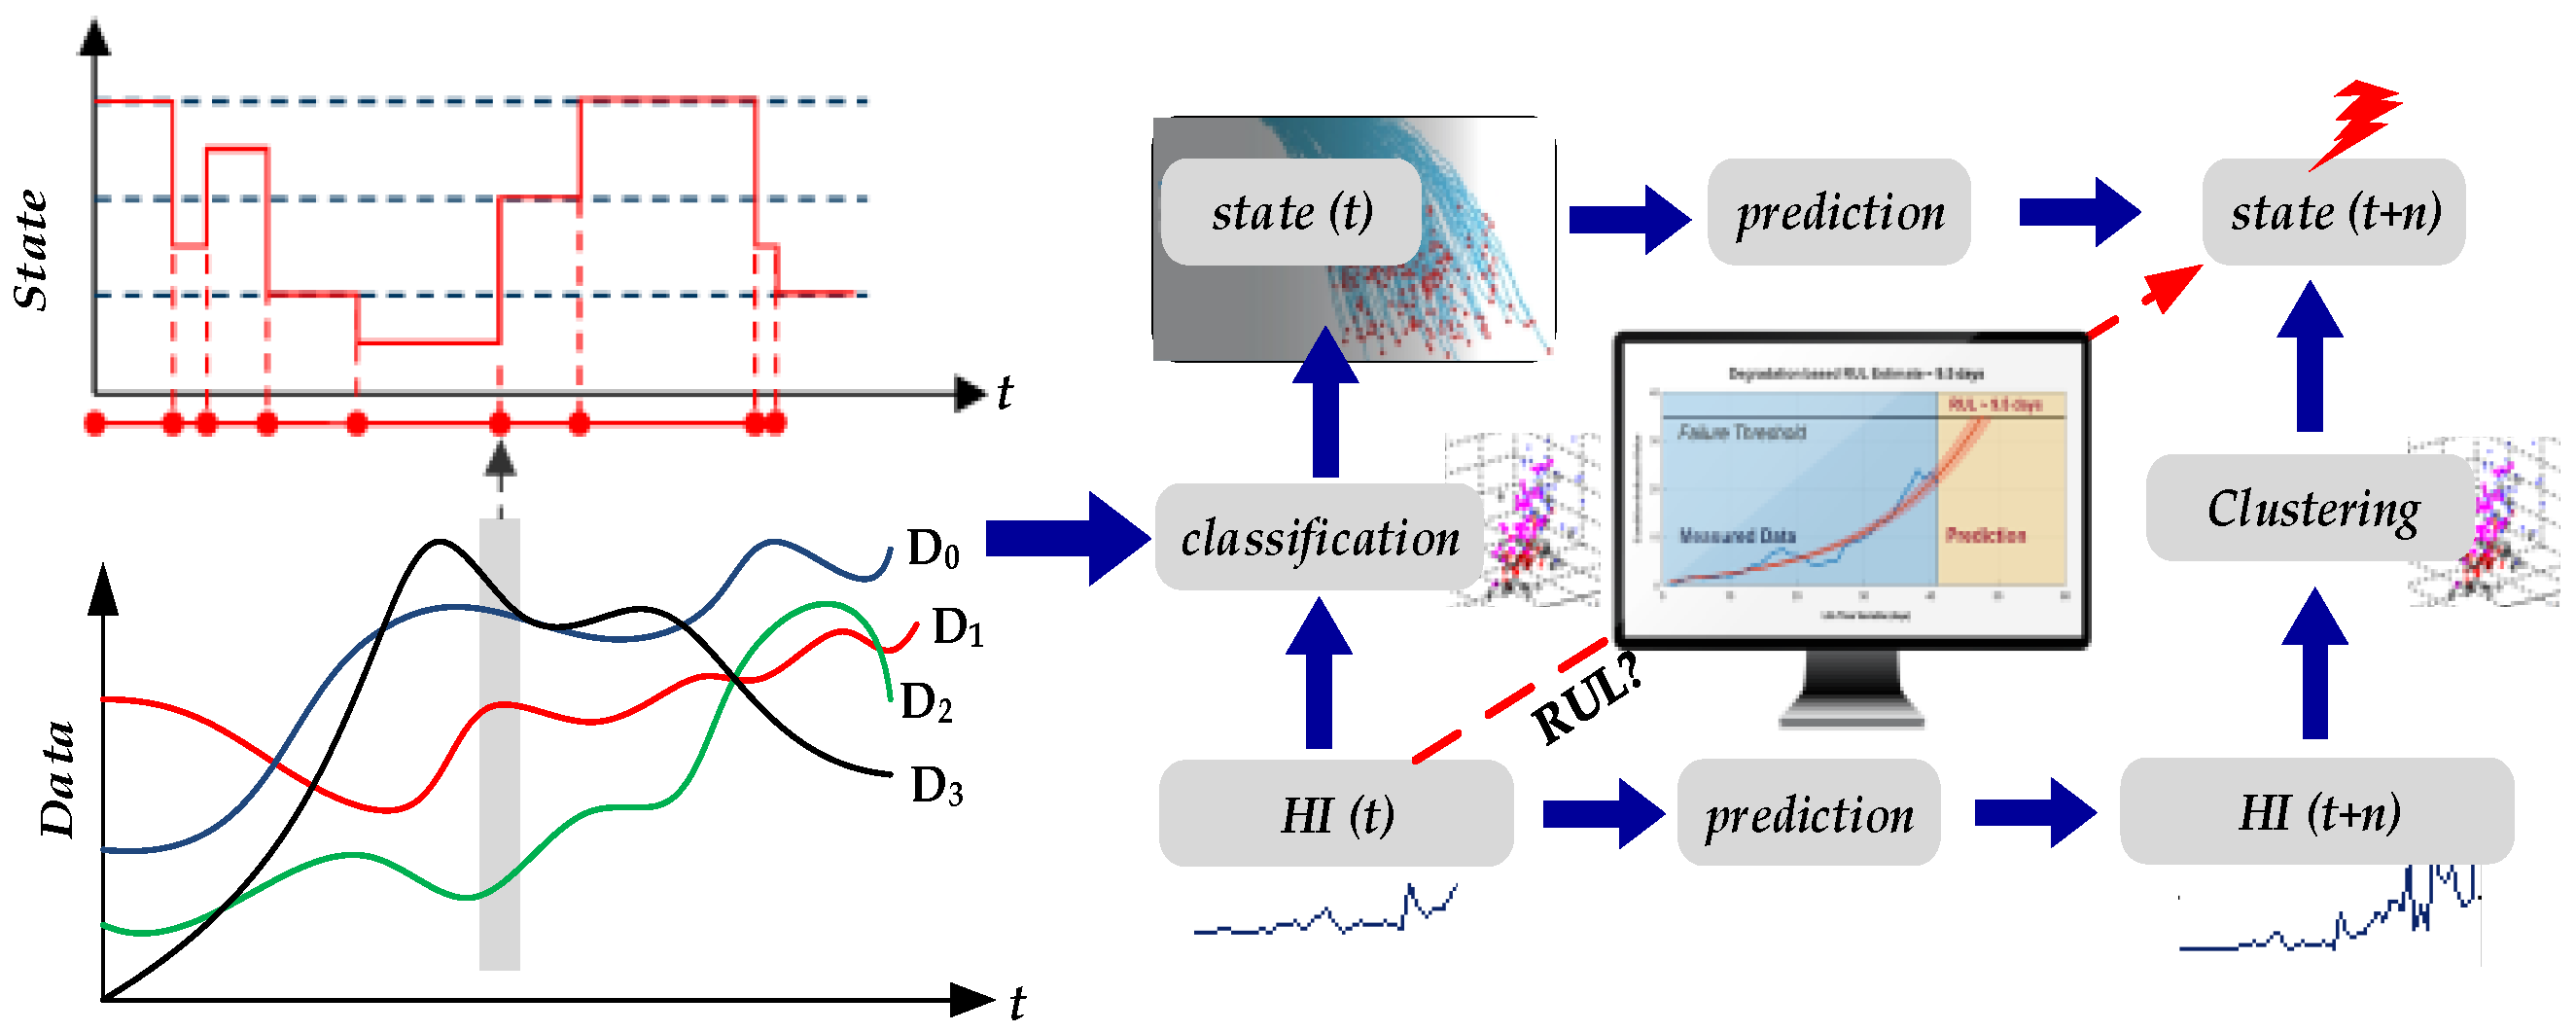
- Either to predict the evolution of a situation’s HI and then to identify the system’s state through classification.
- -
- Either to identify the current state, by classification, and then to estimate its future state.
4. Challenges in Prognostics
- -
- Modeling uncertainties (numerical errors, unmodeled phenomenon, dynamics, and complexity of real systems): unknown level of uncertainties arising due to lack of knowledge or information.
- -
- Input data uncertainties (initial state (damage) estimate): experiments can be used to characterize the process’s inherent statistical variability.
- -
- Measurement uncertainties (sensor noise, loss of information during preprocessing, approximations, and simplifications): unknown number of uncertainties stemming from the collection or processing of data. Feature extraction: to have meaningful prognostics, it is important to collect data that is directly related to damage.
- -
- Operating environment uncertainties (unforeseen future loads, unforeseen future environments, variability in the usage history data).
5. Prognostics Applications
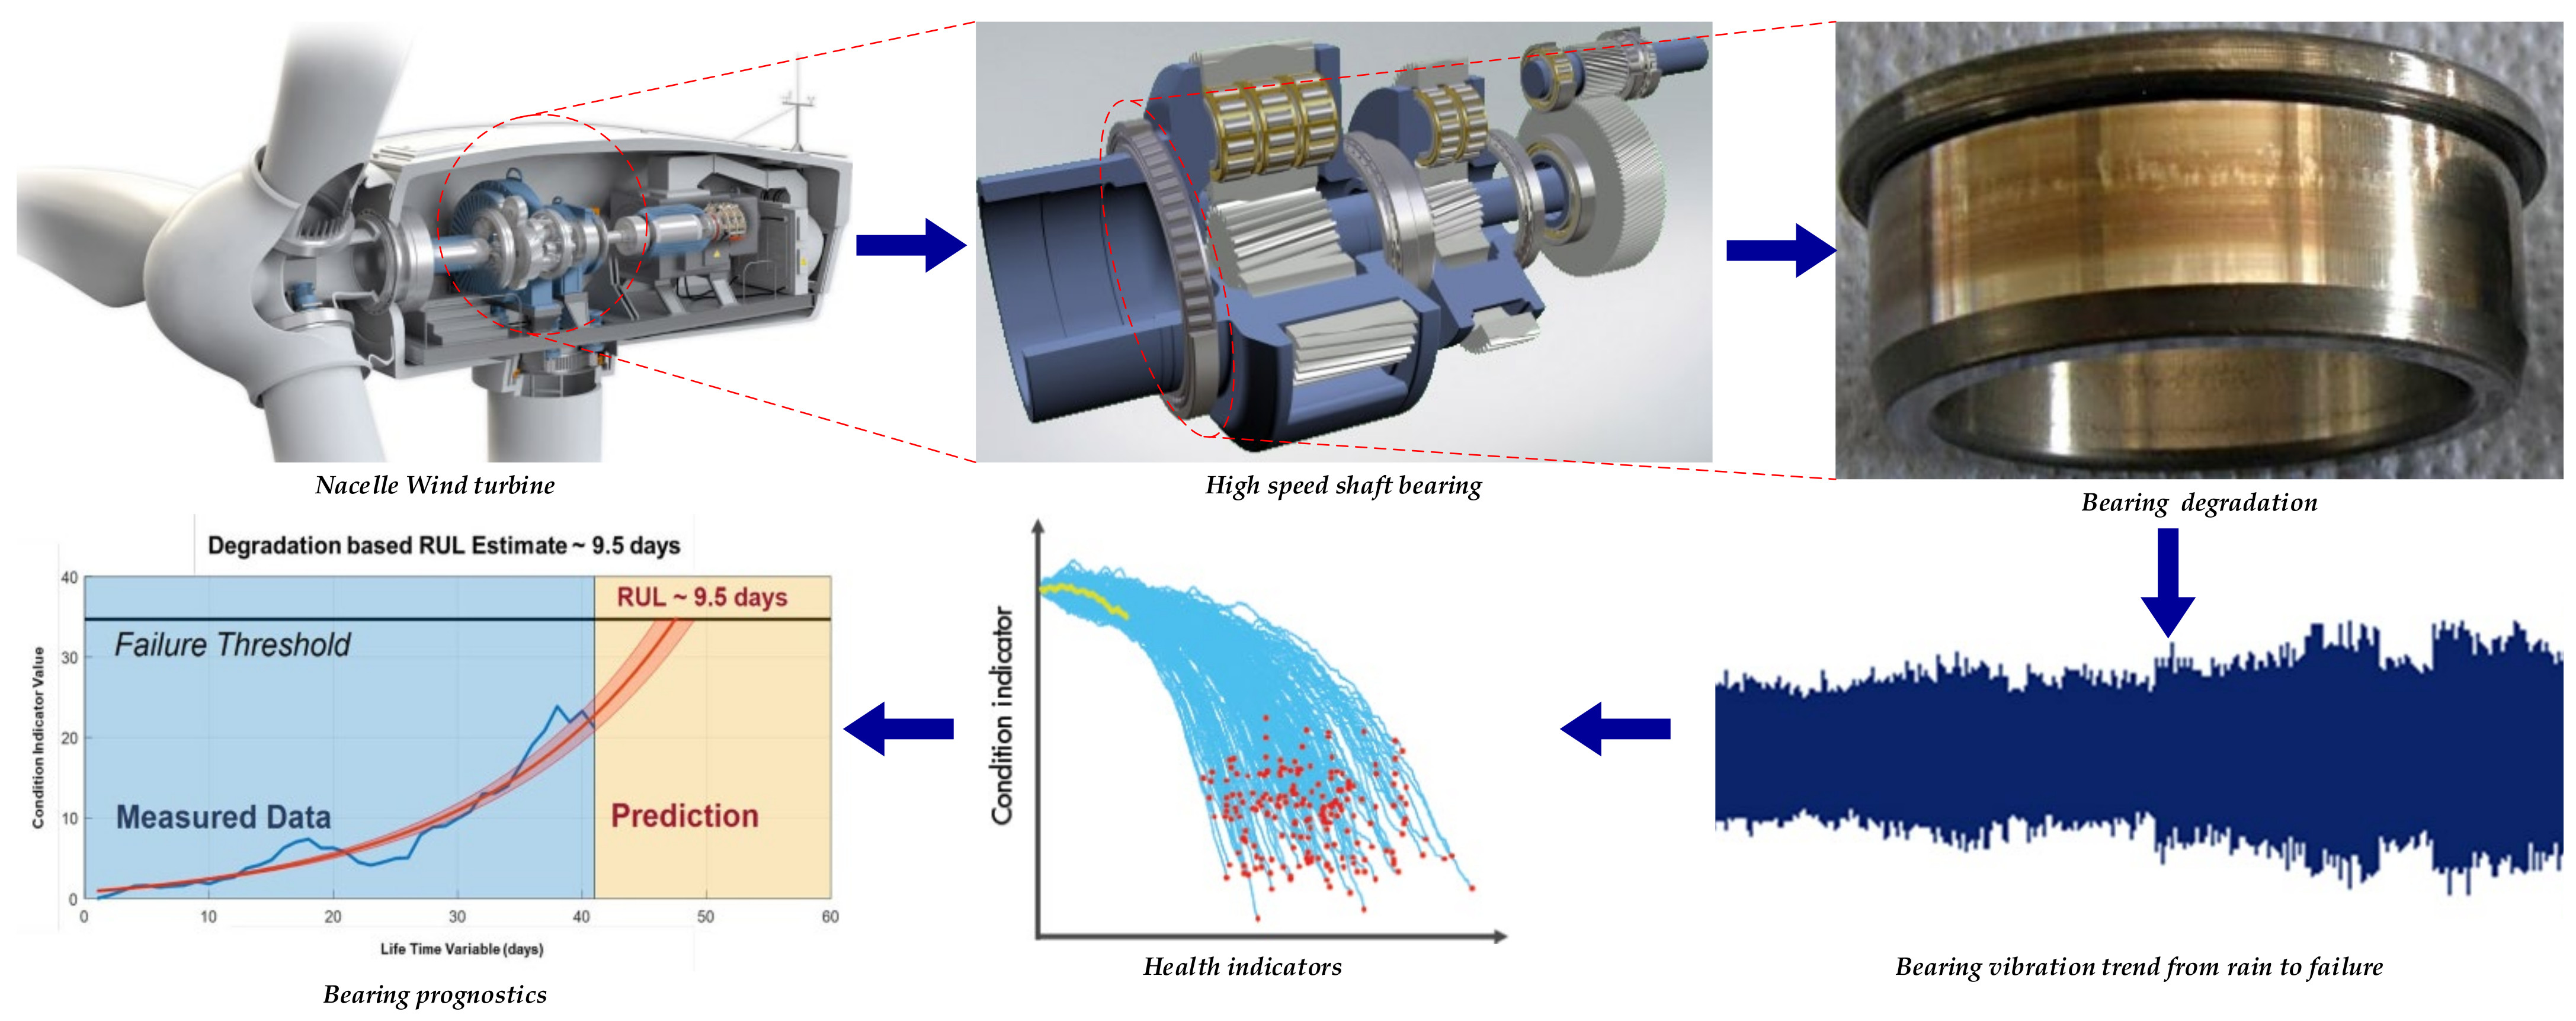
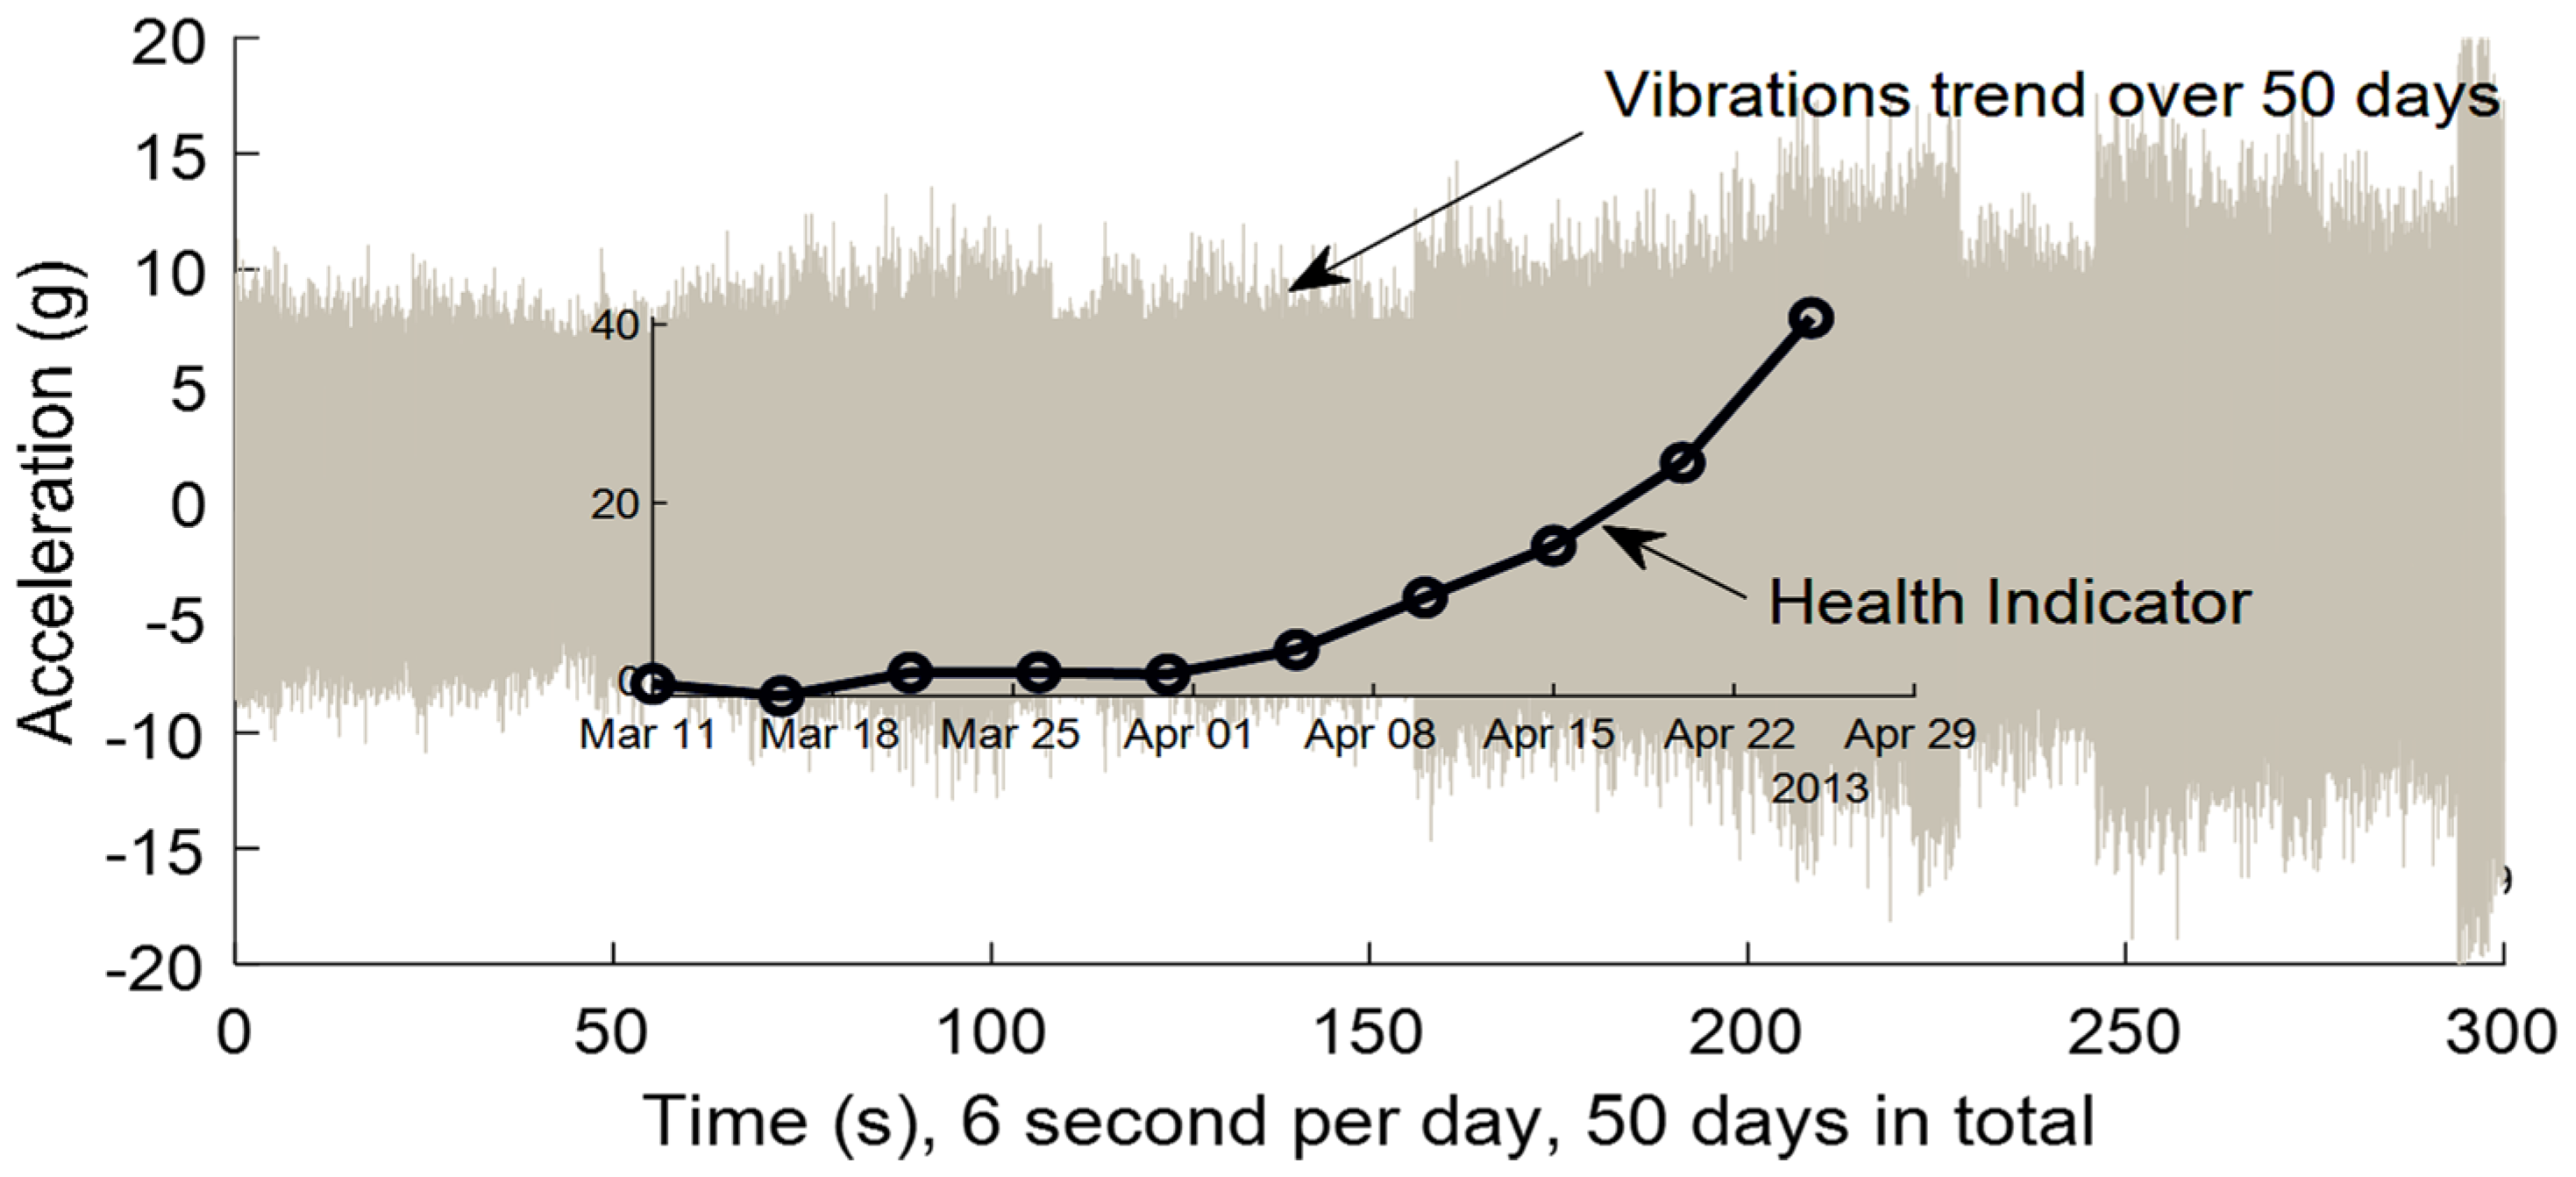
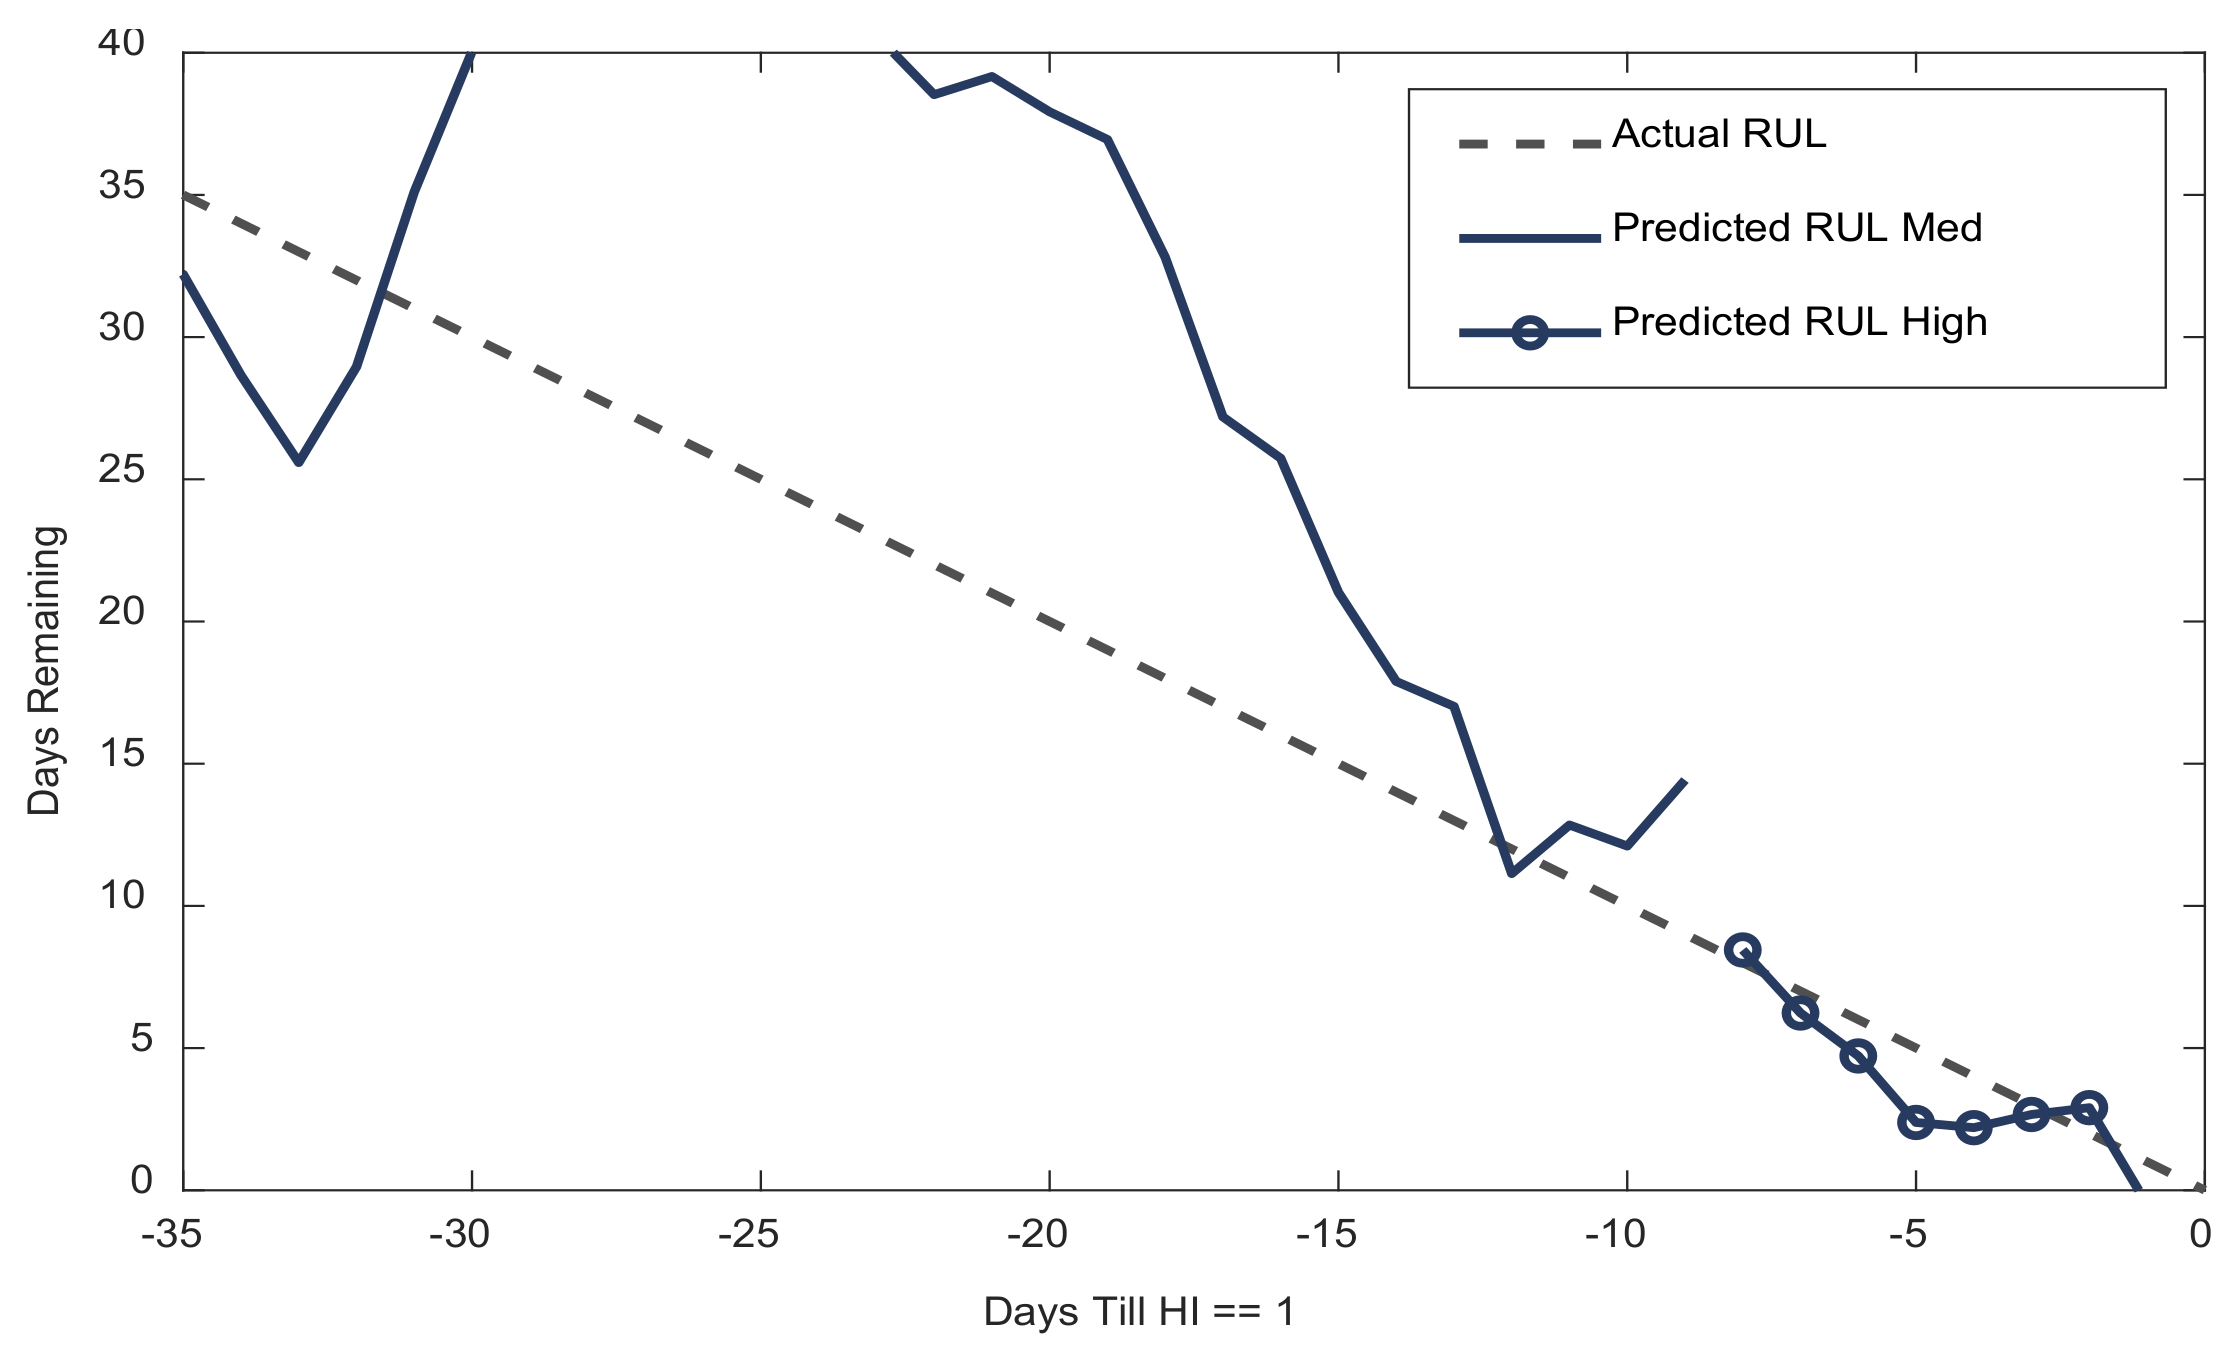
5.1. PHM of High-Speed Shaft Bearing Wind Turbine (HSSB)
5.2. PHM of High-Speed Shaft Bearing Wind Turbine (HSSB) Based on Physics-Based Approaches
5.3. PHM of Wind Turbine Electronic Power Converters
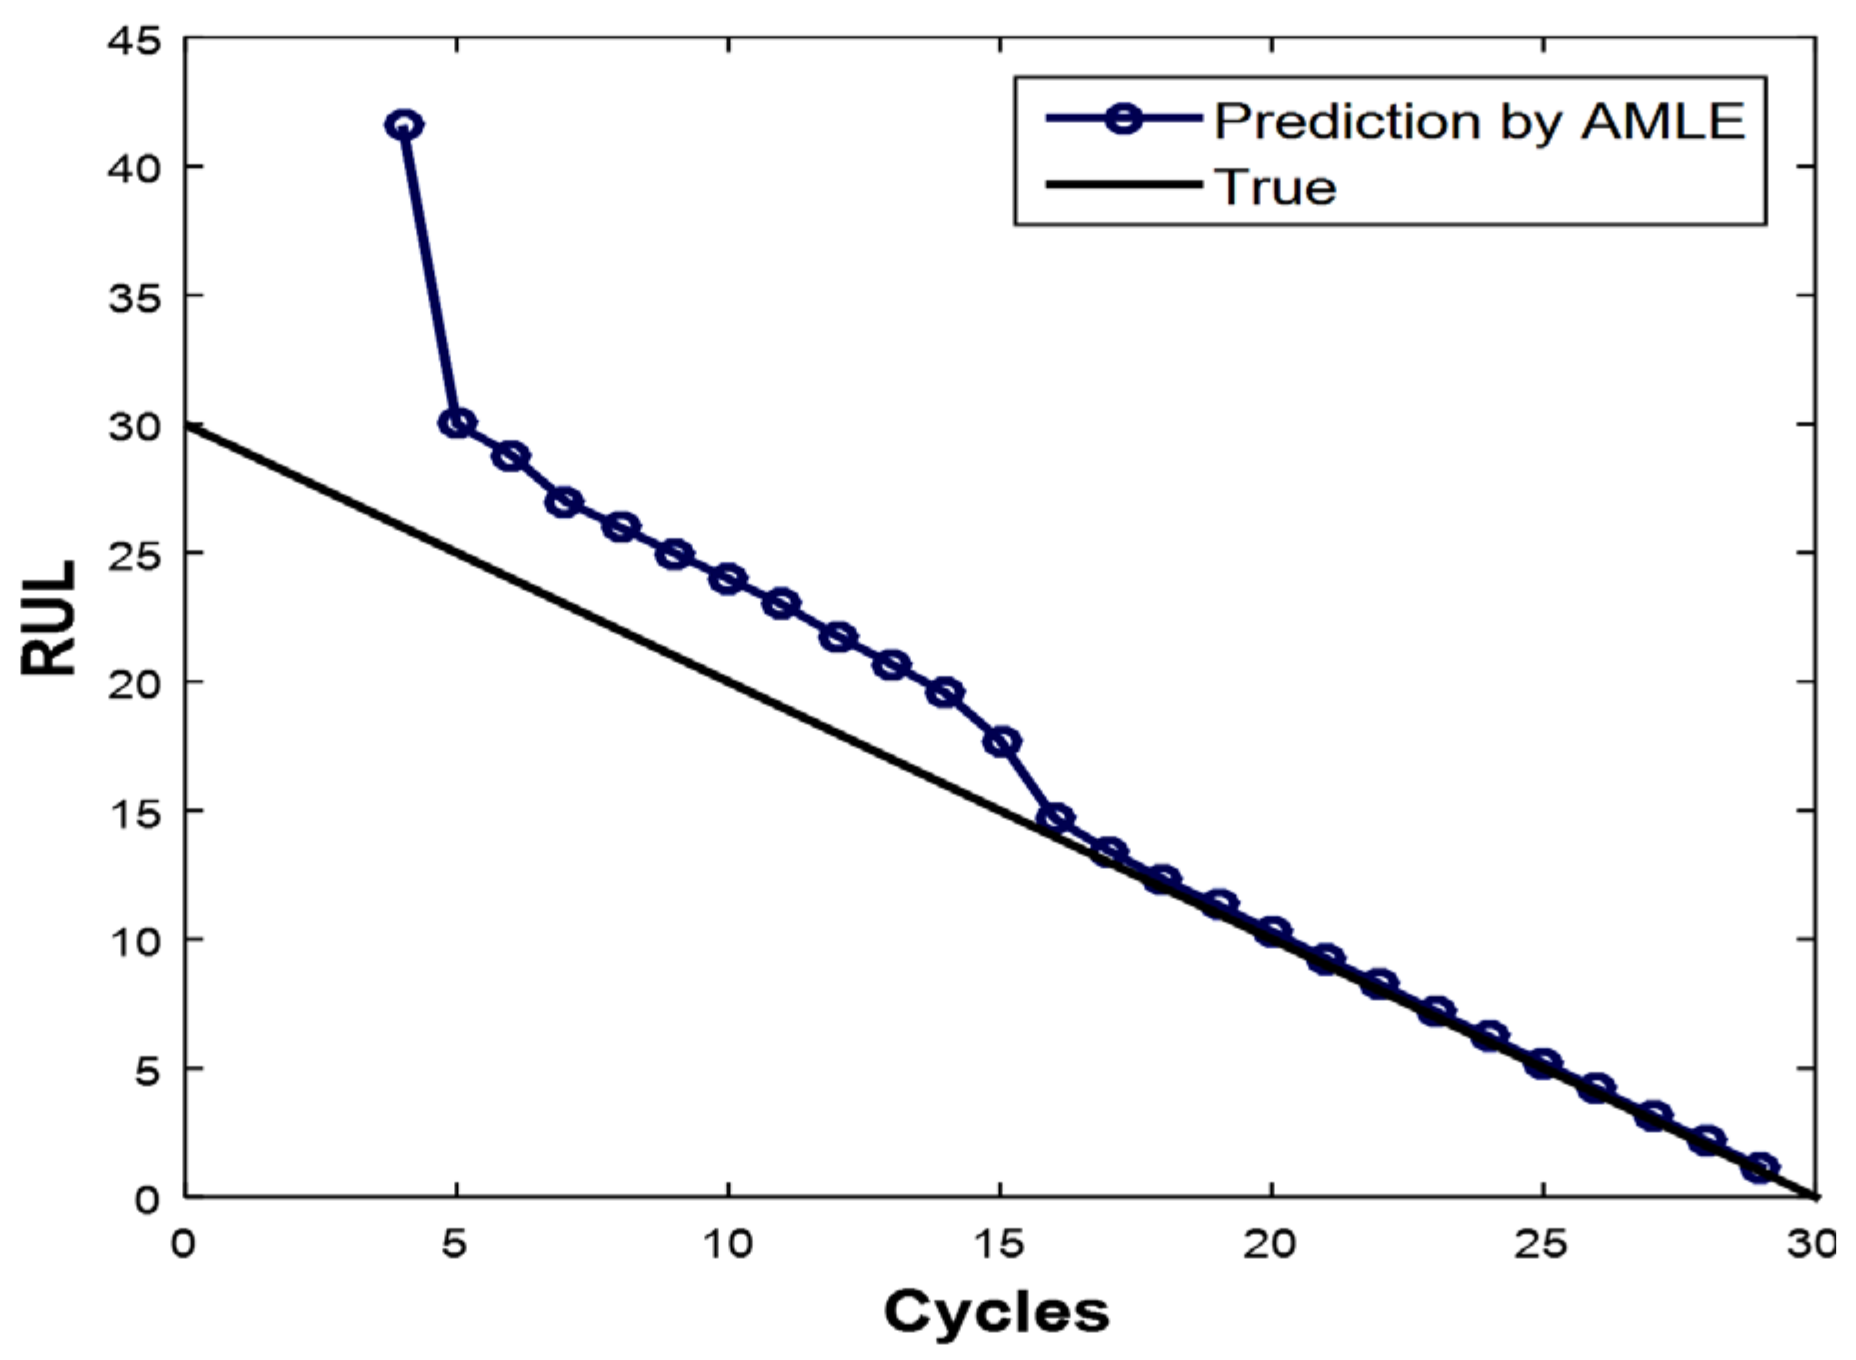
5.3.1. RUL Estimation for Thermally Aged Power IGBT Based on a Modified Maximum Likelihood Estimator
5.3.2. RUL Prediction of Thermally Aged Power IGBT Based on Gaussian Process Regression
5.4. Power Storage Systems: Predicting Battery Discharge
6. Conclusions
Author Contributions
Funding
Conflicts of Interest
References
- Coble, J.B. Merging Data Sources to Predict Remaining Useful Life—An Automated Method to Identify Prognostic Parameters. Ph.D. Thesis, The University of Tennessee Knoxville, Knoxville, TN, USA, May 2010. [Google Scholar]
- Saxena, A.; Celaya, J.; Saha, B.; Saha, S.; Goebel, K. Metrics for offline evaluation of prognostic performance. Int. J. Progn. Health Manag. 2010, 1, 4–23. [Google Scholar]
- IEEE PHM 2012 Prognostic Challenge. 2012. Available online: https://phm-europe.org/data-challenge (accessed on 8 November 2021).
- Kim, N.-H.; Dawn, A.; Joo-Ho, C. PHM of Engineering Systems; Springer International Publishing: Cham, Switzerland, 2017. [Google Scholar]
- Sun, B.; Zeng, S.; Kang, R.; Pecht, M.G. Benefits and challenges of system prognostics. IEEE Trans. Reliab. 2012, 61, 323–335. [Google Scholar] [CrossRef]
- Baraldi, P.; Mangili, F.; Zio, E. Investigation of uncertainty treatment capability of model-based and data-driven prognostic methods using simulated data. Reliab. Eng. Syst. Saf. 2013, 112, 94–108. [Google Scholar] [CrossRef] [Green Version]
- Gouriveau, R.; Medjaher, K. Chapter 2: Industrial prognostic—An overview. In Maintenance Modelling and Applications; Andrews, C.B.J., Jackson, L., Eds.; Det Nor. Veritas: Høvik, Norway, 2011; pp. 10–30. ISBN 978-82-515-0316-7. [Google Scholar]
- Yin, S.; Ding, S.; Zhou, D. Diagnosis and prognosis for complicated industrial systems—Part I. IEEE Trans. Ind. Electron. 2016, 63, 2501–2505. [Google Scholar] [CrossRef]
- IEEE Reliability Society. International Conference on Prognostics and Health Management. 2011. Available online: http://rs.ieee.org (accessed on 15 July 2021).
- PHM Society. The Prognostics and Health Management Society. 2009. Available online: http://www.phmsociety.org (accessed on 15 July 2021).
- PCoE. Prognostics Center of Excellence. 2016. Available online: http://ti.arc.nasa.gov/tech/dash/pcoe (accessed on 15 July 2021).
- Vogl, G.W.; Weiss, B.A.; Donmez, H.M. Standards Related to Prognostics and Health Management (PHM) for Manufacturing. 2014. Available online: https://www.nist.gov/publications/standards-related-prognostics-and-health-management-phm-manufacturing (accessed on 15 July 2021).
- ISO13381-1. Condition Monitoring and Diagnostics of Machines Prognostics Part 1: General Guidelines; International Standard; ISO: Geneva, Switzerland, 2004. [Google Scholar]
- Batzel, T.D.; Swanson, D.C. Prognostic health management of aircraft power generators. IEEE Trans. Aerosp. Electron. Syst. 2009, 45, 473–482. [Google Scholar] [CrossRef]
- Saidi, L.; Ben Ali, J.; Benbouzid, M.; Bechhofer, E. An integrated wind turbine failures prognostic approach implementing Kalman smoother with confidence bounds. Appl. Acoust. 2018, 138, 199–208. [Google Scholar] [CrossRef]
- Saidi, L.; Bechhofer, E.; Ben Ali, J.; Benbouzid, M. Particle filter-based prognostic approach for High-Speed Shaft Bearing Wind Turbine Progressive Degradations. In Proceedings of the 43rd Annual Conference of the IEEE Industrial Electronics Society, Beijing, China, 29 October–1 November 2017; pp. 8099–8104. [Google Scholar]
- Ismail, A.; Saidi, L.; Sayadi, M.; Benbouzid, M. Gaussian process regression remaining useful lifetime prediction of thermally aged power IGBT. In Proceedings of the 45th Annual Conference of the IEEE Industrial Electronics Society, Lisbon, Portugal, 14–17 October 2019; pp. 6004–6009. [Google Scholar]
- Benbouzid, M.; Berghout, T.; Sarma, N.; Djurovi’c, S.; Wu, Y.; Ma, X. Intelligent Condition Monitoring of Wind Power Systems: State of the Art Review. Energies 2021, 14, 5967. [Google Scholar] [CrossRef]
- Saxena, A.; Celaya, J.; Saha, B.; Saha, S.; Goebel, K. On applying the prognostic performance metrics. In Proceedings of the Annual Conference of the Prognostics and Health Management Society, San Diego, CA, USA, 27 September–1 October 2009. [Google Scholar]
- Muneer, A.; Taib, S.M.; Naseer, S.; Ali, R.F.; Aziz, I.A. Data-Driven Deep Learning-Based Attention Mechanism for Remaining Useful Life Prediction: Case Study Application to Turbofan Engine Analysis. Electronics 2021, 10, 2453. [Google Scholar] [CrossRef]
- Do, M.H.; Söffker, D. State-of-the-art in integrated prognostics and health management control for utility-scale wind turbines. Renew. Sustain. Energy Rev. 2021, 145, 111102. [Google Scholar] [CrossRef]
- Berghout, T.; Mouss, L.-H.; Kadri, O.; Saidi, L.; Benbouzid, M. Aircraft engines remaining useful life prediction with an adaptive denoising online sequential Extreme Learning Machine. Eng. Appl. Artif. Intell. 2020, 96, 103936. [Google Scholar] [CrossRef]
- Ben Ali, J.; Saidi, L.; Benbouzid, M.; Bechhofer, E. Online automatic diagnosis of wind turbine bearings progressive degradations under real experimental conditions based on unsupervised machine learning. Appl. Acoust. 2018, 132, 167–181. [Google Scholar] [CrossRef]
- Benkedjouh, T.; Medjaher, K.; Zerhouni, N.; Rechak, S. Health assessment and life prediction of cutting tools based on support vector regression. J. Intell. Manuf. 2015, 26, 213–223. [Google Scholar] [CrossRef] [Green Version]
- Introduction to Predictive Maintenance Toolbox; The MathWorks, Inc.: Natick, MA, USA, 2019.
- Saidi, L.; Ben Ali, J. A new suitable feature selection and regression procedure for lithium-ion battery prognostics. Int. J. Comput. Appl. Technol. 2018, 58, 102–115. [Google Scholar]
- Meng, H.; Li, Y.F. A review on prognostics and health management (PHM) methods of lithium-ion batteries. Renew. Sustain. Energy Rev. 2019, 116, 109405. [Google Scholar] [CrossRef]
- Meyer, A.; Brodbeck, B. Data Driven Performance Fault detection in Commercial Wind Turbines. In Proceedings of the Processing of the PHM Society European Conference, Turin, Italy, 1–3 July 2020. [Google Scholar]
- Leão, B.P.; Yoneyama, T.; Rocha, G.C. Prognostics performance metrics and their relation to requirements, design, verification and cost-benefit. In Proceedings of the International Conference on Prognostics and Health Management, Denver, CO, USA, 6–9 October 2008; pp. 1–8. [Google Scholar]
- Xia, T.; Dong, Y.; Xiao, L.; Du, S.; Pan, E.; Xi, L. Recent advances in prognostics and health management for advanced manufacturing paradigms. Reliab. Eng. Syst. Saf. 2018, 178, 255–268. [Google Scholar] [CrossRef]
- Camci, F.; Medjaher, K.; Zerhouni, N.; Nectoux, P. Feature evaluation for effective bearing prognostics. Qual. Reliab. Eng. Int. 2013, 29, 477–486. [Google Scholar] [CrossRef] [Green Version]
- Bosnić, Z.; Kononenko, I. An overview of advances in reliability estimation of individual predictions in machine learning. Intell. Data Anal. 2009, 13, 385–401. [Google Scholar] [CrossRef] [Green Version]
- Saidi, L.; Benbouzid, M.; Diallo, D.; Amirat, Y.; Elbouchikhi, E.; Wang, T. Higher-Order Spectra Analysis-Based Diagnosis Method of Blades Biofouling in a PMSG driven Tidal Stream Turbine. Energies 2020, 13, 2888. [Google Scholar] [CrossRef]
- Camci, F.; Chinnam, R.B. Health-state estimation and prognostics in machining processes. IEEE Trans. Autom. Sci. Eng. 2010, 7, 581–597. [Google Scholar] [CrossRef] [Green Version]
- Cheng, C.T.; Xie, J.X.; Chau, K.W.; Layeghifard, M. A new indirect multi-step-ahead prediction model for a long-term hydrologic prediction. J. Hydrol. 2008, 361, 118–130. [Google Scholar] [CrossRef] [Green Version]
- Cheng, S.; Pecht, M. A fusion prognostics method for remaining useful life prediction of electronic products. In Proceedings of the CASE 2009: IEEE International Conference on Automation Science and Engineering, Bangalore, India, 22–25 August 2009; pp. 102–107. [Google Scholar]
- Berghout, T.; Mouss, L.-H.; Kadri, O.; Saidi, L.; Benbouzid, M. Aircraft engines remaining useful life prediction using an improved online sequential extreme learning machine approach. Appl. Sci. 2020, 10, 1062. [Google Scholar] [CrossRef] [Green Version]
- Chiu, S.L. Fuzzy model identification based on cluster estimation. J. Intellig. Fuzzy Syst. 1994, 2, 267–278. [Google Scholar] [CrossRef]
- Aka, R.; Lia, Y.-F.; Vitellia, V.; Zio, E. A genetic algorithm and neural network technique for predicting wind power under uncertainty. Chem. Eng. 2013, 33, 1–6. [Google Scholar]
- An, D.; Choi, J.-H.; Kim, N.H. Prognostics 101: A tutorial for particle filter-based prognostics algorithm using Matlab. Reliab. Eng. Syst. Saf. 2013, 115, 161–169. [Google Scholar] [CrossRef]
- Angelov, P.; Filev, D. An approach to online identification of Takagi-Sugeno fuzzy models. IEEE Trans. Syst. Man Cybern. Part B Cybern. 2004, 34, 484–498. [Google Scholar] [CrossRef] [PubMed] [Green Version]
- Baraldi, P.; Mangili, F.; Zio, E. A Kalman filter-based ensemble approach with application to turbine creep prognostics. IEEE Trans. Reliab. 2012, 61, 966–977. [Google Scholar] [CrossRef]
- Zheng, X.; Fang, H. An integrated unscented Kalman filter and RVR approach for lithium-ion battery remaining useful life and short-term capacity prediction. Reliab. Eng. Syst. Safe 2015, 144, 74–82. [Google Scholar] [CrossRef]
- Araldi, B.P.; Compare, M.; Sauco, S.; Zio, E. Ensemble neural network-based particle filtering for prognostics. Mech. Syst. Signal Proc. 2013, 41, 288–300. [Google Scholar] [CrossRef] [Green Version]
- Li, Z.; Zheng, Z.; Outbib, R. A prognostic methodology for power MOSFETs under thermal stress using echo state network and particle filter. Microelectron. Reliab. 2018, 88, 350–354. [Google Scholar] [CrossRef] [Green Version]
- Fan, L.; Jiuping, X. A new prognostics method for state of health estimation of lithium-ion batteries based on a mixture of Gaussian process models and particle filter. Microl. Reliab. 2015, 55, 1035–1045. [Google Scholar]
- Saidi, L.; Ben Ali, J.; Benbouzid, M.; Bechhofer, E. Wind turbine high-speed shaft bearings health prognosis through a spectral Kurtosis-derived indices and SVR. Appl. Acoust. 2017, 120, 1–8. [Google Scholar] [CrossRef]
- Ben Ali, J.; Khelif, R.; Saidi, L.; Chebel-Morello, B.; Fnaiech, F. The use of nonlinear future reduction techniques as a trend parameter for state of health estimation of lithium-ion batteries. In Proceedings of the IEEE 2015 16th International Conference on STA, Västerås, Sweden, 21–23 December 2015; pp. 246–251. [Google Scholar]
- Saidi, L.; Benbouzid, M. Renewable Energy Systems Prognostics and Health Management: A Review of Recent Advances. In Proceedings of the 47th Annual Conference of the IEEE Industrial Electronics Society, Toronto, ON, Canada, 13–16 October 2021. [Google Scholar]
- Liu, D.; Pang, J.; Zhou, J. Prognostics for state of health estimation of lithium-ion batteries based on combination Gaussian process functional regression. Microelectr. Reliab. 2013, 53, 832–839. [Google Scholar] [CrossRef]
- Ismail, A.; Saidi, L.; Sayadi, M.; Benbouzid, M. Remaining useful life estimation for thermally aged power IGBTs Based on a Modified Maximum Likelihood Estimator. Int. Trans. Electr. Energy Syst. 2020, 30, e12358. [Google Scholar] [CrossRef]
- Ben Ali, J.; Azizi, C.; Saidi, L.; Bechhoefer, E.; Benbouzid, M. Reliable state of health condition monitoring of Li-ion batteries based on incremental support vector regression with parameters optimization. Proceedings of the Institution of Mechanical Engineers, Part I: Journal of Systems and Control Engineering. SAGE J. 2020, 0959651820950849. [Google Scholar] [CrossRef]
- Lee, C.-J.; Kim, B.-K.; Kwon, M.-K.; Nam, K.; Kang, S.-W. Real-Time Prediction of Capacity Fade and Remaining Useful Life of Lithium-Ion Batteries Based on Charge/Discharge Characteristics. Electronics 2021, 10, 846. [Google Scholar]
- Benbouzid, M. Signal Processing for Fault Detection and Diagnosis in Electric Machines and Systems; IET: London, UK, 2020; p. 284. [Google Scholar]


| Prognostics Approaches | |
|---|---|
| Advantages | Disadvantages |
| Data-driven approaches | |
| - Relatively simple and rapid to deploy. - Aids in the assessment of massive amounts of data to acquire a better knowledge of bodily dynamic system behavior. | - There are no physical cause and effect relationships used. - It is difficult to strike the right balance between generalization and learning specific data trends. - Requires large amounts of data. |
| Physics-based approaches | |
| - Based on modeled cause-effect correlations, the prediction results are intuitive. - Only calibration may be required for different cases once a model has been built. - Drives sensing requirements. | - Developing models is not trivial. - High-fidelity models can be computationally costly to run, making them unsuitable for real-time applications. |
| Hybrid approaches | |
| - No necessity for high-fidelity models or big data. - Maintains the model’s intuitiveness while explaining observed data. - Assists in the handling of uncertainty. | - Requires both data and the models. - A faulty model or noisy data can lead each other’s approaches to be biased. |
| Benefits of PHM | |
| Benefits in life-cycle cost | - Lower operational costs - Increased revenue |
| Advantages in system design and implementation | - Perfect system design - Improved reliability prediction - Improved logistics support system |
| Benefits in production | - Better process quality control - Integrated maintenance development by OEMs 1 |
| Benefits in system operation | - Reinforcing system safety - Enhanced operational reliability |
| Benefits in logistics support and maintenance | - Condition-based maintenance - Improved fleet-wide decision support - Optimized logistics supply chain - Decreased maintenance-induced fault |
| Challenges in PHM | |
| Requirements specifications: - How might a necessity for prognostics be presented in light of uncertainty? - How to identify and attain the prognostic fidelity you want? Uncertainty in prognostics: - To what extent does a prediction’s probability distribution reflect reality? Validation and verification: - How can a system be evaluated to see if it meets the requirements? - Is it possible to evaluate the success of prognostics both offline and online? | |
Publisher’s Note: MDPI stays neutral with regard to jurisdictional claims in published maps and institutional affiliations. |
© 2021 by the authors. Licensee MDPI, Basel, Switzerland. This article is an open access article distributed under the terms and conditions of the Creative Commons Attribution (CC BY) license (https://creativecommons.org/licenses/by/4.0/).
Share and Cite
Saidi, L.; Benbouzid, M. Prognostics and Health Management of Renewable Energy Systems: State of the Art Review, Challenges, and Trends. Electronics 2021, 10, 2732. https://doi.org/10.3390/electronics10222732
Saidi L, Benbouzid M. Prognostics and Health Management of Renewable Energy Systems: State of the Art Review, Challenges, and Trends. Electronics. 2021; 10(22):2732. https://doi.org/10.3390/electronics10222732
Chicago/Turabian StyleSaidi, Lotfi, and Mohamed Benbouzid. 2021. "Prognostics and Health Management of Renewable Energy Systems: State of the Art Review, Challenges, and Trends" Electronics 10, no. 22: 2732. https://doi.org/10.3390/electronics10222732
APA StyleSaidi, L., & Benbouzid, M. (2021). Prognostics and Health Management of Renewable Energy Systems: State of the Art Review, Challenges, and Trends. Electronics, 10(22), 2732. https://doi.org/10.3390/electronics10222732