Abstract
Arm swing during gait has been positively related to gait stability and gait efficiency, particularly in the presence of neurological disorders that affect locomotion. However, most gait studies have focused on lower extremities, while arm swing usually remains ignored. In addition, these studies are mostly based on costly, highly-specialized vision systems or on wearable devices which, despite their popularity among researchers and specialists, are still relatively uncommon for the general population. This work proposes a way of estimating arm swing asymmetry from a single 2D gait video. First, two silhouette-based representations that separately capture motion data from both arms were built. Second, a measure to quantify arm swing energy from such a representation was introduced, producing two side-dependent motion measurements. Third, an arm swing asymmetry index was obtained. The method was validated on two public datasets, one with 68 healthy subjects walking normally and one with 10 healthy subjects simulating different styles of arm swing asymmetry. The validity of the asymmetry index at capturing different arm swing patterns was assessed by two non-parametric tests: the Mann–Whitney U test and the Wilcoxon signed-rank test. The so-called physiological asymmetry was observed on the normal gait sequences of both datasets in a statistically similar way. The asymmetry index was able to fairly characterize the different levels of asymmetry simulated in the second set. Results show that it is possible to estimate the arm swing asymmetry from a single 2D gait video, with enough sensitivity to discriminate anomalous patterns from normality. This opens the door to low-cost easy-to-use mobile applications to assist clinicians in monitoring gait condition in primary care (e.g., in the elderly), when more accurate and specialized technologies are often not available.
1. Introduction
Arm swing (AS) has been positively related to the recovery of gait stability after a perturbation [1], to gait efficiency [2,3] and, in toddlers and children with cerebral palsy, to gait balance [4,5]. The value of the arm movements as an outward sign of health condition has also been well established [6,7,8,9], while rehabilitation studies [10,11] have suggested that exercises aimed at normalizing AS in patients with neurological disorders contribute to improve the inter-limb coordination and the locomotion pattern. However, in spite of such evidence, most recent gait studies still ignore upper limbs [8,11].
Much of the efforts aimed at measuring AS have been focused on asymmetry, a term that denotes the amount of discrepancy between the left and the right side during gait. AS amplitude has proven to vary significantly between the left and right side both in patients with neurodegenerative diseases [6,9,12,13] and, to a lesser extent, in healthy people [14,15]. As observed in [6], AS adapts to walking velocity both in patients of Parkinson’s disease (PD) and in control subjects, while arm swing asymmetry remains relatively unaffected by changes in walking conditions. In addition, significant differences in AS asymmetry were found between early PD and the control group, concluding that arm swing asymmetry can be more reliable in the diagnosis and monitoring of PD than arm swing amplitude. The value of AS asymmetry to characterize the unilateral dynamic of upper limb in early PD was also observed in [9], resulting significantly higher in patients than in the control group. They also provide evidence in favor of the robustness of AS asymmetry to changes in walking speed.
In the context of healthy people, [14] stated that “a certain degree of asymmetry is physiological”, and it is not related to handedness. Reproducible asymmetries between the left and right AS were measured in normal subjects. These findings were later confirmed by [15] when measuring AS asymmetry in overground walking. Motion data consisted of the range of motion (in degrees) measured by IMUs attached to wrists. They concluded that left-dominant AS is typical in healthy gait, regardless of walking condition or handedness.
In most previous studies, kinematic data were collected by tracking reflective markers placed at anatomical locations by a multi-camera 3D motion capture system such as Vicon [6,16] and Qualisys [9,14], which are very accurate solutions, but also costly and highly specialized. In the case of wearable gadgets (e.g., markers, IMU, etc.), despite their simplicity, precision, and growing popularity among researchers and clinical specialists, they are generally scarce in non-specialized healthcare centers as compared to, for example, smartphones, which have become virtually ubiquitous.
Along with these approaches, simple vision devices such as RGB or RGB-D cameras have been gaining momentum in rehabilitation [17,18], gait analysis [13,19,20,21] and parkinsonian gait assessment [22]. Main reasons include their low cost, user-friendliness, ubiquity, and ability for remote sensing. Recently, [23] showed that the Kinect error can be lower than as compared to the Vicon system, supporting its feasibility for certain clinical applications. Besides, since gait studies are conducted in a cooperative setting, factors that might alter gait perception such as subject appearance (e.g., clothing) and recording conditions (e.g., scene, lighting) can be easily kept under control. As it is well known, the ability of an RGB camera sensor to capture or perceive the actual characteristics of a subject’s gait pattern (here referred to as gait perception) could be severely limited by wearing loose clothing, by carrying backpacks, by poor lighting conditions, by the presence of objects in the scene between the optical sensor and the subject, by a changing background, by the sensor viewpoint, etc. Fortunately, a fully cooperative setting can be assumed in a vision-based analysis of gait disorders in healthcare environments, where all these factors can be avoided or kept within certain established limits. For example, we can expect simple indoor scenarios, fixed backgrounds, stable illumination conditions, tight clothes, no accessories, smooth floor, etc.
Previous efforts in estimating gait symmetry from a markerless 2D video can be found in [20,21]. In [20], measurements were focused on the legs, while in [21], a symmetry index was obtained between amounts of movement calculated separately from half-cycle representations of the human gait. Such representations comprise information from all four limbs of the body together, making it difficult to attribute a measured anomaly to a particular limb or a body half (according to the sagittal plane). Unlike the aforesaid efforts, this work proposes the computation of a measure of asymmetry between representations that condense the energy of each arm separately obtained throughout the entire gait cycle. In this way, the measurements can potentially discriminate anomalies present in the swing of a particular arm.
More formally, this paper introduces a method for measuring AS asymmetry from only a 2D gait video. Contributions include (1) a side-dependent silhouette-based gait representation, and (2) a method for quantifying AS energy from such a representation. Arm swing asymmetry is then computed between both side-dependent energy measurements. The method is independent of recording parameters, making it valid for cross-platform analysis. Experiments were performed on two gait video databases, one with healthy subjects walking normally and one with healthy subjects simulating different styles of AS asymmetry. Results were validated by two non-parametric statistical tests. Since the method requires only a 2D video, it brings transfer opportunities for low-cost mobile systems to assist clinicians in monitoring gait parameters when more accurate and specialized technologies or trained staffs are not available.
2. Materials and Methods
2.1. Datasets
This study involves two public databases, the OU-ISIR Treadmill Dataset B [24] and the INIT Gait Database [20]. The former is a general-purpose gait video database that comprises indoor recordings of 68 healthy subjects, wearing up to 32 clothing styles. Sequences that combine regular pants and full shirt were chosen because of their neutral outline. This database is intended to establish an asymmetry benchmark in healthy walking from the new measure’s perspective. The second database is also composed of indoor sequences of high-quality binary silhouettes of 10 healthy volunteers walking normally ( style) and simulating several abnormal gait styles. Four of them reproduce AS asymmetry by combining the two arms and two reduced ranges of motion:
- The left arm swings normally, while the right arm is volitionally held still.
- The right arm swings normally, while the left arm is volitionally held still.
- The left arm swings normally, while the right arm swing is incomplete.
- The right arm swings normally, while the left arm swing is incomplete.
Instructions for and styles were to hold the affected arm relaxed, just next to the trunk, without swinging, while for and , participants were asked to perform half swing with the affected arm. Although exactly half swing can not be assumed, it can be reasonably accepted as a working hypothesis an incomplete trajectory of the affected arm. Figure 1 illustrates styles and as opposed to .

Figure 1.
From top to bottom, key silhouettes from one-cycle gait sequences corresponding to the , , and styles, respectively. Their dynamics are observed from right to left.
2.2. Arm Swing Asymmetry Measurement
The proposed method consists of 3 steps:
- Two side-based Gait Energy Images (GEI) [25] are built, so that each one comprises the motion data of each arm separately. A region of interest (ROI) containing arm motion is automatically extracted from each side-based representation.
- A Perceptible Motion Index (PMI) is introduced to quantify the amount of perceivable arm motion from each side-based ROI.
- A modified Robinson index [15,26] is used to measure AS asymmetry.
2.2.1. Side-Based Gait Energy Images
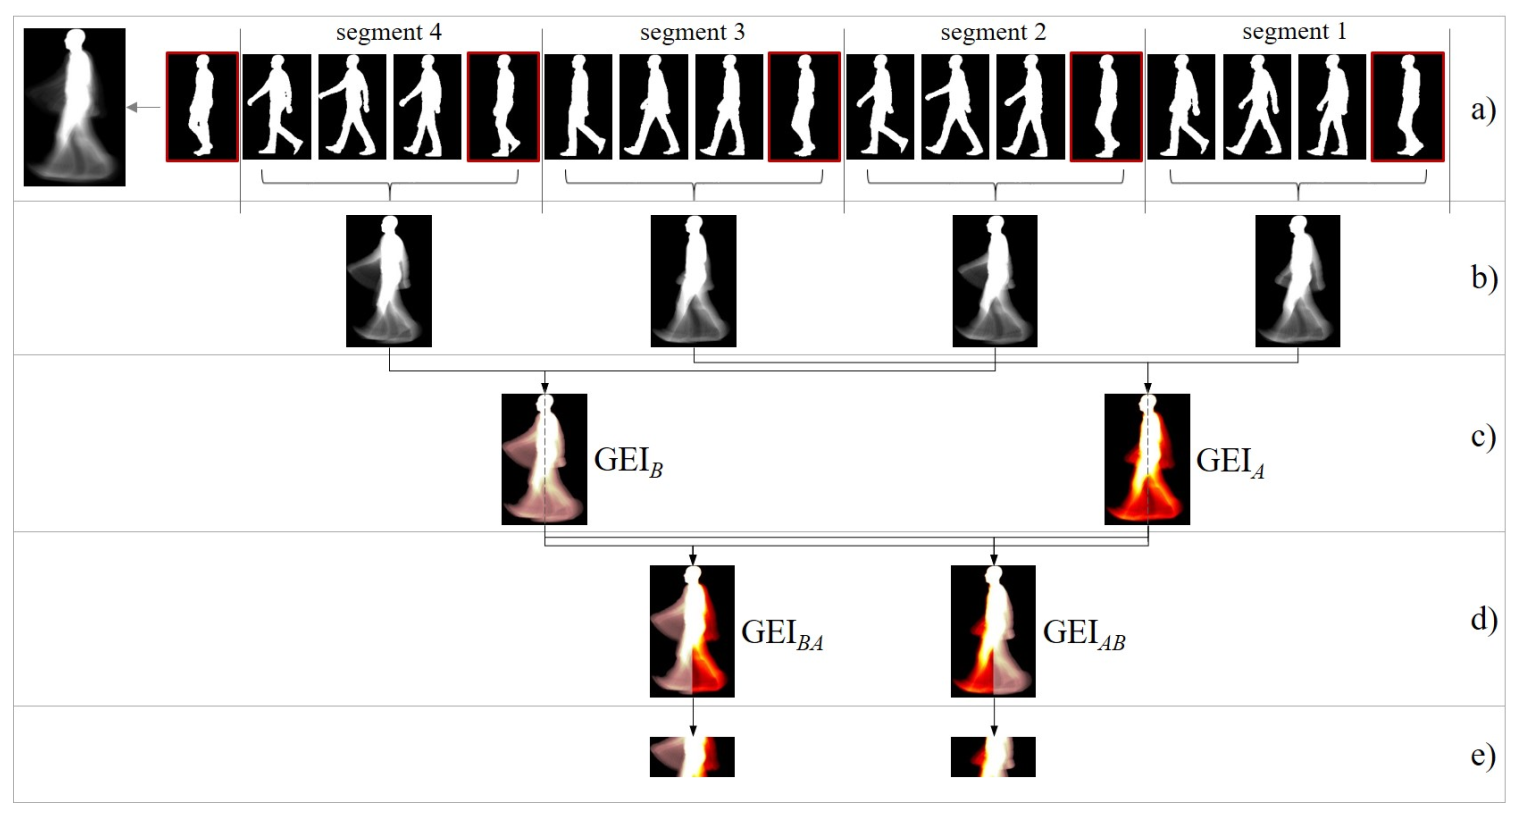
The Gait Energy Image (GEI) is a well-known silhouette-based gait representation that summarizes a subject’s dynamic and appearance. Given a sequence of aligned, size-normalized silhouettes, the GEI is computed by averaging all silhouettes. In this work, silhouettes were preprocessed as in [20]. Figure 2a shows a GEI example, where three types of GEI pixels can be identified:
Figure 2.
(a) A number of key silhouettes representing an -style sequence of 148 silhouettes divided into segments by midstance/midswing poses (framed in red); the GEI of the full sequence is shown on the left. (b) Segment-based GEIs. (c) Odd and even segment-based GEIs are averaged. (d) Two side-dependent GEIs are built. (e) ROIs enclosing arm motion are extracted. Subfigures (c), (d) y (e) were drawn with color maps to facilitate understanding.
- White pixels.
- They capture body regions with zero or little relative motion with respect to image borders, e.g., head and torso. They encode appearance.
- Gray pixels.
- They capture most of the gait energy mainly caused by the cyclic movement of limbs. A gray value means that the pixel has sometimes been background (black in some gait frames) and sometimes silhouette (white in other frames). The more intermediate the gray value, the greater the balance between background and silhouette and, therefore, the greater the movement recorded.
- Black pixels.
- They capture background regions common to all silhouettes.
Typically, a GEI is obtained from full gait cycles, summarizing the whole gait energy in a single representation. In order to isolate the motion of each arm, a side-based GEI is built as follows:
- A sequence of silhouettes is split into segments delimited by midstance/midswing poses (Figure 2a). Each resulting segment covers half a cycle.
- Segment-based GEIs are computed (Figure 2b). The way of splitting the sequence leads to segment-based GEIs in which each arm is captured either in the front side or in the back side (according to the coronal/frontal plane). This dynamic alternates along the segments: odd segments reflect an arm arrangement; the even ones, the opposite.
- Odd and even segment-based GEI are averaged separately (see Figure 2c). The two resulting GEIs are referred to as GEI and GEI, respectively. Due to the gait cyclic nature, the arm captured in the front side of GEI coincides with the one in the back side of GEI. Similarly, the motion in the back side of GEI and in the front side of GEI correspond to the other arm. Legs are also segregated.
- Two side-based GEIs are built by binding together the front side of GEI and the back side of GEI and, contrarily, the back of GEI and the front of GEI (Figure 2d). Let us denote the resulted side-based representations as GEI and GEI. Note that each of these representations condenses the movement of a single arm. For the purpose of estimating AS asymmetry, the correspondence between GEI/GEI and the left/right arms is irrelevant.
Two ROIs enclosing arm motion are then extracted from GEI and GEI, following a popular body proportion canon: the head to body ratio is one to eight for an adult. The ROI is established from 2.5 to 4.5 heads (Figure 2e). This heuristic rule proved very effective in isolating the energy information captured from the movement of the arms.
2.2.2. Perceptible Motion Index
The Perceptible Motion Index (PMI) is intended to quantify the motion information accumulated in a ROI, which is mostly due to the related arm. The term perceptible considers that there is a portion of AS that keeps hidden by the trunk silhouette which cannot be measured. A compensation factor is introduced to weight every bit of perceptible motion directly proportional to its distance to the trunk. PMI is defined below:
where is a weighting function that grows with the distance to the trunk (depends only on the x-coordinate), and accounts for the energy of the arm motion at pixel , and it is computed as with being the gray level at that ROI pixel [20]. The maximum of is reached at , when the pixel has been half times background and the other half silhouette; its minimum occurs when has only been either background (0) or silhouette (255).
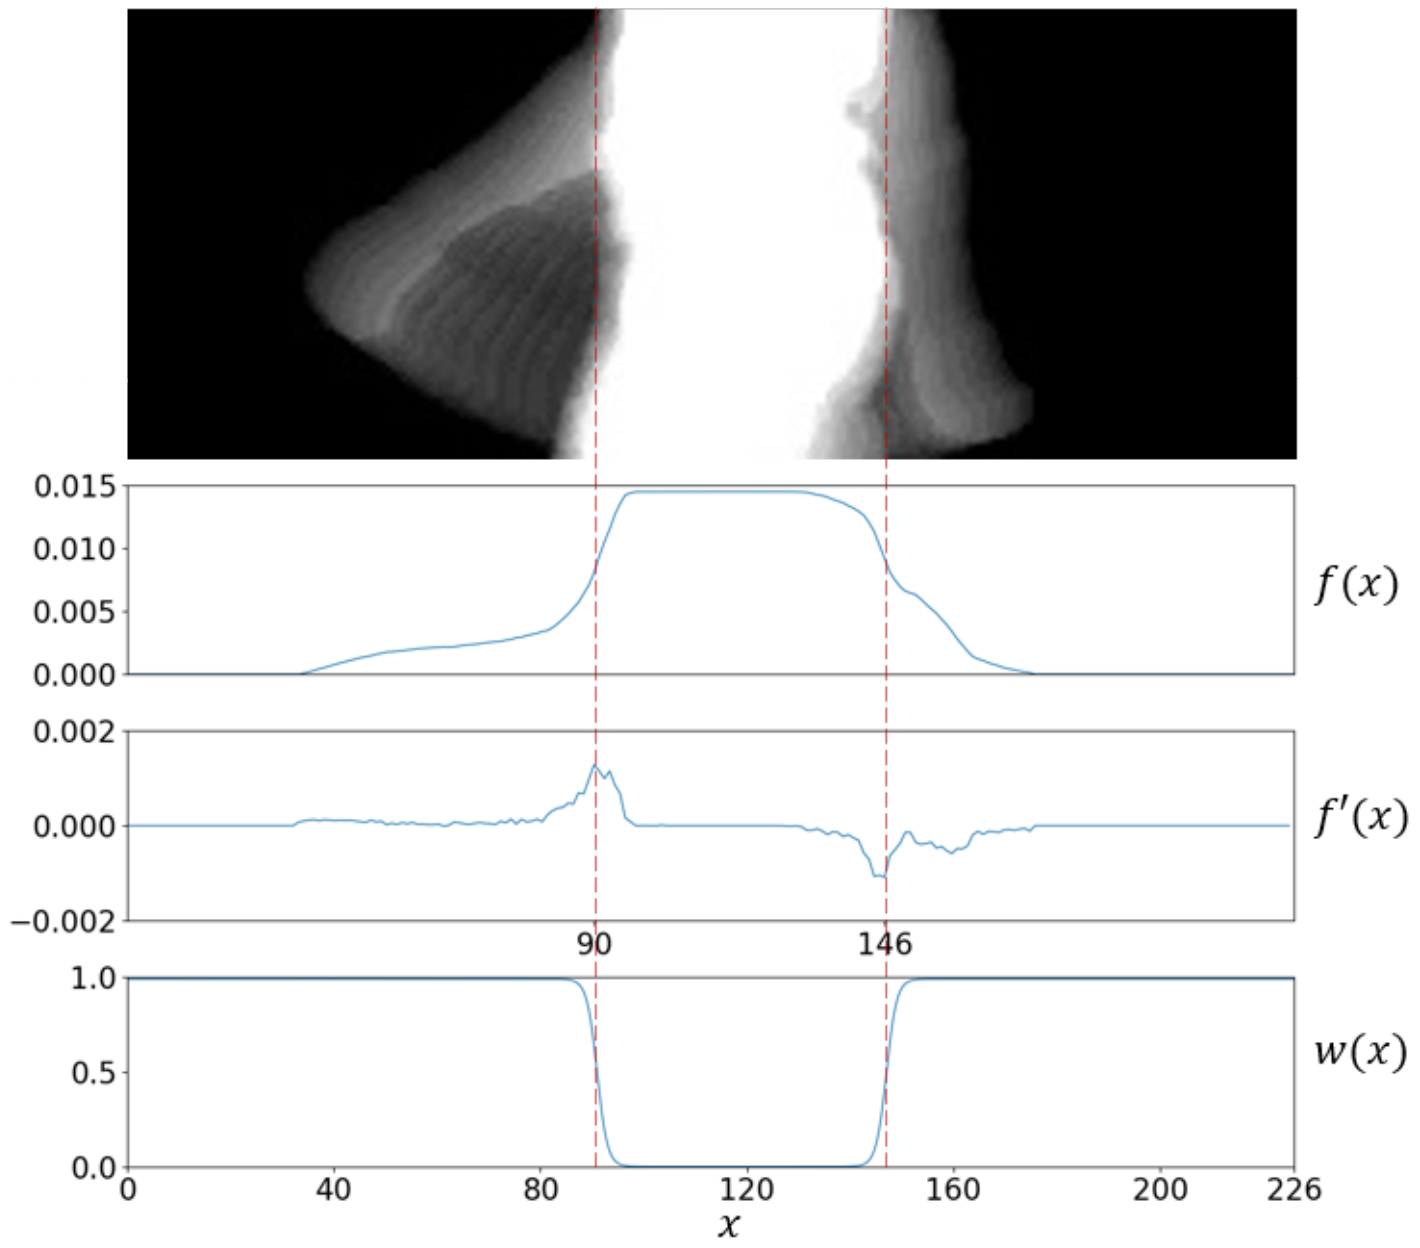
The proposed weighting function is shown in Figure 3. Note that is zero in the x-range imputed to the trunk, and it grows as it moves away from the center. That is, cancels any contribution coming from the trunk region (where arm motion remains undetected), and keeps motion information found beyond the trunk. It is formally defined as:
where is the sigmoid function, introduces a horizontal stretching () or shrinking () of , and and cause horizontal shifts of the inflection points at which accelerates. This notation assumes the subject walks from right to left in the scene. Finally, and are estimated as the minimum and the maximum of the first derivative of the probability density function of foreground data along the x-axis. This process is illustrated in Figure 3 and formally stated below:
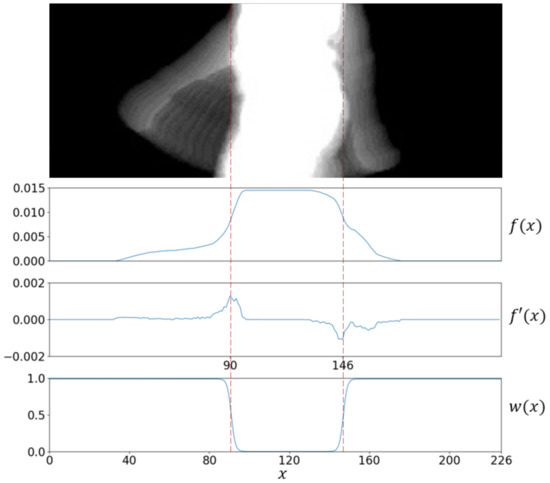
Figure 3.
From top to bottom, a ROI including arm motion, the probability density function of foreground data along the x-axis, the first derivative , and the weighting function with . The inflection points were estimated at and .
Experiments were designed in terms of (standard sigmoid function).
2.2.3. Modified Robinson Index
Let and be the PMI values computed on ROIs extracted from GEI and GEI, respectively. The following version of the Robinson index is used to measure AS asymmetry (ASA):
According to [27], ASA measures the disagreement between two measurements made from discrete time events. However, unlike conventional discrete approaches, Equation (4) summarizes a spatio-temporal disagreement over the entire gait cycle.
3. Results
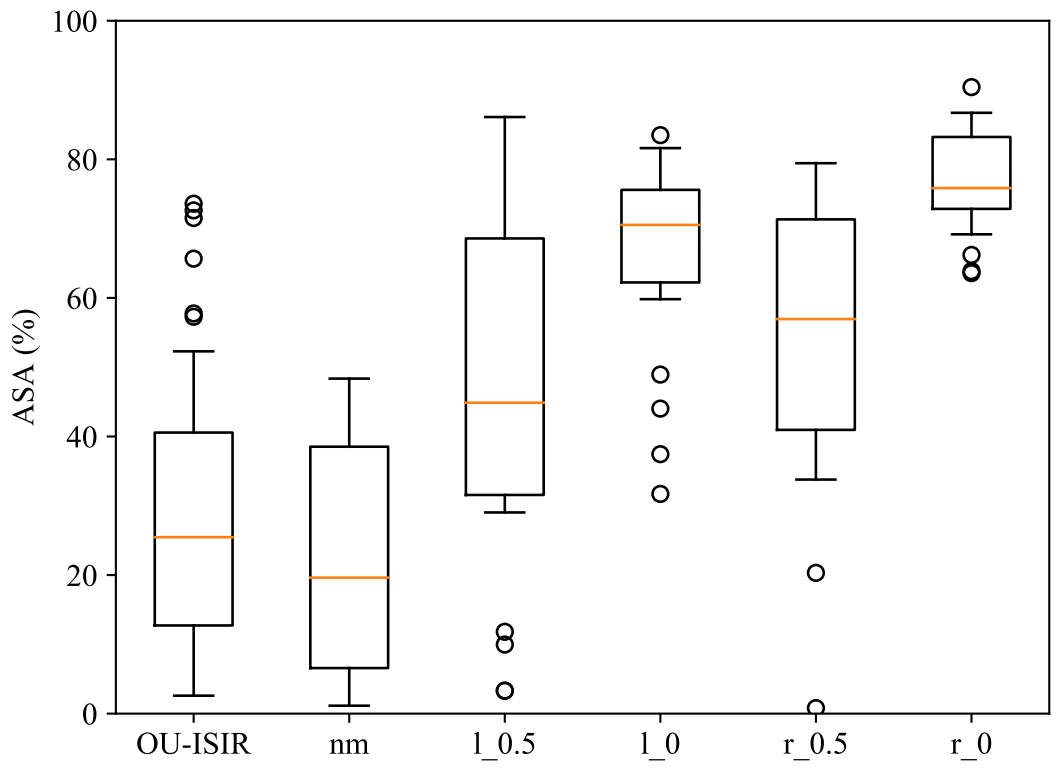
Figure 4 shows the ASA distributions from OU-ISIR and from the five INIT AS styles. Similar distribution patterns can be found in the two independent groups of normal gait, OU-ISIR and , with medians and , respectively. The distribution shapes of and styles (one arm partially swings) were also similar with medians and , respectively, as well as the shapes of and styles (one arm remains motionless) with medians and , respectively. Despite the big differences between the three levels of motion, one might expect and results closer to 1. However, marginal movement registered in the trunk contour affects the perceived asymmetry.
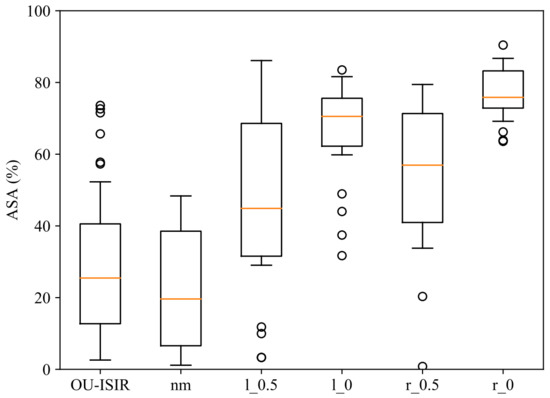
Figure 4.
ASA distributions in OU-ISIR and the five styles of INIT.
Considering the presence of outliers and the large differences in variances, the non-parametric Mann–Whitney U test [28] was performed to determine whether two groups of ASA measurements can be considered the result of the same data generating process (null hypothesis ). Besides, to reduce the impact of subject variability, the Wilcoxon signed-rank test [29] was also applied to paired mean performances of subjects in the INIT database. Both tests were carried out using the implementations provided by the module scipy.stats from the Python library SciPy. Table 1 shows p-values of both tests, stressing rejections at a significance level of .

Table 1.
Results of non-parametric tests between the column and the row groups in terms of Mann–Whitney p-value/Wilcoxon p-value. Bold p-values denote rejection at (differences are significant). Symbol ‘–’ denotes a meaningless comparison.
The main findings can be summarized as follows: (1) differences between the two independent groups of normal gait (OU-ISIR and ) were not significant; (2) differences between each pair of styles with different motion patterns (OU-ISIR/ vs. , OU-ISIR/ vs. , vs. , vs. ) were statistically significant in both tests; (3) differences between and styles were not significant in either of the two tests; (4) differences between and styles were significant in both tests. The first three results agree with expectations. That is, the ASA measure was able to establish statistical similarity between independent groups of normal gait, as well as to statistically differentiate the three levels of AS asymmetry, in most cases with very small p-values. The fourth result could be due to the left arm preference and the greater visibility of the left arm in this experiment. Both arguments are discussed below.
4. Discussion
As a first general observation, the method was able to statistically differentiate each AS asymmetry pattern from the rest, while found statistical equivalence between asymmetry measurements of the two normal gait databases acquired under very different conditions. As stated in [9,14,15], our ASA measure on healthy gait also showed a small but clear degree of asymmetry. This should be consider when assessing gait disorders.
Although a direct comparison with previous works is meaningless (they involve different data and acquisition technologies), some insight could be drawn from contrasting means and standard deviations when ASA is measured, as in (4). For example, refs. [14,15] reported mean asymmetries of and from healthy young and older people, respectively. These results are highly consistent with and obtained from the OU-ISIR and the INIT styles, respectively.
Results on the INIT database also showed a little more asymmetry when the left arm moved freely and the right one had motion restrictions (, ) than in their opposite settings (, ). On the one hand, this result is consistent with the left arm preference found in [14,15] on healthy subjects who were mostly right-handed. On the other hand, the walking direction in the INIT gait sequences, from right to left, kept the left arm closer to the camera and, potentially, more visible. This may have introduced some bias in the results. However, statistically significant differences were proved for both arms. In a real scenario, this could be addressed by asking the patient to walk both from right to left and from left to right, and by combining the two measurements.
Considering the previous discussion, the value of the proposed method can be reasonably stated as a low-cost effective solution to quantify ASA from a single 2D gait video under a cooperative setting. Simple mobile applications can then be easily conceived to assist primary care professionals who usually lack specialized technologies and training.
5. Conclusions
Measuring arm swing asymmetry (ASA) can provide insight into health and quality of life, anticipate risks, and suggest appropriate therapies. Despite this, most gait studies still disregard arm swing. A cross-platform method for measuring ASA based on only a single 2D gait video was introduced. It is quite independent of acquisition conditions and spatio-temporal resolution. The method involves a novel silhouette-based gait representation and an algorithm to quantify arm motion. The method was validated on two gait video datasets, one with healthy subjects walking normally and one with healthy subjects simulating different levels of ASA. Experiments supported by two non-parametric statistical tests showed consistent results on two independent groups of normal gait sequences, and significant differences between groups with distinct asymmetry patterns. Mean ASA measurements were highly consistent with results reported in other works from different datasets and sensing technologies. Future work could explore more accurate functions of measuring arm motion, as well as possibilities of deploying this low-cost approach in real environments.
Author Contributions
Conceptualization, R.A.M., R.F.-B. and J.O.; Methodology, R.A.M. and J.O.; Software, D.C. and J.O.; Validation, R.A.M., D.C. and R.F.-B.; Formal analysis, R.A.M. and R.F.-B.; Investigation, R.A.M. and J.O.; Data curation: R.A.M., D.C. and J.O.; Writing—original draft preparation, R.A.M. and D.C.; Writing—review and editing, R.A.M. and R.F.-B.; Supervision, R.A.M. and R.F.-B. All authors have read and agreed to the published version of the manuscript.
Funding
This research received no external funding.
Data Availability Statement
Data used in this study can be downloaded from http://bit.ly/3BcHYA2 (accessed on 21 October 2021).
Conflicts of Interest
The authors declare no conflict of interest.
Abbreviations
The following abbreviations are used in this manuscript:
| AS | Arm Swing |
| PD | Parkinson’s Disease |
| GEI | Gait Energy Image |
| ROI | Region Of Interest |
| PMI | Perceptible Motion Index |
| ASA | Arm Swing Asymmetry |
References
- Bruijn, S.M.; Meijer, O.G.; Beek, P.J.; van Dieën, J.H. The effects of arm swing on human gait stability. J. Exp. Biol. 2010, 213, 3945–3952. [Google Scholar] [CrossRef] [PubMed]
- Umberger, B.R. Effects of suppressing arm swing on kinematics, kinetics, and energetics of human walking. J. Biomech. 2008, 41, 2575–2580. [Google Scholar] [CrossRef] [PubMed]
- Yizhar, Z.; Boulos, S.; Inbar, O.; Carmeli, E. The effect of restricted arm swing on energy expenditure in healthy men. Int. J. Rehabil. Res. 2009, 32, 115–123. [Google Scholar] [CrossRef] [PubMed]
- Kubo, M.; Ulrich, B. A biomechanical analysis of the high guard position of arms during walking in toddlers. Infant Behav. Dev. 2006, 29, 509–517. [Google Scholar] [CrossRef]
- Meyns, P.; Desloovere, K.; Van Gestel, L.; Massaad, F.; Smits-Engelsman, B.; Duysens, J. Altered arm posture in children with cerebral palsy is related to instability during walking. Eur. J. Pediatr. Neurol. 2012, 16, 528–535. [Google Scholar] [CrossRef]
- Lewek, M.D.; Poole, R.; Johnson, J.; Halawa, O.; Huang, X. Arm swing magnitude and asymmetry during gait in the early stages of Parkinson’s disease. Gait Posture 2010, 31, 256–260. [Google Scholar] [CrossRef]
- Huang, X.; Mahoney, J.M.; Lewis, M.M.; Du, G.; Piazza, S.J.; Cusumano, J.P. Both coordination and symmetry of arm swing are reduced in Parkinson’s disease. Gait Posture 2012, 35, 373–377. [Google Scholar] [CrossRef]
- Hejrati, B.; Chesebrough, S.; Foreman, K.B.; Abbott, J.J.; Merryweather, A.S. Comprehensive quantitative investigation of arm swing during walking at various speed and surface slope conditions. Hum. Mov. Sci. 2016, 49, 104–115. [Google Scholar] [CrossRef]
- Koh, S.B.; Park, Y.M.; Kim, M.J.; Kim, W.S. Influences of elbow, shoulder, trunk motion and temporospatial parameters on arm swing asymmetry of Parkinson’s disease during walking. Hum. Mov. Sci. 2019, 68, 102527. [Google Scholar] [CrossRef]
- Dietz, V. Quadrupedal coordination of bipedal gait: Implications for movement disorders. J. Neurol. 2011, 8, 1406. [Google Scholar] [CrossRef][Green Version]
- Meyns, P.; Bruijn, S.M.; Duysens, J. The how and why of arm swing during human walking. Gait Posture 2013, 4, 555–562. [Google Scholar] [CrossRef]
- Rubino, F.A. Gait disorders. Neurologist 2002, 8, 254–262. [Google Scholar] [CrossRef]
- Ospina, B.M.; Chaparro, J.A.V.; Paredes, J.D.A.; Pino, Y.J.C.; Navarro, A.; Orozco, J.L. Objective arm swing analysis in early-stage Parkinson’s disease using an RGB-D camera (Kinect). J. Park. Dis. 2018, 8, 563–570. [Google Scholar] [CrossRef]
- Kuhtz-Buschbeck, J.P.; Brockmann, K.; Gilster, R.; Koch, A.; Stolze, H. Asymmetry of arm-swing not related to handedness. Gait Posture 2008, 27, 447–454. [Google Scholar] [CrossRef]
- Killeen, T.; Elshehabi, M.; Filli, L.; Hobert, M.A.; Hansen, C.; Rieger, D.; Maetzler, W. Arm swing asymmetry in overground walking. Sci. Rep. 2018, 8, 12803. [Google Scholar] [CrossRef]
- Riad, J.; Coleman, S.; Lundh, D.; Broström, E. Arm posture score and arm movement during walking: A comprehensive assessment in spastic hemiplegic cerebral palsy. Gait Posture 2011, 33, 48–53. [Google Scholar] [CrossRef]
- Wochatz, M.; Tilgner, N.; Mueller, S.; Rabe, S.; Eichler, S.; John, M.; Völler, H.; Mayer, F. Reliability and validity of the Kinect V2 for the assessment of lower extremity rehabilitation exercises. Gait Posture 2019, 70, 330–335. [Google Scholar] [CrossRef]
- Fuertes-Muñoz, G.; Mollineda, R.A.; Gallardo-Casero, J.; Pla, F. A RGBD-Based Interactive System for Gaming-Driven Rehabilitation of Upper Limbs. Sensors 2019, 19, 3478. [Google Scholar] [CrossRef]
- Auvinet, E.; Multon, F.; Manning, V.; Meunier, J.; Cobb, J.P. A Validity and sensitivity of the longitudinal asymmetry index to detect gait asymmetry using Microsoft Kinect data. Gait Posture 2017, 51, 162–168. [Google Scholar] [CrossRef]
- Ortells, J.; Herrero-Ezquerro, M.T.; Mollineda, R.A. Vision-based gait impairment analysis for aided diagnosis. Med. Biol. Eng. Comput. 2018, 56, 1553–1564. [Google Scholar] [CrossRef]
- Verlekar, T.T.; Soares, L.D.; Correia, P.L. Automatic classification of gait impairments using a markerless 2D video-based system. Sensors 2018, 18, 2743. [Google Scholar] [CrossRef] [PubMed]
- Tan, D.; Pua, Y.H.; Balakrishnan, S.; Scully, A.; Bower, K.J.; Prakash, K.M.; Clark, R.A. Automated analysis of gait and modified timed up and go using the Microsoft Kinect in people with Parkinson’s disease: Associations with physical outcome measures. Med. Biol. Eng. Comput. 2019, 57, 369–377. [Google Scholar] [CrossRef] [PubMed]
- Eltoukhy, M.; Kuenze, C.; Oh, J.; Wooten, S.; Signorile, J. Kinect-based assessment of lower limb kinematics and dynamic postural control during the star excursion balance test. Gait Posture 2017, 58, 421–427. [Google Scholar] [CrossRef] [PubMed]
- Makihara, Y.; Mannami, H.; Tsuji, A.; Hossain, M.A.; Sugiura, K.; Mori, A.; Yagi, Y. The OU-ISIR gait database comprising the treadmill dataset. Trans. Comput. Vis. Appl. 2012, 4, 53–62. [Google Scholar] [CrossRef]
- Han, J.; Bhanu, B. Individual recognition using gait energy image. IEEE Trans. Pattern Anal. Mach. Intell. 2005, 28, 316–322. [Google Scholar] [CrossRef]
- LaRoche, D.P.; Cook, S.B.; Mackala, K. Strength asymmetry increases gait asymmetry and variability in older women. Med. Sci. Sport. Exerc. 2012, 44, 2172. [Google Scholar] [CrossRef]
- Viteckova, S.; Kutilek, P.; Svoboda, Z.; Krupicka, R.; Kauler, J.; Szabo, Z. Gait symmetry measures: A review of current and prospective methods. Biomed. Signal Process. Control 2018, 42, 89–100. [Google Scholar] [CrossRef]
- Mann, H.B.; Whitney, D.R. On a test of whether one of two random variables is stochastically larger than the other. Ann. Math. Stat. 1947, 18, 50–60. [Google Scholar] [CrossRef]
- Wilcoxon, F. Individual comparisons by ranking methods. Biom. Bull. 1945, 1, 80–83. [Google Scholar] [CrossRef]
Publisher’s Note: MDPI stays neutral with regard to jurisdictional claims in published maps and institutional affiliations. |
© 2021 by the authors. Licensee MDPI, Basel, Switzerland. This article is an open access article distributed under the terms and conditions of the Creative Commons Attribution (CC BY) license (https://creativecommons.org/licenses/by/4.0/).


