Article

Self-Assessment of Soft Skills of University Teachers from Countries with a Low Level of Digital Competence

by
Álvaro Antón-Sancho
1,
Diego Vergara
2,* and
Pablo Fernández-Arias
2
1
Department of Mathematics and Experimental Science, Catholic University of Ávila, C/Canteros, s/n, 05005 Avila, Spain
2
Department of Mechanical Engineering, Catholic University of Ávila, C/Canteros, s/n, 05005 Avila, Spain
*
Author to whom correspondence should be addressed.
Electronics 2021, 10(20), 2532; https://doi.org/10.3390/electronics10202532
Submission received: 26 September 2021 / Revised: 8 October 2021 / Accepted: 13 October 2021 / Published: 17 October 2021

Abstract

:
The lockdown of March and April 2020 as a consequence of the COVID-19 pandemic has forced relevant changes in the educational environment in a very short period of time, making it necessary to suspend in-person instruction and generating the need to implement virtual learning mechanisms. In a future post-COVID-19 hybrid educational model, it will be necessary for university teachers to acquire an optimal degree of digital competence, as a combination of different competencies, namely, (i) technical, (ii) digital, and (iii) soft. Soft skills have been shown to have a decisive influence on the development of digital competence. The aim of this study was to analyze the degree of acquisition of soft skills in Latin American university teachers whose countries are less digitally developed. For this purpose, the countries with the lowest Global Innovation Index (GII) were selected: (i) Panama; (ii) Peru; (iii) Argentina; (iv) El Salvador; (v) Ecuador; (vi) Paraguay; (vii) Honduras; and (viii) Bolivia. To achieve this objective, it was necessary to develop a questionnaire on the self-concept of soft skills, based on the soft skills included in the Bochum Inventory of Personality and Competences (BIP). Results obtained from statistical analysis of the data collected from a sample of 219 participants show that university teachers are sufficiently prepared, in terms of their soft skills, for the increase in digital competence required as a result of the COVID-19 crisis, despite the low level of digital development in their respective countries.

1. Introduction

The global crisis initiated in 2020 due to the COVID-19 pandemic has resulted in structural changes in many dimensions of life in all societies around the world. In particular, it has forced significant adjustments in the work processes of companies and institutions. In the specific field of higher education, in a very short period of time, it has been necessary to suspend in-person instruction, and remote learning has been adopted to reduce the spread of the COVID-19 disease. In the university education system, there is currently a need to implement virtual classroom delivery mechanisms and to introduce technological tools that mediate all teaching and learning processes. The consequence of these factors is that university teachers have to develop skills that are appropriate for the emergence of these new technologies in their teaching work [1].
The specialized literature has portrayed these skills as 21st century skills [2]. These new capabilities comprise specific skills—both technical and digital—and soft skills [3], and this combination of skills has also been referred to as digital competence [4]. Specific skills refer to measurable and job-specific abilities. Soft skills, however, encompass transversal skills, such as those that affect the worker’s communicative capacity, critical thinking, collaborative and social skills, and problem-solving abilities. In turn, the concept of soft suggests the opposite of hard [5]. Hard skills are those that are developed at a specific level in a given profession, and are composed of particular and eminently technical or methodological contents, such as knowing the structure of a didactic unit, knowing how to operate a machine, or knowing the side effects of a medication [6]. By comparison, soft skills are not specific to a particular family of jobs, but are transversal to all of them. Industry 4.0 requirements are transferred to the sphere of professional competence profiles while reflecting the need for combining technical and digital skills with soft skills for the 21st century [7]. The professional competences for the 21st century include, but are not limited to, economic competences, project management, and digital skills [8].
For all these reasons, soft skills are essential for university teachers to reach an optimal level of digital competence, which is necessary for the development of any training action in a virtual learning environment. The European Commission supports this idea and links, in its Digital Education Action Plan [9], soft skills with digital skills, stating the need for adequate training at the Higher Level to achieve a solid development level of soft skills and, therefore, an adequate level of digital competence. In fact, soft skills, being transversal competencies, nevertheless have an intimate relationship with digital competencies, because they enable the development and transfer of digital competencies, particularly in the long term. Thus, previous research has highlighted a combined digital–soft competency [10].
Specifically, soft skills are personal and interpersonal competencies linked to the character and personality of individuals [11,12]. As a result, these skills are cross-cutting and transferable between the different areas of learning and the academic and working life of individuals. It is possible to identify soft skills linked to aspects of the subject’s personality (such as communication and teamwork skills, motivation, or leadership) and others associated with the intellectual dimension of the person (such as critical thinking or analytical reasoning) [13]. These qualities are required by employers, particularly for the development of technical skills [14], and have a decisive influence not only on professional development, but also on education and training, social relations, and health [15]. Studies show that the most frequent perception of employers is that university graduates have not sufficiently developed these skills to the level required in employment [16,17]. Similarly, university graduates from different areas of knowledge state that they are generally dissatisfied with their training in the aforementioned soft skills, which is a hindrance to their insertion in a technical and digitalized world [18].
Faced with a future hybrid post-COVID-19 educational model and the existing gap between the skills demanded by employers and those of future professionals, this study examined the self-concept of soft skills expressed by a group of university teachers from all areas of knowledge who work in countries with a low level of development, innovation, and digitalization (according to the Global Innovation Index (GII) [19]). University teachers were the focus because they are professionals who are required to have a high level of digital competence (especially since the emergence of COVID-19 and the consequent transition to digital educational environments), and because there is an urgent need to train future professionals who are required to immerse themselves in an increasingly technical and digitized labor market, in which soft skills play a crucial role [20,21]. The main objective was to assess the perception of university teachers in these countries about their soft skills despite the scarce digital development of their environment. This will make it possible to estimate whether, among university teachers in these countries, there is adequate training availability in soft skills that will enable the generation of adequate digital training in the immediate future or whether, on the contrary, it is necessary to work on the training of soft skills prior to the development of digital technologies in the field of higher education. For this purpose, the Bochum Inventory of Personality and Competences (BIP) [22] was used as a reference for the development of the self-assessment questionnaire of soft skills in these university teachers.
The Global Innovation Index (GII) [19] was used to determine the countries with the lowest economic, technological, and digital development. The GII analyzes 130 countries from the perspective of the development of their economies and their innovation, with technical and digital development among its key criteria [23,24]. Latin American countries were chosen because this geographical area, in addition to Africa, comprises the largest concentration and number of countries with low GII (compared to the most developed countries). In Southeast Asia, for example, there are only four countries whose GII is in the range of the countries analyzed in this paper (Indonesia, Cambodia, Laos, and Myanmar) [19]. Furthermore, the case of Africa is very particular because, first, a significant proportion of its countries are not included in the GII. Moreover, it is a region that is heavily dependent on the outside world, with very little technical development. Furthermore, the data measured by the GII do not make it possible to ensure that the innovation index accurately represents the degree of technical development and digital competence of African countries [19]. In Latin America, by comparison, the GII better represents its level of scientific, technical, and digital development.
Examination of the GII scores of the Latin American countries analyzed by the aforementioned index in 2021 [19] (the indexes of the United States and Canada are much higher), shows that the highest index is 33.9 (Chile) and the lowest is 22.4 (Guatemala). The average GII in Latin American countries is 27.91, with a standard error of the mean equal to 1.05. In order to identify the countries that were taken as a reference for this study, i.e., those with a low GII, the mean plus the standard error of the mean, which is 28.96, was taken as the maximum index. Consequently, the self-concept of soft skills was analyzed in a group of Latin American university teachers from countries with a GII less than or equal to this value (Table 1). Panama was also included (with a GII equal to 29) because its index is almost identical to the upper limit that was defined.
According to the Gini Index, which is used by the World Bank to evaluate inequality in each country, using a range from 0% (minimum inequality) to 100% (maximum inequality), many of the countries with low GII have high levels of inequality (e.g., 49.8 for Panama, 45.1 for Peru, 42.9 for Argentina, 38.8 for El Salvador, 45.7 for Ecuador and Paraguay). Bearing in mind that the universities are located in favored areas of the cities and their teachers are part of the most affluent sectors of the societies of the respective countries, this fact implies that the results obtained cannot be extrapolated to the entire societies of the geographical area involved, but only to the sector of university teachers. This social sector will, in fact, be more similar in its socio-economic aspects to the social bulk of more technologically advanced societies (e.g., some European countries such as Spain or Italy).
The results of the questionnaire were analyzed at a descriptive level in order to assess the participants’ perception of their self-concept regarding their soft skills. An inferential analysis was also carried out to detect whether there are statistically significant differences in these self-concepts when differentiated by certain non-academic characteristics (such as gender or age) or academic characteristics (such as the area of knowledge, the length of teaching experience or the nature—private or public—of the university of the teacher).

2. Materials and Methods

In this work, quantitative research was carried out on the self-concept of soft skills of a group of university teachers from different areas of knowledge located in Latin American countries with a lower Global Innovation Index (GII ≤ 29). Consequently, the dependent variables studied were soft skills, which were grouped into the five subscales of skills, as explained. The study was descriptive and involved inferential statistical analysis, and had the following main objectives: (i) to explore the self-concept of university teachers in Latin American countries with lower GII about their soft skills; (ii) to analyze the differences that exist in the self-concepts of the aforementioned university teachers according to their gender, age, teaching experience, area of knowledge and the nature (private or public) of the institution where they carry out their work. These variables were examined in an attempt to describe the influence of certain sociological (gender or age) and academic (area of knowledge, teaching experience, or nature of the educational institution) aspects on the self-concept that the participants express about their soft skills and to identify, if any, the gaps induced in this self-concept by the above variables.
The study was carried out using a questionnaire designed by the Bochum Inventory of Personality and Competences (BIP) [22]. The questionnaire is made up of 19 questions, each of which requests the evaluation of the self-concept on one of the 19 soft skills under consideration. All the questions are Likert-type, from 1 to 5, with 1 corresponding to the lowest rating and 5 to the highest rating. The questions in the questionnaire are grouped into five families or scales, each corresponding to a family of soft skills: (i) Work motivation: results orientation, initiative for change, and leadership; (ii) Work behavior: conscientiousness, flexibility, and action orientation; (iii) Social skills: social intelligence, sociability, relationship development, teamwork, and influence; (iv) Psychic structure: emotional stability, work capacity, and self-confidence; and (v) Additional competences: sense of control, competitiveness, mobility, leisure orientation, and image distortion.
The questionnaire was answered freely, voluntarily, and anonymously by the participants. Table 2 shows the Cronbach’s alpha parameters for each of the scales of the questionnaire, which were used to assess the internal consistency of the instrument. All the parameters were between 0.8 and 0.9, which allowed us to assume that the questionnaire was reliable and had good internal cohesion in each of the scales into which it was divided.
The participants were selected through a conventional probability sampling process. In total, the sample consisted of 219 teachers from different universities from the eight Latin American countries included in the GII database and whose index is less than or equal to 29 (the mean plus the standard error of the Latin American countries’ indexes). Specifically, the distribution of the eight participating countries is shown in Table 1.
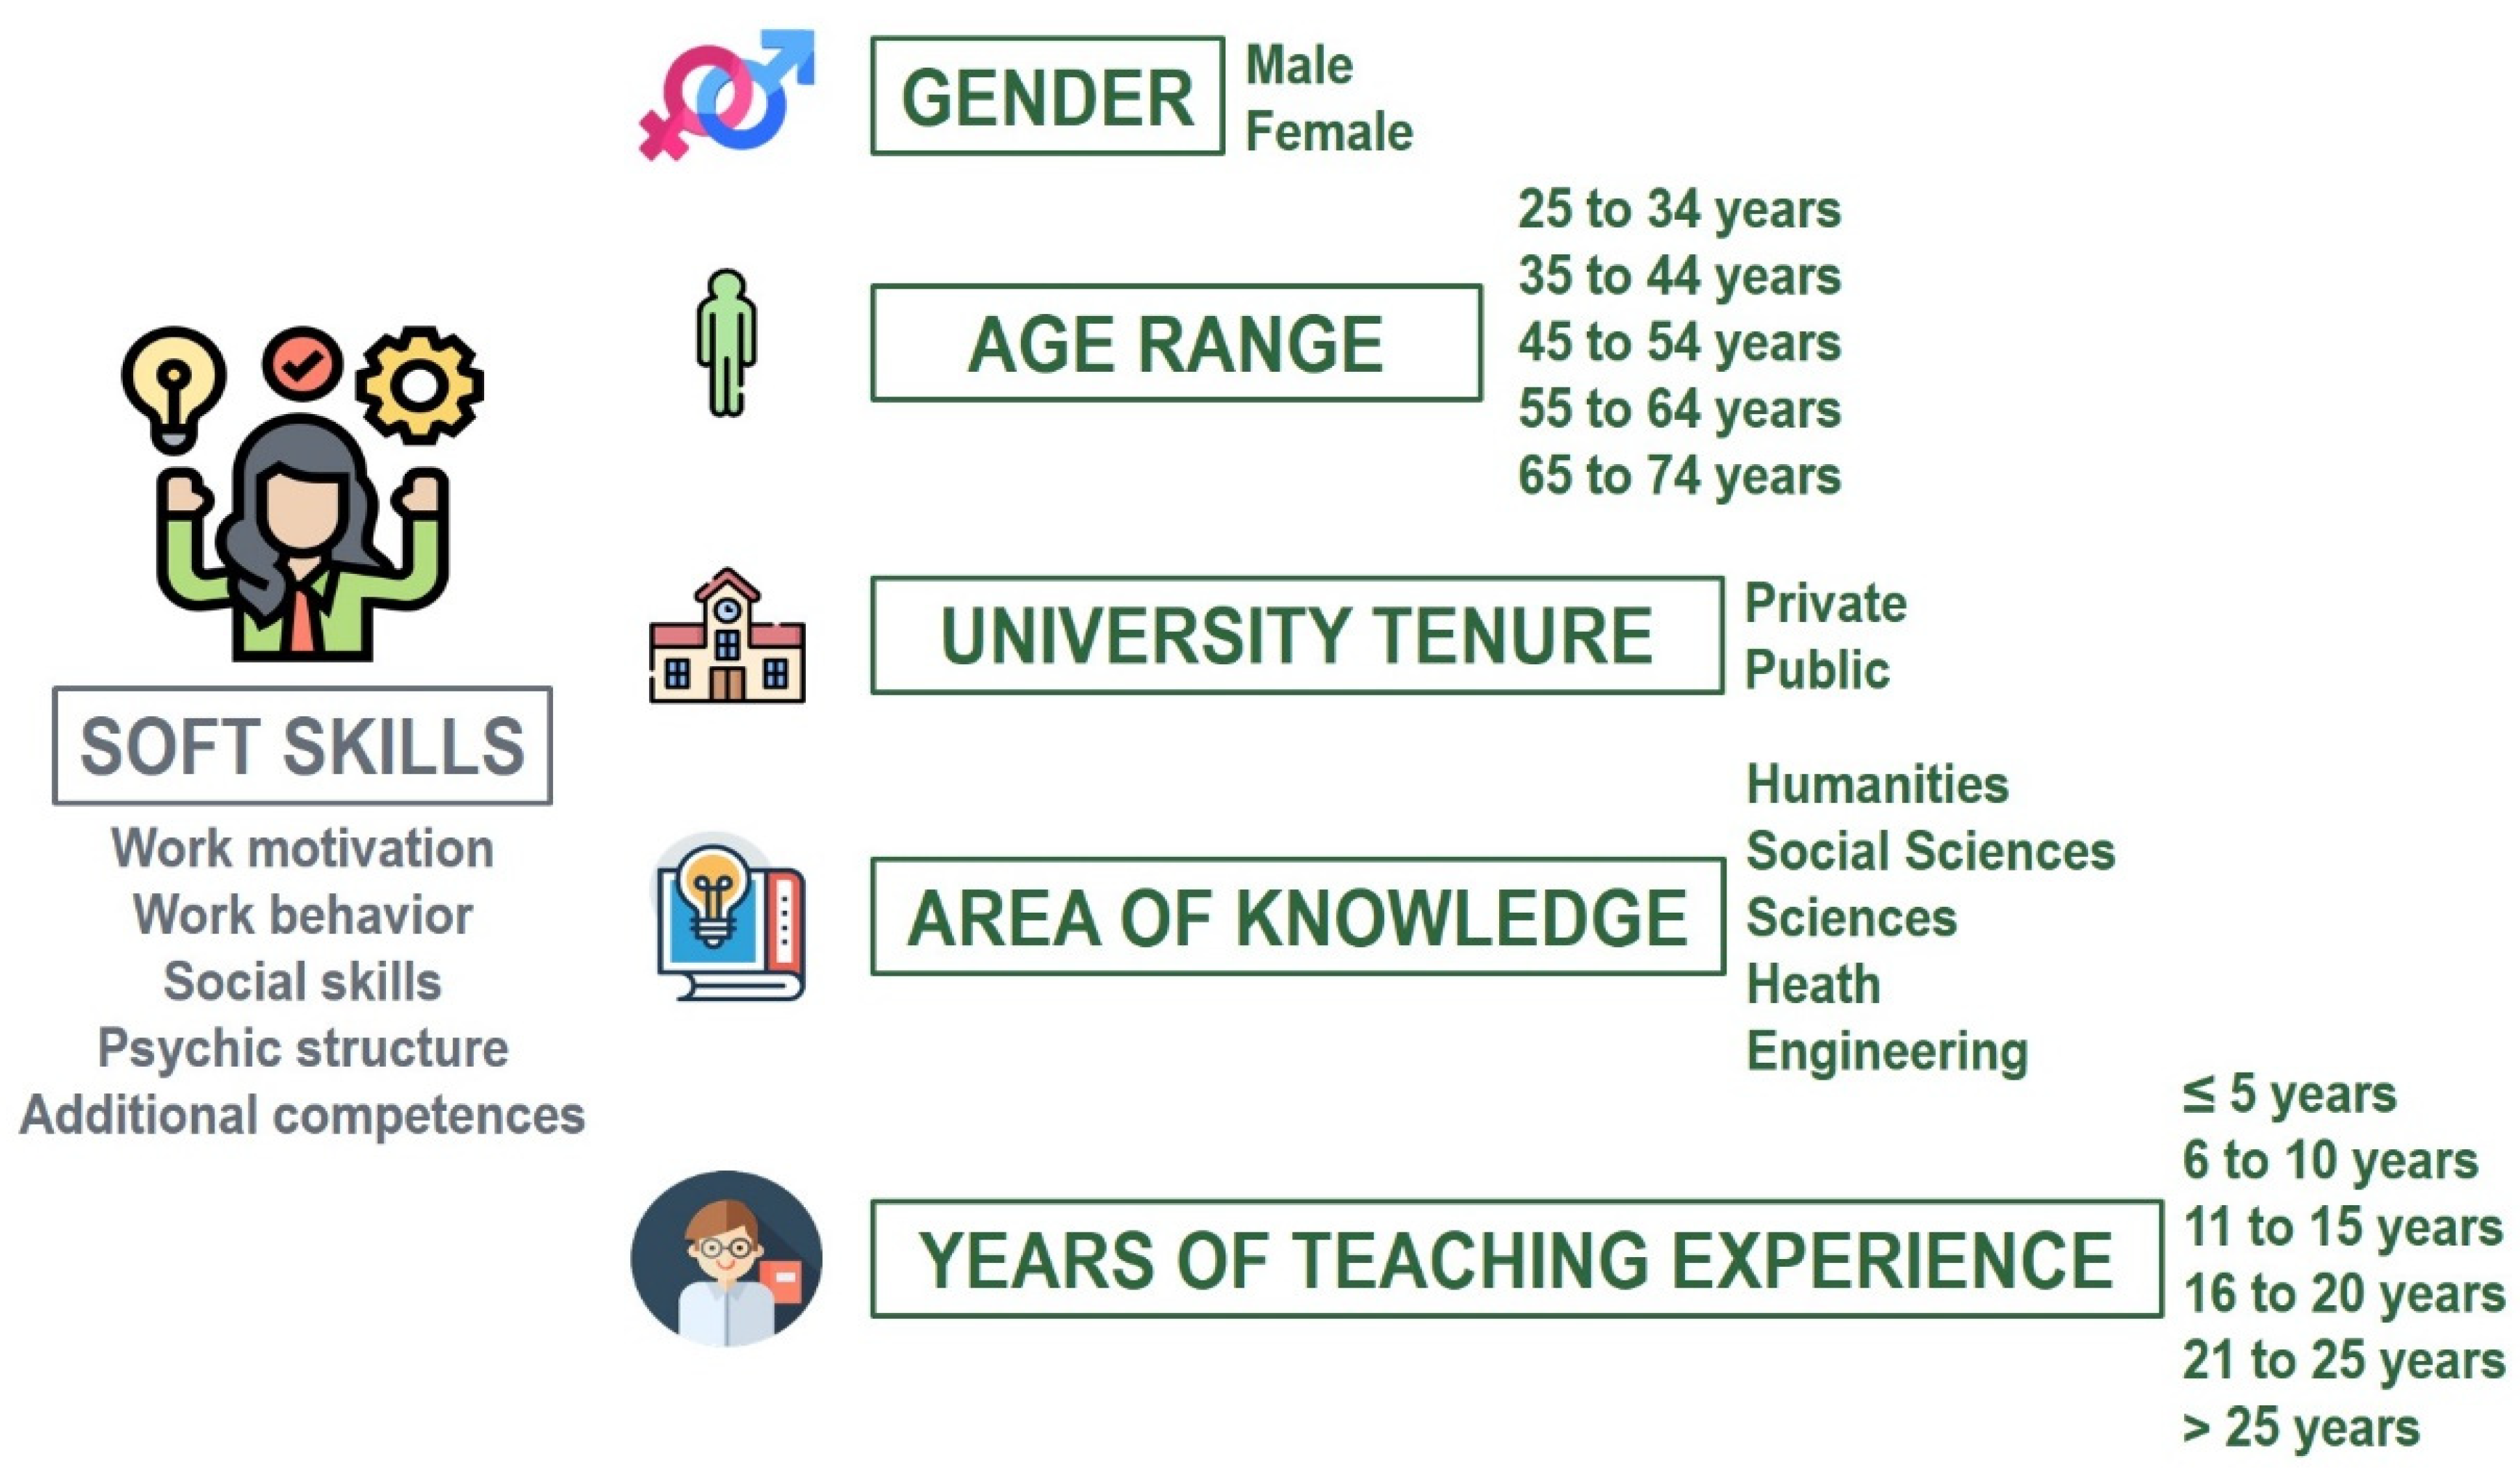
The study used independent variables of two different natures: first, variables that affect the sociological profile of the participants. These are gender (dichotomous in nature) and age (grouped in 10 year ranges, from 25 to 74 years; therefore, it is polytomous in nature). The rest of the independent variables concern different dimensions of the academic activity of the participants (Figure 1).
Specifically, the area of knowledge (whose values could be Arts and Humanities, Social and Legal Sciences, Sciences, Health Sciences, or Engineering and Architecture), the years of university teaching experience (grouped in 5 year ranges, from less than or equal to 5 years to more than 25), and the nature of the university institution where the teacher works (private or public). Of these three variables, the first two are polytomous and the latter is dichotomous.
For the inferential study, the Mann–Whitney test (for dichotomous variables) or the Kruskal–Wallis test (for polytomous variables) for comparison of means, and the Levene test for comparison of variances, were applied to compare results when the sample of participants was differentiated by each of the independent variables. The reason for choosing nonparametric tests in inferential analysis for the comparison of means, instead of parametric tests such as the t-test or ANOVA, is that the p-values of the normality tests applied to the different items of the questionnaire do not allow us to assume that the data follow a normal distribution. This analysis is original and innovative, because previous research was concerned with analyzing the need for the cultivation of soft skills in teachers in their training stage [25], rather than the analysis of these characteristics in active teachers. Figure 1 shows an outline of the methodology followed in this statistical study, and Figure 2 shows the distribution of participants according to each of the independent variables. Sector diagrams are used for nominal variables and histograms for continuous variables grouped by ranges.
In Figure 2a, it can be observed that there are notably more females than males (around 67% more). In terms of age ranges, the largest number of participants is in the middle range, from 45 to 54 years old, with the least number of participants at the extremes (from 25 to 34 or from 65 to 74 years old). It can be seen that the distribution by areas of knowledge tends to be more homogeneous, although with a certain superiority in the Engineering area (Figure 2c). With regard to teaching experience, the sample of participants with more than 25 years of experience is clearly in the majority, followed by those with between 21 and 25 and those with between 16 and 20 years of experience. The lowest frequency is found among participants with less than or equal to 5 years of experience. Finally, although there is a certain superiority in the number of teachers from public universities than from private universities, the difference is very small, in relative terms. In fact, the statistics of the chi-square test of goodness of fit with one degree of freedom (chi-square = 1.3196, p-value = 0.2507) allow us to assume, with a significance level of 0.05, that the participants are distributed homogeneously between teachers from private and public universities. For the rest of the independent variables, the chi-square goodness-of-fit test statistics yield p-values below 0.05, which does not allow the corresponding distributions of participants to be homogeneous within the sample.

3. Results

3.1. Global Results

Table 3 shows the descriptive statistics of the overall answers to the different scales of the questionnaire. The mean answers show that the participants generally have good or very good self-concepts on all the soft skills scales. In fact, all the average answers are above 4, except for the additional skills scale, where the average falls slightly below 4. The scale of additional skills has the greatest dispersion in the answers because it has the greatest standard deviation. It also has the highest coefficient of variation. Nevertheless, it can be assumed that the answers are homogeneously distributed around the mean in all the scales because the coefficients of variation are all less than 30%. It is interesting to note that the work behavior and psychic structure scales present the highest mean answers (4.42 and 4.44, respectively) with the lowest data dispersions (the standard deviations are 0.70 and 0.73, respectively).
Regarding skewness, measured through Pearson’s skewness coefficient, all the scales present high negative skewness (or moderate, in the case of the additional skills scale), with moderate skewness being understood as that in which the Pearson coefficient ranges between −0.5 and −1, and high skewness as that in which it is less than −1. This shows a notable polarization of the answers towards values 4 and 5. In fact, the mode is 4 in all the scales. The fact that the mean answer drops to 3.76 in the case of additional skills is due to the fact that the data dispersion is greater and the frequency of answers 1, 2, and 3 is higher, as indicated by the fact that the skewness is closer to 0.
Figure 3 shows the bar charts of the overall relative frequencies of the different scales of the questionnaire. It can be seen that, in the scales of work motivation, social skills, and additional skills, the modal value is 4, and its frequency exceeds 40% in all cases. The second most frequent answer is 5 in the three scales mentioned, and its frequency exceeds 40% in work motivation, is slightly below 40% in social skills, and drops to almost 25% in additional skills. Nonetheless, between the two values corresponding to high self-concepts in these scales, more than 80% of the participants in the work motivation and social skills scales and slightly more than 67% in additional skills are grouped together.

3.2. Gender

When differentiated by gender, the answers show high or very high self-concepts in the scales of motivation and work behavior, social skills, and psychic structure, with moderate or high negative skewness of the distribution (especially in work behavior and psychic structure), and high self-concepts in additional skills, with moderate negative skewness (therefore, with a strong concentration of the answers around values 4 and 5). The modal values are maintained. It should be noted, however, that skewness is higher, in absolute value, in males than in females (Table 4), indicating that in males the concentration of answers around the high and very high self-concepts on all scales is stronger.
Nevertheless, there are some significant differences between genders in terms of the distributions of the answers. First, as already noted in the description of the results, males have slightly lower mean self-concepts than females on all scales except for additional skills (Table 4). The Mann–Whitney test statistics in Table 5 show that only a statistically significant difference in the mean values between males and females can be assumed for the work behavior scale because the corresponding p-value is less than 0.05.
In terms of deviations, males have a higher dispersion of answers than females on all scales (Table 4). However, from Levene’s test with one degree of freedom, whose statistics are shown in Table 6, it follows that the differences can only be taken as significant in the work motivation scale. From this it can be assumed that the self-concept that females present in terms of work motivation is more solidly formed than that of males.

3.3. Age Range

When differentiated by age range, the answers of the different scales of the questionnaire result in the statistics shown in Table 7 and Table 8. From the data in Table 7, it follows that the lowest mean answers and the greatest dispersions are obtained in the additional skills scale for all age ranges. The oldest participants are those who give the lowest mean answers (except for the psychic structure scale, where they tie with the youngest participants), and they are also those with the highest standard deviation. Consequently, it is these participants who have the lowest self-concept of soft skills and, at the same time, the least consolidated self-concept.
Regarding skewness, as expressed in Table 8, in the work motivation scale, the youngest participants show a slight positive asymmetry (similar to a symmetrical distribution), whereas the remainder show moderate or high negative asymmetry (especially those between 35 and 54 years old). In work behavior, participants younger than 45 years or older than 64 years present moderate negative asymmetries, whereas participants between 45 and 64 years present high negative asymmetry. In social skills, those under 45 years old and those between 55 and 64 years old present moderate negative asymmetry, whereas those between 45 and 54 or older than 64 present high negative asymmetry. In psychic structure, all age ranges present high negative asymmetry, with the highest corresponding to participants between 45 and 64 years old. In additional skills, all age ranges show moderate negative asymmetry, with the smallest asymmetry corresponding to the oldest participants.
Regarding the mean values when differentiating the participants by age, the lowest mean self-concepts are presented by the participants of extreme ages (i.e., the youngest and the oldest), except in work behavior, where the youngest participants show the highest self-concept, and in additional skills, where those older than 54 years show a slightly lower self-concept than the youngest participants. However, the Kruskal–Wallis mean comparison test statistics with four degrees of freedom expressed in Table 9 show that, with significance level 0.05, the differences in the mean answers between the different age ranges cannot be assumed to be statistically significant. The p-value of the work behavior scale is, however, very close to the significance level, so that a certain significant gap by age range can be assumed in this scale.
Table 10 shows the statistics of the Levene’s test for comparison of variances with four degrees of freedom when differentiated by age ranges. As can be seen, the test detects significant differences in the deviations of the work motivation scale. Consequently, it follows from the data in Table 7 that the youngest participants, who clearly present the smallest deviation, state that they are more confident than the remainder of their self-concepts in terms of work motivation (although the mean value of their answers is not the highest in the sample on this scale).

3.4. Area of Knowledge

Table 11 shows the means and standard deviations of the overall answers to the different scales when differentiated by area of knowledge. The coefficients of variation and skewness, when differentiating by the same variable, are shown in Table 12. Participants from humanistic-social areas (Humanities and Arts and Social and Legal Sciences) present higher mean answers on the scales of motivation and work behavior, social skills, and additional skills than participants from scientific-technical areas (Sciences, Health Sciences, and Engineering and Architecture). In psychic structure, the means do not show large differences by areas of knowledge. Regarding the deviations, the most dispersed answers on the scale of work motivation, social skills, psychic structure, and additional skills are presented by the participants in Social Sciences and Legal Sciences. In the work behavior scale, the greatest dispersion is presented by the participants from Health Sciences, followed by the Social Sciences area.
With regard to average self-concepts, significant gaps are observed when participants are differentiated by their area of knowledge. Table 13 shows the statistics of the Kruskal–Wallis test for comparison of mean values with five degrees of freedom. In the p-values column, it can be seen that there are significant differences between the mean answers of the participants from the different areas of knowledge for the scales of motivation and work behavior, social skills, and additional skills. As previously noted in the results section, in these scales the mean answers are perceived to be higher in the humanistic-social areas than in the scientific-technical areas.
Consequently, it can be assumed that there is a gap between these two families of knowledge areas in terms of the aforementioned scales, in the sense that participants from humanistic-social areas have higher mean self-concepts than participants from scientific-technical areas. Assuming that the latter are the most sensitive to the level of technical and digital competence and who most realistically assess the possibilities of their immediate environment in this respect, this gap suggests the idea that a low level of competence influences the respondents’ perception of their soft skills.
Regarding deviations, the Levene’s test statistics with five degrees of freedom (Table 14) show significant differences by area of knowledge in the scales of social skills, psychic structure, and additional skills. Given that, in these scales, it is the participants of Social and Legal Sciences who show more dispersion, it can be concluded that the deviations in the answers of the participants of this area for the aforementioned scales are significantly higher than those of the rest of the areas. Consequently, the self-concepts on social skills, psychic structure, and additional skills are more weakly formed in the Social Sciences participants, even though their mean self-concepts are the highest (or the second highest, in the case of psychic structure) of the different areas for these scales.

3.5. Years of Teaching Experience

The statistics of the distributions of answers when differentiated by the range of years of teaching experience are shown in Table 15 and Table 16. In terms of the mean answers, the most notable observation is that the participants with less teaching experience present a lower mean self-concept in all scales. Regarding the remainder of the participants, those with more extensive teaching experience present lower mean self-concepts than the others in terms of motivation and work behavior. In the psychic structure scale, the participants with more experience present a higher mean self-concept, and in additional skills, the highest mean answers are given by participants with between 11 and 20 years of experience.
The mean data on social skills are very homogeneous when differentiated by areas of knowledge. Moreover, participants with less than or equal to 5 years of experience present moderate negative asymmetry in all scales; that is, a certain concentration of the answers in the values indicating high or very high self-concepts. However, in participants with between 6 and 10 years of experience, this asymmetry is reduced in all scales, except in the psychic structure scale, in which, in fact, the concentration of answers in very high self-concepts increases. The highest deviations in the motivation and work behavior scales were found among participants with teaching experience of 5 years or less, but in social skills, the greatest dispersion was found among participants with more than 20 years of experience.
Table 17 and Table 18 show the Kruskal–Wallis test statistics and Levene’s test results, respectively, with five degrees of freedom, for the different scales when differentiated by years of teaching experience. In this case, it can be observed that there are significant differences in the mean self-concepts for the scales of work motivation and additional skills. This fact allows us to assume that there is a gap, by time of teaching experience, in the participants’ self-concepts of their work motivation and additional skills. This gap can be interpreted in the sense that participants with less teaching experience have significantly lower self-concepts regarding these skills than the rest of the participants. From Table 18 we can deduce that it is not possible to assume homoscedasticity, when differentiating by years of teaching experience, in any scale except that of psychic structure. This reveals that the self-concept on motivation and work behavior of the participants with the least experience is the most weakly formed; in social skills it is the participants with more than 20 years of experience who have the least well-formed self-concept; and in additional skills this position is occupied by participants with between 6 and 15 years of experience.

3.6. University Tenure

Differentiating by the nature, private or public, of the university where the participants teach, we obtained the statistics described in Table 19 and Table 20. In both types of centers, the overall mean answers are above the value of 4 in all scales, except for additional skills, where the mean falls slightly below 4. Regardless of this, the mean self-concepts expressed by teachers from private universities are higher than those of participants from public universities. Although the dispersions are similar, they are slightly greater in private university teachers for the scales of work motivation, psychic structure, and additional skills. The opposite is true for the work behavior and social skills scales.
The Mann–Whitney test statistics for comparison of means presented in Table 21 show that there is a significant gap by type of center for the scales of work motivation and psychic structure. It can be assumed, therefore, that, for these soft skills, teachers from private universities manifest a significantly better self-concept than those from public universities. Regarding dispersion, homoscedasticity can be assumed for all scales when differentiating by type of center, as is immediately evident from the Levene’s test statistics with one degree of freedom shown in Table 22.

4. Discussion

As previously explained in the Results section, the mean is a descriptive statistic suitable for discussing the overall answers given by the participants on the different scales of the questionnaire. Therefore, in light of the data in Table 3 and Figure 3, it is possible to assume that participants’ self-concepts about their soft skills are high or very high. In this sense, there are discrepancies with respect to studies that analyze the perception that students have about the skills of their teachers [2,26,27]. This fact highlights that university teachers have a higher confidence in their own soft and digital competencies than they are able to project in the classroom. This suggests that the high mean values detected may be due, at least in part, to social desirability.
In addition, the high dispersion of additional skills with respect to the remainder of the soft skills scales is noteworthy. This fact may be due to the variety of additional skills, in contrast to the rest of the soft skills, which are grouped into families with a common definition. It would be interesting to explore the reasons for this difference by means of a study comparing the teachers’ ratings with those of their own students.
When the sample is differentiated by gender, a statistically significant gap is identified on the work behavior scale, in favor of females. Consequently, it can be assumed that females have a higher self-concept of their own abilities in terms of assuming responsibilities, work challenges, and team roles than males. Furthermore, the homogeneity of answers in this sense is greater in females than in males because they have a lower standard deviation, but this difference is not statistically significant. This fact is not accompanied by a significant superiority in the self-concepts on social skills or motivation, which indicates that the perception of females is more optimistic than that of males with regard to taking action. This fact shows that, in the higher education teaching profession, there is no gender gap in favor of males, as some studies indicate with respect to employment in general [28].
The results obtained when the sample is differentiated by age range lead to the following assertions: (i) younger teachers have a significantly higher self-concept on work behavior than the rest of the participants; and (ii) older teachers have the lowest self-concept on this scale. Again, the gap identified refers to the work behavior scale, and in this case the greatest optimism is detected among the youngest teachers. In this case, the youngest teachers demonstrate a higher self-appraisal in the competencies that relate to moving into action, which suggests the idea that their self-concept is conditioned by the outwardness and impetus of youth. However, examination of the data from the variable measuring years of teaching experience shows that the most significant gaps are in the scales of work motivation and additional competencies. Interestingly, it is the most experienced teachers who are more motivated, although they are not the ones who best value their own behavior in action. It is perceived, therefore, that there is a phenomenon derived from the strength and impetus of youth that explains the high self-evaluation of young people’s work behavior. However, the experience provides the participants with a more objective awareness of their limitations in terms of their teaching performance and, in addition, induces motivation to continue improving in their teaching activity.
The above analysis represents a novelty with respect to previous studies, which usually have not studied the existence of age or experience gaps in soft skills, but rather analyzed them in students or young professionals [1,2,29]. Alternatively, studies have also focused on digital competence by analyzing gaps by age ranges in university professors. For example, the results obtained here are in line with works such as [30,31], which attribute the highest digital competence rating to the youngest. However, the current results are in contradiction with other studies, such as [32], who found the highest digital competences among teachers under 40 years of age. The explanation for these divergences may lie in the reflection made by [32]: the area of knowledge is probably the variable that most strongly conditions the assessment of this type of competency, because it relates to the use of technologies, and being employed in this area depends strongly on the field in which the teacher is trained.
Undoubtedly, the variable that allows us to identify the greatest differences in the studied population regarding their self-concepts about soft skills is the area of knowledge. Indeed, the data shows that, with the exception of psychic structure skills, all the scales analyzed report significant differences by area of knowledge. In the light of the data, it is possible to corroborate that the observed gap is, in fact, derived from significant differences in their self-concepts between teachers of scientific-technical areas and teachers of humanistic-social areas. The latter are more optimistic in their evaluations on all scales. These observations are in line with works such as [29], which attribute intermediate levels of digital competence to teachers in the area of Health Sciences. However, the current results are in partial contradiction with studies such as that of [30], which attributes the highest levels of digital competence to teachers in the area of Engineering. These differences may be due to the fact that the present study compares all areas of knowledge. In this sense, it can be perceived that teachers from humanistic-social areas are more optimistic in their self-concepts because they usually have less training in digital and communication and information technologies, and are less experienced in them than teachers in the areas of Science or Engineering, who constantly use these technologies. In fact, [29] states that the development of digital competencies is associated with the development, generation, and dissemination of information. Hence, teachers with less experience in these areas show a more optimistic self-concept.
Finally, taking into consideration university tenure, it was found that, both in terms of work motivation and psychic structure, professors at private universities have a significantly more optimistic self-concept than those at public universities. This fact contradicts the results of analogous studies in which the population is made up of students rather than teachers [26,27]. This indicates that a greater effort can be made in public universities to develop students’ soft skills. This would explain why professors have a lower self-concept than their own students (because, somehow, students do not miss these skills, which have little presence in the teaching they receive).
This work also has some limitations. These include the lack of an analysis of the answers of the respondents by crossing the different independent variables. This would make it possible to deepen the analysis of the gaps studied and probably identify others. In addition, the article is limited to exploring the self-concepts of university teachers, without taking into account the students’ perception of their teachers’ skills or of themselves. This latter limitation indicates an interesting future line of research, which involves exploring the self-concept of soft skills of university students in different areas of knowledge and the perception they have of the skills of the faculty, and differentiating the results by the different sociological and academic variables taken into account in this paper. In this same sense, it would also be interesting to explore the opinion of employers, who, in some manner, also evaluate the skills of university graduates.

5. Conclusions

This study found that university teachers from countries with medium or low technical and innovation development (measured through the GII) express high or very high self-concepts on all the soft skills scales. Specialized studies frequently show that students’ perceptions of the soft skills (and also the digital competencies) of their teachers are intermediate or low. This discrepancy suggests the need for specific teacher training plans on the use of digital tools in didactic environments and on the development of the different aspects of soft skills. In addition, an interesting line of research would be to study and expose students’ suggestions on how teachers could improve their digital skills.
A certain gender gap was identified, in the sense that females expressed a more optimistic self-concept. This gap was especially significant in the work behavior skills: conscientiousness, flexibility, and action orientation. With respect to the area of knowledge, teachers in scientific-technical areas have a worse self-concept of their soft skills than those in humanistic-social areas. This shows that teachers in scientific-technical areas are more insecure about their soft skills. Their insecurity is probably caused by their broader technological knowledge, which makes them more realistic in their perceptions of their abilities.
Age was also identified as a discriminating variable in the self-perception of soft skills. Younger teachers with less teaching experience are more insecure and consequently express the lowest average self-concept in terms of their soft skills. Exceptions to this observation are the skills related to work behavior (conscientiousness, flexibility, and action orientation), in which younger teachers express the highest self-concept (moreover, this is the only scale in which the gap can be assumed to be statistically significant). Older participants also expressed lower self-concepts than those in the middle age ranges. It can be concluded, therefore, that age exerts a certain influence on the assessment of one’s own soft skills, in the sense that older teachers have a more pessimistic perception in this regard. The results in the case of long-lived and experienced participants may be due to the dependence caused by the accumulation of years of use of traditional teaching methodologies. However, the insecurity shown by younger and less experienced participants suggests the need for universities to propose training plans on digital competence oriented to novice teachers, and the role for countries with a higher level of digital development to help (for example, through teacher mobility plans or online training) university teachers from countries with less digital development.
A higher self-concept of teachers from private universities was found. This difference was especially significant in the skills of work motivation and psychic structure. This highlights the existence of differences between the two types of centers that result in greater optimism among private university teachers with respect to their soft skills. This is probably because private universities make a greater investment in digital learning resources and faculty training. Consequently, such actions should also be implemented by public universities.

Author Contributions

Conceptualization, D.V. and P.F.-A.; methodology, Á.A.-S. and D.V.; validation, Á.A.-S., D.V. and P.F.-A.; formal analysis, Á.A.-S., D.V. and P.F.-A.; data curation, Á.A.-S.; writing—original draft preparation, Á.A.-S., D.V. and P.F.-A.; writing—review and editing, Á.A.-S., D.V. and P.F.-A. All authors have read and agreed to the published version of the manuscript.

Funding

This research received no external funding.

Data Availability Statement

The data are not publicly available because they are part of a larger project involving more researchers. If you have any questions, please ask the contact author.

Conflicts of Interest

The authors declare no conflict of interest.

References

  1. Reis, A.; Leite, C. Digital literacies in higher education: Skills, uses, opportunities and obstacles to digital transformation. RED 2021, 65, 1–20. [Google Scholar] [CrossRef]
  2. López-Pérez, F.; Bas, M.C.; Escudero-Nahón, A. Self-perception about emerging digital skills in Higher Education students. Comunicar 2020, 62, 89–98. [Google Scholar] [CrossRef] [Green Version]
  3. Wegerif, R.; Mansour, N. A dialogic approach to technology-enhanced education for the global knowledge society. In New Science of Learning: Cognition, Computers and Collaboration in Education; Khine, M.S., Saleh, I.M., Eds.; Springer: Berlin/Heidelberg, Germany, 2010; pp. 325–339. [Google Scholar] [CrossRef]
  4. Gallardo Echenique, E.; Minelli, J.; Marqués Molías, L.; Esteve Mon, F. Digital competence in knowledge society. MERLOT J. Online Learn. Teach. 2015, 11, 1–15. [Google Scholar]
  5. Fernandes, P.R.d.S.; Jardim, J.; Lopes, M.C.d.S. the soft skills of special education teachers: Evidence from the Literature. Educ. Sci. 2021, 11, 125. [Google Scholar] [CrossRef]
  6. Rodríguez, A.; Sierra, V.; Falcón, C.; Latorre, C. Key soft skills in the orientation process and level of employability. Sustainability 2021, 13, 3554. [Google Scholar] [CrossRef]
  7. Maisiri, W.; Van Dyk, L. Industry 4.0 competence maturity model design requirements: A systematic mapping review. In Proceedings of the 2020 IFEES World Engineering Education Forum—Global Engineering Deans Council (WEEF-GEDC), Cape Town, South Africa, 16–19 November 2020; pp. 1–6. [Google Scholar]
  8. Krpálek, P.; Berková, K.; Kubišová, A.; Krelová, K.K.; Frendlovská, D.; Spiesová, D. Formation of professional competences and soft skills of public administration employees for sustainable professional development. Sustainability 2021, 13, 5533. [Google Scholar] [CrossRef]
  9. European Commission. Communication from the Commission to the European Parliament, the Council, the European Economic and Social Committee and the Committee of the Regions on the Digital Education Action Plan; European Commission: Brussels, Belgium, 2018; pp. 1–11. Available online: https://eur-lex.europa.eu/legal-content/EN/TXT/PDF/?uri=CELEX:52018DC0022&from=EN (accessed on 15 September 2021).
  10. Freiman, V.; Godin, J.; Larose, F.; Léger, M.; Chiasson, M.; Volkanova, V.; Goulet, M.J. Towards a life-long continuum of digital competencies: Exploring a combination of soft-skills and digital skills development. In Proceedings of the INTED 2017, Valencia, Spain, 6–8 March 2017; pp. 9518–9527. [Google Scholar] [CrossRef]
  11. Claxton, G.; Costa, A.; Kallick, B. Hard thinking about soft skills. Educ. Leadersh. 2016, 73, 60–64. [Google Scholar]
  12. Sisson, L.G.; Adams, A.R. Essential hospitality management competencies: The importance of soft skills. J. Hosp. Tour. Educ. 2013, 25, 131–145. [Google Scholar] [CrossRef]
  13. Bartel, J. Teaching soft skills for employability. TESL Can. J. 2018, 35, 78–92. [Google Scholar] [CrossRef] [Green Version]
  14. Hendarman, A.F.; Cantner, U. Soft skills, hard skills, and individual innovativeness. Eurasian Bus. Rev. 2018, 8, 139–169. [Google Scholar] [CrossRef]
  15. Kyllonen, P.C. Soft Skills for the Workplace. Chang. J. High. Educ. 2013, 45, 16–23. [Google Scholar] [CrossRef]
  16. Robles, M.M. Executive perceptions of the top 10 soft skills needed in today’s workplace. Bus. Commun. Q. 2012, 75, 453–465. [Google Scholar] [CrossRef]
  17. Farner, S.M.; Brown, E.E. College students and the work world. J. Employ. Couns. 2008, 45, 106–114. [Google Scholar] [CrossRef]
  18. Gruzdev, M.V.; Kuznetsova, I.V.; Tarkhanova, I.Y.; Kazakova, E.I. University Graduates’ Soft Skills: The Employers’ Opinion. Eur. J. Contemp. Educ. 2018, 7, 690–698. [Google Scholar] [CrossRef]
  19. Cornell University; INSEAD; WIPO. The Global Innovation Index 2020: Who Will Finance Innovation? Ithaca, Fontainebleau, and Geneva. 2020. Available online: https://www.wipo.int/edocs/pubdocs/en/wipo_pub_gii_2020.pdf (accessed on 29 September 2021).
  20. Warrner, J. Integrating Soft Skills into an Academic Curriculum. Am. Assoc. Adult Contin. Educ. 2021. Available online: http://www.aaace.org (accessed on 30 September 2021).
  21. Green-Weir, R.R.; Anderson, D.; Carpenter, R. Impact of Instructional Practices on Soft-Skill Competencies. Res. High. Educ. 2021, 40, 1–20. [Google Scholar]
  22. Batista-Foguet, J.; Sipahi-Dantas, A.; Guillén, L.; Martínez Arias, R.; Serlavós, R. Design and evaluation process of a personal and motive-based competencies questionnaire in Spanish-speaking contexts. Span. J. Psychol. 2016, 19, 1–12. [Google Scholar] [CrossRef]
  23. Wang, X.; Wang, Z.; Jiang, Z. ConFiguretional Differences of National Innovation Capability: A Fuzzy Set Qualitative Comparative Analysis Approach. Technol. Anal. Strateg. Manag. 2021, 33, 599–611. [Google Scholar] [CrossRef]
  24. Ionescu, G.H.; Firoiu, D.; Pîrvu, R.; Enescu, M.; Rădoi, M.-I.; Cojocaru, T.M. The Potential for Innovation and Entrepreneurship in EU Countries in the Context of Sustainable Development. Sustainability 2020, 12, 7250. [Google Scholar] [CrossRef]
  25. Ngang, T.K.; Yunus, H.M.; Hashim, N.H. Soft Skills Integration in Teaching Professional Training: Novice Teachers’ Perspectives. Procedia Soc. Behav. Sci. 2015, 186, 835–840. [Google Scholar] [CrossRef] [Green Version]
  26. Gallardo-Echenique, E.; Poma, A.; Esteve, F. La competencia digital: Análisis de una experiencia en el contexto universitario. Academicus 2018, 12, 6–15. [Google Scholar]
  27. Garzón, E.; Sola, T.; Ortega, J.; Marín, J.; Gómez, G. Teacher training in lifelong learning. the importance of digital competence in the encouragement of teaching innovation. Sustainability 2020, 12, 2852. [Google Scholar] [CrossRef] [Green Version]
  28. Hong, R. Soft skills and hard numbers: Gender discourse in human resources. Big Data Soc. 2016, 3, 1–13. [Google Scholar] [CrossRef] [Green Version]
  29. Tang, K.N. The importance of soft skills acquisition by teachers in higher education institutions. Kasetsart J. Soc. Sci. 2020, 41, 22–27. [Google Scholar] [CrossRef]
  30. Cabero-Almenara, J.; Guillén-Gámez, F.D.; Ruiz-Palmero, J.; Palacios-Rodríguez, A. Digital competence of higher education professor according to DigCompEdu. Statistical research methods with ANOVA between fields of knowledge in different age ranges. Educ. Inf. Technol. 2021, 26, 4691–4708. [Google Scholar] [CrossRef] [PubMed]
  31. Kingsley, K.V.; Kingsley, K. A case study for teaching information literacy skills. BMC Med Educ. 2009, 9, 1–6. [Google Scholar] [CrossRef] [PubMed] [Green Version]
  32. Eloy, S.; Dias, M.S.; Lopes, P.F.; Vilar, E. Digital technologies in architecture and engineering: Exploring an engaged interaction within curricula. In Architecture and Design: Breakthroughs in Research and Practice; IGI Global: Hershey, PA, USA, 2019; pp. 390–426. [Google Scholar] [CrossRef]
Figure 1. Scheme of the aspects analyzed in the statistical study.
Electronics 10 02532 g001
Figure 2. Distributions of the sample participants differentiated according to the different values of the independent variables considered: (a) gender; (b) age range; (c) area of knowledge; (d) years of teaching experience; (e) university tenure.
Electronics 10 02532 g002aElectronics 10 02532 g002b
Figure 3. Bar graphs of the relative frequencies of the possible answers for the different scales: (a) work motivation; (b) work behavior; (c) social skills; (d) psychic structure; (e) additional skills.
Electronics 10 02532 g003
Table 1. Number of participants by country, ordered by GII.
CountryGIIParticipantsPercentage of Sample
Panama29.020.91%
Peru28.89643.84%
Argentina28.36831.05%
El Salvador24.8104.57%
Ecuador24.13515.98%
Paraguay24.120.91%
Honduras23.031.37%
Bolivia22.431.37%
Table 2. Cronbach’s alpha parameters for the different scales of the questionnaire.
ScaleCronbach’s Alpha
Work motivation0.8566
Work behavior0.8553
Social skills0.8822
Psychic structure0.8597
Additional competences0.8017
Table 3. Overall descriptive statistics of the questionnaire by scales.
Mean ValueStandard DeviationCoefficient of VariationSkewness
Work motivation4.190.8520.31%−1.16
Work behavior4.420.7015.85%−1.37
Social skills4.200.8119.30%−1.11
Psychic structure4.440.7316.55%−1.47
Additional skills3.761.0427.77%−0.84
Table 4. Means, standard deviations (St.D.), coefficients of variation (C.V.) and skewness (Skew.) of the overall answers of the different scales of the questionnaire when the sample is differentiated by gender.
MalesFemales
ScaleMeanSt.D.C.V.Skew.MeanSt.D.C.V.Skew.
Work motivation4.150.9523.00%−1.274.220.7818.59%−0.99
Work behavior4.340.7817.97%−1.614.480.6414.41%−1.01
Social skills4.160.8620.62%−1.404.230.7818.49%−0.86
Psychic structure4.410.7015.84%−1.764.450.7015.84%−1.22
Additional skills3.821.0627.88%−0.933.731.0327.68%−0.80
Table 5. Mann–Whitney test statistics when the sample is differentiated by gender.
ScaleMann–Whitney W-Valuep-Value
Work motivation50,1020.8358
Work behavior46,1580.0359 *
Social skills87,4250.4617
Psychic structure50,0520.8105
Additional skills148,8930.0776
* p < 0.05.
Table 6. Levene test statistics when the sample is differentiated by gender.
ScaleLevene F-Valuep-Value
Work motivation4.87960.0275 *
Work behavior1.99080.1587
Social skills0.15310.6957
Psychic structure0.40840.5230
Additional skills0.00010.9914
* p < 0.05.
Table 7. Means and standard deviations (St.D.) of the overall answers of the different scales of the questionnaire when the sample is differentiated by age range.
25 to 3435 to 4445 to 5455 to 6465 to 74
ScaleMeanSt.D.MeanSt.D.MeanSt.D.MeanSt.D.MeanSt.D.
Work motivation4.040.564.180.864.210.894.280.773.961.05
Work behavior4.570.554.440.634.410.764.480.674.170.80
Social skills4.110.824.240.814.200.834.270.703.961.00
Psychic structure4.360.764.540.634.410.784.420.724.370.78
Additional skills3.740.973.801.083.841.003.671.063.631.10
Table 8. Coefficients of variation (C.V., measured in percent) and skewness (Skew.) of the overall answers of the different scales of the questionnaire when the sample is differentiated by age range.
25 to 3435 to 4445 to 5455 to 6465 to 74
ScaleC.V.Skew.C.V.Skew.C.V.Skew.C.V.Skew.C.V.Skew.
Work motivation13.720.0420.53−1.2721.27−1.3517.94−0.8426.38−0.85
Work behavior11.97−0.7614.23−0.6717.17−1.7914.88−1.2719.08−0.78
Social skills20.07−0.8119.09−0.8219.75−1.2716.49−0.8825.24−1.22
Psychic structure17.43−1.0713.93−1.2417.80−1.5416.27−1.6717.94−1.01
Additional skills26.01−0.8228.55−0.9326.08−0.8328.99−0.8130.16−0.74
Table 9. Kruskal–Wallis test statistics when the sample is differentiated by age range.
ScaleChi-Squarep-Value
Work motivation7.44240.1143
Work behavior9.44830.0508
Social skills6.28980.1785
Psychic structure3.90540.4190
Additional skills6.02370.1970
Table 10. Levene test statistics when the sample is differentiated by age range.
ScaleLevene F-Valuep-Value
Work motivation4.60290.0011 *
Work behavior0.87970.4756
Social skills1.29870.2688
Psychic structure1.84850.1179
Additional skills1.17390.3206
* p < 0.05.
Table 11. Means and standard deviations (St.D.) of the overall answers of the different scales of the questionnaire when the sample is differentiated by area of knowledge.
HumanitiesSciencesHealth Sci.Social Sci.Engineering
ScaleMeanSt.D.MeanSt.D.MeanSt.D.MeanSt.D.MeanSt.D.
Work motivation4.220.864.110.794.190.844.340.924.130.87
Work behavior4.480.614.380.674.290.824.530.794.360.66
Social skills4.240.814.150.784.110.754.330.944.160.81
Psychic structure4.410.684.490.614.370.804.430.884.420.75
Additional skills3.840.983.730.893.691.063.881.203.651.09
Table 12. Coefficients of variation (C.V., measured in percent) and skewness (Skew.) of the overall answers of the different scales of the questionnaire when the sample is differentiated by area of knowledge.
HumanitiesSciencesHealth Sci.Social Sci.Engineering
ScaleC.V.Skew.C.V.Skew.C.V.Skew.C.V.Skew.C.V.Skew.
Work motivation20.31−1.4218.72−0.4220.16−0.8621.22−1.7221.08−1.29
Work behavior13.70−0.7515.31−0.7919.06−1.2217.38−2.5215.25−0.85
Social skills19.03−0.9318.75−0.9518.23−0.6121.62−1.6419.49−1.31
Psychic structure15.42−1.0313.65−0.7918.29−1.1219.78−1.9617.04−1.56
Additional skills25.58−1.0223.82−0.4028.70−0.8230.93−1.0529.74−0.78
Table 13. Kruskal–Wallis test statistics when the sample is differentiated by the area of knowledge.
ScaleChi-Squarep-Value
Work motivation11.8040.0376 *
Work behavior15.4870.0085 *
Social skills15.9260.0071 *
Psychic structure2.67670.7497
Additional skills12.2900.0310 *
* p < 0.05.
Table 14. Levene test statistics when the sample is differentiated by the area of knowledge.
ScaleLevene F-Valuep-Value
Work motivation0.93720.4562
Work behavior1.70430.1314
Social skills3.06390.0095 *
Psychic structure2.99730.0110 *
Additional skills3.56420.0033 *
* p < 0.05.
Table 15. Means (M.) and standard deviations (St.D.) of the overall answers of the different scales of the questionnaire when the sample is differentiated by years of teaching experience.
≤56 to 1011 to 1516 to 2021 to 25>25
M.St.D.M.St.D.M.St.D.M.St.D.M.St.D.M.St.D.
Work motivation3.811.044.180.724.090.854.390.594.320.924.190.87
Work behavior4.180.894.480.594.410.694.490.544.490.824.400.65
Social skills4.160.774.180.804.200.754.210.674.230.964.210.83
Psychic structure4.320.714.380.754.470.784.450.664.350.864.540.60
Additional skills3.560.963.691.153.801.083.990.863.741.053.731.06
Table 16. Coefficients of variation (C.V., measured in percent) and skewness (Skew.) of the overall answers of the different scales of the questionnaire when the sample is differentiated by years of teaching experience.
≤56 to 1011 to 1516 to 2021 to 25>25
C.V.Skew.C.V.Skew.C.V.Skew.C.V.Skew.C.V.Skew.C.V.Skew.
Work motivation27.39−0.9717.30−0.3020.77−1.3113.39−0.6621.28−1.6420.86−0.84
Work behavior21.29−0.8313.11−0.6315.60−0.8912.09−0.3618.35−2.3814.87−0.83
Social skills18.44−0.8319.08−0.6517.92−0.7915.95−0.4322.68−1.4919.69−1.30
Psychic structure16.48−0.5517.15−1.0917.49−1.6814.90−1.0219.89−1.8213.23−1.12
Additional skills27.11−0.8231.22−0.7528.54−0.8721.48−0.7828.18−0.8328.42−0.85
Table 17. Kruskal–Wallis test statistics when the sample is differentiated by years of teaching experience.
ScaleChi-Squarep-Value
Work motivation20.6000.00096 *
Work behavior9.75790.0824
Social skills3.40430.6379
Psychic structure7.00490.2203
Additional skills13.3340.0204 *
* p < 0.05.
Table 18. Levene test statistics when the sample is differentiated by years of teaching experience.
ScaleLevene F-Valuep-Value
Work motivation3.73920.0024 *
Work behavior2.81290.0156 *
Social skills2.71110.0193 *
Psychic structure2.01130.0752
Additional skills5.26160.000088 *
* p < 0.05.
Table 19. Means and standard deviations (St.D.) of the overall answers of the different scales of the questionnaire when the sample is differentiated by the tenure of the university.
PrivatePublic
ScaleMeanSt.D.MeanSt.D.
Work motivation4.240.874.150.83
Work behavior4.470.684.390.71
Social skills4.230.804.180.82
Psychic structure4.490.754.390.71
Additional skills3.781.063.751.03
Table 20. Coefficients of variation (C.V., measured in percent) and skewness of the overall answers of the different scales of the questionnaire when the sample is differentiated by the tenure of the university.
PrivatePublic
ScaleC.V.SkewnessC.V.Skewness
Work motivation20.56−1.6420.06−0.73
Work behavior15.31−1.6616.28−1.15
Social skills18.96−1.1919.61−1.05
Psychic structure16.81−2.0016.28−0.97
Additional skills27.98−0.9927.61−0.71
Table 21. Mann–Whitney test statistics when the sample is differentiated by tenure of the university.
ScaleMann–Whitney W-Valuep-Value
Work motivation58,0670.0475 *
Work behavior56,8250.1389
Social skills97,8590.4628
Psychic structure58,2650.0312 *
Additional skills153,3240.3789
* p < 0.05.
Table 22. Levene test statistics when the sample is differentiated by the tenure of the university.
ScaleLevene F-Valuep-Value
Work motivation0.07680.7818
Work behavior0.91540.3390
Social skills0.09760.7549
Psychic structure0.27520.6001
Additional skills0.47650.4902
Publisher’s Note: MDPI stays neutral with regard to jurisdictional claims in published maps and institutional affiliations.

