1. Introduction
FPGA-based applications usually include a higher number of processor cores implemented in real-time microcontrollers, as application processors. One can observe that, to test such cores, random-based testing methodologies are mainly proposed, which require a huge number of testing vectors, advanced optimization algorithms, and FPGA resources for their implementation.
For such reasons, methods of test vector compression have been developed in order to save memory resources to store them [
1]. Pseudo-random stimuli generation is defined in the System Verilog HDL language standard [
2], and in the Universal Verification Methodology (UVM) [
3]. Various pseudo-random stimuli generators (PRGs) are often utilized for this purpose. Such PRGs can be built into register-transfer level (RTL) simulators or external ones written in C++ and connected through a direct programming interface [
4].
The efficiency of stimuli generation is usually measured by the coverage of injected faults, where authors mainly utilize well-known “stuck-at” fault models.
The pseudo-random test-pattern generators proposed in the bibliography are often realized as feedback-controlled. Such methods based on coverage analysis are called coverage-driven verification (CDV). A drawback of this approach is the redundant number of random test vectors, where, as a result, the coverage feedback is not properly propagated to the PRG and reflected by suitable constraints [
4]. Related optimization techniques already appeared in works to overcome the above-mentioned difficulties. Another similar solution is described in [
5], which introduced the capability of on-the-fly constraint optimization and generation of an optimal stimuli set. A genetic algorithm (GA) was integrated directly into the UVM verification environment with optimized values of GA parameters. Kitchen and Kuehlmann in [
6] proposed a pseudo-random stimuli generator (PRG) using a hybrid constraint solver based on Markov chain Monte Carlo methods, which dynamically controls the PRG.
Two main approaches based on coverage analysis are known from the bibliography: feedback-based CDV (FBCDV) and CDV. FBCDV is based on feedback from coverage analysis and modification of the constraints to the PRG, whereas the coverage-driven verification by construction (CDVBC) approach is based on a generated external model of the device under verification (DUV) which is used to generate stimuli designed to satisfy the intended coverage [
4]. By analogy, our optimization methodology presented in this paper is supported by feedback information about the fault coverage. CDVBC-based approaches commonly consist in transforming a coverage situation into Boolean logic (e.g., the conjunctive normal form) and gaining the power of a simultaneous Boolean satisfiability (SAT) solver [
7,
8].
Finally, there are FBCDV approaches based on genetic algorithms (GAs). The authors of [
8] applied a GA for automated generation of stimuli based on the source code of a specific software application. Naturally, such an approach neglected all the details concerning the processor hardware irrelevant to the verified application.
Different FBCDV solutions utilize genetic algorithms (GAs). Application of GA automated generation of stimuli based on the source code of a specific software application was presented in [
9]. In this approach, only processor hardware resources utilized by a verified application are taken into consideration. Additionally, such a solution is time-consuming. Meanwhile, a lack of deterministic quick built-in self-tests (BISTs) which can be applied to periodical online tests of embedded processor cores is observable in the bibliography. This, with the cooperation of the dynamic FPGA reconfiguration methodology, constitutes an efficient and powerful reliability mechanism. Moreover, such a solution is easy to implement.
Paper Organization
Section 2.1 presents the authors’ previously published testing methodology: the bijective test program and the SEU-induced fault model. The basic principle of instruction sequencing is presented in
Section 2.1.
Section 2.1.1 clarifies our methodology for achieving full bijectivity and illustrates the principle of a data-sensitive path. These methods are the basis for the proposed research; therefore, they are described in detail here. In
Section 3, the fault detection matrix is determined, and then the methodology and algorithms for a reduction in the number of test vectors are proposed. The results show that for the PicoBlaze example, the number of required test vectors is reduced from 256 down to 28 (or 33 for different algorithms) with the same fault coverage (FC), denoted further as the maximum value of fault coverage (FCmax).
Section 4 studies the further reduction in the test vector number where the FC might be reduced. Consequently, only three test vectors are required in order to obtain 97% FCmax. The previous sections consider global test vectors, i.e., the whole test program is initialized by a single vector. In
Section 5, local test vectors are used, i.e., the test program was divided into smaller parts and each part (assigned to different microprocessor blocks) uses different local test vectors which are optimized by algorithms described in
Section 3. For most microprocessor blocks, testing only one to three local test vectors results in FCmax(block). The only exception is the flag generation block which requires all 28 test vectors. For FPGA soft processors, testing is often neglected, and, as in most cases, a configuration readback procedure is used to detect SEU faults. Consequently, there are very few current papers studying the subject. Therefore,
Section 6 describes designs when soft processor testing might be very important.
2. Bijective Program and Fault Modeling
2.1. Bijective Test Program
We generated a test sequence that allows arbitrary situations that might occur in practice. This is accomplished by using a test sequence that explores the functionality of each individual instruction and is composed in such a way that it forms a sensitive path. This path can be executed more than once, each time with a different input vector [
10,
11].
Although we have borrowed the notion of a sensitive path from the automatic test pattern generation (ATPG) techniques [
12,
13], in our case, it has a slightly different meaning [
10]. The path sensitization in conventional ATPG techniques for automatic test generation involves the generation of the path that is sensitive to the presence of a stuck-at fault and the justification of the values along the path by propagating signals back to the primary inputs.
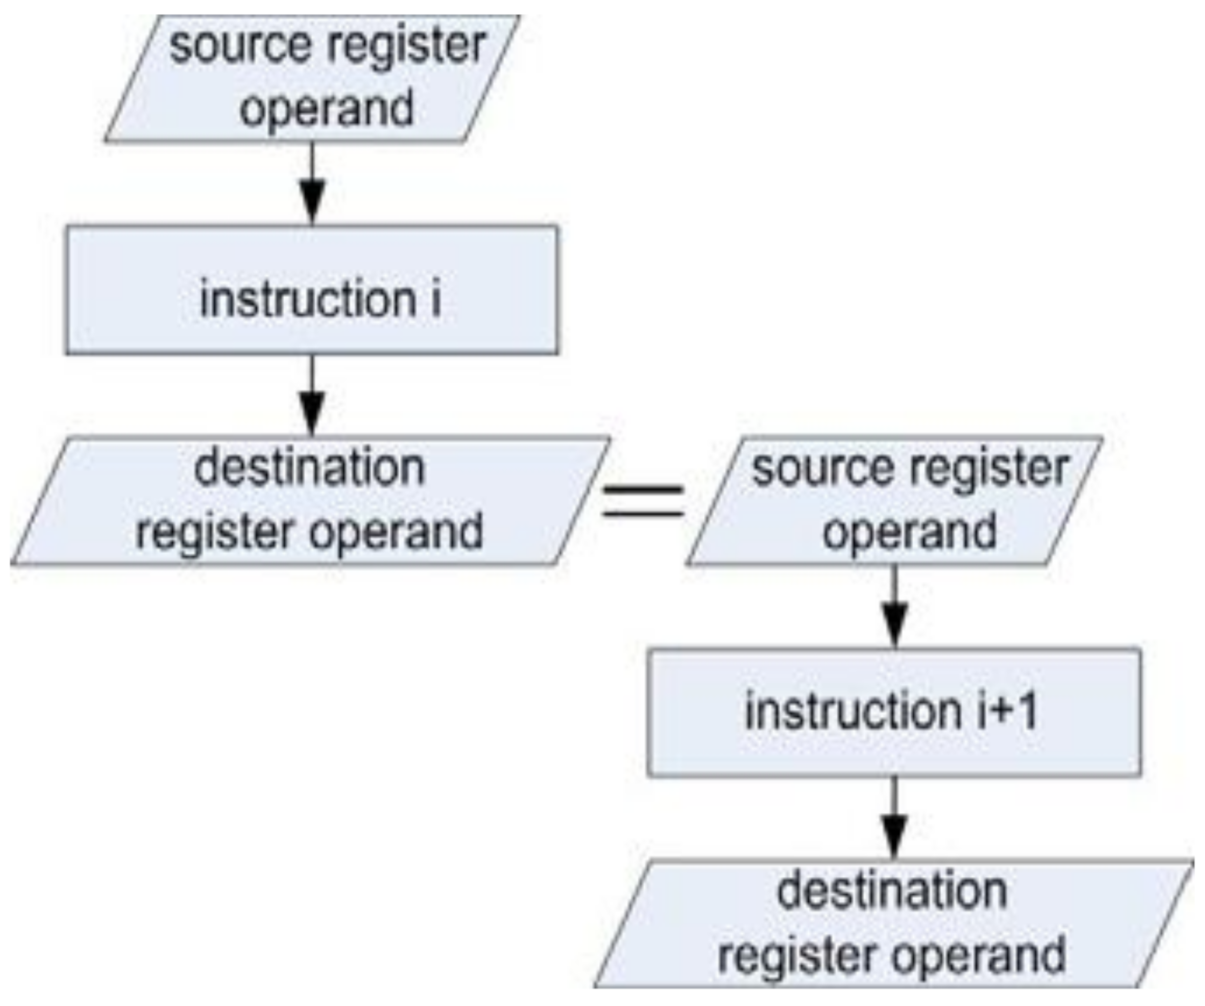
According to our approach, the fault detection is performed at the instruction level by a compact test program in which individual processor instructions are organized in such a sequence that the destination register operand of the
i-th instruction represents the source register operand of the (
i+1)-th instruction. In the test sequence, each processor instruction participates at least once. The principle of instruction sequencing is presented in
Figure 1.
Intuitively, we assume that the test sequence represents a sensitive path if the data flowing through it are sensitive to changes in the input pattern. We pursue the following two goals:
The faults occurring during the execution of individual instructions in the test sequence should manifest themselves in the final result;
To increase fault coverage, the data-sensitive path should provide a way of randomizing the instruction operands of the test sequence, resulting in increased processor activity and, consequently, in increased fault coverage.
The test sequence is composed of individual instructions (i.e., system components), which act upon the data stored in registers and memory cells. An instruction processes the input data (i.e., the argument) and generates a result that represents the input data for the next instruction in the test sequence. The input data of the first instruction of the test sequence represent the system’s primary inputs, while the results of the test sequence system are the primary outputs. The test sequence is composed incrementally: each time, a new instruction is added to the test sequence, and the resulting test block is checked for controllability and observability [
11].
The requirement that the test sequence preserves a sensitive data path between the input data and the result is a prerequisite for achieving a high fault coverage. On the other hand, some faults may still escape if the input data do not lead to the occurrence of an event that would manifest itself in a result that is different from the expected reference obtained with a fault-free system. To detect these faults, we can re-run the test sequence with different primary input data [
10].
We impose a stricter rule on the test sequence generation by requiring that there is a one-to-one, i.e., bijective [
14], correspondence between the input test pattern and the result. If we apply this rule at the level of sub-sequences of the assembler instruction sequence, we can ensure a high fault coverage (FC). The key achievement of earlier work [
11] was the proposed bijective testing procedure.
2.1.1. Refinements to Achieve Full Bijectivity
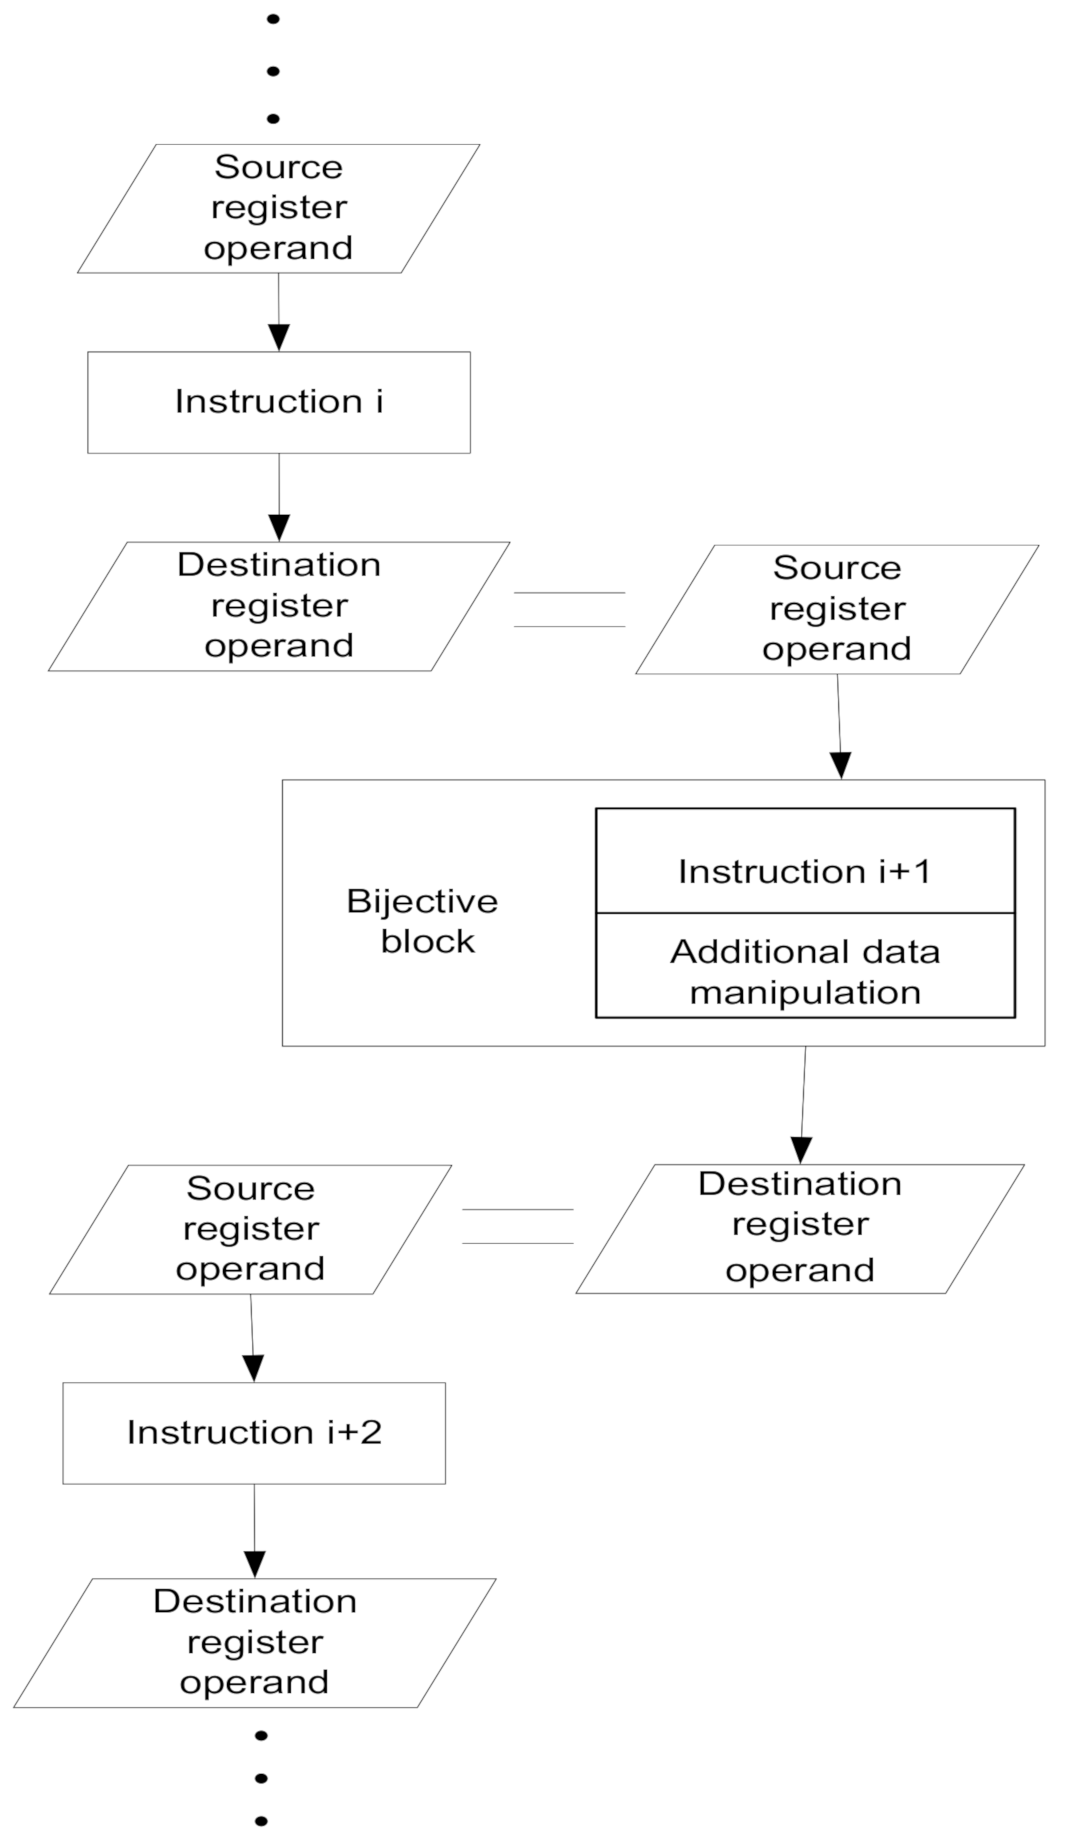
For some instructions, the output data may not be completely sensitive to every change in the input data, and hence the property of a sensitive data path is not preserved. For example, some part of the register holding the result of the instruction operation may be cleared or set to all 1s. In such a case, additional data manipulations need to be performed (i.e., the input data are stored at another location and logically combined with the result of the executed instruction). To summarize, bijectivity is closely related to the full flow of information through the test program. The flow of information can be disturbed by: an incompetent composition of the test program, which does not provide a full flow of information, masking the flow of information related to problems that are not completely solved due to the overlapping of flags generated by different instructions; operation of different instructions on the same registers and data to be solved by a programmer; and the nature of SHIFT instructions (by execution, merely “SHIFT” instructions, not the full range of numbers, are generated, unless we use special solutions such as an linear-feedback shift register LFSR), masking the flow of information related to the processor implemented in the FPGA hardware construction as delays (Abramovici 2002), or hardware redundancies (Renovell 2000 B), simplifying the construction of individual sub-blocks of the processor.
For illustration, a part of the test sequence organized in a data-sensitive path is shown in
Figure 2. The destination register operand of the instruction represents the source register operand of the next instruction in the test sequence.
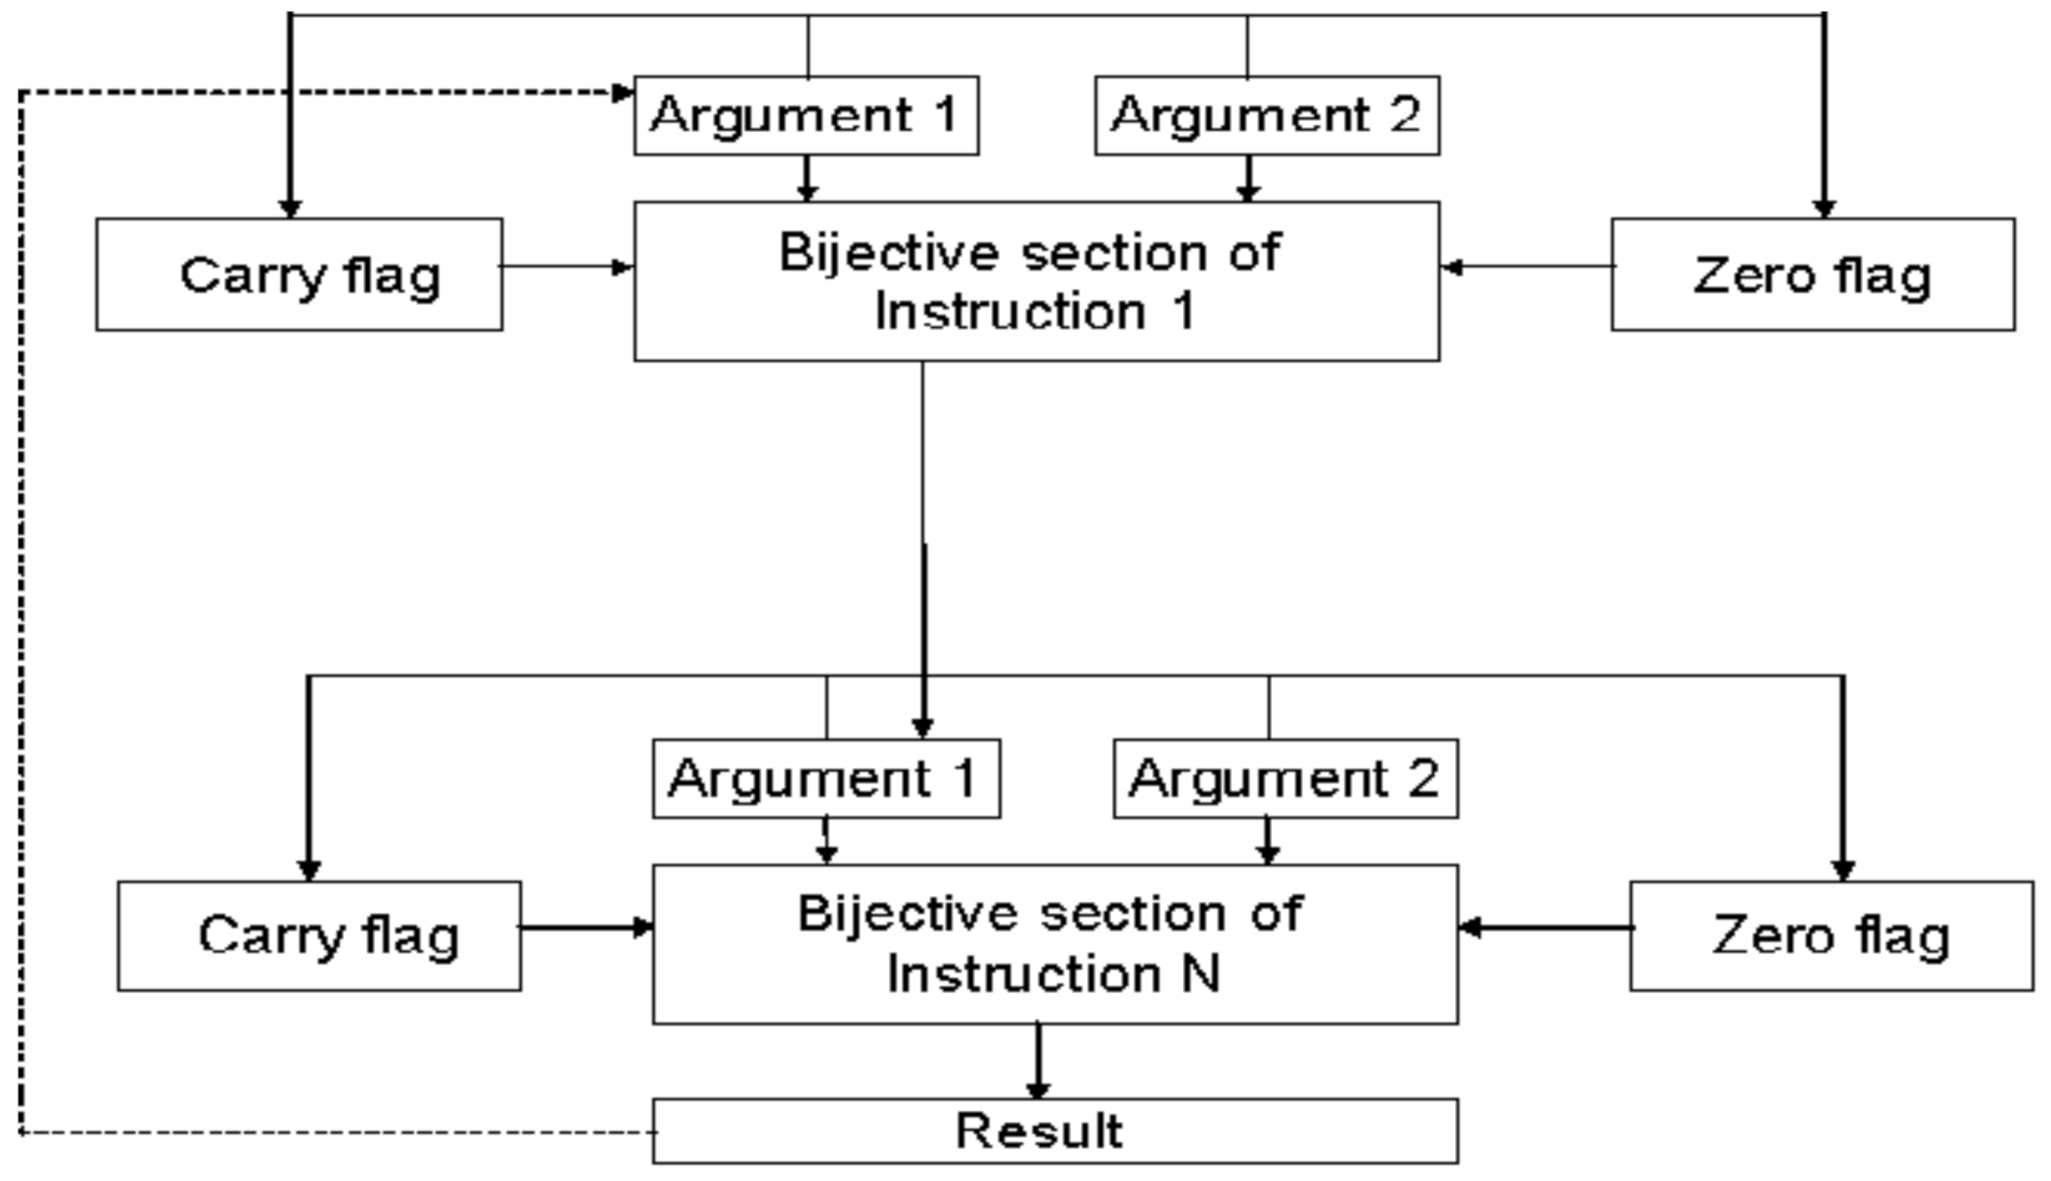
The execution of some instructions affects the status flags (for example, the Zero and Carry Flags). In order to detect possible faults in the status information, the contents of the status register are included in the result of the currently executed instruction. This is usually achieved by “XOR-ing” the contents of the status register and the resulting output data. However, more complex operations in the assembler are applied as described further in this chapter, in the case when “XOR-ing” alone does not work. With such refinements, the instructions and additional data manipulation code represent a bijective block within the test sequence. The basic architecture of a bijective block is presented in
Figure 3. The bijective property opens up possibilities for further optimizations such as cyclic usage of the output results, as indicated by the dashed line in
Figure 3.
The test sequence is composed of bijective blocks. By definition, any program composed of bijective blocks is bijective. A bijective block can be a single instruction if it exhibits a bijective property. If not, some additional data manipulation is required to obtain a bijective block. We have found several ways to achieve a bijective property:
IDENTITY;
Continuous ADDITION or SUBTRACTION of a constant value, e.g., “1”;
Flag register (e.g., Carry Flags) generation or recovery (on the basis of actual data);
Negation (e.g., by “XOR-ing” data);
Bit permutation (e.g., ROTATE data);
Lookup table (LUT) method (not hereby used);
LFSR.
2.1.2. Comparison of Results
Table 1 presents a summary of the research results from the bibliography of the subject. Research results on the processors whose functionality, construction complexity, or performance can be compared with the PicroBlaze were selected and are collected in
Table 1 to compare with the results achieved by our program intended for PicoBlaze testing. The results of these studies are usually expressed as the coverage of injected faults into the hardware of the given microprocessor/microcontroller.
The most important novelty introduced hereby is a different model of injected faults. This model differs significantly from the conventional stuck-at models widely used for testing processors/microcontrollers implemented in ASIC/embedded platforms because an SEU-induced fault affects the logic elements implemented by the lookup tables (LUTs) in this manner, meaning that the logic function is arbitrarily changed, as described in detail in
Section 2.2 about fault modeling and injections.
It is worth noticing that the authors of publications compared in
Table 1 mainly applied stuck-at fault models, while we injected both stuck-at and “SEU in LUT” modeling faults. Despite the fact that faults induced by SEU in LUTs are harder to detect, we obtained results comparable to those of other publications which utilized only the stuck-at fault model.
2.2. Fault Modeling
In the proposed approach, the goal is to generate a compact test sequence that detects permanent SEU-induced faults of embedded processor cores in SRAM-based FPGAs [
11]. As described in [
14,
15], the functional model of such faults differs considerably from the conventional stuck-at fault model because SEU-induced faults affect logic elements implemented by lookup tables (LUTs); in this way, the logic function is arbitrarily changed [
16]. Permanent SEU-induced faults in LUTs are modeled by software injection at the structural level of the hardware description language (HDL—in our case, VHDL) description of the targeted microprocessor.
An example [
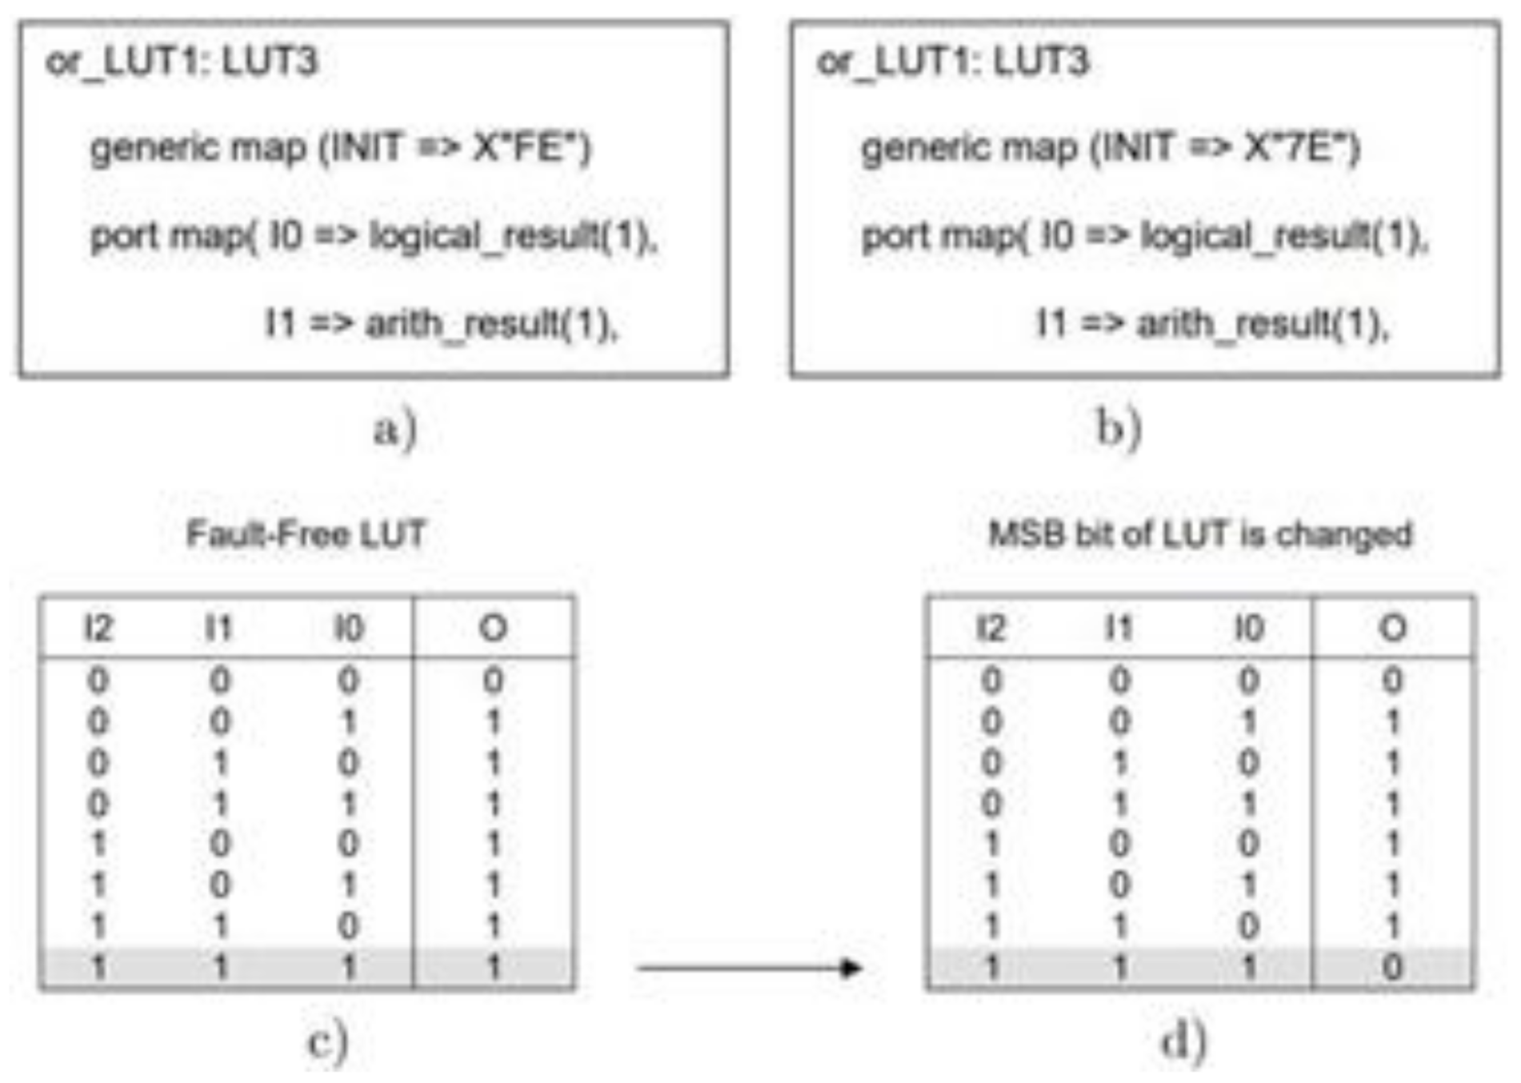
17] of a modeled fault is shown in
Figure 4. The HDL description of an LUT implementing a three-input OR gate is shown in
Figure 4a, and the corresponding truth table is shown in
Figure 4c. An SEU-induced fault of an LUT typically manifests itself as a change of one bit of the LUT, thus modifying the Boolean function it implements. Let us assume that the most significant bit of the LUT has been corrupted, as shown in
Figure 4d. The fault can be modeled by changing the initialization parameter (INIT), as shown in
Figure 4b.
According to [
17] PicoBlaze HDL descriptions reflect the FPGA structure in order to efficiently use the FPGA resources. This allows precise modeling of the faults and their automated fault injection. For each simulated fault, an appropriate HDL file is generated. All the fault injection campaigns and analysis of their effects are automatically performed by a Perl script. The faults in an HDL description of the processor are simulated by modifying the individual functional blocks. For each functional block, an HDL model represents the behavior of the SEU. The HDL model should reflect the change in the configuration as a consequence of the SEU effect. These errors are injected and detected consecutively. We identified 1804 single-bit faults related to the used LUTs. These are all possible single-bit errors to inject into the HDL description of PicoBlaze.
The developed experiments were targeted at testing the fault susceptibility of application programs running on a microprocessor implemented within FPGA. Our idea [
11] is to use an appropriate microprocessor simulator that accepts its specification in the HDL, correlates it with the targeted FPGA, performs simulations with the provided programs (in an assembler), and allows analyzing the behavior of the tested application (e.g., program results) in this environment. These simulations were performed by two simulators: Cadence NC VHDL and Mentor Graphics ModelSim. Fault injection was performed at the microprocessor HDL structural description level, which reflects the FPGA implementation.
The generation of the fault descriptions was implemented as a Perl script [
11,
17]. All the instances of lookup tables (LUTs) contained in functional blocks of the processor are described in the VHDL code. For each LUT instance, its initialization parameter is investigated, and the list of the initialization parameters describing all the SEU-induced faults as well as all the stuck-at faults at the LUT inputs and outputs are generated. For some LUT instances, a single-bit change in the LUT content may manifest itself as a stuck-at fault. In such a case, a duplicated stuck-at fault description is excluded. Similarly, the stuck-at faults at the LUT inputs as well as the stuck-at faults at the LUT output can also be modeled by modifying the contents of the LUT configuration. In some cases, LUT SEU faults and the stuck-at faults may result in the same LUT contents. In such a case, a duplicated fault description is omitted.
All fault descriptions were placed in a file of faults and then read by the Perl script. The set of faults was developed in this way so that the content of LUTs is altered only by one bit or by many bits when a stuck-at fault is injected. This leads to a slight modification of a logical function realized by the LUTs. Such faults are more difficult to test. During the fault simulation, the generated “faulty” initialization parameters were applied one by one to the HDL description of the Xilinx PicoBlaze processor core [
11,
17]. A modified HDL description was used, running the test sequence with different input vectors, and the results were recorded for a later offline evaluation. A Cadence NC VHDL simulator running on a Sun Fire V240 server and then i7 Intel core was used for the HDL.
3. Optimal Reduction in Test Vectors
One of the most important criteria of every test program evaluation is the fault coverage (FC) and the time required for completion. This time depends on both the number of program instructions to be executed and the number of applied test vectors. This paper focuses on optimization of the number of test vectors with as low an influence as possible on the FC. Such approaches may be especially profitable in the case of testing 32- or 64-bit microprocessors as there is a huge number of input test vectors required for exhaustive testing of these microprocessors. For instance, there are 232 possible input test vectors for a 32-bit microprocessor.
The superior objective is to find a minimal set of test vectors which can achieve the maximal fault coverage (FCmax). This means that the developed optimization method should return the same FC as an exhaustive test. Another aspect of research is to select only a few vectors in such a way that the ratio of FC to the number of test vectors is optimal. A general test situation can be described by:
The set of faults F = {f1, f2, …, fm}:
The set of available tests vectors V = {v0, v1, …,vn-1 }, where vi corresponds to the execution of the test sequence (program) with a binary input value i (0 ≤ i ≤ n-1); in the case of an 8-bit microprocessor, n = 256.
The fault detection matrix D of dimension m×n, which describes the detectability of every fault fj by every test vector vi, 0 ≤ i ≤ n − 1:
The element dji of matrix D is set to 1 (dji = 1) in the case when the test vector vi detects a fault fj; otherwise, dji = 0. In this particular case, the number of different injected faults is m = 1603, and the number of different test vectors n = 256.
In order to better understand the optimization of the number of test vectors, we propose the following definitions:
Definition 1. A fault of the i-th order is a fault detected exclusively by i test vectors.
Definition 2. The vector of the i-th order is a vector which detects at least one fault of the i-th order and does not detect any fault of a lower order than i.
Consequently, the most difficult to detect faults, further referred to as the hardest faults, are the first-order faults, which are detected by only one test vector. In our practical case, we found 41 faults detected by only one vector.
Table 2 presents statistics on the fault orders. Faults of these orders are present as the outcome of the fault simulation experiment.
There are 41 faults of the first order, 1 fault of the 15th order, 1 fault of the 67th order, etc. Faults of the 256th order occur the most (731). It is worth noticing that faults of higher orders are usually covered by first-order vectors. By definition, this holds for 256th-order faults. Experiments proved that this also holds for the 15th- and higher-order faults.
The above statistics provide us with information on how efficient a bijective test program is. Hence, if the number of low-order faults is high, and a high number of the lowest-order vectors is required to detect them, this would mean that a small number of sensitivity paths are activated. Therefore, it seems a good idea to improve the test program (written in the PicoBlaze assembler).
Based on the above results, vector selection algorithms may be proposed in order to minimize the set of test vectors required to obtain the maximal fault coverage (FCmax). First, a greedy algorithm is proposed. This algorithm first selects the best vector, i.e., a vector which covers the largest number of faults (Algorithm 1).
| Algorithm 1: Greedy algorithm: the vectors that detect the largest number of faults first. |
| Determine set F of all faults fi |
| { Determine test vector vi which covers the maximum number |
| of faults in set F; |
| Test the microprocessor with test vector vi; |
| Remove all faults fj that are covered by test vector vi from |
| set F; |
| } |
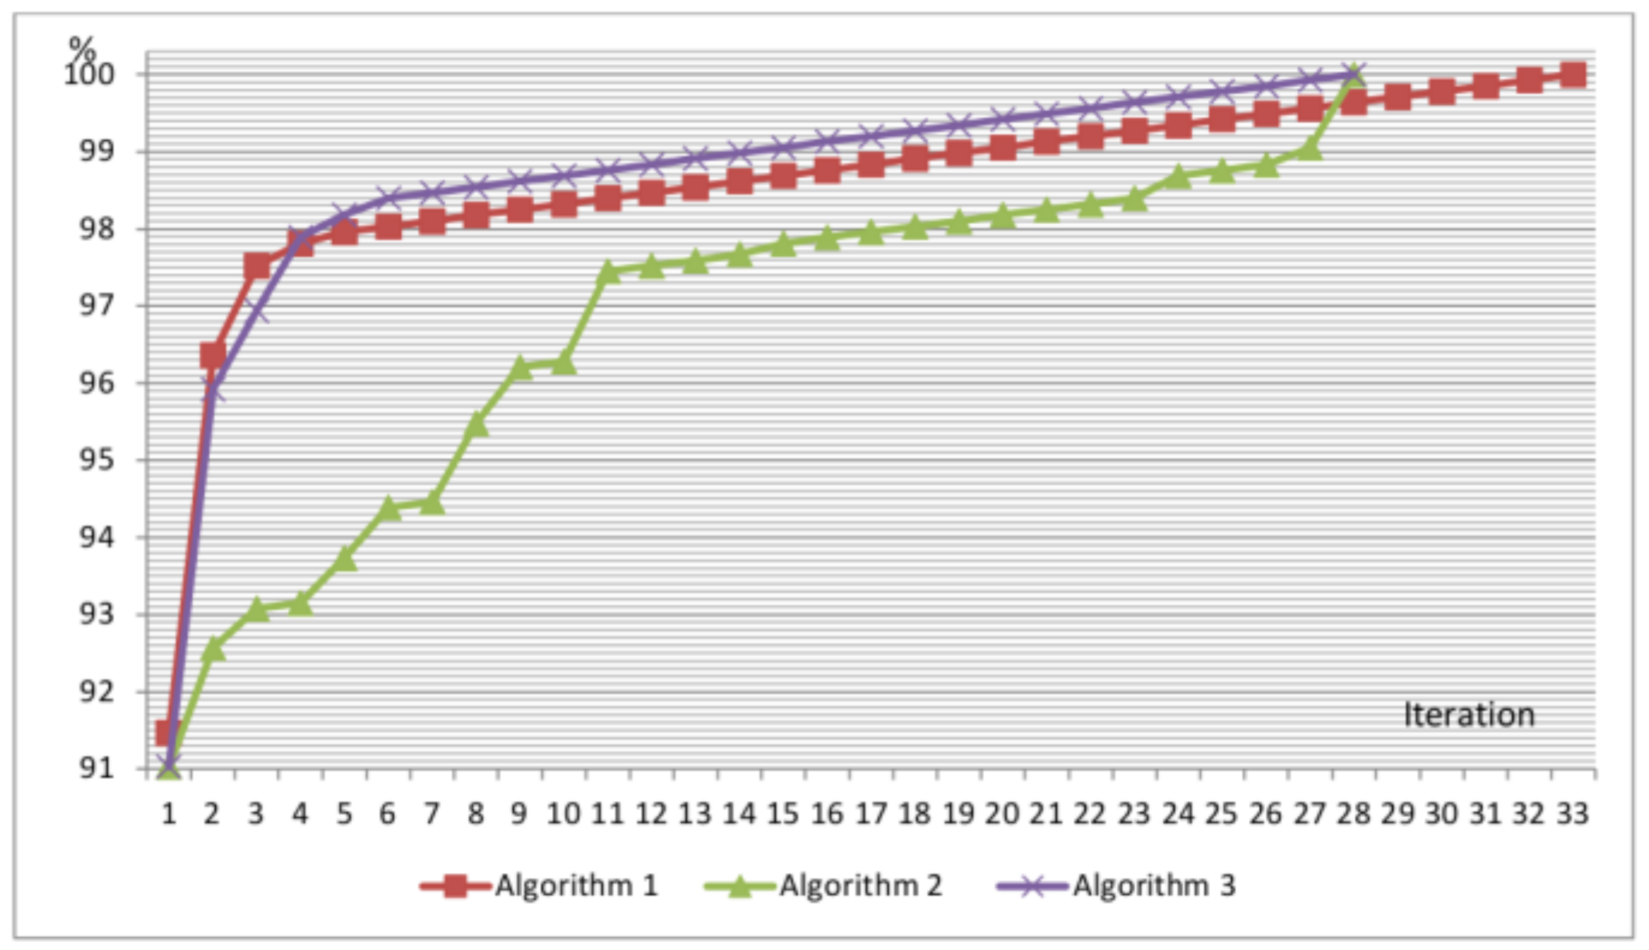
In the case of Algorithm 1 and the penultimate version of the bijective program, the set of 33 such vectors appears to be sufficient to reach an FCmax of 85.4% (see
Figure 5). This experiment showed that the application of all 256 tests vectors (exhaustive test) for the PicoBlaze processor is redundant. Moreover, it turns out that we can shorten the exhaustive testing time by about eight times.
In order to further reduce the number of test vectors without decreasing the FC, Algorithm 2 is proposed. This algorithm selects the lowest-order test vectors first.
| Algorithm 2: The lowest-order vector first. |
| Determine set F of all faults fi; |
| While F is not empty |
| {Select the lowest order fault fi of set F; |
| Select a test vector vi that detects fault fi; |
| Test the microprocessor with test vector vi; |
| Remove all faults fj covered by test vector vi from set F; |
| } |
In the implementation of the above algorithm, 28 vectors are enough to obtain the maximal fault coverage FCmax. One of the vectors (7D) detected 12 first-order faults. Vector 7E detected three first-order faults. The other 26 vectors detected only one first-order fault each (see
Table 3).
Initially, it might seem that the greedy algorithm (Algorithm 1) should return a better result (lower number of test vectors) than Algorithm 2. However, this is not the case, and Algorithm 2 results in 28 test vectors, in comparison to 33 test vectors for Algorithm 1. After thorough consideration, it is obvious that starting with first-order test vectors provides the optimal solution, as in order to obtain FCmax, all first-order vectors must be tested. This can be easily derived from Definitions 1 and 2. For a first-order fault, only one vector detects this fault, meaning this vector must be used to obtain FCmax.
Nevertheless, it is not obvious how Algorithm 2 should be constructed after all first-order vectors have been tested. Fortunately, in our case, testing all first-order vectors is enough to cover all higher-order faults. Based on the statistics of the fault orders and further experiments, we can conclude that most higher-order faults are covered by many vectors from the set of the first order. Hence, we may propose the method of testing the processor consequently with increased order vectors, until all faults are covered. Nevertheless, in the general case, Algorithm 2 should be improved. When there are two or more vectors of the same lowest order, several different vectors can be taken. In this case, the proposed Algorithm 3 may be used. For Algorithm 3, the vector which covers the largest number of the lowest-order faults is selected. Consequently, the improved algorithm, Algorithm 3 Hybrid, is a mixture of Algorithms 2 and 1. However, Algorithm 2 is a higher-priority algorithm. Algorithm 3 is especially useful in the case when the lowest-order vector is a second- or higher-order one, as in this case where there are two or more vectors that cover the same fault. A proposition of the improvement is presented below. It should be noted that the performance of Algorithm 3 was not tested in practice, as in this experiment, testing only first-order vectors resulted in FCmax.
| Algorithm 3: Hybrid (improved the lowest-order vector first). |
| Determine set F of all faults fi; |
| While F is not empty |
| {Determine subset Fi of F with the same, lowest-order faults fi; |
| Select a vector vi that detects the largest number of faults from set Fi; |
| Test the microprocessor with test vector vi; |
| from set F, remove all faults fj that are covered by test vector vi; |
| } |
In our case, all faults are covered by the first-order vectors; therefore, Algorithm 3 and Algorithm 2 require the same number of vectors to obtain FCmax. Nevertheless, in the general case, Algorithm 3 should require less testing vectors. On the other hand, Algorithm 2 is simpler and requires slightly less calculation time. Algorithm 1 “Greedy” requires a higher number of iterations to achieve FCmax. Algorithm 3 “Hybrid” turned out to be the best in this practical case.
4. Further Reduction in Test Vector Number
In our testing case, all vectors (or selected 28 vectors) return a fault coverage at the level of 85.4% which is denoted as FCmax. It should be noted that some of these undetected faults cannot be detected at all due to, e.g., logic redundancy. Some faults are so hard to detect that only specific instructions with specific input vectors and defined processor states are affected. In practice, these instructions are, in most cases, not used.
In some cases, we want to further reduce the number of test vectors at the cost of a lower FC. In practice, 95 or 97% FCmax may be satisfactory. For this reason, we checked how quickly the FC tends to FCmax, applying the algorithms presented previously.
The initial goal was to reach FCmax with the lowest number of vectors (the result was 33 vectors), which is larger in the case of Algorithm 1 than Algorithm 2 (28 vectors). However, the greedy algorithm (Algorithm 1) results in the fastest increase in FC for the initial iterations. This holds by definition, where the greedy algorithm takes the best possible vector at each iteration (but no global optimization is used); therefore, a different algorithm (global optimization) may return a better result only after two or more iterations.
Algorithm 2 requires 28 first-order test vectors to achieve FCmax. The FC achieved when one of these vectors was applied alone is presented in
Table 4. Based on these results, the order of applied test vectors is determined at the very beginning of this algorithm (before Algorithm 2 is started). This order was determined once. However, this approach allows achieving FCmax, but the number of iterations required to achieve 97% FCmax is optimized further in
Section 5.
Results of Implementation-Aggregated FC vs. Number of Test Vectors
The comparison of the aggregated FC for all three algorithms is shown in
Figure 5. Algorithm 1 results in the highest FC only for the three initial iterations. A higher FC is achieved with Algorithm 3 from the fourth iteration. Using Algorithm 2, the FC increased irregularly. This algorithm is not optimal. However, this algorithm is easier to implement and quicker to execute than Algorithm 3. For the hybrid algorithm, the number of covered faults is calculated at every iteration of the algorithm. Algorithm 1 “Greedy” can be used when a rapid increase in FC in the first few iterations is required. On the other hand, this algorithm requires the highest number of iterations (33) for completion (obtaining FCmax). It is predictable that for other sets of input data, the difference in the number of iterations may be even greater in favor of Algorithm 3 “Hybrid”. Taking into consideration both the number of iterations required to achieve FCmax and the FC increase rate, it is possible to conclude that Algorithm 3 is the best. However, more sophisticated algorithms, i.e., exhaustive search, genetic algorithm, and simulated annealing, might return better solutions.
5. Local Test Vectors
Up to now, global test vectors have only been considered, i.e., a single input vector is applied for the whole test program. The global test vectors reduce the number of input/output data transfers between the processor and external test control module, reduce the memory size, and check results. Nevertheless, when these factors are neglected, a further reduction in the test time might be obtained by employing local test vectors. A local vector is applied only for a single processor block (specified assembler instructions).
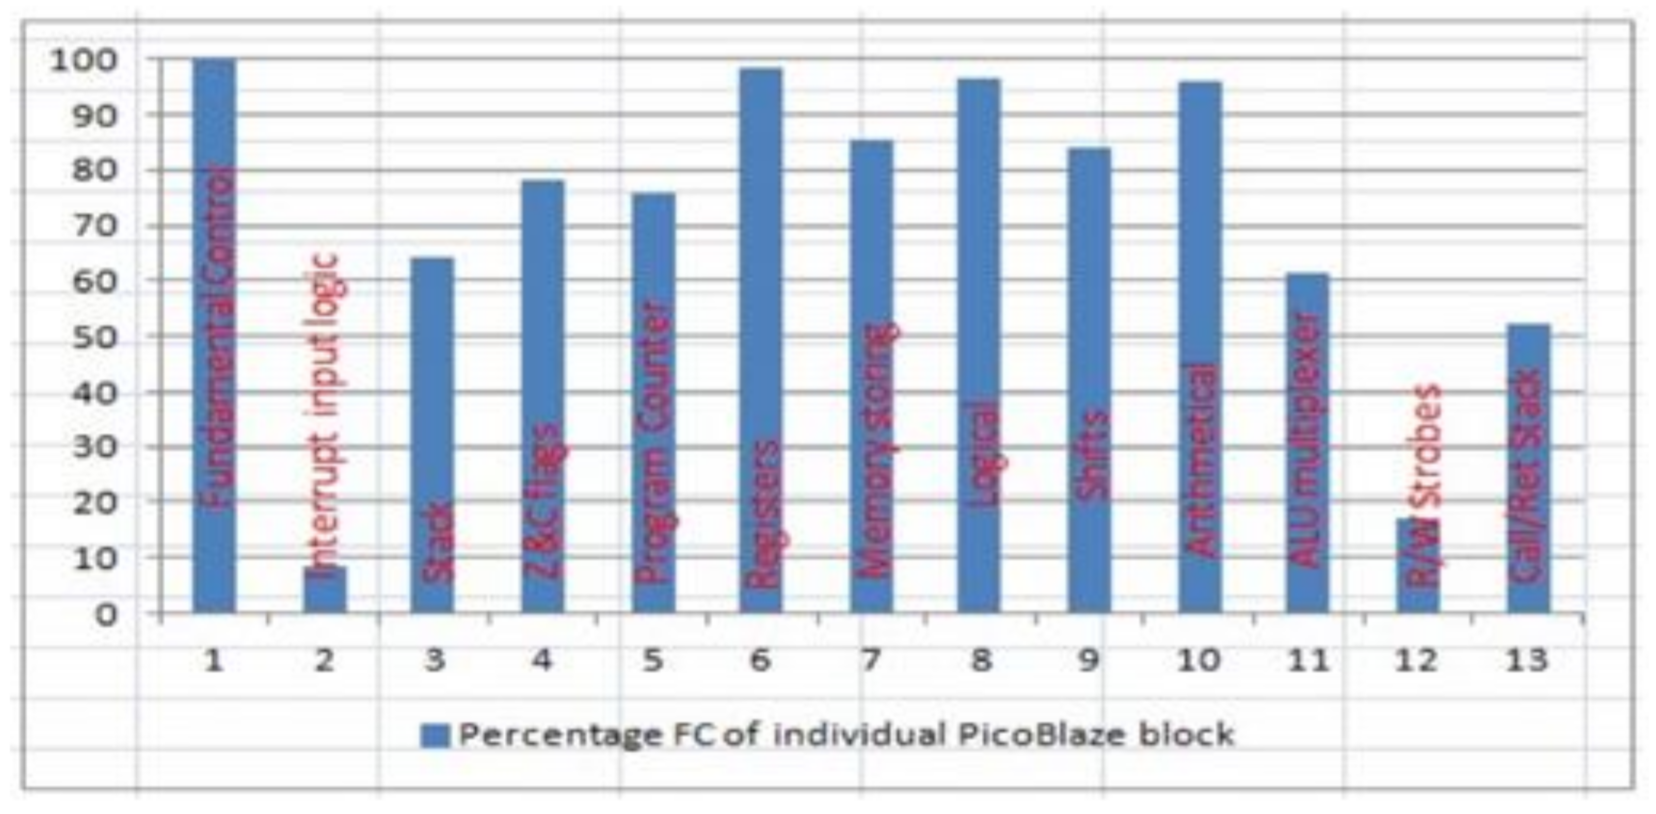
The PicoBlaze VHDL description is divided into 13 blocks by its designer (Ken Chapman). We determined optimal sets of test vectors separately for every hardware block of the processor. We primarily utilized Algorithm 3 Hybrid and Algorithm 1 for this task. Algorithm 1 is usually applied for blocks, where the lowest order of test vectors was relatively high, i.e., 67 or higher. The number of local test vectors required to achieve FCmax(block) and the index of the algorithm which returned the best result are presented in
Table 5.
Three blocks require only one test vector to obtain FCmax(block). Most blocks require two or a maximum of three vectors to obtain FCmax(block). Seven blocks require two such vectors. Only two blocks require three such vectors. However, the worst block is the Zero and Carry Flag block which requires as much as 28 vectors to obtain FCmax(block).
Furthermore, there exist two PicoBlaze HW blocks, where global rather than local vectors are required. Such blocks are Zero and Carry Flags, and Program Counter (PC). Every type of instruction such as logical, arithmetical, and shifts can generate flags. Every instruction of the bijective program tests PC indirectly.
The percentage distribution of detected faults in every individual PicoBlaze block is presented in
Figure 6. We can observe that the best results are achieved for blocks that operate directly on data (Blocks 6–10 in
Table 5).
ALU multiplexer was tested indirectly by assembler functions, and hardware redundancies existed in this block. Moreover, a lot of undetected faults have their place in HW which realizes I/O operations (about 39% injected in this block). For this reason, FC is relatively low here. The most difficult one to test is the Zero and Carry Flag generation block. Hence, there is a higher number of first-order faults and vectors to detect them. The hardware architecture of this block is the most complex. Many one-bit details on both operands (256 × 256) are required to detect all possible situations related to faults in this block. Moreover, a few instructions can generate the same flags in the situation when all 8 bits are taken under calculations and the range of the register is limited to 7, 6, 5, etc., bits. The FC for PicoBlaze blocks dedicated to Program Counter is low too because testing of these processor resources is not the main task of this bijective program, as mentioned above.
Unfortunately, the Zero and Carry Flag block has a maximum of 28 test vectors. Therefore, local vectors cannot reduce the test time in a direct way. One of the solutions to this problem might be to further optimize the testing procedure so that the Zero and Carry Flag block has a separate testing program. For example, we may design a similar testing procedure only for the Zero and Carry Flag block, i.e., check how many vectors are required for each processor block when only flag block faults are injected. The drawback of this solution is that the program size will grow, and the testing procedure will be complicated.
Another solution is to analyze an individual user’s program for what type of flag instructions are used. In most cases, the flag register is modified but the next instruction ignores the flag states; in most cases, only branch instructions check the flag state. Therefore, only a few instructions need to be tested in the Zero and Carry Flags.
6. Configuration Readback
Almost 100% FC can be obtained by using FPGA configuration readback, i.e., when a configuration memory SEU error occurs, we can read the configuration memory and compare it with the original one. Therefore, in theory, this results in 100% FC. Nevertheless, hard faults, i.e., stuck-at errors, might not be detected by the readback, as these faults are not associated with the FPGA configuration memory corruption. Nevertheless, these types of faults are less common than SEUs. Such types of faults can be detected by our test program. Stuck-at faults at the inputs and outputs of LUTs were modeled [
11,
17].
The configuration readback method does not detect any application faults of data stored in BRAM. Fortunately, additional parity bit checking can easily detect these SEU faults. SEU fault detection is much more complicated in the case of registers (standard or pipeline) and distributed RAM (scratchpad or stack memory). In this case, parity bit checking would require redesigning the processor core with associated arithmetic and logic modules. An alternative solution might be triple modular redundancy (TMR). Recent research revealed that the method of partial reconfiguration assisted by TMR or testing achieves the best results. On the other hand, there are static FPGA resources which cannot be partially reconfigured, such as global connections, the logic of interfaces, and part of clock resources. The method of partial reconfiguration is usually complex and requires three bitstreams (original, readback, and masking data, which can change during operation). Xilinx elaborated a CAPTURE tool which makes it possible to store application data before readback. Moreover, testing by the readback method requires knowledge about the placement and utilization of elements (frame address register).
Nevertheless, TMR has its drawbacks too. For example, it requires three times more hardware resources; moreover, TMR is sensitive to a higher number of faults and may not satisfy its function in this case. One of the most important TMR components, the so-called majority voter (MV), is the most critical circuit. For this reason, newer solutions of MV are still being developed, both at the logical and technological levels. New TMR solutions, increasingly immune to SEUs, are also created as temporal, partial, or partitioned TMR [
18,
19,
20,
21].
Reading back the whole FPGA configuration memory is time consuming—it requires a similar time to FPGA programming. The complete bitstream for Virtex Ultrascale+ VU3P contains 213,752,800 bits. Using the SelectMAP mode or the ICAP, this BIT file could be loaded in about: 213,752,800 bits/3,200,000,000 bps 66.79 milliseconds.
The time can be significantly reduced when partial configuration readback is employed. For example, a small partial BIT file for a Virtex-7 device contains a region spanning 100 slices. Before the raw bit (.rbt) file is generated, the configuration time can be estimated by using the bitstream size provided by the PlanAhead software.
Nowadays, the partial reconfiguration technique plays a key role for digital programmable systems, where high reliability is required. In high-reliability systems, partial reconfiguration is often supported by testing for the above-mentioned reasons. Testing according to our methodology under certain conditions [
11,
16] may require a similar amount of time as partial reconfiguration.
Table 6 presents a comparison of reconfiguration and testing times for the PicoBlaze processor core. The first column presents the partial reconfiguration time with an exclusively given processor core. Additionally, the fast version of PicoBlaze (PicoBlazeHZ) was taken into consideration.
There is not an optimal solution for every application. In the case when a fast run time (less than roughly 10 µs) is required, TMR seems the only solution. On the other hand, when the accepted delay is more than 100 ms, configuration readback is the best solution. This readback should be associated with the proposed test and the user’s program execution two or three times in order to detect register/distributed memory SEUs. In the case when the accepted delay is between roughly 10 µs and 100 ms, different solutions might be used. One of them is (partial) readback combined with the proposed testing solution. Another solution might be dual module redundancy combined with the proposed testing procedure to select a proper result. The proposed testing procedure can also be adopted in the case of TMR when two or more SEUs occur. In these cases, selecting the number and/or value (order) of test vectors might be a very important issue and it is application dependent.
7. Conclusions
Testing FPGA soft processors is often neglected since, in most cases, either configuration readback or triple module redundancy (TMR) is used. Nevertheless, testing combined with readback or TMR might still be a good solution. Furthermore, for an allowed delay of 10 µs to 100 ms, soft processor testing might be the very fundamental mission-critical procedure.
In this paper, an SEU-induced fault model in FPGA was presented. Based on the model and the bijective testing procedure, an automated tool was designed to construct the fault detection matrix D. This matrix specifies the fault coverage for every possible test vector. Based on the matrix D, three novel optimization algorithms: Algorithm 1 (greedy), Algorithm 2 (lowest order first), and Algorithm 3 (hybrid), were developed in order to reduce the number of required test vectors without reducing the obtained fault coverage (FC). In the given case study, the number of required global test vectors was reduced from 256 (8-bit microprocessor) to 31 for Algorithm 1, and even to 28 for Algorithm 2 or Algorithm 3. By the introduced theory, it is proved that Algorithm 2 obtains the optimal number of test vectors to obtain FCmax, provided that only first-order vectors are used. In a general case, when second- or higher-order vectors were used, Algorithm 3 seemed to be the best; however, this was not proved in practice, as in our case, testing only first-order vectors resulted in the FCmax. In some cases, it might even be possible to use Algorithm 2 for first-order vectors and an exhaustive search algorithm for second- and higher-order vectors. The provided theory proves that it would result in the optimal solution.
In some cases, the testing time was limited, and thus the number of test vectors needed to be further reduced, sacrificing the level of fault coverage. This case was also studied, and as the result in our case, the greedy algorithm was the best when only three vectors were tested. Otherwise, Algorithm 3 should be employed. This hybrid algorithm considers both global and local optimization. It should be noted that testing only three vectors resulted in a more than 97% FCmax.
A further reduction in the number of testing vectors might be obtained by employing local test vectors. These test vectors are used only for a specific microprocessor block. Most blocks can be fully tested by only two or three vectors. Unfortunately, 28 vectors were required to test the Carry and Zero Flag generation block, and the flag register was influenced by most instructions. It should be noted that the Carry Flag register was, in most cases, used only for branches. Therefore, a further reduction in the number of test vectors can be obtained by analyzing an individual program. The drawback of local vector usage is that more input and output vectors should be transferred to/from the microprocessor, and in some cases, these vectors’ transfer may be more problematic than an increased test run time in the case of global vectors. Further optimization may be achieved by employing a hybrid method: global and local vector usage, i.e., employing 2 global vectors and 26 local vectors to test only the flag register block.


