Article

Identifying the Lack of Energy-Conscious Behaviour in Clinical and Non-Clinical Settings: An NHS Case Study

1
James Watt School of Engineering, University of Glasgow, Glasgow G12 8QQ, UK
2
School of Engineering, University of Greenwich, Kent ME4 4TB, UK
3
School of Psychology, University of Kent, Canterbury CT2 7NT, UK
4
College of Engineering, Design and Physical Sciences, Brunel University London, Middlesex UB8 3PH, UK
5
Medway NHS Foundation Trust, Kent ME7 5NY, UK
*
Author to whom correspondence should be addressed.
Current address: James Watt School of Engineering, College of Science and Engineering, University of Glasgow, Glasgow G12 8QQ, UK.
Electronics 2021, 10(20), 2468; https://doi.org/10.3390/electronics10202468
Submission received: 13 September 2021 / Revised: 29 September 2021 / Accepted: 30 September 2021 / Published: 11 October 2021
(This article belongs to the Special Issue Electrification of Smart Cities)

Abstract

:
The race against climate change has been a great challenge for years, and the UK government has taken serious steps towards achieving the net-zero carbon target by 2050. Technology is leading the way and innovation is believed to be a key solution. Nevertheless, tackling the issue, by attempting to limit the waste in energy, due to negative energy usage behaviour, has proven to be a successful approach that is capable of complementing other technology-based initiatives. The first step towards this is to promote energy-conscious behaviour and pinpoint where savings can be made. Thereby, this paper contributes to the existing literature, by presenting a new methodology to identify potential energy waste and negative energy usage behaviour in an NHS hospital. The paper presents an analysis of electricity consumption vs occupancy during minimal consumption periods (i.e, bank holidays and weekends) and it presents a log of equipment left switched on outside of working hours, in order to highlight the level of energy-conscious behaviour. The results revealed that the proposed technique is not only able to identify negative energy usage behaviour amongst the hospital staff but helps identify areas where immediate energy savings can be made, with potential savings of more than 30,000 pounds, if action is taken.

1. Introduction

Management of energy consumption and carbon emissions has been an ongoing challenge for years and has lead to high energy costs and negative impacts on the environment [1,2]. Presently, excessive energy consumption and carbon emissions pose environmental threats on a domestic and non-domestic level in the United Kingdom (UK); with energy contributing to both economic and social development [3], controlling it is crucial.
The building sector is an active energy consumer [4], accounting for 40% of the energy consumed in the European Union [5] and 34% of the world’s total energy consumption [3], with 9% for commercial ones, as per the International Energy Agency (IEA). This translates into 12% of global CO 2 emissions [6]. Efforts have been made, and several studies conducted, to address energy conservation in the building sector. Some research studies rely on achieving energy efficiency, by targeting heating ventilation and air conditioning (HVAC) systems, lighting, and office equipment [5,7,8]; other studies focus on energy usage behaviour [9,10,11,12,13,14]. However, and to the best of the authors’ knowledge, relatively little attention has been given, in the literature, to the analysis of energy consumption for identifying where (and how) energy is wasted, i.e., is it due to negative energy usage behaviour?
The attitudes and conduct of individuals towards energy usage, here and after referred to as ‘energy usage behaviour’, can have a significant impact on overall energy consumption [15]. An often-repeated phrase in this paper is “negative behaviour” or “negative energy usage behaviour”, and it refers to actions taken by individuals, resulting in unnecessary consumption of energy. An example of negative energy usage behaviour is leaving equipment/appliances powered on when not in use, resulting in unnecessary high consumption of electricity. Steps toward improving energy usage behaviour can be made, without the need to spend substantial amounts of money on energy-saving measures, if the focus is turned towards behavioural change [16]. One key step in enabling behavioural change is monitoring consumption over prolonged periods of time to establish a strong baseline, which is a crucial stage in building successful energy management plans [17,18,19]. Baseline data can be further used for waste analysis, identifying behavioural patterns, and comparison with the post interventions’ consumption, in order to highlight the impact of the introduced energy-saving measures.
This paper presents an analysis of the data collected during a field study, conducted in Medway NHS Foundation Trust (MWNFT), a hospital in the south-east of England, in order to promote energy-conscious behaviour amongst the members of staff, using persuasive technology [20]. The data collected during the study and analysed in this paper includes half-hourly electricity consumption, occupancy numbers by members of staff and patients, responses to relevant questions from a “Views and Ideas on Energy Usage and Behaviour” questionnaire, and the results of an equipment audit performed outside of working hours. The paper builds on the work in [2], which presented a framework designed to address the energy usage behaviour issue in MWNFT. Moreover, the work in [2] highlighted the main building blocks of the system and the techniques implemented to collect the data during the study period. Nevertheless, the focus in the current paper is on analysing the electricity and occupancy data, collected during the baseline period of the field study, in order to identify the possible presence of negative energy usage behaviour. The idea is to show that by performing basic analysis of electricity consumption patterns outside of working hours, waste can be identified and linked to potential negative energy usage behaviour. Studies in the literature have shown that behavioural interventions can record immediate savings of up to 21.9%, without the need for introducing invasive and expensive energy measures [21].

Research Contribution and Impact

This section is intended to summarise the contributions made by the work presented in this paper, that is, why they are deemed significant contributions, and the potential impact they can have on the field and particularly, in assisting other research studies that are focused on the behavioural change side of energy management.
  • A novel methodology is proposed, in order to identify where energy is wasted by analysing the electricity consumption of two independent clinical and non-clinical areas in MWNFT. This involves the analysis of electricity consumption patterns, in light of occupancy and the consideration of the member’s of staff mindset and behaviour towards energy usage, through a questionnaire and an equipment audit to pinpoint which equipment is left switched on unnecessarily.
    Significance and Impact: This contribution is believed to be a game changer, when it comes to energy management. Studies, such as [5,22,23,24], that focus on the high energy consumption problem tend to overlook the “Why?” question and focus on bringing down the numbers by introducing energy-saving measures. However, there are far simpler and cheaper methods to bring down energy, carbon emissions, and costs. The Department for Energy and Climate Change (DECC) have published several energy efficiency guidelines for the community to follow. In [25], the DEEC were providing guidelines to small and medium-sized enterprises (SMEs), in relation to energy efficiency. The main focus of the report was to point out basic and cheap measures to reduce wasted energy, in order to cut down energy costs. Several case studies were reported, including that of the Chinese Contemporary Arts Centre in Manchester, which managed to save 4363 pounds and 17.6 tonnes of CO 2 e a year by installing a 100 pounds timer, after discovering heaters were left switched when the occupancy of the rooms was zero. Thereby, successfully pinpointing where and how energy is wasted would enable energy management personnel to focus their efforts in one place and ensure the maximum effectiveness of the implemented energy conservation techniques.
  • To the best of the authors’ knowledge, this study is the first of its kind to address the issue of energy usage behaviour in a hospital environment.
    Significance and Impact: Although the analysis and methodology presented are applicable to data collected in any environment, this research study invites the question “Why hospitals and not any other type of building?". The answer to this question lies in the fact that hospitals are high consumers of energy when compared to other types of buildings [26]. A study reported that the healthcare sector spends 400 pounds million per year on energy [27], while another reported 750 million pounds [28]. The 24-h operation of hospitals throughout the year makes it the biggest consumer but also creates the high potential to save energy in a society [29]. Thereby, it is hoped that by following the footsteps of this paper, other studies will emerge that tackle the same issue in other hospitals with the sole purpose of making a collective positive impact on the environment.

2. Background

In recent years, several research studies have been conducted on the impact of occupants’ behaviour on energy consumption in the building sector [30,31,32,33]. The purpose of the studies was to conduct experiments to show the effectiveness of feedback technology on occupants’ behaviour towards energy usage.
In line with the feedback theory, providing an individual with feedback is a performance indicator of a habit that will drive the individual towards associating their behaviour and its consequence [34]. In the context of this study, energy consumption feedback is the provision of visual usage information to the energy users to increase their awareness of their consumption [35].
The problem tackled by the provision of feedback is the invisibility of energy usage information to the end-user [36], especially in non-domestic buildings. The invisibility of usage leads to the lack of consideration of the high energy usage consequences. This turns the individual to a state of ignorance of the impacts of their actions, that is, negative energy usage behaviour. A considerable amount of data and information is required to redirect the individual towards the causes of their actions and make them think about them [35]. Providing feedback to individuals can result in self-awareness of their energy usage, which leads to energy-conscious behaviour and reduced carbon footprint [37].
A sustained energy-conscious behaviour and reduction in energy consumption cannot be promoted by merely providing numerical information, but feedback must be combined with other interventions [35,36], such as goal setting [9,34,38], incentives [11], and energy delegates [10]. However, the interventions did not account for or measure negative behavioural patterns amongst the energy users that participated in the studies [33].

Why Was Medway Hospital Selected for This Study?

The particular choice of Medway hospital has two main scientific folds, the first is the hospital’s status in carbon emissions, compared to other NHS hospitals across the UK (Figure 1). The second is the fact that MWNFT is considered one of the biggest employers in Medway towns and one of the top five NHS hospitals across Kent, Surrey, and Sussex, with almost 4000 members of staff employed, which made it an ideal location for an energy-conscious behaviour study. Moreover, working in close proximity of the hospital premises, during the data collection phase, was an added advantage.
The data plotted in Figure 1 were obtained from publicly available Estates Return Information Collection (ERIC) reports, and the corresponding carbon emissions were computed using a 0.3516 kgCO 2 per kWh of electricity, conversion factor, as per the hospital’s energy team. The carbon emission figures in Figure 1 are shown for electricity only, which was the focus of the pilot study conducted in Medway hospital. The increase in carbon emissions from 2009 to 2018 shows an average of 4%, compared to other trusts that showed a 1.5% drop in the five years preceding 2018 as few energy-saving measures were introduced at Medway hospital during the period.
Previous literature reports on the use of feedback as a performance indicator with a focus on the types [36] and characteristics of feedback. Discussions and studies emerged showing the impact of different types of feedback (direct [39,40,41], indirect, inadvertent [42], utility-controlled and energy audits [43]), frequency of information provided [35,44,45], presentation medium [46,47,48], data units [49,50] and location of feedback [43,45,51].
Negative behaviour towards energy usage is directly tied to waste in energy. Studies in the literature, such as [1,9,44,51], go on to tackle the increased energy consumption by targeting behavioural change without identifying that there is, in fact, a behavioural issue. Although the studies yielded positive results, and the findings do show the effectiveness of the approaches taken, they focus on implementing a method to influence positive energy usage behaviour without looking at how and where energy is wasted. The success in such cases is reliant on the presence of the influencer, which, in busy environments and changes in members of staff, can result in losing the positive impact.
With current studies of building energy performance, resulting in errors of up to 300% according to [52,53]. Thereby, the consideration of occupants and their negative behaviour could have potentially shaped the experiments and resulted in more significant savings and sustained pro-environmental behaviour. Furthermore, enabling the creation of informed policies to encourage waste-free energy usage behaviour.
Here, the focus is on the analysis of baseline data to identify potential negative energy usage behaviour and areas where energy is wasted prior to any interventions, which, to the best of the authors’ knowledge, is an area that was not previously addressed in the literature. This study presents a methodology to identify negative energy usage behaviour by correlating the electricity consumption with the occupancy, by members of staff and patients. High consumption periods, with low occupancy, can be flagged as anomalies and could be further investigated to confirm energy waste. Performing this outside of working hours, for example during bank holidays, can be an indication of unused equipment being left switched on, and this is the main focus and contribution in this study.

3. Methodology

This section intends to outline the methods adopted in the study, including the ward/department selection process, as well as data collection and analyses techniques. Section 3.1 outlines the selected wards/departments and details of the selection process, while Section 3.2 provides information on the data collected and presented in this paper as well as the adopted analysis techniques.

3.1. Selection of the Clinical and Non-Clinical Ward/Department

The selection process of the areas chosen for this study aimed at reflecting the capability of the system and framework to be applied to clinical and non-clinical domains. Thus, enabling other sectors of the community across the UK to adopt the methodology and tackle energy usage behaviour issues in their buildings. Accordingly, two independent wards/departments, from Medway hospital, participated in this study. One of the selected areas is a clinical ward and the other is a non-clinical department; however, both have fixed operating hours to enable analysing the energy consumption during and outside of working hours. Details of the selected areas are below:
  • The Clinical Engineering (CE) department, which has a typical office setting with members of staff working from 8 a.m. to 5 p.m. during weekdays. The department looks after servicing medical equipment across the hospital and is responsible for buying new equipment along with testing, maintaining, and distributing them across the hospital’s wards/departments.
  • The Cardiac Catheter Suite (CCS) has a mixture of offices and ward areas for patient scans and treatments. The ward diagnoses and manages patients with acute and chronic heart-related health conditions, and patients spend short amounts of time there, as they come only for examination.

3.2. Data Collection and Analyses Techniques

Four quantitative data types were collected and are discussed in this subsection. The first is the electricity consumption data, the second is the number of occupants in each ward/department, the third is a log of equipment left switched on outside of working hours, and the fourth is the members of staff’s views on energy consumption and saving regimes, through a semi-structured questionnaire.

3.2.1. Electricity Consumption and Occupancy Data

Data on electricity consumption was collected over a period of 15 months, between December 2017 and February 2019, using the wireless electricity data logger (WEDL) presented, in [54] which recorded electricity data from the hospital electricity meters, at a half-hourly rate. It was crucial to collect high resolution electricity data, from individual hospital wards, to enable fine-grain monitoring and analysis of consumption trends and energy-conscious behaviour. The permanently deployed system, previously presented in [2], meets this particular criteria, which is necessary for this type of studies. Other techniques include more invasive approaches, such as installing temporary energy-sensing nodes using smart plugs inside the wards or clamp sensors [1] in the electrical distribution boards, located inside the wards; both can cause a disruption to the wards’ operation.
Occupancy data were also collected during this period and was obtained directly from hospital records. The advantage of this was the easy and rapid access to anonymous occupancy figures crucial for the timely progression of the study. Other techniques of people counting involve using technologies such as radio frequency identification (RFID) [55], Wi-Fi [56], and thermal imaging [57]. Although, deploying such technologies in a hospital environment can face several challenges, due to privacy (such as with RFID) and compliance with the health code; those approaches can be considered for future research.
The collected data were analysed to calculate:
  • Consumption per occupant;
  • Statistical correlation between weekly occupancy and electricity consumption;
  • Hourly electricity consumption profiles of weekends and bank holidays.
Consumption per occupant is a critical metric to establish a baseline number that takes into consideration the occupancy of the target place. For instance, a day with consumption recorded above average can be due to an intense operation in the workplace, rather than being an anomaly, and one with low recorded consumption can be the opposite. Thereby, knowledge of occupancy is a step closer to evaluating and explaining the recorded consumption.
The second point to be analysed, that is statistical correlation between energy consumption and occupancy, is to highlight the impact of occupancy on the area’s energy consumption.
Lastly, the hourly profiles of weekends and bank holidays are presented to shed some light on a higher resolution of data. The increased consumption, with reference to the average weekly consumption of the ward/department, will flag anomalies that can enable the identification of negative energy usage behaviour. Given the data collected for this study was for a period of 15 months, which, in an hourly resolution, equates to a large number of data points. The hourly profiles presented are of a limited number of weekends and bank holidays to showcase what is believed to be a pattern of behaviour and electricity usage.

3.2.2. Out-of-Hours Log of Switched on Unused Equipment

As part of the long-term aims of the study, to measure the improvement in energy usage behaviour, a log of equipment left switched on, outside of working hours, in each ward/department, was created. The information collected about the equipment was used as a measure of energy-conscious behaviour in the workplace. Although this is not the aim of this paper, this metric would enable quantifying human behaviour in the workplace, hence enabling accurate evaluation of energy usage behaviour.
The data were collected through out-of-hours walkarounds in both of the wards/departments reported in this paper. The information collected includes:
  • Description of the equipment/device, for example, a PC or a monitor, and so on.
  • Count of the equipment if more than one was left switched on
It was crucial to only consider the impact of the electricity consuming loads that are connected to the WEDL. For instance, the lights were disregarded as they were not fed from the same distribution board feeding the rest of the equipment in the wards/departments.
The equipment involved in the analysis were only those that the working members of staff can access and control. Prior to the study, it was ensured that the selected equipment will encounter no problems or malfunction if switched on and back off every day. This was confirmed with the IT department, medical equipment department, and the wards’/departments’ managers, each for the equipment they oversee. A piece of equipment was recorded as “unnecessarily left switched on” based on whether they were left performing an overnight task and were only recorded if they were not. This was to accurately model the behaviour of the members of staff working in the wards. The equipment can be categorised as follows:
  • Office, for example, PCs, monitors, and so on.
  • Kitchen, for example, water boiler, water cooler, coffee machine, and so on.
    -
    Both areas, analysed in this paper, were fitted with a wall mount Hydroboil instant water boiler, energy rated 2.4 KW @230 V.
  • Medical, for example, blood pressure monitors.
Whilst the individual impact of every piece of equipment varies, depending on power rating and usage, the purpose of this analysis was to assess the behaviour of the members of staff regardless of how big or small the impact on energy usage is. This is because doing so with low power usage equipment will develop a behaviour that will urge the user to perform the same action with everything else as evidenced by the psychology of habit [58].

3.2.3. Views on Energy Consumption Regimes

A semi-structured questionnaire, entitled “Views and Ideas on Energy Usage and Behaviour” was designed to gather information on the views and ideas of individuals working in the hospital. The questionnaire was designed based on recommendations from Carbon Trust [59] and the energy team at MWNFT.
Two categories of participants took part in this survey, the first were 12 individuals from the two pilot wards/departments to reflect the behaviour within each and the second were 89 individuals from across the hospital to enable modelling the overall behaviour of members of staff across the hospital. Qualtrics [60], an experience management company, online survey software was used to develop and send the questionnaires to the participants, after providing informed consent. The following questions were selected from the questionnaire:
  • How many actions are you aware of that can save energy?
    The responses to this question can help indicate the level of awareness of the members of staff in each ward/department and can be correlated to the recorded consumption and unused equipment left switched on, in order to identify negative energy usage behaviour.
  • Do you think your use of energy is efficient?
    This question provides some information on individuals’ perspectives of their energy usage behaviour.
  • Do you feel that you, as an employee, have a role to play in improving the way energy is used within the Trust?
    This question complements the previous ones in painting the big picture of individuals’ role in the hospital towards energy conservation.

4. Results and Discussion

This section presents, for each ward/department, three levels of analysis. Firstly, the analysis of the electricity usage and occupancy in the wards/departments selected for this study, where the aim is to enable the identification of negative energy usage behaviour by comparing electricity consumption in weeks with and without bank holidays. Secondly, the hourly profiles for weekends and bank holidays are presented, in order to further support the findings from the weekly data. Lastly, a behavioural measure is presented in Section 4.3, for both wards/departments combined, based on the data collected from the semi-structured questionnaire and the out-of-hours audit of equipment.

4.1. The Clinical Engineering Department

4.1.1. Weekly Electricity Consumption and Occupancy

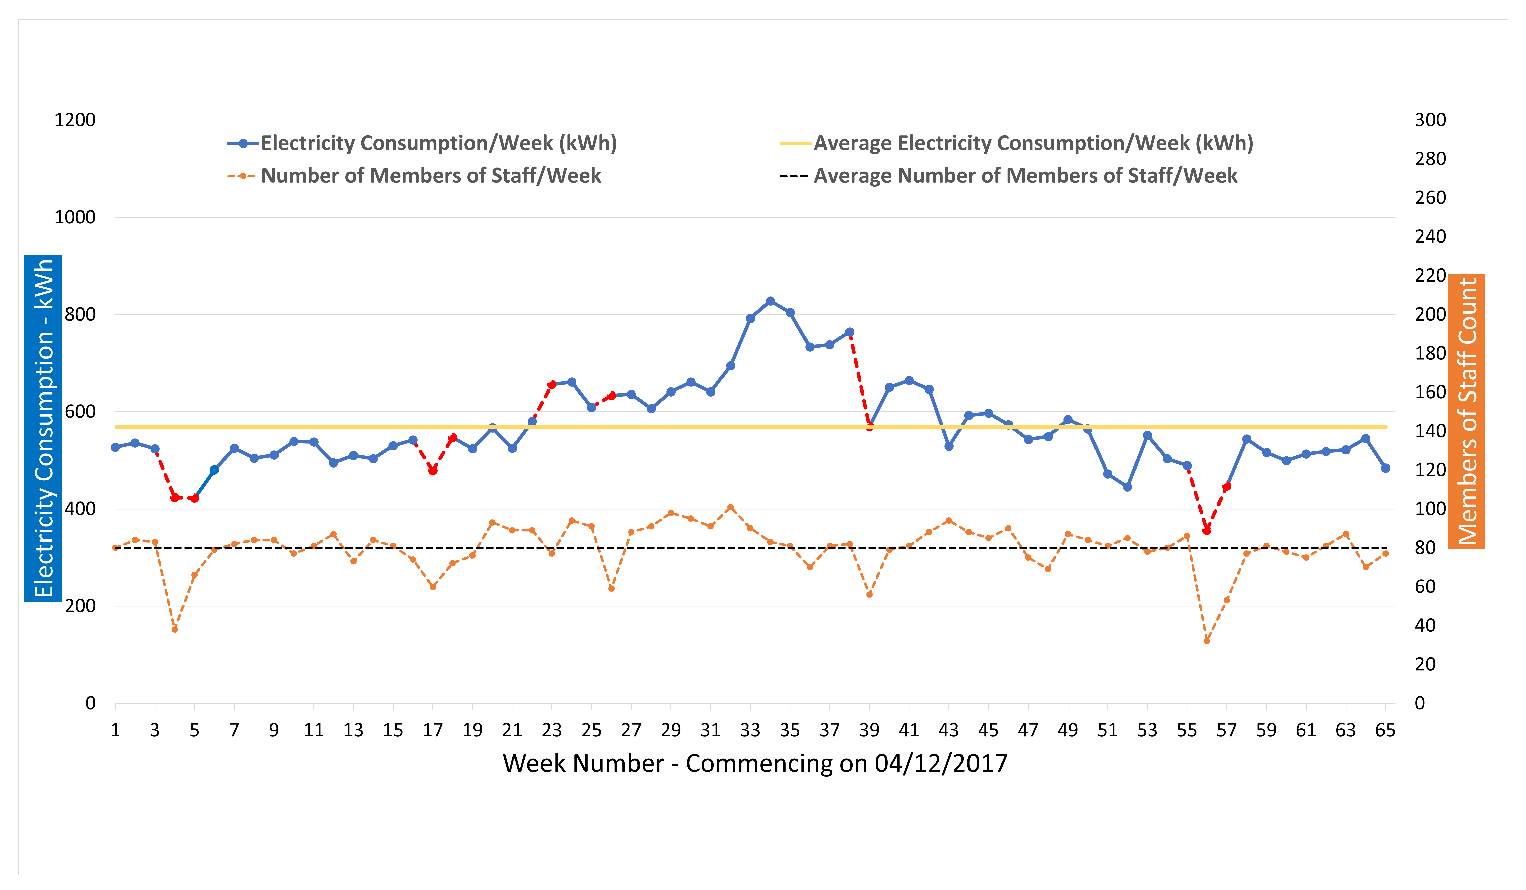
Figure 2 shows a plot of the weekly electricity consumption and the number of members of staff in the CE department during the baseline stage. The solid line shows the electricity consumption throughout the baseline period. Moreover, the consumption during the nine bank holiday weeks is represented on the graph of Figure 2 using a dashed line, highlighted in red.
The data recorded during the bank holiday weeks show great variations from one to the other. For example, the recorded consumption in the first two bank holiday weeks (weeks 4 and 5) are 423 and 422 kWh, with 38 and 66 members of staff, respectively. Although the second bank holiday week (week 5) had 74 % more members of staff working, the consumption remained nearly the same. Moreover, week 4 had two bank holidays, while week 5 had only one. A similar scenario applies to weeks 23 and 26. Accordingly, a potential lack of awareness and a negative energy usage behaviour amongst members of staff in the department can be reported.
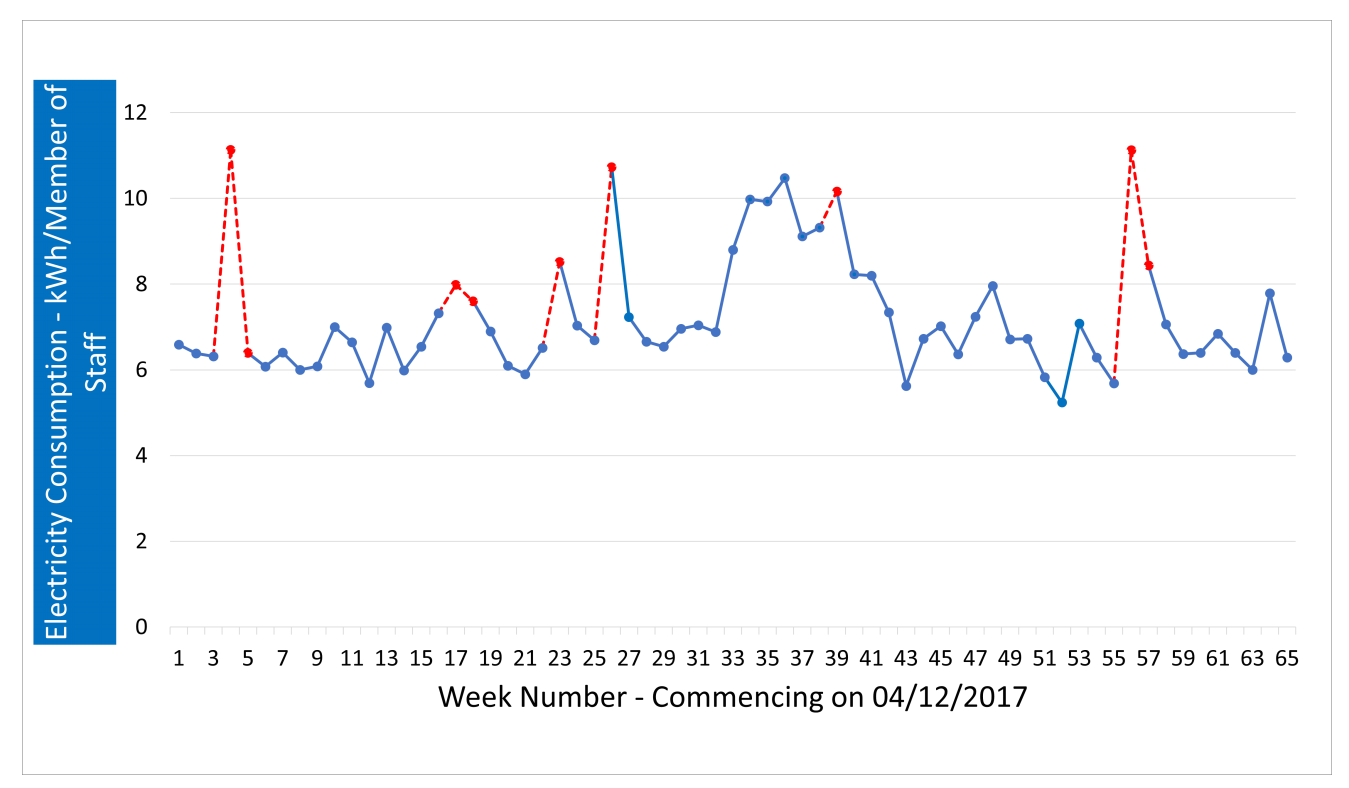
A measure of energy usage behaviour is the recorded consumption per occupant, and the target is to record the lowest possible value for it by reducing unnecessary consumption. Figure 3 was plotted to show the consumption per member of staff across the same period, to enable drawing a more reliable conclusion on the energy usage behaviour within the department.
The dashed red lines in Figure 3 represent the highest recorded weekly electricity consumption per member of staff (all above the average of 7.2 kWh/staff), in the weeks with bank holidays in them, that is, where it is expected to record lower overall consumption. What is alarming about them all is the very low occupancy recorded during these periods, which is a clear indication of the presence of negative behaviour. It is valid that there can be other reasons, such as the use of high consuming equipment to counter a high or low temperature, and so on. However, it is to be noted that heating is not electricity based in Medway hospital, and no equipment, foreign to the department, were reported during the data collection stage.
To further highlight the relationship between electricity consumption and occupancy in the CE department, a statistical correlation analysis was performed to highlight the significance of the correlation between both data sets. The reported results indicated a positive but weak correlation (p-value < 0.1; r = 0.431) between the weekly electricity consumption recorded by the department and the occupancy during the same period. This shows the reality of the situation in the hospital where the consumption can be high with low occupancy. This shows the importance of analysing the consumption patterns, in the context of occupancy, to identify negative energy usage behaviour.

4.1.2. Hourly Profiles of Weekends and Bank Holidays

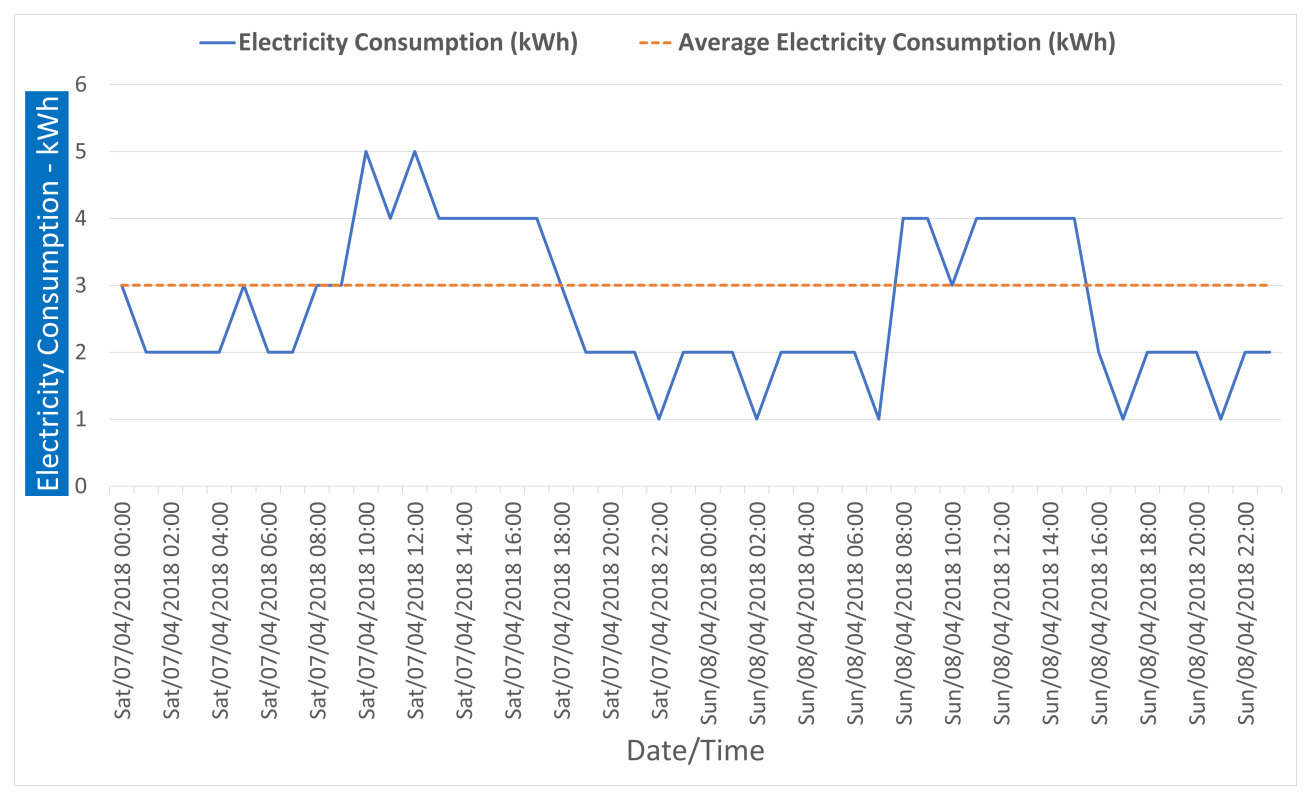
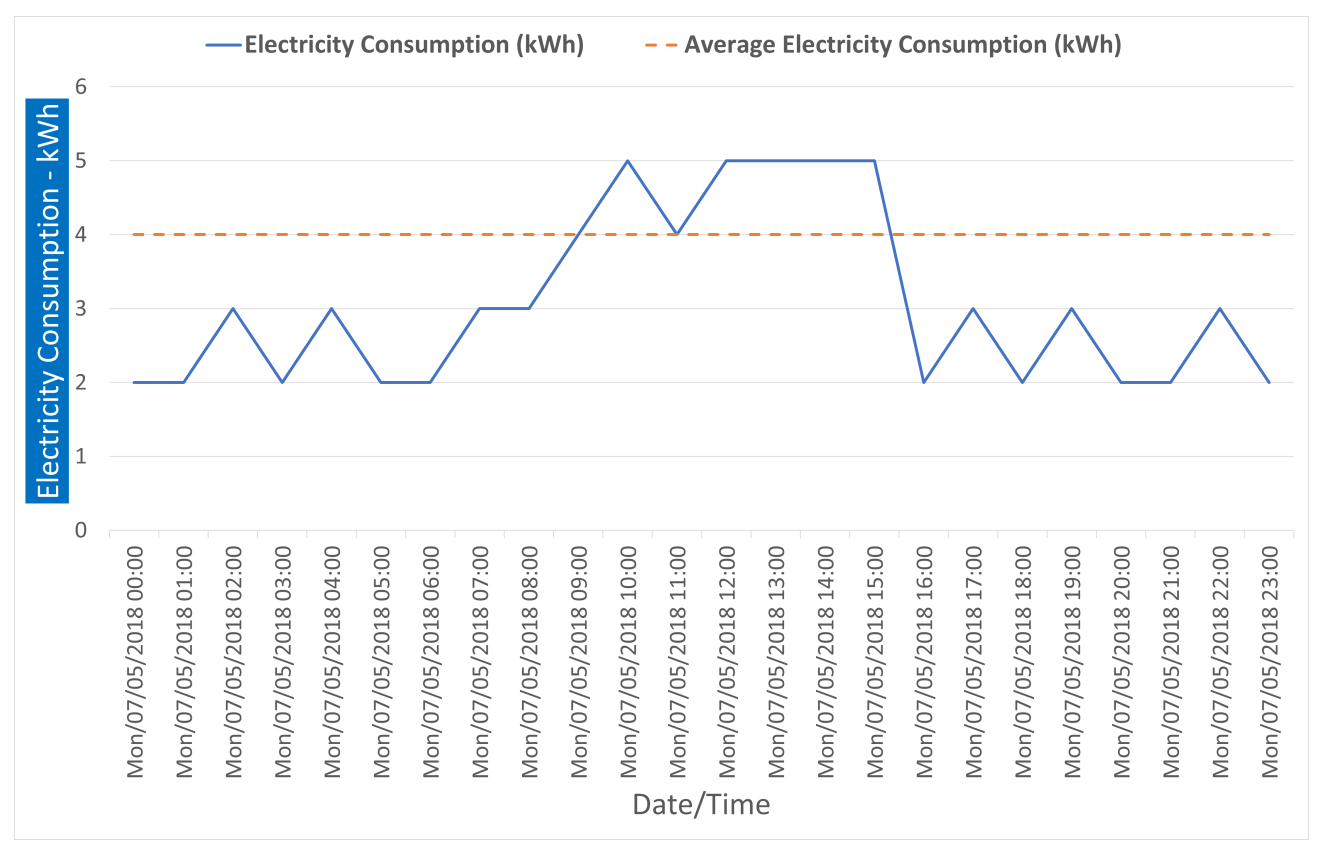
The analyses presented in Section 4.1.1 showed the potential presence of negative energy usage behaviour in the CE department. To further support this, the hourly profiles of the department on the weekend commencing 7 April 2018 and the bank holiday, on the 7 May 2018, are presented in Figure 4 and Figure 5, respectively. The graphs in Figure 4 and Figure 5 are plots of the hourly electricity consumption in the department, on the designated days, against the average usage of the whole week (MON-SUN).
With the department having zero occupancy over weekends and bank holidays, the profiles seen in the figures raise concerns on the member of staffs’ behaviour towards equipment outside of working hours. The data shows electricity consumption being above average for 9 h on Saturday and 7 h on Sunday (see Figure 4) and for another 7 h on bank holiday Monday (see Figure 5). This increased consumption can potentially reflect equipment being left switched on outside of working hours, leading to an unnecessary increase in electricity consumption.

4.2. The Cardiac Catheter Suite

4.2.1. Weekly Electricity Consumption and Occupancy

A similar approach to the analysis was taken with the clinical ward in the study. However, unlike the department in Section 4.1, only eleven months’ worth of data were analysed from December 2017 up to and including October 2018. The four months November 2018 to February 2019 were disregarded, as there was work that involved the installation of a replacement chiller, which caused a large drop in the meter readings recorded by the EFS for the CCS. This was based on information from the operational estates team in Medway hospital.
As a clinical ward, the occupancy can be either by members of staff or patients. However, this analysis excluded the members of staff counts based on their Coefficient of Variation (CV), an evaluating measure of the standard deviation [61]. The CV of the members of staff counts during the eleven months baseline period was found to be 11.17% for an SD = 2.80 and M = 25, indicating that the variability in members of staff counts were not significant throughout the baseline period. Hence, the members of staff counts were assumed to be a fixed factor.
The patient counts over the same period had a CV of 14.58%, which is close to that of the members of staff, with an SD = 74.94 and M = 514. However, the identities of the staff members working in the clinical ward do not change significantly over a period, but with patients they do because of new cases, illnesses, treatments, and others. Therefore, the non-significant variation in the number of patients has a more significant impact on energy consumption than that of the members of staff. Hence, the analysis was performed to identify the impacts of patient numbers on the ward’s electricity consumption.
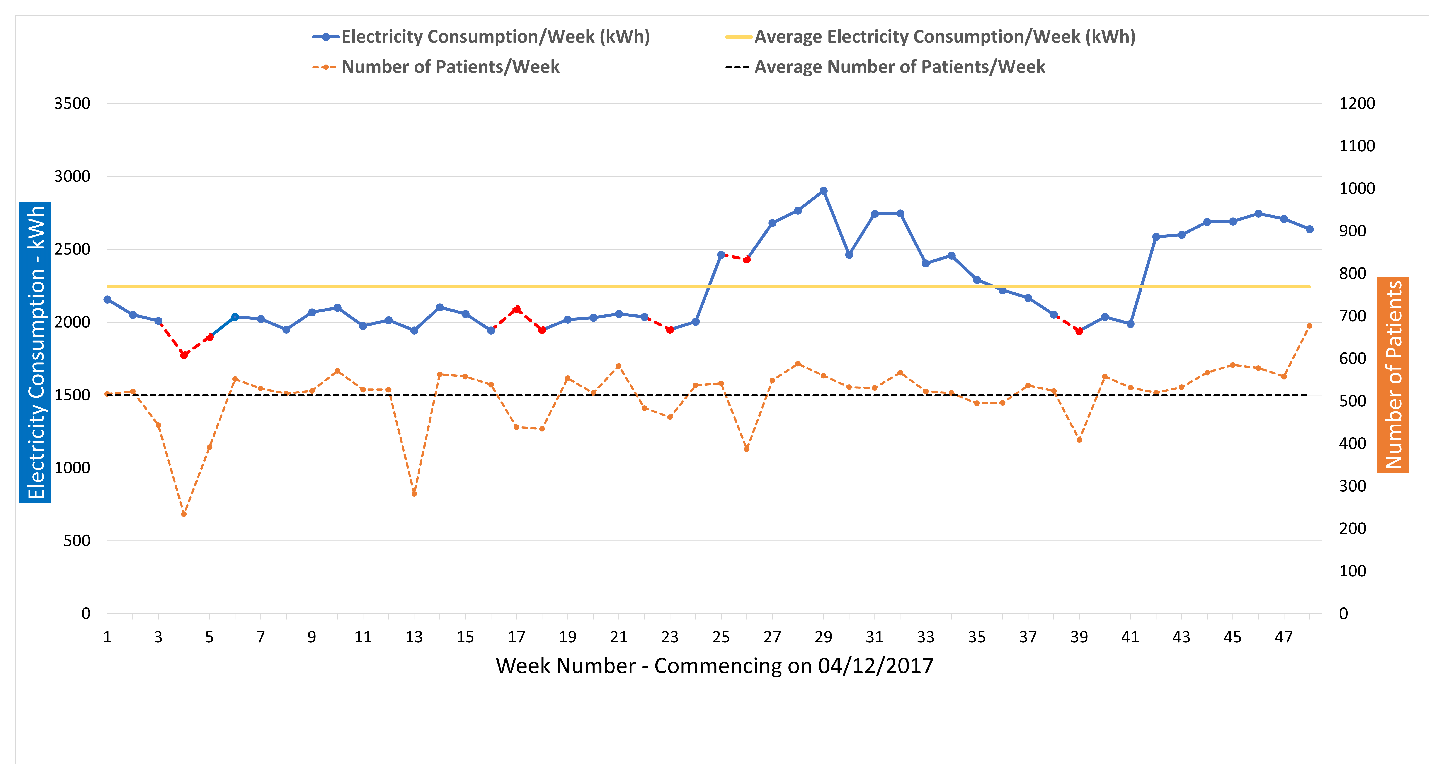
Figure 6 shows a plot of the weekly electricity consumption and the number of patients in the CCS during the baseline stage. The top solid blue line graph shows the electricity consumption, with the consumption during the seven bank holiday weeks dashed and highlighted in red.
Electricity consumption in the bank holiday weeks varies, with some of them, for example week 26, recording consumption above average (Figure 6). This variation in the data across weeks with at least one bank holiday is an indication of a potential waste in energy that can be attributed to negative energy usage behaviour.
Considering the first bank holiday week (see Figure 6, week 4), the recorded consumption is 1775 kWh with 234 patients admitted to the ward. Comparing this with another bank holiday week 18, which recorded 1947 kWh and 201 more patients, plus the fact that week 4 had two bank holidays, can indicate energy waste outside of working hours.
Similarly, weeks 23 and 26 were compared; week 23 recorded approximately 480 kWh less, with 75 more patients admitted. This shows the importance of considering and analysing high-resolution energy data against occupancy and the information that such analysis can reveal.
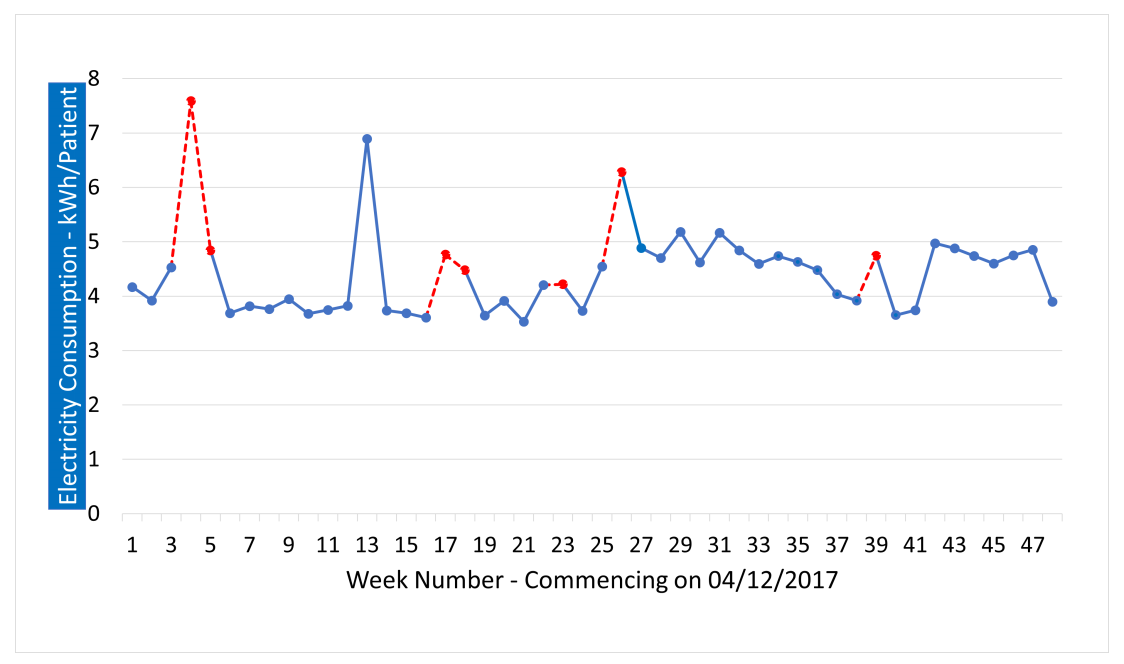
A key metric, especially in a clinical ward, is the consumption per patient to evaluate energy usage behaviour and also as a measure of the efficiency of operation and resource utilisation within the ward; although, the introduction of any energy measure must not negatively impact the day to day operation of the ward and the quality of patient treatment. Figure 7 shows the consumption per patient across the same time period to evaluate the ward’s energy usage behaviour.
The dashed red lines in Figure 7 represent the highest recorded weekly electricity consumption per patient, in the weeks with bank holidays in them, most of which are above average (4.44 kWh/Patient).
Bank holiday Weeks 4 and 26 alongside week 13 reported the highest consumption per patient and the lowest number of patients admitted (see Figure 6), compared to the final week in the data set. The fact that fewer patients were admitted means less equipment used, less activity, and potentially, very high waste and the presence of negative behaviour.
To further highlight the relationship between electricity consumption and occupancy in the CCS, a statistical correlation analysis was conducted. The reported results indicated a significant positive correlation (p-value < 0.1; r = 0.484) between the weekly electricity consumption recorded by the ward and the occupancy, by patients, during the same period. As with the non-clinical ward (Section 4.1), the correlation factor is below 0.5. This further supports the result from the non-clinical area but also adds new insights to the analysis by showing that having fewer patients can still mean high consumption, indicating the potential lack of awareness towards energy usage in the ward.

4.2.2. Hourly Profiles of Weekends and Bank Holidays

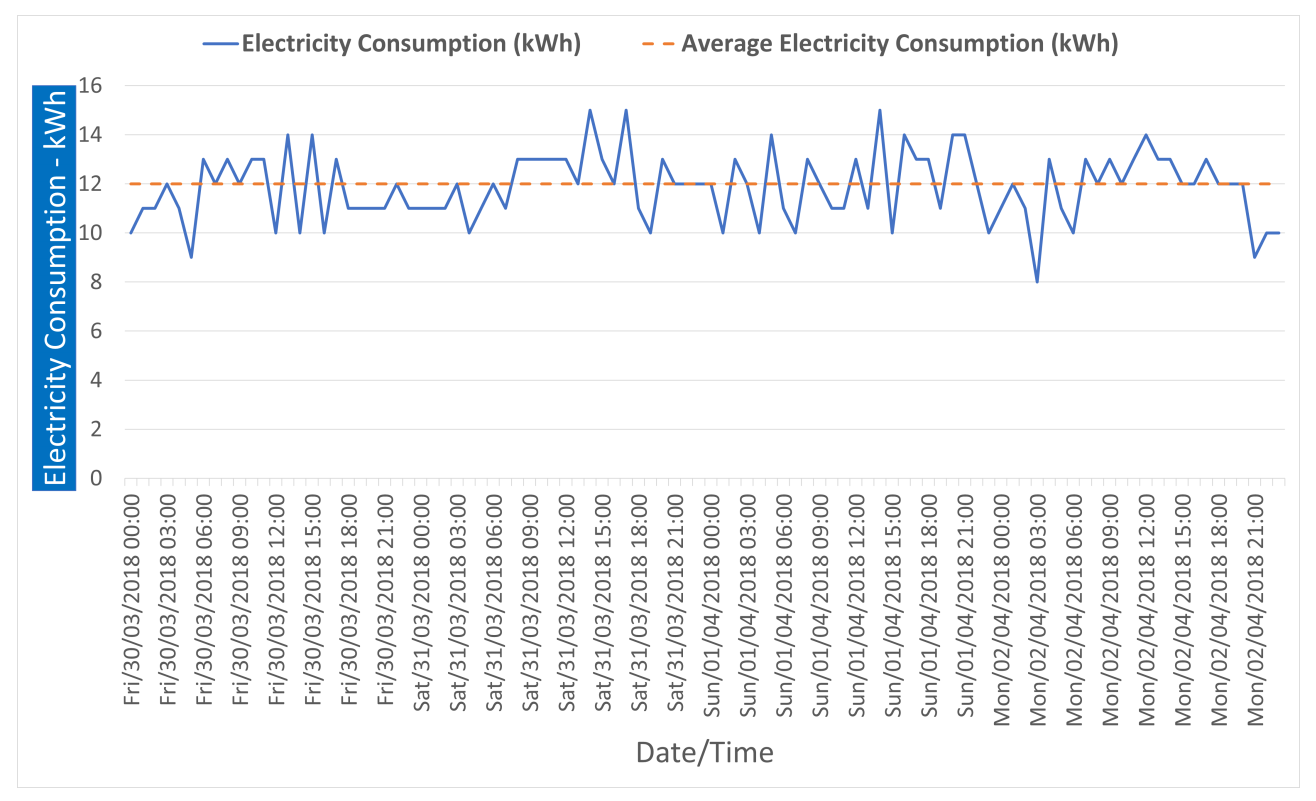
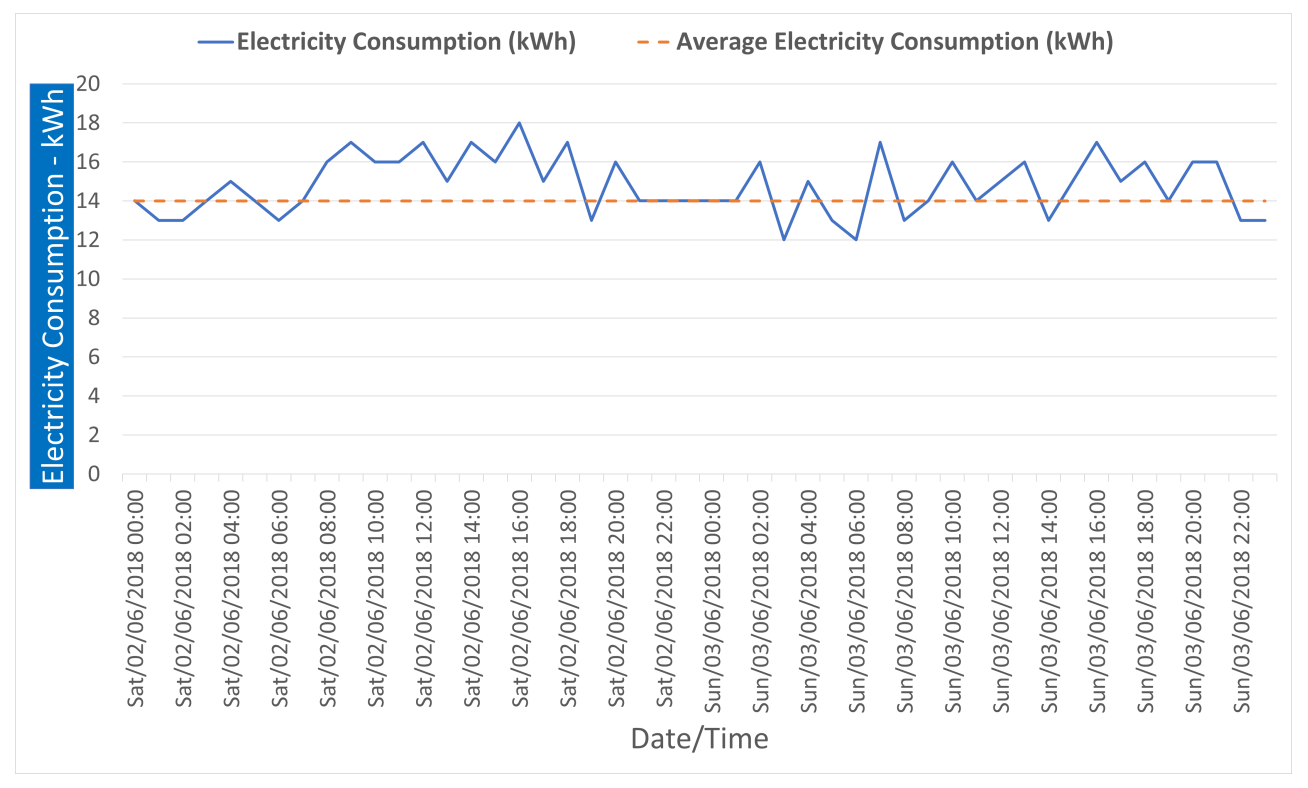
The hourly profiles of the CCS during the bank holiday weekend commencing on the 30 March 2018 and the weekend commencing on the 2 June 2018, are presented in Figure 8 and Figure 9, respectively.
The graphs in Figure 8 and Figure 9 are plots of the hourly electricity consumption in the department, on the designated days, against the average usage of the whole week (MON-SUN).
The CCS has a significantly higher hourly consumption profile, compared to the CE department, which makes it a much more impactful area to consider. Looking at the plots of both Figure 8 and Figure 9, the consumption is above average for more than 50% of the time, with zero occupancy by staff and patients. Similar to the CE department, this increased consumption can potentially reflect equipment being left switched on outside of working hours, leading to an unnecessary increase in electricity consumption.

4.3. Energy Usage Behaviour Measure

Having presented and analysed the weekly and hourly profiles of the wards’ electricity consumption. This section presents the results of the selected questions from the “Views and Ideas on Energy Usage and Behaviour” questionnaire and the out-of-hours equipment audit. The purpose of this section is to accurately evaluate the energy usage behaviour of the members of staff working in the selected wards/departments. The responses to the questionnaire and the results of the out-of-hours equipment audits and the potential savings from switching off unused equipment are reported and discussed in Section 4.3.1 and Section 4.3.2, respectively.

4.3.1. Members of Staff Views on Energy Usage and Energy Saving Measures Adopted in the Trust

As mentioned earlier, participation was invited from the two pilot wards/departments and from across the hospital, in order to establish a relationship between both views and identify whether any behavioural issues that might arise would persist across the hospital.
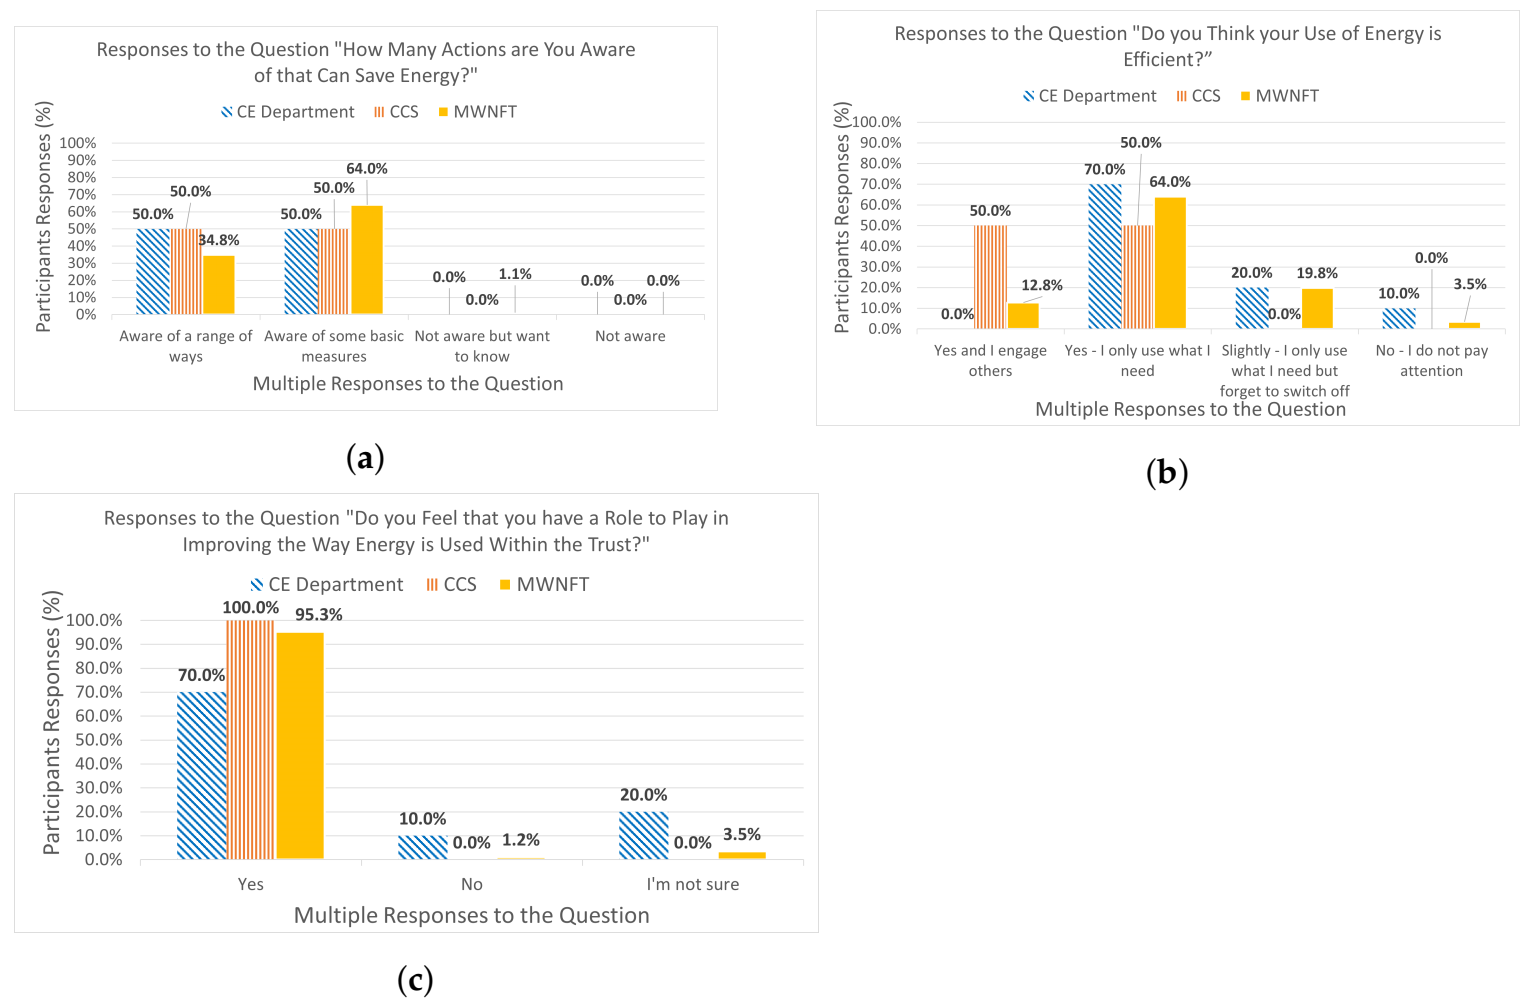
The selected questions aimed at an evaluation of individuals’ awareness and behaviour to save energy through efficient usage of equipment. The results showed that participants from the two/pilot wards/departments and the majority (approximately 95 % ) of the participants from across the hospital are aware of actions that can save energy, as seen in Figure 10a. The second question, which asked about the efficiency of energy usage, showed some positive outcomes as well, with more than 50 % of the participants believing they use energy efficiently, see Figure 10b. However, some participants from the CE department and from across the hospital responded that they some times forget to switch off equipment or they do not pay attention and this falls in line with the figures analysed previously in Section 4.1 and Section 4.2, indicating a potential negative energy usage behaviour. Lastly, and as per Figure 10c, more than 70 % of the participants believe that they have a role to play in improving energy usage in MWNFT. Nevertheless, some participants from the CE department answered “No” ( 10 % ) and “I’m not sure” ( 20 % ), indicating a lack of awareness.
The following subsection quantifies the normal behaviour of members of staff working in the pilot wards/departments by presenting the quantity of equipment left switched on, unnecessarily, out-of-hours and further discusses the results of the questionnaire.

4.3.2. Members of Staff Behaviour towards Equipment Outside of Working Hours

The results of the out-of-hours equipment audit were crucial to paint a picture of the level of energy-conscious behaviour in the selected pilot wards/departments. Table 1 shows a log of the equipment recorded during the out-of-hours walkarounds, how many were left switched on unnecessarily, their power rating, and the resulting waste in electricity consumption per week. The figures in the table represent an average of all the logs recorded over the course of the study; the power rating was found by using a portable power meter, where the equipment can plug into to measure parameters such as power, current, and others.
By looking at each individual type of equipment, there is always more than 50% of them left switched on. By following the reported figures in Table 1 a total of 128.5 kWh can be saved per week from the two wards/departments in this study, which equates to about 551 kWh per month and 6609 kWh per year. So, if the hospital is billed at 0.114 pounds/kWh (the average tariff during 2018, as per the hospital’s energy team) then savings of approximately 750 pounds can result from switching-off/unplugging PCs, monitors, screens, and other simple equipment, before leaving the workplace, in two out of at least 50 other wards/departments that operate with limited hours in the hospital. This means the adoption of such behaviour across the hospital can have 30,000 pounds + annual savings.
The recorded figures in Table 1 show a clear lack of energy-conscious behaviour. However, it can also be quite natural, given the individual perception that switching-off one device will not save the world and the numbers do support this. For instance, an individual PC with one monitor will cost the hospital 12 pounds per year. This is believed to be where the problem lies and it shows the importance of raising awareness that a collective effort from everyone on very simple energy measures can, indeed, make a massive positive impact on the hospital’s savings and, consequently, on the environment.

4.4. Limitations of the Study

The study presented in this paper aimed at identifying the potential presence of negative energy usage behaviour in the workplace. The study relied on the analysis of occupancy, by members of staff and patients, to flag anomalies in the recorded electricity consumption patterns, as well as members of staff’s views on energy saving measures, and finally, a log of equipment outside of normal working hours. Although the reported results are sufficient, from a scientific point of view (and with respect to the literature), a few points limited the focus of the study. For instance, the occupancy figures of patients were treated as numbers only, without accounting for what equipment was used per patient and for how long. Similarly, members of staff were assumed to have equal impact on the ward’s electricity consumption, regardless of their role and the equipment used. The reason for not considering the above points goes back to the absence of this data for anonymity, as well as the potential disruption to the ward/department’s daily operation. Future close collaboration with ward/department managers can be performed, in order to factor in individual equipment used.

5. Conclusions

This field study presented a framework to enable energy personnel to identify potential negative energy usage behaviour and areas of immediate savings through an analysis of historical energy consumption data. The study was designed to tackle energy usage behaviour, as a solution to energy waste, and is in line with the governmental focus on climate change and the net-zero carbon emission target in the UK.
Based on electricity per staff/patient occupancy, presented earlier in the paper, electricity consumption during bank holiday periods were higher than expected. The CE department consumed 26% more energy than was expected, with a 30% reduction in the number of staff working during the bank holiday weeks. Similarly, the CCS recorded 32% more energy, with a 37% reduction in the number of patients admitted during the bank holiday weeks. The expectation was to see a significant drop in electricity consumption per staff/patient during bank holidays, but on the contrary, an increase was recorded, suggesting that equipment was left switched on unnecessarily. Furthermore, the hourly profiles have revealed the high consumption of electricity for a significant amount of time during the weekends and bank holidays, in areas where minimal, if not zero, consumption was expected. The log of equipment, presented in Table 1, made a strong case of support for the lack of awareness and energy-conscious behaviour in both wards/departments, with nearly 80 % of all equipment left switched on unnecessarily, outside of normal working hours, resulting in a monthly waste of approximately 551 kWh.
By identifying the peak consumption periods (Figure 3 and Figure 7), the usage data and department operations during them can be reviewed to limit the waste and avoid it in the future. In wards/department with limited working hours, immediate savings can be guaranteed when actions are taken in such periods. Moreover, acting on high consumption areas will result in higher savings. For instance, the lowest recorded hourly consumption in Figure 8 and Figure 9 (the CCS) were significantly higher than the highest recorded consumption in Figure 4 and Figure 5 (the CE department). Hence, a valid strategy would be to tackle areas of high consumption first, in order to bring the overall consumption down and eventually expand it across the whole hospital.
To conclude the paper, the analyses presented shows the value of the collected data and sets a methodological baseline for other research studies to build on. By analysing consumption, the number of occupants, and tracking down equipment during working and non-working hours, negative behaviour amongst members of staff can be identified, in order to locate areas where immediate savings in consumption can be made. Furthermore, with the advancements in the field of artificial intelligence (AI) and machine learning (ML), the data collected for this study (and similar ones) can be used to develop forecasting models that can predict future consumption and behaviour, based on the recorded patterns and, hence, take early action to avoid unnecessary consumption in the future. Moreover, the data can be useful in analysing the impact of individual high-consuming equipment and evaluate their operating energy efficiency, whilst factoring in the human behaviour element.

Author Contributions

Conceptualization, A.T. and J.K.; data curation, A.T.; formal analysis, A.T., J.K. and T.H.; funding acquisition, A.T. and R.W.; investigation, A.T.; methodology, A.T.; project administration, A.T., J.K. and R.W.; resources, N.A. and J.B.; software, A.T.; supervision, J.K., T.H., R.W., N.A. and J.B.; validation, A.T., J.K. and T.H.; visualization, A.T.; writing—original draft, A.T.; writing—review and editing, A.T., J.K., T.H., A.Z., Q.H.A. and M.A.I. All authors have read and agreed to the published version of the manuscript.

Funding

This research was funded by the University of Greenwich’s Vice-Chancellor PhD Scholarship and by the contributions of the Estates and Facilities Department of Medway NHS Foundation Trust.

Institutional Review Board Statement

The data presented in this paper involved electricity consumption data and occupancy by human subjects. However, anonymous occupancy data were collected directly from the hospital where the study was conducted. Nevertheless, the study was conducted in accordance with the Declaration of Helsinki, and ethics approval was obtained from the NHS Health Research Authority (HRA).

Informed Consent Statement

Where it was needed, informed consent was obtained from all subjects involved in the study.

Data Availability Statement

Restrictions apply to the availability of these data. The data belongs to Medway NHS Foundation Trust but was collected using systems provided by EnergyLogix. Data, however, can be made available with the approval of the corresponding author, Medway NHS Foundation Trust, and energylogix.

Acknowledgments

The authors would like to acknowledge the support provided by energylogix during the data collection phase. Energylogix is a Small to Medium Enterprise (SME) that provided the equipment used for collecting the electricity data for this study. This work was supported in parts by, the Engineering and Physical Sciences Research Council (EPSRC) grants, EP/T517896/1.

Conflicts of Interest

The authors declare no conflict of interest.

Abbreviations

The following abbreviations are used in this manuscript:
NHSNational Health Service
MWNFTMedway NHS Foundation Trust
CEClinical Engineering
CCSCardiac Catheter Suite
EFSElectricity Feedback System
CVCoefficient of Variation

References

  1. Emeakaroha, A.; Ang, C.S.; Yan, Y.; Hopthrow, T. A persuasive feedback support system for energy conservation and carbon emission reduction in campus residential buildings. Energy Build. 2014, 82, 719–732. [Google Scholar] [CrossRef]
  2. Taha, A.; Wu, R.; Emeakaroha, A.; Krabicka, J. Reduction of Electricity Costs in Medway NHS by Inducing Pro-Environmental Behaviour Using Persuasive Technology. Future Cities Environ. 2018, 4, 1–10. [Google Scholar] [CrossRef] [Green Version]
  3. Teke, A.; Timur, O. Overview of Energy Savings and Efficiency Strategies at the Hospitals. Int. J. Soc. Behav. Educ. Econ. Bus. Ind. Eng. 2014, 8, 242–248. [Google Scholar]
  4. Ziebik, A.; Hoinka, K. Energy Systems of Complex Buildings; Springer: London, UK, 2012; p. 347. [Google Scholar] [CrossRef]
  5. Gordo, E.; Campos, A.; Coelho, D. Energy Efficiency in a Hospital Building Case Study: Hospitais da Universidade de Coimbra. In Proceedings of the 2011 3rd International Youth Conference on Energetics (IYCE), Leiria, Portugal, 7–9 July 2011; pp. 1–6. [Google Scholar]
  6. Huovila, A.; Tuominen, P.; Airaksinen, M. Effects of building occupancy on indicators of energy efficiency. Energies 2017, 10, 628. [Google Scholar] [CrossRef] [Green Version]
  7. Buonomano, A.; Calise, F.; Ferruzzi, G.; Palombo, A. Dynamic energy performance analysis: Case study for energy efficiency retrofits of hospital buildings. Energy 2014, 78, 555–572. [Google Scholar] [CrossRef]
  8. Saidur, R.; Hasanuzzaman, M.; Yogeswaran, S.; Mohammed, H.A.; Hossain, M.S. An end-use energy analysis in a Malaysian public hospital. Energy 2010, 35, 4780–4785. [Google Scholar] [CrossRef]
  9. Petersen, J.E.; Shunturov, V.; Janda, K.; Platt, G.; Weinberger, K. Dormitory residents reduce electricity consumption when exposed to real-time visual feedback and incentives. Int. J. Sustain. High. Educ. 2007, 8, 16–33. [Google Scholar] [CrossRef]
  10. Emeakaroha, A.; Ang, C.S.; Yan, Y.; Hopthrow, T. Integrating persuasive technology with energy delegates for energy conservation and carbon emission reduction in a university campus. Energy 2014, 76, 357–374. [Google Scholar] [CrossRef]
  11. Bekker, M.J.; Cumming, T.D.; Osborne, N.K.P.; Bruining, A.M.; McClean, J.I.; Leland, L.S. Encouraging Electricity Savings in a University Residential Hall Through a Combination of Feedback, Visual Prompts and Incentives. J. Appl. Behav. Anal. 2010, 43, 327–331. [Google Scholar] [CrossRef]
  12. Siero, F.W.; Bakker, A.B.; Dekker, G.B.; Van Den Burg, M.T.C. Changing Organizational Energy Consumption Behaviour Through Comparative Feedback. J. Environ. Psychol. 1996, 16, 235–246. [Google Scholar] [CrossRef] [Green Version]
  13. Murtagh, N.; Nati, M.; Headley, W.R.; Gatersleben, B.; Gluhak, A.; Imran, M.A.; Uzzell, D. Individual energy use and feedback in an office setting: A field trial. Energy Policy 2013, 62, 717–728. [Google Scholar] [CrossRef] [Green Version]
  14. Koroleva, K.; Melenhorst, M.; Novak, J.; Herrera Gonzalez, S.L.; Fraternali, P.; Rizzoli, A.E. Designing an integrated socio-technical behaviour change system for energy saving. Energy Inform. 2019, 2, 30. [Google Scholar] [CrossRef]
  15. Cibinskiene, A.; Dumciuviene, D.; Andrijauskiene, M. Energy Consumption in Public Buildings: The Determinants of Occupants’ Behavior. Energies 2020, 13, 3586. [Google Scholar] [CrossRef]
  16. Mahmood, L.; Abrams, D.; Meleady, R.; Hopthrow, T.; Lalot, F.; Swift, H.; Van de Vyver, J. Intentions, efficacy, and norms: The impact of different self-regulatory cues on reducing engine idling at long wait stops. J. Environ. Psychol. 2019, 66, 101368. [Google Scholar] [CrossRef]
  17. Fichera, A.; Volpe, R.; Cutore, E. Energy performance measurement, monitoring and control for buildings of public organizations: Standardized practises compliant with the ISO 50001 and ISO 50006. Dev. Built Environ. 2020, 4, 100024. [Google Scholar] [CrossRef]
  18. ISO 50001. Establishing a Baseline, Energy Indicators (KPIs) and Objectives. Available online: https://energiledelse.norskoljeoggass.no/en/Energiledelse/Planlegge/EnergyIndicators (accessed on 25 May 2021).
  19. IEE. The Importance of Setting an Accurate Energy Baseline, 22 May 2016. Available online: https://ieeegypt.org/the-importance-of-setting-an-accurate-energy-baseline/ (accessed on 25 May 2021).
  20. Fogg, B.J. A Behavior Model for Persuasive Design. In Proceedings of the 4th International Conference on Persuasive Technology, Persuasive ’09, Claremont, CA, USA, 26–29 April 2009; ACM: New York, NY, USA, 2009; pp. 40:1–40:7. [Google Scholar] [CrossRef]
  21. Khan, I. Energy-saving behaviour as a demand-side management strategy in the developing world: The case of Bangladesh. Int. J. Energy Environ. Eng. 2019, 10, 493–510. [Google Scholar] [CrossRef] [Green Version]
  22. Kolokotsa, D.; Tsoutsos, T.D.; Papantoniou, S. Energy Conservation Techniques for Hospital Buildings. Adv. Build. Energy Res. 2012, 6, 159–172. [Google Scholar] [CrossRef]
  23. Brandon, G.; Lewis, A. Reducing Household Energy Consumption: A Qualitative and Quantitative Field Study. J. Environ. Psychol. 1999, 19, 75–85. [Google Scholar] [CrossRef]
  24. Mankoff, J.; Fussell, S.R.; Dillahunt, T.; Glaves, R.; Grevet, C.; Johnson, M.; Matthews, D.; Matthews, H.S.; McGuire, R.; Thompson, R.; et al. StepGreen.org: Increasing Energy Saving Behaviors via Social Networks. In Fourth International AAAI Conference on Weblogs and Social Media; AAAI: Washington, DC, USA, 2010; pp. 106–113. [Google Scholar]
  25. DEEC. SME Guide to Energy Efficiency; Technical Report; Department of Energy & Climate Change: London, UK, 2015.
  26. Ji, R.; Qu, S. Investigation and Evaluation of Energy Consumption Performance for Hospital Buildings in China. Sustainability 2019, 11, 1724. [Google Scholar] [CrossRef] [Green Version]
  27. Carbon Trust. Hospitals|Healthy Budgets through Energy Efficiency; Technical Report; Carbon Trust: London, UK, 2010. [Google Scholar]
  28. Green Investment Bank. A Healthy Saving: Energy Efficiency and the NHS. 2014. Available online: http://www.greeninvestmentbank.com/media/5242/gib-nhs-market-report-final.pdf (accessed on 13 June 2016).
  29. EPTA Ltd. Guidelines for Energy Efficiency in Hospitals; Technical Report; Environmental Engineers Consultants: Athens, Greece, 2007. [Google Scholar]
  30. Morgenstern, P. Understanding Hospital Electricity Use: An End-Use(r) Perspective. Ph.D. Thesis, University College, London, UK, 2016. [Google Scholar]
  31. Hu, S.; Yan, D.; Azar, E.; Guo, F. A systematic review of occupant behavior in building energy policy. Build. Environ. 2020, 175, 106807. [Google Scholar] [CrossRef]
  32. Laaroussi, Y.; Bahrar, M.; Elmankibi, M.; Draoui, A.; Si-Larbi, A. Occupant behaviour: A major issue for building energy performance. IOP Conf. Ser. Mater. Sci. Eng. 2019, 609, 072050. [Google Scholar] [CrossRef]
  33. Soomro, A.M.; Bharathy, G.; Biloria, N.; Prasad, M. A review on motivational nudges for enhancing building energy conservation behavior. J. Smart Environ. Green Comput. 2021, 1, 3–20. [Google Scholar] [CrossRef]
  34. Abrahamse, W.; Steg, L.; Vlek, C.; Rothengatter, T. A review of intervention studies aimed at household energy conservation. J. Environ. Psychol. 2005, 25, 273–291. [Google Scholar] [CrossRef]
  35. Fischer, C. Feedback on household electricity consumption: A tool for saving energy? Energy Effic. 2008, 1, 79–104. [Google Scholar] [CrossRef]
  36. Darby, S. The Effectiveness of Feedback on Energy Consumption. A Review for DEFRA of the Literature on Metering, Billing and Direct Displays; Technical Report April; Environmental Change Institute University of Oxford: Oxford, UK, 2006. [Google Scholar]
  37. Darby, S. Energy feedback in buildings: Improving the infrastructure for demand reduction. Build. Res. Inf. 2008, 36, 499–508. [Google Scholar] [CrossRef]
  38. Vanhouwelingen, J.H.; Vanraaij, W.F. The Effect of Goal-Setting and Daily Electronic Feedback on In-Home Energy Use. J. Consum. Res. 1989, 16, 98–105. [Google Scholar] [CrossRef]
  39. Dobson, J.K.; Griffin, A.J.D. Conservation Effect of Immediate Electricity Cost Feedback on Residential Consumption Behaviour; Summer Study on Energy Efficiency in Buildings; American Council for an Energy-Efficient Economy: Washington, DC, USA, 1992. [Google Scholar]
  40. Sidler, O.; Waide, P. Metering Matters. Appl. Effic. 1999, 4, 1999. [Google Scholar]
  41. Ueno, T.; Tsuji, K.; Nakano, Y. Effectiveness of Displaying Energy Consumption Data in Residential Buildings: To Know Is to Change; ACEEE (American Council Energy-Efficient Economy) Summer Study: Washington, DC, USA, 2006. [Google Scholar]
  42. Sharpe, V.J.; Watts, D.R. Beyond Traditional Approaches to Marketing Energy Conservation: The Espanola Experience; American Council for an Energy-Efficient Economy: Washington, DC, USA, 1992; pp. 10.149–10.156. [Google Scholar]
  43. Darby, S. Making It Obvious: Designing Feedback into Energy Consumption; Springer: Berlin/Heidelberg, Germany, 2001; pp. 685–696. [Google Scholar] [CrossRef]
  44. Froehlich, J. Promoting Energy Efficient Behaviors in the Home through Feedback: The Role of Human-Computer Interaction. Proc. HCIC Workshop 2009, 4, 1–11. [Google Scholar]
  45. Wood, G.; Newborough, M. Energy-use information transfer for intelligent homes: Enabling energy conservation with central and local displays. Energy Build. 2006, 39, 495–503. [Google Scholar] [CrossRef]
  46. Hutton, R.B.; Mauser, G.A.; Filiatrault, P.; Ahtola, O.T. Effects of Cost-Related Feedback on Consumer Knowledge and Consumption Behavior: A Field Experimental Approach. J. Consum. Res. 1986, 13, 327–336. [Google Scholar] [CrossRef]
  47. Lu, Y.; Kua, H.W.; Yu, M.; Ruan, T. Paper or screen? Examining the effectiveness of messaging delivery means in promoting household energy conservation in China. Resour. Conserv. Recycl. 2018, 139, 27–39. [Google Scholar] [CrossRef]
  48. Holzinger, A.; Baernthaler, M.; Pammer, W.; Katz, H.; Bjelic-Radisic, V.; Ziefle, M. Investigating paper vs. screen in real-life hospital workflows: Performance contradicts perceived superiority of paper in the user experience. Int. J. Hum.-Comput. Stud. 2011, 69, 563–570. [Google Scholar] [CrossRef]
  49. Burgess, J.; Nye, M. Re-materialising energy use through transparent monitoring systems. Energy Policy 2008, 36, 4454–4459. [Google Scholar] [CrossRef]
  50. Anderson, W.; White, V. Exploring Consumer Preferences for Home Energy Display Functionality. Report to the Energy Saving Trust; Technical Report; Centre for Sustainable Energy: Bristol, UK, 2009. [Google Scholar]
  51. Abdelmohsen, S.; Yi-Luen Do, E. Energy Puppet: An Ambient Awareness Interface for Home Energy Consumption. In Proceedings of the 7th International Workshop on Social Intelligence Design, San Juan, Puerto Rico, 3–5 December 2008; pp. 3–9. [Google Scholar]
  52. Deng, Z.; Chen, Q. Impact of occupant behavior on energy use of HVAC system in offices. E3S Web Conf. 2019, 111, 04055. [Google Scholar] [CrossRef] [Green Version]
  53. Delzendeh, E.; Wu, S.; Lee, A.; Zhou, Y. The impact of occupants’ behaviours on building energy analysis: A research review. Renew. Sustain. Energy Rev. 2017, 80, 1061–1071. [Google Scholar] [CrossRef]
  54. Barakat, B.; Taha, A.; Samson, R.; Steponenaite, A.; Ansari, S.; Langdon, P.M.; Wassell, I.J.; Abbasi, Q.H.; Imran, M.A.; Keates, S. 6G Opportunities Arising from Internet of Things Use Cases: A Review Paper. Future Internet 2021, 13, 159. [Google Scholar] [CrossRef]
  55. Labeodan, T.; Maaijen, R.; Zeiler, W. The human behavior: A tracking system to follow the human occupancy. In Proceedings of the International Conference on Cleantech for Smart Cities and Buildings (CISBAT 2013); Technische Universiteit Eindhoven: Lausanne, Switzerland, 2013; pp. 513–518. [Google Scholar]
  56. Martani, C.; Lee, D.; Robinson, P.; Britter, R.; Ratti, C. ENERNET: Studying the dynamic relationship between building occupancy and energy consumption. Energy Build. 2012, 47, 584–591. [Google Scholar] [CrossRef]
  57. Taha, A.; Krabicka, J.; Wu, R.; Kyberd, P.; Adams, N. Design of an Occupancy Monitoring Unit: A Thermal Imaging Based People Counting Solution for Socio-Technical Energy Saving Systems in Hospitals. In Proceedings of the 11th Computer Science and Electronic Engineering Conference, Essex, UK, 18–20 September 2019; p. 6. [Google Scholar]
  58. Wood, W.; Rünger, D. Psychology of Habit. Annu. Rev. Psychol. 2016, 67, 289–314. [Google Scholar] [CrossRef] [Green Version]
  59. Carbon Trust. Employee Awareness and Office Energy Efficiency|Latin America. Available online: https://latam.carbontrust.com/en/resources/employee-awareness-and-office-energy-efficiency/ (accessed on 14 June 2019).
  60. The World’s First Experience Management Platform|Qualtrics. Available online: https://www.qualtrics.com/uk/ (accessed on 10 April 2017).
  61. Abdi, H. Encyclopedia of Research Design–Coefficient of Variation; SAGE Publications, Inc.: Newbury Park, CA, USA, 2010. [Google Scholar] [CrossRef]
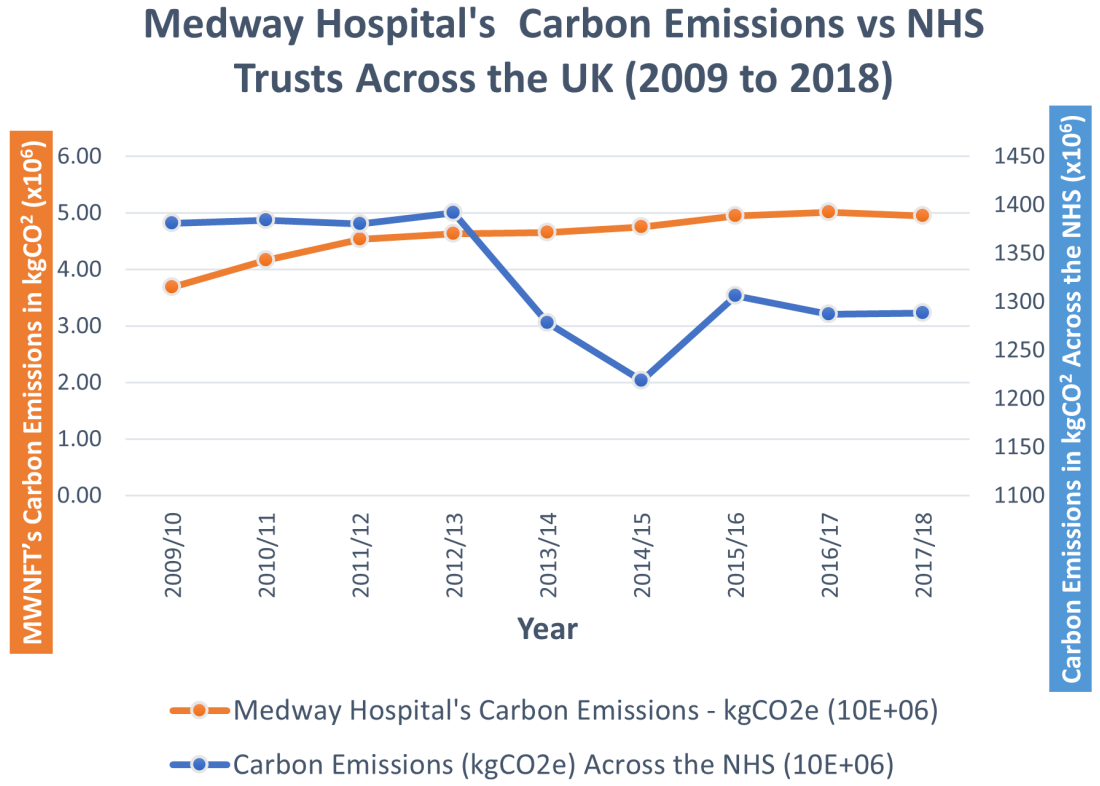
Figure 1. Medway hospital’s carbon emissions compared to NHS Hospitals across the UK (2009 to 2018).
Electronics 10 02468 g001
Figure 2. Relationship between electricity consumption and occupancy in the clinical engineering department.
Electronics 10 02468 g002
Figure 3. Electricity consumption per member of staff in the clinical engineering department.
Electronics 10 02468 g003
Figure 4. Hourly electricity consumption in the weekend 7 April 2018 to 8 April 2018 of week 19 in the clinical engineering department.
Electronics 10 02468 g004
Figure 5. Hourly electricity consumption on the bank holiday 7 May 2018 of week 23 in the clinical engineering department.
Electronics 10 02468 g005
Figure 6. Relationship between electricity consumption and occupancy in the cardiac catheter suite.
Electronics 10 02468 g006
Figure 7. Electricity consumption per patient in the cardiac catheter suite.
Electronics 10 02468 g007
Figure 8. Hourly electricity consumption in the bank holiday weekend 30 March 2018 to 2 April 2018 of weeks 17 and 18 in the cardiac catheter suite.
Electronics 10 02468 g008
Figure 9. Hourly electricity consumption in the weekend 2 June 2018 to 3 June 2018 of week 26 in the cardiac catheter suite.
Electronics 10 02468 g009
Figure 10. Participants’ responses to the selected questions from the “Views and Ideas on Energy Usage and Behaviour” questionnaire; (a) Q: “How Many Actions are You Aware of that Can Save Energy?”, (b) Q: “Do you Think your Use of Energy is Efficient?”, (c) Q: “Do you Feel that you have a Role to Play in Improving the Way Energy is Used Within the Trust?”.
Electronics 10 02468 g010
Table 1. Electricity waste due to equipment left switched on outside of working hours.
EquipmentDept.Total Number in Each Area% of Equipment Left on Out-of-HoursPower Rating/Equipment (W)Number of Hours Unused\WeekOut-of-Hours Consumption/Week (kWh)Total Consumption/Week (kWh)
PCCE206018.810323.2438.73
CCS129020.9123.24
MonitorCE31700.61031.341.92
CCS21901.171.30
LaptopCE4804510314.8318.54
CCS000.000.00
PrinterCE0081030.000.00
CCS21001.651.65
Wall Mount
Boiler
CE11001.3 kWh/24 h10317.0017.00
CCS110017.0017.00
ScreenCE1100801038.248.24
CCS11008.248.24
Medical
Equipment
CE00101030.000.00
CCS178514.8817.51
Total128.5153.36
Publisher’s Note: MDPI stays neutral with regard to jurisdictional claims in published maps and institutional affiliations.