1. Introduction
Cardiovascular disease (CVD) is a general term that encompasses a group of disorders related to the functions of the human heart and its blood vessels. Approximately 17.9 million people died from CVDs in 2019, accounting for 32% of all global deaths [
1], with a projected death count of 24.2 million in 2030 [
2]. Many CVDs, such as arrhythmia, manifest their presymptoms a long time prior to the onset of any critical adverse events [
3]. If such symptoms of cardiac abnormalities can be detected early, the patient can receive treatments in time and avoid further complications or even death. In order to increase the early detection rate, it is important to provide mid/high-risk individuals with continuous monitoring of the electrocardiography (ECG) signal. The medical devices required for such monitoring are often expensive, large, and complex to operate. This makes it unaffordable and impractical for individuals to own such equipment in their homes, requiring non-disruptive devices that can be easily handled.
In most conventional wet-electrode ECG devices, the heart’s electrical activity is sensed using Ag-AgCl electrodes in direct contact with the user’s body. Wet electrodes are universally used in medical ECG devices because of their reliable, good signal quality with low noise. The high signal quality can be attributed to the low-impedance direct contact between the electrodes and the user’s skin using large-sized electrodes and electrolyte gel. This method, however, causes discomfort and irritation since the conductive gel between the electrodes and the skin used for increasing the signal conductivity contains materials that can cause irritations or allergies to the user. Additionally, this method cannot be used for long-term monitoring since the gel on the electrodes dries out, degrading the sensitivity and even the functionality [
4]. These limitations have pushed many researchers towards developing dry and non-contact electrodes [
4], and many ECG wearables and systems have been designed over the past decade [
5,
6,
7,
8]. Even though dry electrodes do not require electrolyte gel, they need a tight forced contact against the body for recording [
9]. Such required direct contact between the skin and the electrode can still cause discomfort.
On the other hand, non-contact electrodes do not require the use of an electrolyte gel or direct contact with the skin. Due to the boosted input impedance, non-contact electrodes can capture the signal more reliably in direct contact with the body compared to dry-electrode cases. Moreover, signal recording is possible even through a sheet of cloth in between. The interaction between the electrode and the skin can be viewed as a parallel plate capacitor [
10]. Even though the non-contact electrodes resolve the issue of discomfort and skin irritation caused by wet or dry electrodes, they are highly sensitive to moving artifacts and environmental noise [
9]. To address the intrinsic limitations of non-contact electrodes, various techniques have been proposed, such as neutralization and guarding, and it has been reported that the signal acquired can even rival that of wet electrodes [
9].
Previous systems and wearables covered a range of target populations including disabled drivers [
5], infants [
6], and office workers [
8]. Stork et al. [
5] provides an ECG system with non-contact electrodes implemented on the shirts of drivers. Even though the electrodes had to be fastened on the user’s body via belts, the signal was sensitive to the user’s movements. Kato et al. [
6] implement non-contact ECG monitoring in mattresses for infants. The electrodes successfully recorded a periodic heart rate through cotton baby clothing, but without much success in extracting the ECG features due to moving artifacts. Furthermore, this type of ECG implementation did not provide a portable solution. Chamadiya et al. [
8] provide a non-contact ECG monitoring solution for hospitalized patients, placing the monitoring device inside hospital beds, stretchers, and wheelchairs where the user would spend the most time. The amplitude of the recorded signal lied in the same range as regular ECG recordings, but the noise level was variant with where the device was implemented, the highest being in the bed. This interference causes unwanted spikes between the R-R region and false positive QRS counts, requiring further QRS complex detection analysis and improvement of the signal stability and quality. In spite of their non-contact nature, these solutions are not suitable for long-term and continuous monitoring because the monitoring stops when the user leaves the specific environment where the device is implemented. Moreover, these systems lack portability and were designed for very specific target populations, eliminating most of the general population. Even though there are several existing research projects that present portable ECG monitoring solutions with Bluetooth compatibility, the majority of these projects use conventional electrodes [
11,
12,
13,
14]. Lastly, previous implementations have encountered many issues with power consumption. There have been a few attempts at lowering the power consumption of ECG monitors [
12]. However, despite achieving a lower power consumption of 32 µW, the system suffered information loss in the signal detection process.
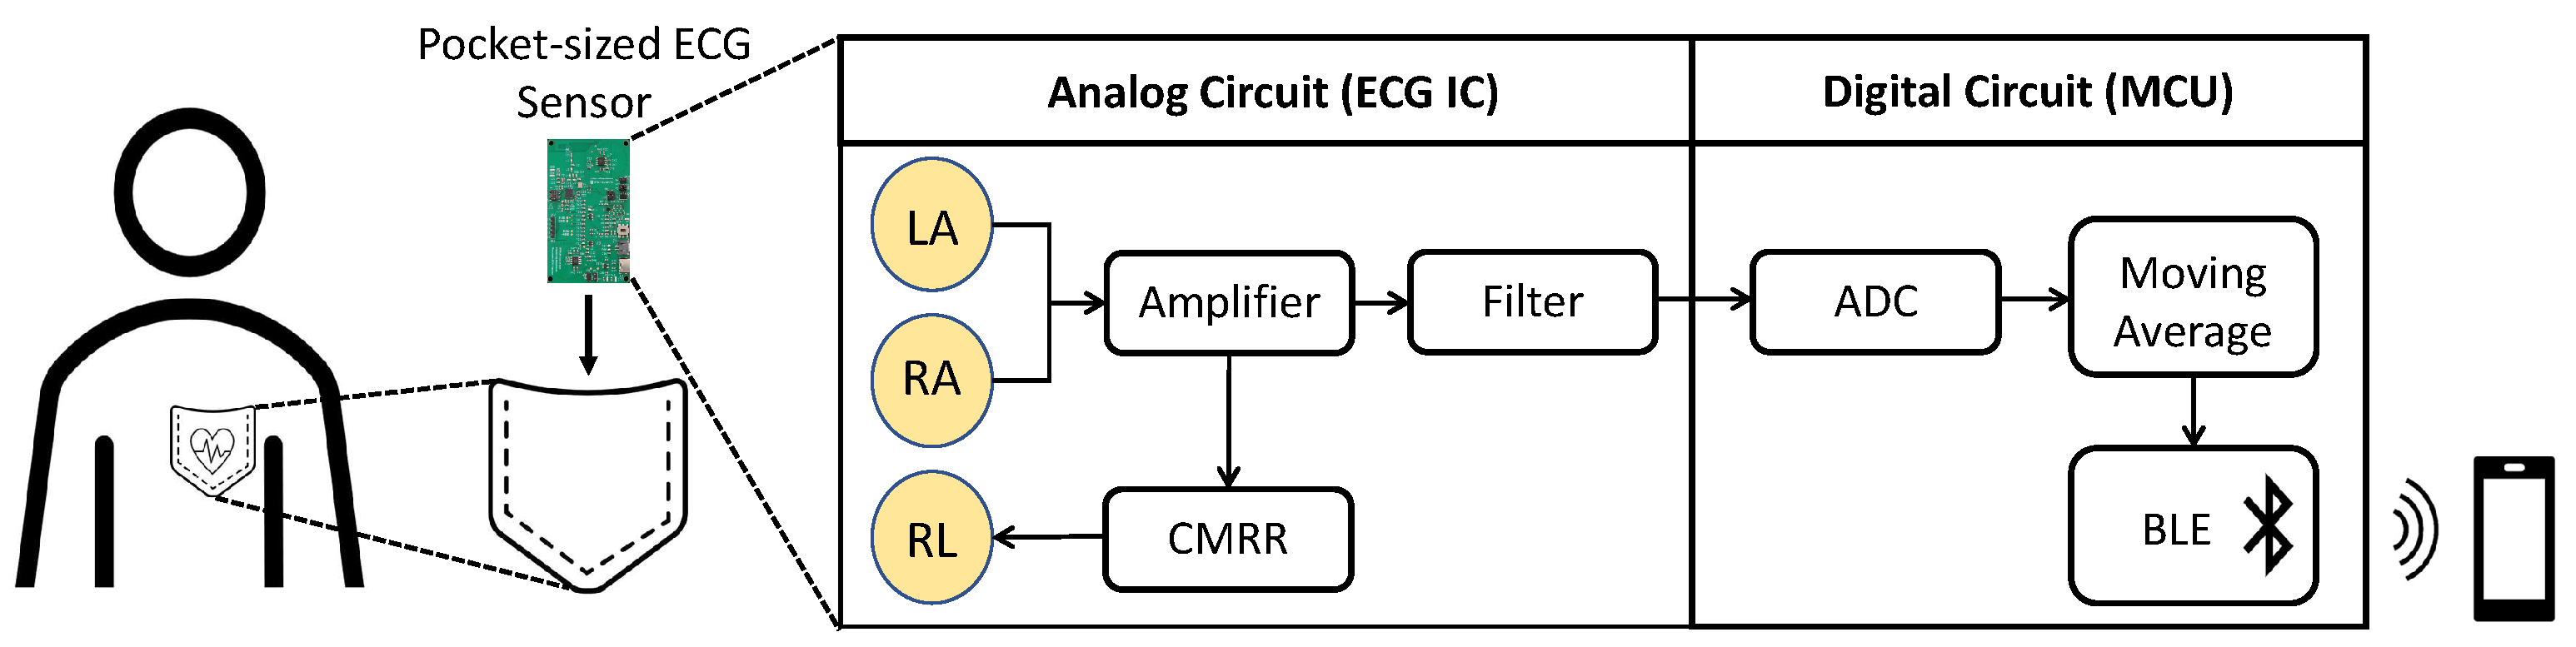
In this paper, we present a portable, wearable, low-power, non-contact ECG monitoring device as an aid in early detection of CVDs. Since the ECG signal is the strongest near the heart or large arteries, the device can be placed in a shirt pocket, from where it transmits the data via Bluetooth Low Energy (BLE) to the user’s mobile phone, as shown in
Figure 1. Due to its compact size, the device can easily be worn by a large variety of users in different environments, as an advancement to previously proposed devices. In contrast to the earlier ECG monitoring designs that have sensing, processing, and transmission components connected with wires over a large area, causing inconvenience for the user, our design integrates all the non-contact ECG monitoring components on a credit-card-sized printed circuit board, making it compact and easily wearable and transportable. A detailed explanation of the device design and its components is provided in the next section followed by the results of device performance.
2. Design Details of the Proposed Device
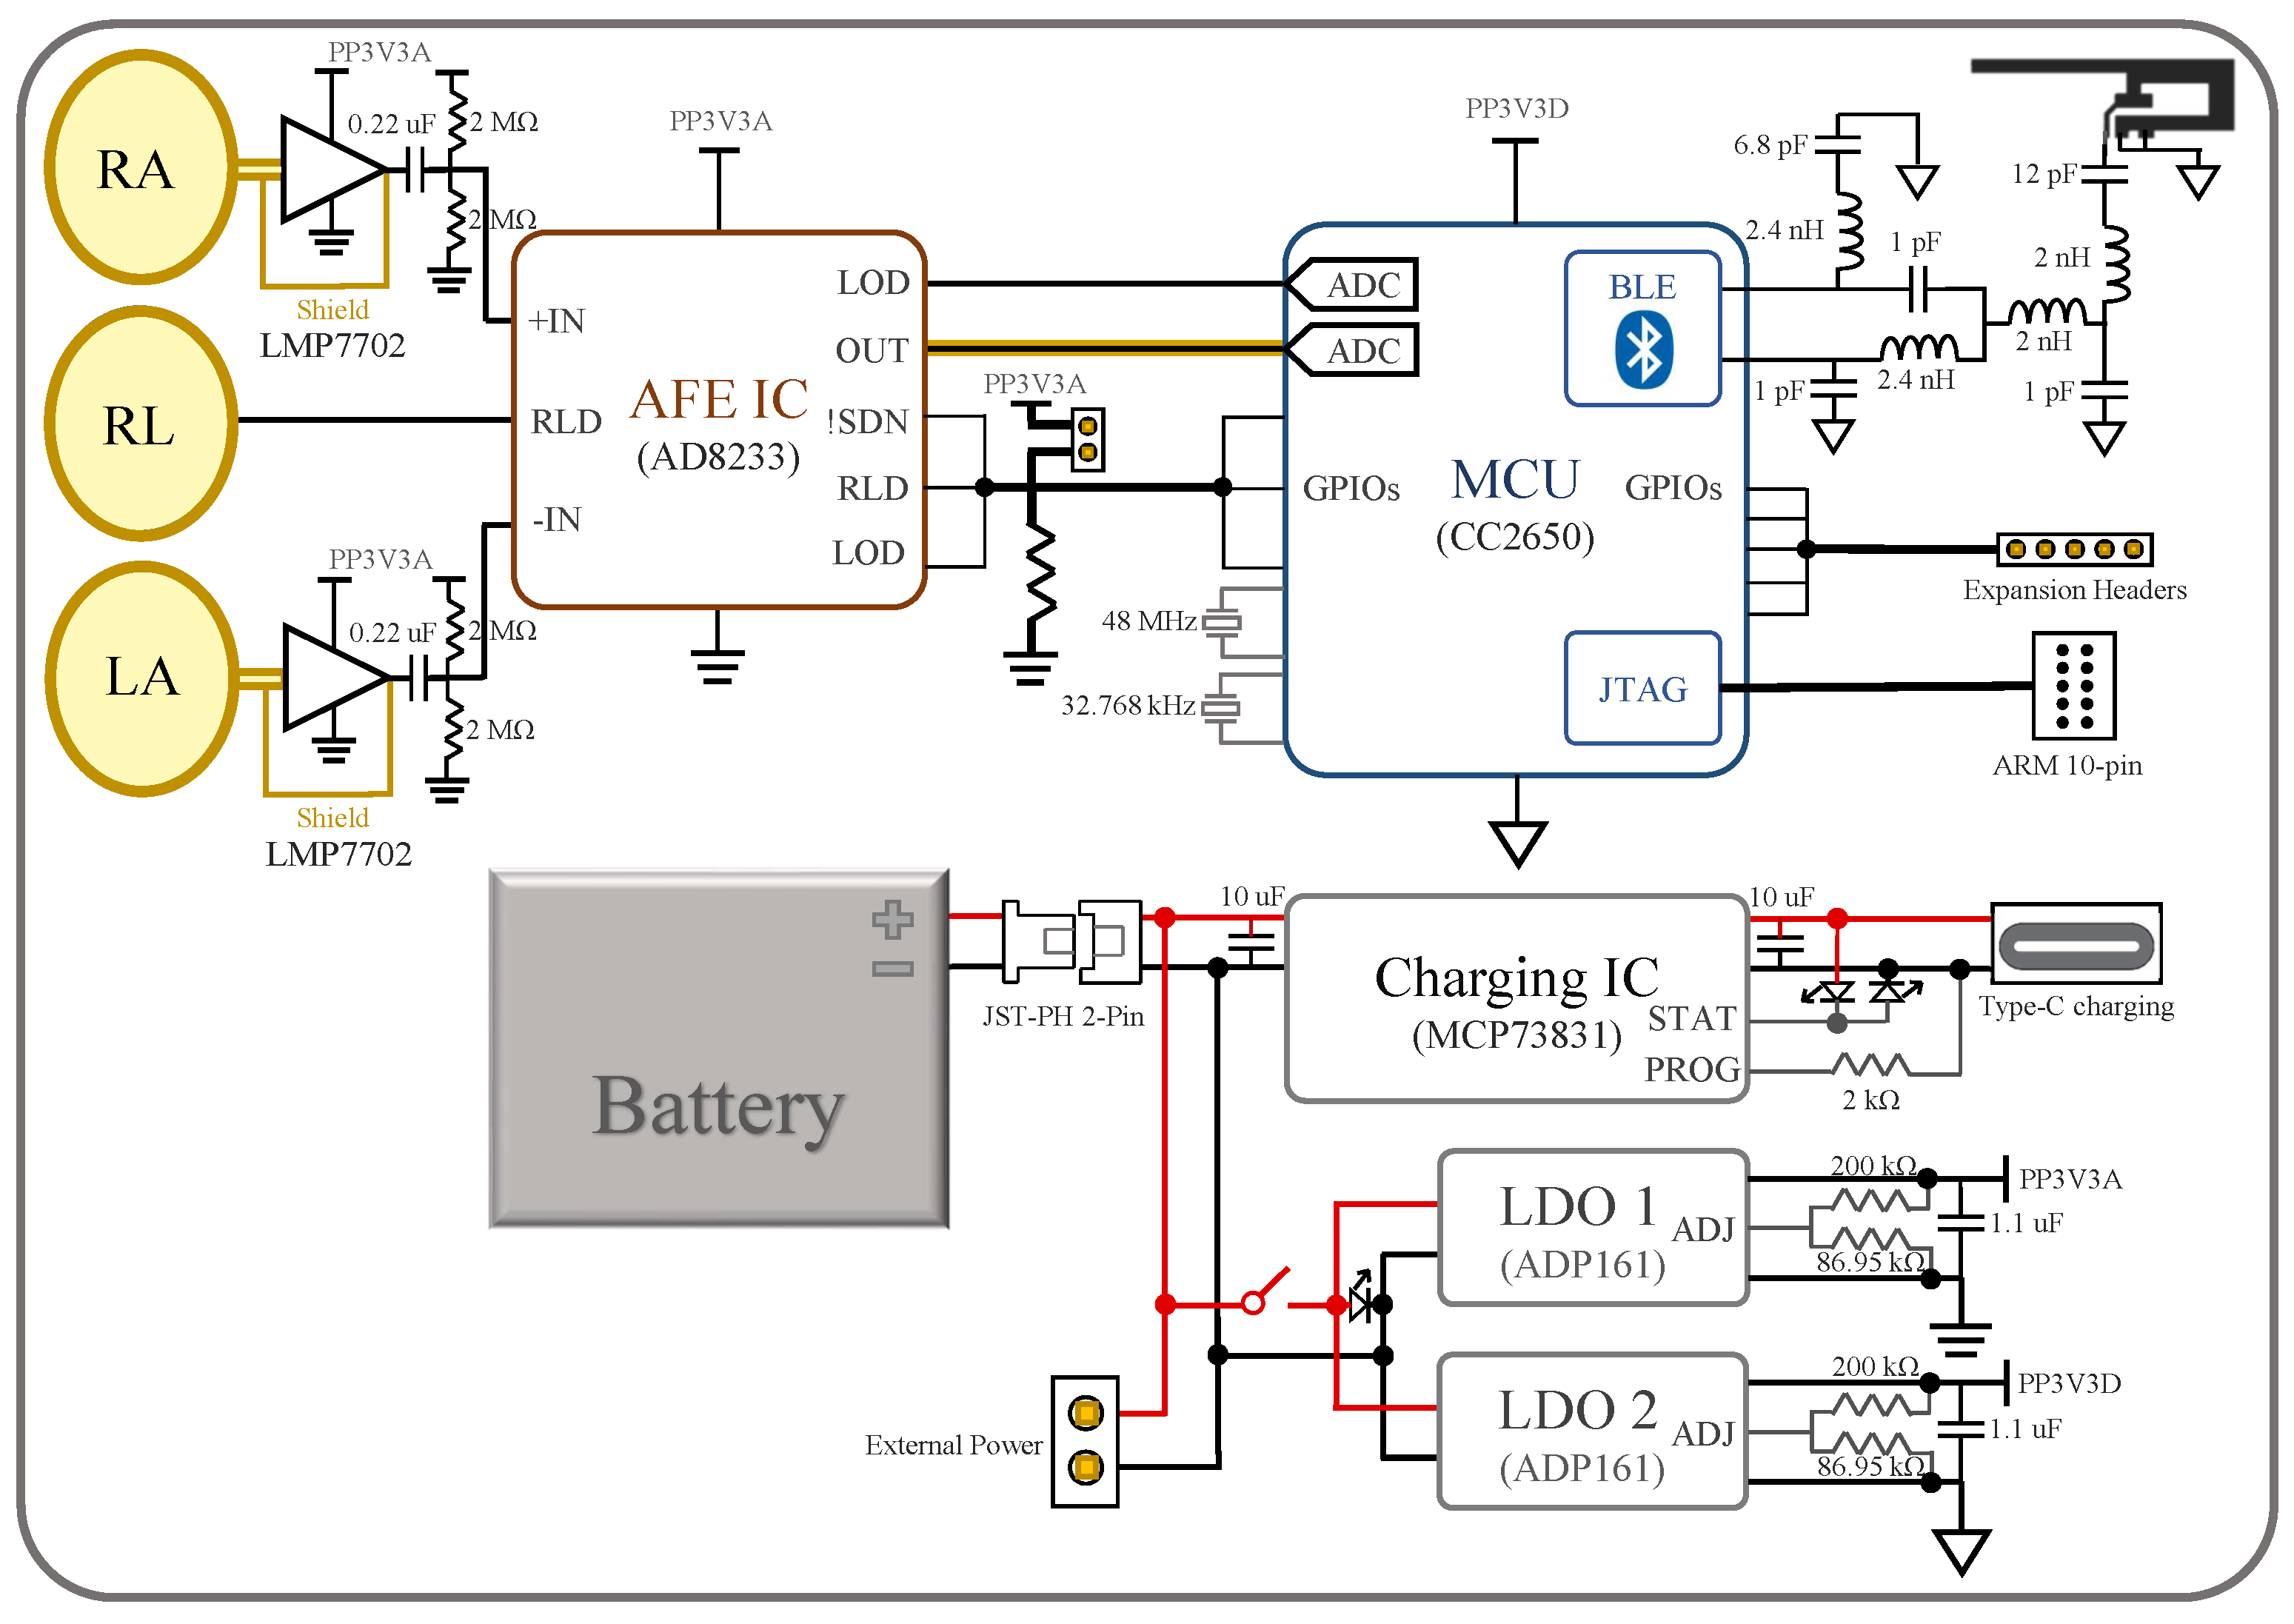
Figure 2 shows the block diagram of the device, where RA, LA, and RL are the naming conventions of the electrodes: right arm, left arm, and right leg, respectively. There are four major components in the device: the electrodes, analog front-end (AFE) IC, microcontroller unit (MCU), and power management system. The bio-potential signal is recorded through the RL, LA, and RL non-contact electrodes and then sent to the AD8233 AFE IC to extract and filter the ECG signal. The signal undergoes quantization by ADC in the CC2650 MCU as well as further filtering before it is transmitted through BLE to the user’s mobile device. The actual implemented device is shown in
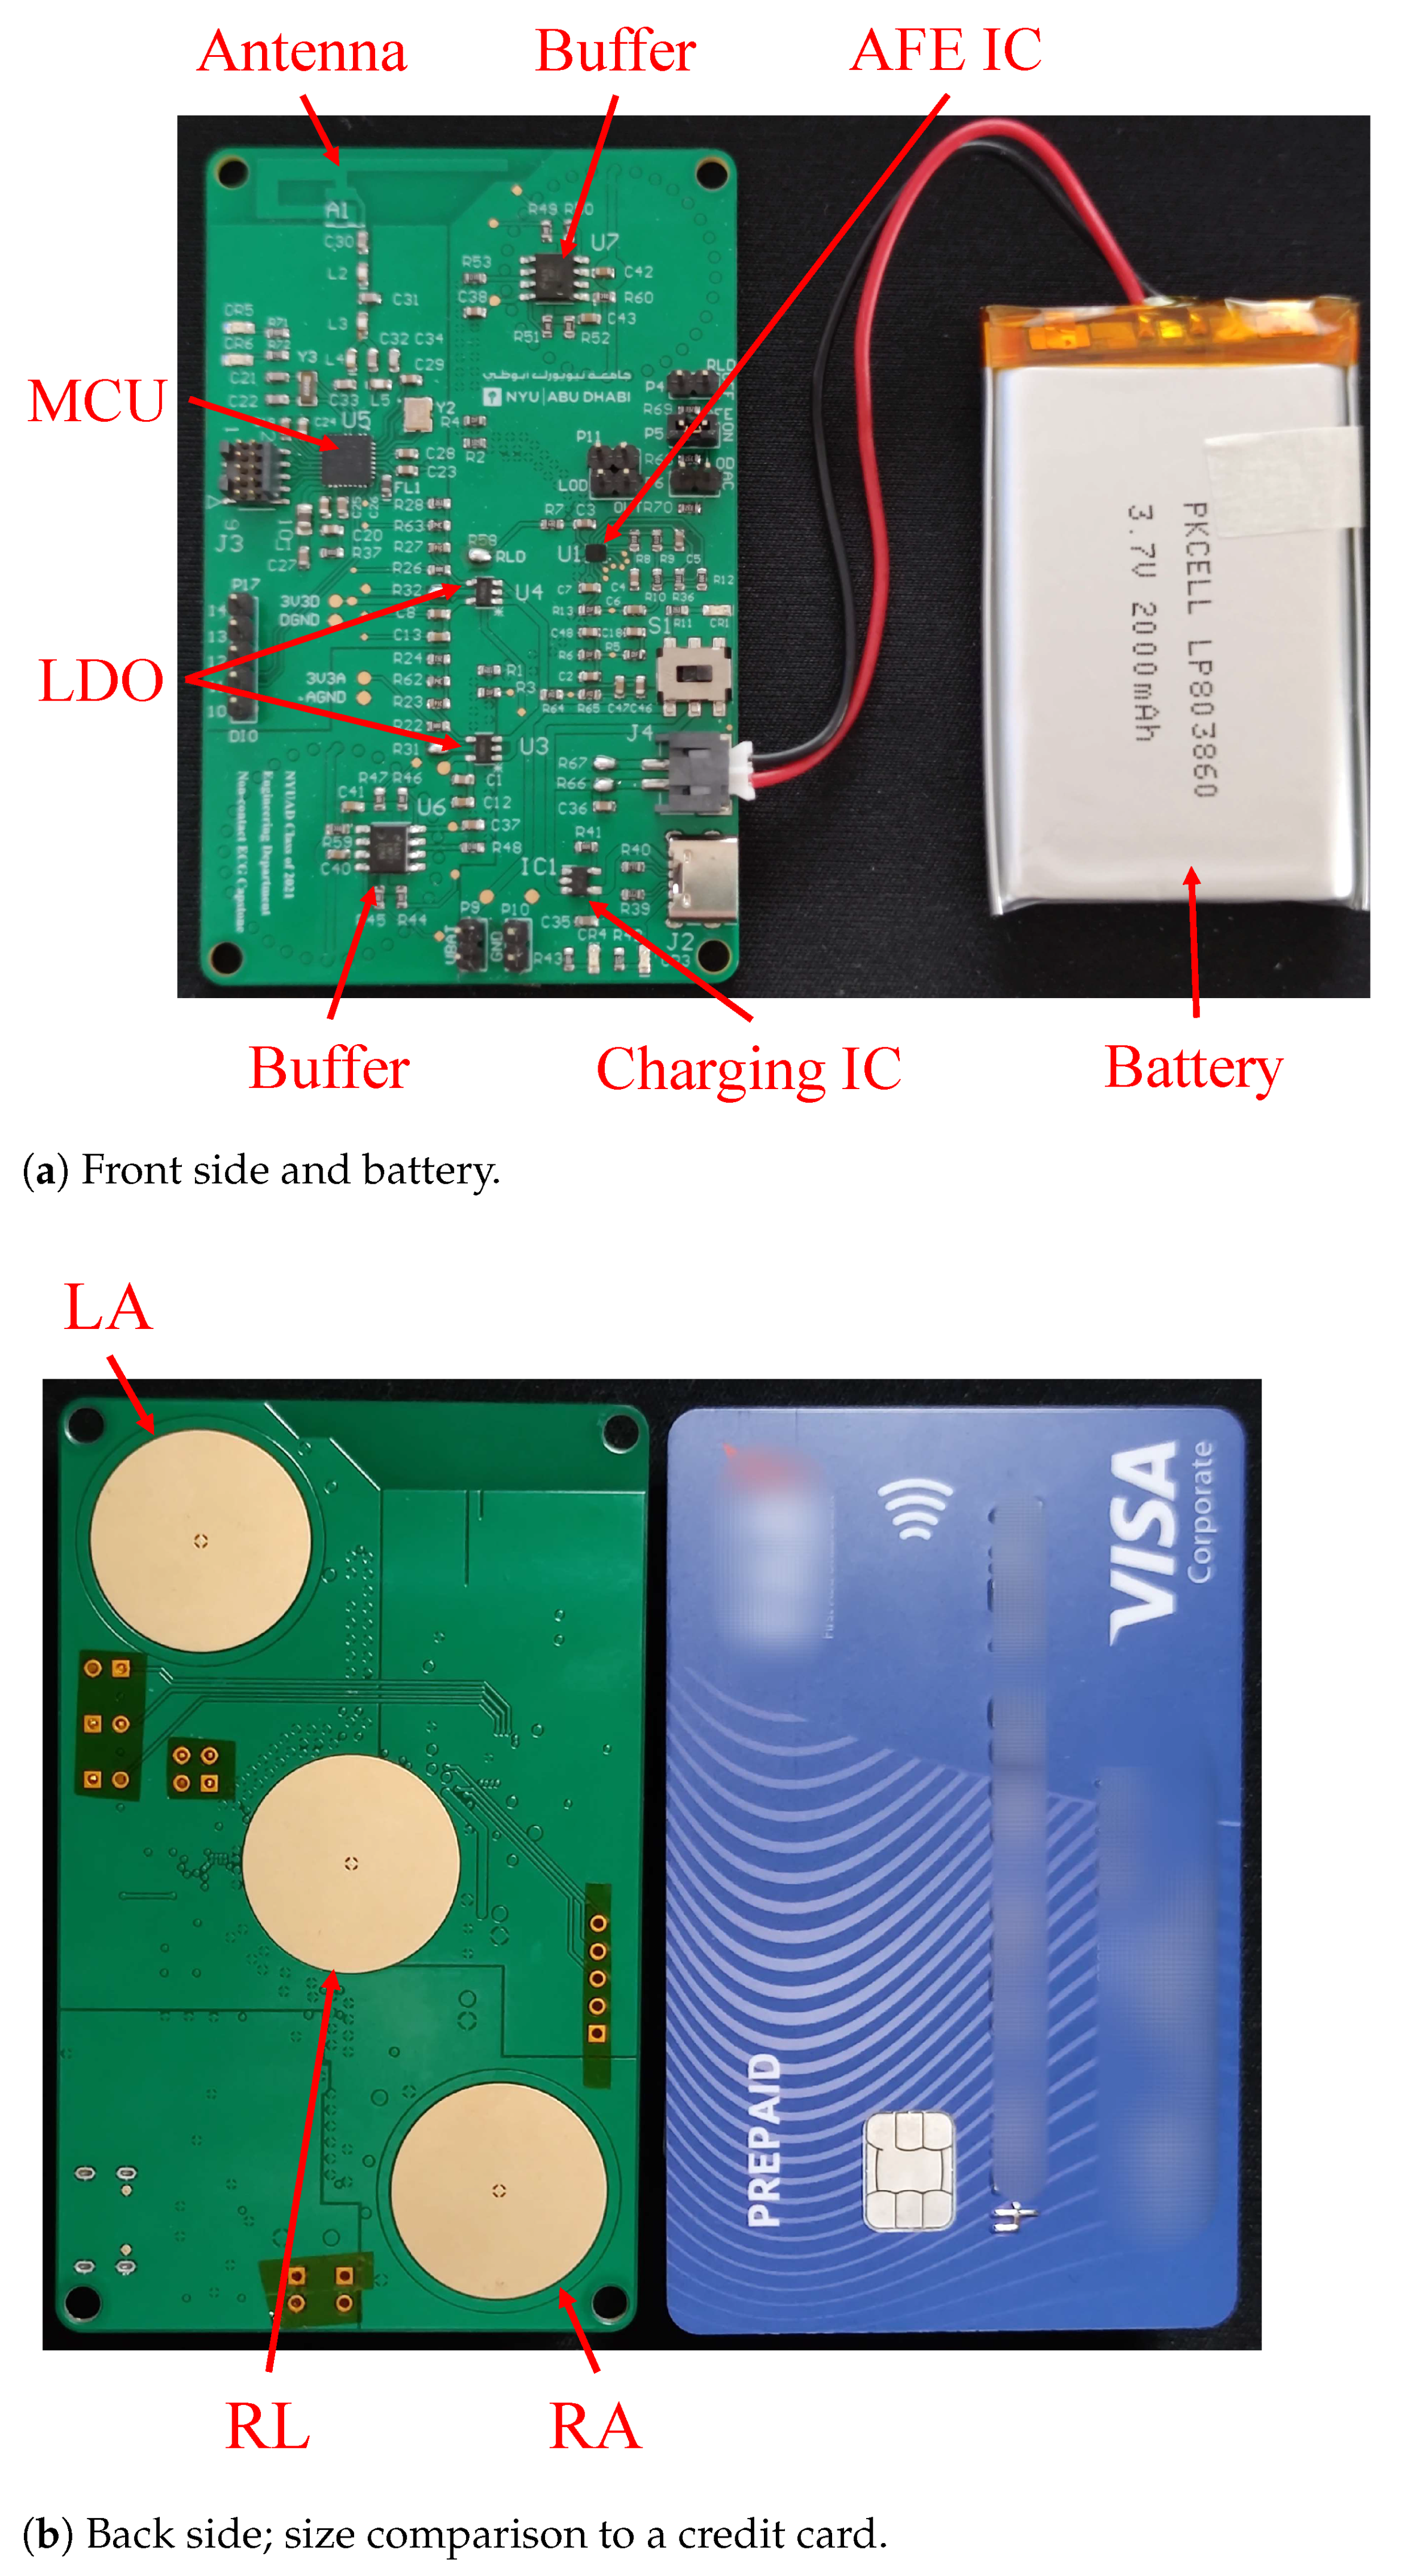
Figure 3, where the mentioned components are indicated. Note that the device’s dimension is 8.56 cm × 5.4 cm, the same as a credit card. In the following subsections, the design of the device’s individual components, i.e., the electrodes, AFE IC, MCU, and the power management system, are described in more detail.
2.1. Non-Contact Electrodes
As shown in
Figure 3b, there are three electrode plates at the bottom of the board, facing the chest area when placed in a shirt pocket. The two outer active electrodes (LA and RA) sense the ECG signal, while the inner passive electrode (RL) provides the right-leg-drive (RLD) signal counteracting the common-mode noise.
The design of the active electrodes is based on the work in [
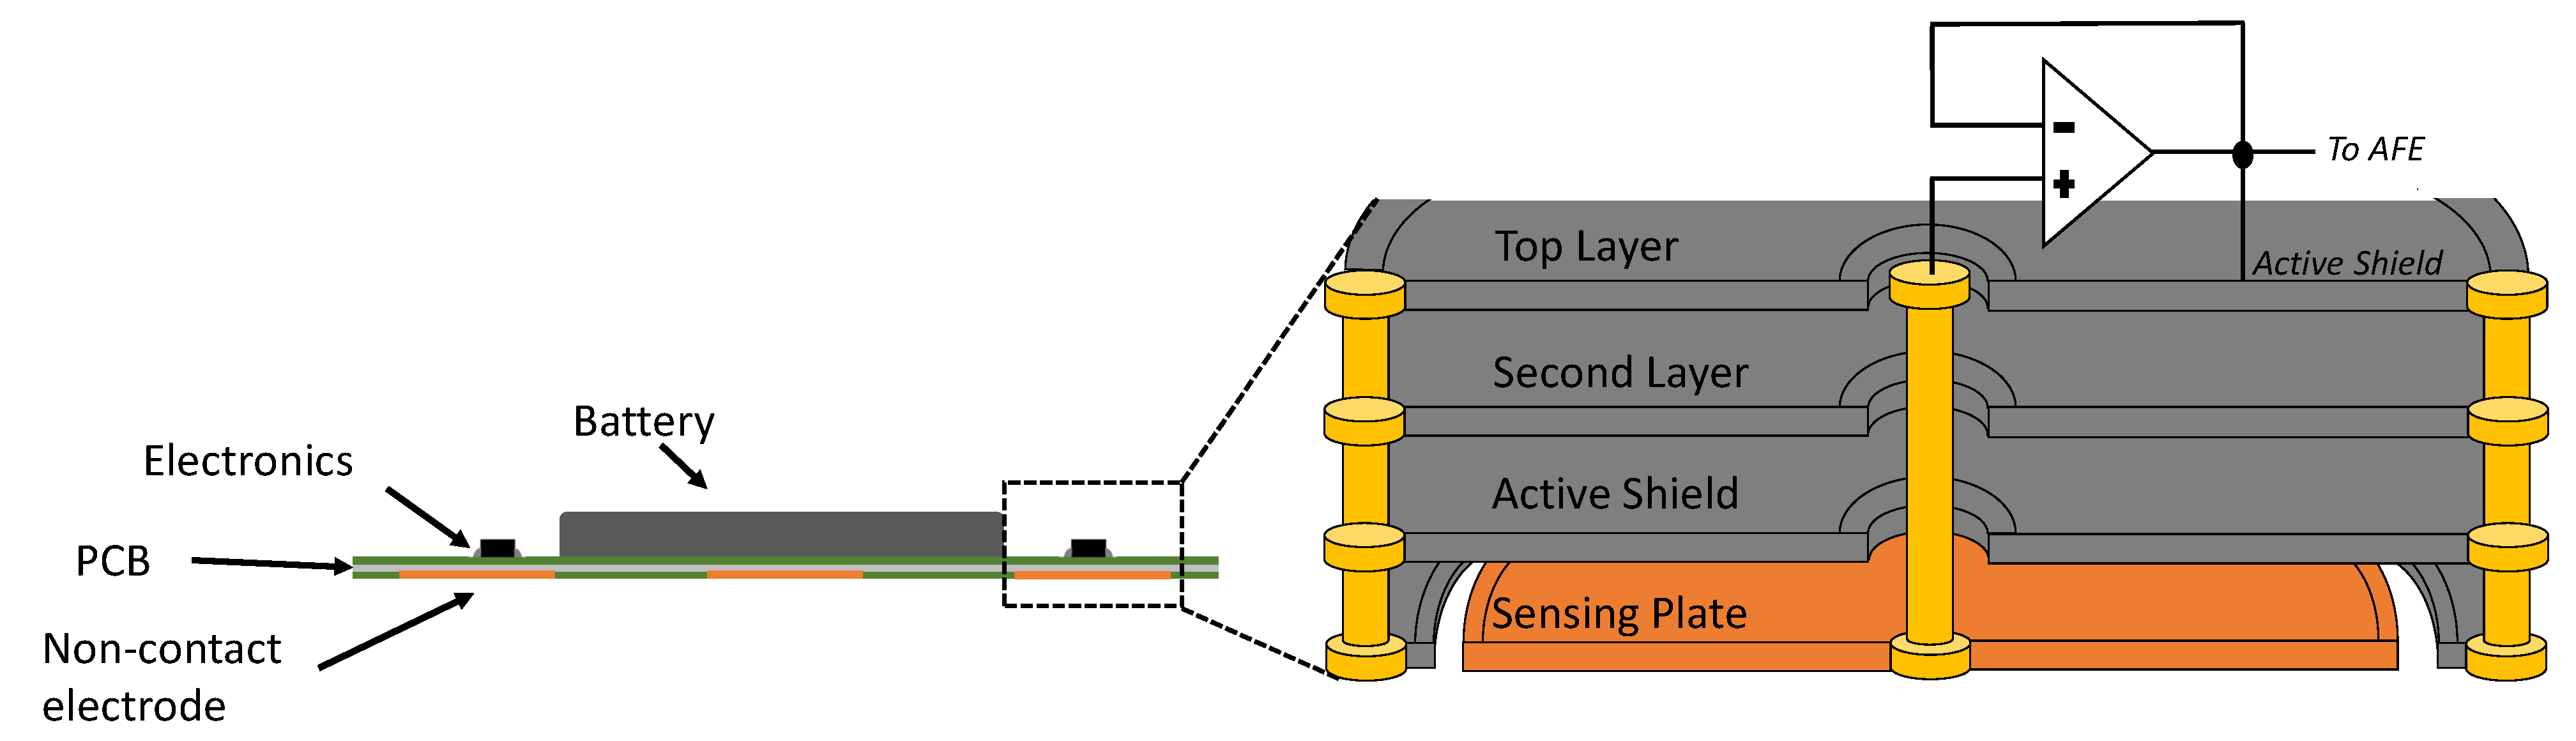
10]. For each active electrode, two precision operational amplifiers (LMP7702) form two unit gain buffers in series. The first stage buffer’s output feeds into the second stage buffer and serves as the shield signal, which bootstraps all the shield surrounding the electrode plate and its signal path. As shown in the electrode cross section diagram in
Figure 4, the shield signal surrounds the plate in ring shape at the bottom layer and also surrounds the vertical inner connection in circular shape from the bottom to the top layers. The shielding not only protects the signal from the noise but also cancels out the parasitic capacitances between the sensing plate and other layers. The removal of parasitic capacitances in parallel with the input boosts the input impedance of the system. Thanks to the increased input impedance, the ECG signal can be captured in a non-contact manner through a shirt.
After the second stage buffer, the conducting path to the AFE IC is surrounded by copper pours and vias at ground (GND) in its lower, higher, and same layers, securing the paths from any electromagnetic interference (EMI). Additionally, the conducting paths of the AFE IC inputs are highly symmetric to each other in order to provide maximum precision and common-mode rejection ratio (CMRR). The RL passive electrode is left without shield as a single copper plate because it is in proximity to the AFE IC that is capable of driving it.
2.2. Analog Front-End IC
The AD8233 AFE IC from Analog Devices is chosen for its simplicity to implement and stability in use. The IC and its related components occupy the mid-right area of the board in
Figure 3a. The signal from the active electrodes firstly goes through the IC’s instrumentation amplifier (INA) and then a customizable filter, which in our device is a band-pass filter with cut-off frequencies at 8 Hz and 25 Hz, with a total system gain of 1100
V/
V [
15]. The circuit for this filter is not outlined in the block diagram, but it can easily be found in AD8233’s data sheet [
15]. Then, the output ECG signal is read by an ADC on the MCU. The conducting path of the signal is shielded in a similar manner as that from the electrodes to the AFE IC. The output, however, can also be measured by an oscilloscope from a header pin for testing and monitoring purposes. Additionally, the IC’s configurations—RLD, lead-off detection (LOD), shutdown (SDN)—can be controlled both manually or by the MCU. This is achieved by setting the control pins to default values with pull-up/down resistors and routing them to both MCU’s digital input/output (DIO) pins and header pins.
2.3. MCU
The CC2650 MCU from Texas Instruments (TI) is chosen. The IC and its peripheral circuits occupy the upper-left and mid-left area on the PCB, as shown in
Figure 3a. Program flashing and wired communication can take place through the ARM 10-pin JTAG header on the board [
16]. Some of the CC2650’s digital IOs are connected to the AD8233’s outputs and controls, while others are routed to header pins left for future expansion.
The MCU reads the AFE IC’s output with its built-in 12-bit ADC, whose sampling speed is set to 300 samples/s for two reasons. An ECG signal typically has a frequency band from 0.5–150 Hz [
17], where the upper limit is at the Nyquist frequency of the sampling speed of the ADC. The MCU performs a moving average algorithm to smooth the common-mode noise in the signal, which comes from the power line’s magnetic interference picked up by the body. The moving average filter was chosen deliberately as a simple implementation of the subtraction procedure for power-line elimination [
18]. However, the power line frequency around the world differs. For example, the AC power is at 50 Hz in the UAE, but at 60 Hz in many other countries. A frequency of 300 Hz is the least common multiple of these two frequencies, allowing 16.67 ms or five data points average in areas with a 60 Hz power line frequency, and 20 ms or six data points average to eliminate the 50 Hz power line interference in our case.
The Bluetooth antenna design, which is called an inverted F antenna and is recommended by the manufacturer [
19], is implemented on the left-top side of the board using copper traces [
20]. Besides RF components, the placement of crystal oscillators, decoupling capacitors, and current return paths strictly follow the hardware configuration and PCB design guidelines for the CC26xx series MCU [
21].
2.4. Power Management
The device’s power system is implemented at the lower-right area of the board. The main power can be supplied through a battery with a JST-PH 2-Pin connector, USB type-c charger, or header pins. The battery can also be charged through the type-c connector. The charging process is controlled by the MCP73831/2 charge management IC and monitored with indicator LEDs. When the power switch is turned on, the main power supplies two ADP161 LDOs, which step down the voltage to 3.3 V for analog and digital power supplies. This power isolation between the digital and analog power domains improves noise immunity and minimizes crosstalk.
3. Results and Discussion
The results provided in this section are recorded by the MCU and transferred to a Windows 10 computer running TI’s Code Composer Studio 10 (CCS), which prints out the value of each measurement in the console window. Then, the data points were copied to MATLAB for further analysis and plotting. At this point of data acquisition, the BLE has not been utilized, but the same results are expected even with BLE transmission.
3.1. Frequency Response and Harmonic Distortion
In this section, a function generator (Analog Discovery 2) was used to feed the device inputs with sine waves in our interested ECG frequency band from 0.5 Hz to 150 Hz [
17], and the outputs from the MCU were analyzed.
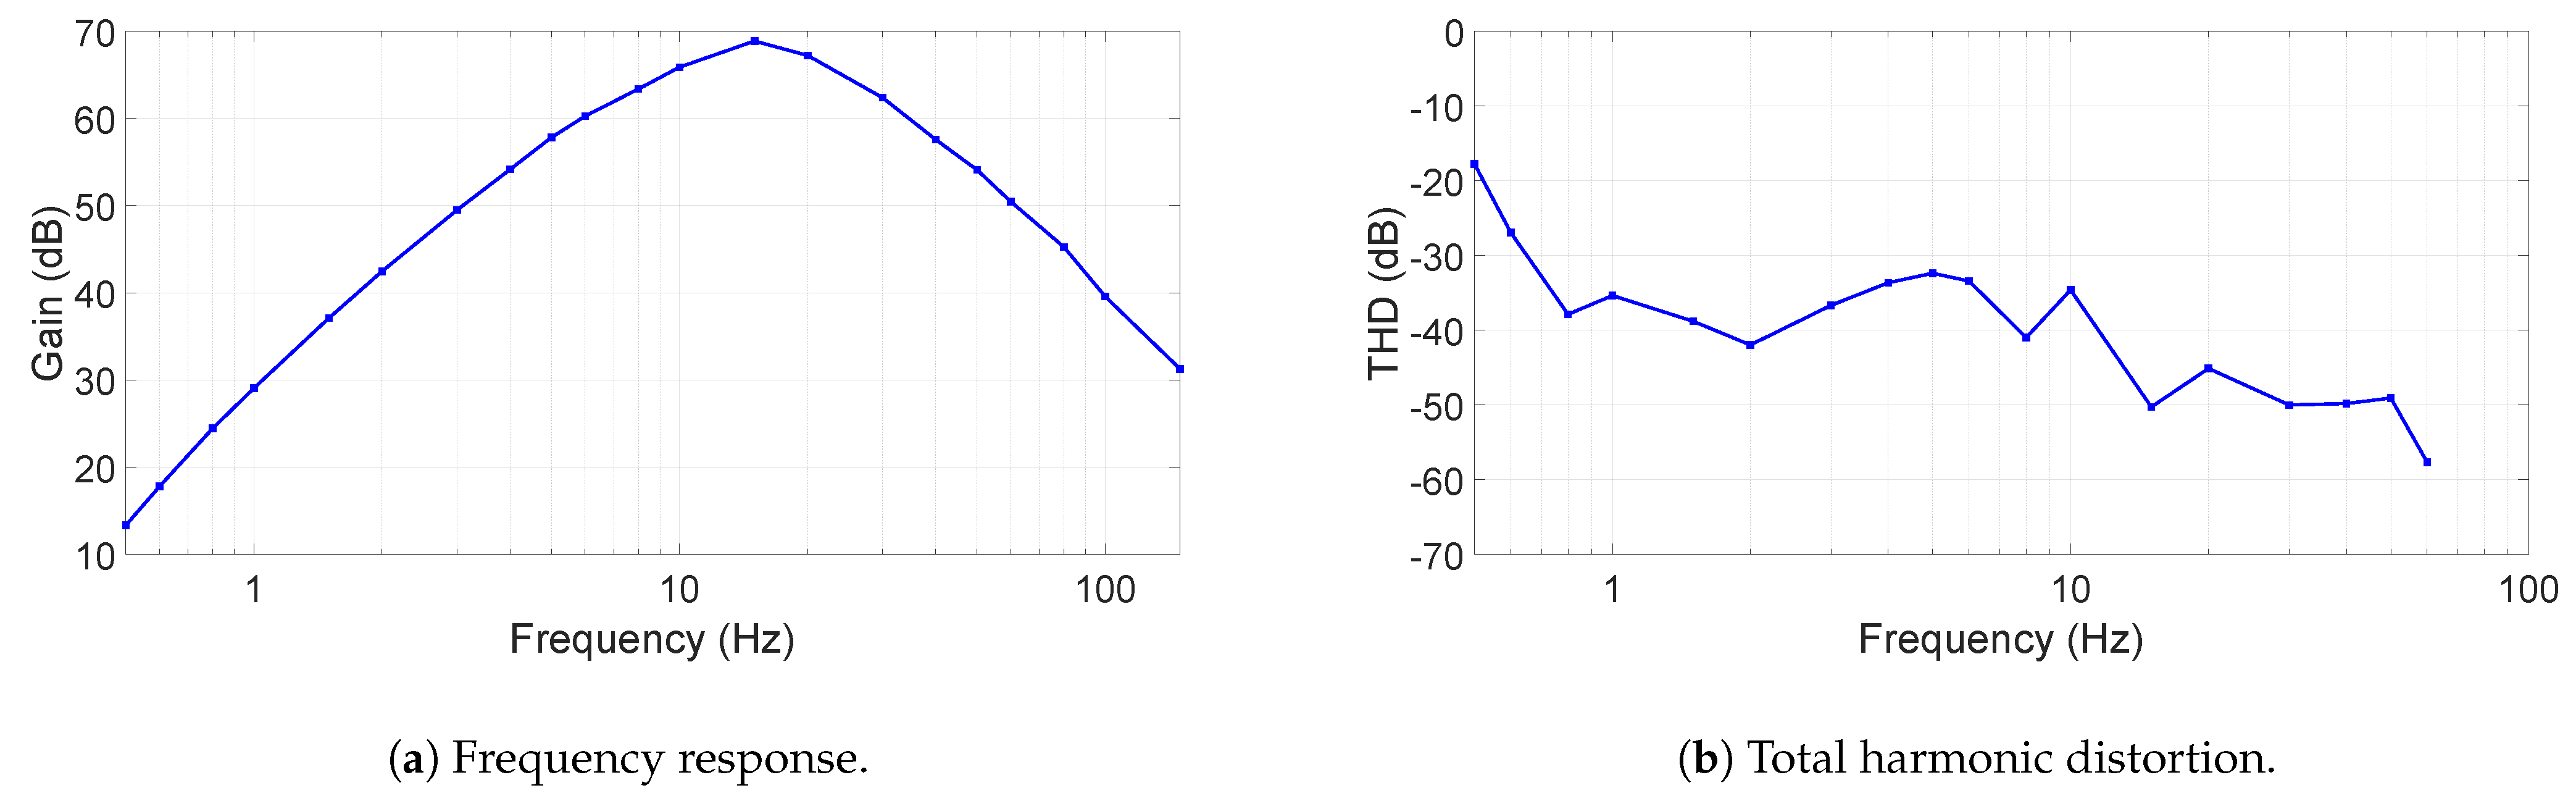
The frequency response of the ECG device is shown in
Figure 5a. As can been seen, the gain is above 40 dB for more than half of the interested frequency and above 60 dB from 6 Hz to 32 Hz, allowing ECG signals, typically at 1 mV, to be distinguished. However, our filter’s frequency response is not well suited for diagnostic ECG monitoring. The filter was chosen deliberately for minimizing baseline wander and motion artifacts, which is caused more by the non-contact electrode interface. This choice of frequency response ensures a meaningful and reliable ECG recording. In future work, the implementation of a flatter frequency transfer function will be investigated to reduce distortion over the ECG signal, whose configuration can also be found in [
15].
The total harmonic distortion (THD) is given in
Figure 5b. In most of the frequency range, the THD is between −30 and −50 dB, where at 60 Hz it can be as low as −60 dB. Since the sampling rate of the ADC is 300 S/s, harmonics were measured up to 75 Hz.
3.2. Noise Performance
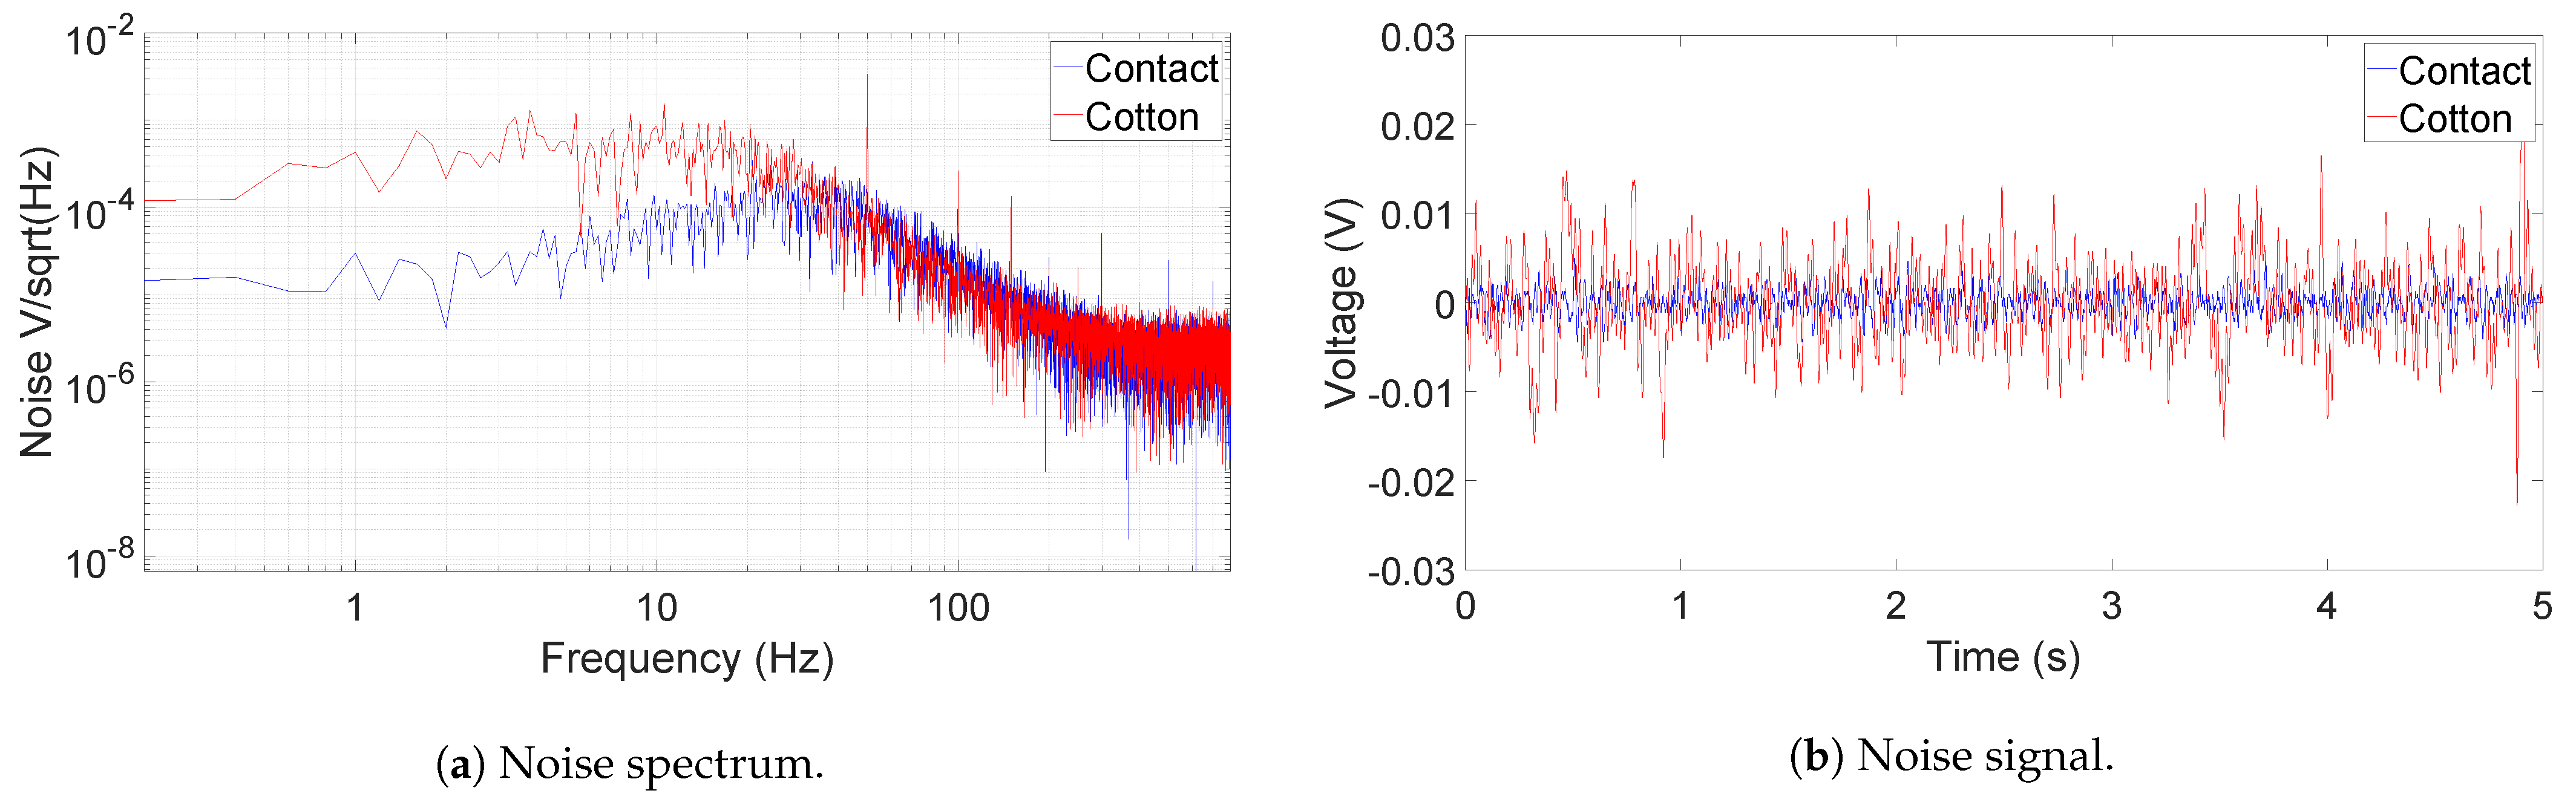
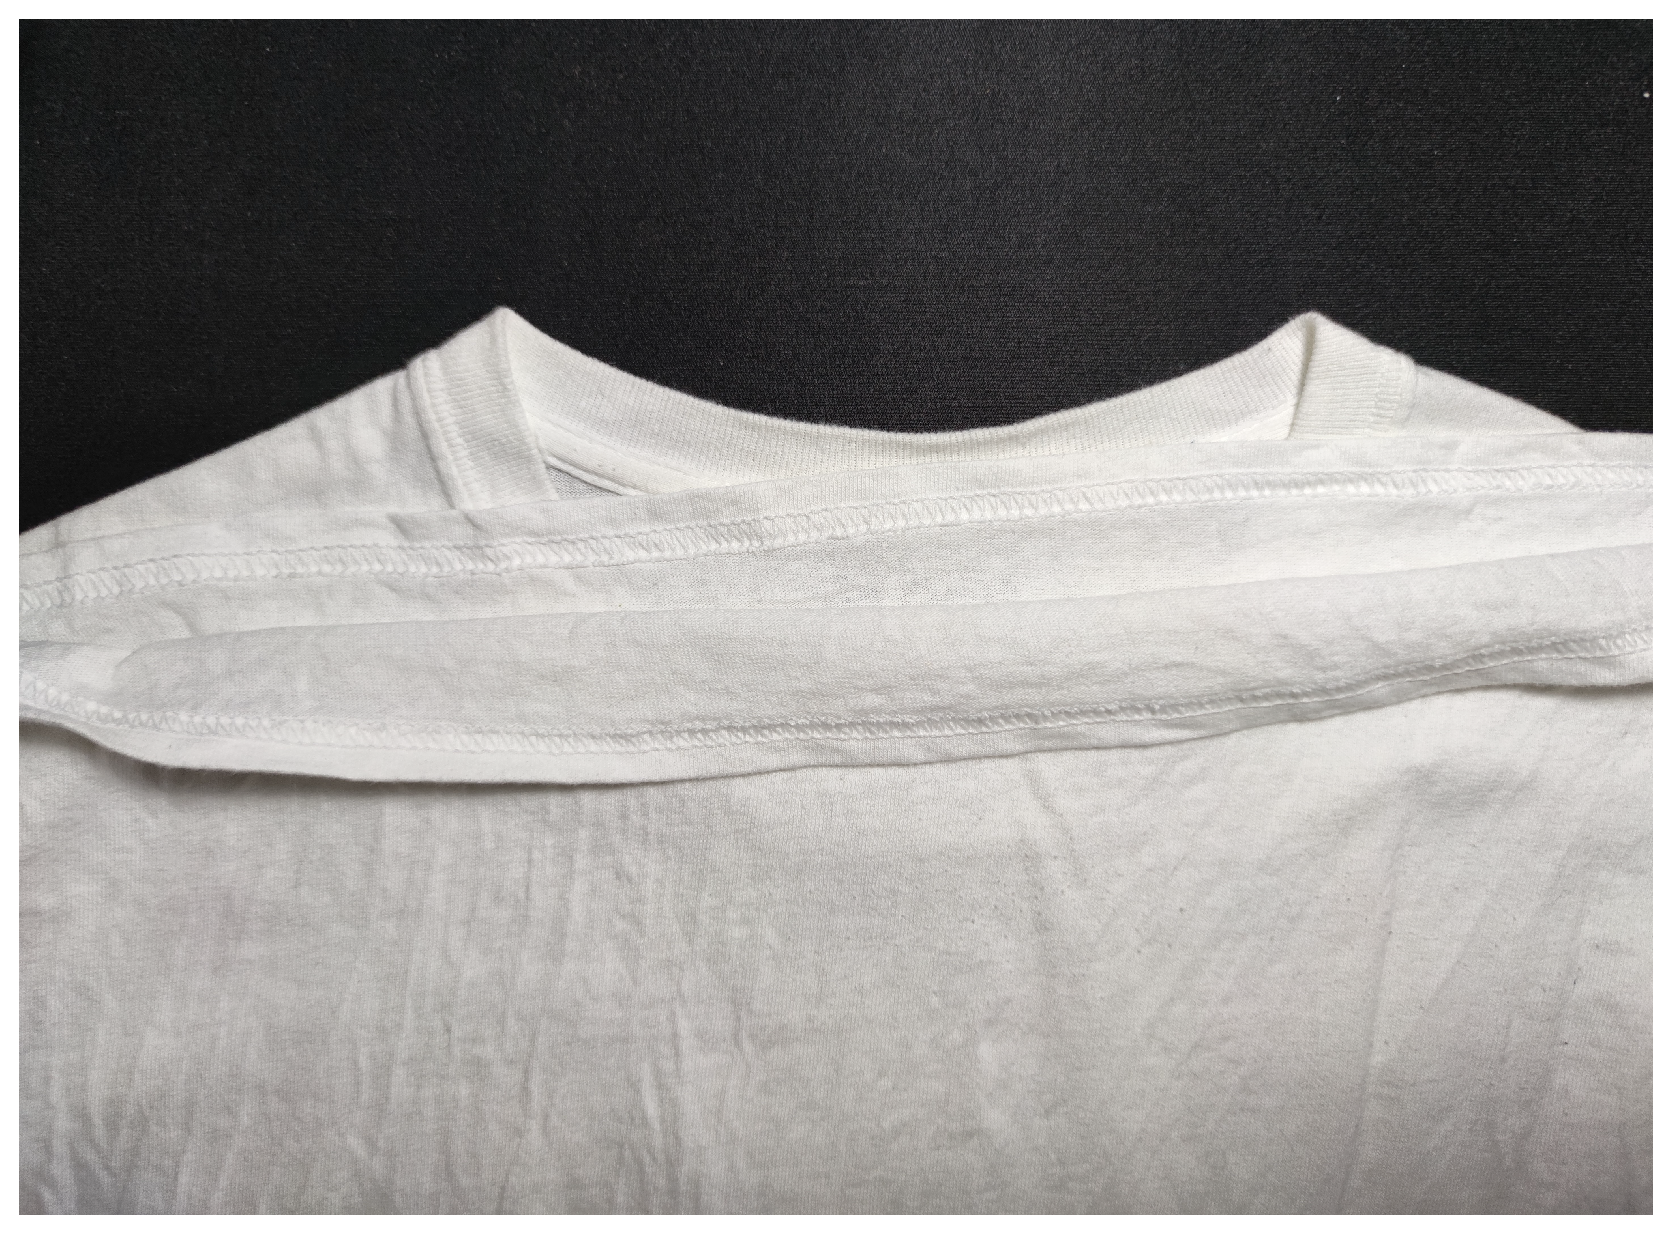
Figure 6 shows the output noise spectrum and time-domain recording of the AFE IC, measured by an oscilloscope (Analog Discovery 2) running at a sampling frequency of 1.6 kHz. During the measurement, both active electrodes’ inputs are connected to GND for the contact case. In the non-contact case, the electrodes are coupled to GND through a layer of dry cotton, a summer t-shirt, in between. A picture capturing the thickness of the t-shirt is provided in
Figure 7. The RMS voltage of the output noise for the contact-sensing case is at 1.46 mV, while for the non-contact-sensing case through cotton, it is around 5.15 mV. As shown in the spectrum in
Figure 6a, the extra noise in non-contact sensing is mainly coming from the band below 20 Hz and the frequency tones caused from the external power line noise (50 Hz in this case). The increased noise is attributed to the noise picked up by the cotton [
10]. The 50 Hz power line noise is more coupled to the AFE because of decreased CMRR, which may be degraded by the mismatch between the two cotton–electrode interfaces at the AFE input. This 50 Hz noise is filtered out in the digital domain in the MCU. It is important to note that the gain of the device, shown in
Figure 5a, can be high as above 60 dB, and thus the actual input-referred noise (IRN) is much lower than the measured ECG signal. When the average gain over the frequency range of interest is taken as 60 dB, the IRN for both cases are as follows:
3.3. ECG Measurements
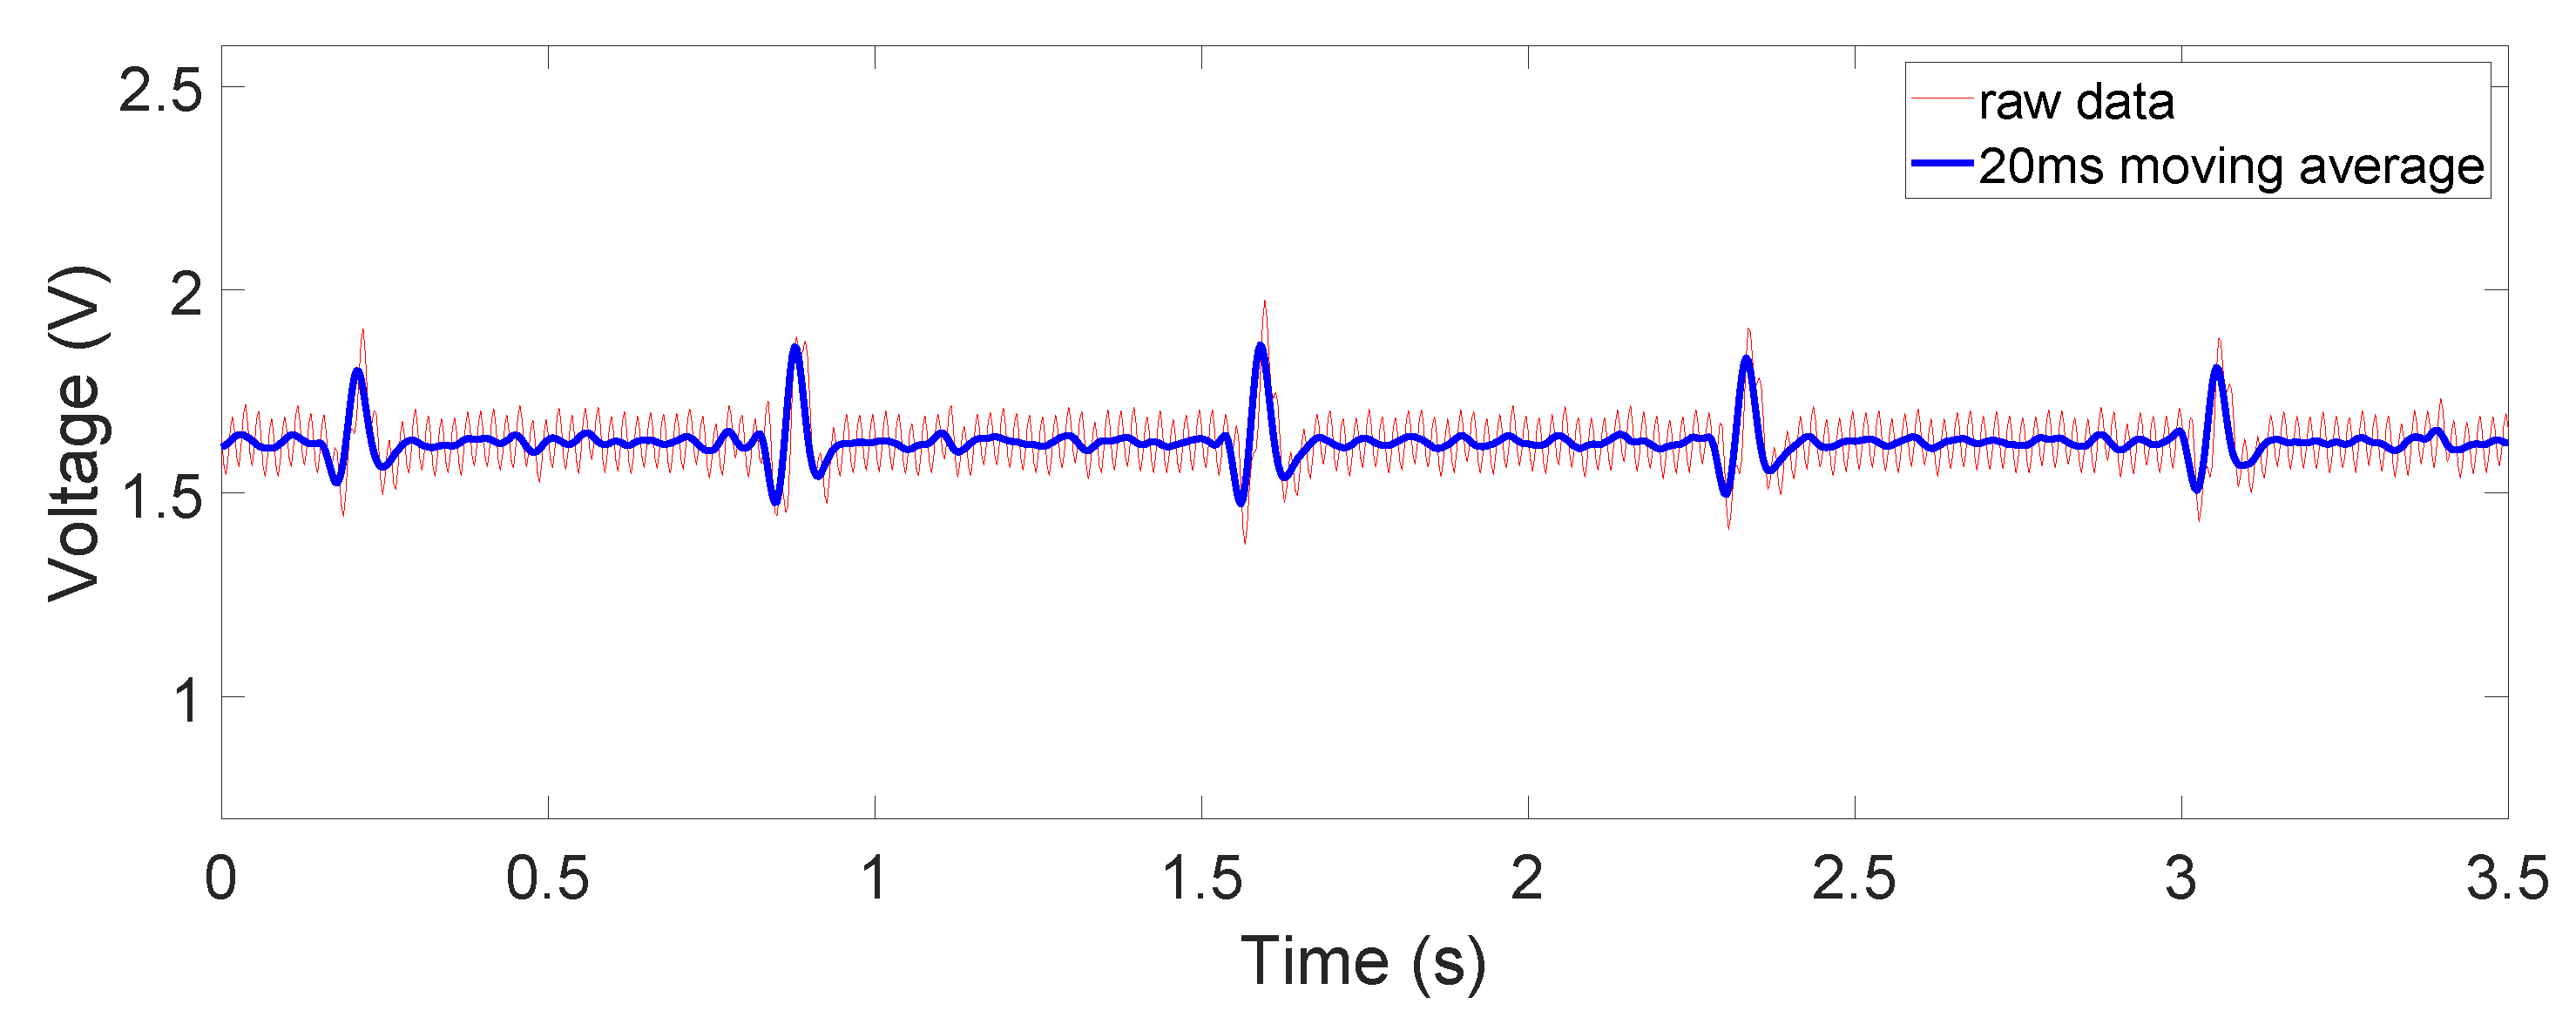
The raw and filtered data in
Figure 8,
Figure 9 and
Figure 10 are obtained when the device is placed on a human subject and are all sent directly by the MCU on board. The details on the sampling frequency and the 20-ms moving average filter are explained in detail in
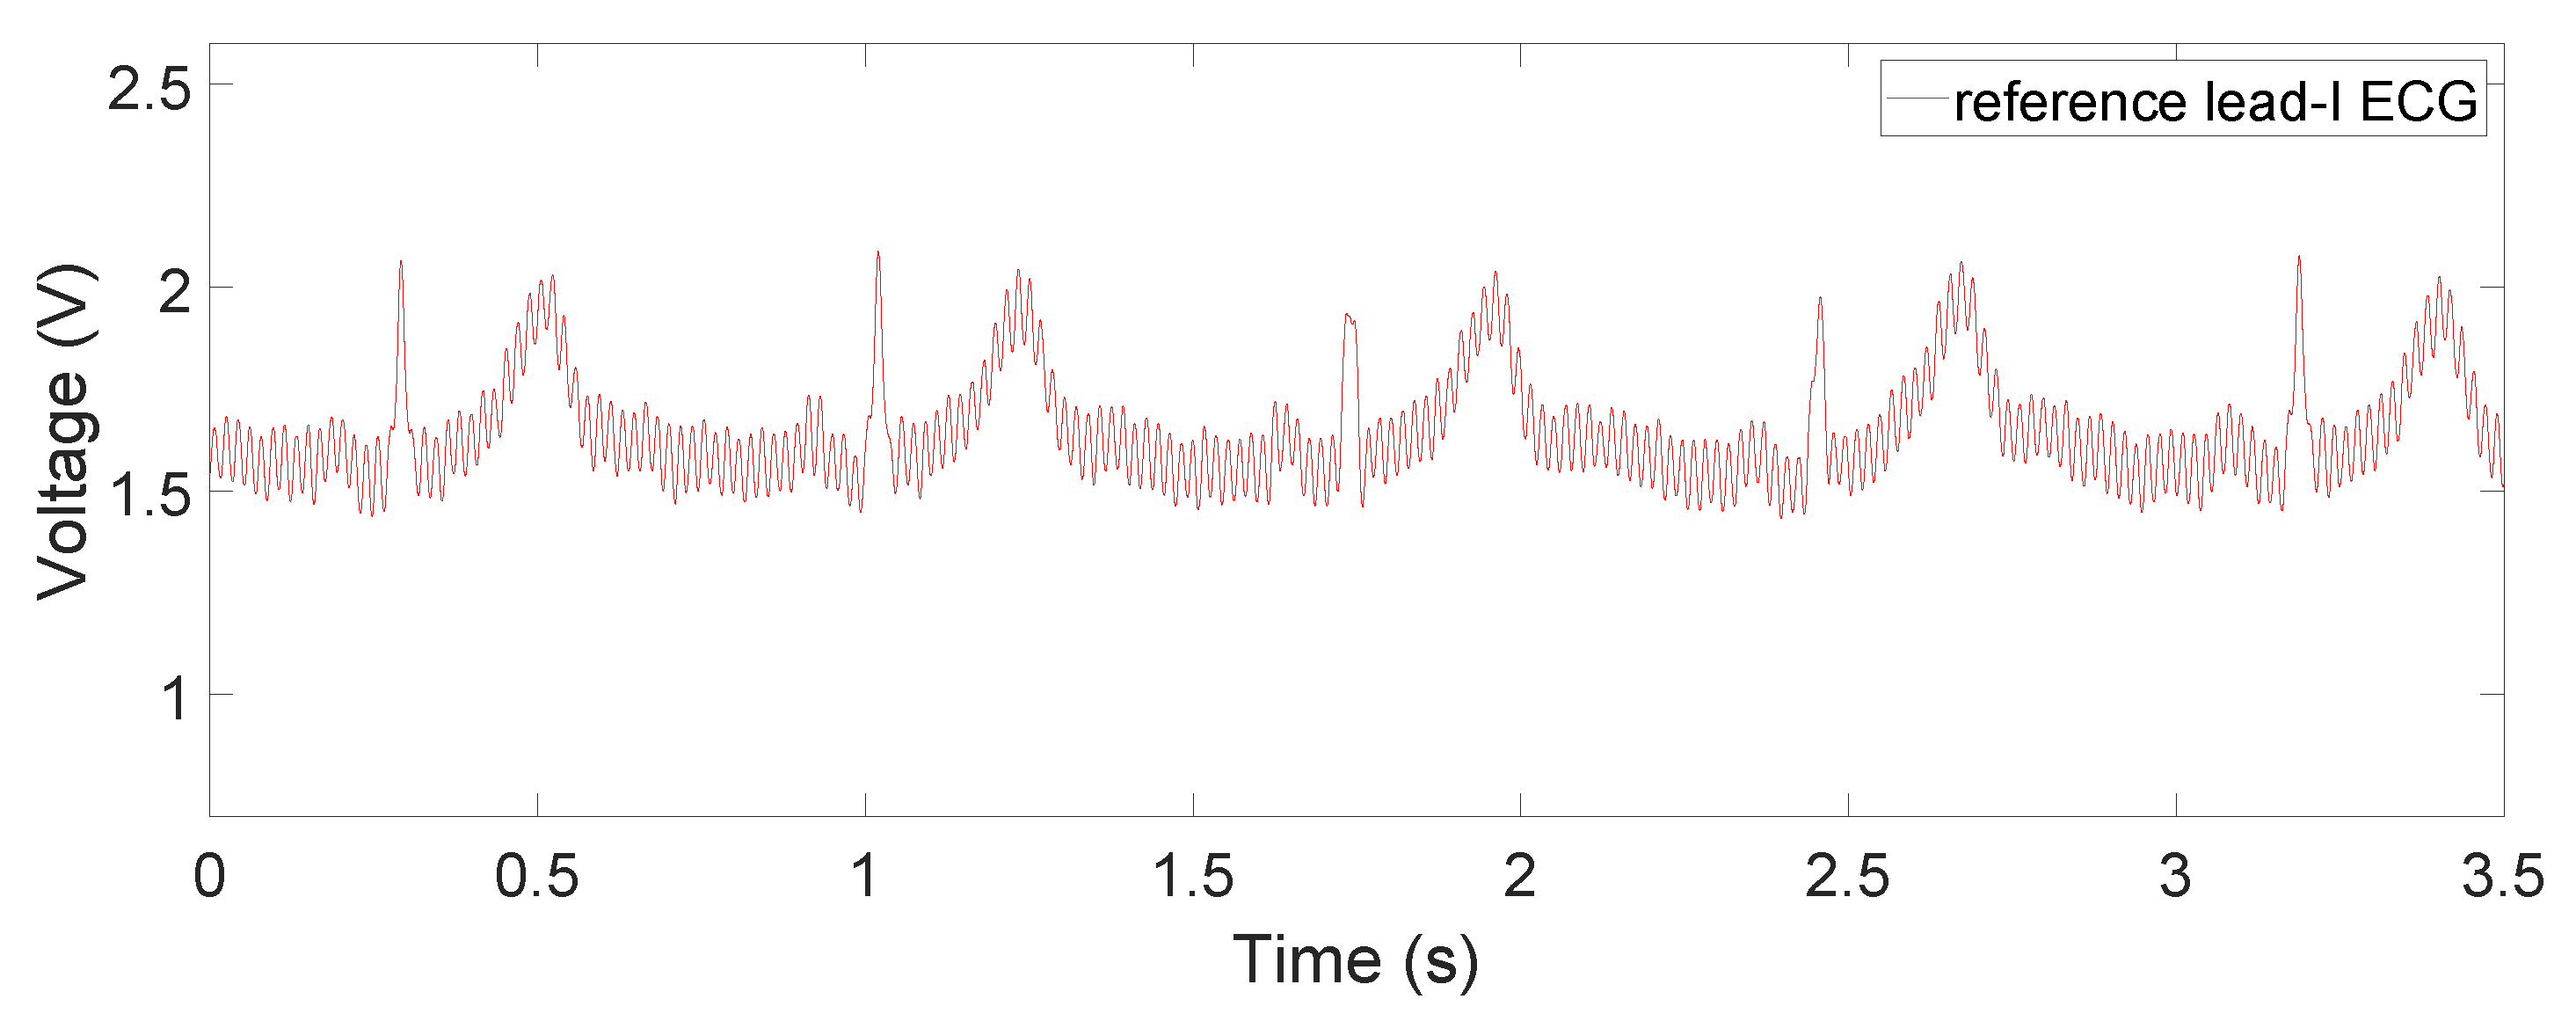
Section 2.3. The reference lead-I ECG signal, shown in
Figure 11, was obtained by using an oscilloscope (Analog Discovery 2) and an AD8232 ECG module (SparkFun 12650), whose RA, LA, and RL are placed on the right wrist, left wrist, and the neck with Ag-AgCl electrodes. Since our device was designed for non-medical purposes, the AD8232 AFE IC was chosen as the reference because it has been proven to be utilized in commercial products. Additionally, it is also very similar to AD8233, providing a common ground in the comparison.
We tested the device under different circumstances: the measurements were taken with the electrodes in contact with the hands and chest and in non-contact through a dry or wet cotton material. For the hand-contacting scenario, RA and LA electrodes were touching right and left thumb, while the RL electrode was touching the left index finger. For the chest recordings, the device was placed on the left side of the chest right above the heart. The results for non-contact sensing were obtained through putting the device on the subject’s chest while wearing a 100% cotton summer t-shirt, shown in
Figure 7. The measurements were taken with the dry t-shirt initially and were taken again after it was slightly rinsed with a 50 mMol/L (0.3%) sodium chloride solution, the medium concentration of human sweat [
22]. The results of both the reference AD8232 module as well as our proposed device were taken on the same subject under the same physical and environmental conditions.
The obtained signals are shown in
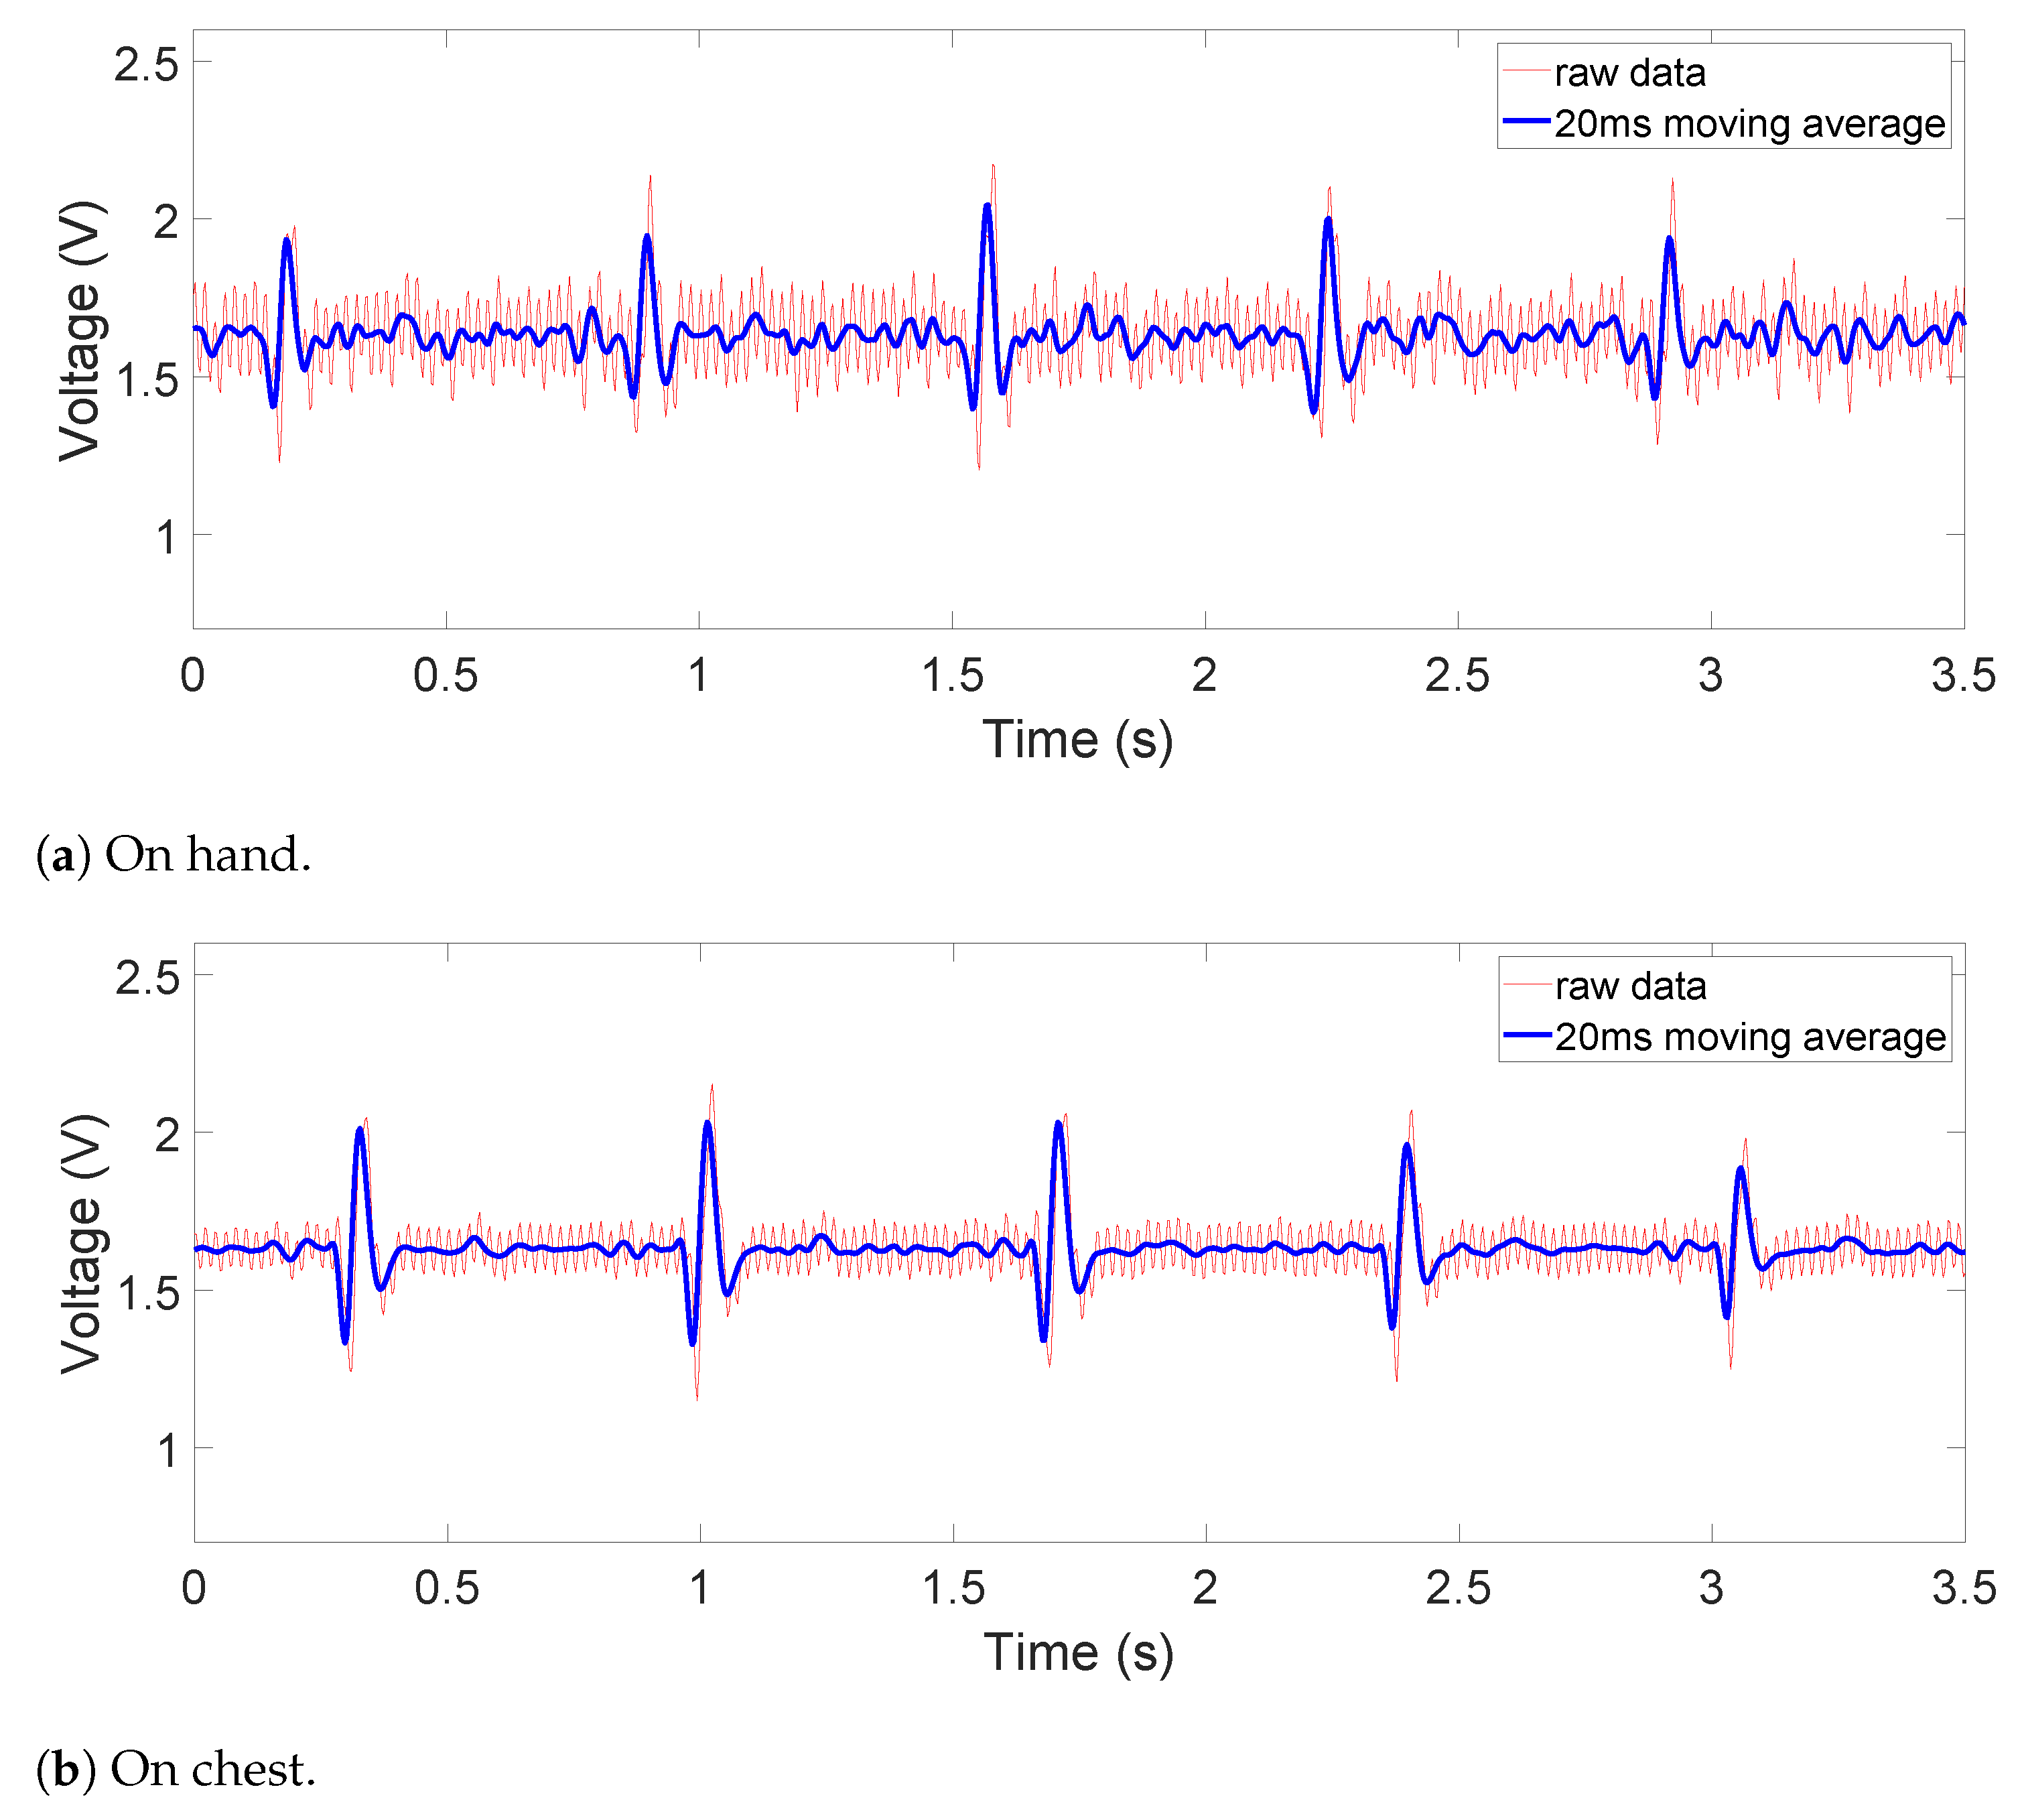
Figure 8,
Figure 9 and
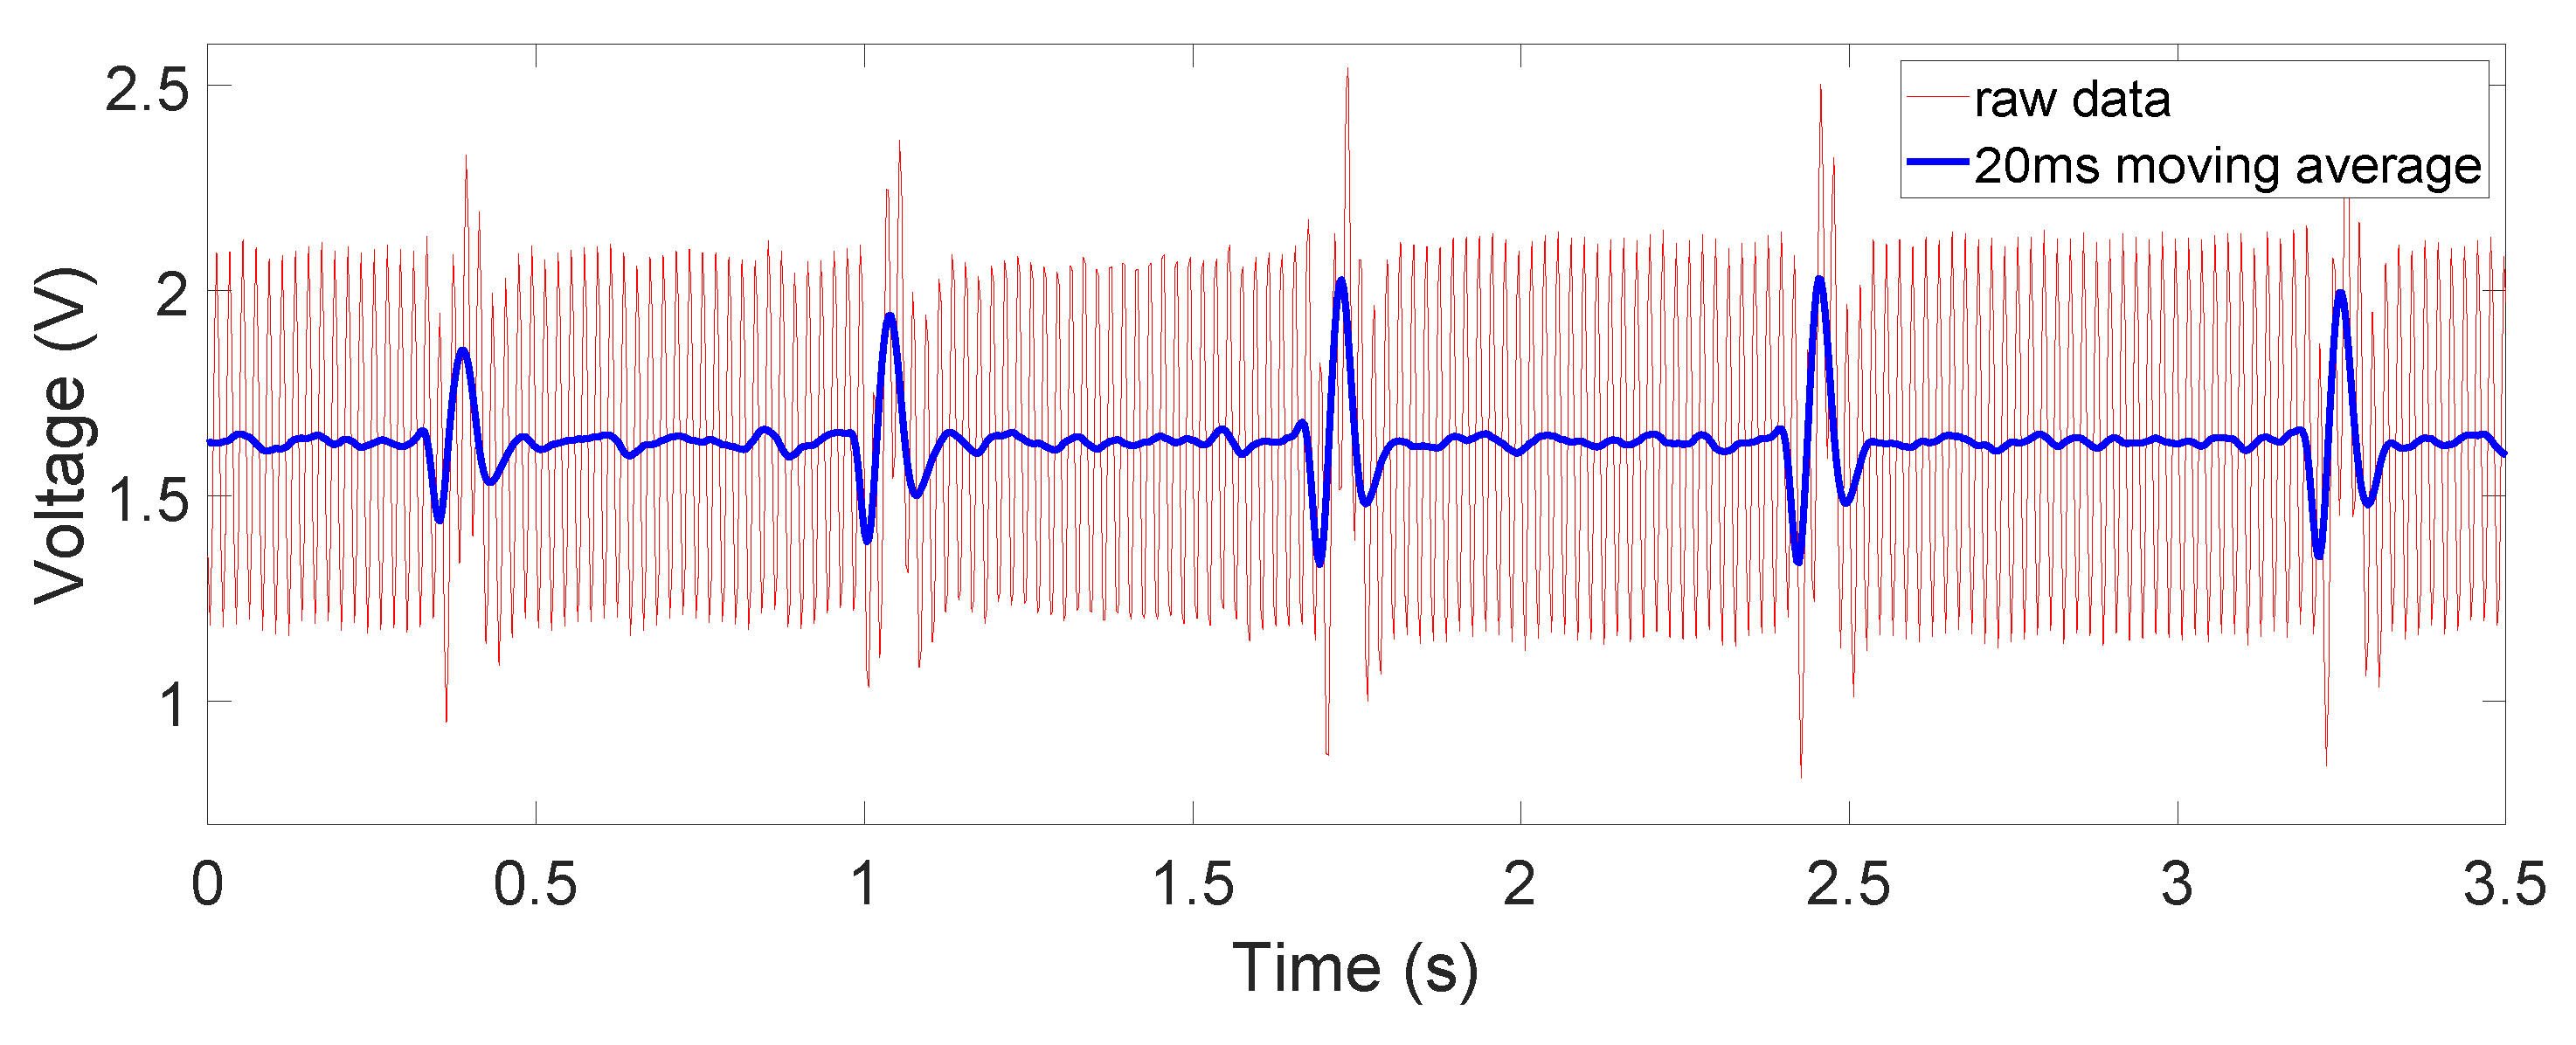
Figure 10. The ECG signals are well measured when the device is in direct contact with the human body, where the common-mode noise is small and most ECG characteristics such as Q, R, and S peaks and T waves are distinguishable. In the dry-cotton non-contact case (
Figure 9), the ECG signal strength is reduced due to increased source impedance. This is attributed to increased impedance of the electrode–skin interface and the additional cotton layer, which has a large impedance. Moreover, a huge 50 Hz power-line interference (60 Hz in some other countries) is observed. This is caused by a mismatch likely happening with electrode–skin impedance between the two electrodes. This mismatch is greater in the non-contact case. The mismatch degrades the total CMRR and eventually converts the 50 Hz common-mode noise on the differential input to a large noise on the recording output. However, the device still captured the QRS complex clearly. When the cotton shirt was rinsed with salt water to emulate a sweating case, the common-mode noise decreased dramatically (
Figure 10). The salt water is electrically conductive, reducing the difference of the electrode–skin impedances, and thus lowered the common-mode noise. The ECG signal’s magnitude is, however, still comparable to or lower than that when the dry cotton was used. This is because the conductive cotton creates a parallel conductive path between the two electrodes, thus reducing the differential signal amplitude.
For the contact on-chest measurements in
Figure 8b, we can observe small-magnitude (sometimes concave) P and T waves compared to the reference ECG signal in
Figure 11. This is partly due to diminishing gain at lower frequencies in the frequency response, which can be fixed by switching to a flatter filter, but also the fact that the electrodes are not in perfect locations for a lead-I ECG or at any point in a 12-lead ECG system. This is also the case for both non-contact results shown in
Figure 9 and
Figure 10, where the ECG is measured at the same area. Due to the location of the device, such distortion is inevitable as a trade-off for portability and convenience. It is worth noting that this device is not intended for diagnostic uses but for everyday uses and thus falls behind on signal fidelity. However, the device still succeeds in monitoring the QRS complex relatively accurately and P and T waves to some extent. In the future, switching to a flatter filter and further improvements in the hardware and signal processing would even improve the visibility of P and T waves.
We can also see from the figures, especially in
Figure 9, that the moving average filter is very effective in eliminating the common mode noise, which is the main source of noise. Although effective in denoising, the moving average did also slightly reduce the magnitude of the ECG signal, as a result of its transfer function, which is not flat over the signal frequency range. Alternatively, a notch filter can indeed have a steeper transfer function without compromising on other frequency bands. However, the moving average filter is much simpler to implement and would serve the purpose of reducing the noise in non-medical applications well. Additionally, due to the limited computation power from the MCU, the moving average is less likely to interrupt continuous monitoring, which requires constant ADC operations and data analyses. In future work, we will explore other methods such as notch filter [
23], Savitzky–Golay filter [
24], or adapting the common-mode interference as reference signal [
25] to find the best option in reducing the noise while preserving accurate ECG information under the hardware limitations.
3.4. Battery Life, Cost, and Wearability
The battery used for this device is rated at 2000 mAh, 3.7 V. The currents drawn by the device at different stages are measured, where 123.7 mA is consumed when the CC2650 MCU is processing AD8233 IC’s output, 83.8 mA when AD8233 is running but CC2650 is idle, 82.6 mA when AD8233 is turned off and CC2650 is idle, and 35.1 mA when both AD8233 and CC2650 are turned off. From the measurements, the approximate battery life was calculated as the quotient between the battery’s capacity and the current consumption, resulting in 24.2 h for idle and 16.17 h for continuous measurement, shown below:
In actual scenarios, the device would be awake and measure the ECG signal periodically. Such a calculated continuously measured battery life of over 16 h would be enough for day-time use. However, the standby mode of the MCU has not been implemented yet, and it is always running. In future development when the MCU standby has been utilized, in which state it only consumes 1 µA to 2.7 µA [
19], the battery life when the whole device is in standby would be extended much longer.
Additionally, in this design, the operational amplifiers are never turned off, where each typically consumes a current of 1.5 mA [
26] and 3 mA in total. In future improvements, turning them off along with the AFE IC will further lower the power consumption in the stand-by mode. The power consumption of three indicator LEDs, which are always on during this measurement and consume 3.23 mA in total, can also be lowered or saved in the future. The battery itself, as can been seen in
Figure 3, is smaller than the device, which means there is still room for a larger battery, further improving the operation time.
If the expected battery life at standby mode after optimization is calculated, the total device current measured when both AD8233 and CC2650 are turned off should be used after subtracting the opamp and LED power and adding the MCU’s standby power. This results in 69.27 h, as calculated below:
Regarding the cost, the manufacturer/fabricator provided us with a preliminary material cost of USD 49.85 per device, excluding the external battery. Through mass production, the economy of scale should be able to cover the battery and PCB cost under the USD 50 bar.
While wearing the device, we noticed that a hard, flat PCB may cause slight discomfort because of the curvature of human chest. This is a potential cause of electrodes disconnecting and the signal weakening. This can be further improved by a design utilizing multiple small PCBs connected by flexible printed circuits. Additionally, for non-contact sensing with dry clothes, in order to acquire the strongest signal, the device is required to be placed precisely above the heart. The situation was alleviated if sweat was presented and the signal could be acquired within a larger area. This limits the compatibility of the current version device with various pocket locations and body shapes.
At the moment, the device is capable of storing 25 s of recorded ECG data used for MCU filtering. The 12-bit data are recorded in a 16-bit array as per the CC2650 predefined ADC functions. This reserves the possibility to cut down the storage size in the future, increasing the recording duration. This length of the recorded data can be further increased by adding external storage to the MCU. Additionally, the MCU runs the moving average filter for 166 ms, meaning that it would be possible to send multiple batches of 25 s long data over a span of 5–10 min (length of a medical ECG recording [
27]) with negligible periodic interruptions of 166 ms. A better approach that we will take is to program the MCU to adapt continuous signal reading, such that the moving average filters the data simultaneously as the raw data are being read, saving up on storage and eliminating the filtering interrupts mentioned above.
Lastly, after evaluating the results of our ECG monitoring device, we can compare it to the literature previously mentioned in
Section 1.
Table 1 summarizes the main characteristics of our device and other similar works. In comparison to the previous works, our ECG monitoring system is novel in unifying the electrodes and signal processing and transmitting components on one PCB device, optimizing its size and wearability.
4. Conclusions
The device presented here provides a potential low-cost solution to the issue of CVD severity and the lack of precautionary monitoring systems. The compact non-contact ECG device integrates the electrodes, signal acquisition, processing, and transfer circuitry on a credit-card-sized PCB, making it easily wearable and transportable, as compared to previously reported large-sized and stationary ECG monitoring devices. From our results, this device has relatively low harmonic distortions and input inferred noise across interested frequencies. In spite of the slight distortion, thanks to the embedded non-contact shielded electrodes, the ECG signals and most of their characteristics, after the moving average filter, outputted by the device are very clear under both contact and non-contact sensing scenarios. Additionally, the device achieved a whole-day battery life and could be extended much longer after further development. For its real-life application, the device needs further improvements on extending the battery life, putting ergonomics into the design, and creating a companion application to receive the ECG data through BLE. It is also worth noting that when it comes to medical use, ECG devices with conventional wet electrodes provide better signal fidelity. However, due to its compactness, size, non-contact sensing, and portability, the presented device provides a simple and convenient solution for every-day ECG monitoring.


