1. Introduction
Ceramic relics are the preservation of ceramic objects in the development and evolution of human beings. They have broken through the limitation of time, and contain rich scientific, historical, and artistic values. They are first-hand materials for archaeology and historical research. Modern science and technology are crucial for the exploration and extraction of such valuable information. Due to the particularity and nonrenewable nature of the ceramic cultural relics, the way to exploit more internal information of the ceramic cultural relics, while causing less damage to the cultural relics, has always been the focus of cultural relics scholars.
In the study of cultural relics, it is necessary to observe the information inside the cultural relics via the surface to analyze the image inside the cultural relics. Currently, X-ray [
1,
2,
3,
4,
5] and infrared imaging technology [
6,
7] are mainly used for the image analysis of cultural relics.
X-ray technology exhibits different black and white contrast photos based on the different absorption degrees of different substances to X-ray. Therefore, the analysis of the X-ray films can reflect the internal information of the cultural relics. The X-ray has a high frequency and high energy. When the X-ray hits the surface of the ceramic relic, some weak chemical bonds in the molecules on the surface of the object will break, and the relic will be damaged.
Infrared imaging technology can effectively reflect the internal conditions of the ceramic relics by receiving and analyzing the infrared radiation energy from the surface of the target object and converting it into visual thermal images. However, for ceramic relics with good thermal insulation ability, infrared internal imaging analysis cannot be realized.
Terahertz-wave technology refers to the frequency of the electromagnetic wave in the range of 0.1 to 10 THz. Its frequency is lower than that of the X-ray, thus its quantum energy is low. It is unlikely for the terahertz wave to cause a photochemical reaction, which is better for the protection of ceramic relics. Additionally, its good penetration ability for ceramic materials and other nonpolar materials makes terahertz waves detect and image opaque objects. Eventually, the wavelength of the terahertz wave is quite small. The terahertz wave has the potential to distinguish different materials, which is conducive to the imaging, accurate positioning, and shape recognition of subtly hidden targets. In summary, the non-destructive detection of ceramic relics based on terahertz-wave technology will become a promising technique.
As an emerging detection technology, terahertz-wave imaging has been applied in many fields involving biological detection and security inspection [
8,
9,
10,
11,
12,
13,
14]. Yet, terahertz-wave imaging in the field of the nondestructive testing of ceramic cultural relics has not been developed fully. In 2001, Ken B et al. proposed a 3D imaging system for the terahertz-wave detection of concealed weapons operating at 576–605 GHz [
12]. The system was able to image a human torso from a distance of 4 m within 5 min. However, the imaging resolution of the system is only 1 cm, which is far from enough to accurately identify the internal structure of ceramic vessels in cultural relics testing. In 2016, Jeffrey S. White et al. reported a very fast terahertz-wave imaging and detection system [
13] that can manage to obtain a picture as large as one square meter with a resolution of 0.5 mm within 10 min. Yet, this system is mainly applicable to the surface defect detection of flat materials and the density prediction of foam materials. Therefore, it is not suitable to detect the structure of 3D ceramic relics. In 2020, Ali Mostajeran et al. devised an ultra-wideband fully integrated terahertz-wave imaging radar based on the center frequency of 221.1 GHz [
14], which can image the targeted structure with a resolution of 2 mm within a distance of 23 cm. Nevertheless, the system cannot directly judge the specific content and structure from the imaging. Therefore, there are many limitations when this system is applied to the detection of ceramic relics. In summary, low imaging accuracy, complex test structure, and high difficulty in imaging identification are three challenges that confine the terahertz-wave detection of ceramic relics.
This paper proposes terahertz-wave imaging for ceramic relics. In the experiment, a 0.2-terahertz wave and AMC4030 servo control platform are used to build up a high-stability high-precision terahertz-wave imaging system with the simplest structure, which realizes the transmission imaging of the ceramic vessels with an accuracy of 2 mm within the size range of 14 cm × 12 cm. Additionally, this study adopts an iterative threshold segmentation method to obtain images of high quality. Furthermore, a neural network algorithm is used to help recognize the content of the transmission image, which can provide further support for people to analyze the inner structure of ceramic relics.
Section 2 details the theoretical principle of terahertz-wave imaging.
Section 3 introduces the imaging and recognition system developed in this study.
Section 4 describes its hardware structure.
Section 5 provides the experimental results and corresponding analysis. Finally,
Section 6 summarizes the conclusion.
2. Theoretical Basis of Terahertz-Wave Transmission Imaging
The propagation characteristics of an electromagnetic wave are calculated by the electrical coefficients of the transmission medium, namely, the dielectric constant, magnetic permeability, and electrical conductivity [
15,
16,
17,
18]. For the air, ceramics, metals, and materials that may exist in the ceramic containers, the differences in the electrical coefficients are the crucial factors that affect the transmission ability of the electromagnetic waves. The penetrating process of the terahertz electromagnetic waves through a ceramic container can be simplified to the superposition of several penetrating processes of the single object. The whole process of the electromagnetic wave passing through a single object from the air can be divided into (1) the wave incidents from air to object, generating the reflected wave and transmitted wave, (2) the transmitted wave propagates and attenuates in the object, (3) the transmitted wave propagating to the other side of the object again, causing reflection and transmission at the interface between the object and the air on the other side.
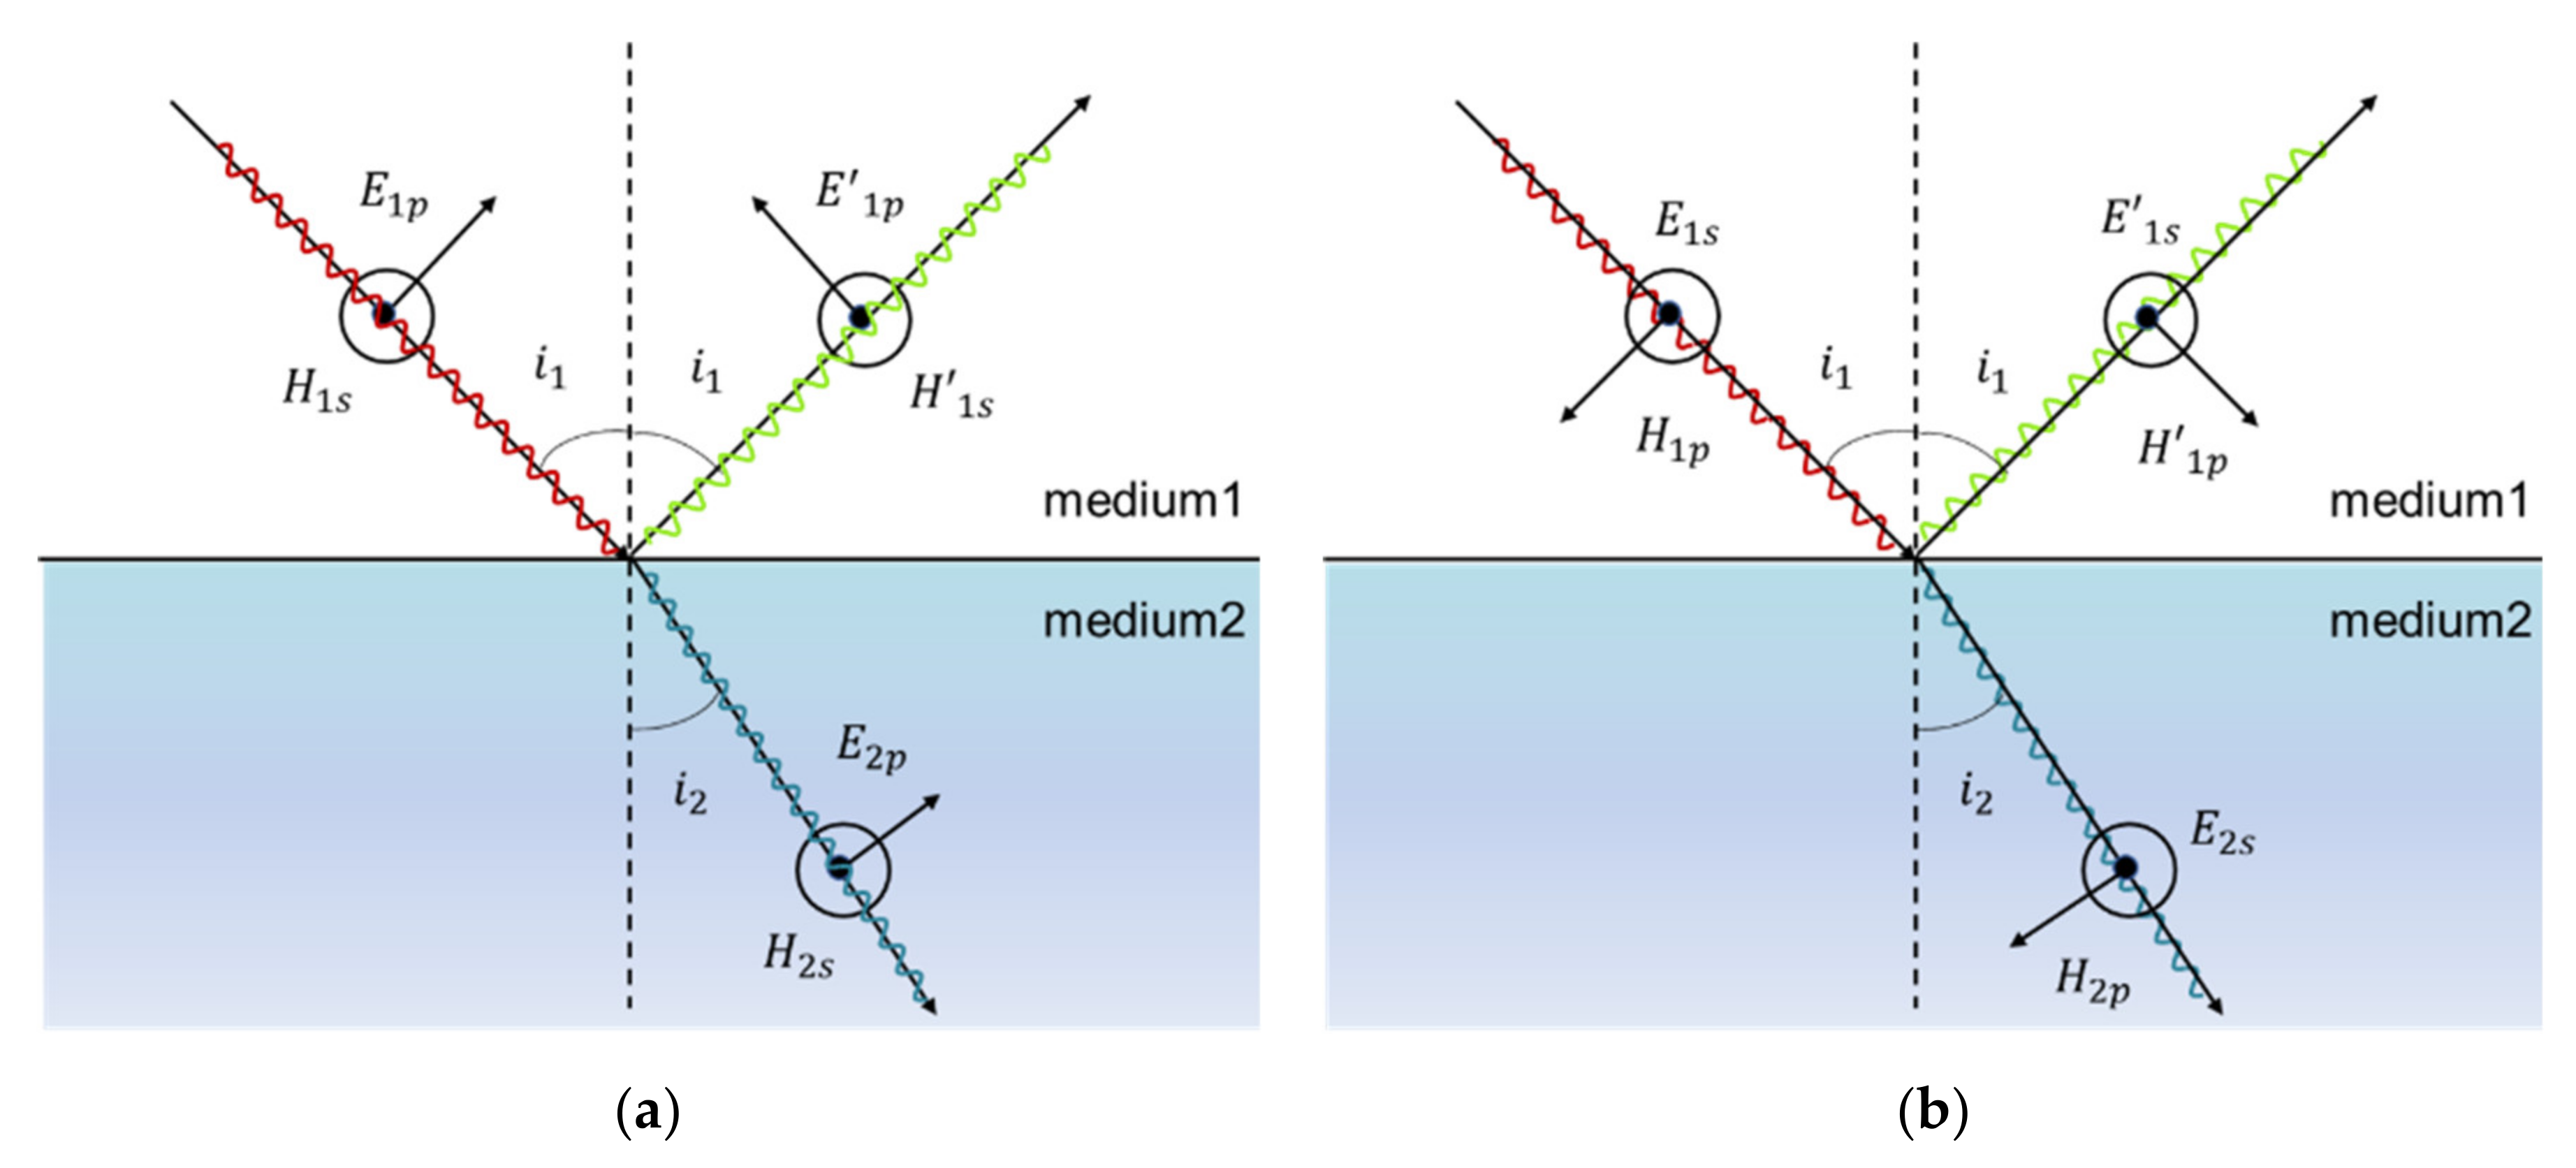
The above (1) and (3) have similar principles and can be solved using the Fresnel formula. The electromagnetic wave follows the electromagnetic field boundary condition at the interface of the medium: the continuous tangential component of the electric vector () and the continuous tangential component of the magnetic vector (). The reflection and refraction of the electromagnetic waves are created at the interface of the medium. We assume that the component parallel to the incident plane is represented by p, and the component perpendicular to the incident plane is represented by s. is the incidence angle, is the refraction angle, and and conform to .
As shown in
Figure 1a, according to the boundary conditions, the relation between tangential components can be expressed as the following:
The amplitude reflection ratio (
) and amplitude transmission ratio (
) of the electromagnetic wave can be derived as follows:
As shown in
Figure 1b, based on the boundary conditions, the relation between perpendicular components can be given as the following:
The amplitude reflection ratio (
) and amplitude transmission ratio (
) of the electromagnetic wave can be computed as the following:
Thus, the transmission ratio of the energy flow parallel to the incident plane and perpendicular to the incident plane of the electromagnetic wave can be written as follows:
The electromagnetic wave needs to propagate from the outside to the inside of the medium, and the electric and magnetic fields inside the medium need to be induced by the external electric and magnetic fields. For common metallic materials inside cultural relics, the dielectric constant is very high at a high frequency. Thus, when the terahertz electromagnetic wave is transmitted to the surface between the conductors and the air, the reflection ratio of the electromagnetic wave is high. Since the dielectric constant of the ceramic containers is small, the terahertz electromagnetic wave can easily provide alternating electric and magnetic fields inside the medium, so that the transmission of the electromagnetic wave is high.
As observed in
Figure 2a,b, the relationship between the transmission ratio of the energy flow of the terahertz electromagnetic wave incident from the air to the surface of the metal and ceramic with different incident angles is drawn based on the Equations (9) and (10). The red line refers to the transmission ratio of the iron, while the blue line refers to the transmission ratio of the ceramic. It can be observed that, for the electromagnetic wave component perpendicular to the incident plane, the transmission ratio of the ceramic is always higher than that of the iron. For the electromagnetic wave component parallel to the incident plane, the transmission ratio of the metal will be slightly larger than that of the ceramic only when the arrival angle is very large. When the terahertz wave passes through different substances at a certain arrival angle, the attenuation of the amplitude caused by the reflection will be different.
In the above (2), the propagation of the electromagnetic waves in the conductors with electrical conductivity can be calculated with Maxwell’s equations. If the wave vector is defined as
, then the electromagnetic wave propagating in a conductor can be expressed as the following:
where
ω, ε, μ, and
σ represent the angular velocity of the electromagnetic wave, the dielectric constant of the medium, the magnetic permeability of the medium, and the electrical conductivity of the medium, respectively. Inside the medium, the amplitude of the electromagnetic wave attenuates exponentially, and the rate of its attenuation is described by the imaginary part (
of the wave vector. The higher the conductivity of the medium is, the higher the frequency of the electromagnetic wave will be, the faster the attenuation will be, and the less easily the electromagnetic wave can pass through the medium.
Moreover, the vibration of the chemical bond of certain molecules can form resonance with the electromagnetic wave, which can greatly absorb the energy of the electromagnetic wave. As a result, certain materials such as water can greatly attenuate terahertz waves, while for most non-polar materials, the penetration ratio of the electromagnetic waves in the terahertz band is very high.
In summary, the attenuation of the terahertz wave when it passes through objects is mainly determined by the reflection on the surface of the medium, the attenuation inside the medium, and the interaction with the chemical bonds in the molecules. All three factors are closely related to the characteristics of the medium and the frequency of the electromagnetic waves. Therefore, it is estimated that there should be an optimal frequency so that the attenuation of the terahertz wave in the air and ceramic is minimized, while other substances inside the ceramic can be clearly detected. In this way, we can analyze the internal structure of the ceramic vessel more effectively. Based on the above principles, after testing and analysis, we finally adopted 0.2 Thz as the electromagnetic frequency used in the transmission imaging system. More comparisons and considerations in the frequency selection are elaborated in
Section 4.
3. Imaging System
Whether using Maxwell’s equations, the Fresnel formula, or the molecular absorption theory, it is not appropriate for us to judge the internal structure of the cultural relics directly using manual calculation. First, due to the inhomogeneity of the ceramic relics, the electrical coefficients in different locations are often different, which requires a lot of measurements of the electrical coefficients in different locations, and these measurements may cause additional damage to the cultural relics. Meanwhile, because the attenuation of the terahertz wave is the result of the combined action of the refraction and transmission of the electromagnetic waves and the absorption of the molecules, it is difficult to use a unified formula to directly explain the measured attenuation of the terahertz wave with the internal structure of the ceramic relics. Therefore, in this design, the detection method of the ceramic relics is to start from the results of the data obtained by detection, then to draw a transmission image of the attenuation lattice of the terahertz wave measured at different positions of the ceramic container by using an imaging algorithm, and finally to realize the prediction of the objects inside the ceramic with the neural network.
The imaging system in this study has three modules (
Figure 3). The test module collects the spectral signals after the terahertz electromagnetic wave transmits through different positions of the object. The servo control module controls the position movement of the object to be measured and delivers the position information to the imaging identification module. The image recognition module obtains the transmission image of the object by integrating and processing the spectrum information and the position information. Afterward, the neural network algorithm is summarized to realize the image content recognition. The algorithm used in the image recognition system is elaborated in
Figure 4.
3.1. Imaging Algorithm
The conventional and widely used transmission imaging algorithms include the linear mapping imaging algorithms [
19,
20,
21,
22,
23,
24,
25,
26,
27,
28]. That is, the attenuation data of the terahertz wave collected at various positions in the experiment correspond to different positions in the picture, and the tested data are linearly mapped to the depth of the color in the picture. The position with the maximum attenuation of terahertz-wave amplitude has the deepest color in the image, and the position with the minimum attenuation of the terahertz-wave amplitude has the lightest color in the image. The advantage of this imaging algorithm is that it effectively restates the transmission imaging of the terahertz wave and contains all imaging information to the maximum extent. However, the disadvantage of this imaging method is that the image pattern is not intuitive and can be easily disturbed by the external noise, which is not conducive to the clear and elaborated analysis of the internal structure of the ceramic relics.
Recently, an alternative method called shaping regularization has been proposed to enhance the quality of imaging [
29,
30,
31]. It can effectively reduce energy leakage when abnormal noise exists. However, this method requires a large number of calculations to achieve a clear and intuitive image of the interior of a ceramic container.
Hence, the improved algorithm adopted in this study is the iterative threshold segmentation method, which requires fewer calculations at the premise of high image quality. The principle of the threshold segmentation algorithm is as follows: according to the calculated threshold values, all the data are divided into different regions; in the same region, the color is the same; and different regions correspond to different depths of color. In this study, the threshold value is obtained based on the iterative algorithm. First, an initial threshold
is selected from all the data “
L” obtained from the experiment. Secondly, the image is divided into two regions,
and
, according to the threshold
. The average attenuation values,
and
, of region
and region
are calculated, respectively, according to the following formulas:
where
represent the average attenuation values of the region
and region
in the
ith iteration, respectively. Each
represents a single attention value, respectively, in the imaging.
Then, the mean value of
and
are set as the new threshold
, namely, the following:
Finally, we repeat the above two steps. After ten iterations, the difference between the thresholds before and after an iteration varies within 1%, and the final threshold, , is obtained. In this experiment, two types of iteration thresholds are used for the segmentation. The first threshold is achieved from all the data collected in the experiment, which can help present the outline of ceramic relics. After the first threshold is obtained, all the data are divided into two groups. The data in one group are above the threshold with the data in the other group below the threshold. We use all the data above the first threshold value as the new database to solve the second threshold value. The process of calculating the first threshold is repeated according to Equations (13)–(15) to obtain the second threshold, which can make the internal structure of the ceramic container more noticeable. The advantage of the iterative threshold segmentation imaging method is that it can make people more intuitively acquire the information of ceramic relics as well as their interior structure from the imaging pictures, and can effectively reduce the interference of the external noise.
Nonetheless, in the process of the cultural relic inspection, only clear images are not sufficient. It is key to accurately identify the images to further protect and exploit the valuable information inside the cultural relics.
There are already many different classification and recognition algorithms that have been widely applied in various areas. In 1992, L. Li et al. adopted a dynamic feature selection algorithm for word recognition [
32]. In 1999, Sung-Hyuk Cha et al. proposed an approximate stroke sequence string matching algorithm for character recognition and analysis [
33]. In 2013, Xiao-Jie Jin et al. reported a classification-based segmentation algorithm with stroke deletion to achieve visual gesture character string recognition [
34]. However, although these algorithms can efficiently recognize characters, words, and simple symbols, they have many limitations in recognizing complex images, such as the internal structure of ceramic containers discussed in this study. In contrast, a neural network has the advantages of high efficiency and high reliability and can classify and recognize complex images. Therefore, based on the iterative threshold segmentation method, this study uses a neural network to further judge and optimize the results of the image.
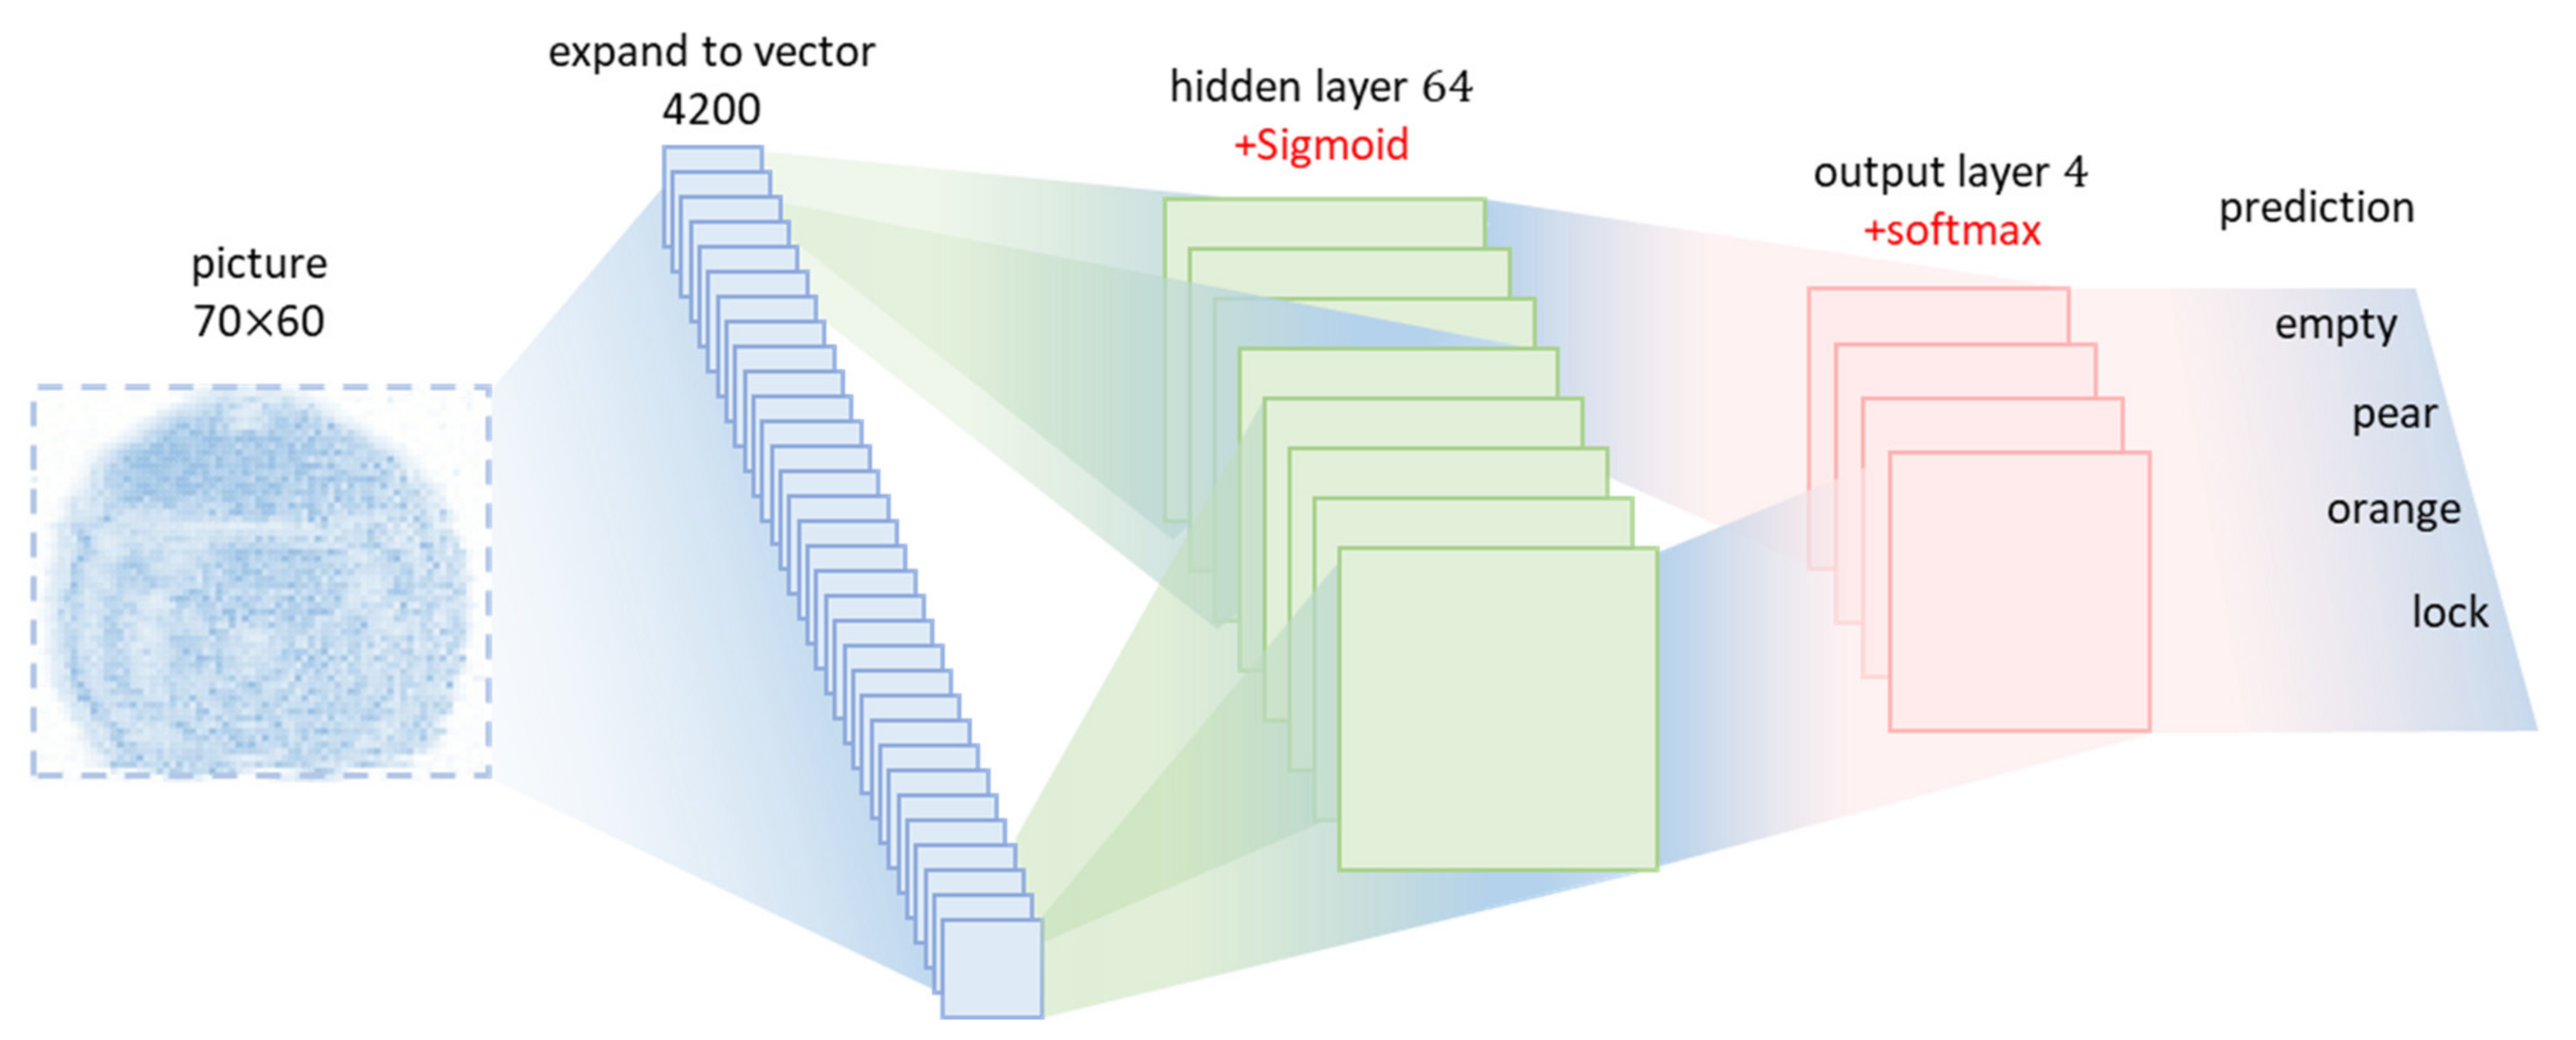
Figure 5 shows the structure of the neural network adopted in this study.
3.2. Neural Network Image Recognition
The image pixel in this study is 70 × 60, and a feedforward neural network is used in this study.
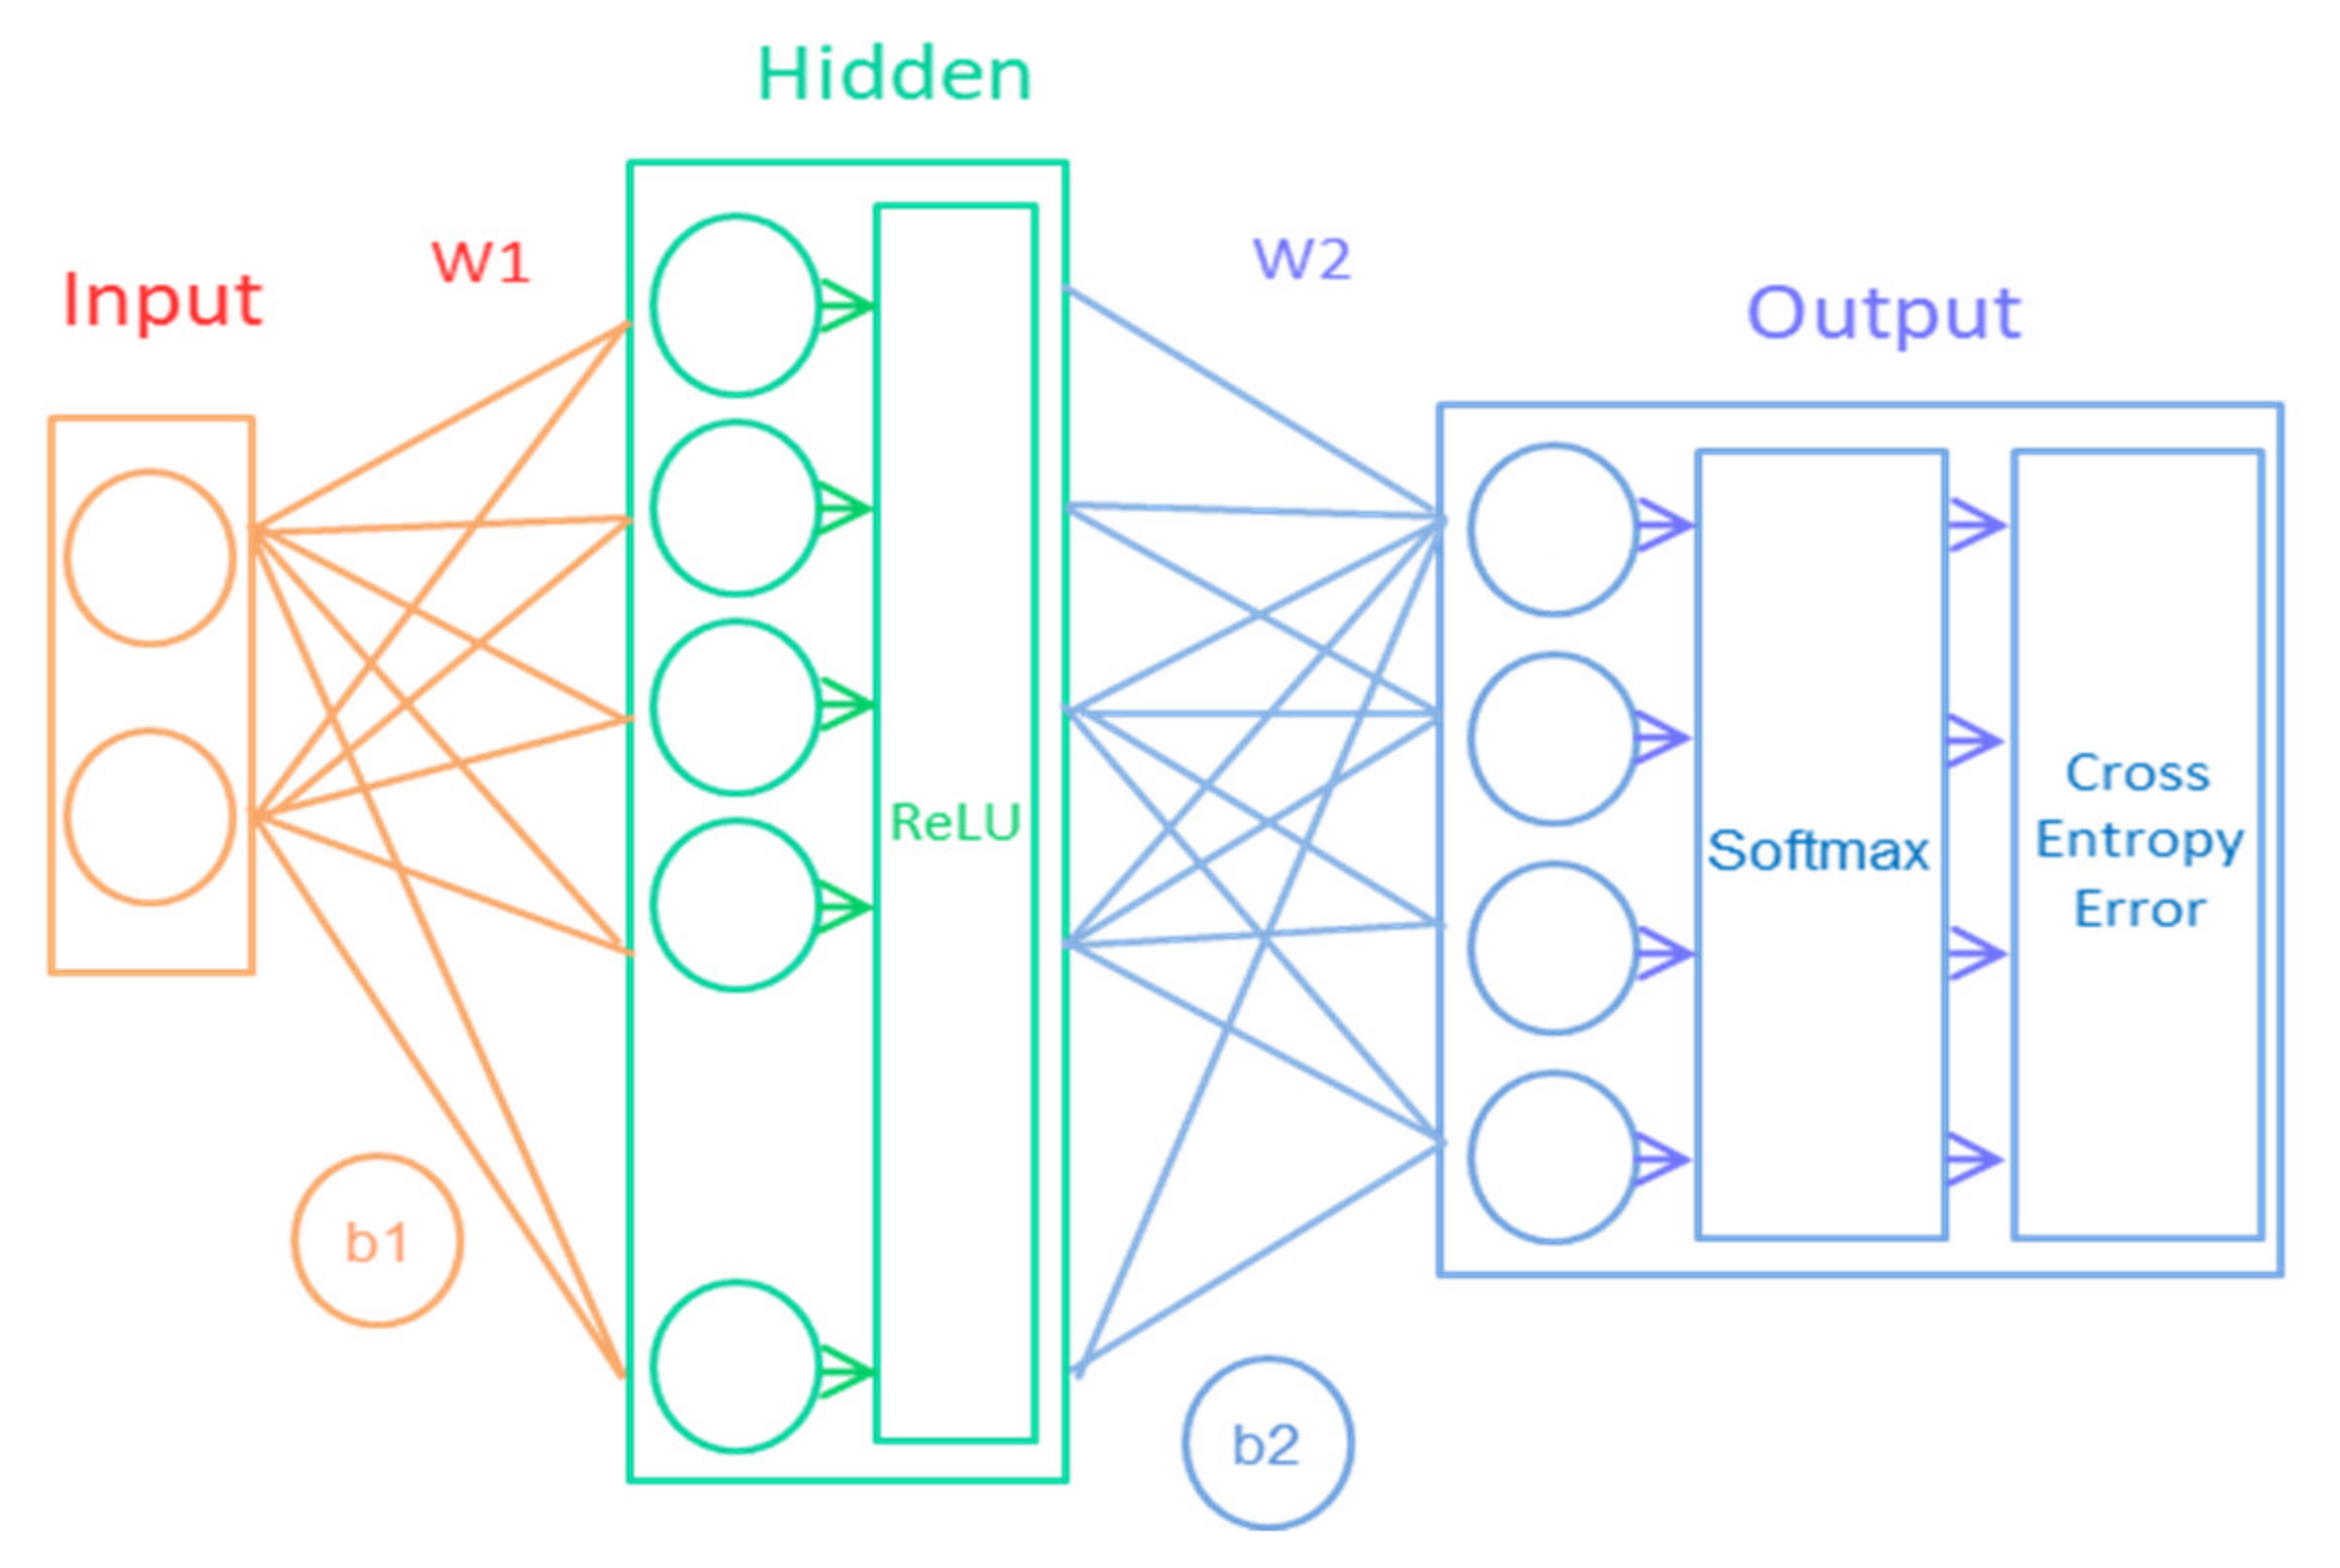
Figure 6 outlines the basic structure of the feedforward neural network. The input layer is the amount of input data required, which is followed by the hidden layer, and the mapping relationship of these two layers can be expressed as follows:
The input value
X is converted to neuron
H by matrix multiplication, where
W1 is the coefficient matrix and
b1 is the offset matrix. The size of the coefficient matrix is determined by the number of inputs and neurons. For example, if the input matrix is 1 × 2 and the number of neurons is 50, then the matrix size of
W1 is 2 × 50. The mapping from the hidden layer to the output layer can also be expressed by the following equation:
Since the operation of a series of linear equations can be expressed by a single linear equation, the fitting ability of multi-layer neural networks cannot be improved without adding nonlinear activation functions. Sigmoid is used as the activation function in this study. The output value Y is a matrix. The results can be judged by the values in the matrix, but such results are often vague and need to be normalized. The calculation formula of normalization is as follows:
The resulting matrix is called the “Softmax” layer. To obtain a measure of the outcome, the “cross-entropy loss” approach is used, where we take the negative logarithm of the probability of the output. The closer the predicted probability value is to 100%, the closer the “cross-entropy loss” result is to 0, and the better the prediction performance of the neural network is. Neural networks need to iterate over and over again. When the data are obtained through the neural network for the first time, and the cross-entropy loss is calculated, the loss value will be propagated back to make the corresponding changes to W and b. Then, the second operation makes the prediction probability closer to 100% compared with that of the original, and the loss will be smaller as well. This course will iterate several times until the expected value is reached.
Different types of neural networks have already been used in various applications. In 2010, Guohuan Lou et al. applied the best-pick algorithm of neural network in the identification of the temperature of the shaft furnace [
35]. In 2013, Shujuan Li et al. achieved printing parameters’ optimization for 3DP based on a neural network and genetic algorithm [
36]. In 2015, Imen Abroug et al. proposed a kind of planar multi-classifier modeling neural network for face recognition [
37]. Concerning the above neural network design, we devise a neural network suitable for the nondestructive testing system of ceramic cultural relics in this study.
As shown in
Figure 5, the feedforward neural network used in this study uses only one hidden layer, which has 64 independent neurons. The neural network used in this study is relatively simple compared with other types of image recognition neural networks [
35,
36,
37], but it still has excellent image recognition ability. Simultaneously, the neural network can realize the identification of the internal structure of the ceramic vessels within 10 s because of less computation, which is very suitable for the preliminary reference of the internal structure of the ceramic containers.
4. The Hardware Implementation
A 0.2-terahertz wave was employed to conduct the transmission imaging experiment. Due to the existence of polar gases, such as the water vapor in the air, the terahertz wave in a specific frequency, will have a large degree of attenuation in the air. The measurements show that, in the laboratory environment, the air has the most obvious attenuation effect on the terahertz wave at the frequency of 0.18 and 0.12 THz. At the frequency of 0.16 and 0.2 THz, the attenuation of the terahertz wave caused by air is the least, while the signal generated by the signal source is the most stable. Considering that the higher the frequency of the terahertz wave is, the shorter the wavelength is, and the higher the accuracy of the imaging inside the ceramic is, the 0.2-terahertz wave was finally adopted in our devised experiment.
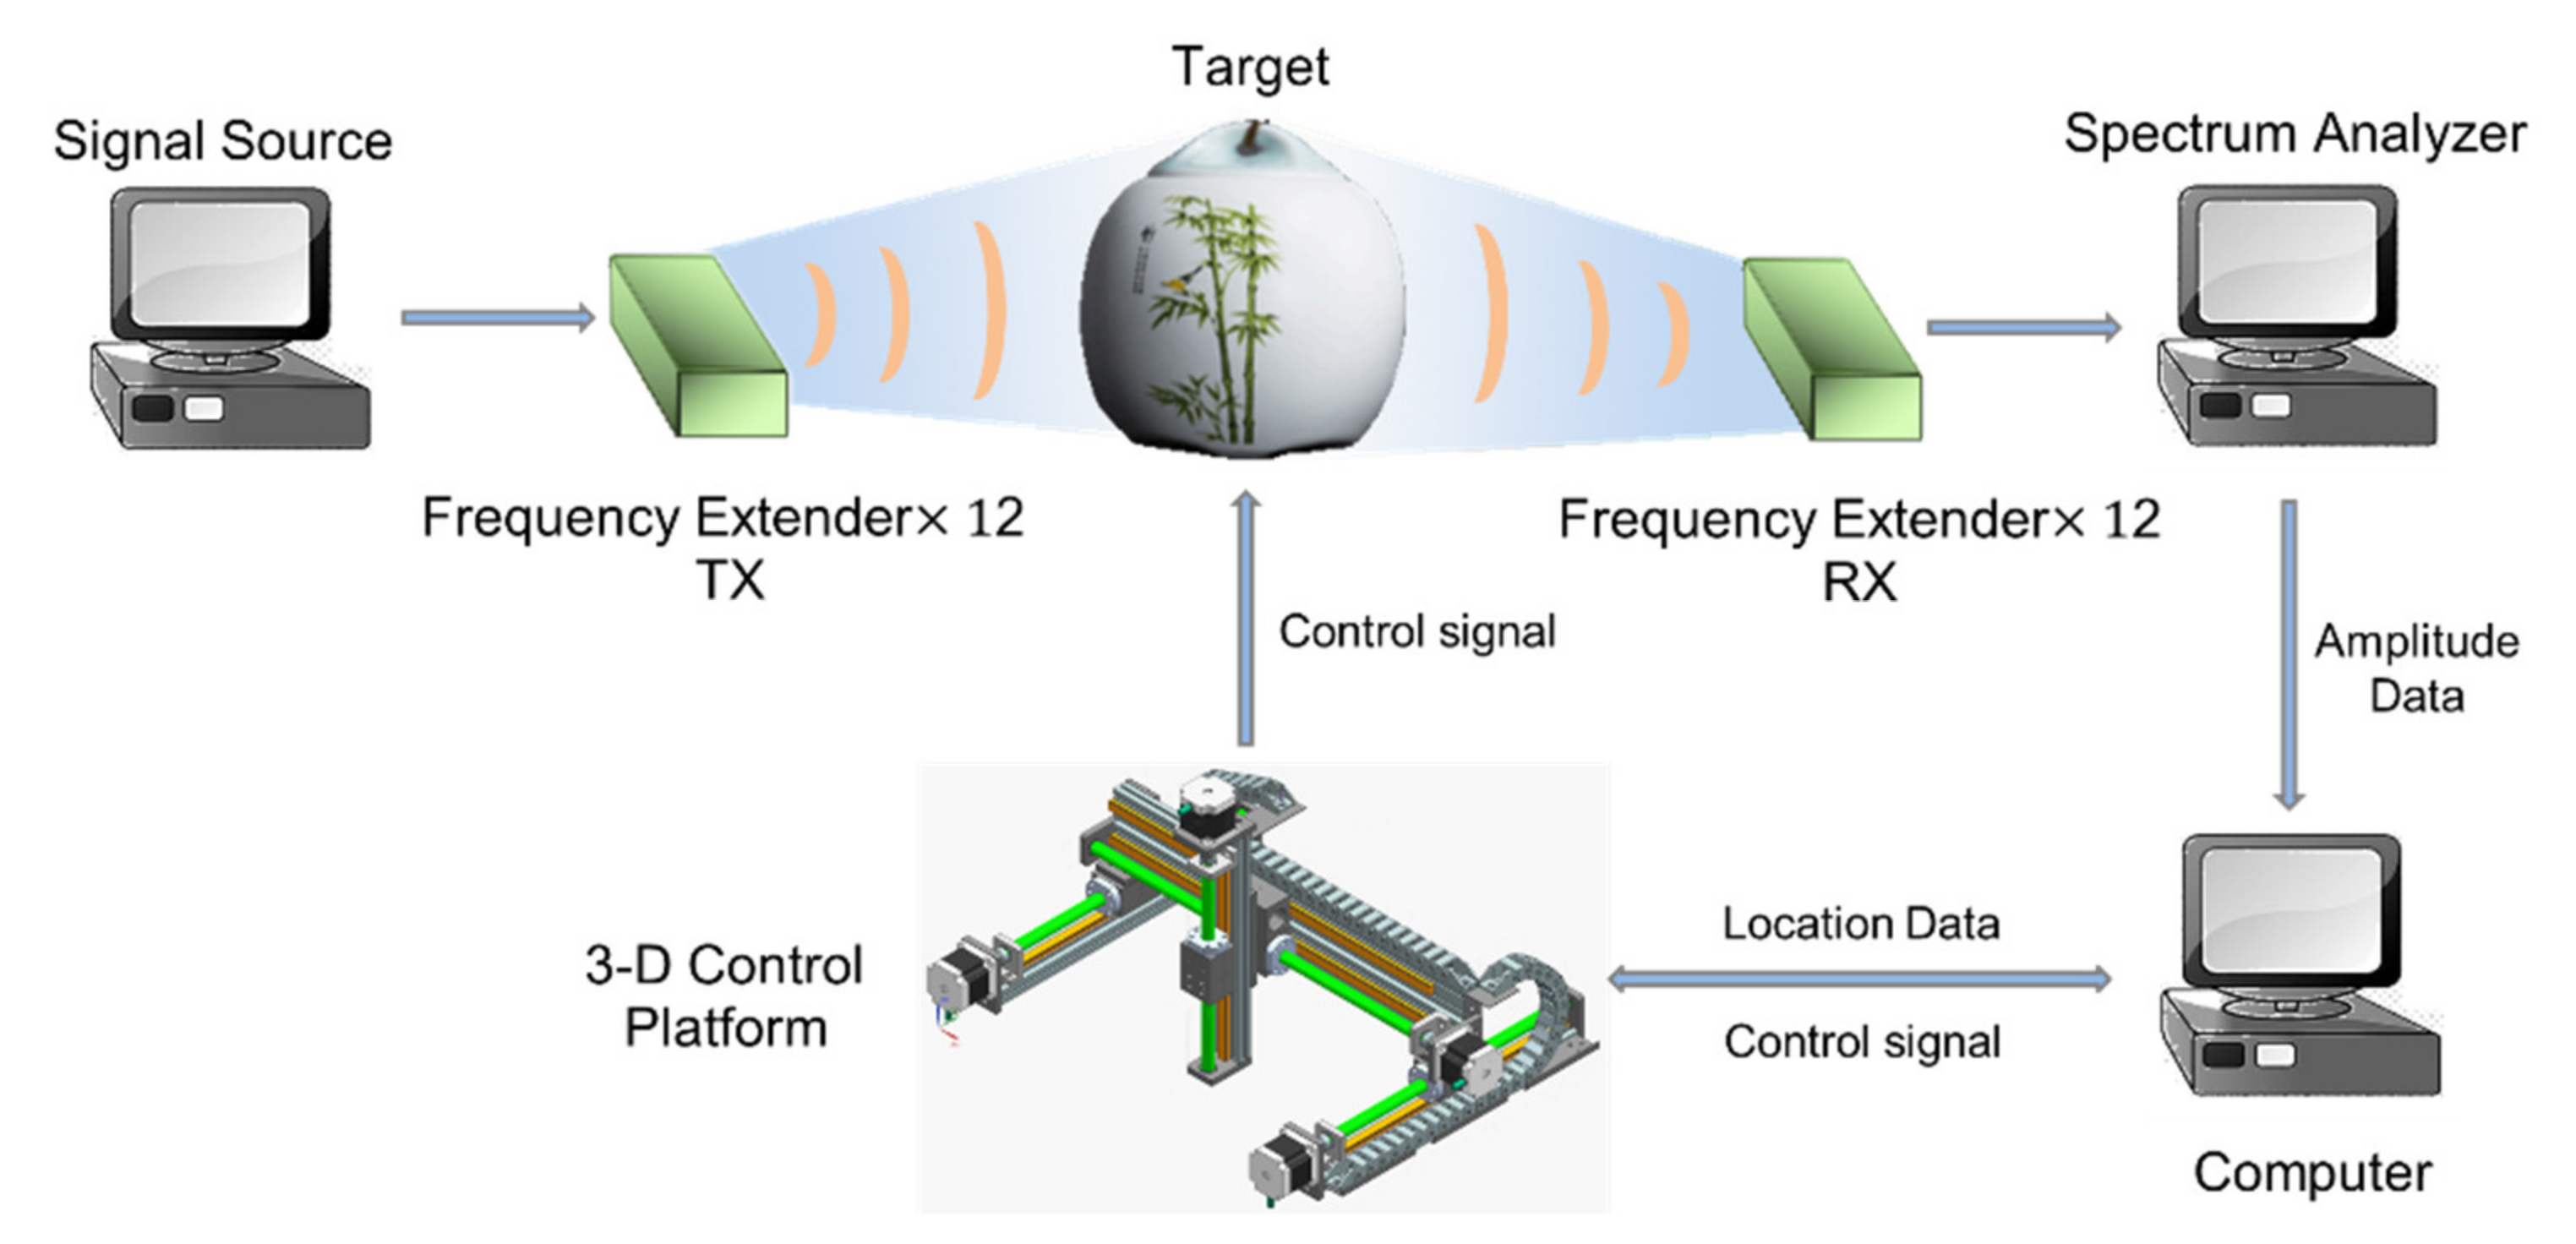
Figure 7 shows an illustration of the test system. The spectrum instrument used in the experiment is Keysight N9040B (Keysight, Santa Rosa, CA, USA), its frequency extender device is Keysight N9029AV05 (Keysight, Santa Rosa, CA, USA). The signal source used in this experiment is Keysight E8257D (Keysight, Santa Rosa, CA, USA), and its frequency extender device used is Keysight E8257DV05 (Keysight, Santa Rosa, CA, USA). The distance between the signal source and the signal receiver is 15 cm. The resolution of the image can be up to 2 mm. In this experiment, the frequency and amplitude of the transmitted terahertz waves from the signal source can be adjusted. The frequency of the signal source is set at 0.2 THz, and the signal amplitude of the signal source is set at 5 dBm. By changing the position of the ceramic container, the transmission attenuation of different positions of the ceramic container is measured. The AMC4030 three-axis controller (Fuyu Technology, Chengdu, China) is used in the experiment. The controller is connected with a computer to drive four motors located on the three axes X, Y, and Z so that the three-axis controller moves between the specified positions at a designed speed. Ceramic containers move at a speed of 2 mm/s. The scanning mode is a Z-scan from top to bottom. During the experimental data collection, the 0.2-terahertz signal amplitude in the spectrum analyzer was sampled in seconds, and finally, we obtain the transmission image of the ceramic container with the pixel of 70 × 60 in the area of 14 cm × 12 cm.
When we set the signal frequency at 0.2 THz, the 5-dBm signal amplitude and the 15-centimeter distance between the signal source and the receiver, if there is no other object between the signal source and receiver, the amplitude of 0.2 THz waves is −48 dBm. There are other objects between the signal source and receiver, the amplitude of 0.2 THz shown on the spectrum analyzer will have different degrees of attenuation according to the physical shape and chemical material of the objects. The different 0.2-terahertz signal amplitude corresponding to the measured ceramic container at different locations is collected, and the transmission imaging image inside the ceramic container can be formed after data processing.
Figure 8 shows the constructed test system in our experiment.
5. Experimental Results
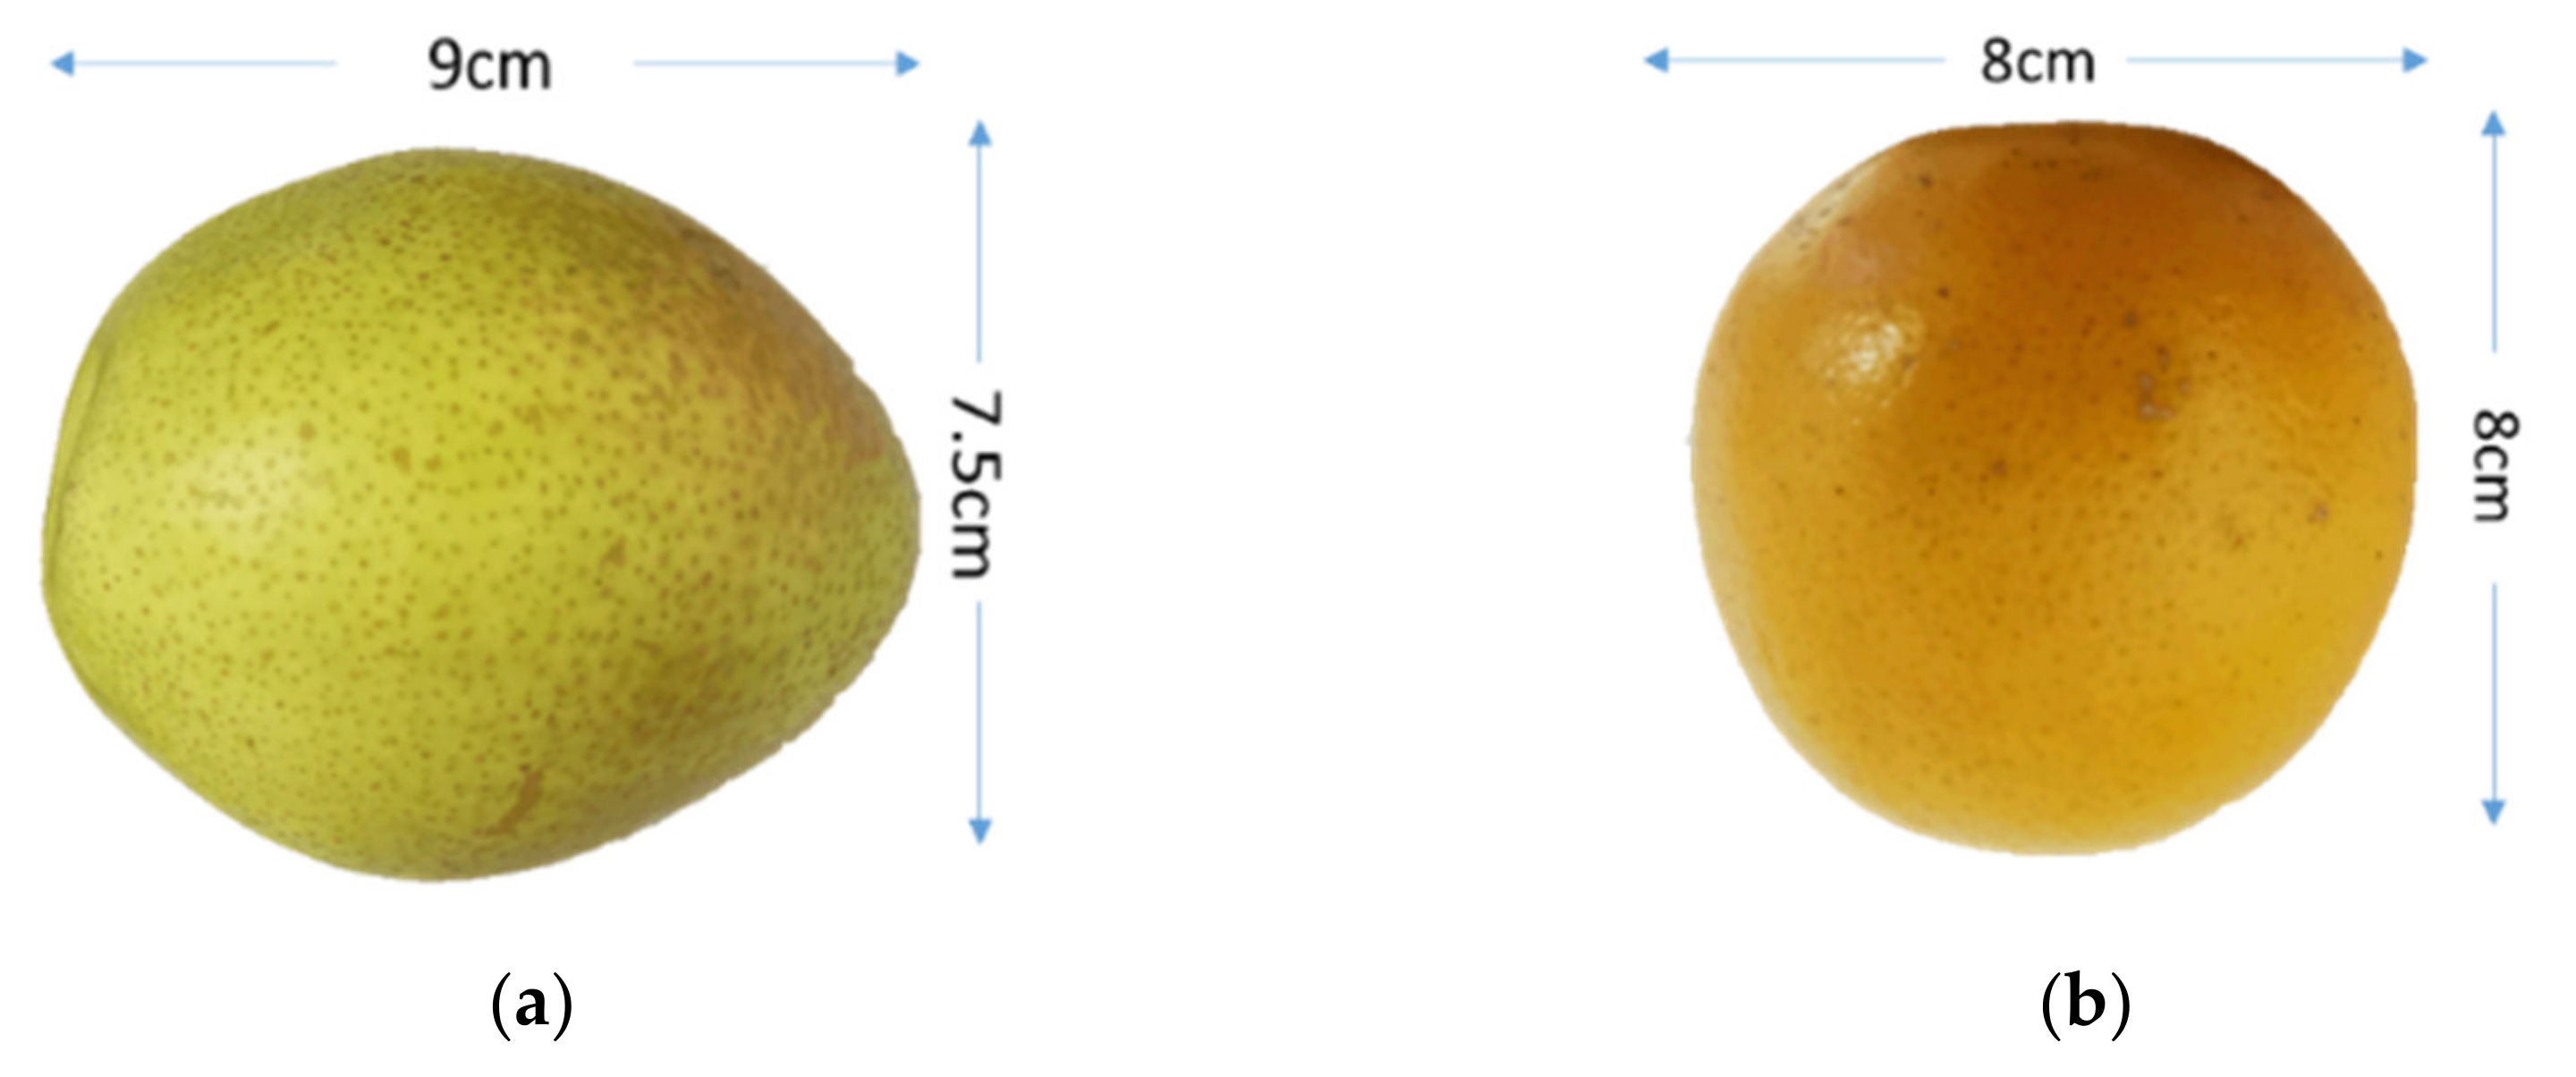
To prove the prediction accuracy of our proposed imaging system, we set the ceramic containers under four conditions, namely empty pottery, pottery with pears, pottery with oranges, and pottery with iron locks. The three items, pears, oranges, and iron locks, are representative, because they have very different shapes and structures. They represent organic matter, water-bearing objects, and metallic objects that may be present in ceramic relics. Therefore, the imaging of the ceramic containers under four conditions can effectively reflect the imaging quality and recognition ability of the proposed system. The size of the empty ceramics, pears, oranges, and iron locks is shown in
Figure 9.
Based on the attenuation of the terahertz waves collected at different locations in the ceramic container,
Figure 10,
Figure 11,
Figure 12 and
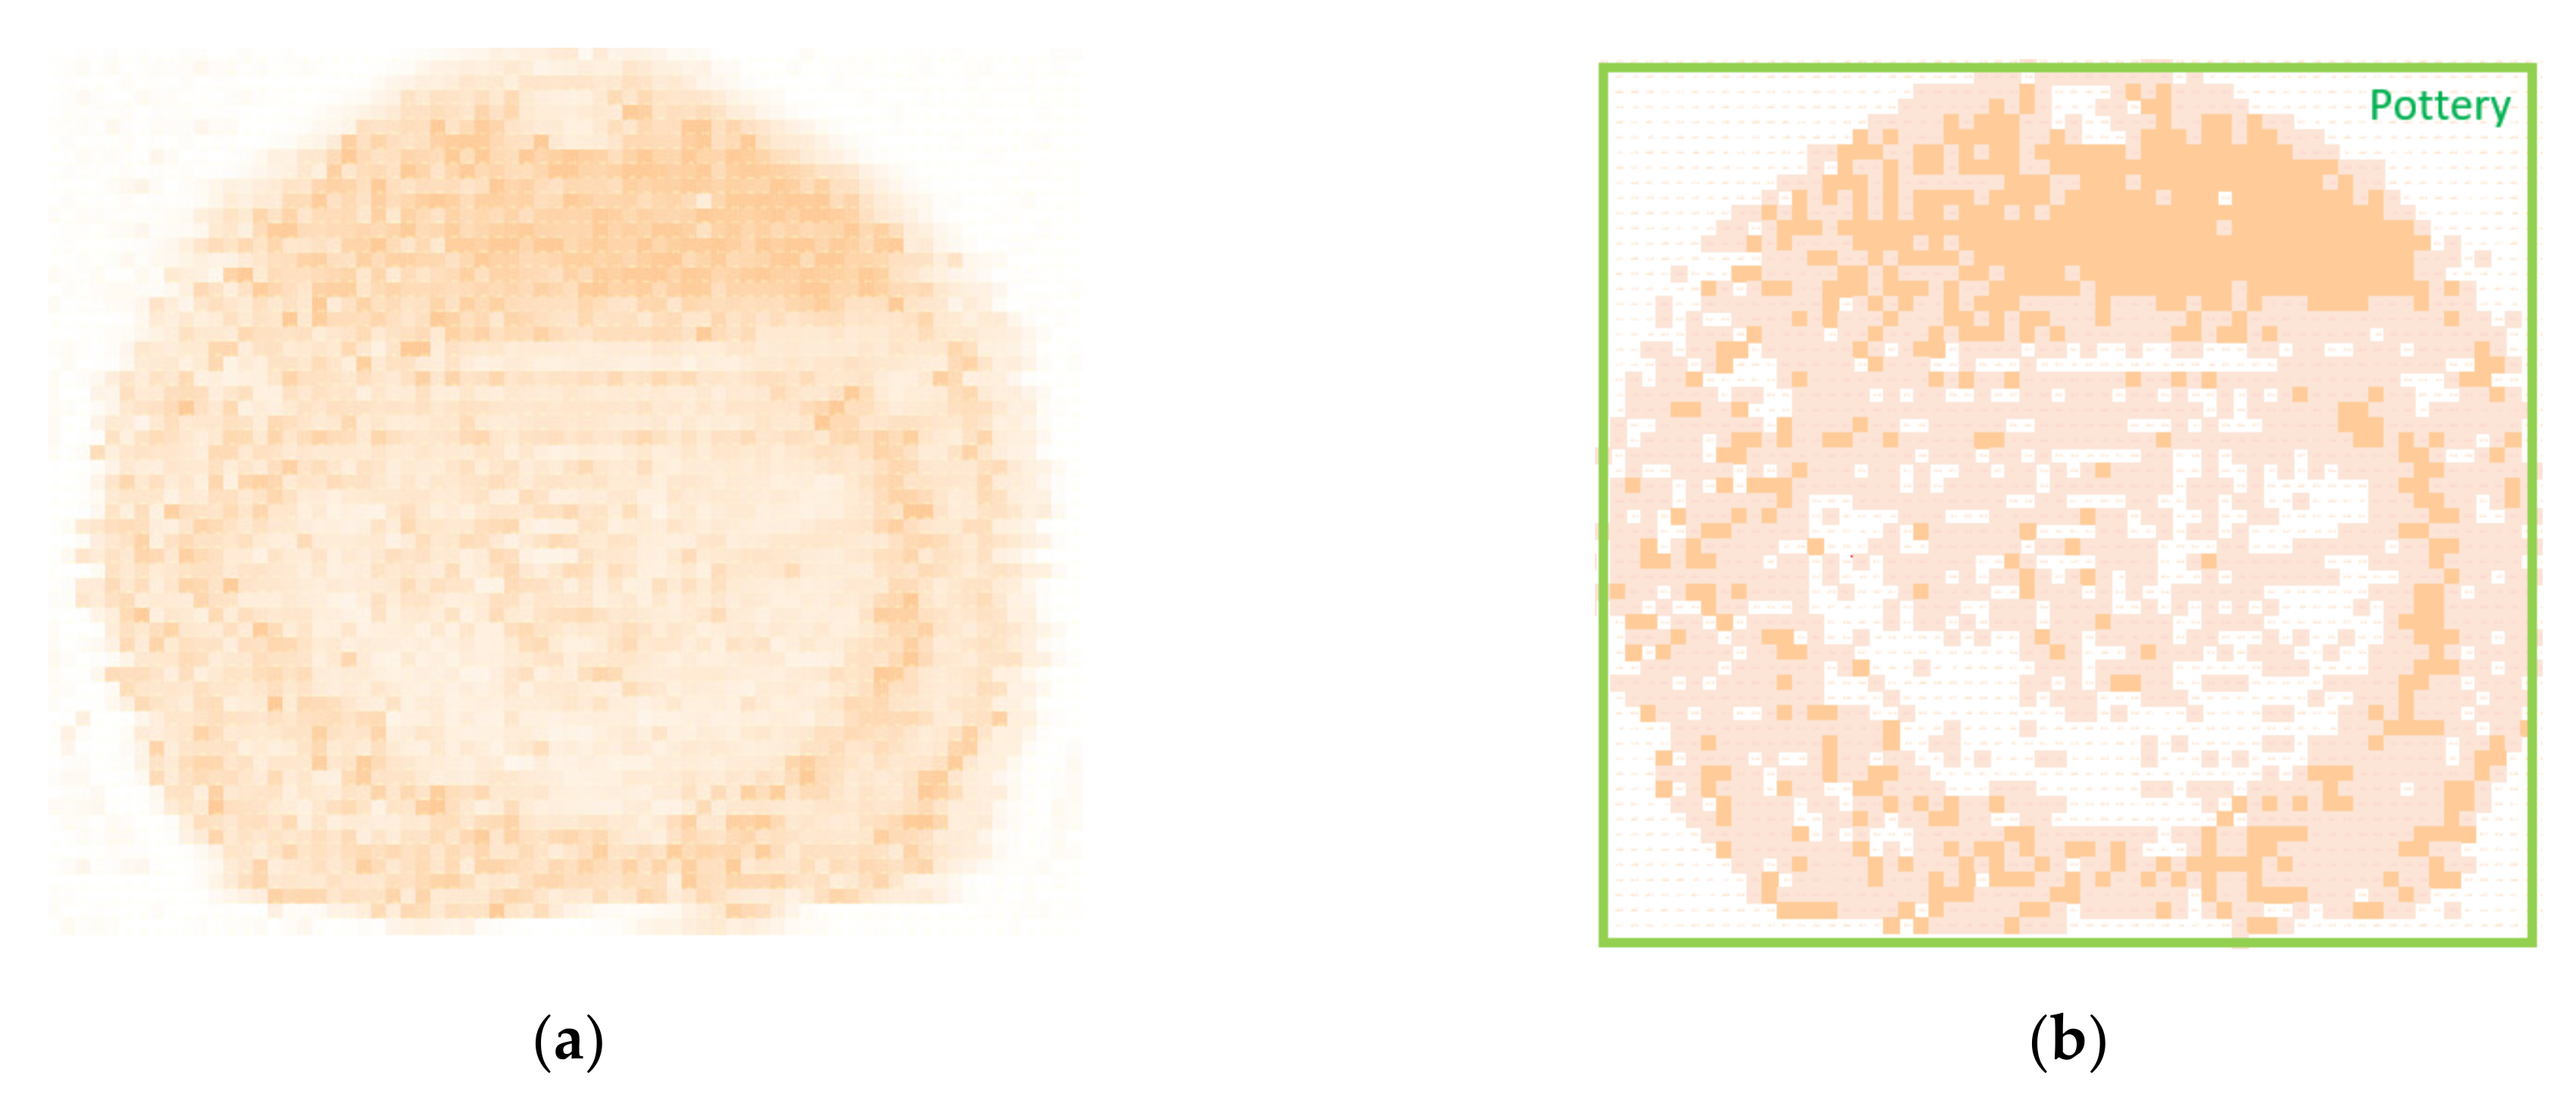
Figure 13 show images of the potteries under four different conditions. All four images are obtained from the same pottery with a length of 12.4 cm, a height of 11.9 cm, and an average wall thickness of 0.5 cm. Each color block in the image reflects an active area of 2 mm × 2 mm.
Figure 10a shows an image of the pottery detected when no other material is stored inside. According to the experimental image, the pottery has a rough length of 13.2 cm and a width of 12 cm, which is slightly larger than the actual size. Inside the pottery, there is an extraordinary dark circular area. Referring to the above mathematical analysis, from the edge of uniform pottery to its interior, the tangential thickness of the pottery should be increasingly thinner, thus the color of the experimental image from the edge to the interior should be from dark to light. The obtained image does not agree with the theory. The reason for this phenomenon is that the thickness of the circular pottery is not uniform in all the positions. At one point, the thickness of the section is so thick that the terahertz wave is attenuated more, indicating that there are anomalously dark ring ripples in the pottery. This is because the ceramic cover at the opening of the pottery increases the tangent thickness of the target, leading to the additional attenuation of the terahertz wave. The measured result is consistent with the actual situation.
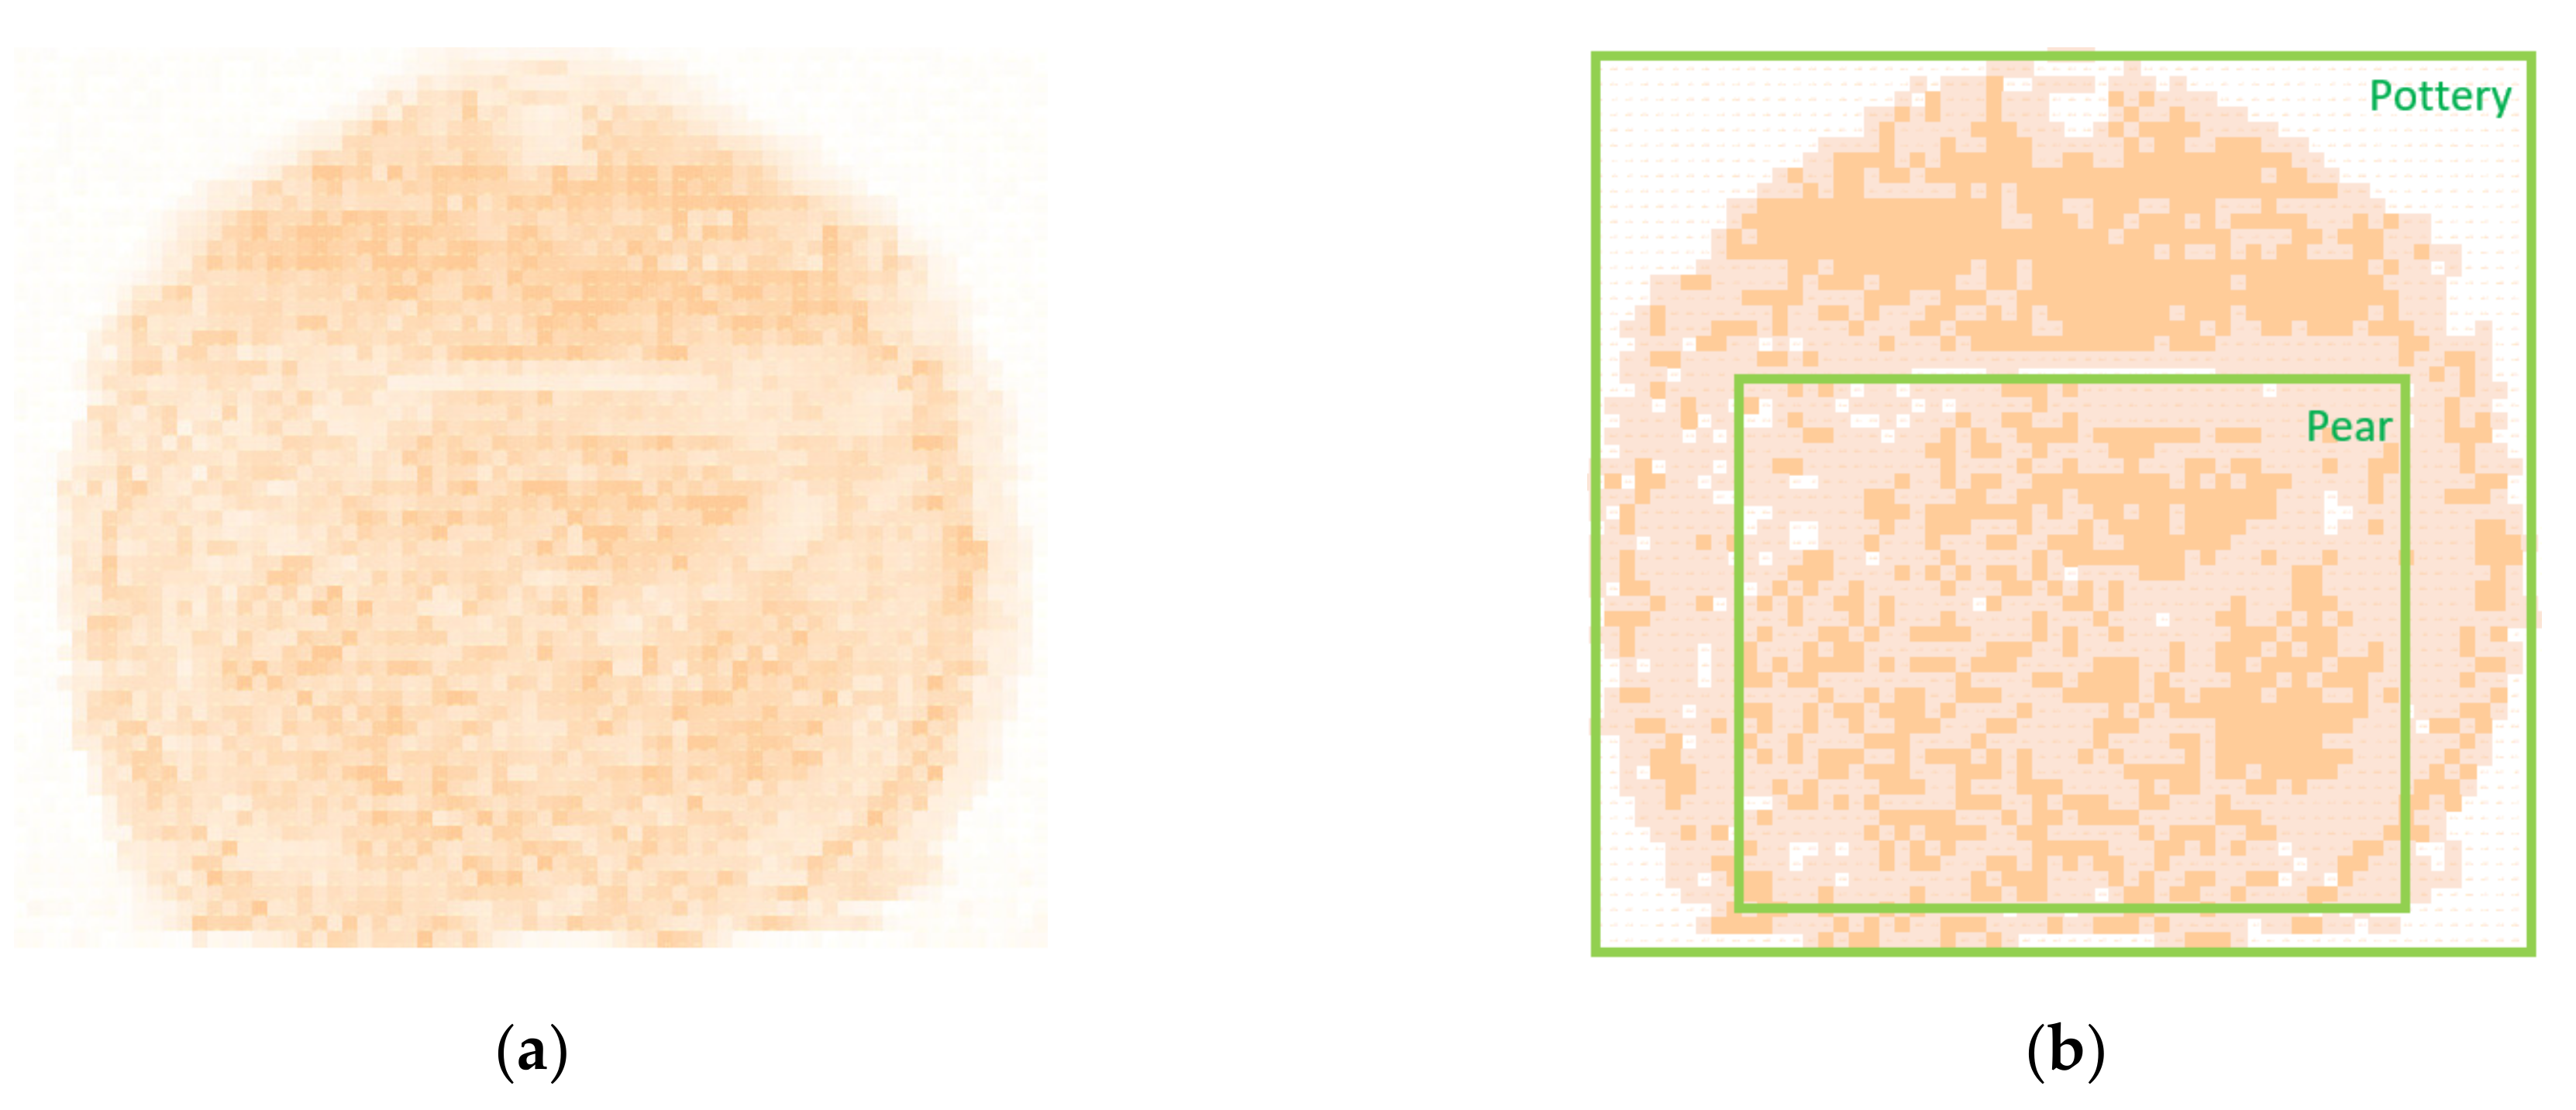
Figure 11a shows an image of the pottery containing a pear. In the terahertz-wave imaging, the pottery measures 13 cm in length and 12 cm in width, which is slightly larger than its actual size. The measured length of the pear in the pottery is 9 cm and the height of the pear is 7.4 cm, which is similar to the actual size.
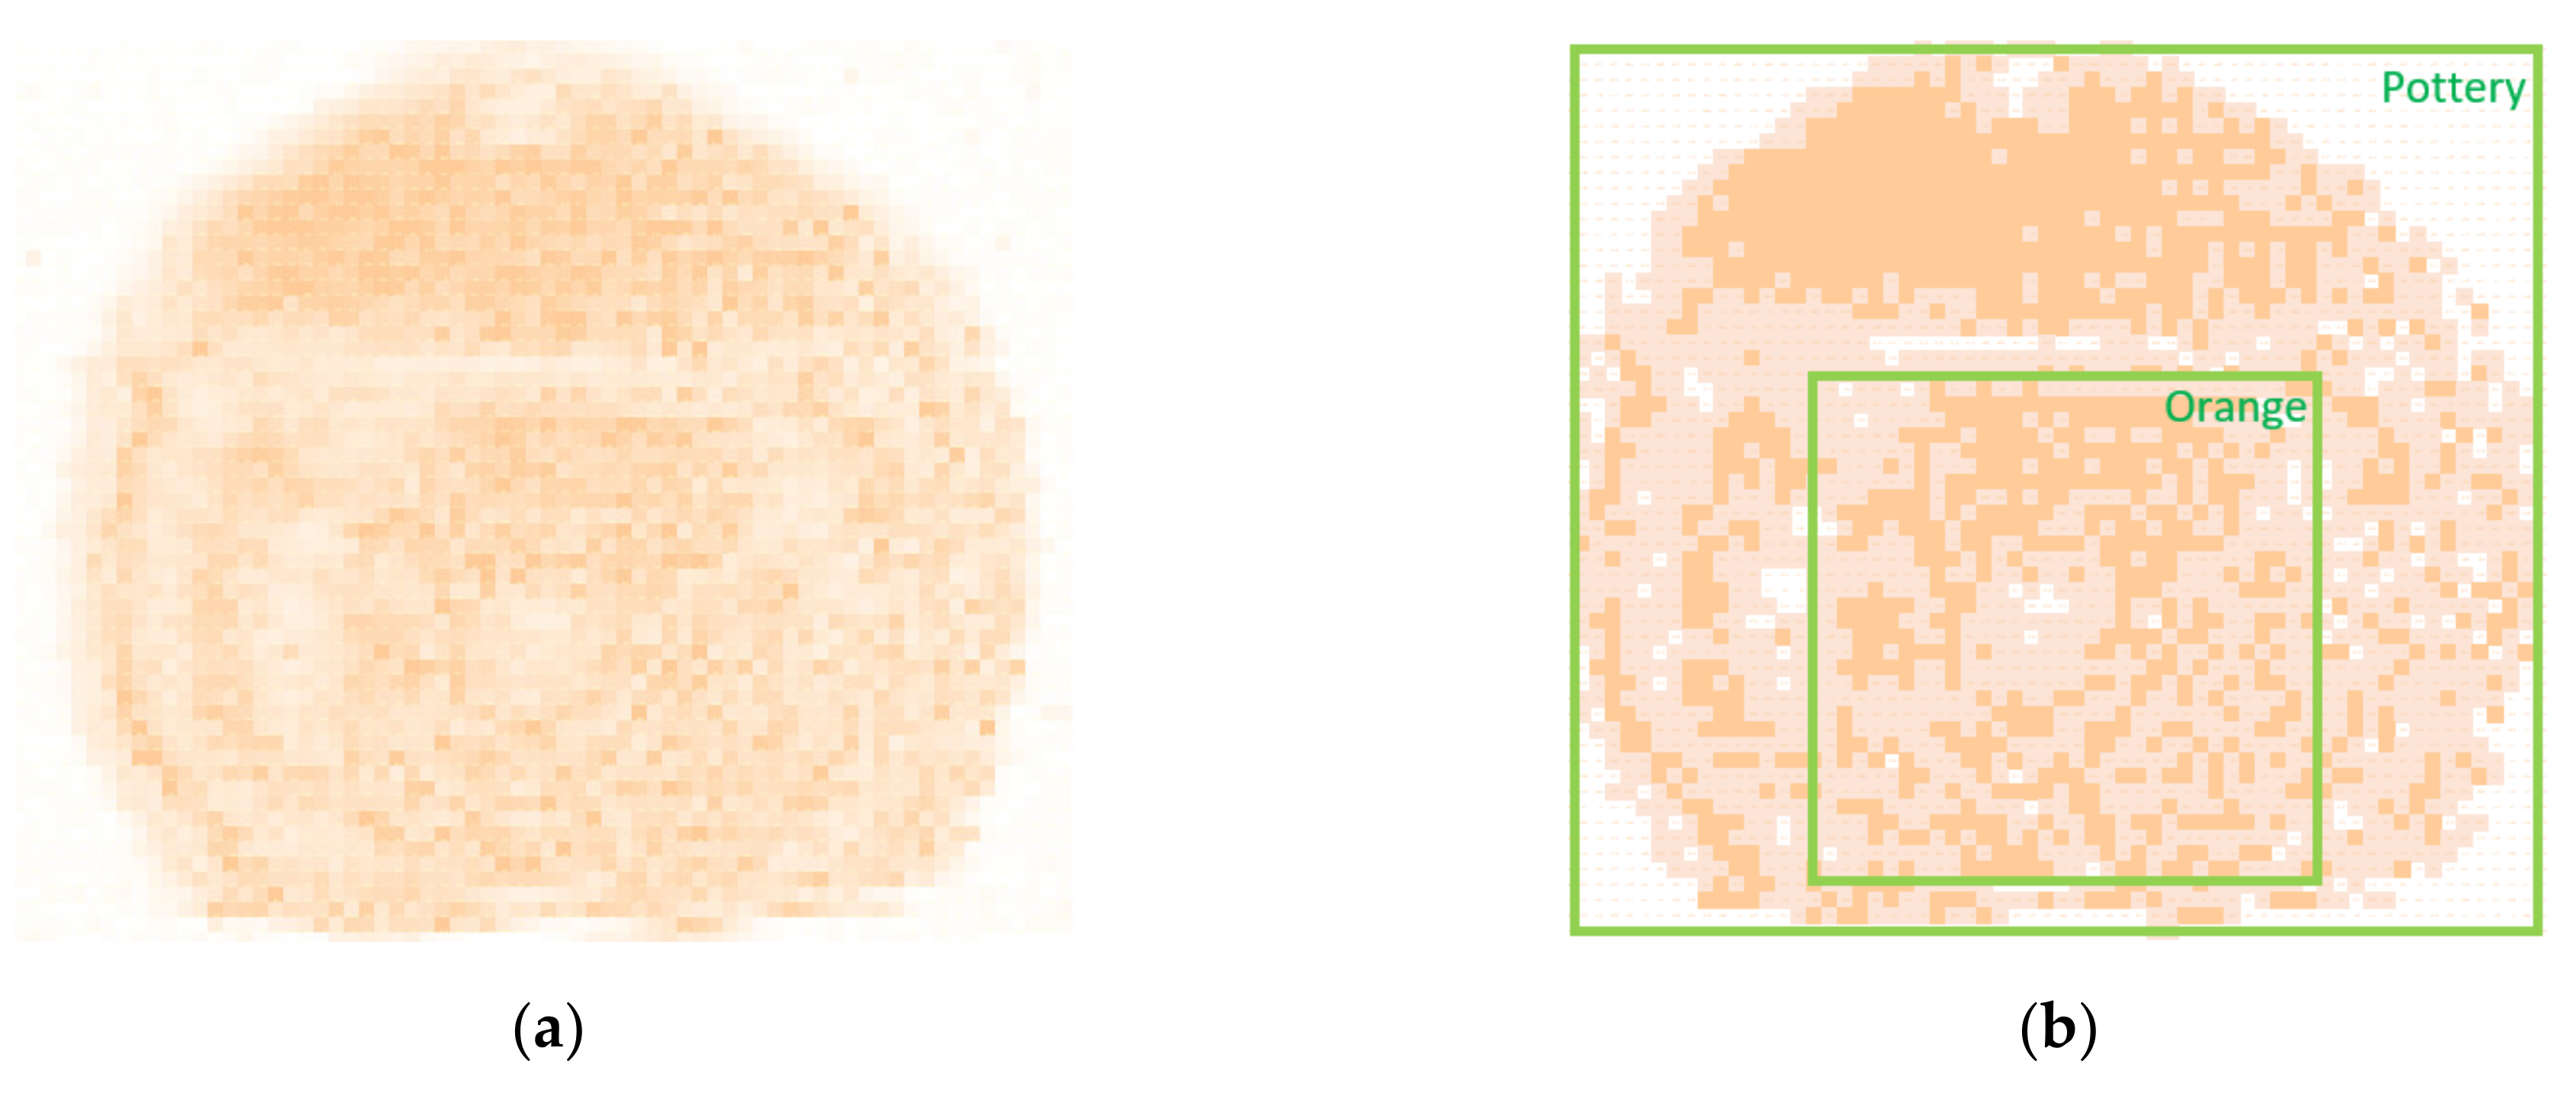
Figure 12a shows an image of the pottery containing an orange. In the terahertz-wave imaging, the pottery measures 13 cm in length and 11.8 cm in width, which is slightly larger than its actual size. By comparing the images with that of the empty pottery, it can be measured that the orange in the pottery has a length of 7.6 cm and a height of 7.4 cm, which was slightly lower than the actual value.
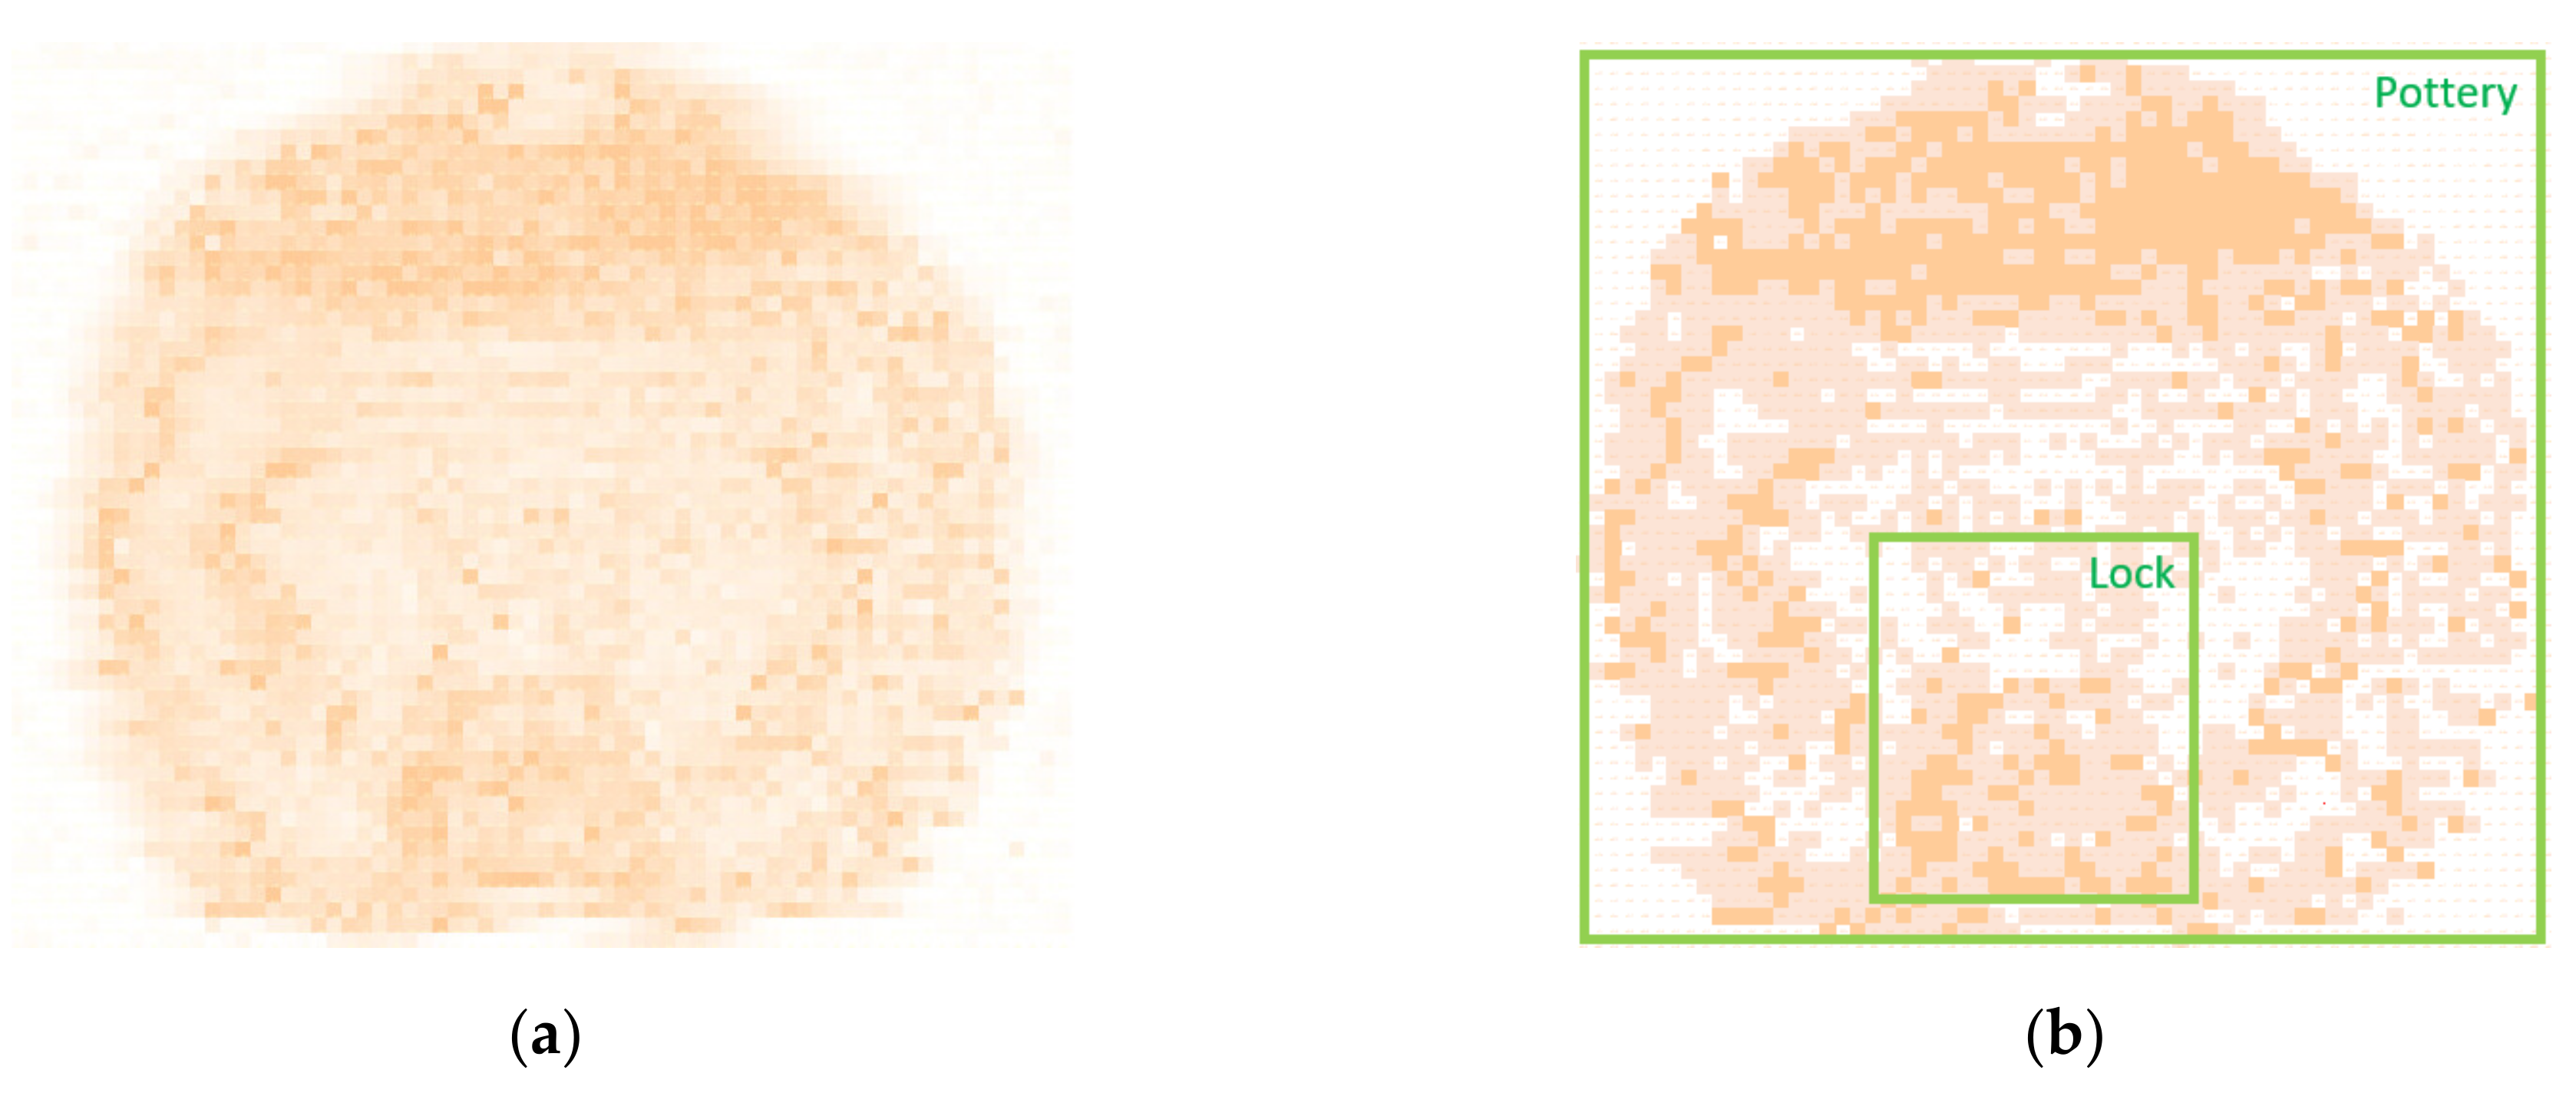
Figure 13a depicts an image of the pottery containing an iron lock. In the terahertz-wave imaging, the pottery measures 13 cm in length and 12 cm in width, which is slightly larger than its actual size. By comparing the images with that of the empty pottery, it can be predicted that the width and height of the iron lock base in the pottery are 3.4 cm and 2.2 cm, respectively, but the specific shape of the iron lock could not be accurately observed.
Throughout the four linear mapping images, the linear mapping images can better restore the detailed information of the pottery and its internal structure. However, the common error is that the measured size of pottery is greater than the real one. The reason for this error is that the receiver is detecting the intensity of terahertz waves coming from all directions in the experiment. When the pottery is close to the signal generator and receiver, even though the terahertz wave propagation is not directly blocked by the pottery, there is still an additional attenuation of the terahertz wave due to the reflection and absorption of the terahertz wave on the surface of the pottery. We can observe a notable error if we judge the pottery and its internal composition only by the depth of the colors linearly dependent on the attenuation data in the image. Additionally, the different colors of the linear mapping imaging in each area make it hard to determine the boundary of the internal structure of the pottery.
To compensate for the shortage of linear mapping imaging, this study also uses the iterative threshold filtering algorithm to process the experimental imaging. After the first threshold filtering, the outer contour of the pottery can be seen more clearly from the image. After the re-filtering of grid points above the first threshold, the internal structure of the pottery can be figured out more accurately from the image, as shown in
Figure 10b,
Figure 11b,
Figure 12b and
Figure 13b.
Based on the transmission images after iterative threshold filtering, the width and height of the pottery are 12.2 cm and 11.6 cm, respectively, which are near to the actual values. The pear is 8.8 cm wide and 7 cm high, which is slightly smaller than the actual size. The orange is 6.4 cm wide and 6.4 cm high, which is slightly smaller than the actual size as well. The width of the lock is 3.6 cm, and the height is 4.2 cm, which is slightly larger than the actual values, while the shape of the lock is more obvious than the linear mapping.
Considering that, the iterative threshold filter helps us to reflect the edges and objects inside the pottery, the image can measure the size of the pottery more accurately. However, there were errors in the measurement of the size of the objects inside the pottery. The reasons for the errors can be summarized as follows: the shapes of the oranges and pears are similar to solid ellipsoids with thin thickness at the edges, and thus, their attenuation effect in these areas on the terahertz electromagnetic wave is not obvious. Therefore, after the iterative threshold filtering, these regions are often ignored, resulting in the size corresponding to the final imaging being smaller than the actual size. As the material of the iron lock belongs to the metal conductor, it has a strong reflection and absorption effect on the terahertz electromagnetic wave. Even if the lock is not in a straight line with the signal generator and the signal receiver, it may still block the transmission of the terahertz electromagnetic wave, resulting in a measurement size slightly larger than the actual size. Although the lock ring is made from metal, it is too thin; therefore, its attenuation effect on the terahertz wave is weak, making its imaging on the graph not obvious.
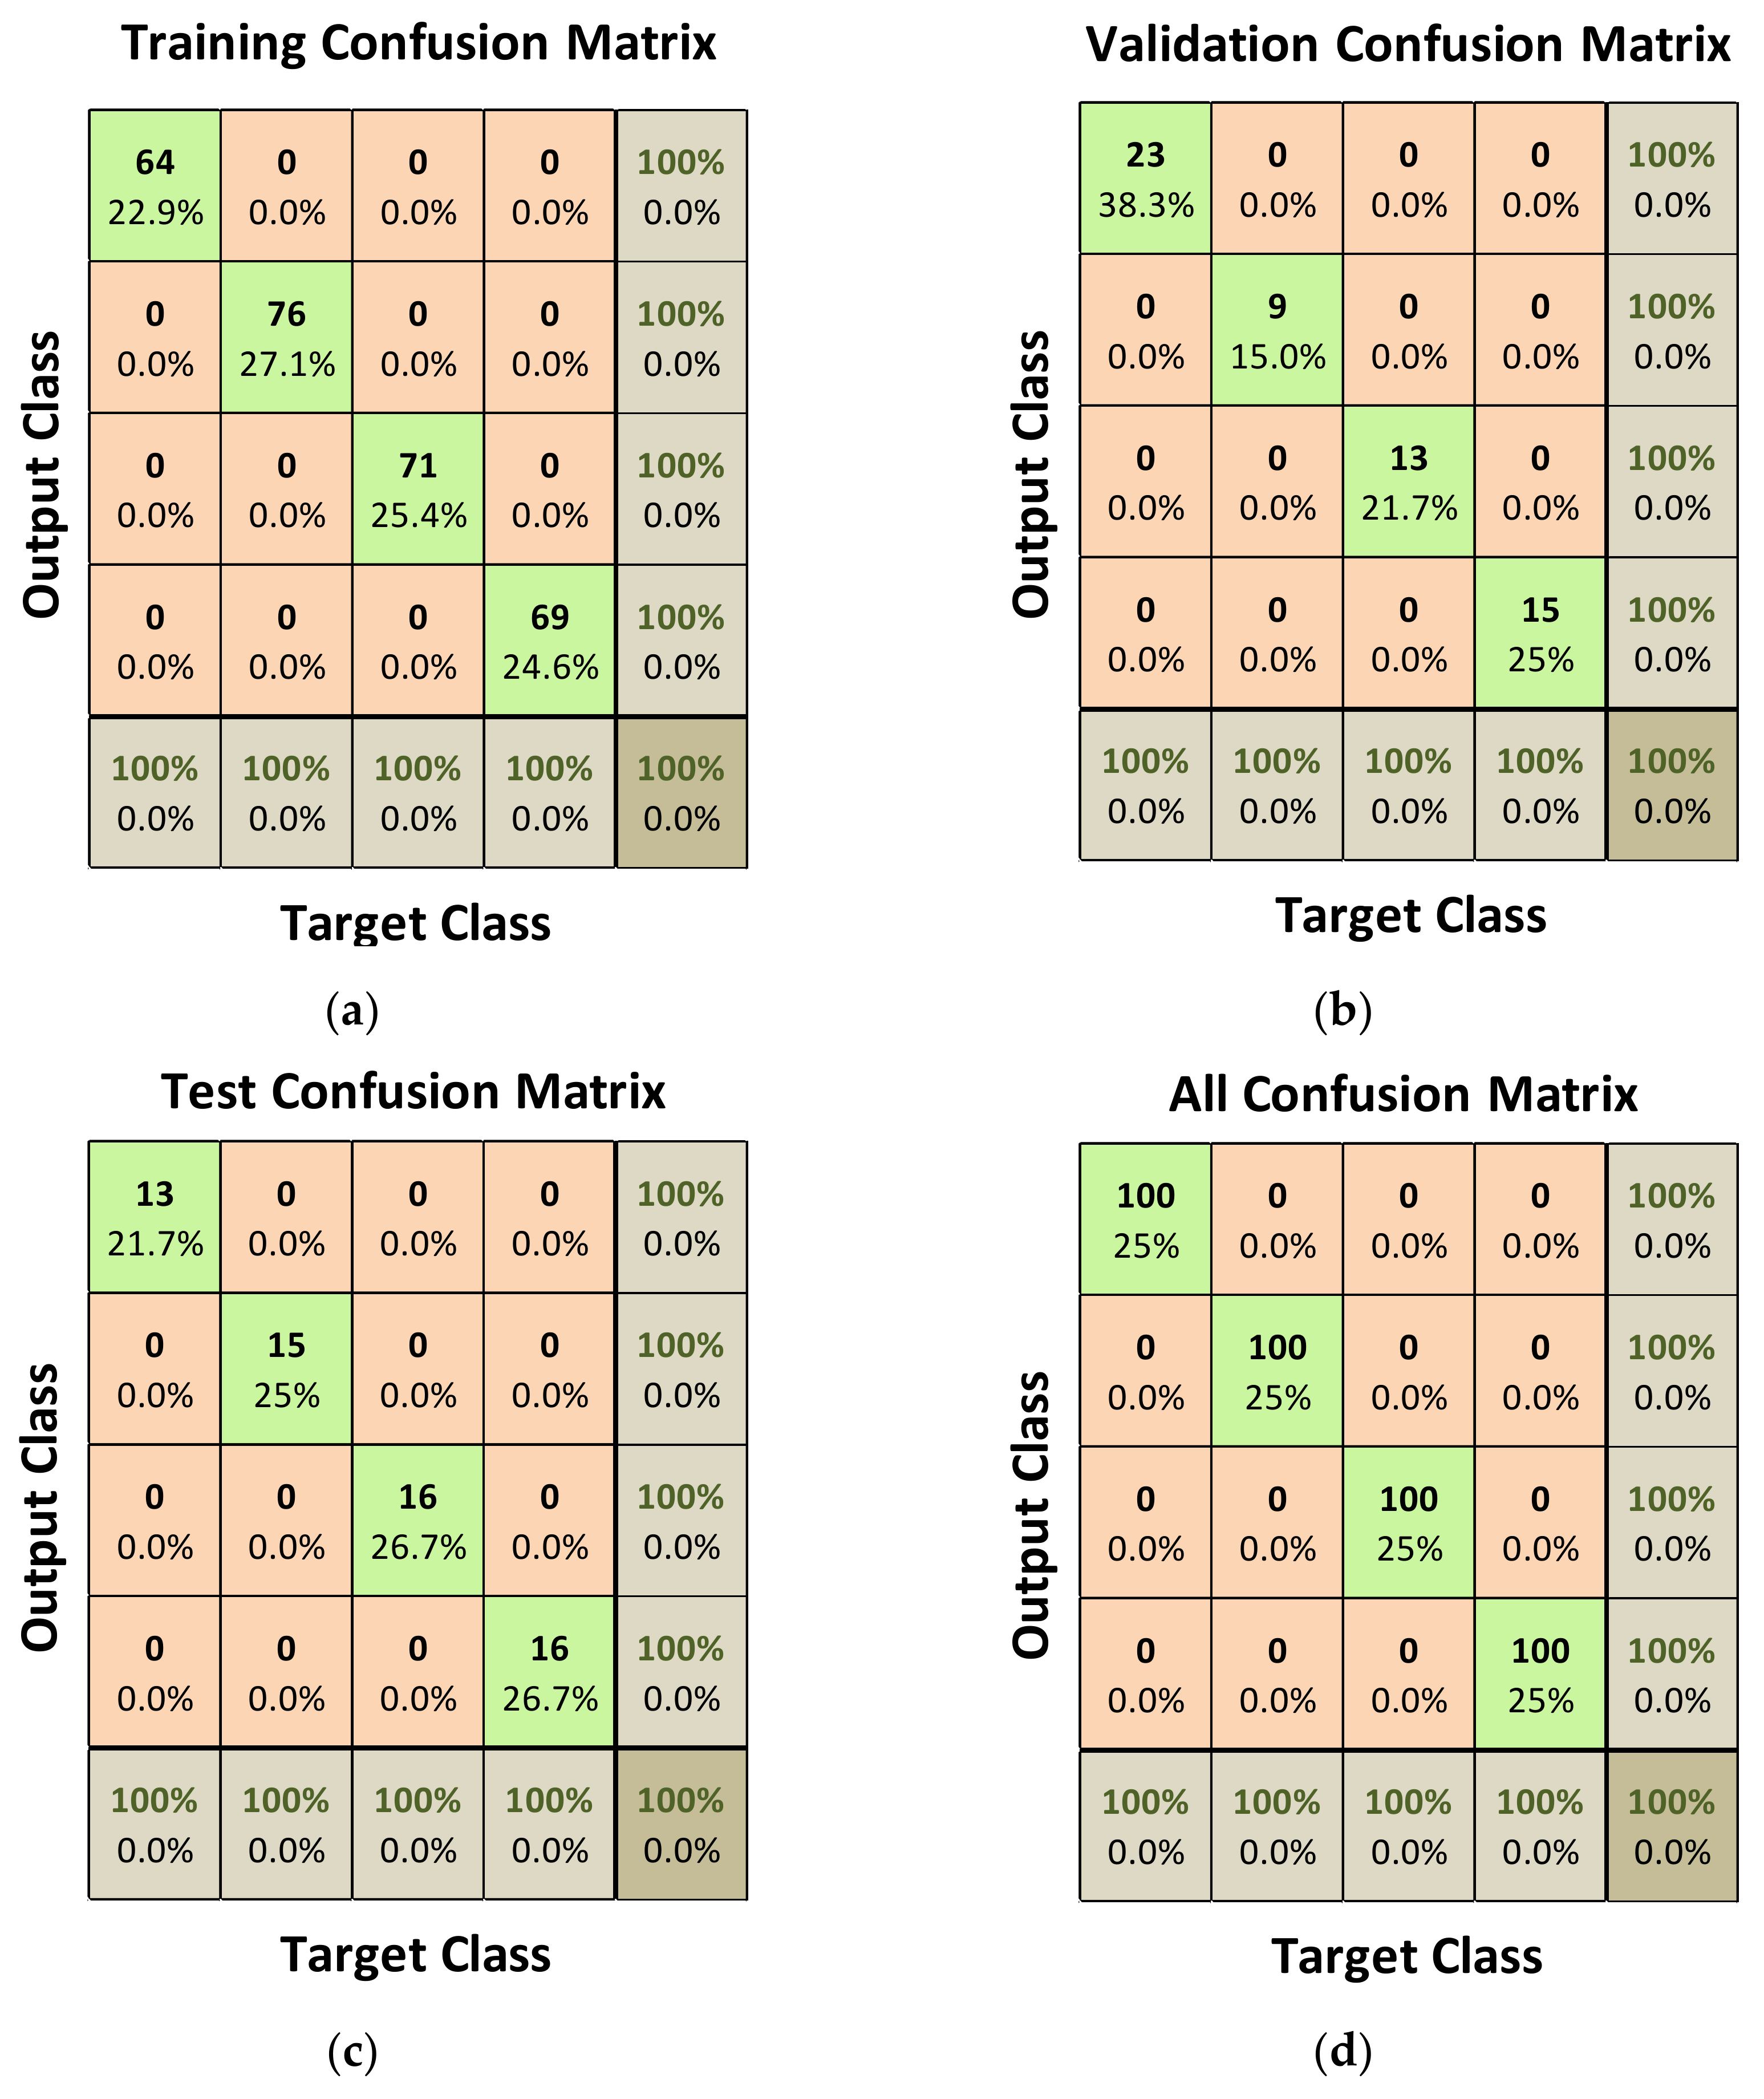
In the experiment of this study, four groups of image data are collected, namely, empty pottery, pottery with a pear, pottery with an orange, and pottery with an iron lock. Each group of the collected data in the database has 100 samples, and 400 samples are obtained. Based on the database of 400 samples, 70% of the sample set is randomly selected as the training set of the neural network, 15% as the verification set of the neural network, and 15% as the test set of the neural network.
As shown in
Figure 14, of all the 400 samples being trained, validated, and tested, their identification predictions given by the neuron network are consistent with their actual results. Thus, the neural network used in this study is excellent for the recognition of ceramic terahertz-wave transmission imaging. As plotted in
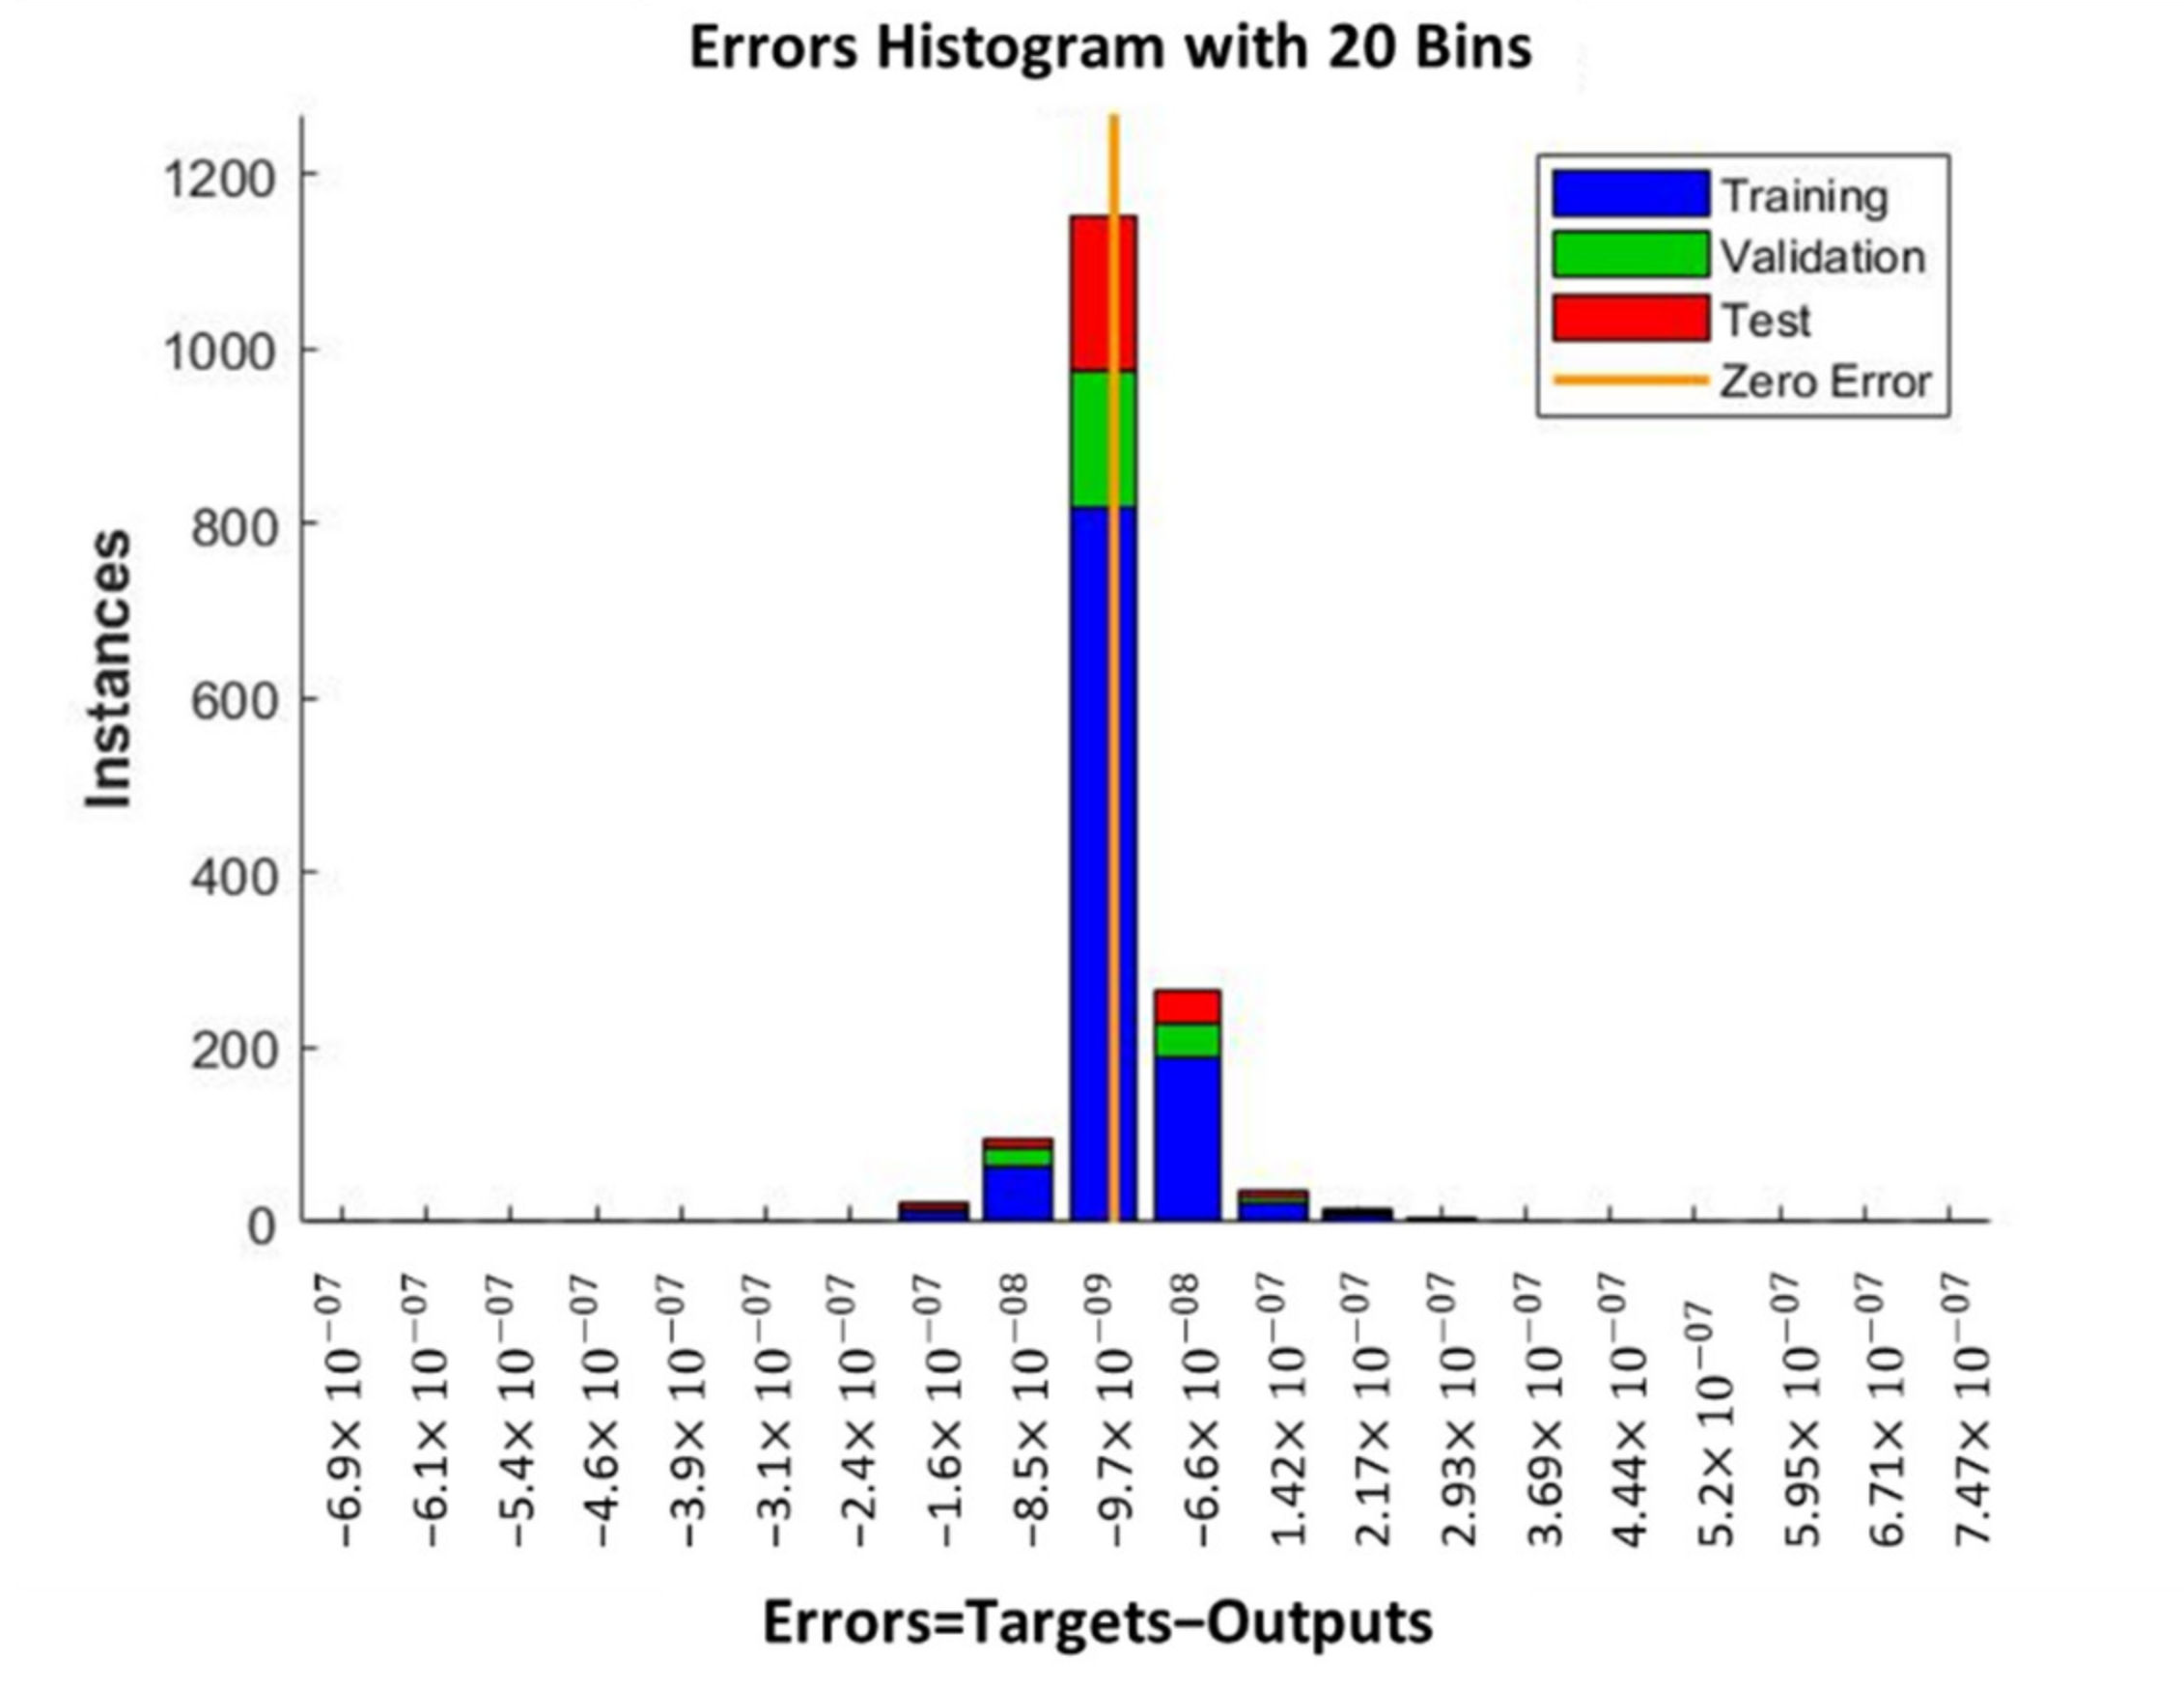
Figure 15, the output of the neural network agrees with the actual result. Though the output of the neural network is slightly greater than the result, given that the difference is very small, there is no need to increase the number of neurons.
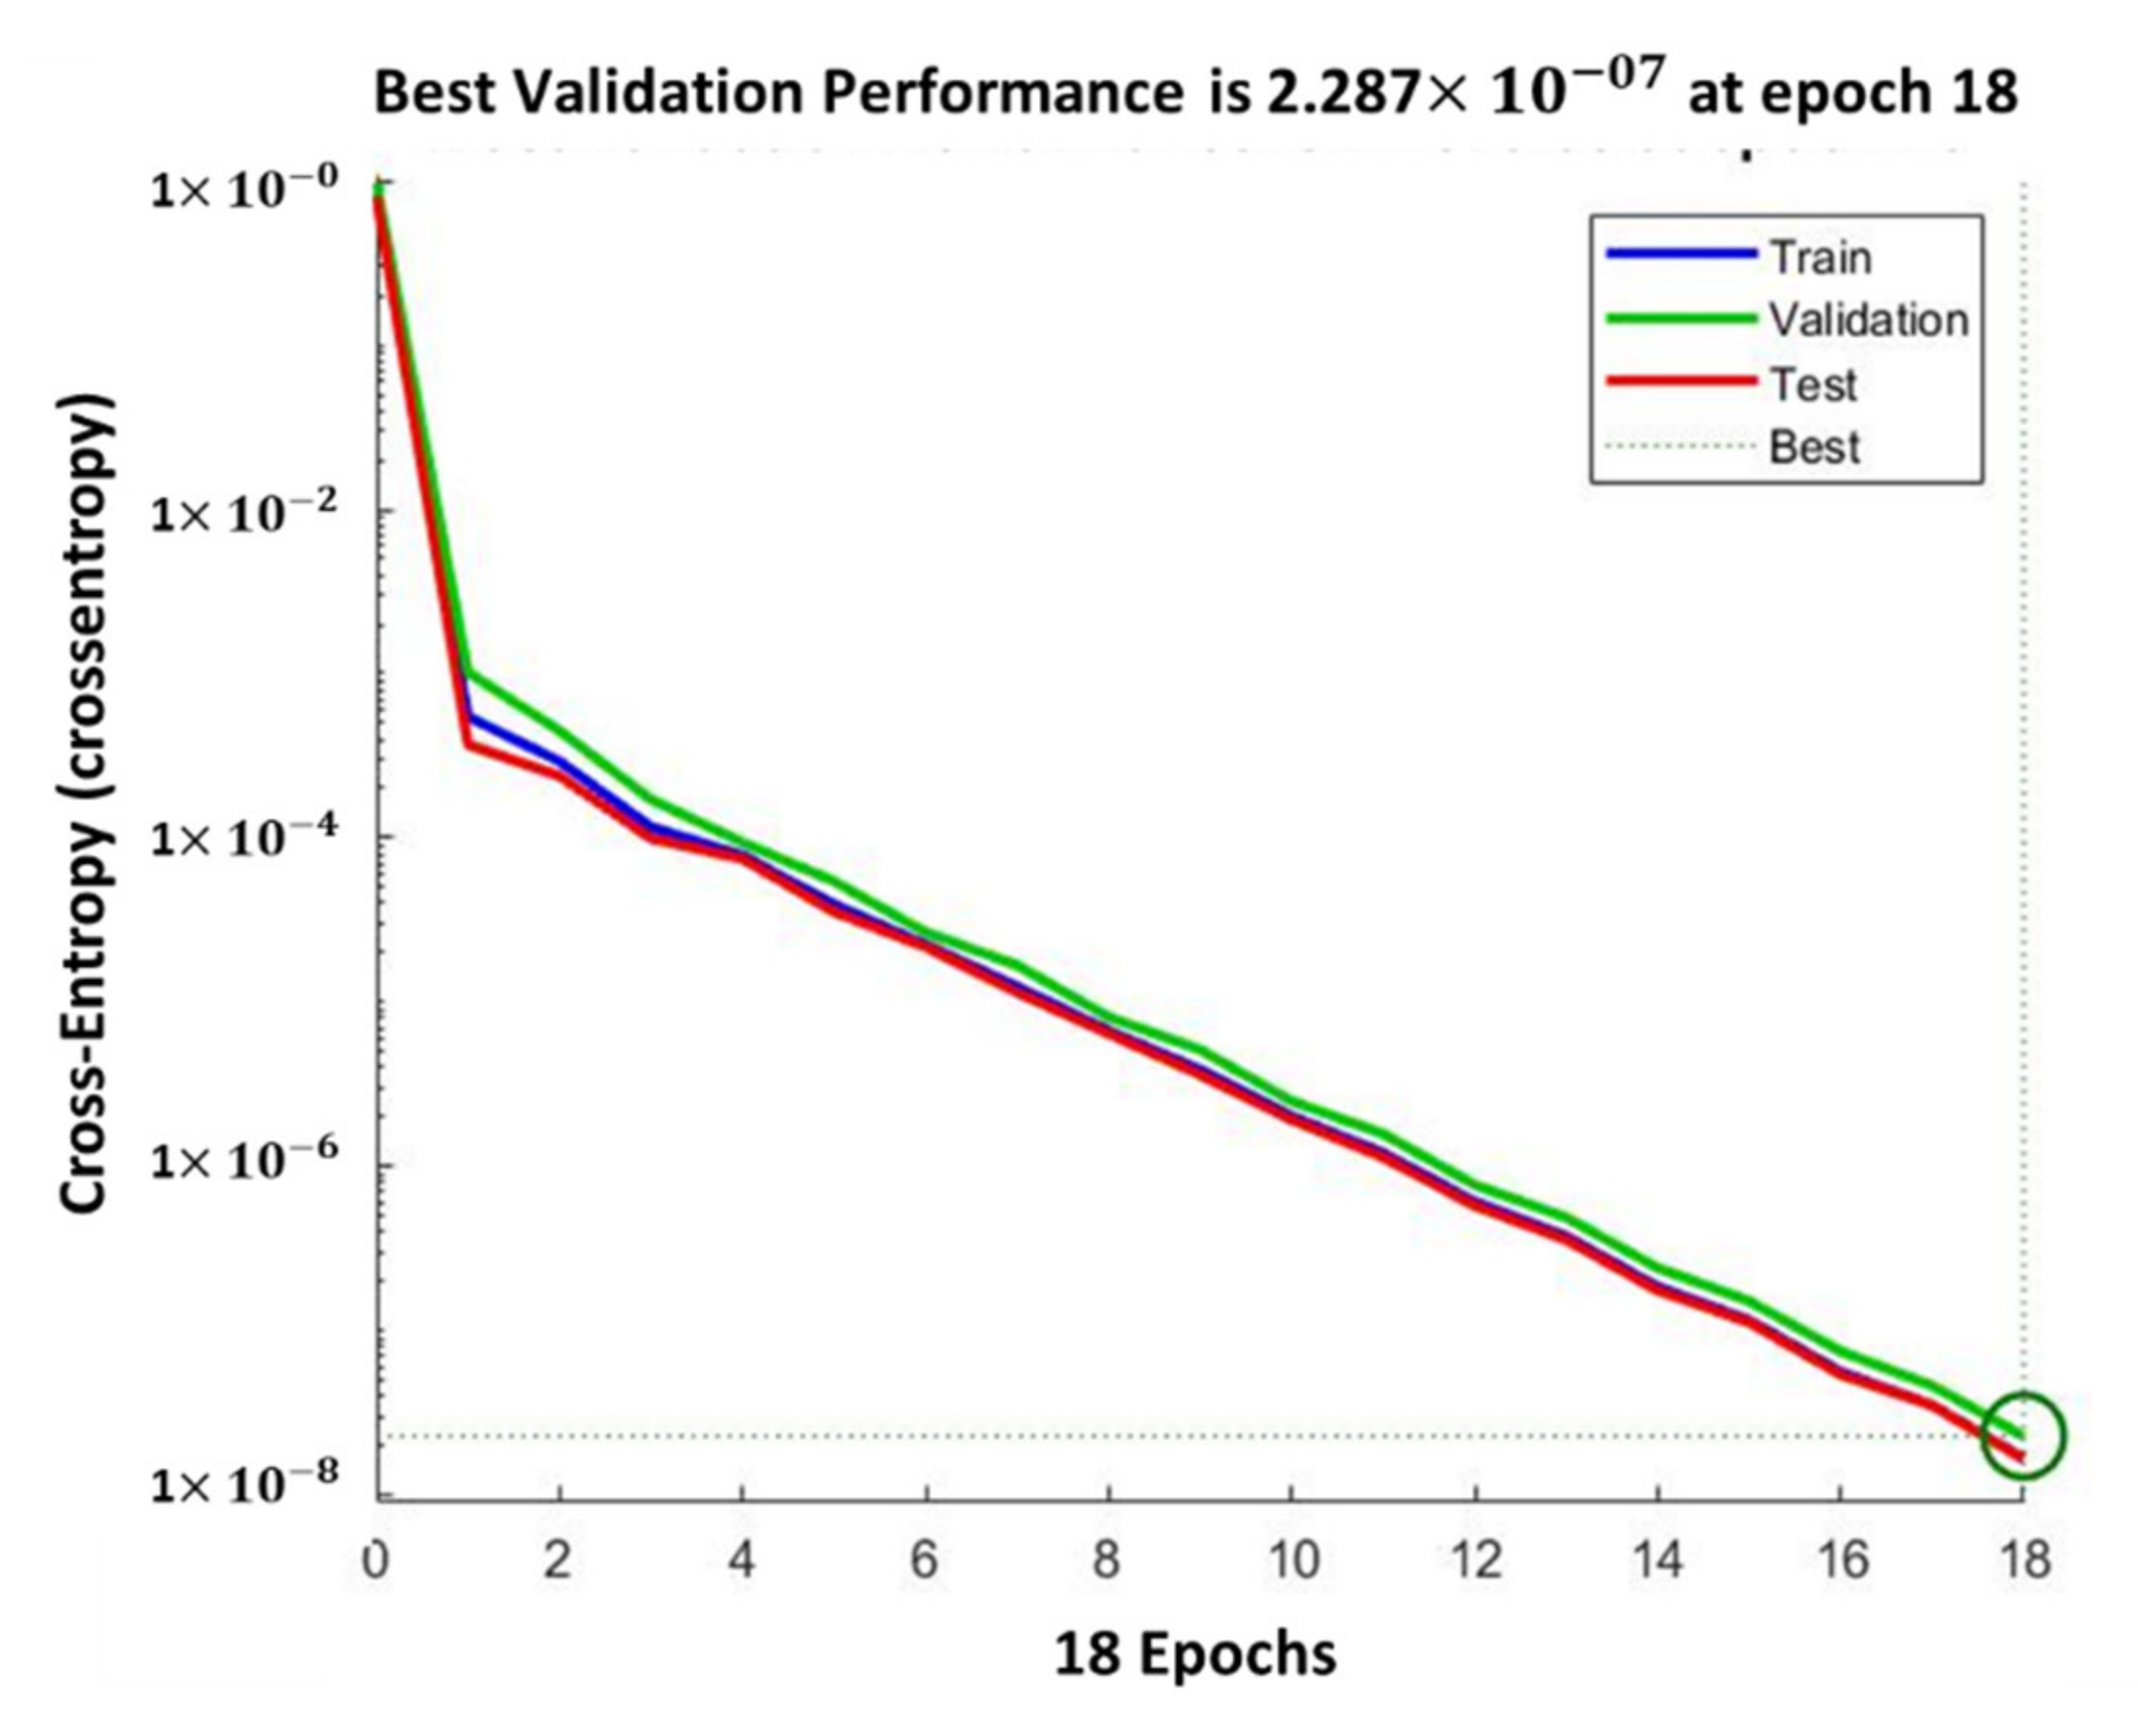
Further, we plot the validation performance of the neural network closer to the optimal value with the increase in the number of neural network iterations (
Figure 16). Based on the trend reflected in
Figure 16, it can be predicted that the validation performance of the neural networks will be even better as the number of neurons and iterations continues to increase. Yet, considering that the increment in the number of the neurons and iterations linearly raises the storage and computing requirements, increasing the performance should be very limited. Therefore, we still use a hidden layer with 64 neurons as the basic structure of the neural network.
6. Conclusions
This paper reports a 0.2-terahertz transmission imaging system for ceramic relics. Its imaging principle, structure, and potential applications are revealed in detail. To visualize the data obtained from the test, linear mapping imaging and iterative threshold imaging are adopted, and relatively clear and intuitive transmission imaging is obtained successfully. Moreover, to identify the contents of the transmission imaging, the feedforward neural network is developed to efficiently predict the internal structure of the ceramic in the terahertz-wave imaging. It provides effective help for the nondestructive testing of the ceramic relics for their low destruction, high efficiency, and high reliability.
However, there are still some aspects of the proposed system that can be improved. Firstly, the proposed system can only achieve two-dimensional imaging, while the thickness and material information of the objects inside the ceramic relics cannot be obtained. Plus, the experimental samples used in this study consist of only four different cases of one ceramic container (empty, pear, orange, and iron lock). Although these four cases are carefully selected and are representative, more cases should be taken into consideration.
In future work, ceramic containers should be scanned in the system from multiple angles to realize 3D terahertz transmission imaging, which will make the system more powerful in detecting ceramic cultural relics. Additionally, more internal structures as well as some real cases should be applied, and different kinds of ceramic vessels should be adopted to further prove the usefulness of the system proposed in this study.
Moreover, since the inspection with electromagnetic waves has the advantage of non-destructive scanning of invisible or hidden objects, the proposed system may be applied to the classification among different rock types to extract the ceramic relics.


