1. Introduction
To improve logical thinking in young people, the education policies of many countries have made programming courses compulsory in high school or junior high school for students in grades 1–12 (K12), including in Taiwan, which started in 2019. Therefore, more and more online judgment systems (OJ) have been developed to help students write programs more easily [
1,
2,
3,
4,
5].
Kafai and Burke [
6] introduced a brief history of school programming languages. In the 1980s, some programming languages, such as BASIC, PASCAL, etc., were used as introductory programming languages for students. However, in the mid-1990s, many schools taught students how to surf the Internet and to build web pages instead of teaching programming languages. The reason that “programming languages are hard to teach and hard to understand” is obvious.
Grover, Pea, and Cooper [
7] developed the basis for the Foundation for Advancing Computational Thinking (FACT) system, which is an iterative process for an empirical investigation of the computational thinking skills of middle school students. They used Scratch as the starting programming language. They also educated K12 students on what “programming languages” and “algorithms” are. A questionnaire of pre- and post-measures was used to measure students’ logical thinking regarding computers and their course experience. Although the feedback was useful, obtaining students’ level of enthusiasm from this information was difficult.
Fotaris et al. [
8] designed a programming assistance system, similar to the famous TV game show “Who Wants to Be a Millionaire?”, to help students understand programming concepts. Similar to the game, the more questions you answer correctly, the higher the reward. They also developed the “Kahoot!” system for students to use their mobile phones to answer questions. Thus, teachers could obtain a distribution of the student answers.
Most OJs help teachers teach outstanding students. However, most students need more help to understand why a program should be written and how to write these programs, which these systems cannot provide. Excellent students have a strong willingness to learn and have strong self-learning abilities; others find difficulty in keeping up with the progress of the class, let alone completing homework. For these students, giving up studying is the easiest solution. Most OJs only know that those students are obtaining fewer and fewer scores, but they do not know why and how these students lose confidence in programming.
1.1. During the Epidemic
In the past two years, educational systems have been forced to change to distance learning; many students have to stay at home and learn remotely due to the impact of the COVID-19 epidemic. In most subjects, “blended learning” is attempted using videos and Internet meetings. Due to distance learning, much chaos has ensued. To overcome this situation, many researchers are studying this topic [
9,
10,
11,
12,
13].
Tang et al. [
14] used the hypothetical model and confirmatory factor analysis (CFA) to analyze several key factors to determine whether students were ready to experience distance learning during the COVID-19 epidemic. In their results, no significant difference was found between the genders. In addition, postgraduate students performed better than undergraduate students. They also recommended increasing the virtual interaction between teachers and students, and the activities among students.
Liu et al. [
15] used the Bridge-in, Objective/Outcome, Pre-assessment, Participatory learning, Post-assessment, and Summary (BOPPPS) method as a base to develop their own blended learning approach. They combined BOPPPS to provide interactive, live, and online assignments; online videos for self-study and mind-map summaries; and consolidation exercises via Q&A tests. They also designed a set of criteria for evaluating learning quality. For each stage in the evaluation, a certain percentage of the grades were included in the overall course grades.
AlShamsi et al. [
16] showed the effects of online vs. face-to-face teaching on teachers and students during the COVID-19 epidemic. According to their results, students would rather learn via face-to-face teaching than the online course, as do the teachers. They concluded that three reasons influence this preference: the materials offered in each course, fatigue, and the maturity of first-year students.
Peimani and Kamalipour [
17] discussed the situation and problems caused because of the fast change from face-to-face teaching to online courses. They also addressed some problems and opportunities between the teacher and students, such as assessments and feedback, and digital platforms for teaching and learning.
These studies all point out the “challenge of rapid transition from face-to-face teaching to online course.” Teachers have a hard time monitoring students’ behaviors in a classroom, not to mention during distance learning. During distance learning, teachers cannot guide students in summarizing and concluding their knowledge through face-to-face methods but can only help students through video conferences or emails. These only work when students are self-aware and are adept at self-learning.
In addition, distance learning requires high use of the Internet, so unstable Internet connections can cause intermissions in teaching, which is a serious challenge for teachers and students. Therefore, some teachers choose not to have individual students turn on their cameras to reduce some bandwidth use. However, students cannot be guaranteed to be sitting in front of their computer, and some students who do not turn on their camera pretend that they are in front of their monitors but are actually engaged in other activities.
1.2. Programming Education during the Epidemic
Compared with other courses, programming courses have some advantages because of the online programming system [
18,
19,
20,
21,
22,
23]. However, the problems faced are the same. In a normal computer programming classroom, the teacher can walk up to the students to assess a student’s progress in learning. However, when it comes to distance teaching, these typically easy and simple actions become difficult. Currently, teachers can only determine how many questions a student has solved through the online judgment system, but they cannot take the initiative to provide help when the student is unable to understand the course content.
Sefriani et al. [
18] used the Edmoo system in a blended learning course for programming. They used the pre-test and post-test to evaluate students’ learning performances. In their study, the blended learning course for programming via Edmoo successfully affected Information technology education students during the COVID-19 epidemic.
Dale and Singer [
24] used Massive Open Online Course (MOOC) to teach an online programming course. In their course, the MOOC was flexible by providing videos and drop-in sessions and by managing programming assignments and feedback.
Deperlioglu and Kose [
25] adopted the Afyon Kocatepe University’s Learning Management System (LMS) named @KU-UZEM to fit the requirements of the blended learning system of their “Data Structures and Algorithms” course. In their work, they blended face-to-face teaching and online learning for programming to help students learn. The feedback from the students when the course finished shows that students were satisfied with this blended learning method.
Demaidi, Qamhieh, and Afeefi [
26] applied blended learning in a C programming course. They compared students who adopted blended learning and other students who used traditional face-to-face learning. In their study, the students who took the blended learning course had better performances than the students who learned via traditional face-to-face teaching.
The studies mentioned above emphasized the power of online systems used for exercises and of the pre-test and post-test in checking the progress of students. However, students can only ask questions during online meetings or through emails. In addition, teachers cannot confirm whether students really obtained knowledge through these online meetings or emails, and they can only rely on online questions or test results to assess the progress in students’ learning.
In addition, another question arises for distance learning in programming. Since the online system only checks whether a student’s answers to a question are correct, distinguishing whether the student wrote the program code by themselves or copied the code from other students is difficult. In a classroom, teachers can walk up to the students to prevent plagiarism, but in distance learning, this becomes almost impossible.
Carter et al. [
27] developed a method of evaluating the performance of students. They compared the log files of students’ behaviors to evaluate the progress in student learning. In addition, they adopted social behaviors to predict student behaviors. Finally, they applied multiple factors to predict students’ behaviors. Though in their work they obtained a reliable ability to predict students’ behaviors, their work is based on the trust that students do not plagiarize. If students obtained their code from the web or from other students, the evaluation system shows that they perform as well as the students who studied hard.
1.3. Goal of This Paper
Therefore, a system that not only analyzes students’ progress in learning and their degree of understanding using an artificial intelligence analysis to monitor students’ progress in learning but also prevents plagiarism is useful for improving student learning efficiency in a blended online programming system. Our goal is to provide a novel method combining DICE [
28] and an expandable blended precision educational platform to measure the class loyalty of students and to prevent plagiarism. In the following section, some essential definitions and backgrounds are presented. In the Methods section, we introduce the methods used to measure students’ enthusiasm towards learning via the logs obtained from DICE. In the Experimental Results section, the results obtained are presented. A conclusion is provided in the last section of this paper.
2. Essential Background and Definitions
In this section, we introduce some essential background and definitions. First, convolution neural networks (CNNs) are introduced in the following subsection. Second, some essential definitions used in the proposed method are given in the next subsection.
2.1. Convolution Neural Network (CNN)
The Convolution Neural Network (CNN) [
29] is a kind of deep learning method. CNNs have been applied in many studies, such as car plate identification, person recognition, etc. [
30,
31,
32,
33,
34,
35].
In 1998, LuChun et al. [
29] proposed the first convolution neural network system called LeNet-5, which is based on gradient-based learning. LeNet-5 was applied to recognize text in documents and obtained a good performance.
Figure 1 shows an example of the structure of the CNN.
In their model, the CNN consisted of three different layers: a convolution layer, a sub-sampling (pooling) layer, and a fully connected layer. The picture (cat) is transformed into a matrix and inputted into the CNN. The vector is first convoluted to extract special vectors called feature maps of the picture. Then, the feature maps are sent to the pooling layer to subsample the features. After, the matrix is flattened into a one-dimensional vector and sent to fully connected neural networks. Finally, the fully connected neural network outputs the possibilities of each category. The details of each layer are given as follows.
2.1.1. Convolution Layer
In this layer, the inputted matrix is multiplied with a special matrix called a filter vector to extract a special matrix called a feature map.
Figure 2 shows an example of a convolution layer.
In this example, the submatrix of image ((1, 0, 0), (1, 1, 1), (1, 1, 0)) is multiplied with ((0, 1, 0), (1, 1, 1), (0, 1, 0)) at each position:
Following this method, the convolution layer finishes the rest of the feature map. Hence, the image can be convoluted into a feature map. After finishing the feature maps, these feature maps are sent to the pooling layer to subsample the feature maps.
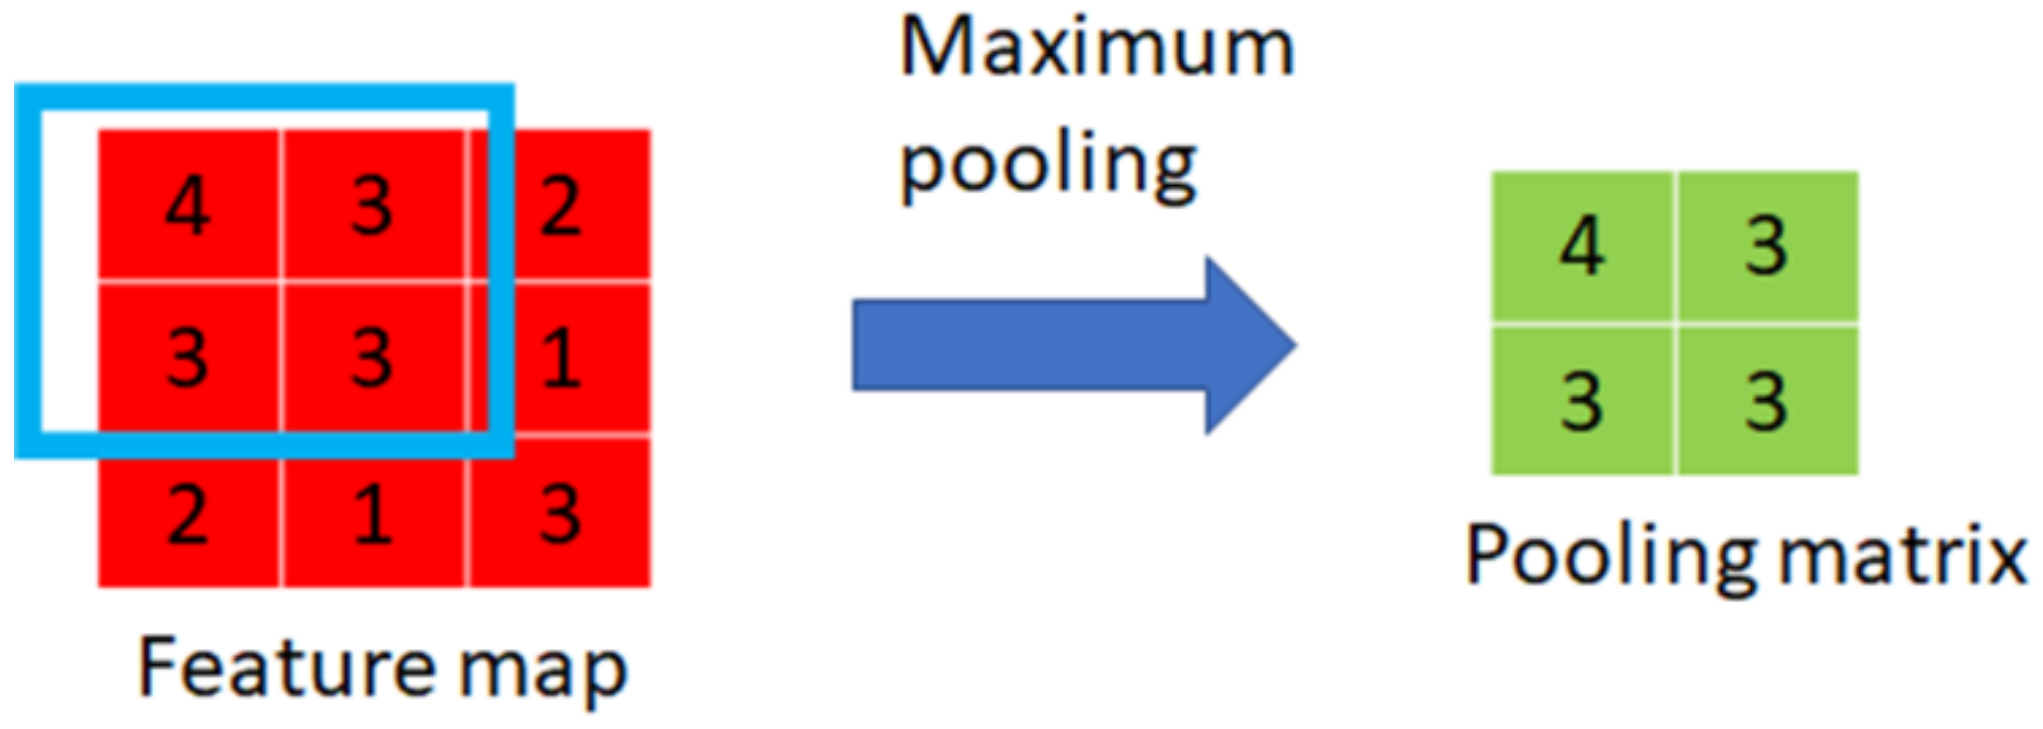
2.1.2. Pooling Layer
In the pooling layer, the feature map is subsampled into a small matrix. In this layer, the sampling method can be an average, a maximum, etc.
Figure 3 shows an example of the convolution layer.
In
Figure 3, the pooling method adopts the max-pooling method. The feature map is subsampled using a moving window. As
Figure 3 shows, the maximum value inside the two-by-two blue rectangle ((4, 3), (3, 3)) is four. Additionally, the maximum value among the next ((3, 2), (3, 1)) matrix is three. The maximum value of the matrix ((3, 3), (2, 1)) is three. Additionally, the maximum value of the matrix ((3, 1), (1, 3)) is three. Hence, the pooling matrix is ((4, 3), (3, 3)).
After the subsampling (pooling) layer, the pooling matrix is flattened into a one-dimension vector and sent to a fully connected neural network.
2.1.3. Fully Connected Neural Network
In a fully connected neural network, the flattened vector is used as input and sent to several hidden layers. In fully connected neural networks, an activation function, such as a sigmoid function, is used. Additionally, a loss function, such as the minimum mean squared error (MSE), is adopted. After the deep hidden layers, the possibilities of each pre-setting category are outputted.
2.2. DICE Expandable Blended Precision Education Platform System
In this paper, we adopted the logs of the DICE expandable blended precision education platform system (DICE) to evaluate students’ learning attitudes and behaviors. Hence, we introduce DICE in this section.
DICE [
28] is a software system with a default content designed for coding education. It is an online assessment system that automatically and immediately judges students’ code throughout the course. This system is a parsing-tree-based automatic programming assessment system with a test-driven development (TDD) environment. TDD is a code development strategy that has been popularized by extreme programming. It writes a test case before writing the code. Additionally, DICE uses the test case to verify the correctness of the code written by the students.
DICE is also an online judgment system for programming. However, unlike other online judgment systems for programming, it was developed to help the teacher teach programming. Teachers can modify the questions quickly, observe how the students solve the questions, discuss the answers with students via the web, help students solve problems via remote control as in the computer classroom, and automatically judge the correctness of the codes written by the students.
Hence, in this paper, we focus on the useful information obtained from the DICE server to help teachers assess the progress of students’ learning and to assess for plagiarism.
2.3. Fuzzy Membership Function and Some Essential Definition
A membership function of a fuzzy set is a kind of function that indicates the degree of truth. Sometimes, the boundary between the values of data is unclear. For example, at a temperature of 24°C, one person may feel cool but another may feel comfortable. We often confuse the degrees of truth with probabilities. However, the fuzzy truth only reflects membership in roughly predefined sets but not the likelihood of some situations, such as being cool or comfortable.
In 1965, Zadeh [
36] first introduced the fuzzy membership function. In his study, the membership function was used to give grades of membership to each object. Additionally, these grades were set within the range [0~1].
In this paper, we use the concept of fuzzy membership functions to set up the evaluation standards for learning loyalty.
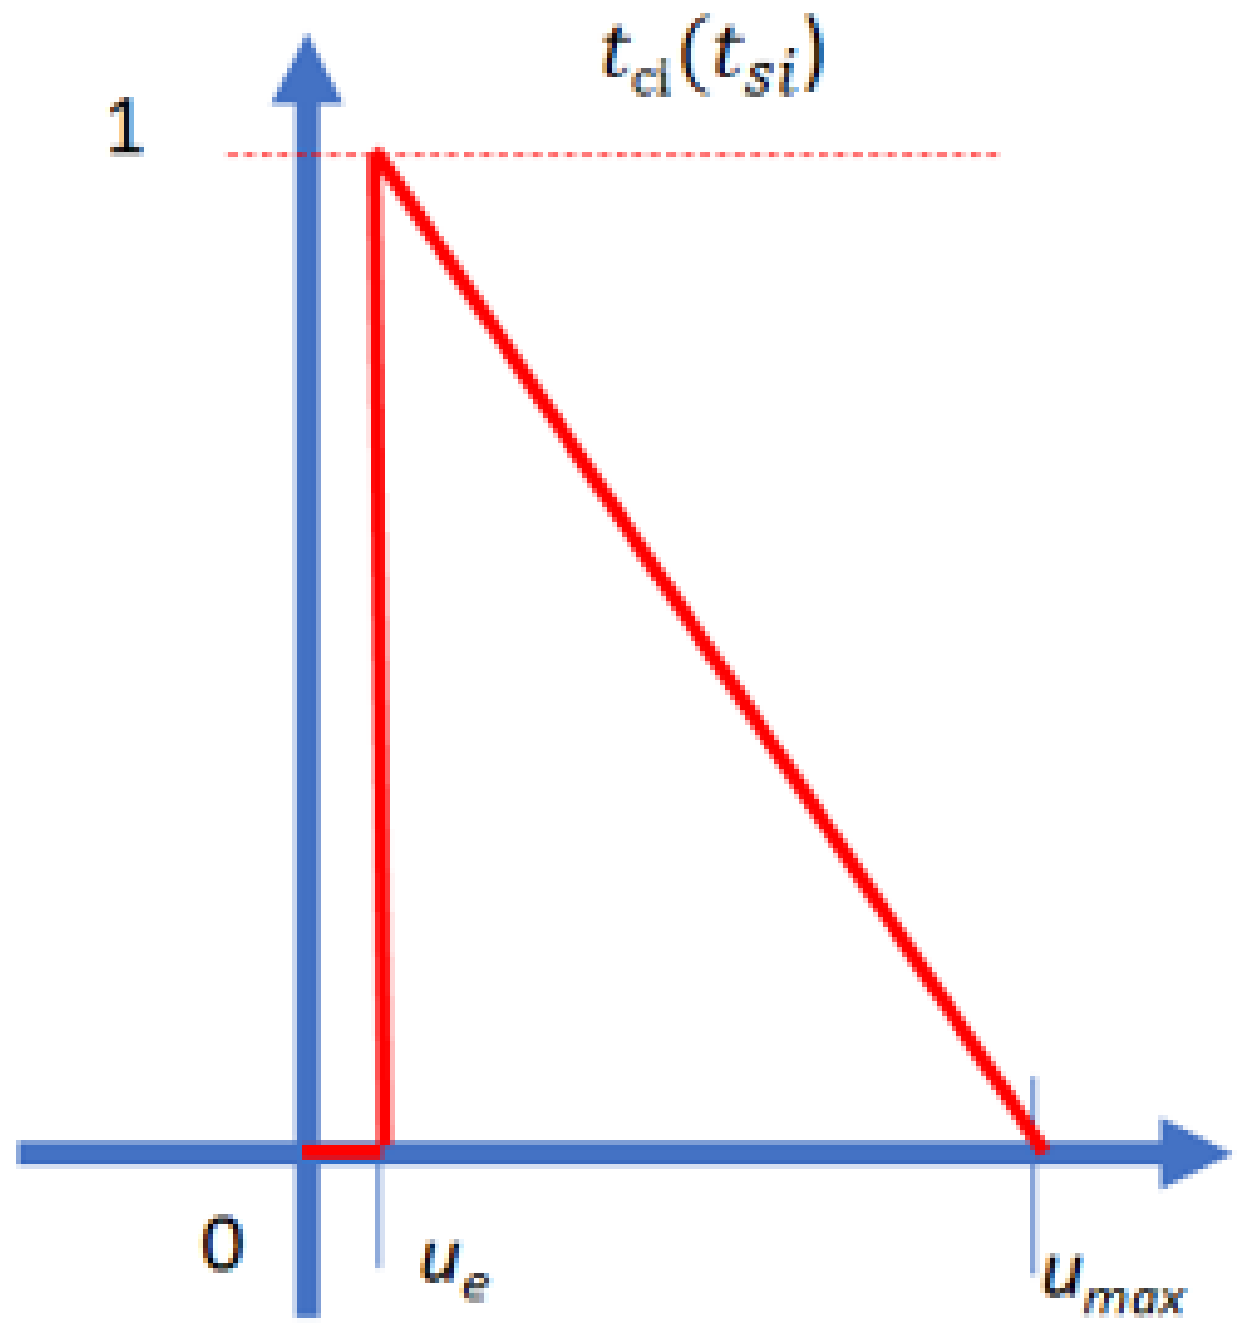
Suppose that a student spends time
tsi when solving the question
i; then, the membership function of time check
tci is represented as in
Figure 4.
Additionally, it can be represented as follows:
where
ue is a constant value and represents the minimum time spent solving this question. This value can be defined by the teacher or by experts. The variable
ue is used so that students cannot copy and paste their answers to the question. In addition,
tmax is the maximum time spent solving this question. This value can be defined using the maximum time spent solving this question in logs of students in the same class.
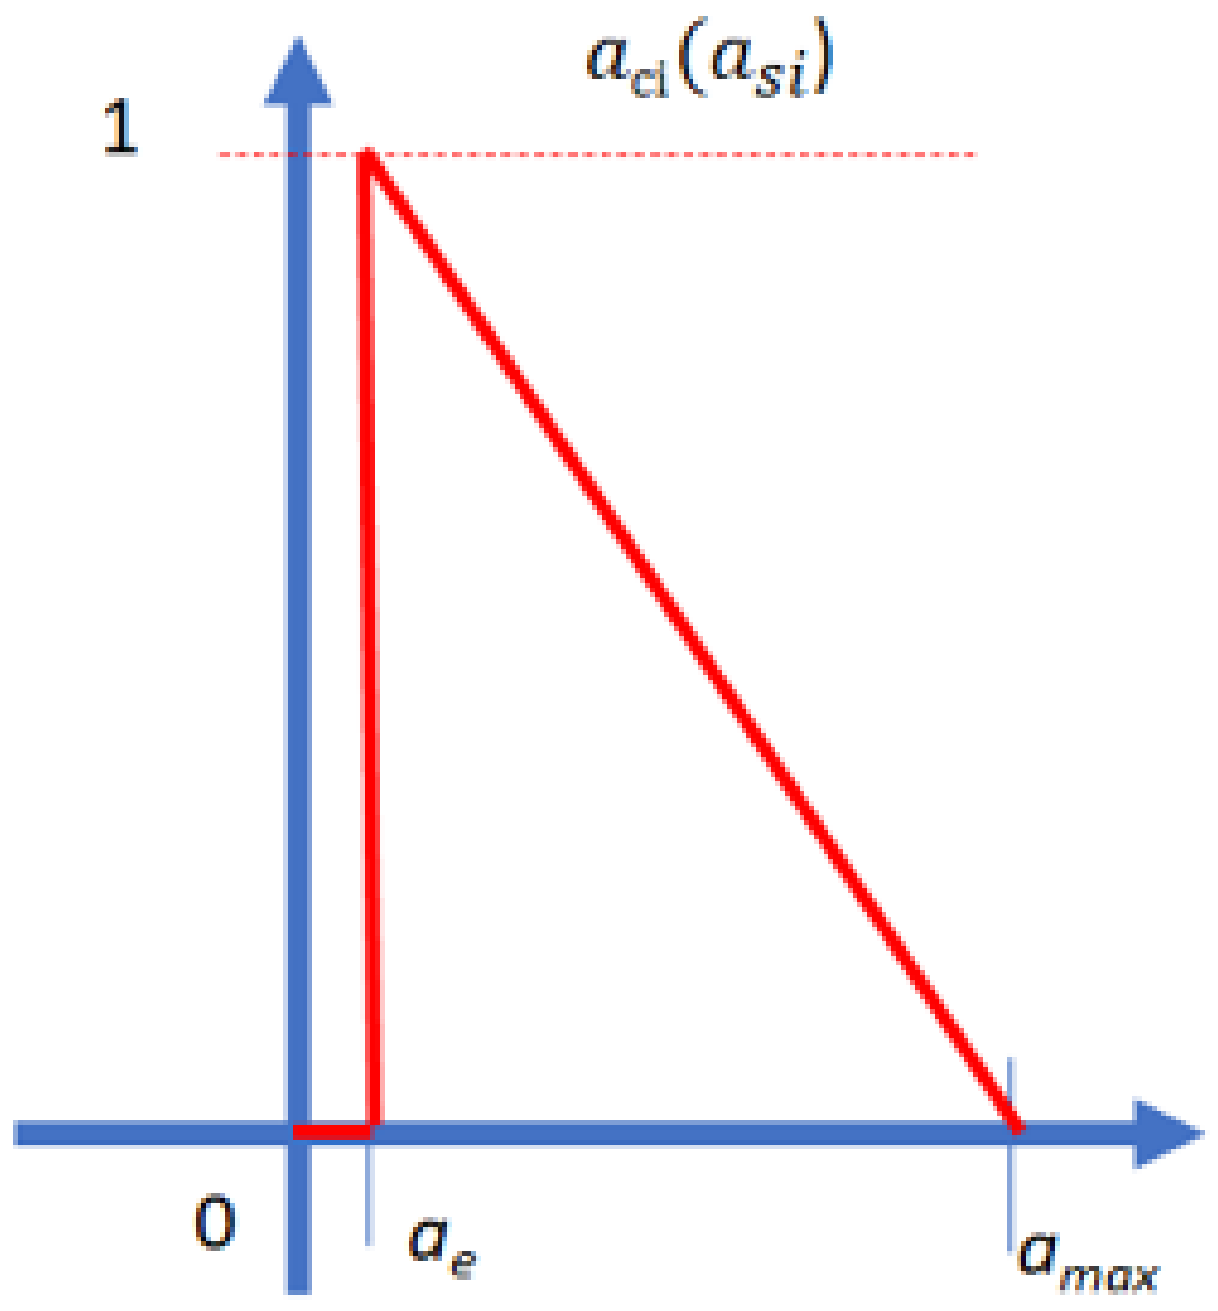
Suppose that a student performs some action and the variable asi is the length of the action string when solving the question i. Here, the action string is a record that records how many actions, such as edit, delete, insert, copy, paste, execute, judge, etc., have been performed by student s. Each action represents a character in an action string. For example, if a student performs a set of actions, “insert, insert, delete, edit, insert, insert, copy, insert, edit, execute, judge”, then, the action string is recorded as “IIDEIICIEXJ”. Note that, if the student keeps performing one action continuously, then we only record actions every thirty seconds or until another action is performed. In this example, the value of asi is eleven.
Additionally, the membership function of action check
aci is represented as follows:
where
ae is a constant value and it represents the minimum length of the action string for solving this question. Additionally, this value can be defined by the teacher or by experts. The variable
ae is used so that the student cannot copy and paste their answer to the question. In addition,
amax is the maximum length of the action string for solving this question. This value can be defined using the maximum length of the action string when solving this question in logs of students in the same class. It can be represented as in
Figure 5.
After the values tci and aci are obtained, we can further use them to evaluate the class loyalty of students.
2.4. Object Tensor
In this paper, we introduce an important concept called “Object Tensor (OT).” Here, the term “tensor” is not the tensor in physics. The idea of OT is an extended version of the data structure dictionary in python. An Object Tensor could be represented as an array (potentially multidimensional) of Objects. The value in an OT can be null, a value, a vector, a string, or even another OT. OT[d1],[d2],[d3]…,[dN] is an N-order Object Tensor and N is an integer, where [d1], [d2], …, [dN] is an ordered set of strings.
For example, an OT could be a set of collections shown as follows:
where
[user] = [“Arvin wu”, “Rebaca Yang”, …]
[question] = [“Question1”, “Question2”, …]
[information] = [“Score”, “Coding Time”, “Actions”]
where the Score records the score that user “Arvin Wu” obtained when answering “Question 1”.
Figure 6 shows the student’s record and transforms it into an OT.
In
Figure 6, one student’s information is stored in different tables. Using the OT, all of the information can be integrated into one OT. We can use the identifier to obtain a particular value in the OT. For example, the value can be obtained using the OT
[“Arvin Wu”][“Question 1”][“Coding Time”] to retrieve the coding time of the student “Arvin Wu” in “Question1”. Since the OT can add or subtract OT to or from itself easily, integrating the information into OT and applying it to the No-SQL database application is quite easy.
In the concept of OT, if one wants to add some items to the OT, these values can be added to the OT according to a special identifier or even a value. Additionally, if one wants to add a new identifier with values into OT, they can just specify the identifier of the OT and add the new identifier to the OT. In the next section, we provide an introduction on how the OT can be used in the proposed method and the details of our proposed method.
3. Proposed Method
In this section, we provide a brief introduction to the proposed methods.
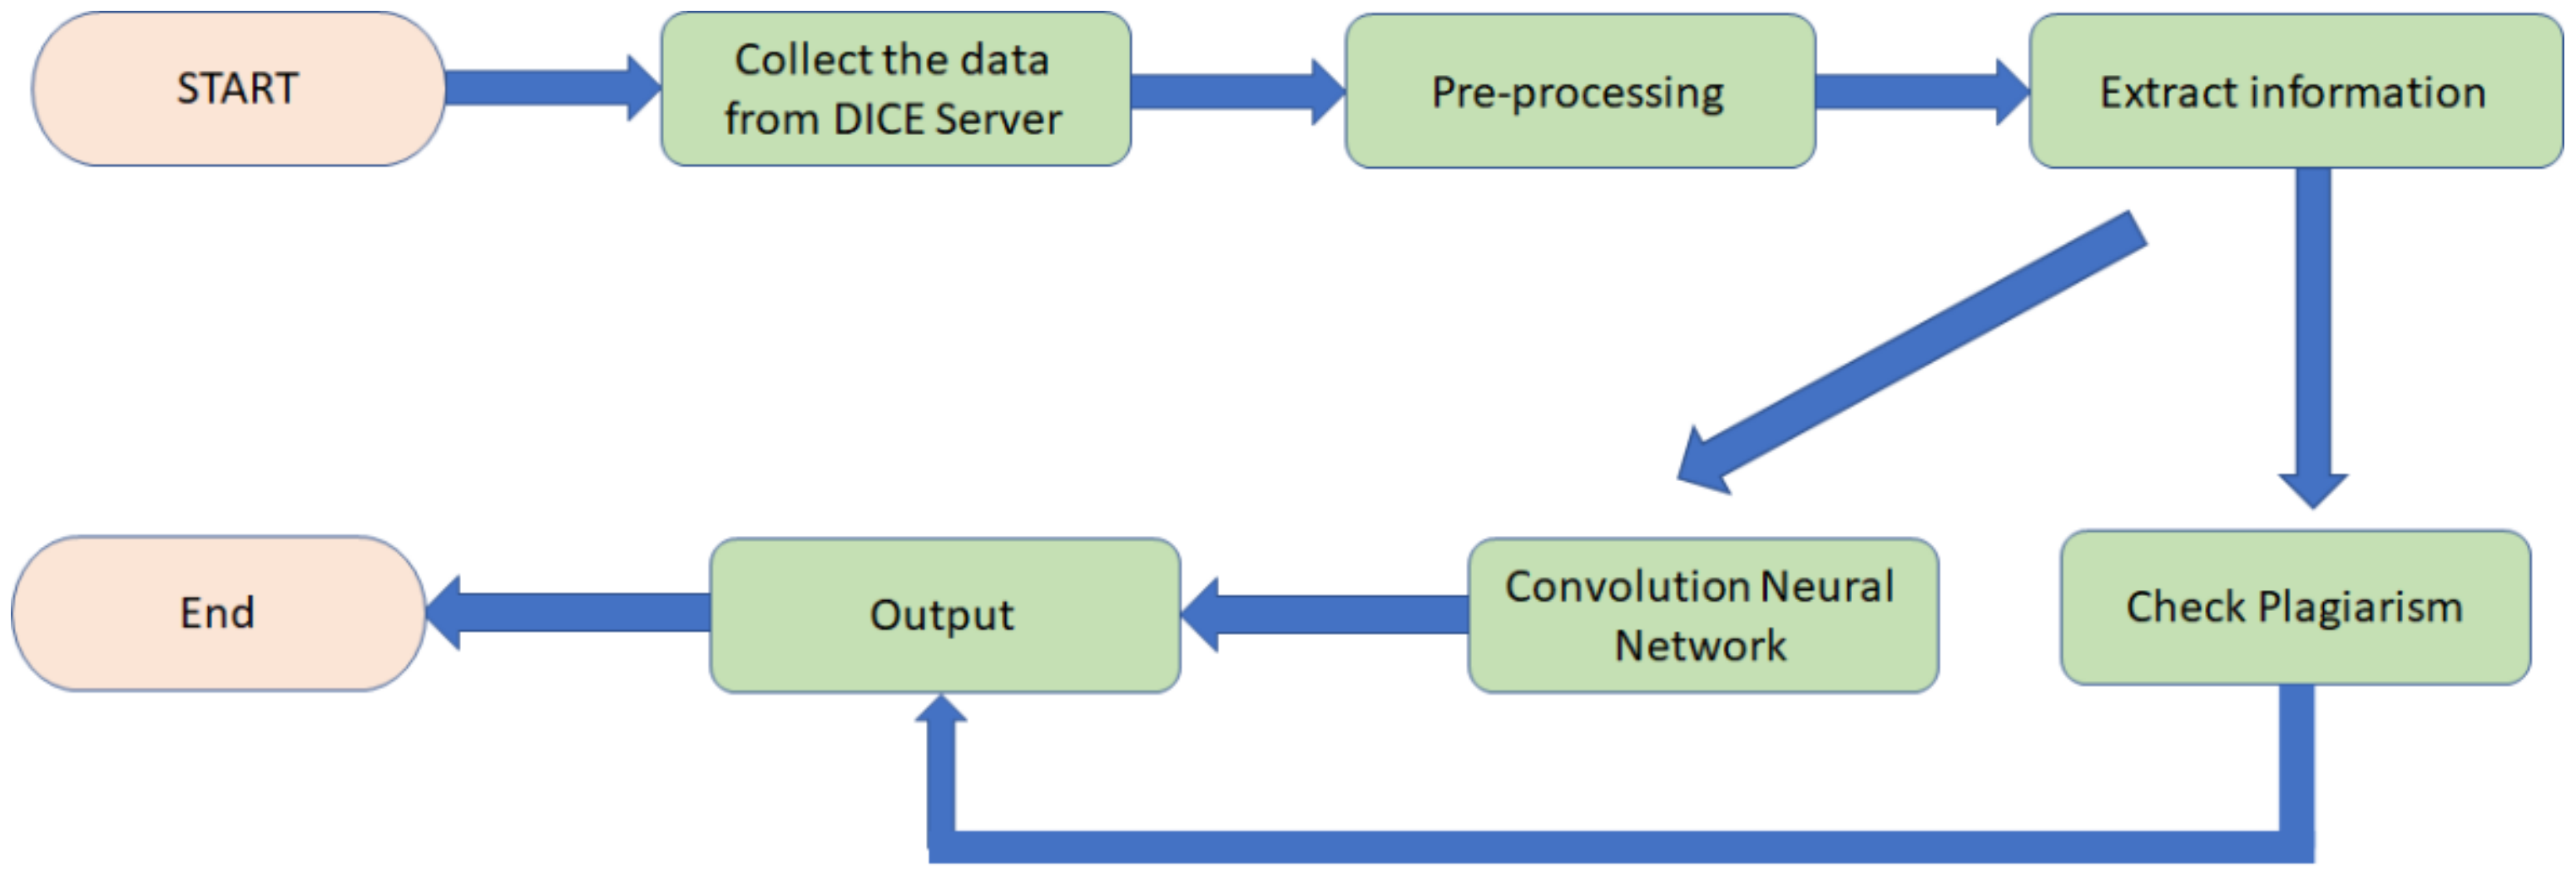
Figure 7 shows a flowchart of the proposed algorithm.
First, the log files are obtained from the DICE server. Then, all logs are processed to remove empty parts, unrelated data, and outliers in the preprocessing phase. After preprocessing, the data on the durations and action strings of students for each question are extracted. This information is then transformed into OTs. Different vectors are obtained from OTs and sent to the different CNNs to learn the model for learning loyalty and transformed to check the degree of plagiarism. Finally, the classification results are sent to the output. The details of each process are given in the following sections.
3.1. Data Collection from the DICE Server
In this paper, we obtain all of the data from the DICE server. However, for several purposes, the logs are separated into different files. Hence, the first job is to collect the logs and to extract and store the information into Object Tensor (OT). We collect the scores; codes to parsing trees; time taken to answer all questions for all students; and the action logs, which record the actions performed every thirty milliseconds. All of the files are sent to the next process: data preprocessing.
3.2. Data Preprocessing
In the logs, some data should be removed, such as outliers or null data. For example, the data for a student who attends only one class but decides not to take the course should be removed. Additionally, some data should be transformed from their original form into vectors. For example, the time taken by a student to answer each question should be transformed into vectors.
Additionally, the code is another problem. It requires a lot of storage space and time to record the whole code if the code becomes increasingly complicated. To verify plagiarism, some online programming judgment systems adopt a “BLAST”-like technique to check DNA sequences for the same patterns and to check similar patterns within different program codes [
37,
38,
39,
40]. This technique is powerful for checking codes that just modify the variable names or some structures slightly. However, when students re-order the codes, this technique treats these two codes as different.
A code with slight modifications can be checked easily using the parsing tree technique, as in [
41]. However, in this paper, we use functional annotations as the internal nodes instead of using the content as the parsing tree. For example, we compare the differences between the codes of two students. The codes of two students can be obtained from the server. Then, the parsing tree is generated according to the code.
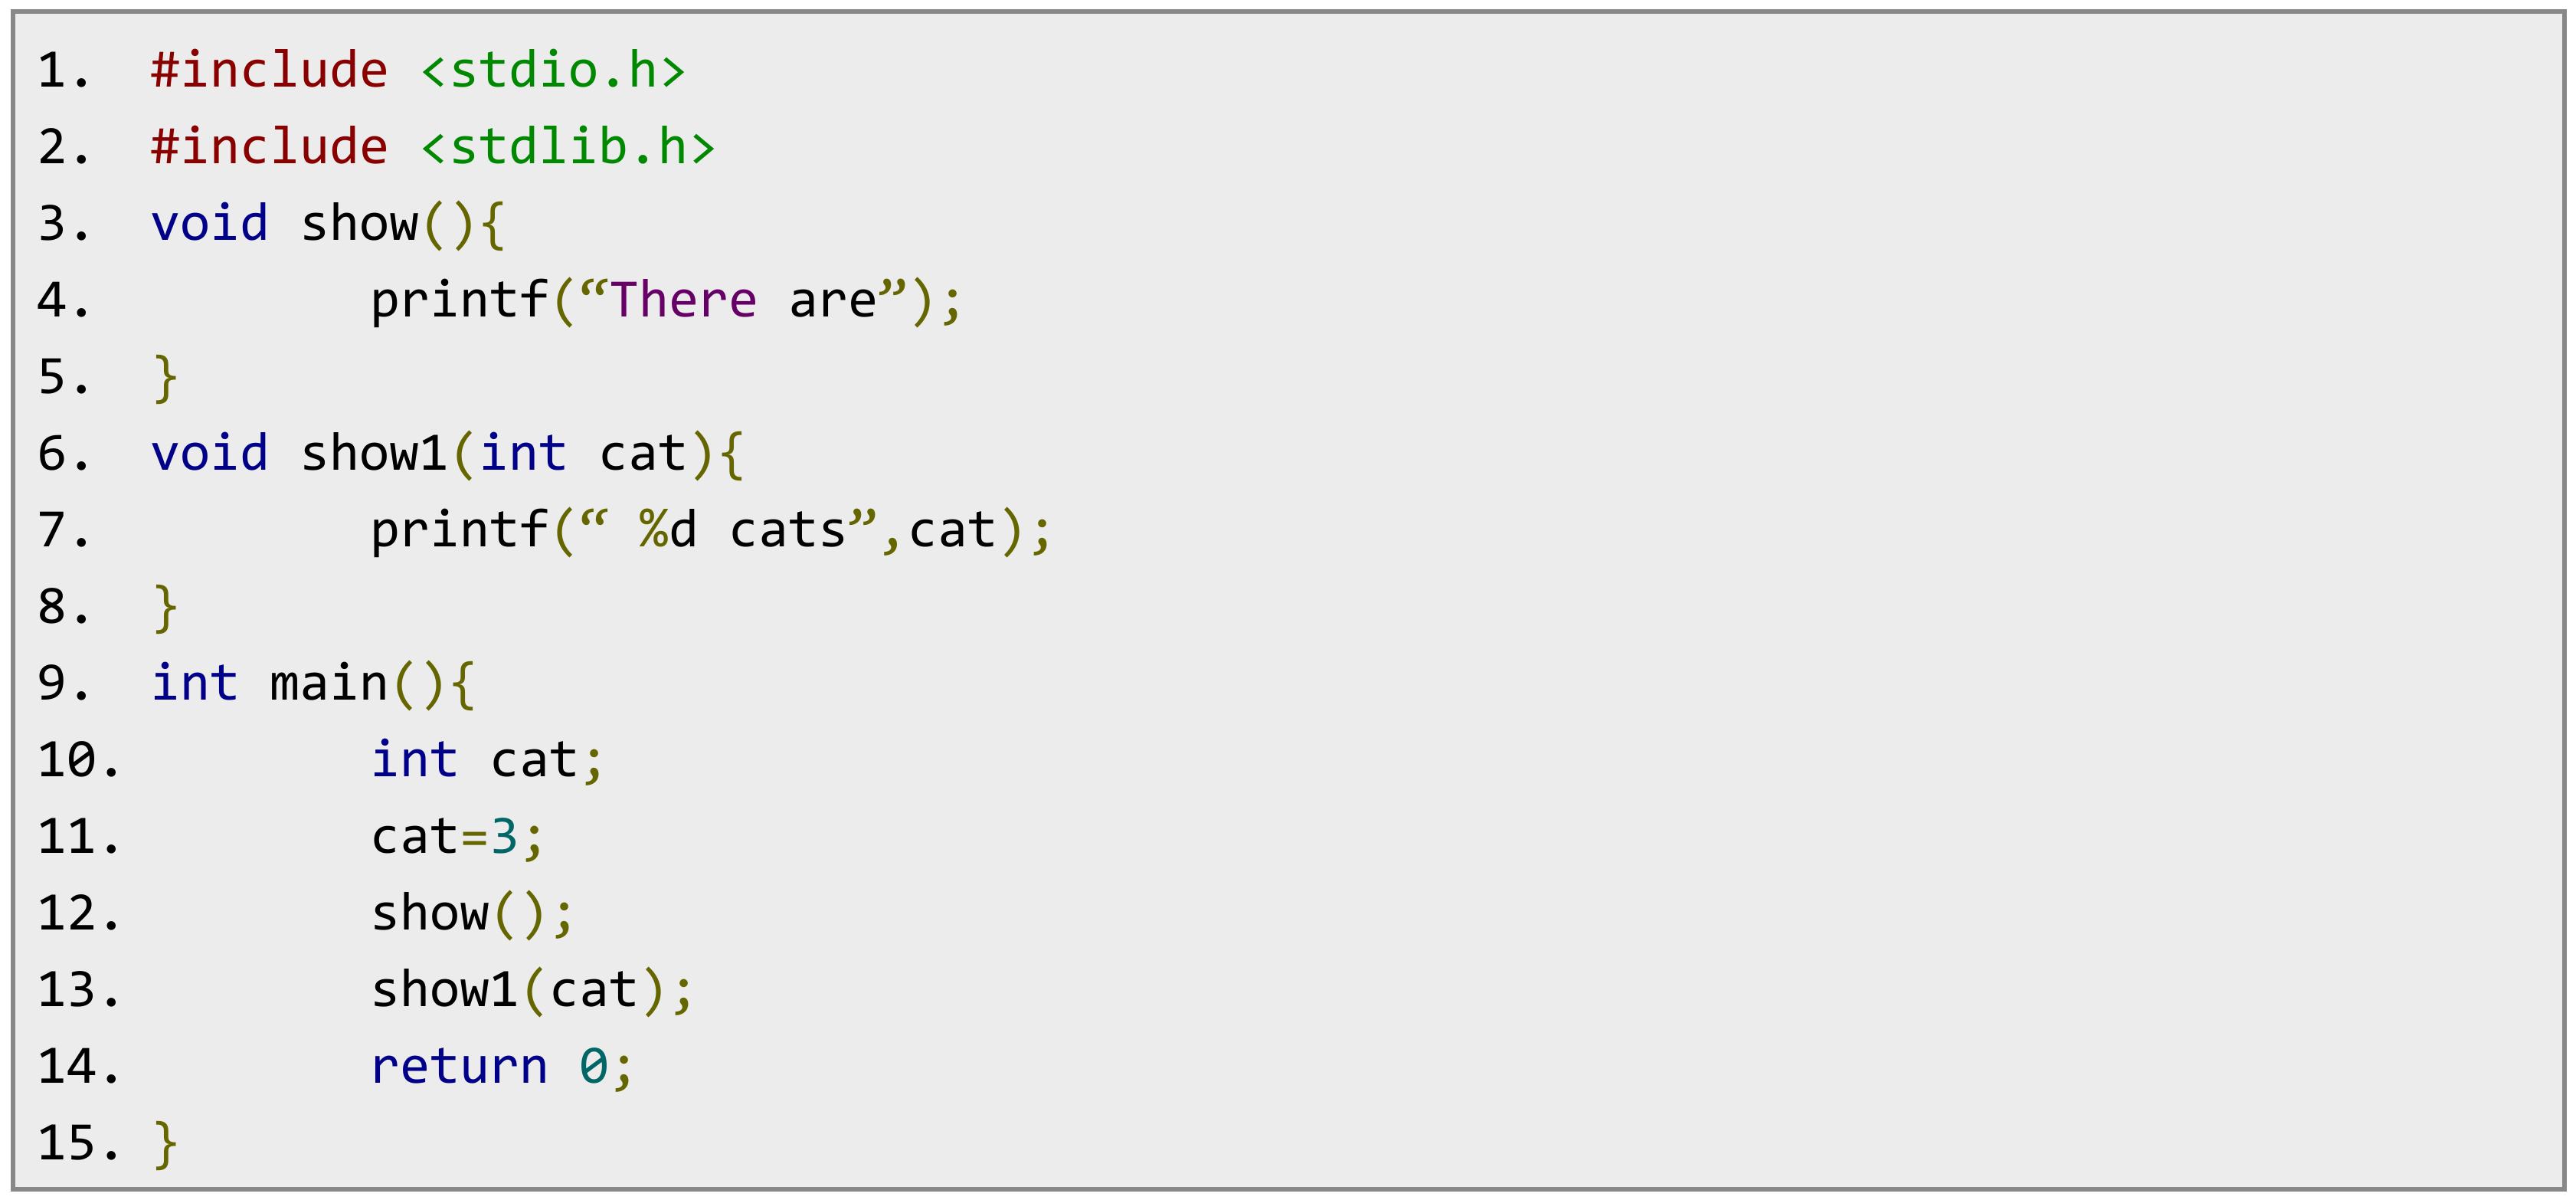
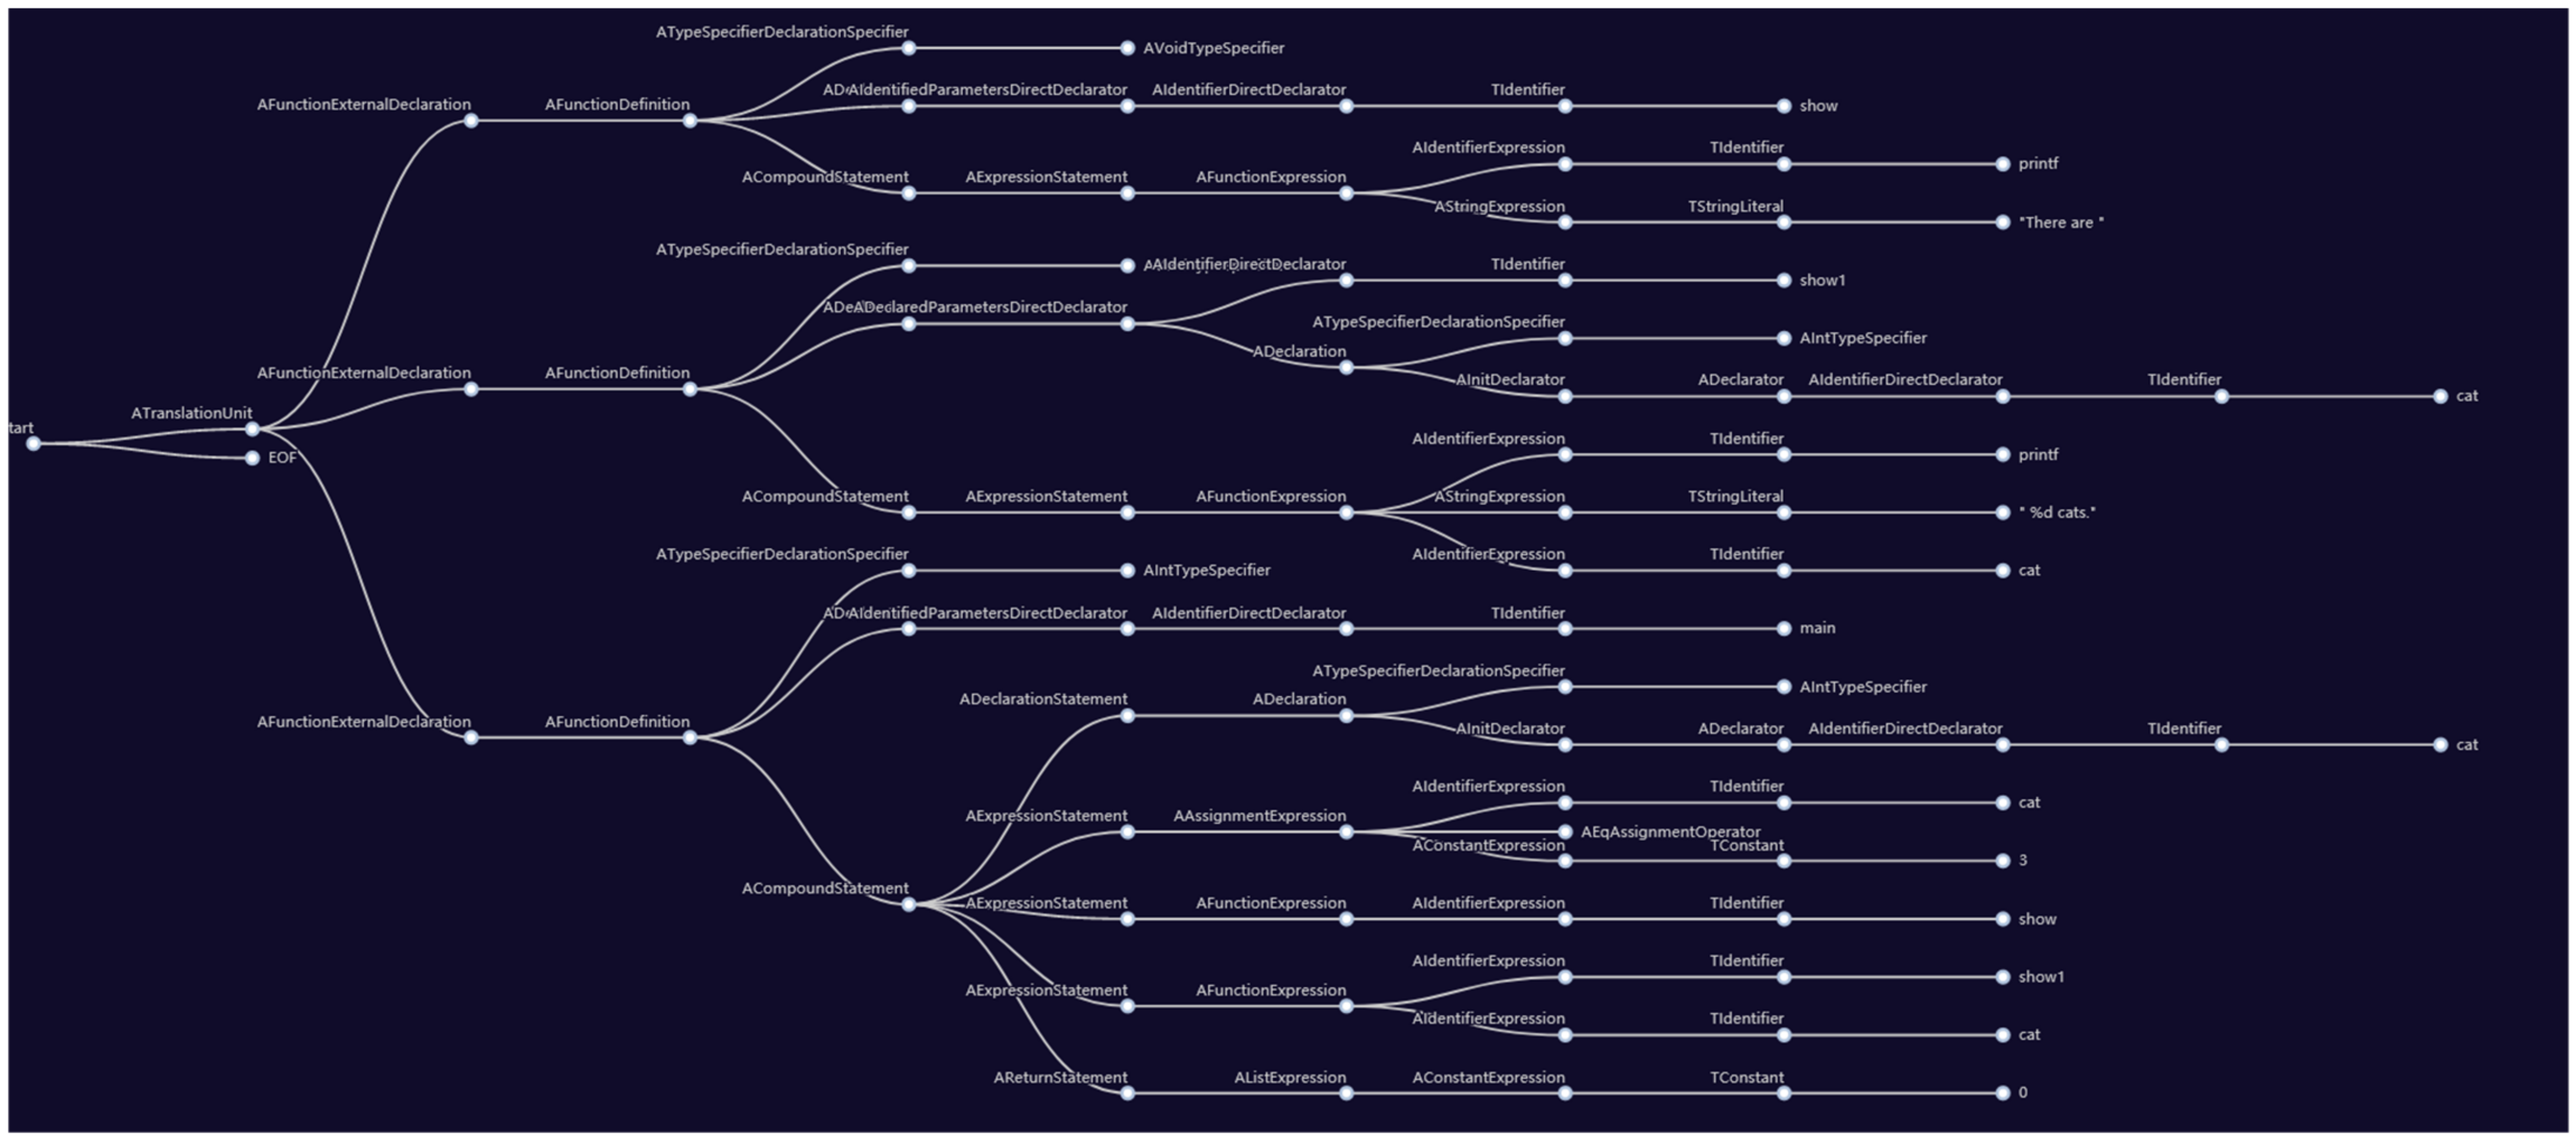
Figure 8 shows an example for a code, and
Figure 9 is the parsing tree of that code.
As
Figure 8 and
Figure 9 show, the C code is transformed into a parsing tree. Each internal node is the identifier of the variable, function, values, etc. If students copied one others’ code and modified the code or even reordered the code, the generated parsing trees of the two codes are similar.
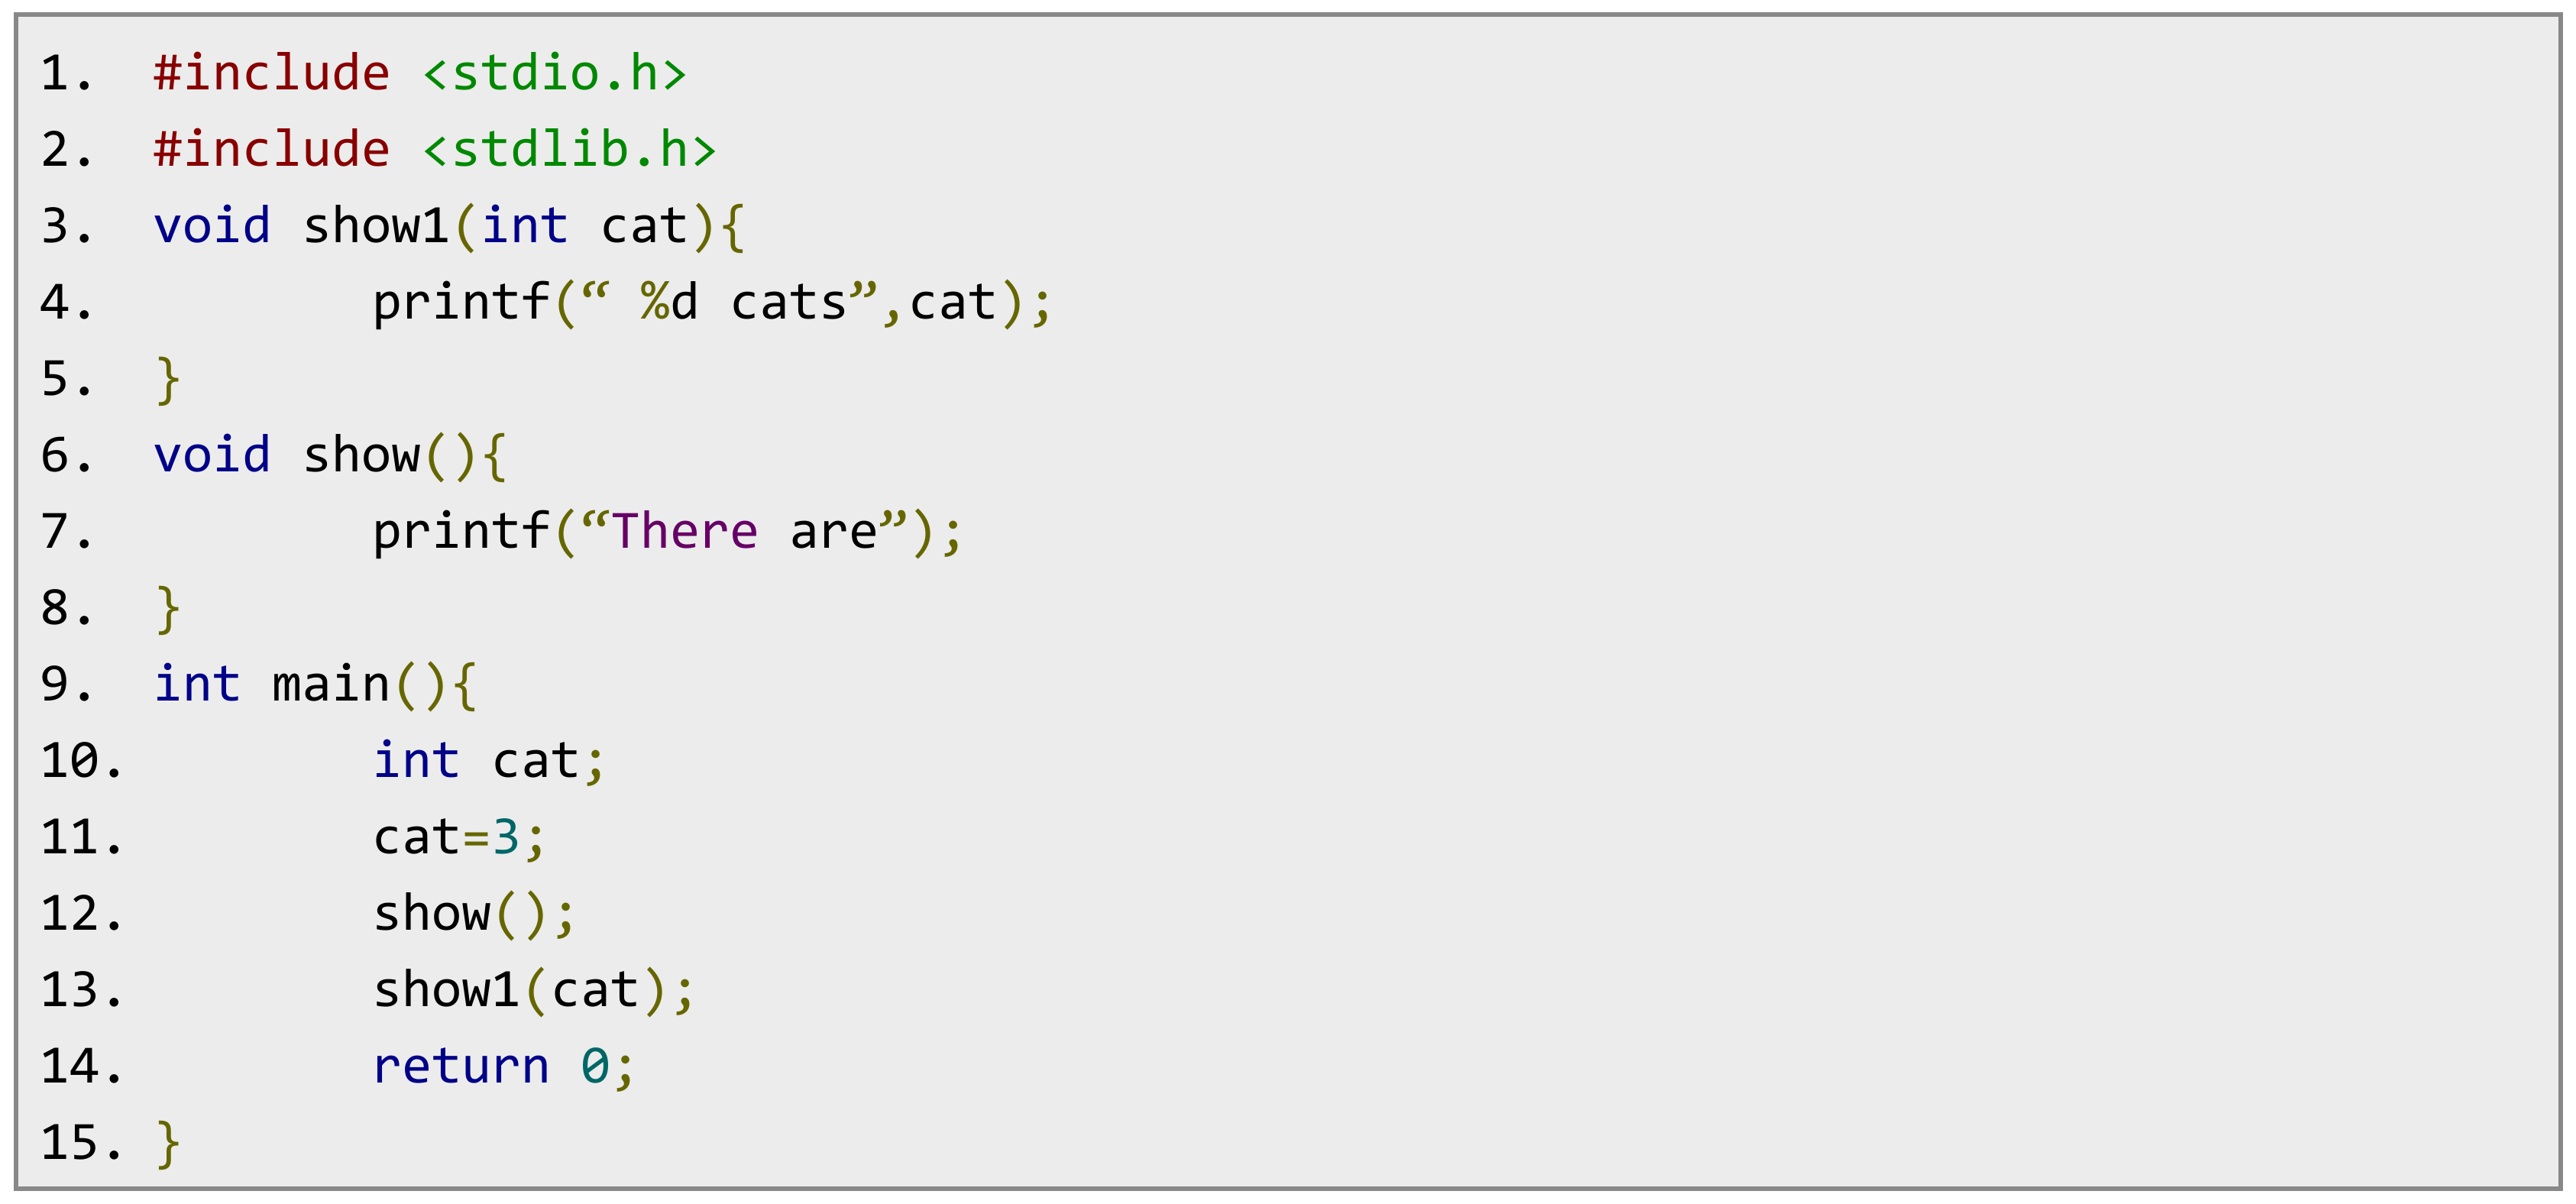
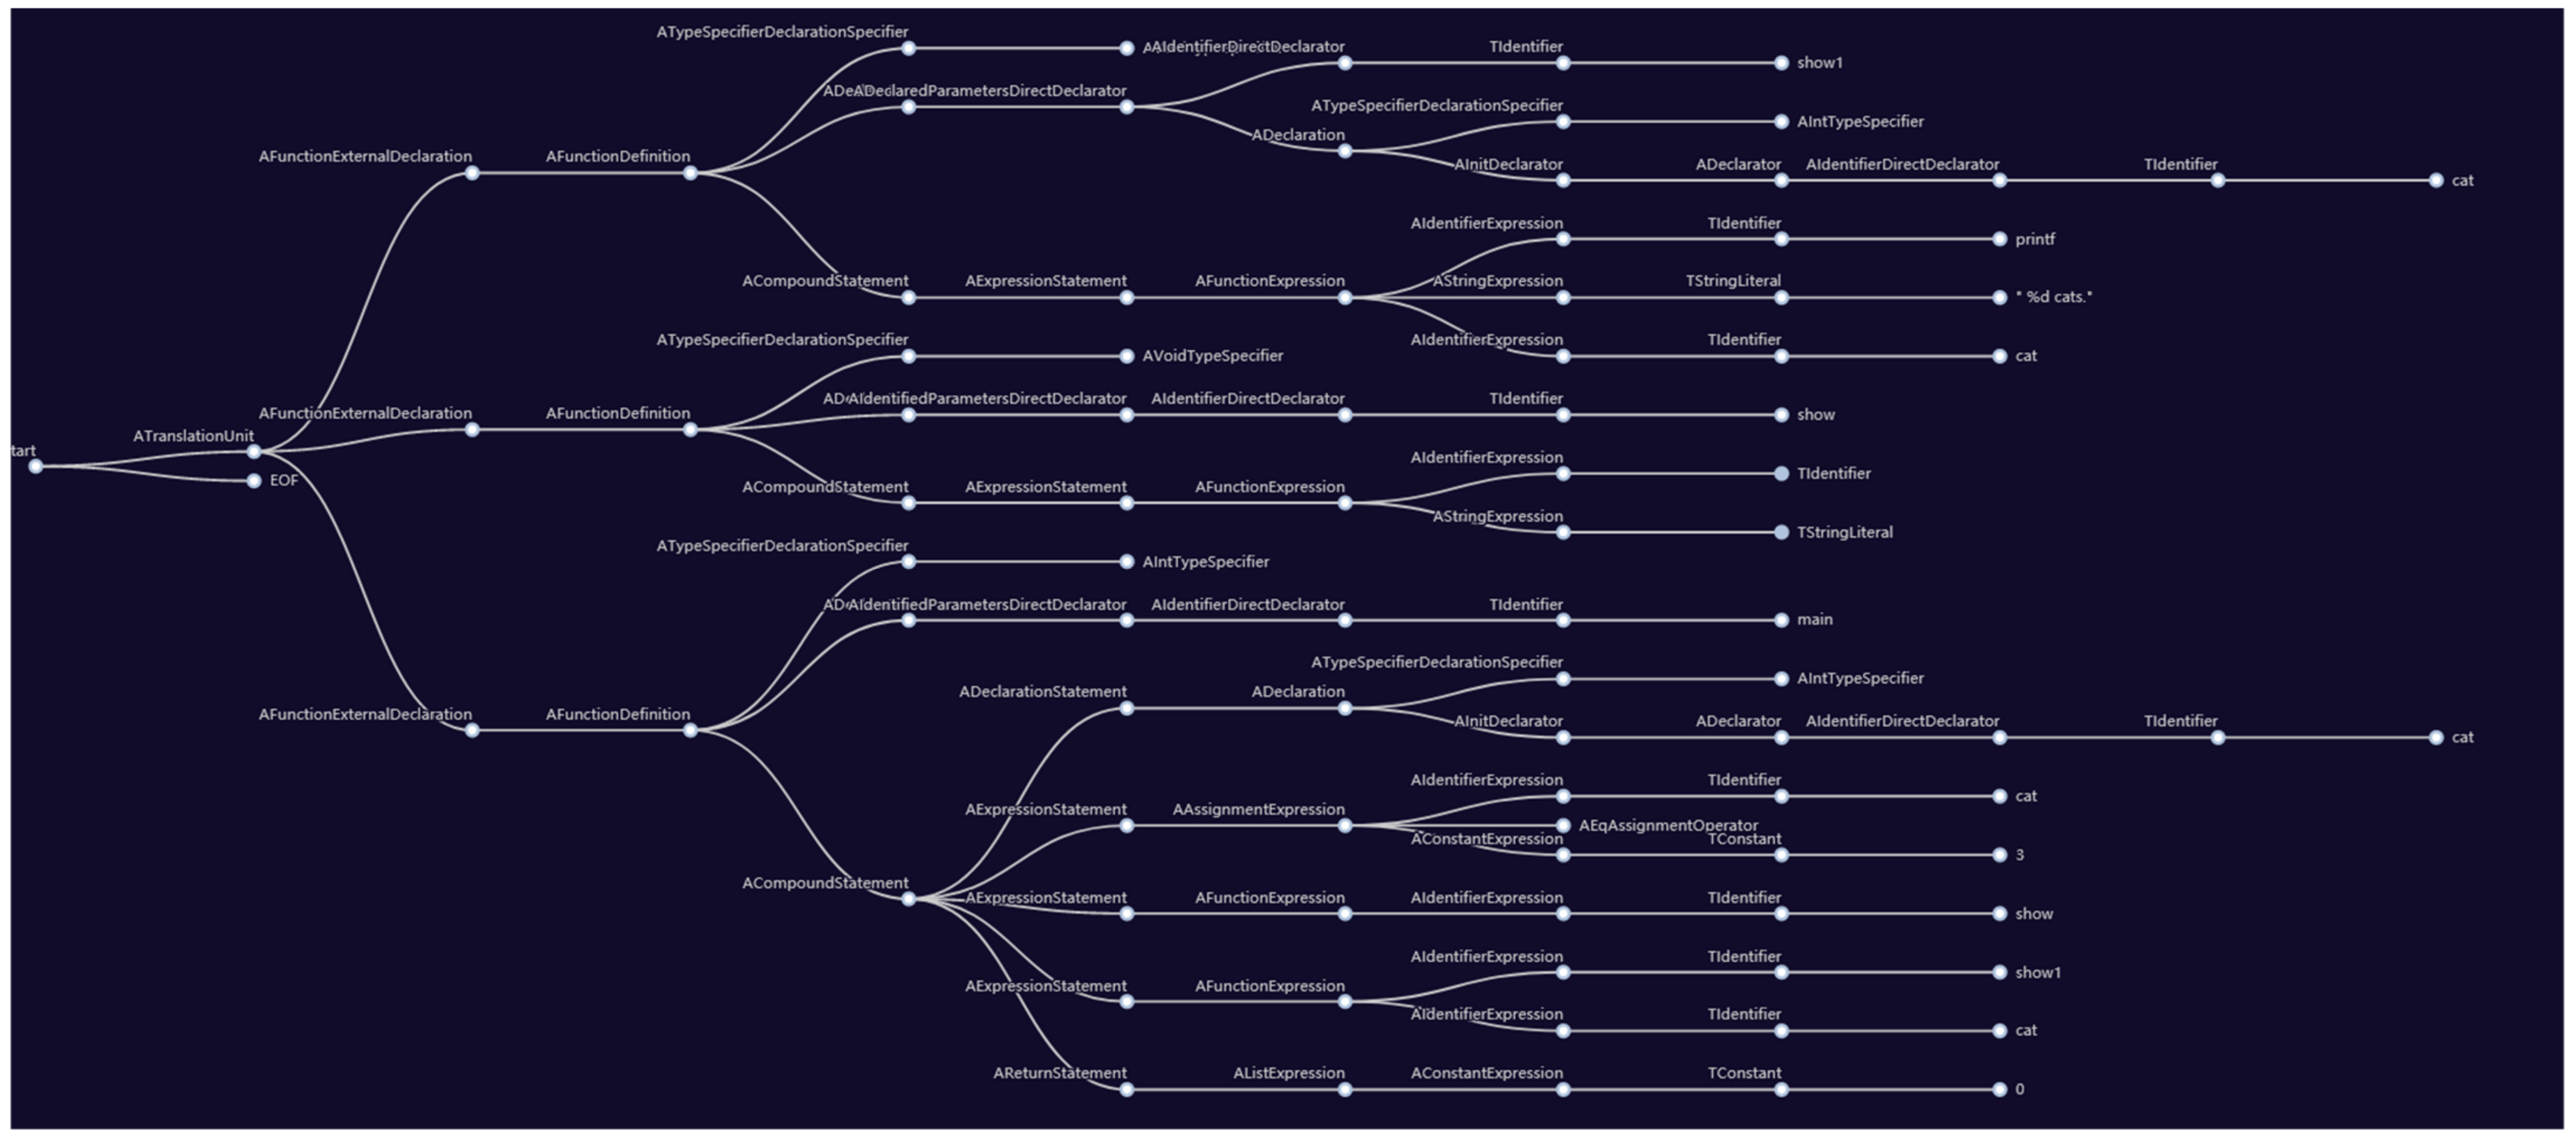
Figure 10 and
Figure 11 show another example of “copied” code that just reordered the functions show and show1, and its parsing tree.
In
Figure 9, we can see that there are 75 internal nodes, 96 branches, 26 different identifiers. Additionally in
Figure 11, there are the same 75 internal nodes, 96 branches, 26 different identifiers.
Table 1 shows all the different identifiers used in
Figure 9 and
Figure 11. In
Table 1, the identifiers of the internal nodes used in both parsing trees are listed. Comparing
Figure 9 and
Figure 11, the number of nodes, the number of branches, and the numbers of different identifiers are “the same”. If the code was reordered, the generated tree may display a different order, but the number of nodes and the number of branches are still the same. Hence, we use the parsing tree to compare two codes.
All of the parsing tree information can be stored into OTs easily. Not all of the information from the parsing tree is needed. If the two trees are the same or similar, the number of nodes and the number of branches should be the same. Hence, in this paper, the number of nodes, the number of branches, and the numbers of the different identifiers are stored in the Question parts of OT.
All of the data for one student in the files are combined into one OT. For a student, the score, time taken, action strings, and parsing tree information of one question are stored into one sub-OT of this student’s OT. Finally, all students’ OTs are combined into one big OT and sent to the next process: extracting information.
3.3. Extracting Information
In the proposed method, for different purposes, different information is required. For checking the loyalty of the students, the scores, action logs, and the time taken for all questions are required and extracted from the OT according to the question identifiers in the sub-OTs and stored into vectors for processing in the convolution neural network.
Additionally, to check for plagiarism, the information, such as the scores, time taken, action logs, and information from the parsing tree, is extracted and stored into a vector for further verification.
3.4. Plagiarism Checking
In this paper, we check for plagiarism in different processes. However, two situations should be considered when checking for plagiarism.
At the early stages of learning, the codes of all students are similar since the question is simple and students are learning from the teacher’s code. At that time, if the only information from the code parsing tree is checked, then we obtain the result that “all codes of students are copied”. That is not the goal of education. Hence, at the initial stages, the information from the code parsing tree should not be used.
When the question becomes increasingly complicated, sometimes, teachers use the default code and modify the default code to fit the requirements of the question. At this moment, the teachers obtain a “C” in the action log, which means “copied code”. If we check the action logs only, then teachers have also plagiarized.
For these two situations, we cannot only consider the information from the code parsing tree or the action logs. We should combine the information from the code parsing trees and coding action strings to observe the behaviors.
Hence, in this paper, we use the information from the parsing tree as a pre-selection requirement. If the code of one student is similar to the codes of other students, a flag is triggered. Then, the score, action log, and duration are also checked. If the number of actions performed by one student when solving a question is short, the duration is short, and the score is high or perfect, then they may have plagiarized.
Suppose that score
ssi is the score,
tsi is the time taken, and
asi is the length of the action string of student
s when solving question
i. The function
Spi(
ssi) is used to check the score and is defined as follows:
where the value
smaxi is the highest score of question
i. Additionally, the function
Tpi(
tsi) is used to check the time taken and is defined as follows:
where
ue is a constant value and represents the minimum time spent solving this question. Though this function is similar to Equation (1), the uses of the two functions are different. The function
Api(
asi) is similarly used to check the action string and is defined as follows:
where
ae is a constant value and represents the minimum action string for solving question
i. Hence, the plagiarism degree
PD(
ssi,
tsi,
asi) is defined as follows:
Additionally, we defined the function Pcopy(
PD(
ssi,
tsi,
asi)) as in
Figure 12.
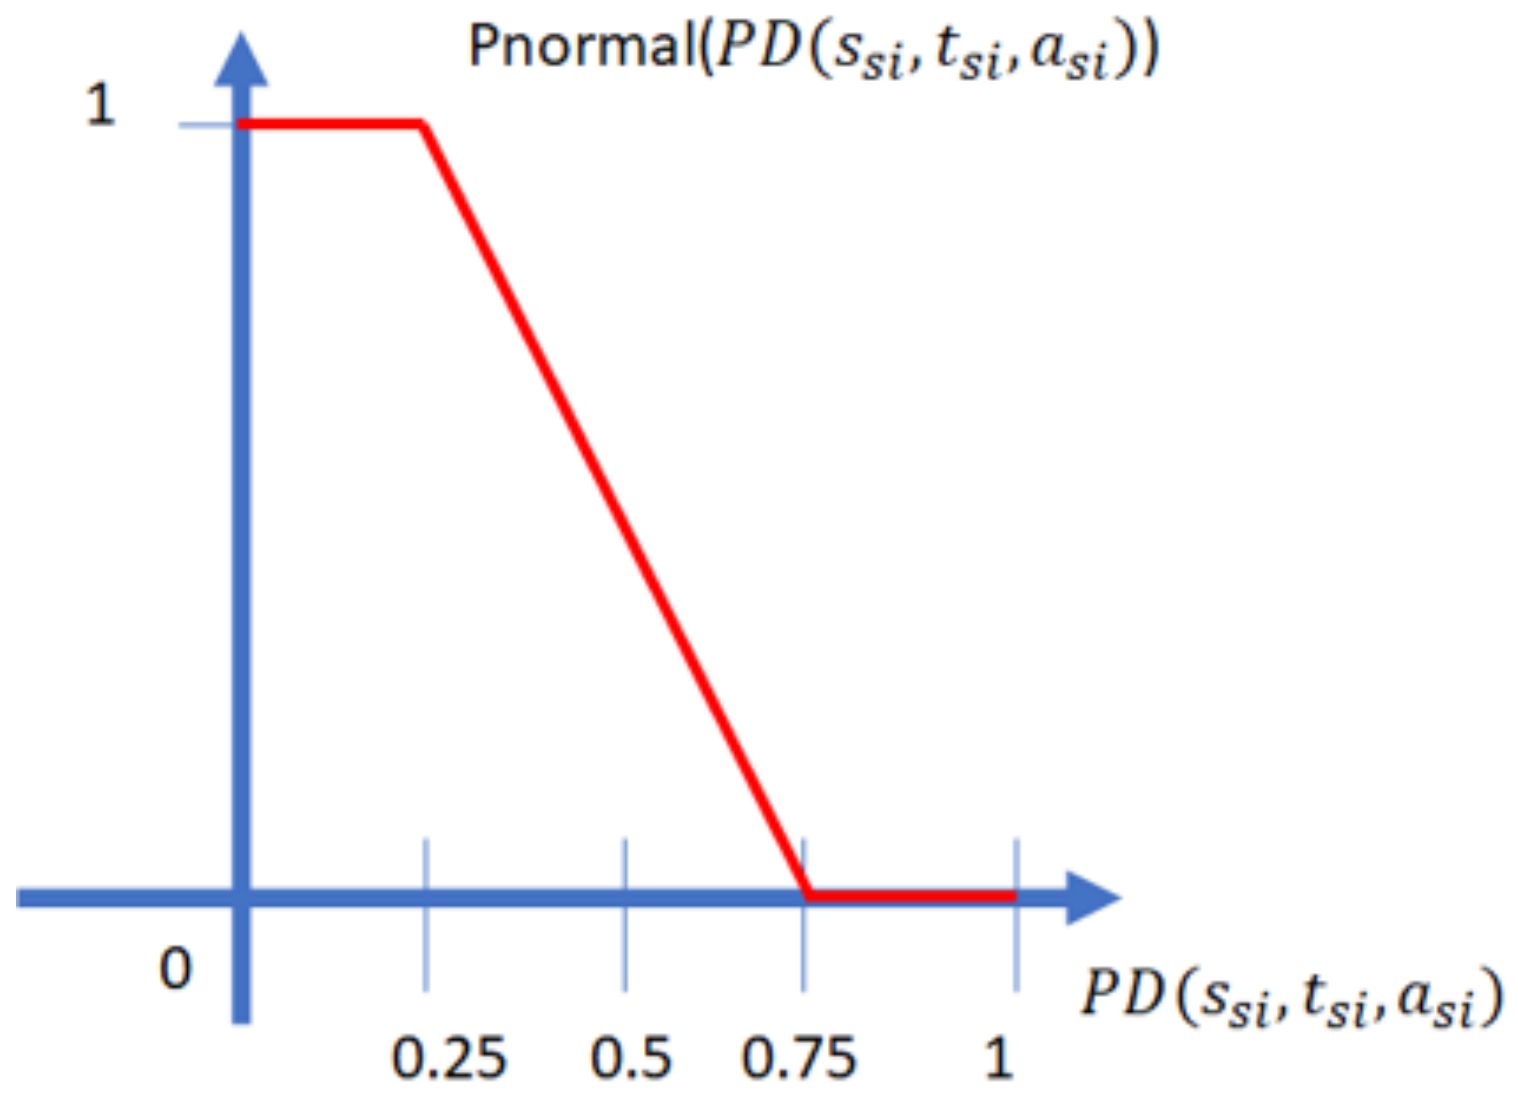
The function Pnormal(
PD(
ssi,
tsi,
asi)) is defined as in
Figure 13.
Finally, the function PD_f is defined as follows:
Using Equation (7), a judgment on the level of plagiarism can be made. After checking for plagiarism, the results are sent to the output.
Additionally, the class loyalty of the student is checked in the next subsection.
3.5. Convolution Neural Network
In this paper, we use the convolution neural network to predict which students are “good” students. However, defining “good” is hard. Hence, class loyalty and scores are used in this paper to reflect the term “good”.
Note that the class loyalty that we defined here is the degree to which a student wants to stay in the class and their will to learn the contents of the course. In order to check the class loyalty of the student, we defined Equations (1) and (2), which were defined in
Section 2.3. According to the results of Equations (1) and (2), the measurements of class loyalty of a student
s is defined in
Table 2.
For example, a student spends three hundred seconds and performs five hundred actions when solving one question. Additionally, the maximum time for solving this question is 1200 s; the shortest time for solving this question is 30 s; the maximum and minimum number of actions for solving this problem are 10,000 and 100. Hence, the
tci (
tsi) of this student is
Additionally, the
aci(
asi) of this student is
When we look up
Table 1, the class loyalty of this student for question
i is “high” since the
tci is greater than 0.6 and the
aci is greater than 0.6. If the class loyalty of a student is “low”, the teacher can give help to the student to increase their class loyalty.
In addition, the convolution neural network is also adopted to evaluate the loyalty of the students. The scores, time taken, and number of actions performed for all questions are used as features. The final scores of the students are used. The scores are sorted and separated into three categories of equal size. Then, the data are labeled according to the scores and the categories.
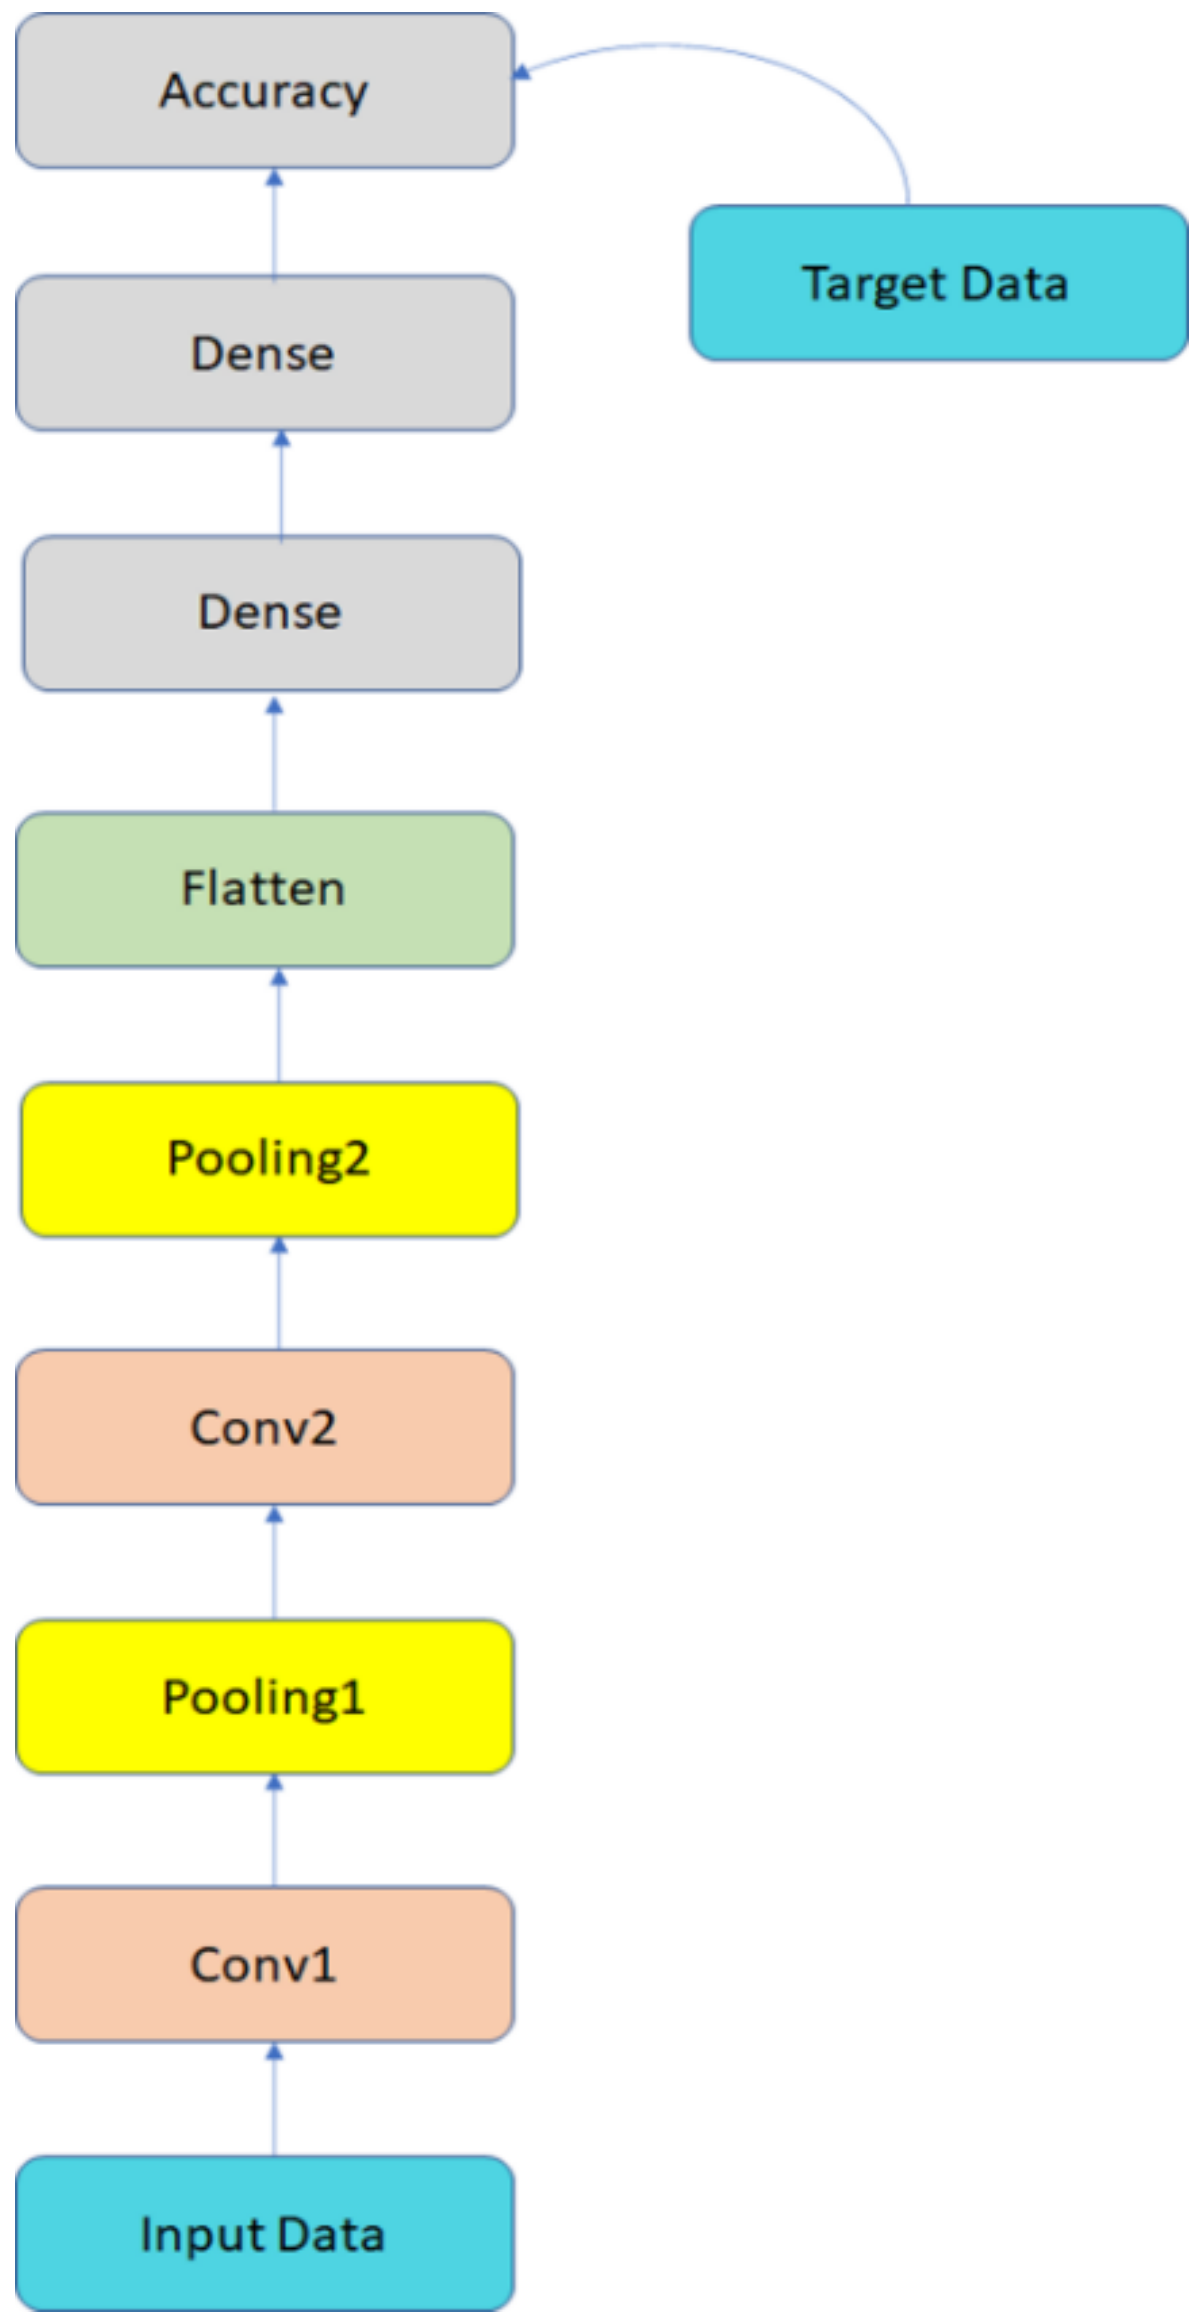
Figure 14 shows the CNN used in the proposed method.
In
Figure 14, the data are sent to the model by Convolution layer 1 (Conv1), max-pooling 1 (Pooling1), Convolution layer 2 (Conv2), and max pooling 2 (Pooling2). Then, the matrix is sent to the subsampling layer to flatten the matrix into a one-dimensional vector and sent to the fully connected neural network. In the next section, we compare the results obtained using the scores and the results obtained using the fuzzy method to predict the scores.
4. Experimental Results
4.1. Experimental Environment
In this paper, we collected three different classes (a total of two hundred and six samples) of students at National Chung Cheng University in Taiwan for the C language course. The C language course is two hours per week and consists of a total of eighteen weeks. Twenty-eight question sets were used to observe the behaviors of the students. The question sets were designed to teaching programming in C, such as variables, if–else statements, loops, arrays, strings, etc. Each question set consists of five or more questions. At each week, the teacher first demonstrated one or two questions in the question set and the students finished the rest of the questions in the question sets.
The goals of the experiments were to find diligent students who do not use any tricks and students with high scores. However, in order to obtain the natural behaviors of the students, the goals of the two experiments were hidden from the students. The students took the class as usual. Due to roll calls in each course, no absences were found.
After a semester (18 weeks), the data were collected from the DICE servers. All of the actions, scores, and time taken to perform actions for the students were collected. All of the information was used for analysis (plagiarism and class loyalty).
In addition, the CPU used was an Intel i7 9750H 2.6 GHz (Intel, Santa Clara, CA, USA), the RAM was 16 G, the video card was an NVIDIA GeForce RTX 2060 (NVIDIA, Santa Clara, CA, USA), the Python version was 3.8.5, and the “Keras” package of tensorflow was used to perform these experiments.
4.2. Plagiarism Check
In this section, we find out whether students plagiarized. In this experiment, we analyzed all of the scores, action strings, and time taken by the students using Equation (7).
The data consisted of two hundred and six students, and each student finished twenty-eight question sets.
We found that 57 students plagiarized and a total of 575 out of 5768 questions may have been copied. Most students not only have perfect scores but also short times taken and short actions strings. All of these students had at least eight instances of plagiarism. Though almost one in four students plagiarized, many of them were diligent students who did not use any tricks. Hence, we further check the class loyalty of the students in the next section.
4.3. Class Loyalty Experiments
In this section, we perform two experiments to detect which students have high class loyalty and which students obtained high scores. In the first experiment, we examine the relationship between students with high class loyalty and students with high scores. Hence, we transformed the time taken and the number of actions performed for each question to the tci and aci of each question and use those values to predict the scores. If the prediction accuracy is higher or equal to the prediction accuracy using the original time taken and number of actions, the fuzzy model is proven to be useful in finding which students obtain high scores and have high class loyalty.
In this experiment, in order to find the values of ue and ae, the time taken and number of actions performed for the top 1/3 students in the same class are collected. Then, the times of these students are averaged and divided by twenty, which is the time taken by experts. Similarly, the time taken and the number of actions performed of top 1/3 students are averaged and divided by four, which is the number of actions performed by experts. Once ue and ae are set, the fuzzy membership function is applied to evaluate the students. After obtaining the fuzzy values of each student when solving questions, we use these values to predict their scores.
In this experiment, students within the same class were classified into three equal-sized categories according to the final scores of the students. After that, the dataset was randomly separated into 90% training and 10% testing for twenty runs.
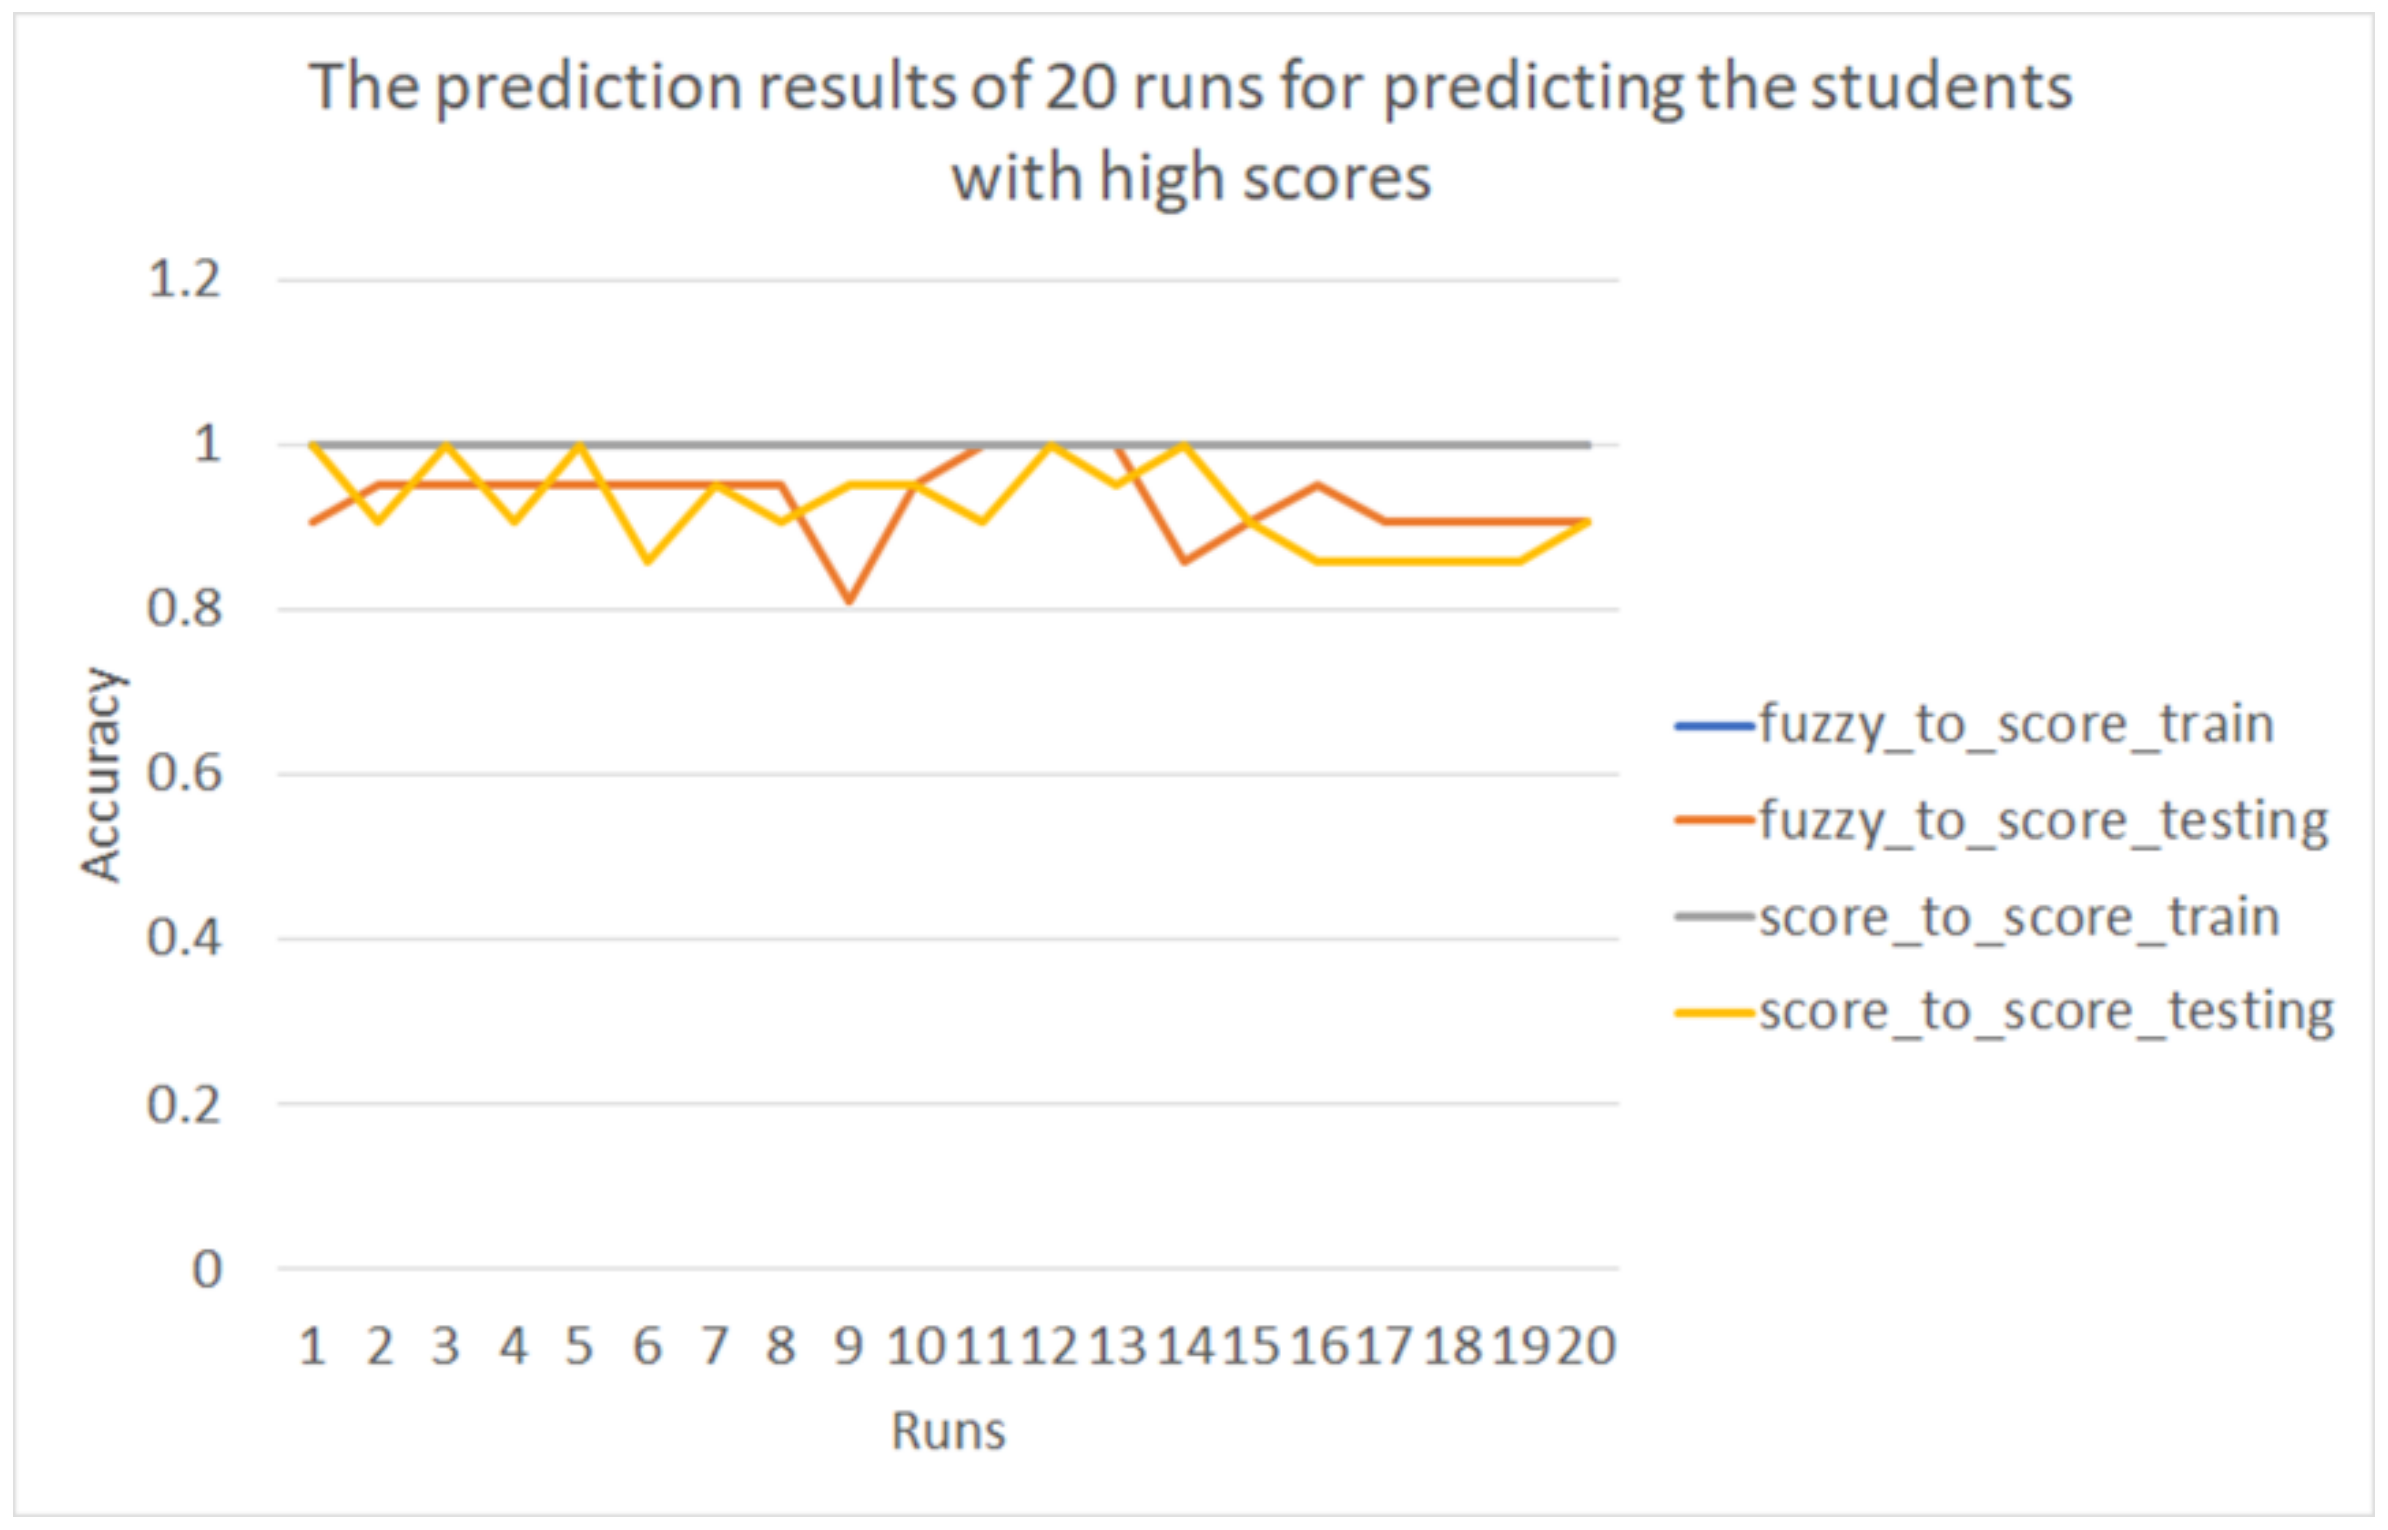
Figure 15 shows the results of the prediction accuracies.
In
Figure 15, the line in blue represents the accuracies of the training dataset using the fuzzy membership function to predict the scores; the line in orange represents the accuracies of the test dataset using the fuzzy membership function to predict the scores; the line in gray represents the accuracies of the training dataset using the original time taken and the number of actions to predict the scores; and the line in yellow represents the accuracies of the test dataset using the original time taken and the number of actions to predict the scores. The average accuracies of twenty runs are shown in
Table 3.
According to the results in
Table 3, no significant differences between the fuzzy method and using the original values were found, which means that the fuzzy model can be used to find students with high scores and who have high class loyalty.
In the second experiment, the students with high class loyalty are found using the fuzzy model or using the original time taken and the number of actions. In this experiment, if the student obtained “high” membership in the fuzzy results when solving one question, then two points are awarded for that question; if the student obtained a “normal” membership in the fuzzy results, then one point is awarded for that question; and if the results show “low” membership when solving one question, then 0 points are awarded for that question. Finally, the fuzzy scores were summed as the fuzzy scores of the students. Additionally, we separated the students within one class into three categories according to the fuzzy scores. Similar to experiment 1, the dataset was randomly separated into 90% training and 10% testing for twenty runs.
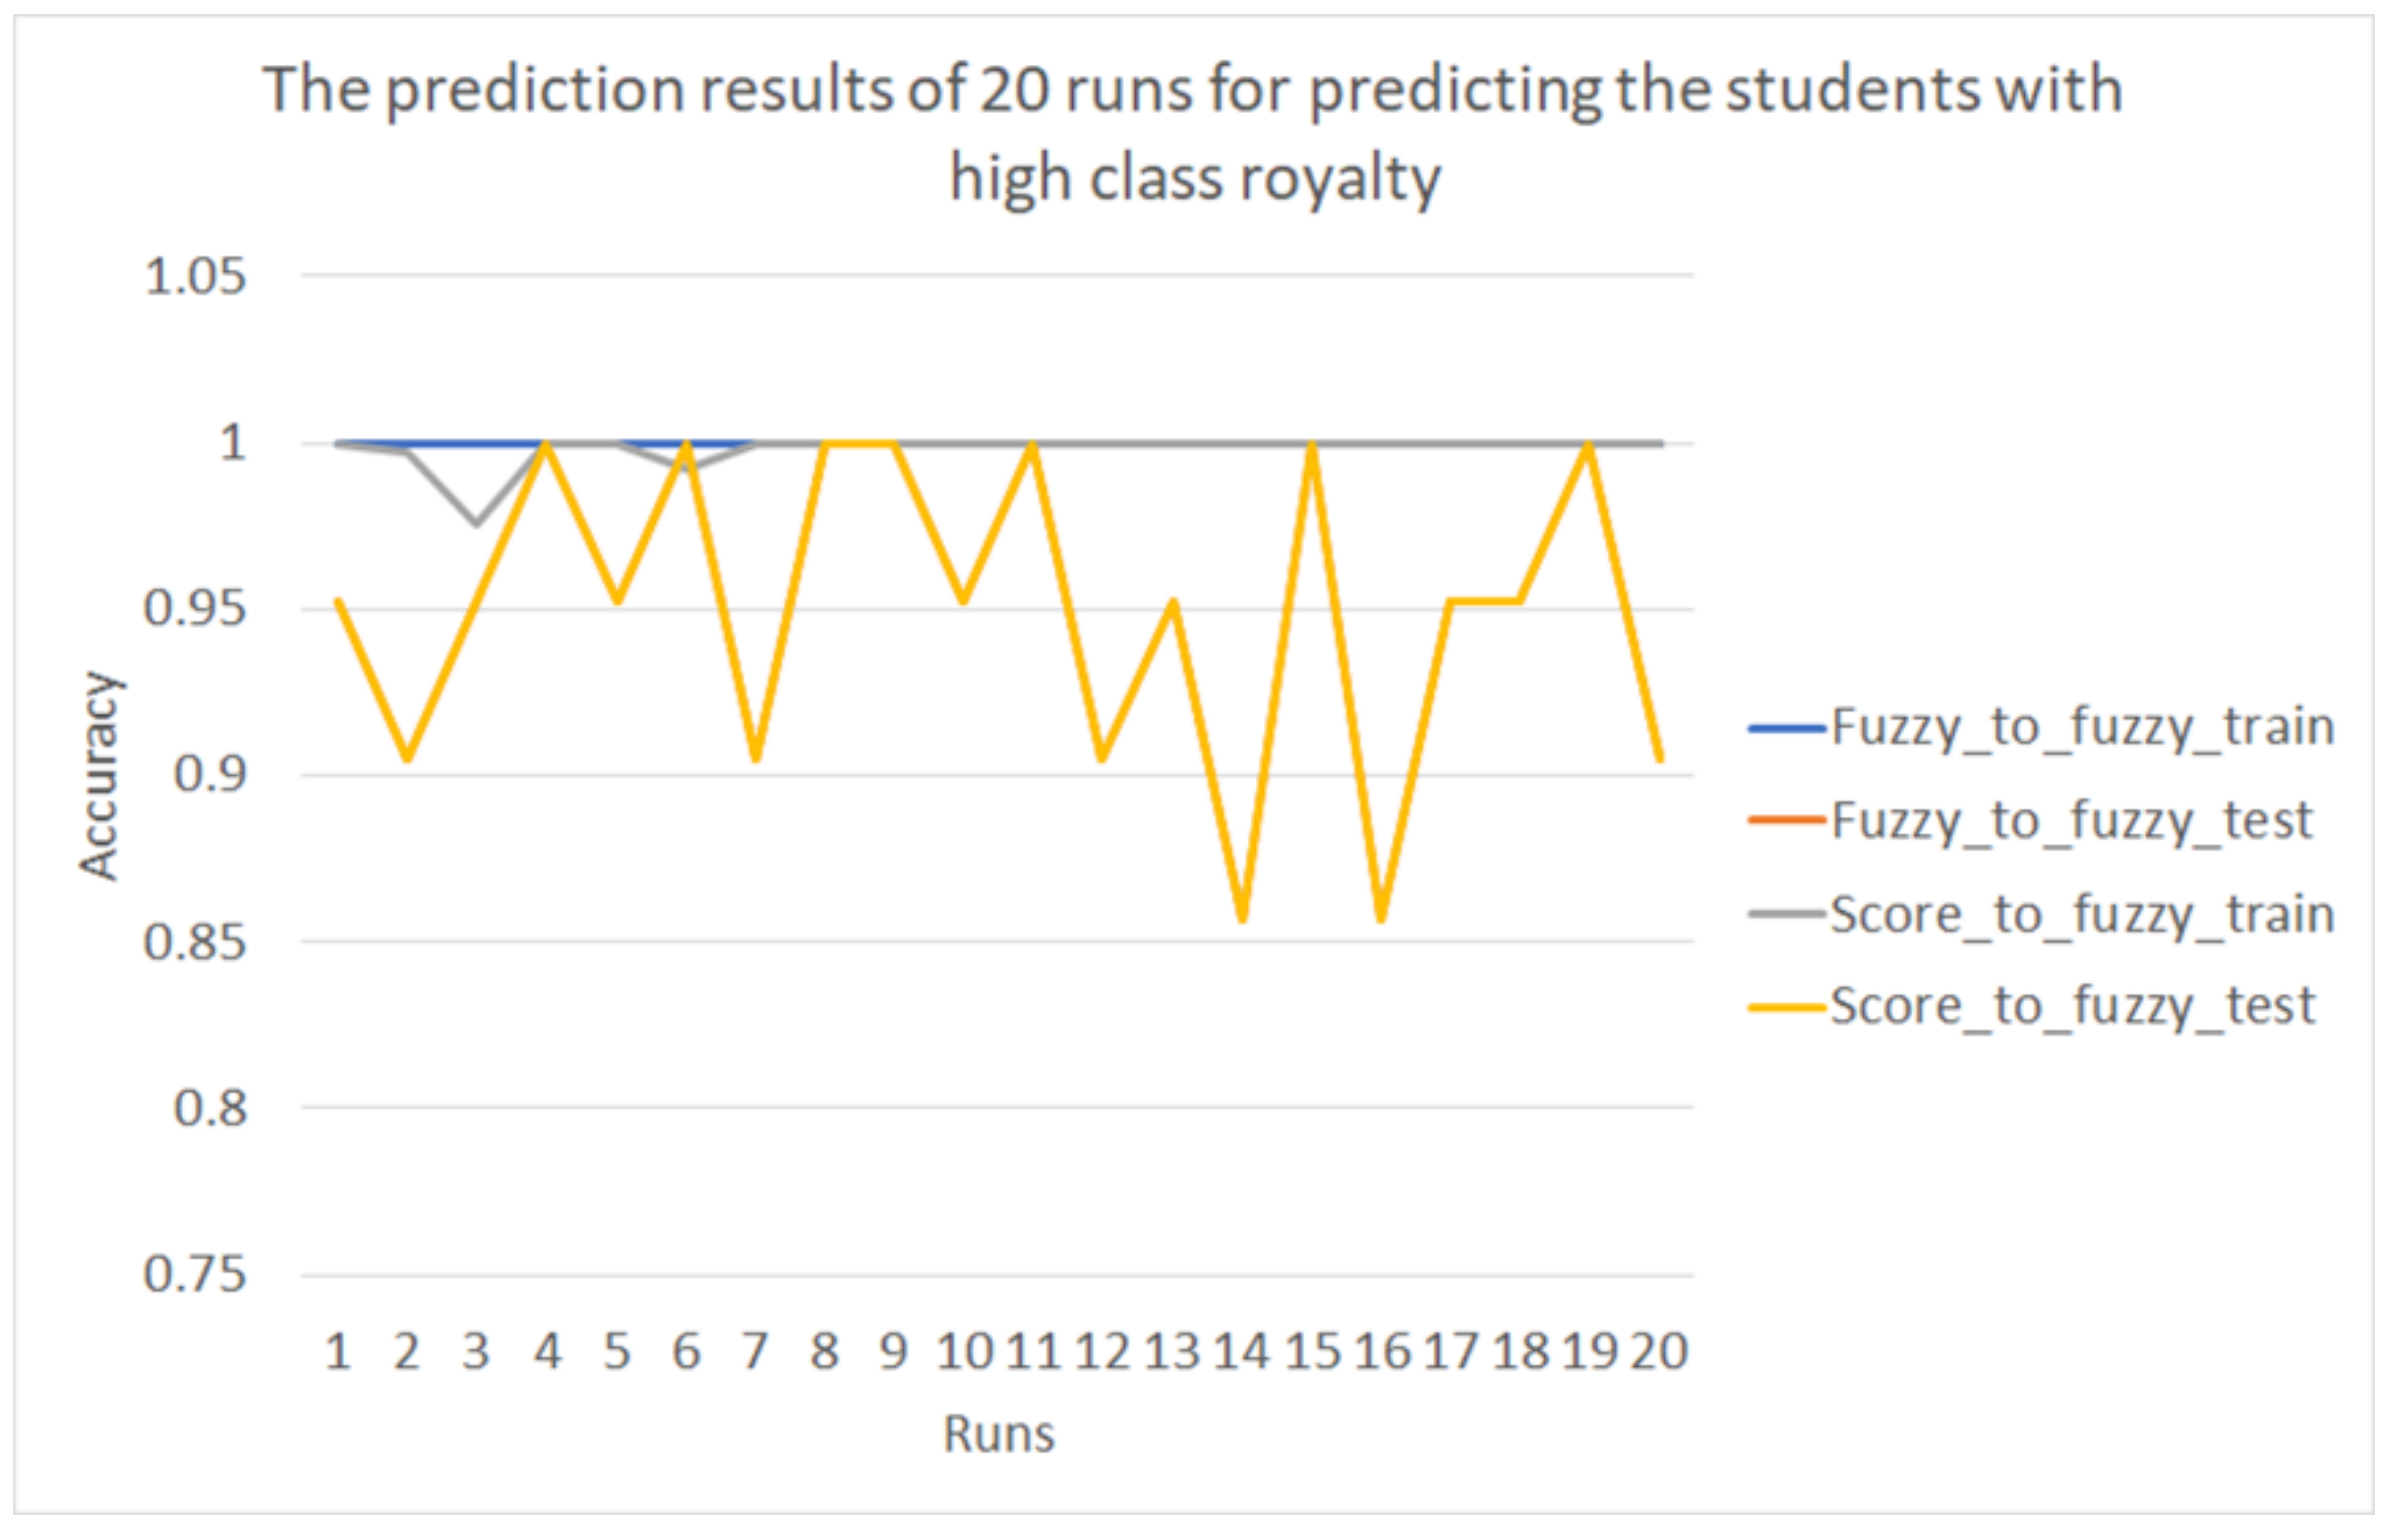
Figure 16 shows the prediction results of the twenty runs for predicting which students have high class loyalty.
In
Figure 16, the line in blue represents the accuracies of the training dataset using the fuzzy membership function to predict the higher class loyalty; the line in orange represents the accuracies of the test dataset using the fuzzy membership function; the line in gray represents the accuracies of the training dataset using the original time taken and the number of actions; the line in yellow represents the accuracies of the test dataset using the original time taken and the number of actions. The average accuracies of twenty runs are shown in
Table 4.
According to the results in
Table 4, a significant difference was found between the fuzzy method and using original values, which means that the time taken and the number of actions performed by students are not the best for predicting which students have high class loyalty.
5. Discussion
In this paper, we did not perform a pre-test and a post-test for the students. Those tests are used to verify the performance of the proposed method. However, it can be achieved using questionnaires but can be misled by the behaviors of students answering the questions. Even if we set some questions to avoid students answering the questionnaires randomly, the questionnaires cannot reflect whether the students plagiarized.
In addition, designing questionnaires to reflect class loyalty is difficult. We directly used the data on the server to verify these two facts. Faking behaviors in each course when a student programs is hard, but faking the results of the questionnaires is easy. If the system does not warn that the students copied code, the students are not aware that their behaviors are monitored by the teacher. This reflects the actual situation in a class during the course. In addition, class loyalty is hardly reflected by the questions in a questionnaire but can be easily observed using the behaviors of a student solving questions. Hence, in this paper, we focus on the data to verify the behaviors and class loyalty of the students.
Though we found a way to observe whether students plagiarized, we are not trying to punish students for their behavior but rather we try to send a warning to the students. In our opinion, students who copy work are trying to pass the question without exerting any effort. If we can stop this behavior when they try to copy code from others, the student can be made aware that their behavior is being monitored and may try to solve questions by themself. Hence, though, in this paper, we proposed a way to assess for plagiarism, we still want to provide opportunities to students who plagiarized by warnings instead of punishing their behavior by decreasing their scores.
During the two experiments, two interesting things are found. First, when observing the class loyalty of a student, we found that some students with lower scores also exhibit a special behavior: they spend over twenty hours and perform over one hundred actions on a beginner question ‘Hello World!’ To discover the reasons for this behavior, we further observe the behaviors of the students in each course. We found that the students are not really solving the question ‘Hello World!’ but “pretending” that they are solving the questions while actually waiting for the answers to other questions from other, diligent students.
Since the teachers in the class cannot focus on all students but have to walk around to solve the problems that come from different students, teachers can only assess the progress of a student’s learning by observing the situation when solving questions, how many questions the students have solved, and the scores obtained by those students. This kind of student spends a lot of time pretending and waiting on diligent students’ answers before copying their answers. This kind of situation worsened during the epidemic since, for distance learning, the teachers and students are not present at the same place. The teachers cannot directly observe whether students are really solving questions. When the students are under surveillance, students tend to solve the problems more seriously. However, when no one is watching, some students become lazy and engage in other activities instead of solving questions, such as playing games.
Based on the class loyalty measured, we can also discover which students have lower-class loyalty and obtain lower final scores, which are students who do not have high class loyalty and just want to pass the course without exerting any effort. Hence, observing the class loyalty of students is another feasible way for a teacher to observe the learning behaviors of their students during the epidemic.
Second, while observing the students’ behaviors, we found that some students have high class loyalty for each question but do not obtain high scores. Those students only obtain better than average scores. This situation interests us. The reason why those students have high class loyalty after not obtaining high scores cannot be known via the data stored in the server. Our guess is that those students may simply be happy in that they can overcome hard problems. However, this remains an open issue without any evidence to prove our hypothesis.
6. Conclusions
We proposed a novel method combined with a convolution neural network to predict class loyalty and a novel method to discover whether students plagiarized during distance learning during the COVID-19 epidemic. We first defined some fuzzy membership functions for evaluating class loyalty. Additionally, to detect instances of plagiarism, the parsing trees of programming code were adopted for fast filtering and the fuzzy membership function was used for further evaluation in order to prevent misjudgments. In the experiments, 206 students were assessed for high scores and high class loyalty. Each experiment was randomly separated into training and test datasets for twenty runs. For the high score experiments, the average accuracy of the training datasets using fuzzy membership functions combined with CNN was 100%, which is the same as that using CNN combined with the original time taken and the number of actions. For the test dataset, the accuracies of the two methods were almost the same: 93.34 and 92.62%. For finding which students have high class loyalty, the accuracies of the training datasets of the two methods were 100% and 99.82%. Additionally, the accuracies of the test datasets of the two methods were 95% and 92.74%. Hence, the proposed method can discover which students study hard and do not copy work. In the future, we can apply this system to other educational environments, such as English language learning.


