1. Introduction
Increases in the prevalence of obesity and associated metabolic diseases is undesirable in terms of a deterioration of individual life quality and an increase in social health care costs. The development of an effective method for the monitoring of caloric intake is very important in order to reduce the prevalence of people being overweight and/or obese [
1]. The “manual logging” method, where the type and amount of foods are recorded by users themselves, is known as a straightforward way of monitoring the intake of calories [
2,
3]. At present, there are many kinds of manual logging methods available in the form of smartphone apps. Since it is cumbersome for most users to record the type of food each mealtime, a method using a camera mounted on a smartphone to automatically recognize types of food has also been developed [
4]. Although high accuracy in the recognition of food type helps to partially reduce user discomfort, there is a problem with the lack of reliability due to human errors that include user laziness and erroneous record-keeping. Such problems are mainly due to the fact that some user intervention is necessary for the manual-logging methods.
Recent advances in sensor technology, signal processing techniques, detection, and recognition algorithms make it possible to continuously monitor the intake of calories with minimal user intervention [
5,
6,
7,
8,
9,
10,
11,
12,
13]. Visual cues have been used for the classification of food types and the estimation of food amount [
14,
15,
16,
17,
18,
19,
20]. A classical pattern recognition approach has also been adopted in visual-based food type recognition methods, where segmentation, feature extraction, and classification were sequentially carried out on the incoming images. Convolutional neural networks (CNN) have successfully been applied to various pattern recognition problems, and a CNN-based food recognition approach has also been proposed [
18]. In this approach, the relationship between the food image and its food type is explained by a nonlinear mapping rule that is constructed using a supervised learning algorithm. A higher level of recognition accuracy (typically, more than 95% [
17,
18]) has been achieved via the visual modality, by comparison with the other modalities (e.g., audio [
8] and ultrasound [
21]). It is known that the accuracy of the supervised learning-based classifier is more or less affected by the size of the training dataset. Hence, the performance would further be improved by using several food image datasets for food recognition, such as UEC-FOOD100 [
22], FOOD-101 [
23], VIREO Food-172 [
24], and other food image datasets [
25,
26]. The visual information has also been very useful in estimating the amount of food for the measurement of caloric intake. In this approach, the problem of measuring the amount of food is formulated as the volume estimation of the food via the given food image. The single-view approach [
15,
16,
17,
18,
19] is attractive in that it can easily be applied to existing mobile devices (e.g., smartphones with a single camera [
16]) without hardware modification. However, volume estimation using only a single view is very challenging, and has resulted in inaccurate caloric estimates. Accordingly, the multi-view approaches [
20,
27] that typically employ a stereo camera have generally been used for the volume estimation of food. There are inherent limitations with the image-based caloric estimation methods; first, the users must take a picture of the food eaten at every meal. Then, the measurement of caloric intake is achieved based on the assumption that all the food in the picture is eaten. Finally, food that is left behind creates a large error between the true caloric intake and the measured caloric intake.
The act of eating can be described by a series of specific movements or gestures. Based on this principle, the sequence of the signals derived from the motion sensors can be represented by a well-known sequence model, such as a hidden Markov model (HMM) [
28] or via long short-term memory (LSTM) networks [
29,
30]. Food intake events were detected with an accuracy of 80% for 10 subjects [
29] when LSTM was adopted. Since motion sensors are generally very small in size, motion-based methods have the advantage of being easily applied to many wearable devices. The amount of food consumed is assumed to be highly correlated with the number of the ingestive actions (chewing or swallowing). Hence, caloric intake can be estimated by counting the number of chewing events or swallowing events that are recognized using an ingestive motion recognizer. The caloric density, which is essential for calculating caloric intake from the amount of food consumed, depends on the type of food. Since it is very difficult to recognize the type of food using ingestive motion, a high level of estimation accuracy in caloric intake cannot be achieved using only motion-based approaches.
Sound from eating foods is useful for recognizing the type of food being consumed and chewing/swallowing events. The underlying principle is that chewing sounds vary depending on the shape, hardness, and moisture content of the food. Acoustic-based estimation of the ingestive behaviors has been proposed by several researchers, and these can be grouped into one of two broad categories: detection of chewing/swallowing [
5,
6,
9,
10,
11,
13,
21,
31] and classification of food type [
8,
32]. Caloric intake can be estimated by using caloric density and the amount of food consumed derived from a food-type recognizer and chewing/swallowing events detector, respectively. An average absolute error of 3.0 calories per food-type was obtained from the 10 subjects and four types of food using a neck-worn sensor equipped with acoustic, proximity, and inertial sensors [
33]. Although acoustic modality provides useful clues for estimating food intake amount, there are some drawbacks associated with the usage of the audio signal. Some degree of audible noise is always present in most eating environments (e.g., cafeteria and restaurants). Therefore, performance degradation due to background noise cannot be avoided in the audio-based methods. A contact-sensing method was employed to alleviate this problem, in which external noise was shielded by attaching the acoustic sensor to the skin of the neck (e.g., neck- or throat-microphones [
7,
33]) or placing it inside the ear (e.g., in-ear microphone [
12]). This approach can reduce noise effects to some extent, but the use of contact sensors can be uncomfortable for users and could exacerbate skin allergies. A Doppler-based approach has also been used to detect food ingestive behaviors [
21,
32]. The underlying principle is that Doppler frequency shifts are caused by movements of the chin and neck during meal time. The experimental results showed that the accuracy of recognizing chewing and swallowing events is comparable to that of the audio-based methods [
21]. Moreover, the performance was not seriously degraded even under severe noise conditions [
32].
In this study, ultrasonic Doppler signals (UDS) were used to detect chewing events during meal time, and the amount of food intake was estimated by using the number of chewing events during intervals of swallowing. The usefulness of the UDS in terms of detecting chew and swallow events was previously evaluated [
21]. In the present study, however, the feasibility tests were carried out using UDS to evaluate the accuracy of estimations of food-intake amounts. Although a reasonable performance in terms of food recognition accuracy (≥80%) was obtained via UDS alone [
32], it was difficult to discriminate the subtle differences between certain foods using only UDS. In this study, visual information was used to identify food items, where food images were recognized via CNN.
The remainder of this paper is organized as follows. An explanation of the developed sensor is presented in
Section 2. The overall procedure of the method used to estimate the food amount is described in
Section 3 which includes the audio-visual principle, feature extraction, a method for detecting chewing/swallowing events, and classifications of the types of food. The experimental results are given in
Section 4. Finally, concluding remarks and directions for future study are provided in
Section 5.
2. Hybrid Ultrasonic and Visual Sensor Device
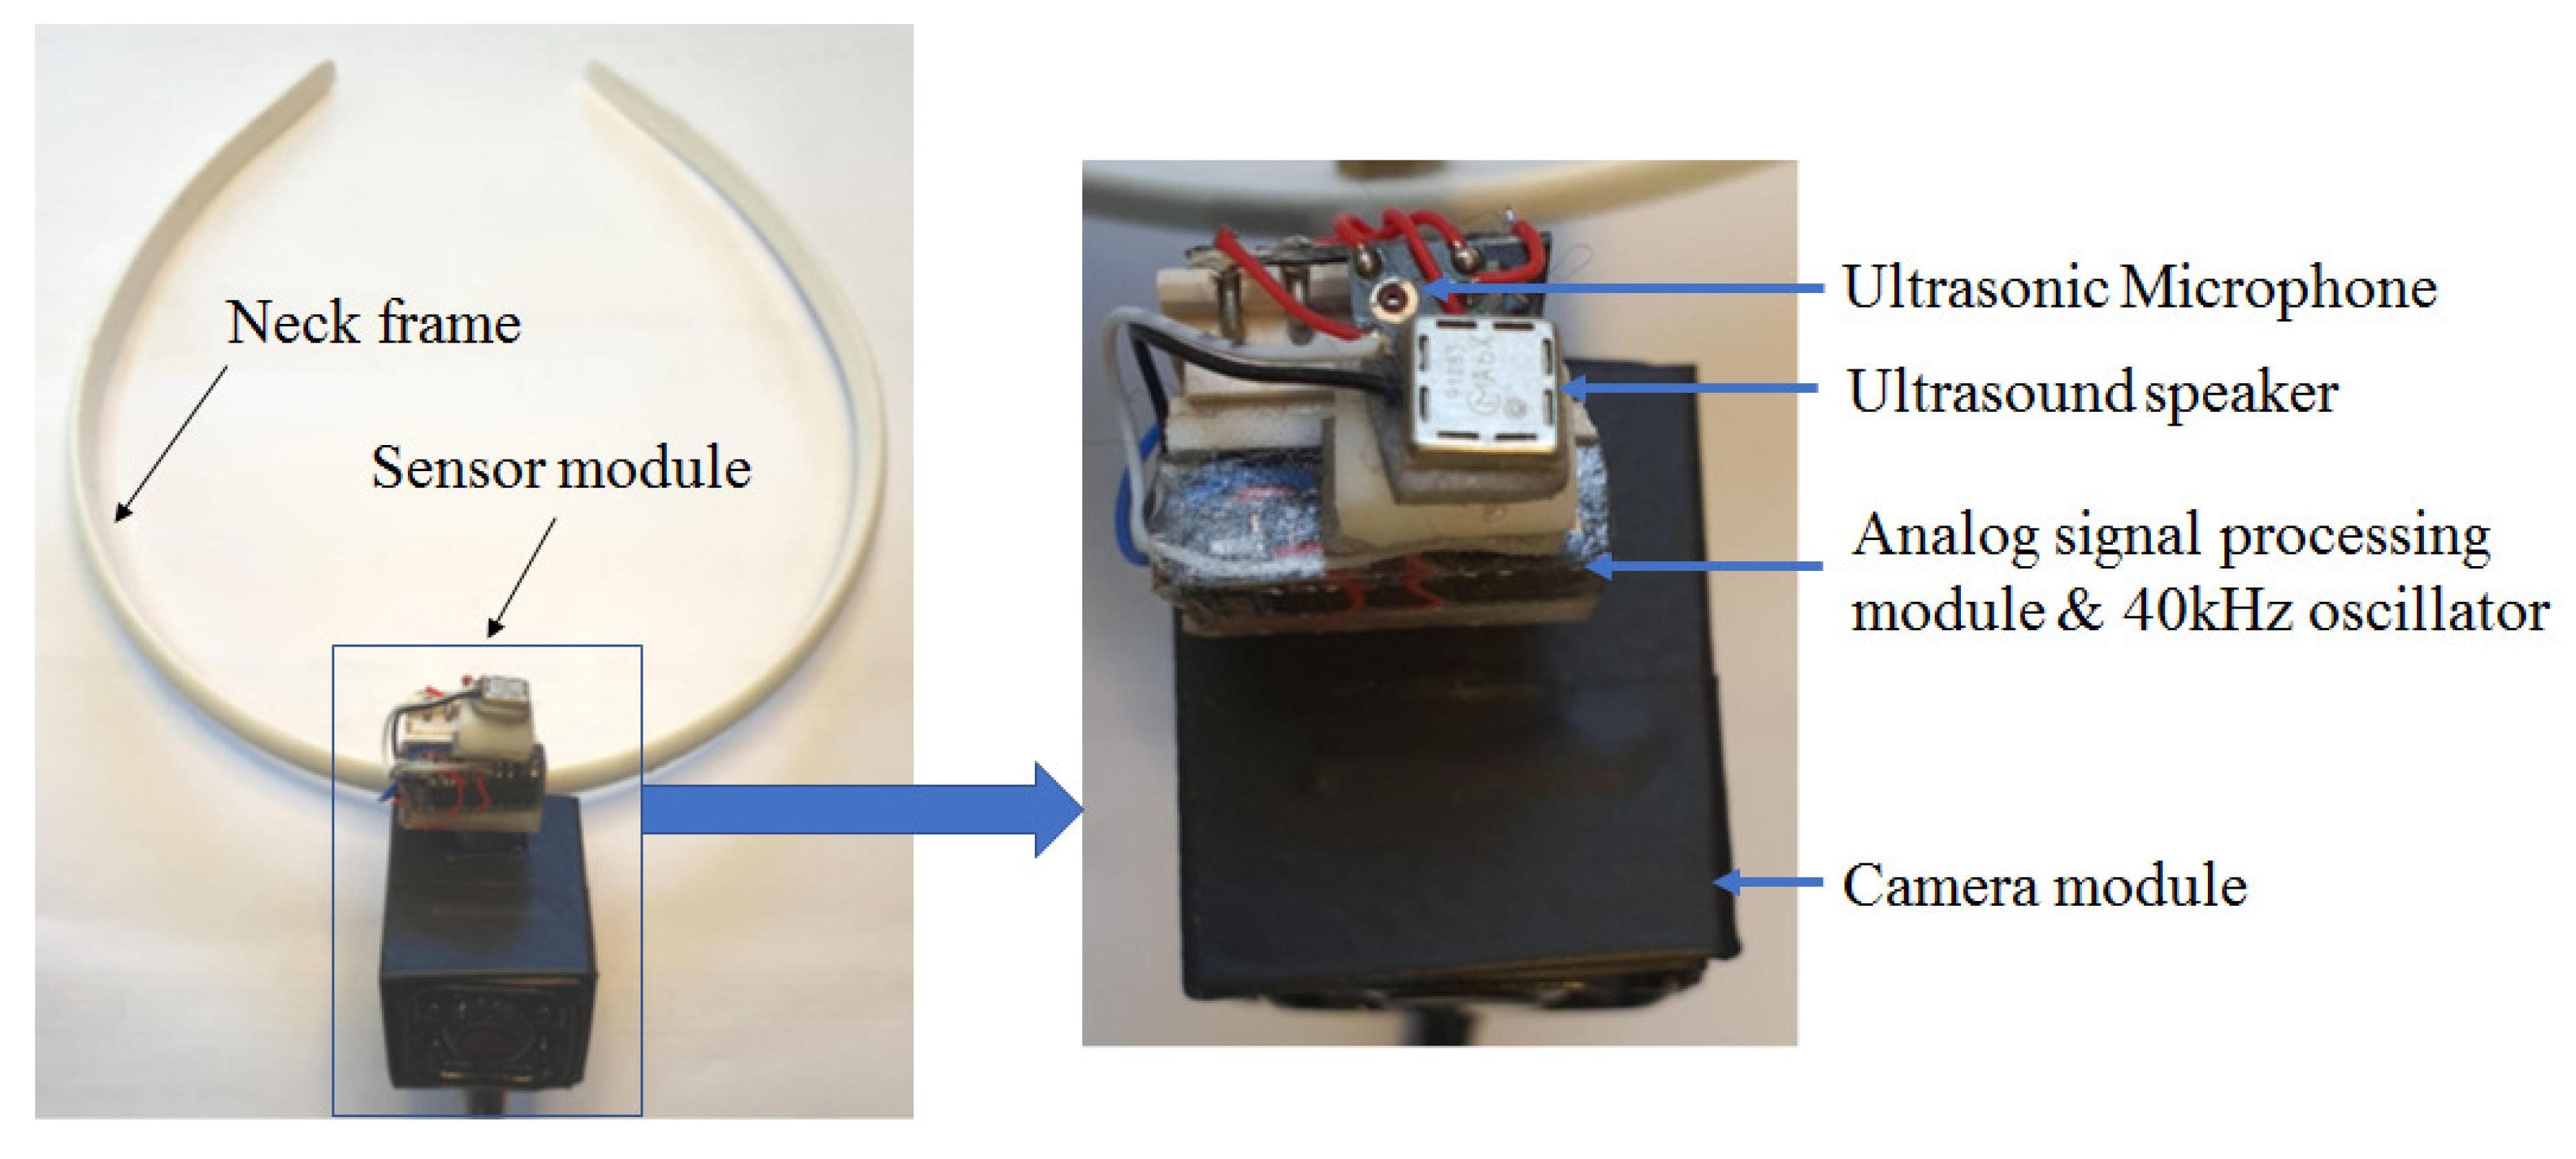
In this study, a sensor device was developed to detect jaw movements and sounds associated with food ingestion. A photograph of the developed sensor device is shown in
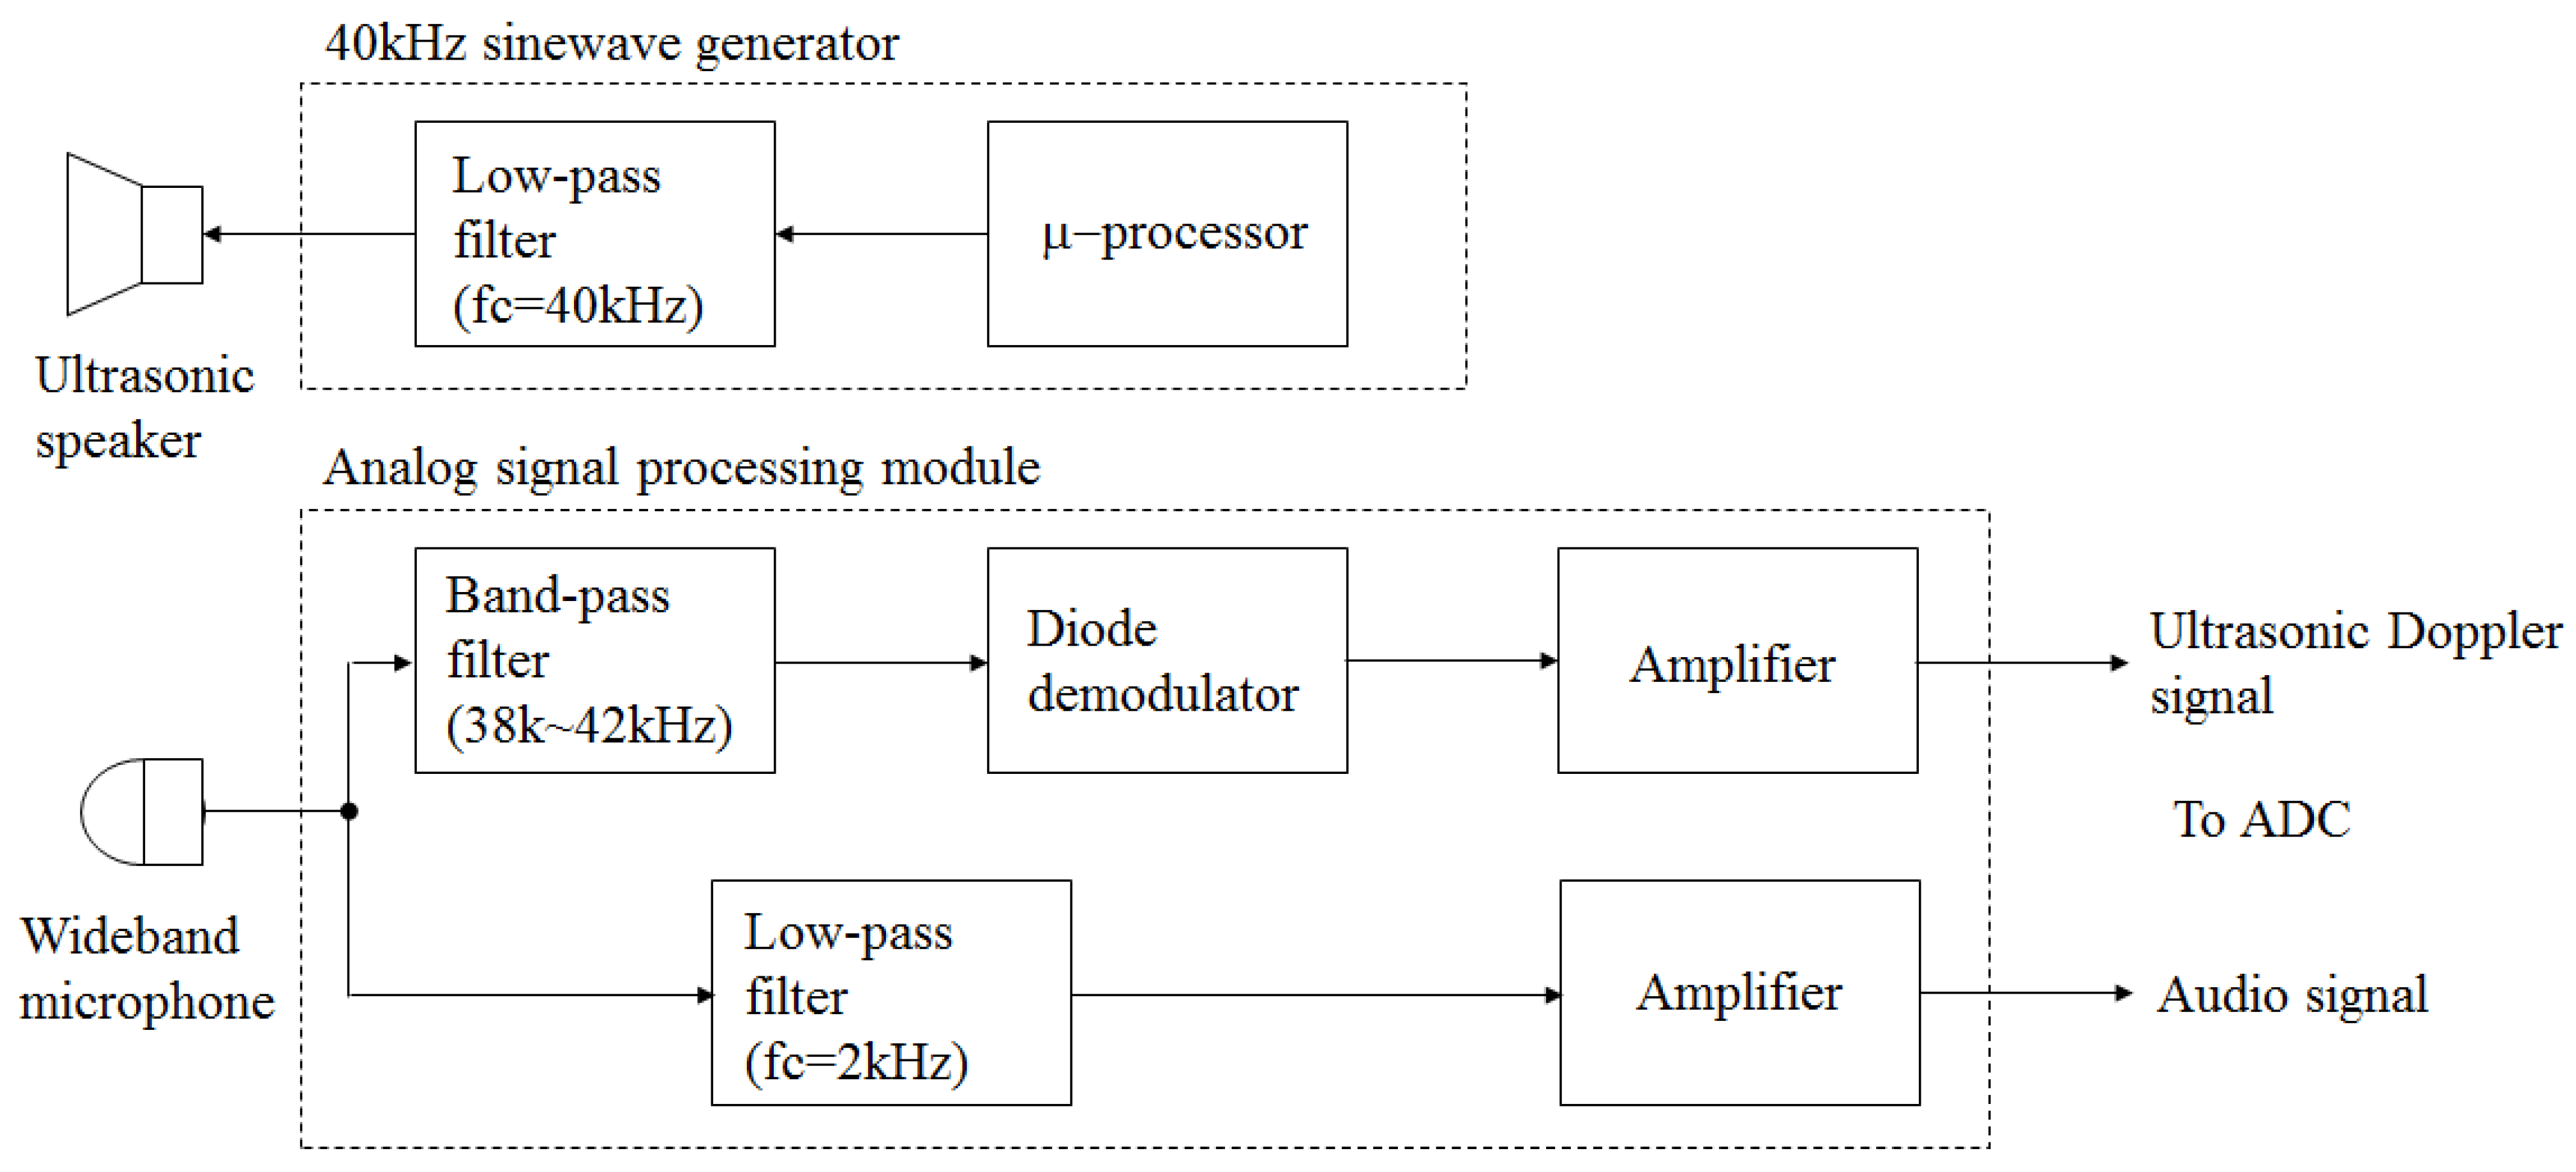
Figure 1. There are four modules in the sensor device: a sine wave generator, an ultrasound speaker, a wide band microphone, and an analog signal-processing module that appears in
Figure 2. In a sine wave generator module, a square wave of 40 kHz is first generated by ATtiny402 microprocessor [
34] and a 5th-order Butterworth low-pass filter (MAX7424CUA) [
35] with a cutoff frequency of 40 kHz is then applied to obtain the 40 kHz sine wave. Such a sine wave generator has several advantages over an analog oscillator: a very stable frequency and the ability to change the frequency via software. The 40 kHz sinusoidal signal was inputted to an MA40H1S-R [
36] ultrasonic speaker.
To record the sound and Doppler frequency shifts associated with food ingestion, the SPM0687LR5H-1 microphone [
37] was mounted towards the lower jaw. The sensitivity of the employed microphone is greater than −5 dB in a frequency that ranges from 0∼42 kHz, which is sufficient for the detection of ingestive behaviors. A low-pass filter with a cutoff frequency of 2 kHz was employed to extract audio signals from the received signal. Such a cutoff frequency seemed to produce a relatively high detection of ingestive sounds. The experimental results, however, showed that setting the cutoff frequency as lower than 2 kHz yielded lower performance in terms of detecting ingestive behaviors. The ultrasonic components were obtained via band-pass filters (38∼42 kHz) and were demodulated by the diode detector. Two signals (audio and demodulated) were amplified so that the level of each was matched with the dynamic range of the subsequent analog-to-digital convertor (ADC). With the exceptions of the microphone and speaker, all components were assembled on a single printed circuit board and molded into epoxy resin to protect them from outside elements. Note that although the developed sensor module outputted both audio signals and UDS output, the audio signal was used only to compare the estimations of food amounts.
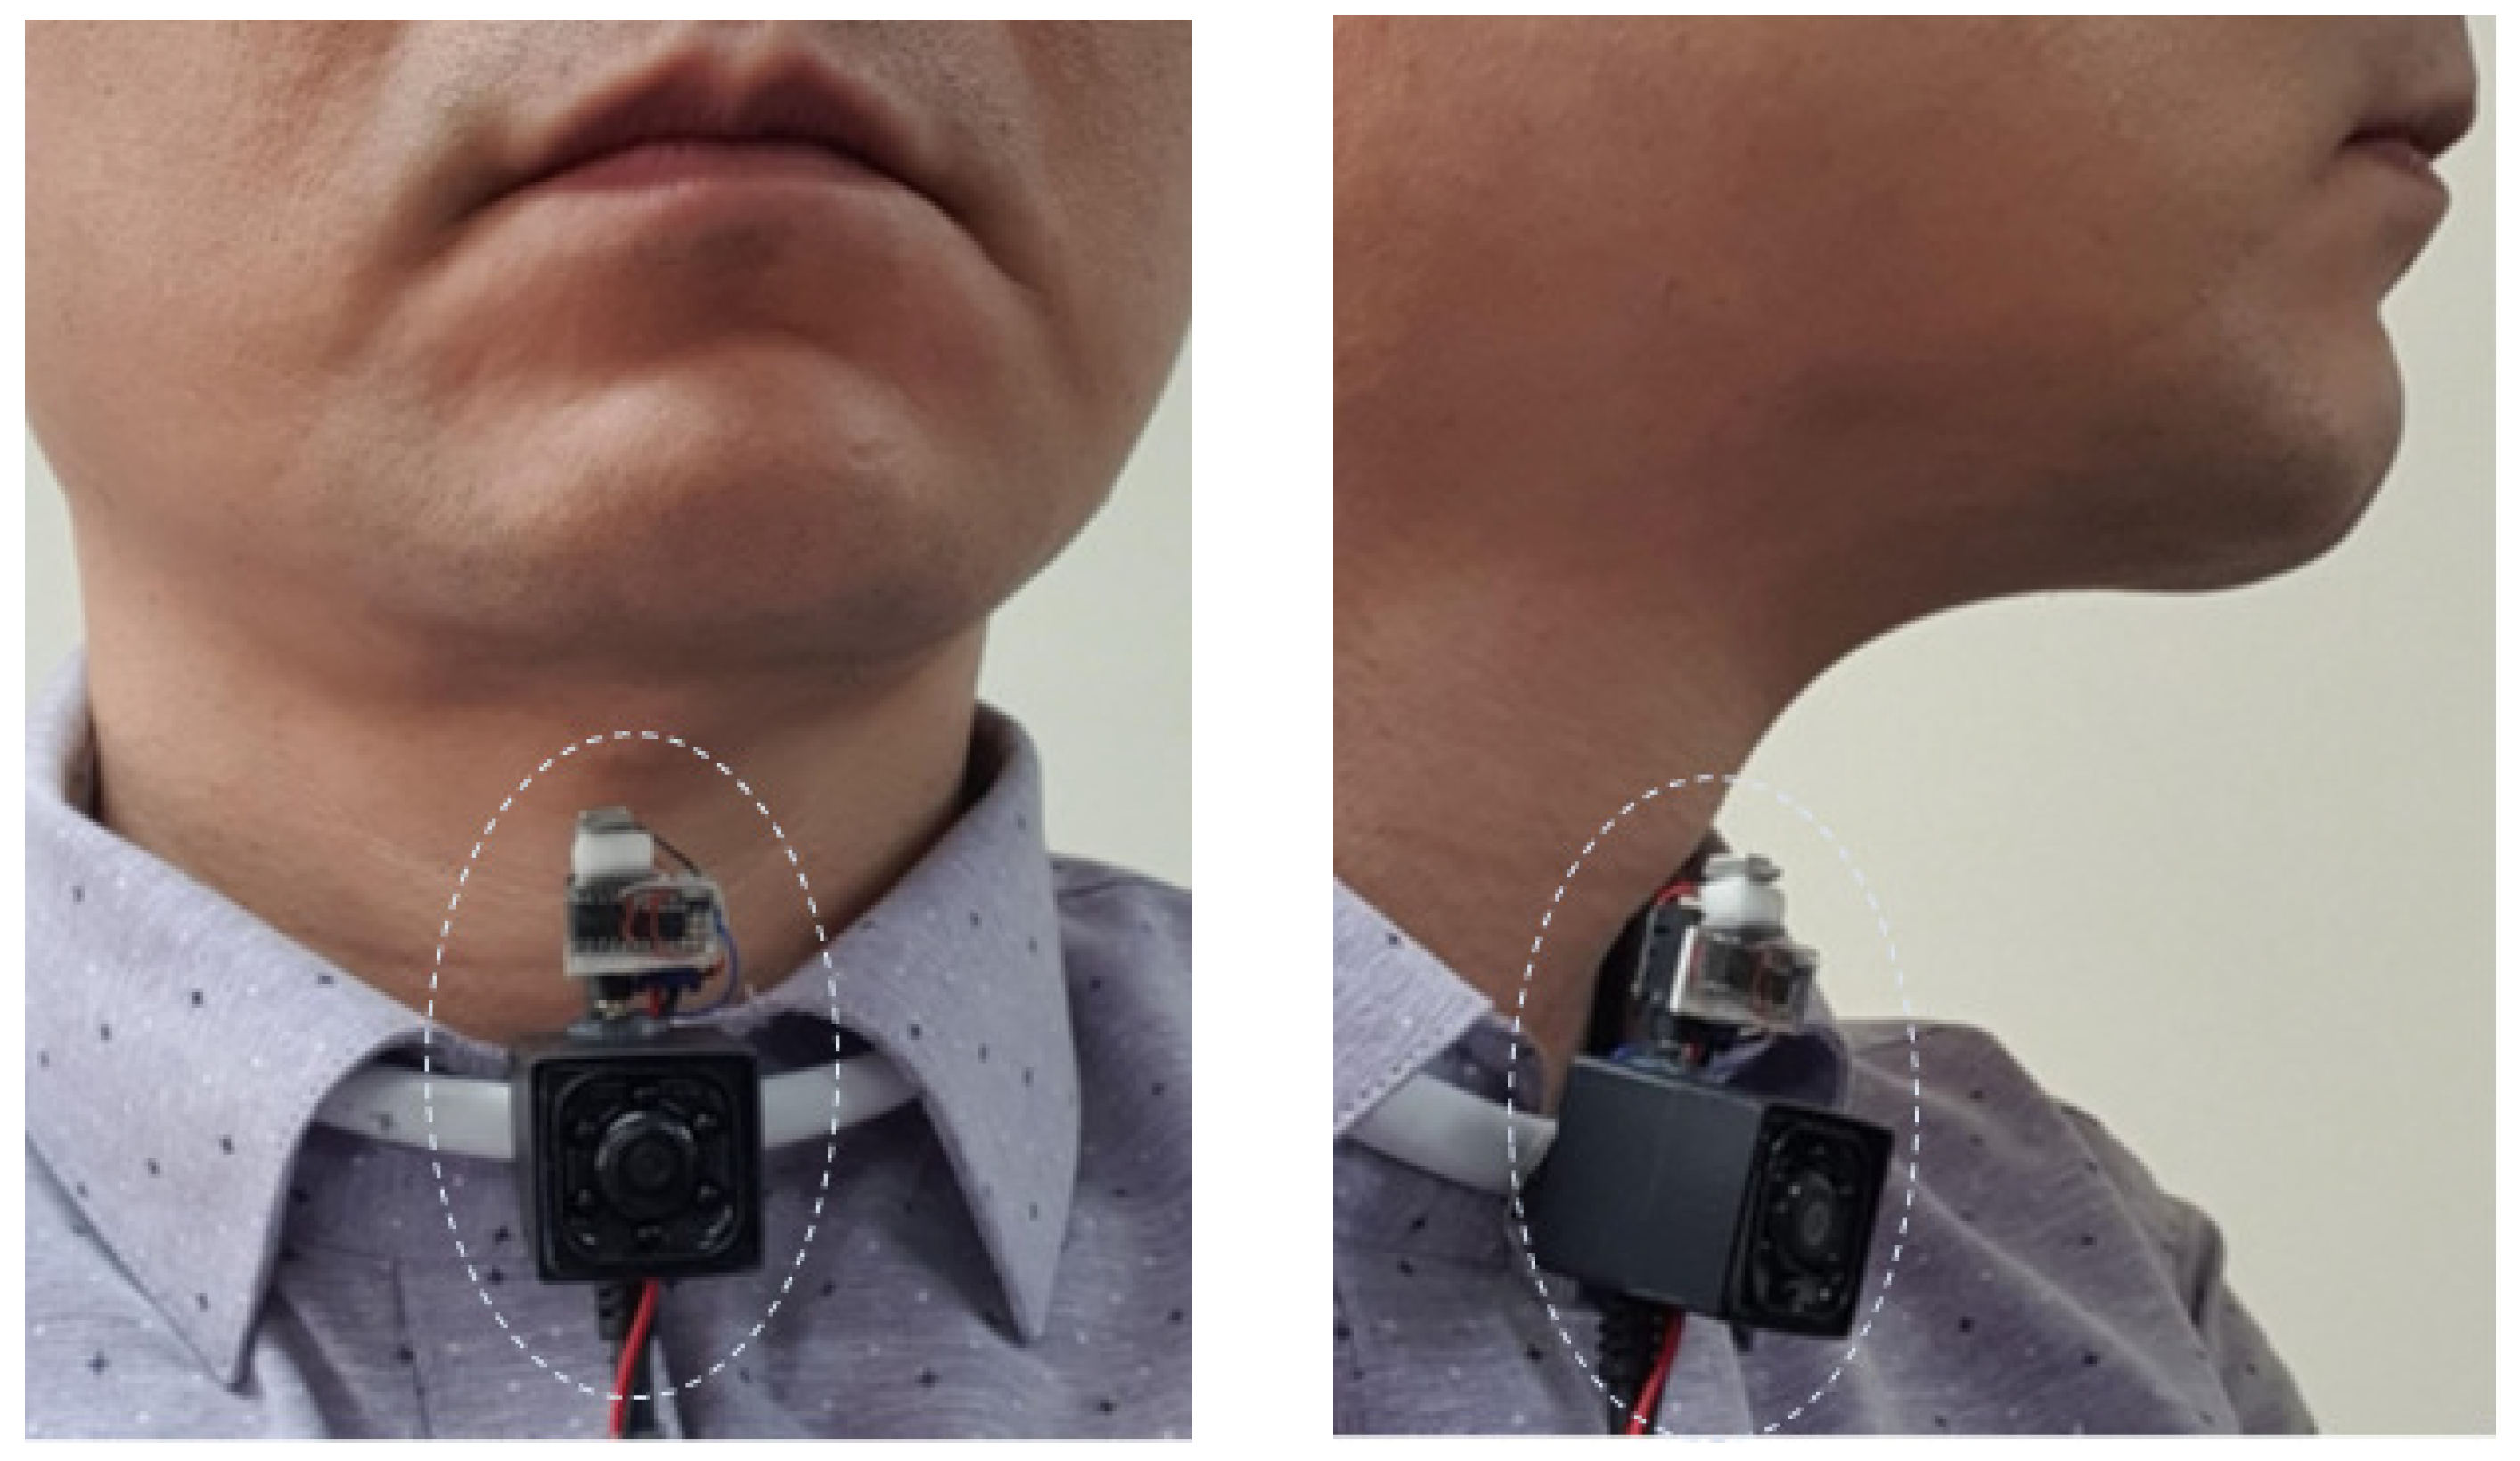
A photograph of a subject equipped with the developed sensor device is shown in
Figure 3. In this photo, the wings of the sensor system are inserted into each collar and fixed to the neck when the subject wears a shirt with a collar. Such a method prevented the undesired displacement of the sensor device due to the movements of the neck and face that were not related to food intake.
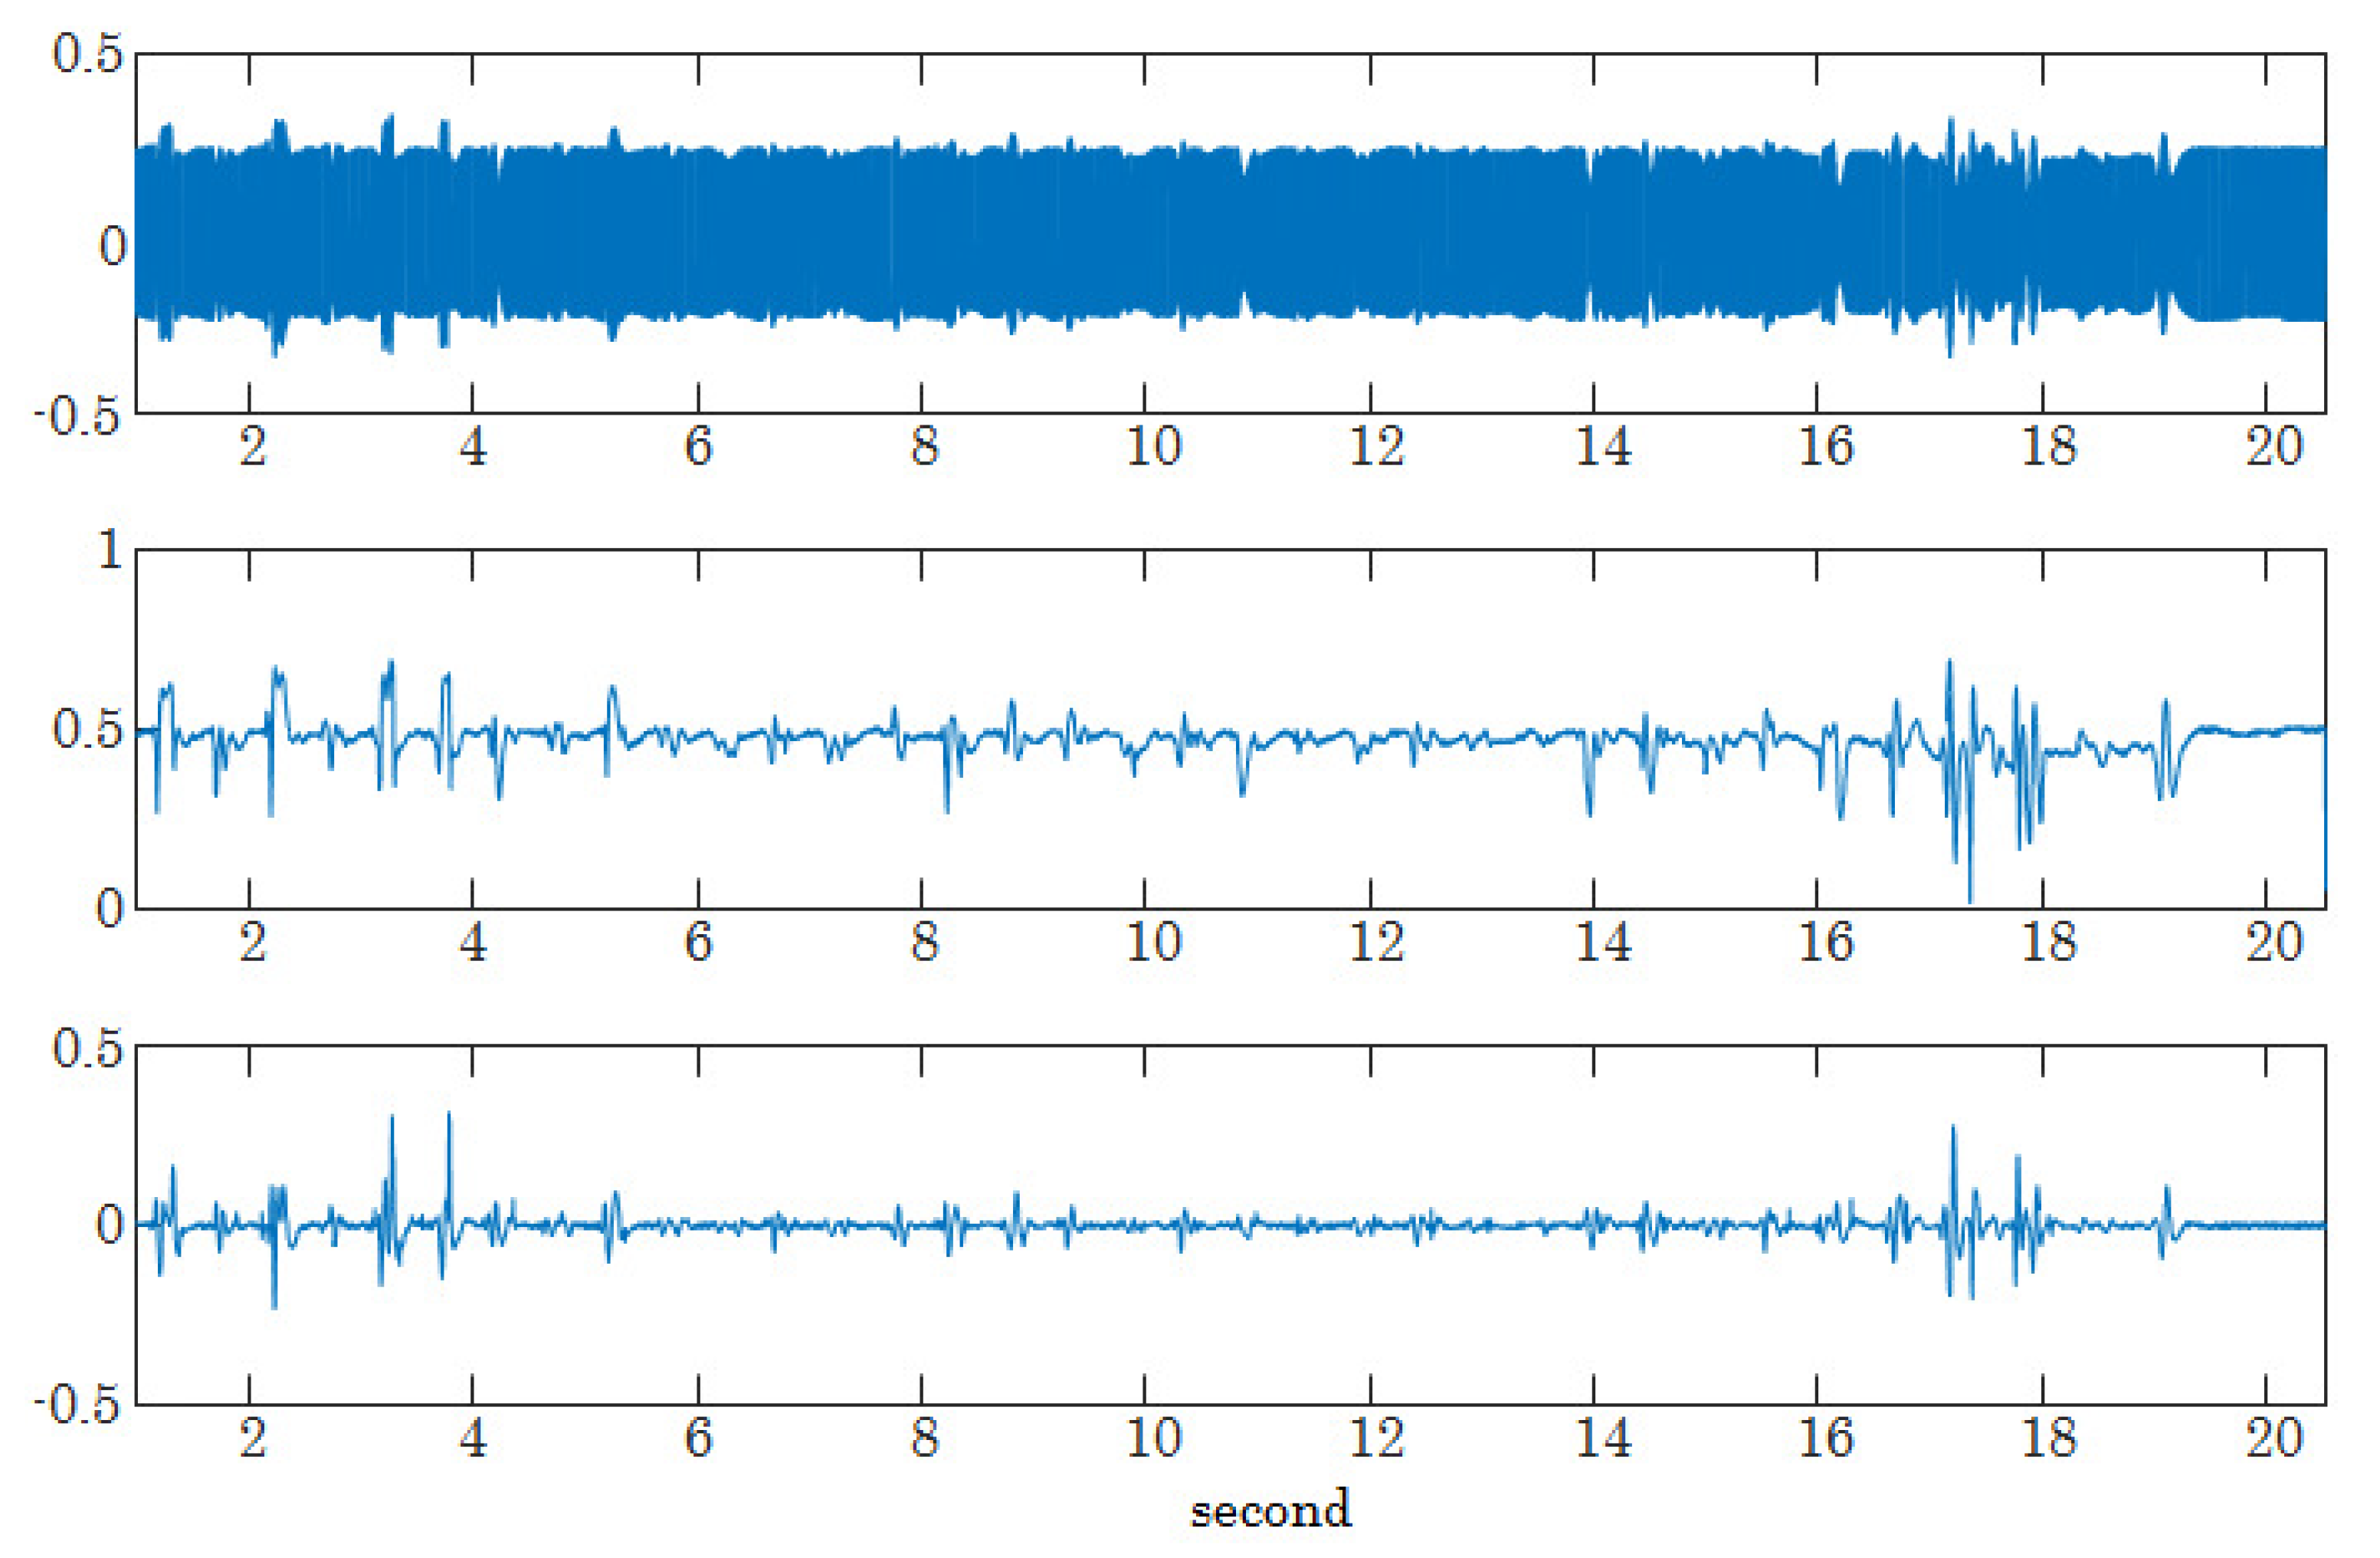
Examples of the recorded signals using the developed device are shown in
Figure 4 and
Figure 5 with the sampling frequency set at 96 kHz. The example signals presented in these figures were recorded under noise-free conditions, and, hence, it can be assumed that each location of the prominent peaks from audio signals correspond to chewing instances. Cashew nuts are an example of a hard-crunch food for which chewing patterns were clearly recognized in the audio signal compared with a food such as pizza. The envelope of the received ultrasonic signal takes a shape that is similar to the corresponding audio signal, and, hence, the demodulated ultrasonic signal is easily matched with the corresponding audio signal. For pizza, the amplitudes of the peaks were varied. This was because the chewing patterns depended on the hardness of each part of the pizza. (e.g., the dough portion is harder than the center). In this case, the positions of the peaks for the two signals (low-pass filtered audio signal and demodulated signal) matched, regardless of the amplitudes of the peaks. Although only two examples of food were presented, similar characteristics were commonly observed for other foods. This implies that when demodulated ultrasonic signals are used to detect chewing events, the accuracy can be as good as that of a noise-free audio signal. It is also noteworthy that the shapes of the demodulated signals remained similar to the noise-free audio signal when audible noises were presented. This indicates that by using an ultrasonic signal, it is possible to achieve a high degree of accuracy in the detection of ingestive behaviors, even under noisy conditions.
3. Dual-Modality Estimation of Food-Intake Amount
The proposed method of estimating food-intake amount is based on the assumptions that (1) the amount of food consumed (or, equivalent caloric intake) is positively proportional to the chewing counts before swallowing, (2) the relationship between the amount of food consumed and chewing counts depends on the type of food.
Such assumptions were empirically validated in this study, where the relationship between the number of chews and the food intake amount in mass (g) was analyzed for nine types of food (boiled chicken breasts, mocha bread, fried chicken, potato chips, cashew nuts, pizza, vegetable salad, rye bread, and plain yogurt). Ten subjects participated in the experiment and were asked to press a buzzer button at every instance of chewing. The subjects were also asked to press the buzzer button just before or after swallowing food. The amount of food eaten was measured each time before it was eaten. In this way, a true number of chewing events and swallowing instances were obtained and subsequently used for regression analysis. The correlation coefficients of the foods used in the experiment are presented in
Table 1, which also includes the
p-values, the root mean squared errors (RMSE) and the mean percentage errors. The results from the validation test are comparable to those of conventional image-based methods [
27]. The relatively high correlation and low amount of estimation error ensured the validity of the food-amount estimation method when using the chewing counts. For pizza and vegetable salad, however, the number of chewing events was not strongly correlated with the amount of food intake, which resulted in a larger RMSE and a percentage error. The common characteristics of such foods is that they are mixed with several ingredients. Similarly, the firmness of the mocha bread depends on the outer and inner portions, and this is a possible explanation for the lower correlation value of the mocha bread. Consequently, the usefulness of chewing counts for the estimation of food-intake amount was confirmed by the validation test to some degree.
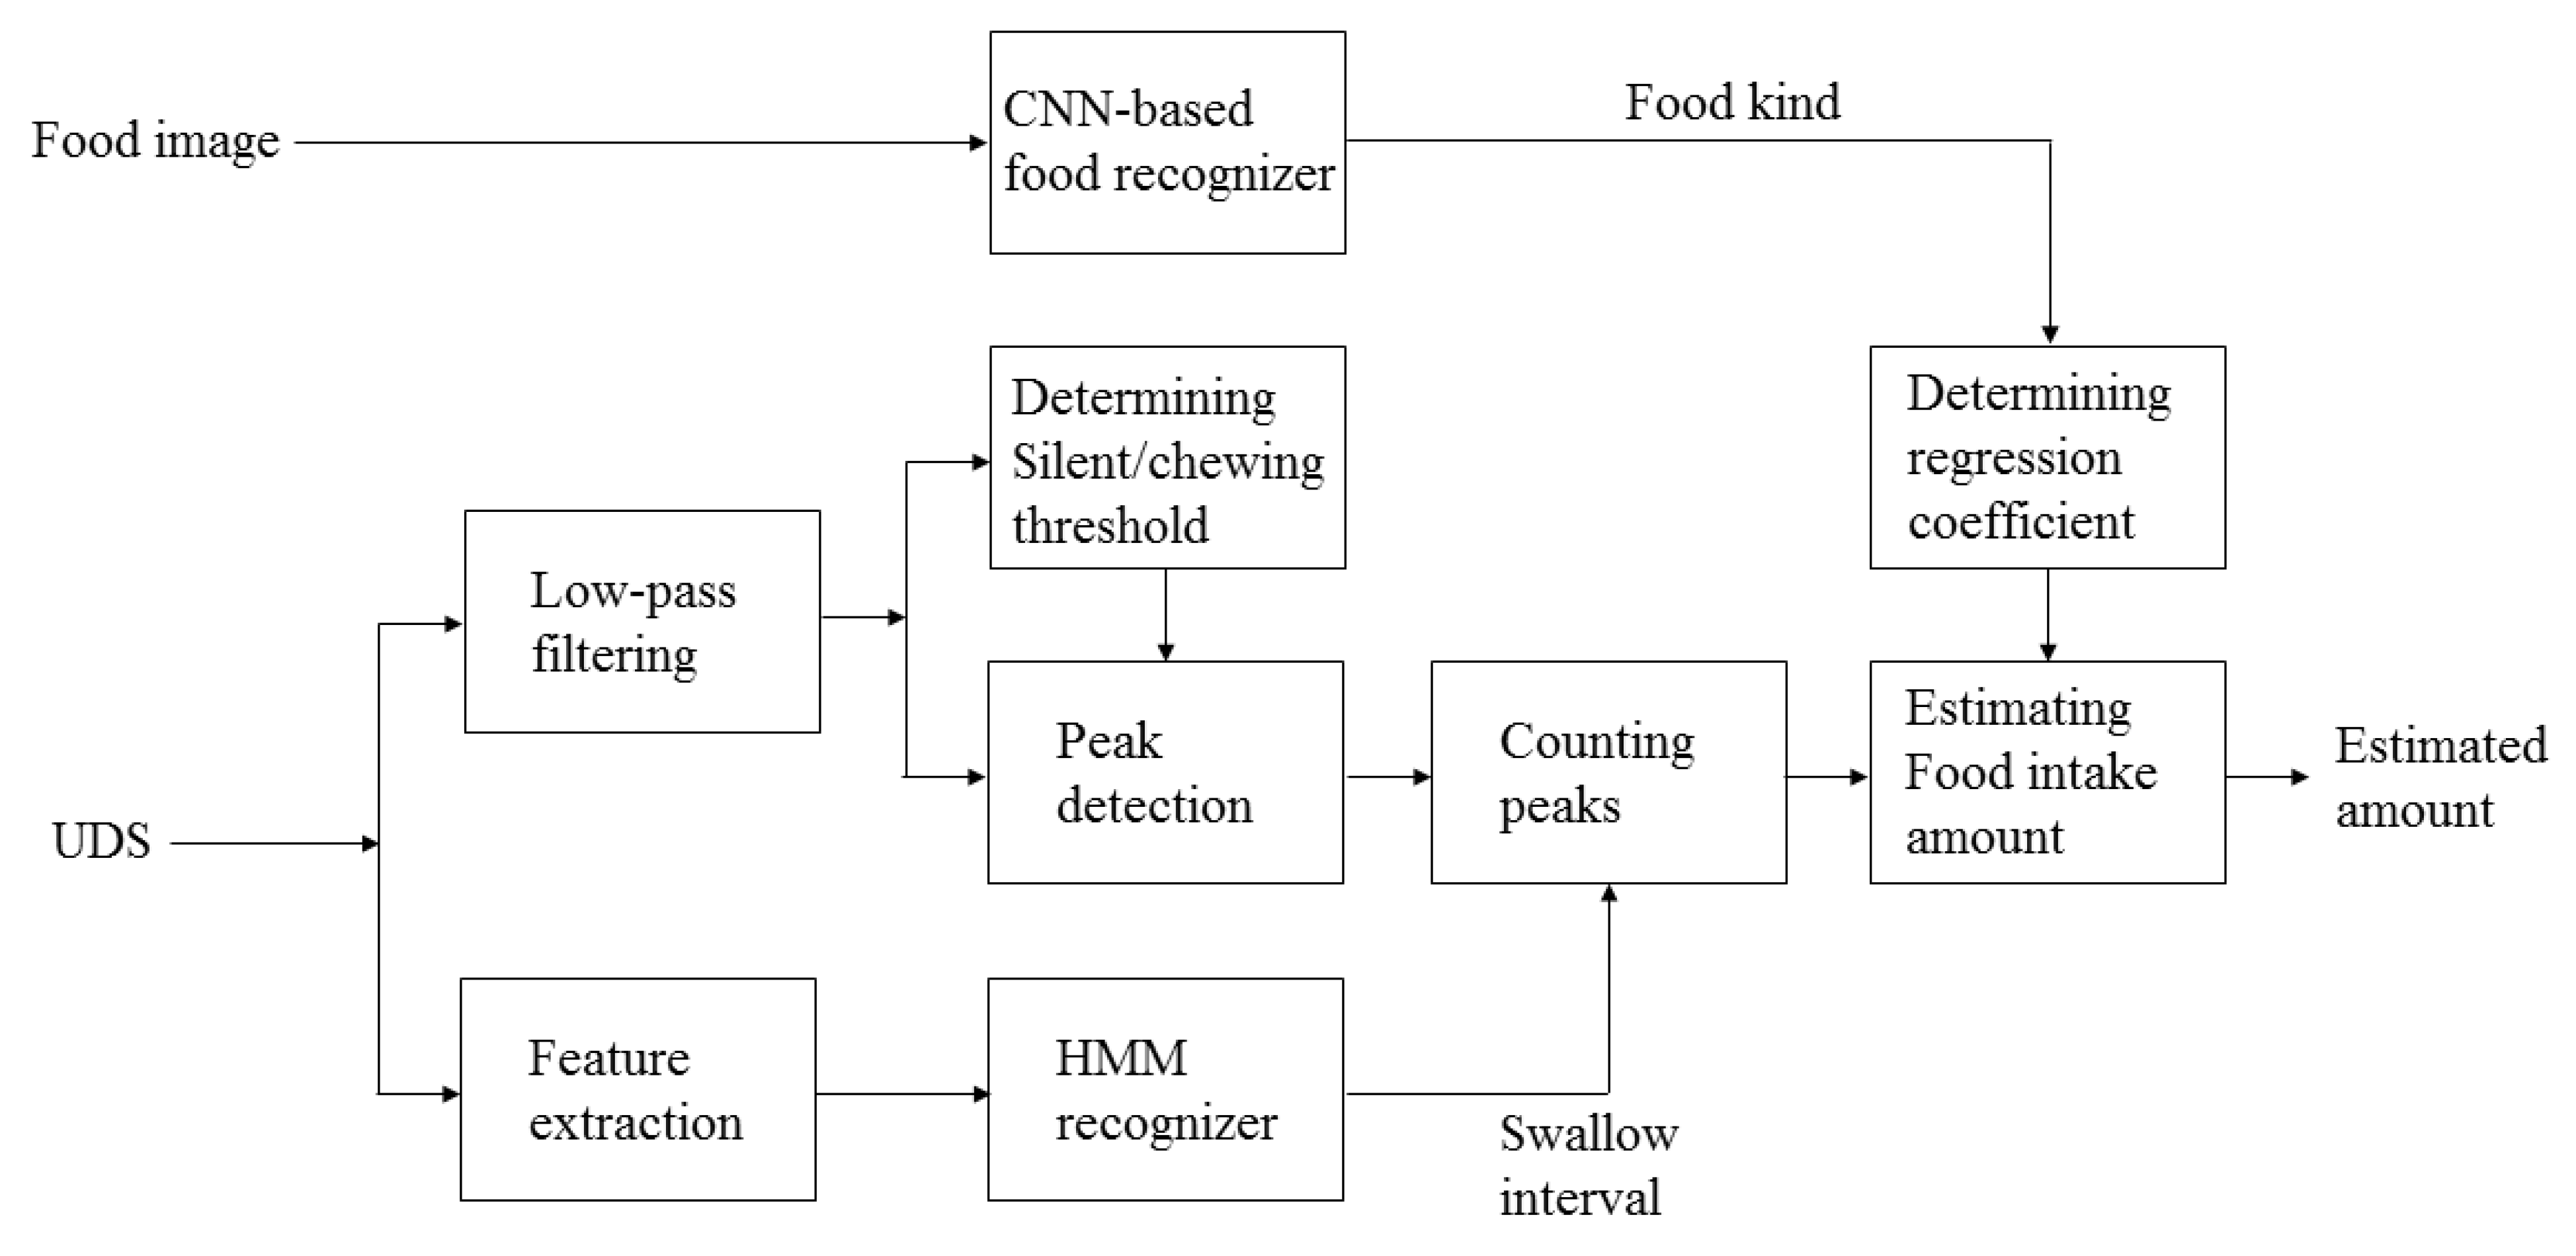
A block diagram of the proposed food intake estimation method is presented in
Figure 6. The major parts of the proposed estimation scheme include detection of food ingestion behavior for chewing counts and recognition of food items. In the proposed method, the detection of chewing/swallowing events and the identification of food items were achieved using the UDS and visual modalities, respectively. A more detailed description of each part is explained in the following subsection.
3.1. Detection of Food Ingestion Behaviors
The demodulated ultrasonic signal (from the sensor module) was first digitally sampled at 8 kHz with 16-bit precision. In this study, the number of chewing events during a swallow interval was practically estimated by counting the number of prominent peaks in UDS signals. Although UDS signals are more robust against environmental noises compared with audible signals, signals unrelated to food intake, which could be caused by vocalization and heartbeat, were often observed in the demodulated ultrasonic signals. The sampled signals revealed that the amplitudes of interference signals were generally smaller than those of food-intake-related signals. Accordingly, it was necessary to distinguish whether the signals were related to food intake according to signal amplitude. To this end, a soft clustering method was adopted, wherein the distribution of each group (food-intake and others) was represented by a Gaussian function. Assuming that the conditional probability density function of the feature,
x, derived from UDS under each hypothesis (H0: null, H1: food-intake), is represented as a Gaussian distribution, the observation probability of
x is given by
where
,
, and
are the weight, mean, and standard deviation for the
i-th Gaussian, which can be estimated using an expectation-maximization (EM) algorithm [
38]. The optimum threshold was determined so that the overall misclassification errors were minimized, given by the root of the following equation:
where
A simple peak-picking method was adopted to obtain a set of candidate peaks (by taking the local maxima). The final peaks were then chosen so that the amplitude of the peak was not less than the optimum threshold. Counting of the number of chews was initiated and terminated by swallowing events. Accordingly, a reliable estimation of swallowing events is desirable to increase estimation accuracy. The specific patterns of muscle movements around the neck associated with swallowing were represented by means of a hidden Markov model (HMM). Hence, an HMM recognizer was employed to detect swallowing events. The HMM features were heuristically determined so that the accuracy of swallowing detection was maximized. The experimental results showed that the log-energy of each of the spectral bins, ranging from 2∼50 Hz, yielded the highest accuracy of swallowing detection.
The relationship between chewing counts and the amount of food intake was represented by a linear regression model. Although the amount of food intake was expected to be more accurately estimated by employing a nonlinear regression model (e.g., the multi-layer perceptron), the experimental results showed that the accuracy of a linear model was slightly superior to that of a nonlinear model. The average percentage error of a linear model was 0.05 lower than that of a nonlinear model. The regression coefficients were obtained differently from food items using training data. This requires the identification of the food item currently being eaten. To this end, a visual modality was used to recognize food items with relatively high accuracy.
3.2. Recognition of Food Items
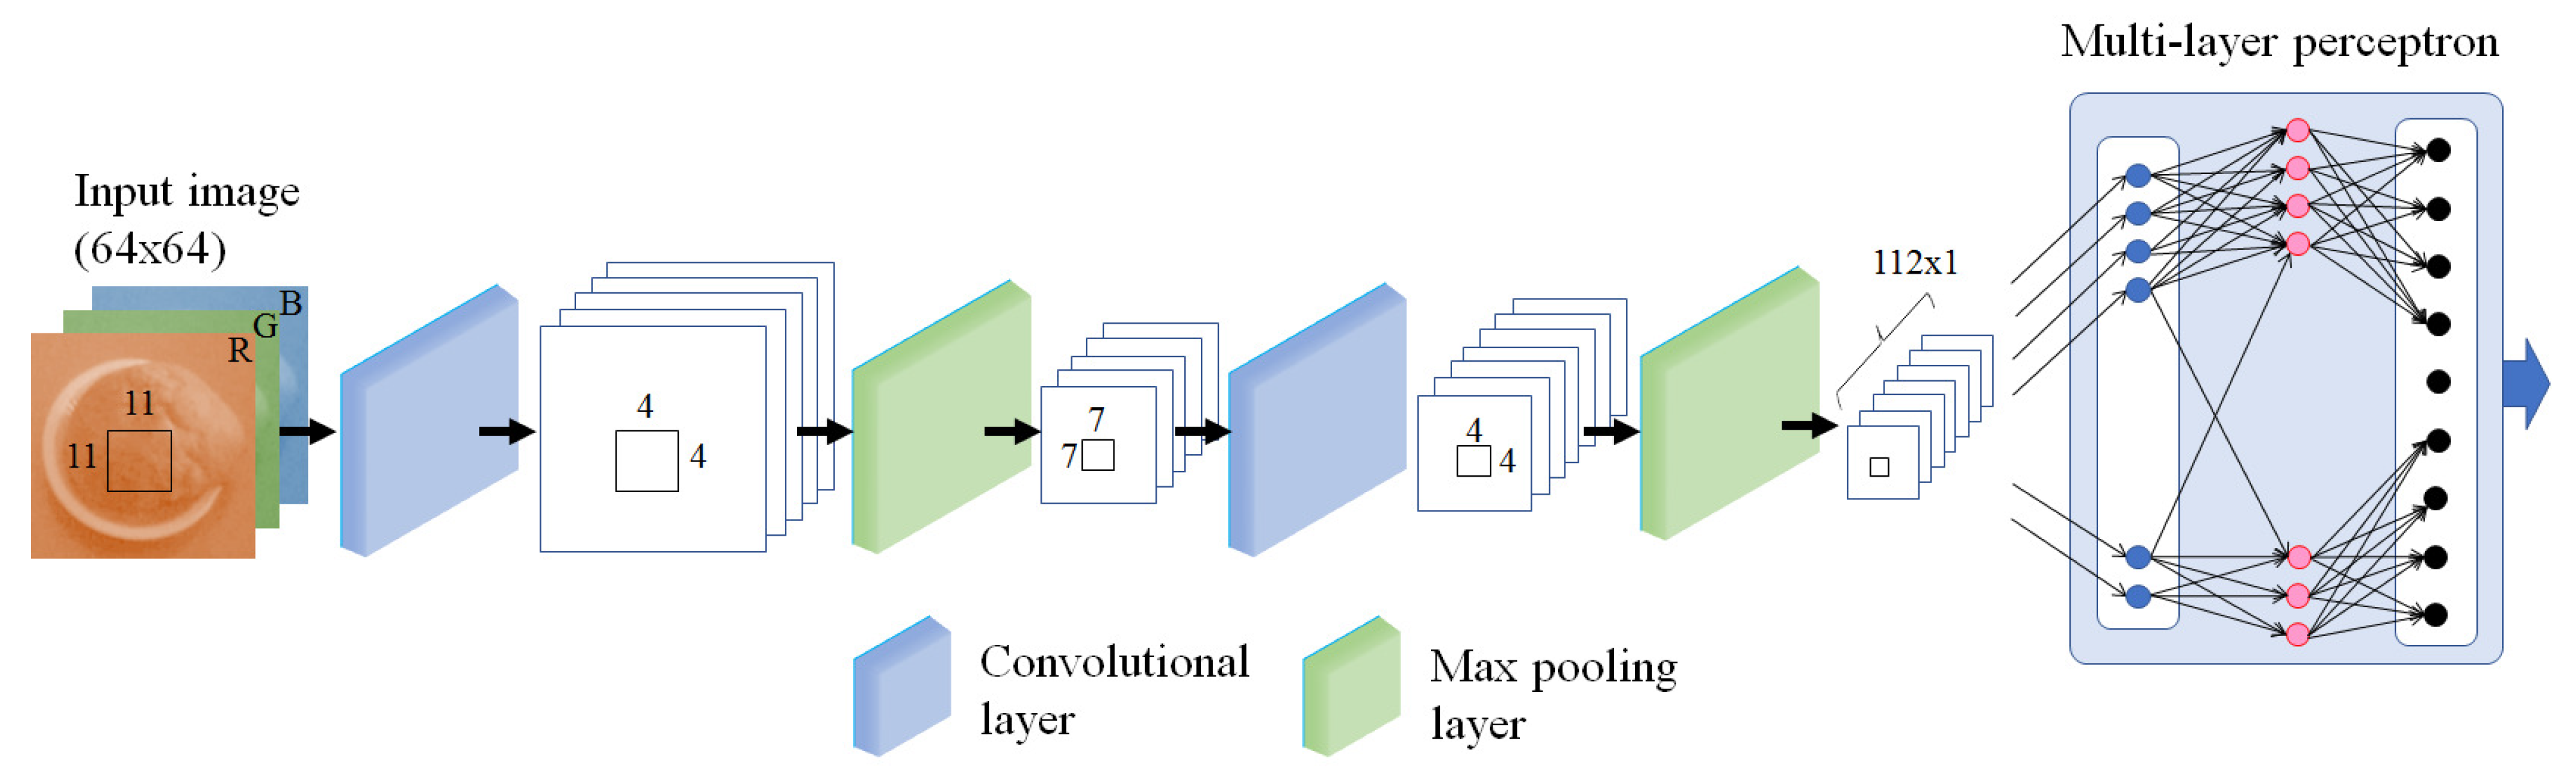
To date, there are many image recognition schemes that can be applied to automatic food recognition. Among them, a supervised learning approach that employs convolutional neural networks (CNN) was adopted in this study. The architecture of the CNN, including the number of layers and the kernel size of each layers was heuristically determined using a validation dataset that was 10% of the entire learning dataset. The resultant CNN was composed of two convolution/max pooling layers and a fully connected multi-layer perceptron (MLP) with a recognition output, and is presented in
Figure 7. The kernel sizes of the 1st and the 2nd convolution layers were 11 × 11 and 7 × 7, respectively, while the window sizes of the max pooling layers were commonly 4 × 4. I tested the performance in terms of image classification accuracy according to different sizes of CNN input (input image sizes). The result showed that sizes of 64 × 64 or 128 × 128 yielded the highest classification accuracy. Lower resolution is more preferable when reducing computational loads of the small-size real-time hardware system. Accordingly, all images from the camera were reduced to 64 × 64 for input to the CNN.
There were three fully connected layers in the proposed CNN, which corresponded to input from the final convolution layer, and to hidden and output layers. The numbers of nodes for each of the layers were determined using the validation dataset as 128, 112, and 18, respectively. Note that the output nodes include a “no food” node, which is used to discriminate whether the incoming image is a valid food image. A rectified activation function was adopted for the the hidden layer. A soft-max function was employed for the output layer. All parameters of both convolutional and fully connected layers were initialized by random values. A back-propagation algorithm involved with the minimum cross entropy (MCE) criterion was used in the training procedure. The learning gain was first set to 0.005 and changed to 0.001 after five epochs. A total of 100 epochs resulted in a trained CNN with sufficient performance in terms of food recognition accuracy. A dropout regularization with a keep probability of 0.75 was employed. Experimental results showed that the accuracy of food classification was highly affected by the mini-batch size and the decision of whether or not to apply a random batch shuffle. A high level of classification accuracy was achieved by applying a relatively small mini-batch size (≤10) and a random batch shuffle. It is also interesting to note that the overall architecture of the CNN used in this study was simpler than others popularly used in image recognition tasks (e.g., ResNet-50, Inception-v3, Xception). This is mainly due to the smaller number of image items being recognized (31 vs. 1000). A lower level of accuracy was often observed for a test dataset when a relatively large number of convolution layers (≥3) was adopted.
3.3. Estimating the Food Intake Amount
In this study, the amount of food consumed was given by a linear combination of the chewing counts and the corresponding regression coefficients. The estimation was determined by the amount ingested between swallows. The period between two neighboring swallowing instances was referred to as “one food intake cycle” in this study. For the
n-th food intake cycle,
,
denotes the chewing counts, and the estimated amount of food consumed
is given by
where
,
represent the regression coefficients. Let
, and
denote the true amount of food consumed (in mass) and the index of food kind, respectively, and the regression coefficients are obtained by
where
is the set of the food intake cycles when the
i-th food is consumed, i.e.,
and
is the number of food types. To obtain the reference amount of food consumed, the food was cut into edible amounts each time and the weight was measured. Then, the subjects participating in the experiments were asked to eat all the given food pieces during one food intake cycle. Note that the regression coefficients were obtained separately for each food. Such a food-by-food basis regression analysis is beneficial for achieving a high level of estimation accuracy for each food. The drawback of this approach, however, is that the performance is more or less affected by the recognition accuracy of the adopted food classification scheme. The experimental results showed that the overall errors in food amount estimation were not significantly increased unless the classification accuracy was lower than 95%. Note that experimental results showed that the regression coefficients varied from subject to subject, even for the same food. This was because chewing sounds also varied depending on the person’s age, health, social factors, and teeth condition. Accordingly, food intake estimation was implemented in a subject-dependent way.
The entire process of food intake estimation was designed to minimize user intervention and could be implemented using a small microprocessor board (Resberry pi zero W). An image was captured every 1.5 s. The captured image was inputted to the CNN. Detection of chewing and swallowing was simultaneously carried out on the incoming UDS. If swallowing was detected, the last 10 captured images were used to determine whether the period between the previous and current swallowing instances was a valid food-intake cycle. This was based on the assumption that food intake was completed (by swallowing) within 15 s of the food being exposed to the camera. If multiple food items were detected during this period, the recognition result nearest to the current swallowing instance was selected as the current food item. A period of 15 s was heuristically determined, which was a good compromise between the performance and the necessary memory size.
4. Experimental Results
4.1. Experimental Setup
Eight healthy subjects (5 males and 3 female with ages ranging from 20 to 52 years) participated in the evaluation tests. The average body mass index (BMI) of the subjects was 23.2 . The subjects had no medical complications that would have interfered with normal food intake. The food items were selected by considering the preferences of the subjects and by striking a balance between healthy and unhealthy foods, which included chicken breasts, mocha bread, fried chicken, potato chips, cashew nuts, pizza, vegetable salads, rye bread, plain yogurt, fried potatoes, strawberries, bananas, rice cakes, chocolate, ramen noodles (Korean style), fried rice, almonds, chocolate bars, dumplings, hot dogs, jelly, jerky, beef steak, spaghetti, sweet red-bean porridge, dried sweet potatoes, cereal (with milk), sandwiches, tangerines, and fried eggs. Such food items covered the various physical properties of everyday foods, such as hardness, cruchiness, and moisture content. The portions of the food served to each subject were divided into amounts they could easily chew and swallow. Accordingly, the subjects were requested to swallow only once if possible, but were allowed to swallow twice if necessary.
For all subjects, the total amount of food eaten was limited to alleviate the effect of subject fatigue and problems caused by the excessive intake of certain foods. This was achieved by dividing all acquisition times for each subject into five sessions, each of which consisted of seven sub-sessions. In each sub-session, the subjects were asked to eat certain foods repeatedly. One of 30 food items was selected in each sub-session. The number of repetitions for each session was determined according to the types of food and the eating patterns of the subjects. The subjects were allowed to drink water or cola between the sub-sessions, but the samples recorded for these moments were removed prior to the evaluation test. The average number of food intake cycles per food item was 25, and, hence, the average number of total food intake cycles was
per subject. The properties of the dataset are summarized in
Table 2, where the values were obtained by averaging the results for all subjects.
In training the HMM parameters for swallowing detection, a typical left-to-right model was used. The distribution of the features was modelled using mixtures of diagonal Gaussians. The number of states for HMM was determined heuristically, at five. The number of Gaussians was determined in the same way, at three. The HMM parameters were derived from the training set (500 swallowing events). The longitudinal pharyngeal muscles are known to condense and expand the pharynx as well as help elevate the pharynx and larynx during swallowing. Accordingly, the surface electromyogram (sEMG) signals were acquired from the neck skin close to the inferior pharyngeal constrictors. The ground-truth swallowing events were obtained from the prominent peaks of the low-pass filtered sEMG signals. The instances of each of the swallowing events were annotated as “reference swallowing instances” to train the HMM.
The food images were captured before the subjects ate the foods, and were not captured during the meal. The average number of captured images for each food type was 877. For each food, various images were captured, which accounted for the view angle, the ambient light conditions, the food location, the types of trays, and the amount of food consumed. There are several food image datasets for food recognition such as UEC-FOOD100 [
22], FOOD-101 [
23], and VIREO Food-172 [
24]. The food items employed in this study are also found in such datasets, which allowed for their use in the training of the image classifier. Although the food images captured from the camera used in this study were sometimes different from the food images in the datasets, the inclusion of the food image datasets in the training data were helpful for reliable food recognition. Therefore, 30% of the training/evaluation images were borrowed from the above-mentioned food image datasets. The ratio between the training data for learning CNN and test data for evaluation was set at 7:3. The validation dataset was randomly selected from the training dataset, which was used to determine the configuration of CNN. The set of the non-food images was composed of everyday images including people, animals, furniture, and landscapes.
The experimental results showed that the food classification accuracy of the visual-only estimator was 99.02% for 30 food items. The confusion matrix was shown in
Table 3, obtained from a total of 7894 test images. Due to its high classification accuracy, it can be observed that diagonal components are prominent and other components are almost zero. Such results demonstrated that the overall performance was not seriously affected by the usage of recognized food items instead of true food items.
4.2. Estimation Results of Food Intake Amount
for Each of the Modalities
The estimations for food intake amounts were first evaluated for each modality (audio, ultrasound, and vision). The mean absolute percentage error [
20] (MAPE) in mass was used as an evaluation metric. Eventually, the calories can be computed by the estimated weight and the nutrition facts for each food. For the
k-th food item, the MAPE is given by
where
and
are the true and estimated weights for the
n-th food intake cycle, respectively.
is the total number of samples for the
k-th food. Both the audio and ultrasonic modalities estimated food intake amount by using the type of food that was recognized by the CNN-based classifier. Note that audio modality method used audible frequency range signal to detect chewing and swallowing instances, while demodulated ultrasonic signals were used in the ultrasonic modality method. The MAPEs for each modality are presented in
Table 4, where the results were obtained under noise-free environments. The average MAPE of the ultrasonic modality estimator was comparable to that of the audio-modality estimator. Although for all subjects, the average MAPEs of the ultrasonic-modality estimator were commonly lower than those of the audio-modality estimator, the differences were not significant for all subjects. This was also confirmed by a significance test (a two-way ANOVA test), in which the
p-value of the factor “modality” was 0.3023 (
). Such results were somewhat expected, since it has been experimentally confirmed that the ultrasonic signals can be approximated as a modulated version of the corresponding audio signals. Visual inspection revealed that some details of the audio signals (mainly corresponding to the high-frequency components) were lost in the demodulated ultrasonic signals. This resulted in slight differences in terms of the MAPE from the audio-modality estimator.
The performance of the visual-modality estimator was also evaluated for comparison. A regression CNN was employed to estimate food amount [
18,
19]. The structure of the CNN was heuristically determined to minimize the overall MAPE for the test data set. The food images were captured using the same camera as that used for the audio- and ultrasonic-modality estimator. In the original studies [
18,
19], the caloric content of the foods was estimated, but the present study estimated the weights (amounts) of the foods. For each food, the average number of acquired images and the number of different amounts (in weight) was 1270 and 25, respectively. The average MAPE appears at the bottom of
Table 4. The MAPE of the video-only estimator was higher than that of other estimators. These results indicate that although food types were correctly classified using the trained CNN, there is a limit to estimating the amount of food intake by visual information alone. That result shows that the average MAPE of the video-only estimator was somewhat lower than that in previous studies. (e.g., 8.2% in [
20]). In the present study, however, the results were obtained from a single image (not a stereo image), and experiments were carried out on a wide variety of food amounts. Consequently, it is apparent that the collaborative use of audio and visual information (the types of food and the number of chewing events are estimated by using visual and audio information, respectively) is very helpful in achieving high accuracy in the estimations of food amount.
4.3. Estimation Results of Food Intake Amount for Each Food Item
Accuracy in estimating the food amounts was investigated for each food. The results are summarized in
Figure 8. There was no clear difference in the MAPEs of the audio- and ultrasonic-modality estimator. This was confirmed by the fact that the correlation and the root mean squared error (RMSE) between the two MAPEs were 0.9727 and 1.14, respectively. For a total of 27 food items, the percentage error of the ultrasonic estimator was less than 10%. Such results indicate that, for various types of food, ultrasonic Doppler signals are as useful as audio signals in estimating the amount of consumed food.
The differences in the MAPEs between the specific food groups were also investigated. First, all food items used in the experiments were split into healthy and unhealthy food groups according to diet guidelines recommended by the world health organization (WHO) [
39,
40]. The accuracy of food intake estimation was then evaluated for two groups (healthy foods: bananas, chicken breast, cashew nuts, strawberries, vegetable salad, rye bread, yogurt, dried sweet potatoes, tangerines, and almonds, and, unhealthy foods: chocolate, fried potatoes, mocha bread, fried chicken, potato chips, pizza, ramen, dumplings, chocolate bar, and beefsteak). The average MAPEs for the healthy and unhealthy food groups were 15.62 and 14.23, respectively, when the audio-modality estimator was employed. Similar results were obtained when using the ultrasonic-modality estimator (16.17 and 15.04 for healthy and unhealthy, respectively). Considering that the average MAPE for the audio-modality estimator was 14.6 for all foods, the estimation accuracy for food amount was slightly reduced when the healthy foods were eaten. However, the 2-way ANOVA test showed that there was no significant difference between the two groups. Hence, the dual-modality (visual + audio or visual + ultrasonic)-based estimation method for food intake amount worked reasonably well for both healthy and unhealthy foods.
A similar trend was also observed when evaluation was separately carried out on hard/soft food groups. The hard food group includes chocolate, potato chips, cashew nuts, chocolate bars, cereal, almonds, and jerky. Fried eggs, fried rice, mocha bread, rice cakes, ramen, strawberries, vegetable salad, yogurt, sweet red-bean portage, spaghetti, dumplings, and jelly are included in the soft food group. The average MAPEs for the two groups were 14.09 (hard group) and 13.80 (soft group), respectively, when the audio-modality estimator was employed. Similar results were observed for the ultrasonic-modality estimation method where the average MAPEs were 14.98 (hard group) and 14.19 (soft group), respectively. Visual inspection of both audio waveforms and ultrasonic waveforms showed that the chewing pattern was less consistent over time when relatively hard foods were eaten. For example, the amplitude of the waveform was high at the beginning of chewing, then decreased over time. The decreasing rate of the amplitude was varied according to the amount of food, initial chewing force, and a subject’s teeth condition. This resulted in changing the number of chewing events during a constant time interval. The inhomogeneity of food is another reason for performance degradation, clearly observed for pizza, chocolate bars, and sandwiches. In the case of such foods, there was a significant change in the number of chews, even for the same amount, which depended on the local properties (solidity, moisture content, and ingredients). A possible solution, alleviating this problem, is to use local visual information and recognize the local properties of foods.
A 2-way ANOVA test was performed to investigate the major factors affecting the performance of food intake estimation. In this experiment, the factors affecting the MAPEs included the subject () and the type of food (). The results showed that the p-values for each factor were 0.002 (the type of food) and 0.654 (subject). This indicated that MAPEs are strongly affected by the type of food, while the variation in MAPEs for subjects was not significant. Such results were obtained when using the ultrasonic-modality estimator. Similar results were observed for the audio-modality estimator. These results were mainly due to the usage of the subject-dependent estimation rules.
4.4. The Accuracy of Food Intake Amount Estimation
under Noisy Environments
Thus far, all presented results were obtained under a noise-free environment. However, there are many kinds of interference in most meal situations. Such factors should be considered for practical application. For this section, the possibility of using the ultrasonic-based estimation method was investigated under actual meal situations. The noisy audio signals were obtained by digitally adding the noise signals to the clean audio signal. Note that environmental noises were mainly observed in the auditory frequency band and were very rarely found near the ultrasonic band used in this study. Hence, noise signals were only added to audio signals. The SNR was controlled by changing the scale factor of the noise signal before addition. The noise signals were separately recorded using the developed sensor in various eating environments that included cafeterias, restaurants, and home dining rooms.
To investigate the range of the signal-to-noise ratio (SNR) for most eating environments, the average levels of chewing sounds and noise signals were computed. Two food items (cashew nuts and bananas) were chosen since the difference in amplitude between the chewing sounds of the two foods was relatively large. Thus, a wider range of SNR was obtained by using these two foods. SNRs were computed by using chewing sounds from two subjects (subject-1 and subject-2) and the noise signals acquired from three different cafeterias, two different restaurants, and each subject’s home dining room. A wide variety of environmental interferences (conversation, sounds caused by the use of cutlery such as spoons, forks, chopsticks, etc., and sounds from music and TV) were allowed for recording noise signals.
Examples of the SNRs measured for the various eating situations are presented in
Table 5. For the same environment, the SNR varied slightly from subject to subject, since the level of the chewing sounds varied slightly according to the subject. The overall SNRs of cashew nuts were higher than that those of bananas. This was because the level of chewing sounds is relatively high when chewing cashew nuts. Compared with cafeterias and restaurants, the noise levels from the home dining rooms were relatively small. According to such results, the SNRs of
∞ (noise-free), −5.25 dB, −17.5 dB, and −19 dB were selected for the subsequent experiments. These SNRs were the most common values under each environment.
The MAPEs of the clean audio signal, noisy audio signal, and ultrasonic signal are shown in
Table 6. All results presented in this table were obtained by averaging all food items. The evaluation was carried out on the five subjects (subject 1–5). As expected, the performance of food amount estimation was generally degraded as the SNR decreased when the audio modality was used. The 2-way ANOVA test showed no clear difference in the MAPEs between a noisy signal at −5.25 dB SNR and an ultrasonic signal (
). For low SNRs (−17.5 and −19 dB), however, significant differences were observed between the two modalities (audio/ultrasound) (
and
, for −17.5 dB and −19 dB, respectively). The average MAPE for ultrasonic signals was slightly lower than that of the audio signal in the case of a noise-free and relatively high SNR (−5.25 dB). These results verified that the ultrasonic signal was as useful for food amount estimation as the noise-free audio signal. Moreover, a good performance for the ultrasonic signal was maintained even under noisy environments. The major reason for the noise-robustness of the ultrasonic signal against environmental noise is that the frequency range of the background noise did not overlap with that of the ultrasonic signal (38∼42 kHz).


