1. Introduction
Denial of service (DoS) attacks attempt to exhaust the network bandwidth or computing resources of a target by overwhelming it with network traffic. If the attack traffic is generated from multiple sources, then it is a distributed denial of service (DDoS) attack, which is harder to mitigate since simple Internet Protocol (IP) address filters do not work. DDoS attacks, in addition to making target networks and servers unavailable for legitimate users, can hide the network traffic of malware propagating laterally within an organization or communicating with their command and control centers [
1]. DDoS attacks exploit the protocols at the network, transport, or application layers of the transmission control protocol (TCP)/IP protocol stack [
2].
DDoS attacks can range from high-rate TCP SYN flooding attacks—the attacker sends TCP SYN requests but does not complete the three-way handshake—to low-rate HTTP slow-read attacks—the attacker initiates an HTTP GET request but throttles the Web server by indicating small or zero advertised receive window values [
1]. The availability of attack tools such as Mirai [
3], slowHTTPtest [
4], Booter [
5], and IPStresser [
6], made these attacks bigger, easier to launch, and more frequent. Cisco report predicts that DDoS attacks will grow to 15 million by 2023 [
7].
Recently, many researchers have applied Machine Learning (ML) and Deep Learning (DL) techniques for DDoS detection and have claimed them to be highly accurate [
8,
9,
10]. Most of these detection techniques are for high-rate DDoS attacks.
1.1. Challenges to Low-Rate Attack Detection
The recent attacks such as the one on AWS (Amazon Web Services) [
11] show that the nature of the DDoS attacks is changing from the typical high-volume flooding attacks to more stealthy low-rate attacks. Kuzmanovic and Knightly [
12] investigated the performance impact of one such low-rate DoS attack, which they called the Shrew attack. Since then, many variants of the low-rate attacks, such as the pulsing attacks [
13] and the reduction of quality (RoQ) attacks [
14] have been proposed and analyzed [
15]. A low-rate DDoS (LDDoS) attack is more difficult to detect since its average traffic volume is not significantly different from that of normal traffic. However, it cannot be ignored as it impacts legitimate traffic over time.
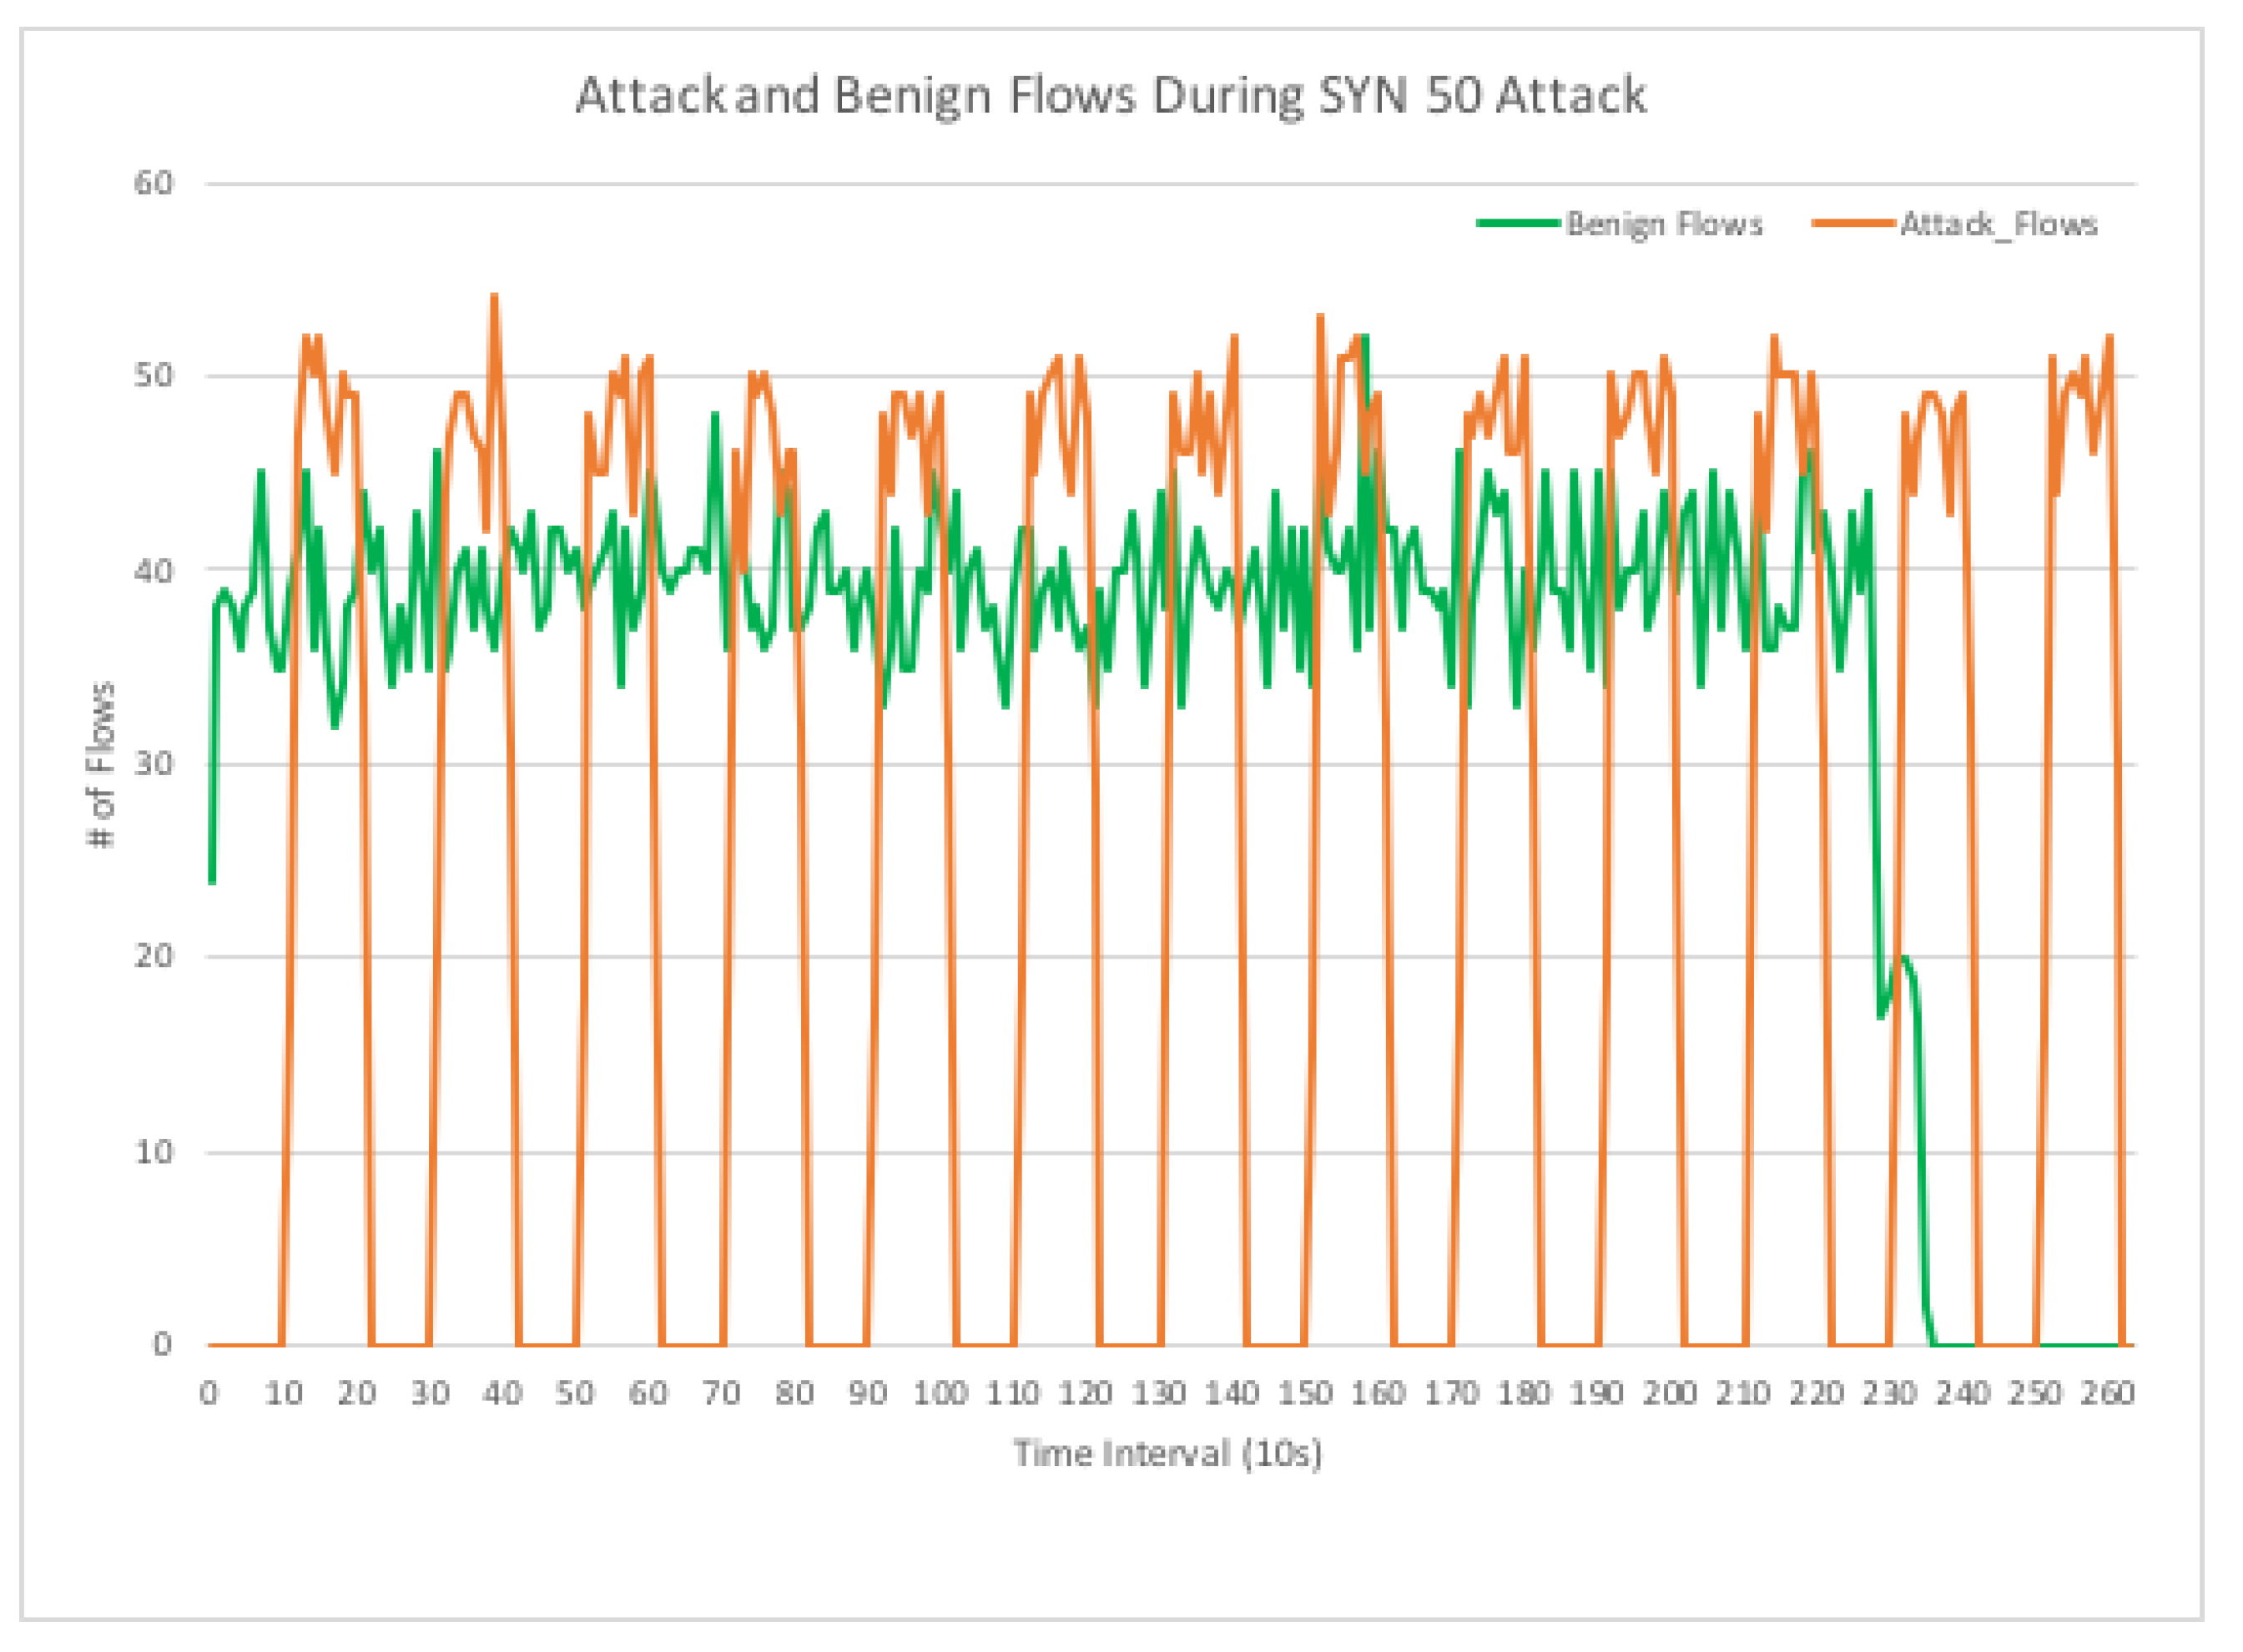
Figure 1 shows the impact of a low-rate pulse-shaped SYN flooding attack on normal traffic; the attacker sends SYN requests at a peak rate of 50 requests per second (rps) for short durations of time, but the average rate is only 2.5 rps. However, the number of benign traffic flows is reduced to 0 after some time owing to the attack.
There has been extensive research on identifying the pulse-shaped LDDoS attacks in which new connections are initiated by the attacker at a high rate for very short periods followed by long periods of no activity. A victim network under attack exhibits fluctuations in the network traffic, which may be reflected in features (attributes) such as source and destination IP addresses, the time between new connections, and traffic rate. Several frequency-domain techniques [
16,
17,
18] such as wavelet and spectral analyses and time-domain techniques [
19,
20,
21] using Shannon or generalized entropy, information distance, and statistical thresholds have been explored. However, they often have low detection accuracy, high data processing overhead, or both.
There are several recent results on LDDoS attack detection using ML/DL techniques. Furthermore, these results use a large number of features, and extracting the data for these features from the network traffic requires grouping packets by flows and significant processing. Such high overhead approaches are suitable for offline analysis of network traffic but are impractical for real-time detection of LDDoS attacks [
22,
23].
1.2. Contributions of This Paper
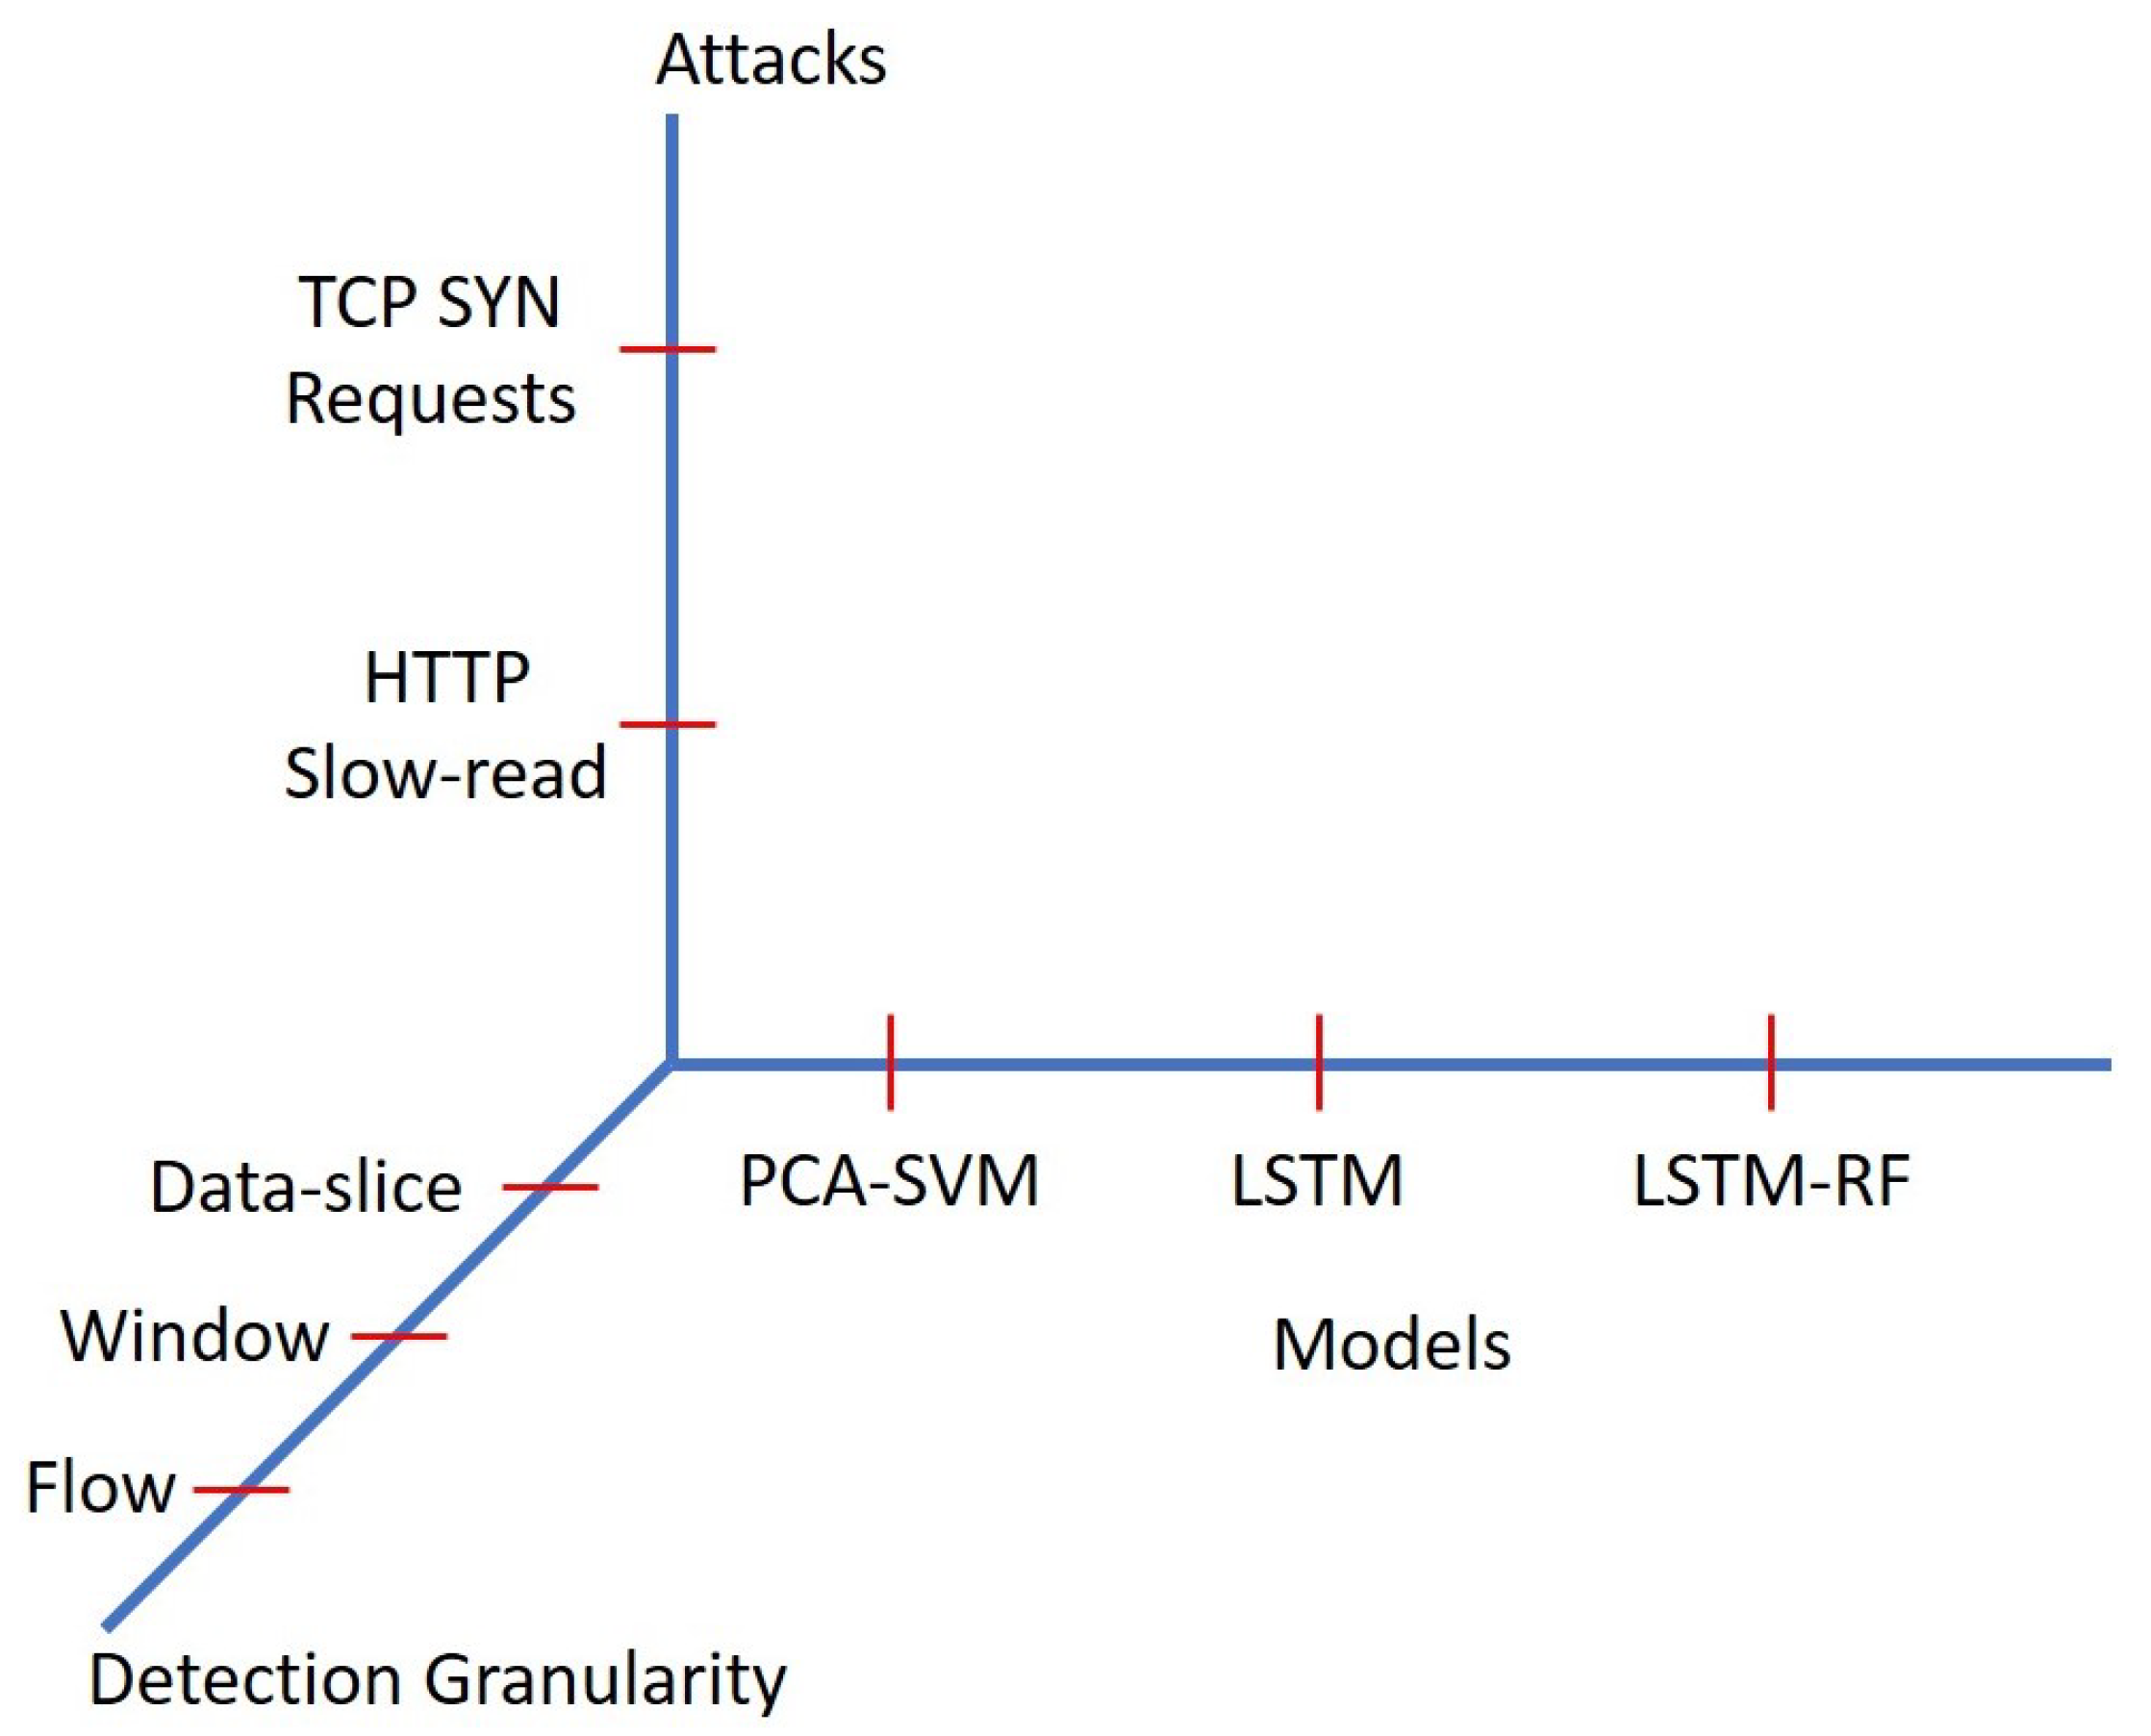
In this paper, we are interested in designing and analyzing low-overhead ML/DL techniques to detect low-rate DDoS attacks on the fly. We consider LDDoS attacks consisting of bogus TCP SYN requests and HTTP slow-read tactics. We present machine and deep learning models that detect attacks by examining the network traffic at various degrees of granularity: individual flows, groups of flows, and slices of network traffic collected over intervals of time. Our main contributions are as follows:
We present a novel two-stage hybrid model that accurately detects low-rate DoS attacks by examining windows (groups) of flows at a time with low overhead. This hybrid model combines the benefits of self-supervised and supervised learning through a long short-term memory (LSTM) Autoencoder and RF random forest (RF) model, respectively, and uses only two features to detect attacks with high accuracy.
We present an LSTM Autoencoder model that can detect individual attack flows with high accuracy while using only two data attributes from the network traffic, taken from the first two seconds of each flow.
We evaluate the suitability of a support vector machine (SVM) model, with principal component analysis (PCA) for feature selection, to detect attacks in slices of network traffic.
We publicly release the UTSA 2021 Low-rate DoS Attack dataset [
24], collected from our experimental SDN testbed (It includes the SYN flooding attack shown in
Figure 1).
The paper is organized as follows.
Section 2 discusses the related work on ML/DL techniques used in DDoS detection and various techniques used in LDDoS detection.
Section 3 presents three ML/DL models to detect attacks with various degrees of granularity.
Section 4 describes the UTSA-2021 dataset generation and its preprocessing to extract various features.
Section 5 presents the performances of the models, and
Section 6 concludes the paper.
2. Related Work
In this section, we review the relevant literature on machine learning and other techniques used for high- and low-rate DDoS attack detection.
2.1. Machine Learning Techniques for DDoS Detection
The DDoS attack detection using machine learning (ML) techniques can be categorized as supervised, unsupervised, or semi-supervised learning.
2.1.1. Supervised Learning
Supervised learning methods require the data to be labeled (marked as benign or attack) for training and validation. Doshi et al. [
8] proposed a DDoS detection method in IoT (Internet of Things) networks. They set up a consumer IoT device network. The benign and malicious traffic was collected using a Raspberry Pi v3 access point (middlebox); data for the features are extracted from the collected traffic; stateless and stateful features were engineered into a five-tuple feature vector. Various supervised algorithms were used to distinguish benign and attack packets. Random forest (RF), K-nearest neighbors (KNN), and neural network (NN) methods showed promising results with 99% accuracy. Yuan et al. [
25,
26] proposed DeepDefense, a DL based technique, to identify DDoS attacks. ISCX2012 dataset [
27] was used for training and cross-validation. The features collected were based on text, binary and numeric fields of the packets. The model includes recurrent neural networks (RNNs), convolutional neural networks (CNNs), and long short-term memory (LSTM) algorithms, particularly the 3LSTM providing the highest accuracy of 98.4%. Osanaiye et al. [
28] and Zekri et al. [
29] used decision trees, J48 and C4.5, respectively, for DDoS detection in a cloud environment.
2.1.2. Unsupervised Learning
Unsupervised algorithms are used when available data are not labeled, and anomalous patterns are to be detected. Therefore, it is easy to find datasets for unsupervised algorithms. Braga et al. [
9] proposed a lightweight DDoS attack detection method and implemented it on a NOX-based software-defined network (SDN). The controller collects a six-tuple traffic flow feature information from OpenFlow switches. Further, self- organizing maps (SOMs) are used to perform DDoS attack detection. Niyaz et al. [
30] proposed a deep learning-based DDoS detection system in SDNs with a POX controller. They collected the flows and extracted various features from TCP, UDP, and ICMP traffic, and computed the Shannon entropy of the data for these features. They used these features in a Stacked Autoencoder (SAE), which consists of stacked sparse autoencoders and a soft-max classifier, for unsupervised learning and classification. Most of the unsupervised algorithms proposed in literature achieve 99% or higher detection accuracy.
2.1.3. Combining Supervised, Unsupervised, and Semi-Supervised Learning
He et al. [
10] proposed an ML-based source-side DDoS detection in a cloud environment. They evaluated nine supervised and unsupervised ML algorithms against different attacks, namely SSH Brute Force, DNS reflection attack, ICMP floods, and TCP SYN floods. The OpenStack cloud infrastructure was used to generate traffic, and different statistical features for each attack were collected. Idhammad et al. [
31], unlike most of the existing work, proposed an online sequential semi-supervised learning approach for DDoS detection. The unsupervised part includes entropy estimation to detect the abrupt changes in the network and co-clustering algorithms combined with information gain ratio for dimensionality reduction. A supervised algorithm, namely extra trees, was used for classification. They used three public datasets, namely NSK-KDD, UNB ISCX 2012, and UNSW-NB15. Suresh and Anita [
32], and Kokila et al. [
33] evaluated the performances of the supervised and unsupervised machine learning algorithms on CAIDA and DARPA datasets, respectively.
Most of the existing works investigated high-rate flooding attacks at the transport or network layer, while some investigated the application layer attacks such as HTTP GET, SSH Brute force, and DNS Reflection. Most of the results focus on the detection of attack flows, often with high data processing overhead.
2.2. Machine Learning and Other Techniques for LDDoS Detection
Based on the current literature, the detection mechanisms of LDDoS can be classified as frequency-domain and time-domain-based detection, traffic-feature-based detection (specifically, when current traffic is under certain conditions, such as an attack or congestion), and machine learning based detection. These mechanisms use the high pulse rate and periodic characteristics of LDDoS to detect and filter the attack packets. We review these detection methods below.
2.2.1. Frequency-Domain Based Detection
The frequency domain uses signal processing to detect and filter LDDoS attacks. To process the signals, first, the traffic data are collected in the time domain and transformed into the frequency domain using the discrete Fourier transform (DFT). The transformed signals are distributed in all the frequency bands when there is no attack. On the other hand, the signals are concentrated in low-frequency bands during an attack owing to its periodic nature. This feature is used with wavelet or spectral analysis to diagnose and detect attack flows.
He et al. [
17] proposed a detection mechanism based on wavelet analysis which transforms the network traffic into fifth-order wavelet coefficients. These coefficients are used to train a backpropagation (BP) neural network to diagnose the network traffic and detect attacks by locating the malicious pulses.
Agrawal and Tapaswi [
34] use the power spectral density (PSD) method to identify low-rate DoS attacks in a cloud environment. The data are collected in the time domain, transformed into the frequency domain using DFT, and the PSD values are calculated. The traffic is classified as an attack if the PSD values are more concentrated in low-frequency bands. Similarly, Bryneilsson and Sharma [
35] used spectral analysis for detecting low-rate DoS attacks against application servers. This attack, called LoRDAS by the authors, exploits the HTTP protocol and targets the persistent connection or the keep-alive feature in HTTP 1.1. Chen and Hwang [
16] proposed collaborative detection and filtering scheme using spectral analysis of specific traffic characteristics to detect shrew attacks. The use of spectral analysis for attack detection has been studied over the past decade [
18]. Although the frequency domain is useful to classify low-rate attacks, it has a high overhead, caused by signal conversion, and high false-positive rates.
2.2.2. Time-Domain Based Detection
The process of detecting LDDoS attacks using the time domain is similar to frequency domain detection with the advantage that it eliminates the complexity of converting the traffic data into signals, which reduces the detection time. Information measurements, such as the entropy and the information distance, are frequently used in time domain-based detection mechanisms.
Xiang et al. [
20] proposed a combination of generalized entropy and information distance to measure the difference between legitimate and malicious traffic. The technique uses the differences in the averages of the entropies for normal and attack traffic for attack detection. The spacing is directly proportional to the order of
; therefore, an increase in
increases the spacing. The traffic for which spacing is greater than a certain threshold is the attack traffic. Similar research has been done by Sahoo et al. [
21] in an SDN-based data center. Likewise, Zhang et al. [
19] proposed an advanced entropy-based (AEB) scheme to distinguish LDDoS attacks from the flash crowd and legal traffic. The scheme divides the attack field into subfields of attack and treats each field with a different method. Unlike the earlier techniques, this is a self-adaptable technique. The self-adaptability feature of the detection technique is prone to adapt to undetected attack traffic. On the other hand, Tang et al. [
36] combined Hilbert Spectrum and Pearson Correlation coefficient to detect LDDoS attack packets in a detection window of 20 s. Despite the benefits of simplicity and quick detection time, time-domain-based detection methods have lower detection rates than the other approaches.
2.2.3. Traffic-Feature Based Detection
The abnormal fluctuations in the victim’s network under attack can be used as features to detect LDDoS attacks. Wu et al. [
37] studied the multi-fractal characteristics [
38] of small-scale network traffic caused by LDDoS attacks. Through the wavelet analysis, the HÖlder index estimates the singularity and the burstiness of the traffic under LDDoS attack. The difference between the HÖlder exponent of attack and normal network traffic is calculated and used for attack detection. HÖlder exponent drastically falls during an attack and suddenly rises during the end of it. This exponent value is used to compare against a fixed threshold that is set based on statistical analysis for attack detection.
Zhang et al. [
39] proposed LDDoS detection based on the congestion participation rate (CPR), which is the ratio of incoming packets in congestion to the total number of packets in a flow. Normal TCP flows tend to send fewer packets during network congestion, whereas the attack flows send more packets.
2.2.4. Machine Learning Based Detection
Recently, several researchers combined the time-, frequency-, or feature-based data collection and sampling to train various ML models for LDDoS detection. He et al. [
17] combined wavelet analysis with backpropagation neural networks for attack detection. Yan et al. [
40] extracted the characteristics such as average, variance, and entropy of TCP traffic and used them as features to train an improved logistic regression model to detect low-rate DoS attacks. Similarly, Zhang et al. [
41] combined the principal component analysis (PCA) with the support vector machine (SVM) model to detect attacks. The characteristics of TCP flows are extracted as principal components by filtering the noise interference. The extracted principal components of the training set are used to train the SVM model. Liu et al. [
42] proposed a detection approach based on multi-feature fusion. The data for the features such as the average queue length, packet size, and ACK sequence number difference are extracted from the network traffic. These features are further digitized and processed to fit the KNN classifiers separately. The outputs of the three classifiers are fitted to a posteriori probability to obtain a decision contour matrix and classify LDDoS attack traffic with 99.22% accuracy.
Wu et al. [
43] studied the low-rate DDoS attack mechanism against the SDN data layer. The attack is adopted from the slow ternary content-addressable memory (TCAM) exhaustion attack [
44]. Further, features such as time duration, packet number, relative dispersions of matched bytes, and relative dispersions of packet intervals are extracted and applied to a Factorization Machine model to detect an attack. Similarly, Perez et al. [
45] proposed a framework to detect low-rate DDoS attacks in an SDN environment. The framework is a module in the ONOS controller, which facilitates the implementation of various ML models such as the J48 decision tree, REP tree, random tree, random forest, multi-layer perceptron (MLP), and SVM for the attack detection. Every ML model is trained with the AppDDoS dataset [
46] and tested with the traffic generated on the simulation. MLP outperformed all other models with an accuracy of 95.01%.
We note that various research is carried out about using DL/ML techniques for LDDoS detection. However, most of the proposed techniques use network traffic in which the attack congests the core links in the target network; additionally, the techniques make use of continuous TCP flows as benign traffic. Our work focuses on attacks that do not aim to congest target networks but reduce TCP throughput and develop detection techniques for such attacks.
In summary, the DDoS and LDDoS attacks have been addressed by the research community using very different approaches: supervised or unsupervised learning; public or private datasets; real or own generated traffic; different contexts such as the IoT, cloud computing, and SDN; a vast number of preprocessing techniques and derived features such as the information distance and time- or frequency-domain features. The reported performance ranged from 91.0% to 99.9% based on diverse metrics such as area under the curve (AUC) of the receiver operating characteristics (ROC) curve, F1-score, accuracy, precision, and recall. Almost all of these methods have high data processing overheads and are mostly suitable for offline analyses of traffic.
3. DDoS Attack Detection Models
We are interested in LDDoS attacks that exploit the TCP protocol design and features. Specifically, we are interested in detecting pulse-shaped SYN floods and HTTP slow-reads. The attack detection can be done by flows, in which each flow is evaluated and determined whether it is benign or malicious, by windows of flows, in which a collection of flows is evaluated to determine whether the collection has all benign flows or not, or by data-slices, in which the traffic collected for a given duration of time is evaluated to determine if it contains any malicious traffic.
3.1. Motivation for New LDDoS Attack Detection Models
The detection of LDDoS attacks requires continuous network traffic analysis since these attacks can be present in seemingly normal traffic. However, most of the detection techniques for LDDoS attacks are at the flow level and require the extraction of features from multiple packets of each flow; keeping track of packets by flow is a resource-intensive task. Many of these models use a large number of features, which requires more training data and longer training times. Therefore, these techniques are suitable for offline analyses of network traffic but are impractical for real-time detection of LDDoS attacks. We address this limitation by designing new ML/DL models that have low data-processing overheads and are suitable for continuous monitoring of network traffic for on-the-fly detection of LDDoS attacks.
We have investigated various ML/DL techniques and developed our detection models at various degrees of granularity: flow, window, and data slice. Specifically, we use the support vector machine (SVM) with principal component analysis (PCA) to preprocess the data, random forest (RF), and long short-term memory (LSTM) Autoencoder techniques to develop our detection models [
47]. The SVM and RF models are commonly used supervised learning techniques that give generally good results with minimal tuning. The LSTM Autoencoders excel in learning complex dynamics within the temporal ordering of time-series data and detect anomalous patterns even by observing only a small number of features from the traffic data.
Figure 2 shows the models and attacks considered in this research. In the remainder of the section, we describe various models grouped by detection granularity.
3.2. Flow Detection Model
The flow detection methods focus on the detection of DDoS attack flows by extracting suitable features of individual traffic flows [
45]. However, they often have high network data processing overhead and require tracking packets by flows. We present an LSTM Autoencoder model for DDoS flow detection. It uses only two features, extracted with low processing overhead, to model the dynamic behavior of benign TCP flows and distinguish them from DDoS flows. An LSTM Autoencoder [
48] is a type of self-supervised deep learning model that can learn a compressed representation (encoding) of a sequence data and reconstruct (decoding) from the reduced encoding a representation as close as possible to its original input. It uses an encoder–decoder architecture consisting of multiple LSTM layers.
The model requires time series data of two features as its inputs: the interarrival times and sizes of packets within the first two seconds of a flow; each flow gives two sequences. These features are considered to be important for DDoS attack detection in existing literature [
42,
49,
50]. Furthermore, they are easily obtainable from the captured packet traces in a time series format which is required by the LSTM Autoencoder.
The model is trained and validated using benign flows only with a 2:1 ratio of flows used for training and validation. The trained model is used to encode and decode previously unseen traffic flows consisting of benign and attack flows. Given an anomalous data sequence (possibly, from an attack flow), the Autoencoder may show higher reconstruction errors than those for normal sequences. Thus, any flow that deviates from the expected behavior of a normal TCP flow can be identified as a potential DDoS attack. A reconstruction error threshold, determined during the training and validation phase, is used to classify a given flow as benign or attack.
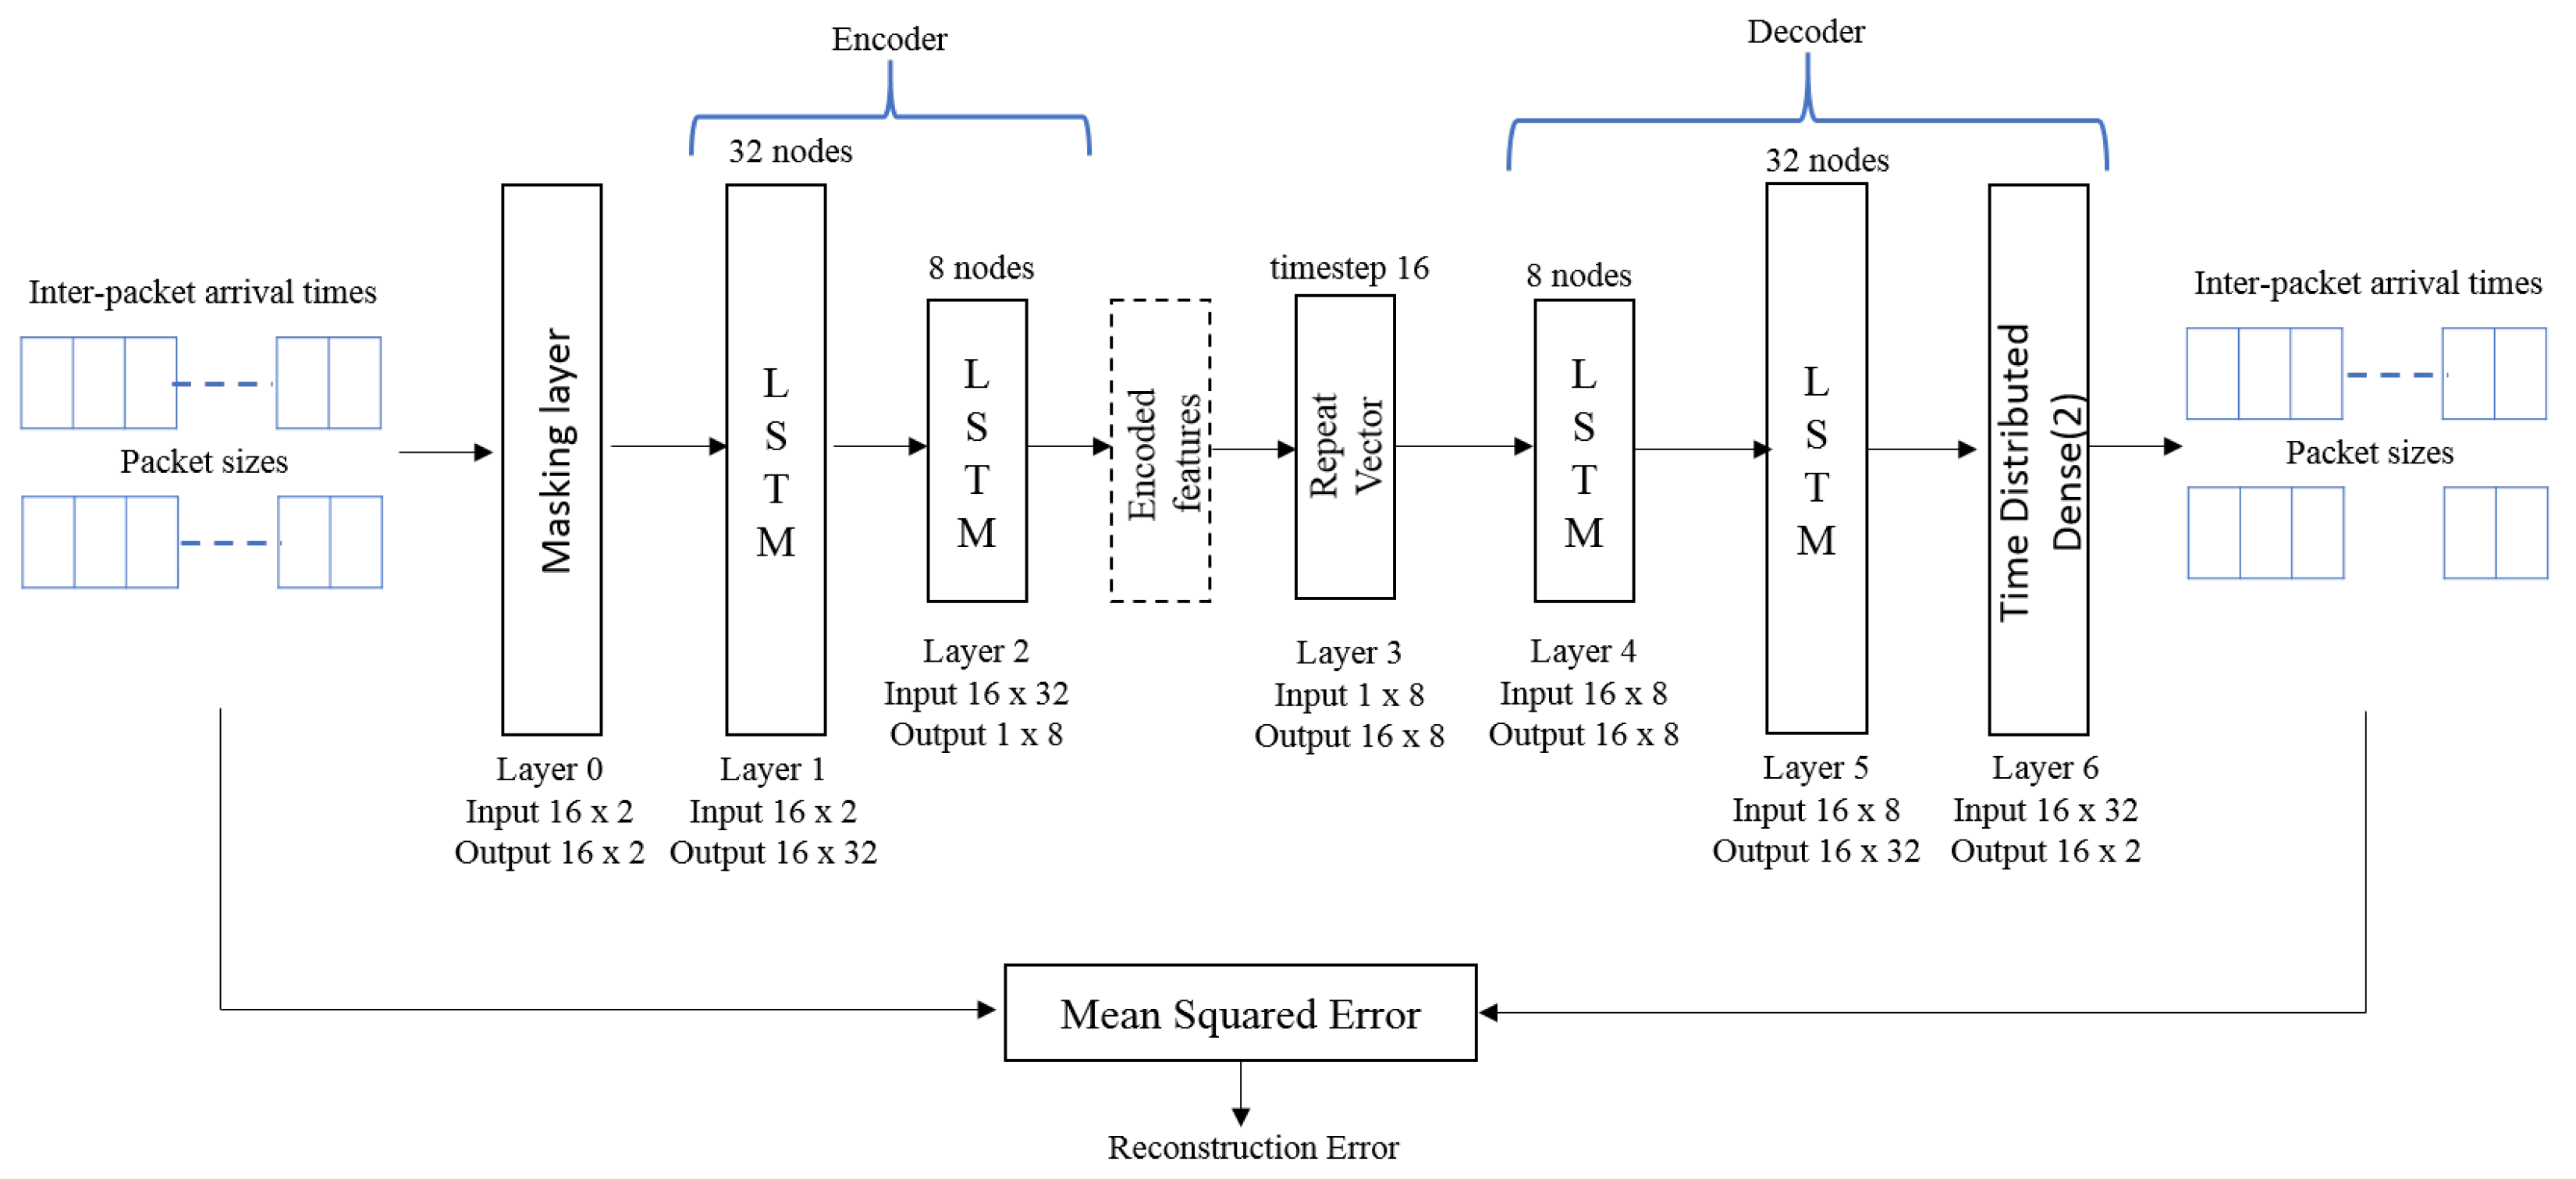
Figure 3 gives the block diagram of the LSTM Autoencoder model we developed. The input data is a 2D array with 16 timesteps (each packet arrival is a timestep) and the two features–interarrival times of packets within a flow and packet sizes. In our experiments, 16 timesteps were sufficient to include the first two seconds of a traffic flow. However, due to unequal packet arrival rates of different flows, the input data samples may have unequal sequence lengths. We address this issue by padding the end of a sequence with dummy values (−1) so that each data sample consists of 16 timesteps. Each layer of the LSTM Autoencoder is described below:
Layer 0, masking layer, informs the downstream layers that some part of the data is actually padding and should be ignored based on the mask value of −1.
Layer 1, LSTM(32), reads the input data and outputs 32 features with 16 timesteps for each.
Layer 2, LSTM(8), takes the input from Layer 1 and reduces the feature size to 8. It outputs a feature vector of size . The output of this layer is the encoded feature vector of the input data.
Layer 3, RepeatVector(16), replicates the feature vector 16 times. The RepeatVector layer acts as a bridge between the encoder and decoder modules. It prepares the 2D array input for the first Decoder layer. The Decoder layers are stacked in the reverse order of the Encoder since they are designed to unfold the encoding.
Layer 4, LSTM (8), and Layer 5, LSTM (32), are the mirror images of Layer 2 and Layer 1, respectively.
Layer 6, TimeDistributed(Dense(2)), is the last layer of the network where “2” is the number of features in the input data. It performs a matrix multiplication between the output from Layer 5 and its internal vector to produce a output vector. The objective of fitting the LSTM Autoencoder is to make this output as close to the input as possible.
The model was trained and validated for a total of 150 epochs with a batch size of 16. Batch size is the number of samples processed before the model is updated. The number of epochs is the number of complete passes through the training and validation dataset. During this process, the reconstruction errors associated with training and validation data decreased with each epoch, and eventually, the model converged to a state where additional training does not reduce the reconstruction errors. We use this steady-state reconstruction error for the validation data as a threshold to classify flows as attack or benign flows.
3.3. Window Detection Model
The window-based detection methods offer low-overhead detection of DDoS attacks by evaluating a group (window) of flows at a time. A window of flows is a group of consecutive new flows based on their start times. These methods are traffic rate-adaptive since the rate at which the windows are formed is based on the traffic rate.
We have developed a
two-stage LSTM-RF hybrid model that consists of an LSTM Autoencoder and an RF classifier. Our model combines the benefits of self-supervised learning (LSTM Autoencoder) in the first stage and supervised learning (RF) in the second stage.
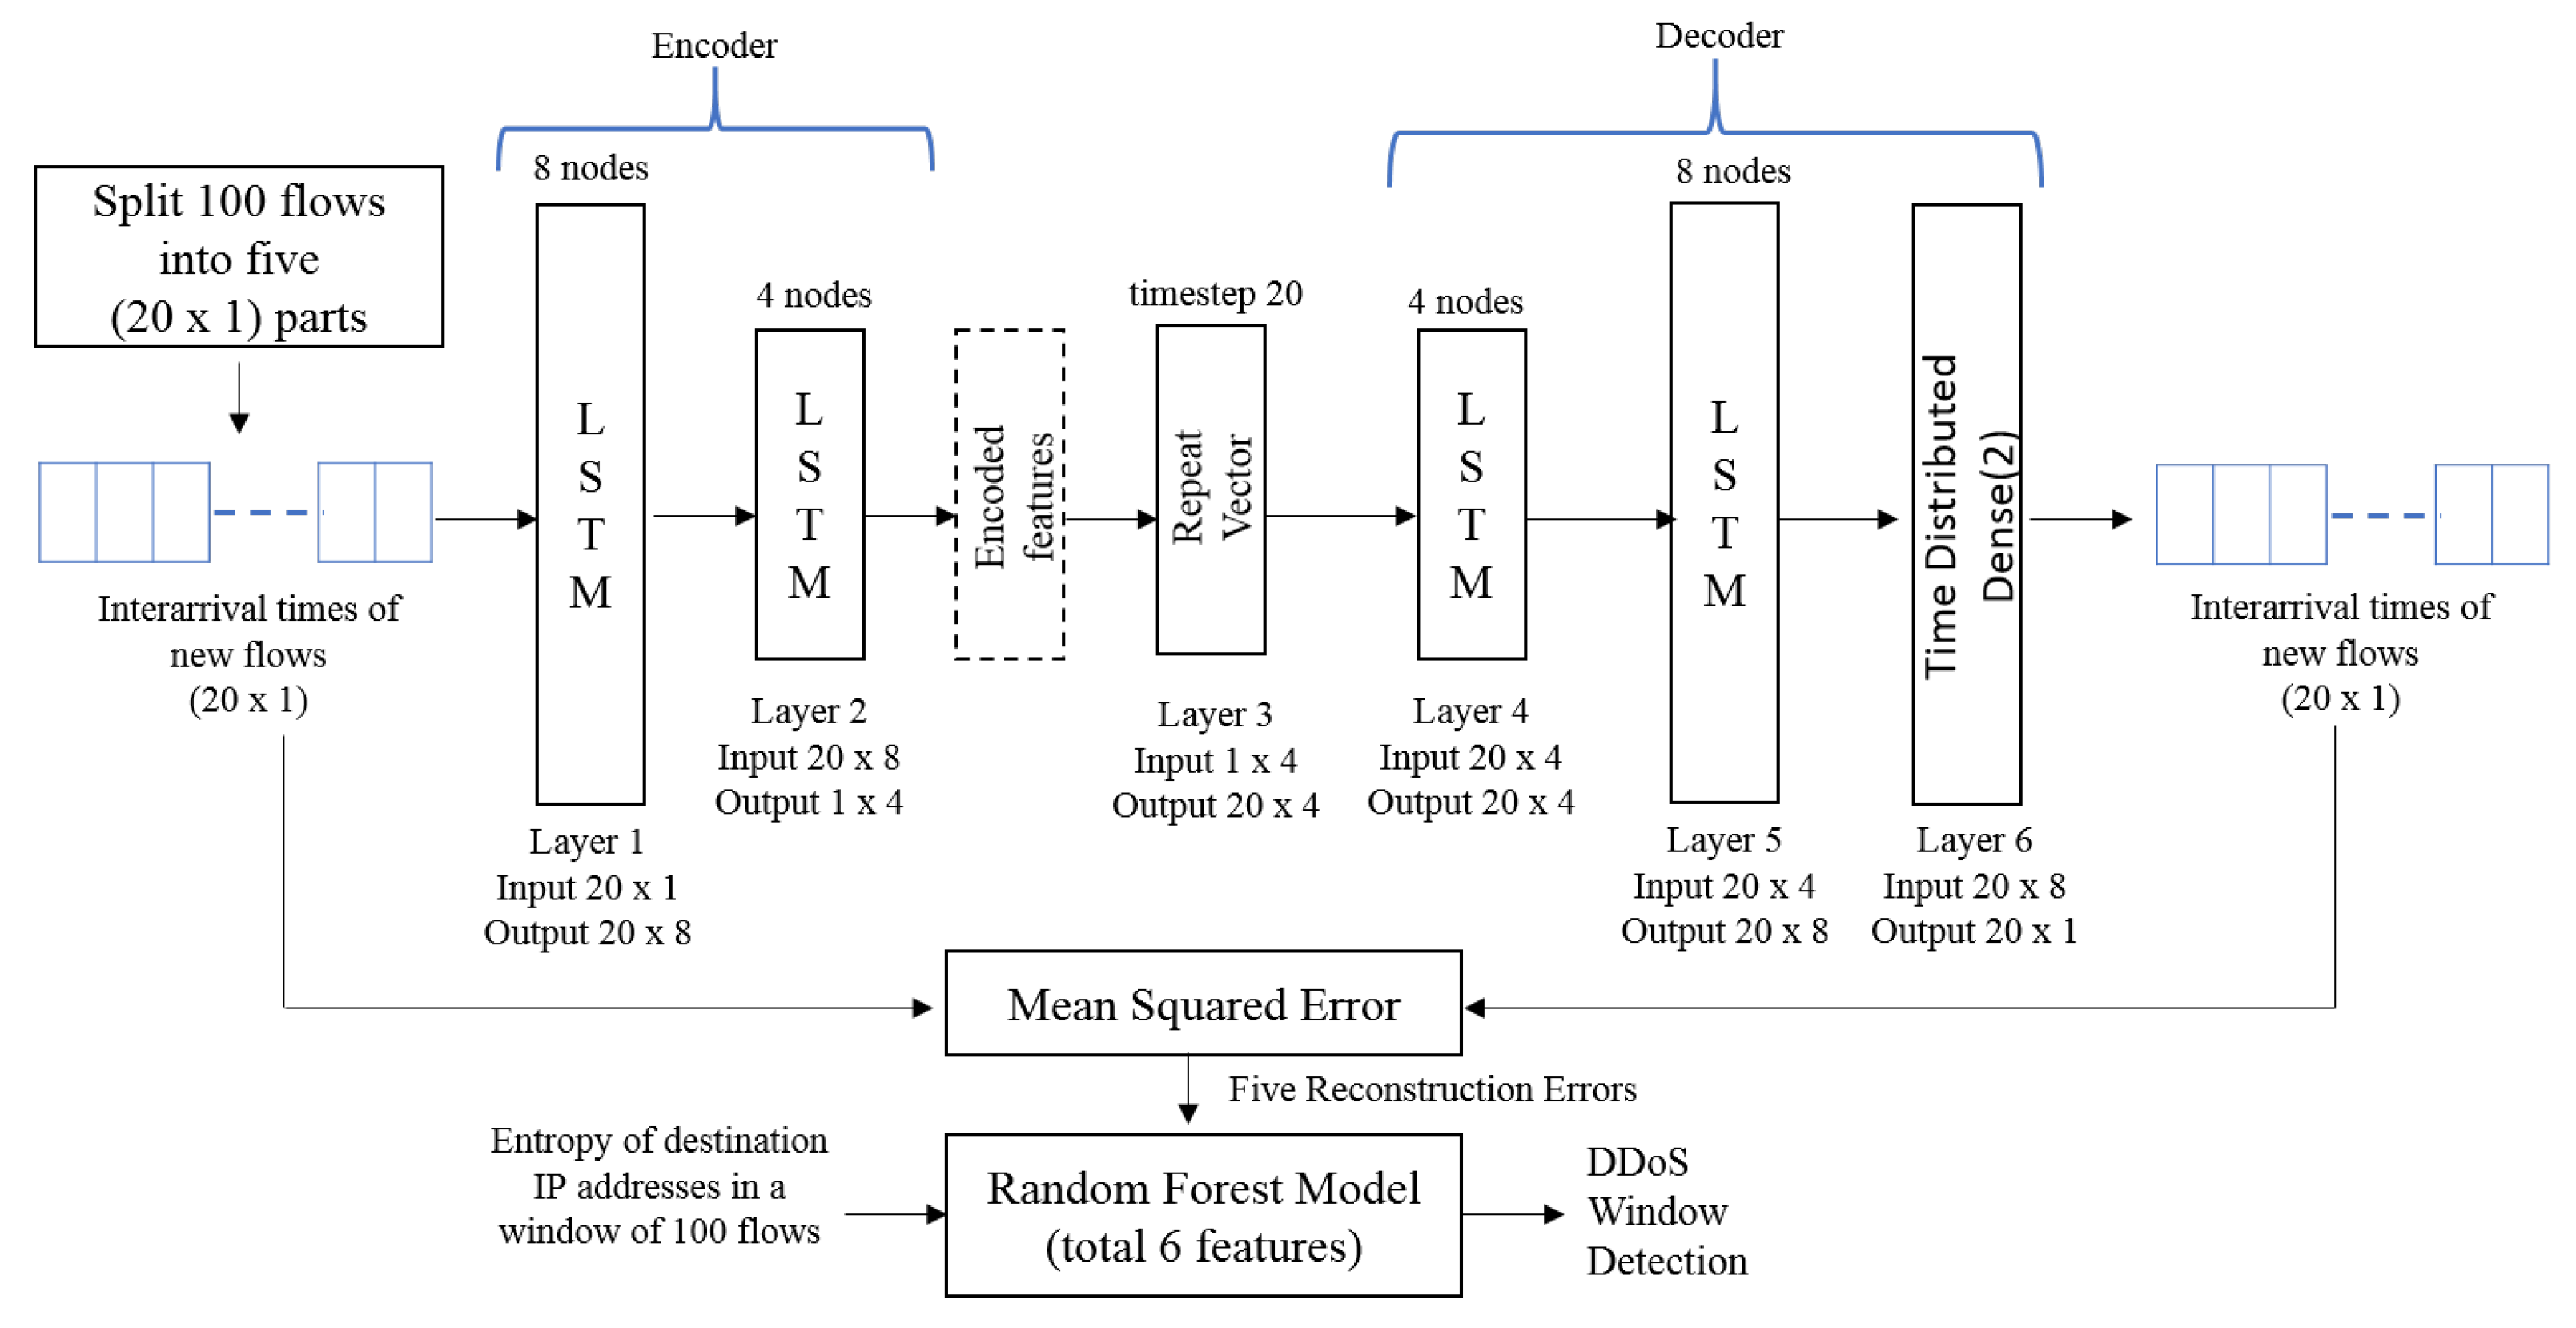
Figure 4 shows the architecture of our model. To reduce the overhead of feature extraction and for faster training, our model is designed to work with just
two features, each of which can be obtained with low overhead. In the first stage, we train an LSTM Autoencoder with data from just one feature: the sequences of interarrival times of new flows from traffic that consists of only benign flows. Each sequence is created using a window of new flows. The RF model in the second stage is trained with data from two features: (a) the reconstruction errors from the first stage and (b) the Shannon entropies of destination IP addresses in the new flows of windows. For the second stage, we use traffic with benign and attack flows. Our two-stage hybrid model captures both the dynamic behavior and the aggregate characteristics of a window of flows by integrating the inter-arrival times of new flows (time-series data) and the entropy of the destination addresses of new flows (aggregate data). We describe below each stage of the model.
The first stage of our hybrid model consists of an LSTM Autoencoder that detects anomalies in the interarrival times of a group of traffic flows. We trained the LSTM Autoencoder with sequences of interarrival times of new flows. Each sequence is measured over a window of
k consecutive benign traffic flows, based on their start times, and split into five parts (subsequences), assuming that
k is a multiple of 5. Then, the model is trained to reconstruct each subsequence. The reason for splitting each sequence of data is that shorter sequences can be reconstructed with higher accuracy than longer sequences in general. The various layers of LSTM Autoencoder serve the same functions as those for the LSTM Autoencoder flow-model described in
Section 3.2. The LSTM Autoencoder window-model differs from the flow model in the following ways: (1) It uses only one of the feature–interarrival times of new flows. (2) It does not use a masking layer since each sequence of data has the same length,
k, which is the number of new flows per window. (3) The number of nodes used in each layer is different from the ones used in the flow detection model since these are tuned for a different purpose. The training and validation dataset in stage 1 included roughly 70% of the network traffic with only benign flows.
In the second stage, we trained a random forest model to classify whether a window of k flows consists of one or more DDoS attack flows. The input features used by this model include the reconstruction errors obtained from the LSTM Autoencoder in Stage 1 and the Shannon entropy of destination IP addresses for a given window of flows.
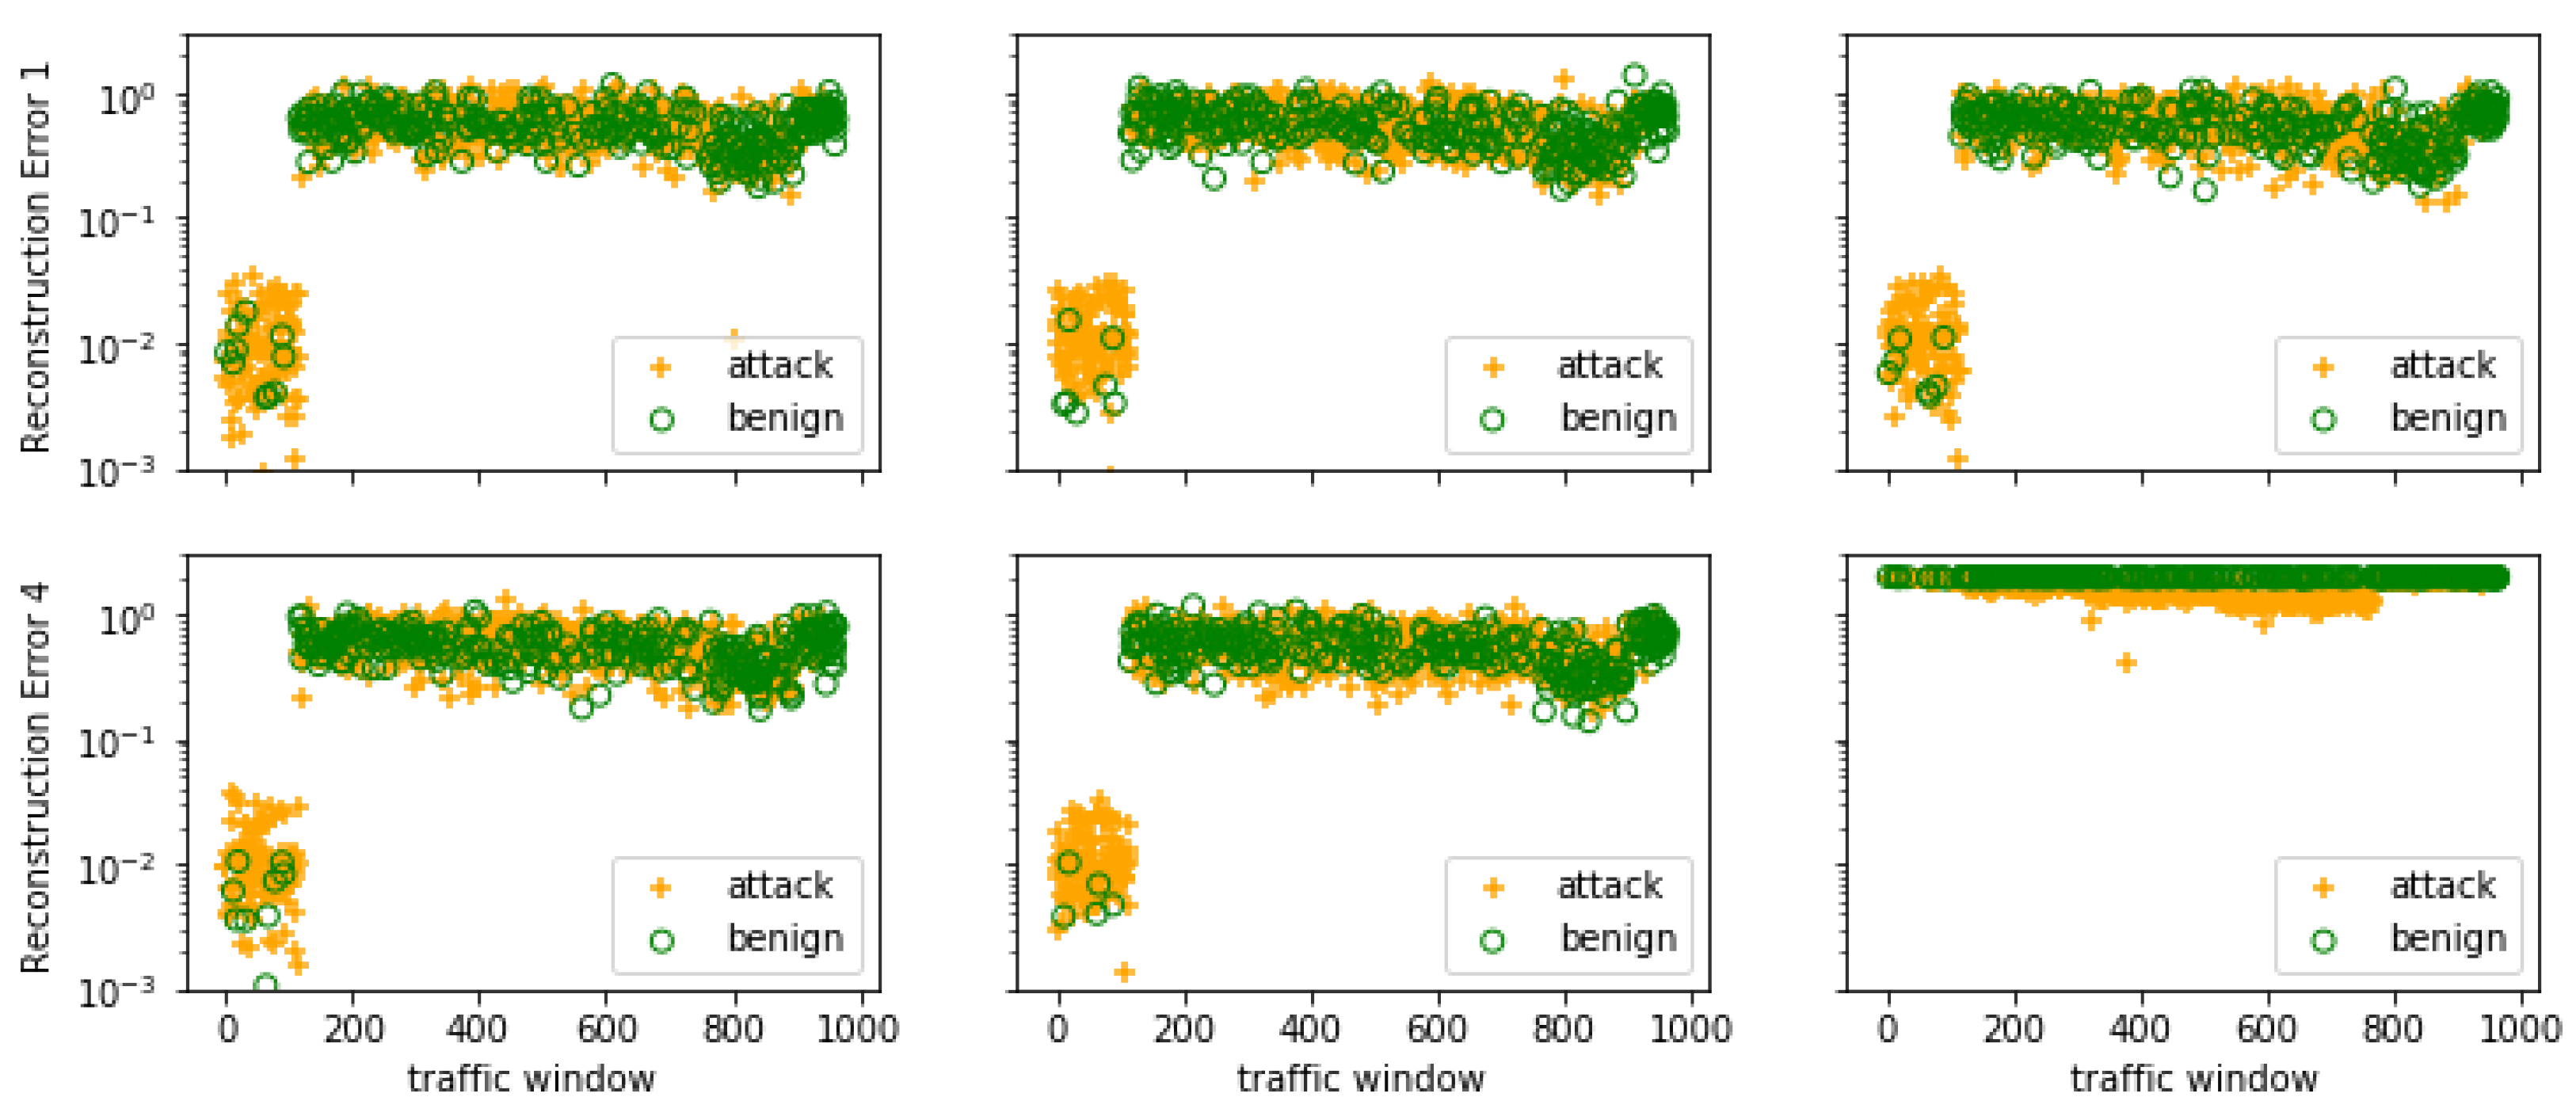
Figure 5 shows the five reconstruction errors corresponding to five subsequences from the LSTM Autoencoder in Stage 1 and the entropies of windows used for training the RF model in Stage 2 for
. We observe that using only a subset of these features will not be sufficient to accurately detect a window with attacks since there are significant overlaps between the input feature values for multiple attack and benign windows. Therefore, a machine learning model that combines all of these features is used to make predictions. The training dataset used in Stage 2 included roughly 70% of all benign and attack traffic.
3.4. Data-Slice Detection Model
A data slice is a portion of the network traffic collected for a specified time duration. Zhang et al. [
41] present a PCA-SVM model for detection of attacks in data slices; this model uses the Principal Component Analysis (PCA) for feature reduction and the Support Vector Machine (SVM) as a classifier. For TCP traffic with continuous flows, which last throughout the experiment, they show that high detection accuracy (about 95%) can be achieved. We think this technique could be suitable for on-the-fly detection of attacks since time-based aggregation of traffic is likely to be easier than processing it to obtain more complicated features such as average packet length or specific TCP/IP header fields, commonly used in many ML/DL models.
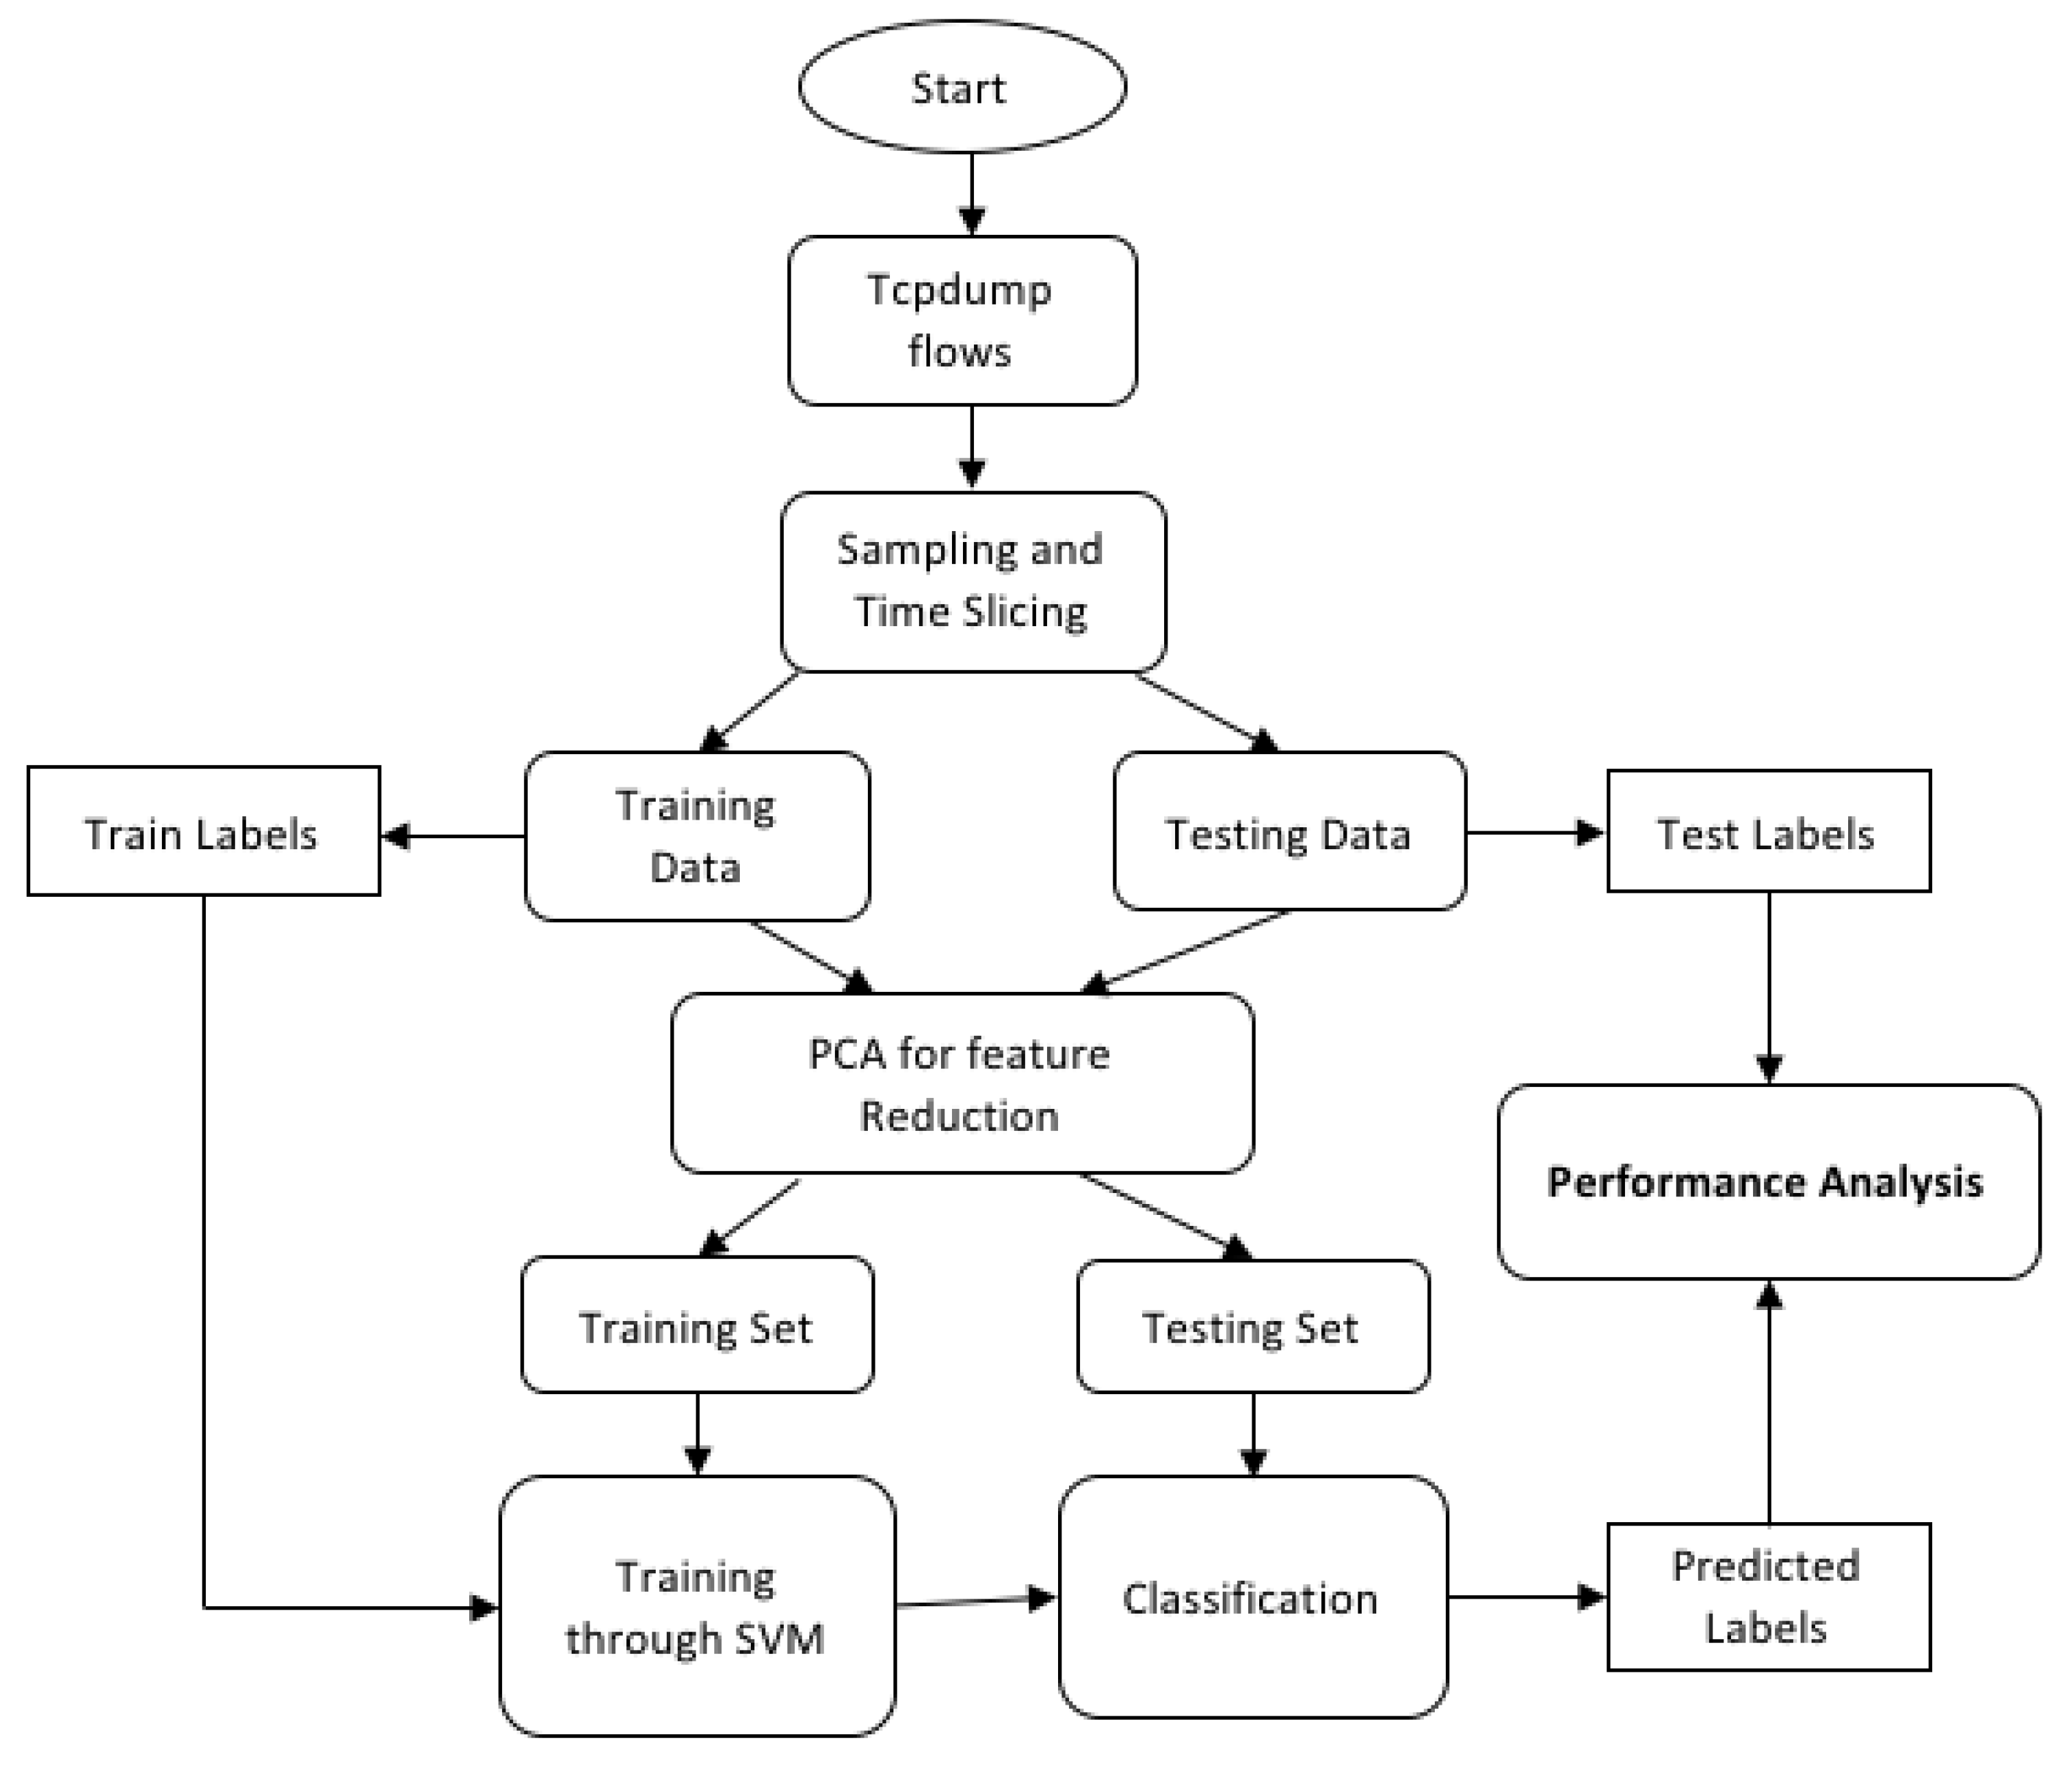
Therefore, to evaluate its effectiveness for the transaction type TCP traffic in which the TCP connections involve downloading web objects by clients and are short-lived, we adapted the PCA-SVM model for low-rate DDoS attack detection. A block diagram of the adapted model is shown in
Figure 6. The main steps in the model are described below.
The network traffic data under the attack is partitioned into samples, each containing seconds of network traffic. A TCP flow value, which can be the number of new flows, total flows, or data bytes, in each sample is extracted.
Owing to the short sampling time, say, s, the sample data may have disadvantages such as lack of correlation and high computational complexity when trying to analyze the relationship between the sample points separately. Therefore, we create an array of TCP flow values and treat it as a data slice. These data will be arranged as a two-dimensional matrix, called feature matrix, with rows and k columns, where t is the duration of the experiment, k is the number of samples in a data slice, and is the sample duration. Each row is a data slice. For network traffic collected for s and with and s, there will be 60 such data slices, and each slice is an array of 100 TCP flow values.
It is possible that the components of some sampling points change very little with or without attack, which will affect classification results. In order to overcome this, PCA is used to extract the most beneficial components for classification from both train and test data. The contribution rate of each principal component is calculated, and the principal components whose sum of contribution rate is over 96% are selected. The number of components that contribute up to the 96% limit decreased with an increase in the attack rate. For example, 87 principal components explained approximately 96% of data variability, in the case of SYN attacks at 2.5 rps, whereas for the same 96% explained variances, only nine principal components are included, for the same attack but at a 30 rps rate.
The training set obtained after the PCA feature reduction is used to train an SVM model.
The test set obtained after PCA processing is classified by the SVM model.
We present the performance of this model for various data-slice sizes and TCP flow values in
Section 5.
4. Datasets
The detection techniques based on ML/DL models critically depend on the availability of large amounts of representative data for training (and validating) the models. For this purpose, we considered the CIC-2019 and CIC-2017 DoS datasets from the University of New Brunswick’s Canadian Institute for Cybersecurity [
51,
52]. The CIC-2019 dataset has mostly high-rate continuous DDoS attacks, which are easy to detect. The CIC-2017 dataset is specifically created to include several types of low-rate DoS attacks [
45,
53]. However, the attack rates are still high; for example, the slow-read attack averages more than ten new flows/second and more than 150 packets/second. Our interest is in detecting attacks that cannot be easily sensed by traffic volume or other commonly used flow-related features.
Since we are interested in the detection of very low-rate attacks that include incomplete (SYN floods) and completed (HTTP slow-read) attack flows, we generated the benign and attack traffic flows with various rates using a software-defined networking testbed described below. For easier reference, we denote this as UTSA-2021 dataset [
24]. The SYN floods are launched at various rates with short durations of attack and long durations of quietness. HTTP slow-read attacks are launched by consuming the data sent by the server very slowly and throttling the web servers with zero receive-window advertisements. An HTTP connection is kept alive for a significantly longer duration than it will be with a normal client.
4.1. Experimental Setup
An experimental SDN testbed was set up to collect realistic benign and attack traffic. The testbed consists of four Linux machines. One machine ran a vSwitch as the OpenFlow switch and a Pox controller as the OpenFlow controller to create an SDN environment [
54]. The southbound interface is a TCP channel with 1Gbps bandwidth. The OpenFlow (OF) protocol v1.0 is used for communication between the switch and the controller. One machine ran the benign clients (as separate processes), and another the attacker processes. The fourth machine ran separate web servers for the attacker and the benign clients. The client and the server machines are connected to the OpenFlow switch.
The SDN switch and controller are run on a machine with Ubuntu 16.04 LTS operating system (OS), Linux 4.15.0-34-generic kernel, Intel core i7-7700 processor at 3.69 GHz clock rate, and 32 GB, 2400 MHz DRAM memory, and a 4-port gigabit Ethernet interface card. The server is run on a machine with Ubuntu 16.04 LTS, Linux 4.4.34abc, Apache 2.4.18 (Ubuntu), Intel Core2 Quad processor Q9550 at 2.83 GHz, 8 GB synchronous 800 MHz DRAM, and a gigabit Ethernet interface card. The normal client is run on a machine with Ubuntu 16.04 LTS, Linux 4.4.0-138 kernel, Intel Core2 Quad processor Q9550 at 2.83 GHz, 8 GB synchronous 800 MHz DRAM and a gigabit Ethernet card. The attacker is run on a machine Ubuntu 16.04 LTS OS, Linux 4.4.0-134 kernel, Intel Core i7-2600 processor at 3.4 GHz, and 16 GB DRAM at 1333 MHz, and a gigabit Ethernet card.
4.2. Data Collection
The network traffic was collected at the switch interfaces connected to the client and attacker machines. Eight instances of the client Python program communicated with two instances of the server program with different ports to generate the benign traffic consisting of HTTP downloads with various sizes and inter-arrival times. All benign traffic is generated using the web client and server codes we created. The attack traffic is generated using hping [
55] and slowhttptest [
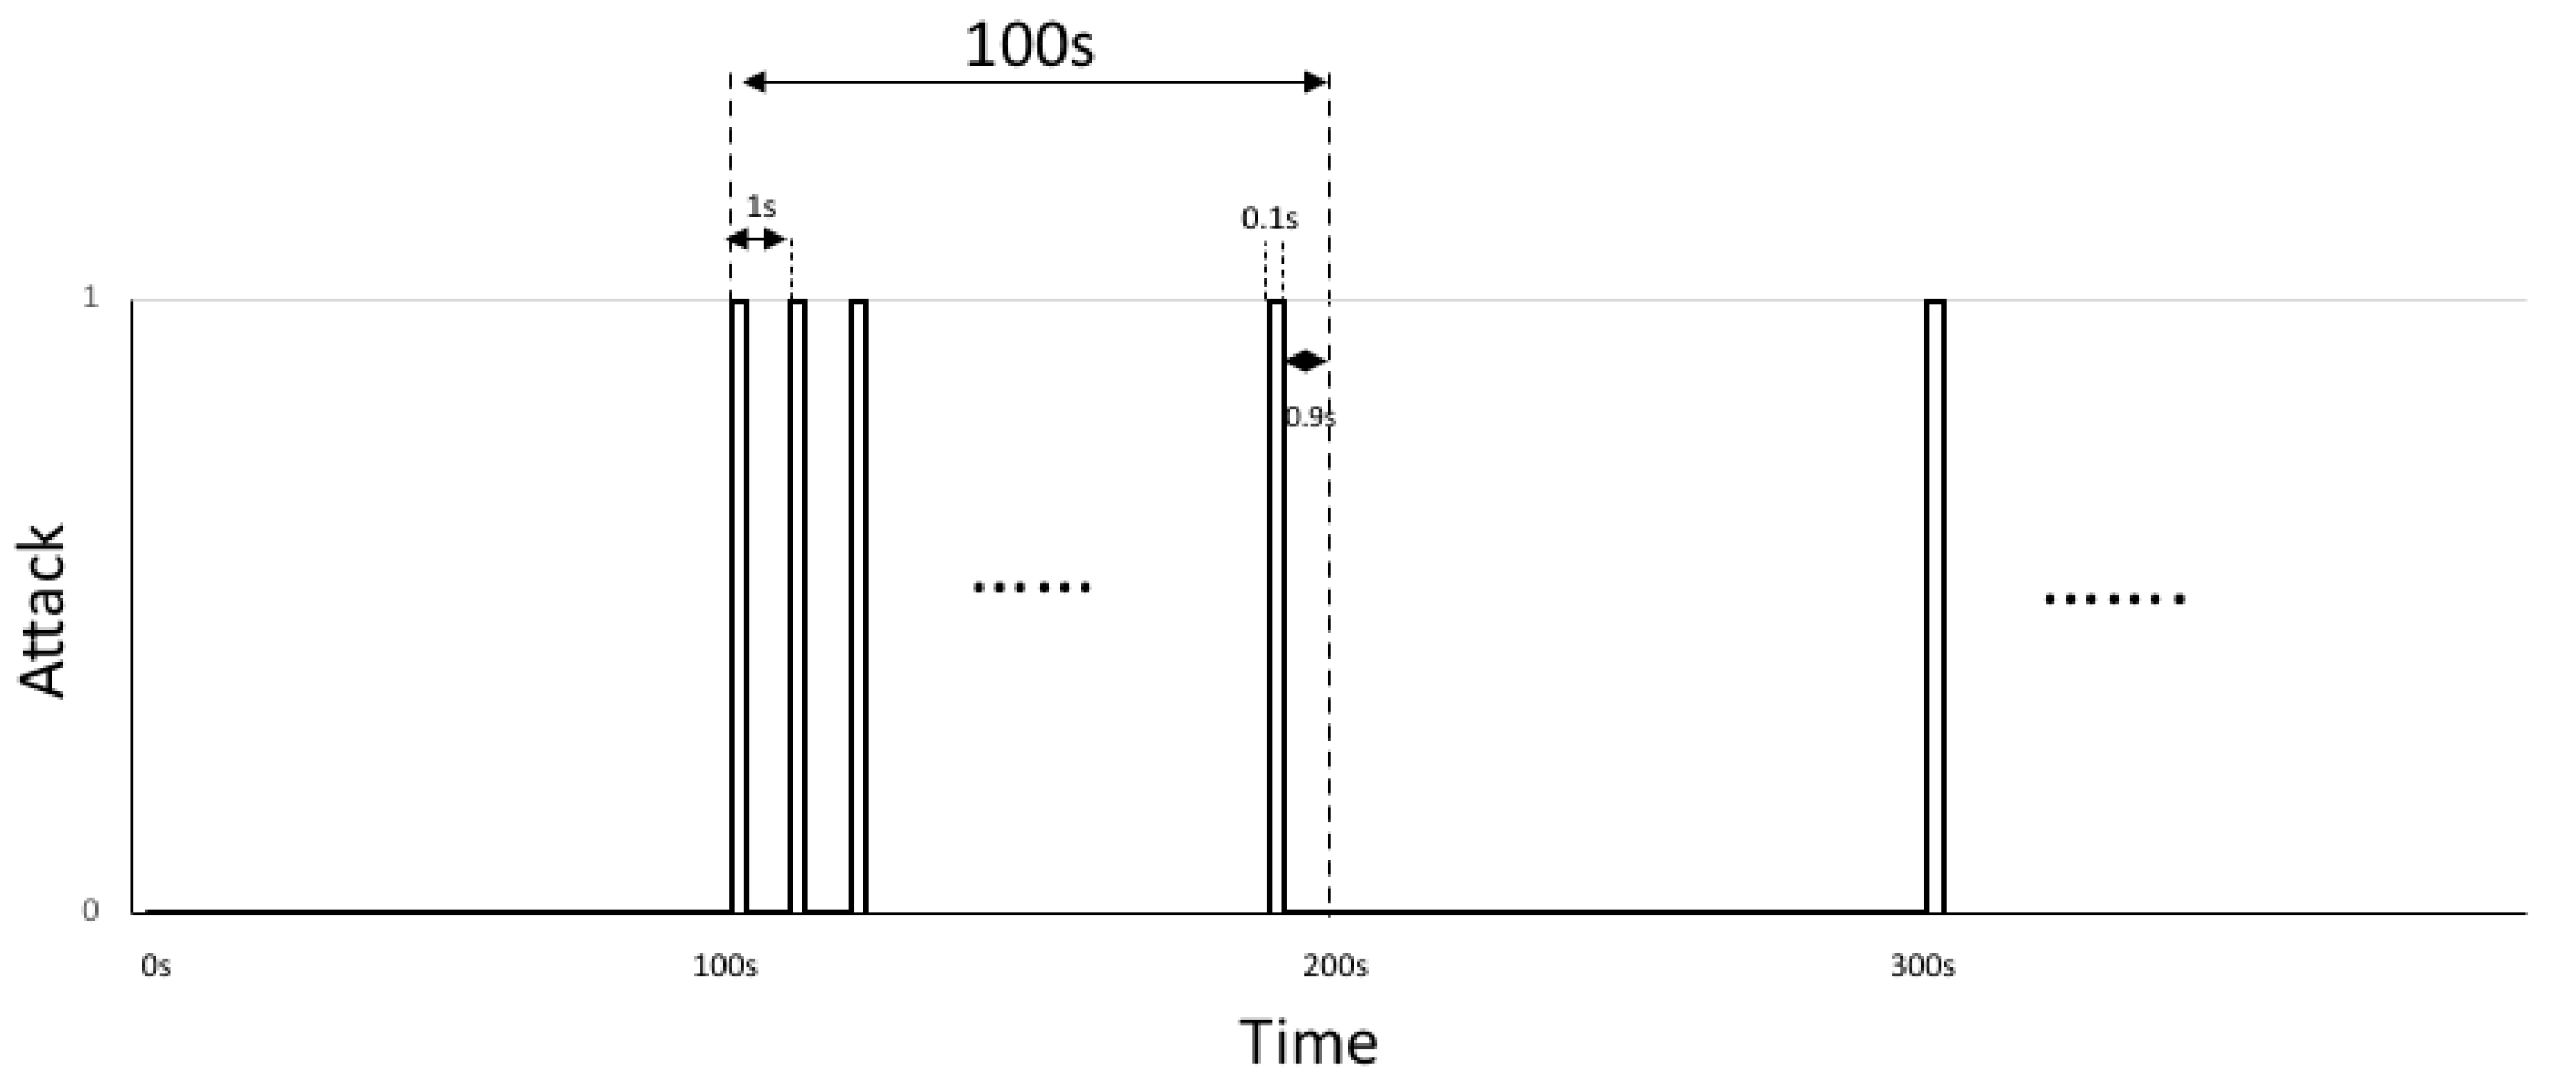
4] tools. The attack traffic consists of various low-rate TCP SYN attacks or HTTP slow-read attacks. In order to achieve low-rate SYN attacks that are active only for small intervals of time, hping was modified to generate attacks only in the first 0.1 s of every second.
The experiments were run for 5 min for each attack rate with one benign client and one attacker. To further camouflage the low-rate attacks, some of the SYN attacks have an altering pattern of 100 s of pulse-shaped attack and 100 s of sleep to interleave periods of benign only traffic and periods of benign and attack traffic.
Figure 7 gives the timing of the attack and quiet periods. Additional SYN-attack experiments were run for 90 min each with this pattern with eight benign clients and one attacker. The slow-read attacks, generated using slowhttptest, did not use the pulse-shaped attack patterns.
The attack and benign flows interfere with one another at the SDN switch and the server.
Figure 1 shown in
Section 1 illustrates this for an SYN attack that sends SYN requests in 0.1-s durations at a peak rate of 50 requests per second (rps), which results in an average attack rate of 2.5 rps. The details of the attack and benign traffic flows are given in
Table 1.
4.3. Data Processing and Features Extraction
We curate the DoS attack dataset we generated using the testbed to create a DDoS attack dataset as follows. Since the testbed we used has only one server (with IP address 10.0.1.2) and two clients (a benign client with IP address 10.0.0.1 and an attacker client with IP address 10.0.2.1), we process the data to create the effect of distributed denial of service attacks. First, we replace the server IP address field in the packets of benign TCP flows with addresses having the network prefix 10.0.1.0/24. For each benign flow, we use an IP address of the form 10.0.1.y, where y is randomly generated with the Python function random.randrange(2, 6); we replace the server IP address in all packets of that flow; that is, the destination address for packets from client to server and the source address in the other direction. The destination IP addresses of the attack packets are left unchanged to capture the attack traffic directed to a single target. The client and attacker IP addresses for benign and attack flows can be randomized similarly. However, in this research, we do not use the source IP addresses or source port numbers for any of the features used to train the models. Only the destination addresses of new flows are used to compute the entropy feature used in the second stage of the LSTM-RF hybrid model. We use the curated data to extract the relevant features needed to train the model and detect attacks.
For the LSTM flow detection model, the preprocessing includes conversion of captured packet traces into flows and extracting selected features from each flow. The conversion of packet capture to individual flows is done with the help of a flow extractor script. The flow extractor, initially, extracts all the packet information with a tcpdump command and sorts the packets by flows and time. Then, the selected features are extracted from these flows forming a feature matrix. The feature matrices of different benign and attack traffic are input to the flow model. The open-source tools for feature extraction such as flowtbag [
56] and CICflowmeter [
57] have limitations or do not extract the features we need. For example, flowtbag extracts features only if the flows have complete TCP connections and not for incomplete TCP connections resulting from the bogus SYN requests from the attacker. Therefore, we developed tools to extract the necessary features.
To create the feature matrix for the data-slice model (PCA-SVM), the network traffic is partitioned into samples, each containing 0.1 s of traffic data. From each sample, a TCP flow value, which could be the number of new connections, number of active connections, number of packets sent, or number of application data bytes sent, is computed. A data slice is formed by taking the TCP flow values for several consecutive samples; the number of samples is determined by the data-slice duration. The feature matrix consists of rows of data slices.
For the window model (LSTM-RF hybrid), the network traffic is partitioned into windows of k consecutive flows based on their start times. For each window, the interarrival times between new flows and the Shannon entropy of destination IP addresses are computed.
In the next section, we describe the performances of the detection models described in
Section 3 using the features data extracted from the UTSA-2021 Low-rate DoS Attack dataset.
5. Results
In this section, we investigate the effectiveness of detection at various levels of granularity using the models described in
Section 3. We used the UTSA-2021 dataset [
24]; 70% of each traffic type is used for training and validation and the rest for testing. The 70–30 ratio is a commonly used rule of thumb for splitting the data into training and testing sets, especially when the dataset contains several thousands of samples [
30,
58].
The testing dataset was further categorized into all traffic, which included all of the testing datasets, and sparse traffic, which included SYN attacks with 25 and 50 peak requests/second (rps), HTTP slow READ attack, and purely benign traffic.
5.1. Detection of Attack Flows
We evaluated the LSTM Autoencoder model described in
Section 3.2 for attack flow detection accuracy. We consider a traffic flow as benign only if the LSTM Autoencoder reconstructs the flow with an error less than or equal to the threshold value determined from the reconstruction errors observed during the training and validation stages. For the UTSA-2021 dataset, with 15,400 benign flows for training and an additional 7700 flows for validation, the threshold is 0.0167.
Table 2 shows the results for the all traffic and sparse traffic cases. The LSTM Autoencoder detects DDoS attack flows with an accuracy of 99.24% for the all traffic case and 99.37% for the sparse traffic case.
A random forest model can also detect attack flows with high accuracy but typically requires a large number of features with high data processing overhead. The RF model by Pérez-Díaz et al. [
45] uses 39 features and works for completed flows. Since we are interested in SYN flooding attacks, which are incomplete flows, and slow-read attacks, which may not always terminate cleanly, we do not consider RF models for individual flow detection.
5.2. Detection of Attacks in Windows of Flows
We used the LSTM-RF hybrid model (
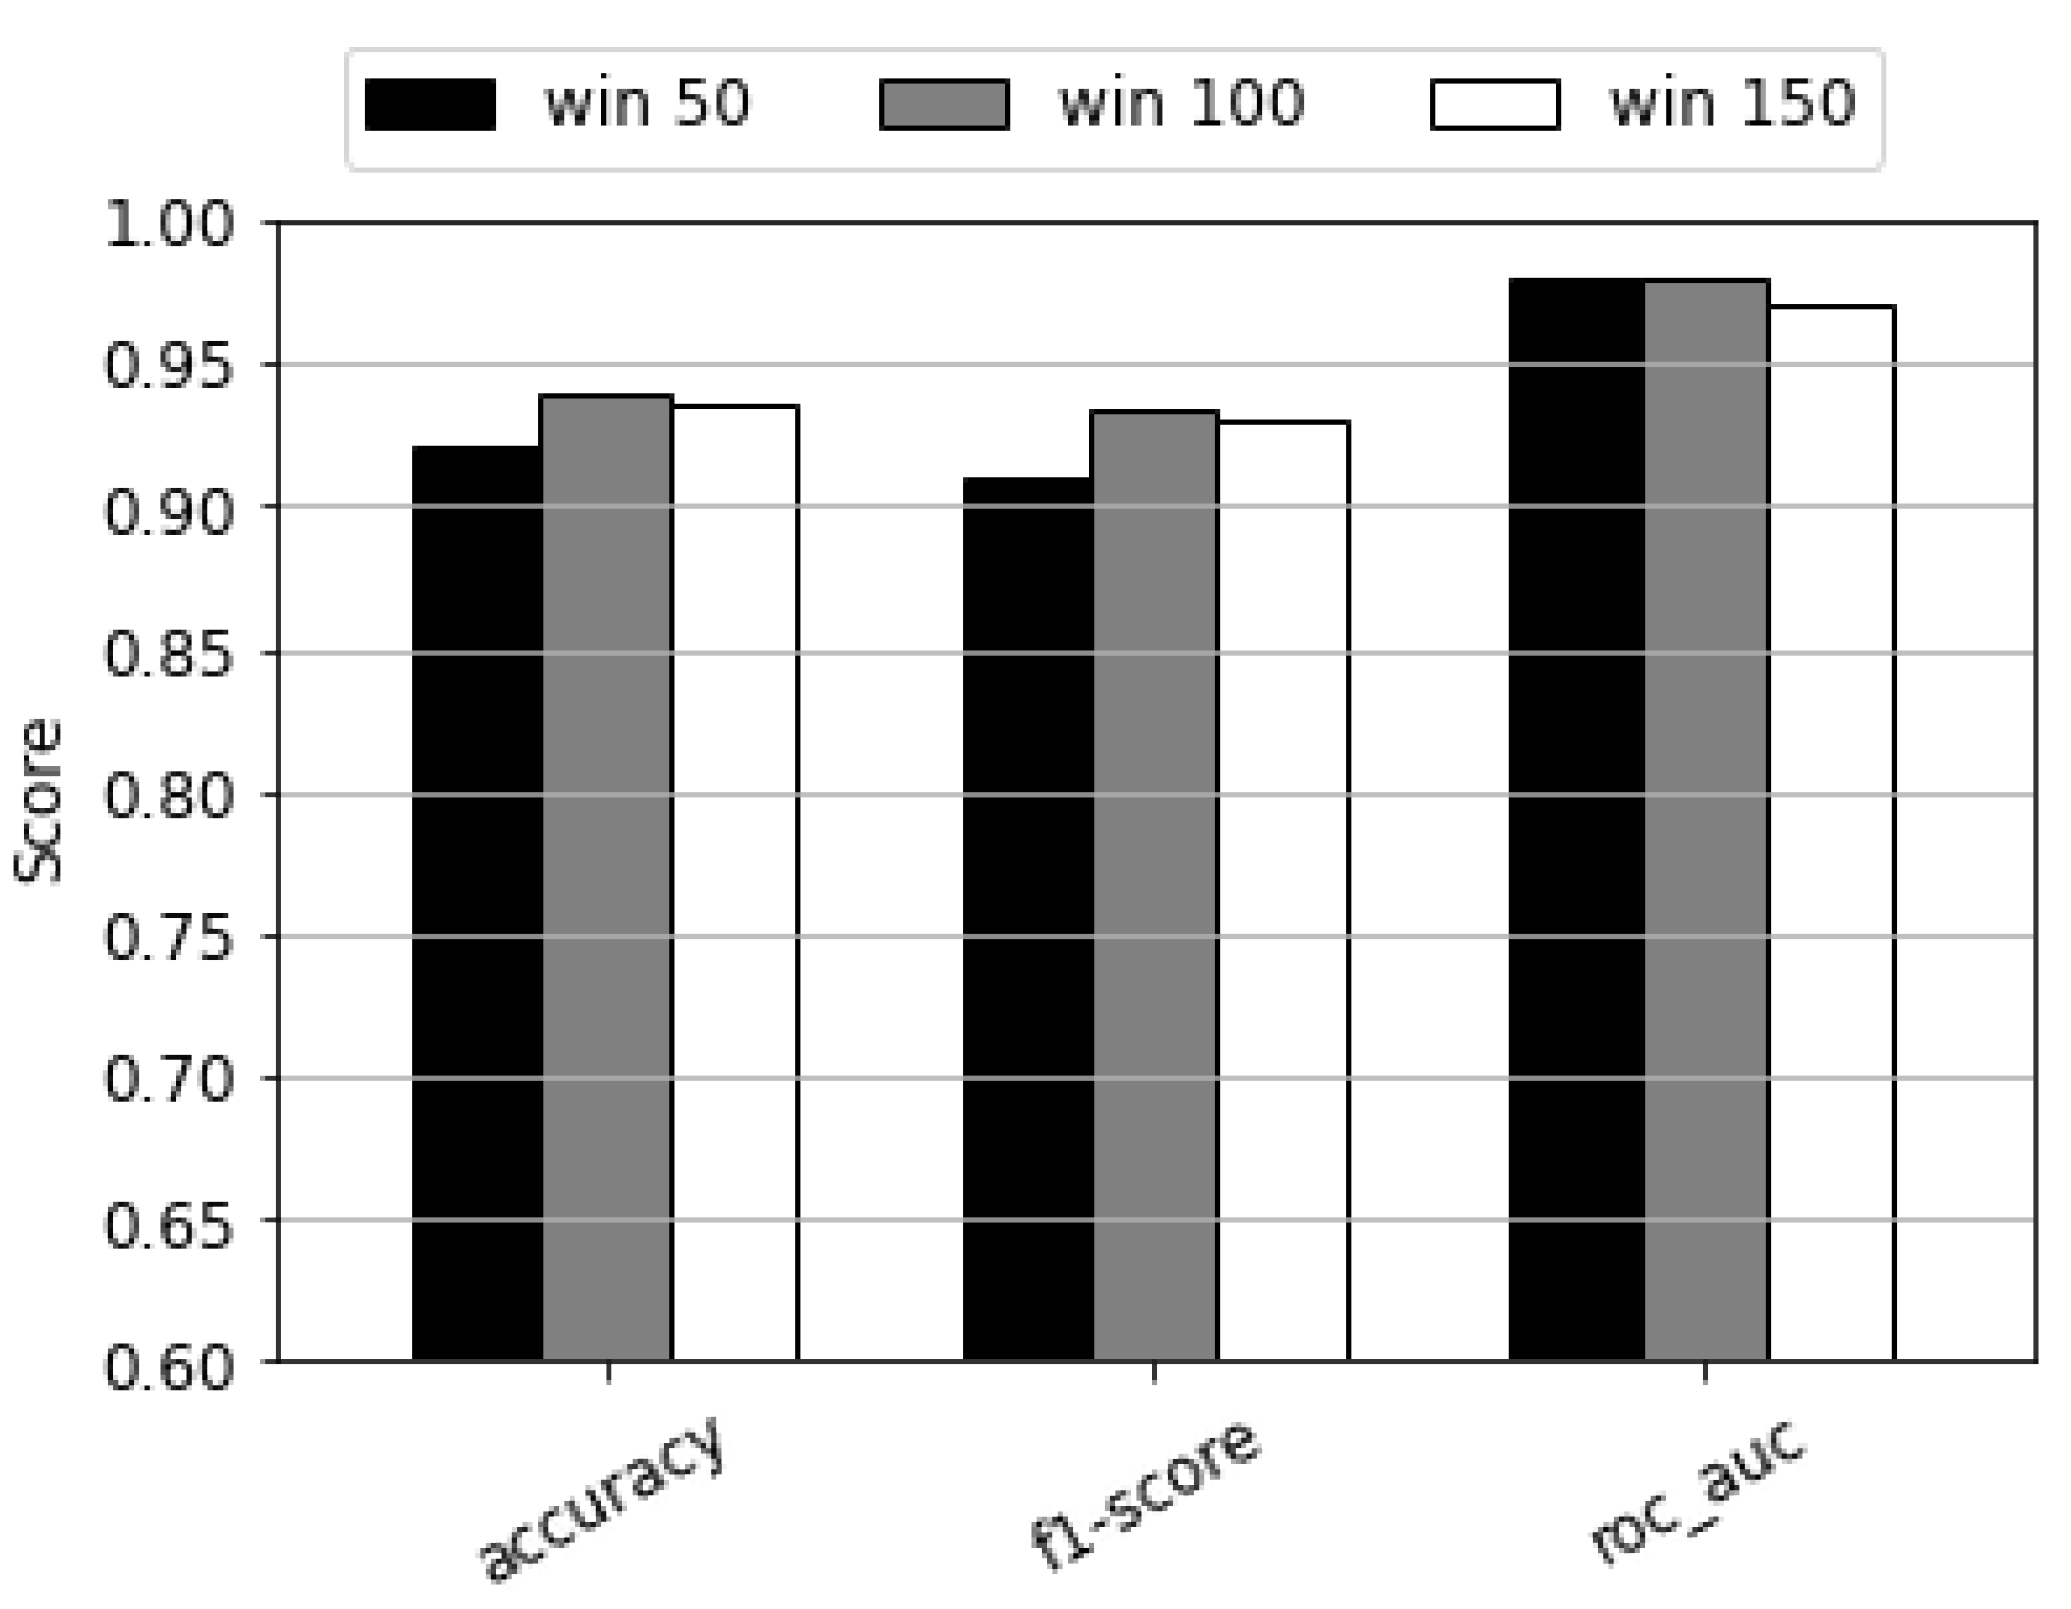
Section 3.3) to detect DDoS attacks in windows flows. We tried different window sizes, 50, 100, and 150, and determined that the entropy feature works better for windows of 100 flows. Therefore, we present below the results for windows with 100 consecutive new flows based on their start times. Later, we analyze the impact of the window size on the performance.
Table 3 shows the corresponding results. Our window detection model gives accuracies of 94% and 93.5% for the all traffic and sparse traffic cases, respectively.
We also performed a 10-fold cross-validation to verify that the LSTM-RF hybrid model was not overfitted. With 10-fold cross-validation, the average accuracy was 91.2%, with a standard deviation of 6%. The precision was 95.9%, with a standard deviation of 5.8%, the recall was 92.8% with a standard deviation of 8.2%, the F1-score was 94% with a standard deviation of 5.5%, and the ROC AUC score was 94.9% with a standard deviation of 5.1%. It is worth mentioning that cross-validation experiments may have cases where the training data for some attack rates may be significantly less than 70% or even entirely missing. Hence, the average accuracy could be lower than that of the experiments in which 70% of all attack rates are present in the training dataset.
The RF model in Stage 2 is fed with the reconstruction errors of windows from LSTM in Stage 1 and the Shannon entropies of windows. If Stage 1 is omitted, then, with the Shannon entropy as the lone feature, RF model performs worse, with accuracy dropping to 90% or below for both traffic cases. To use an LSTM model by itself for window detection, we need to provide more data than the interarrival times of new flows. Determining whether a flow is an attack flow based on its interarrival time only is similar to predicting success in a Bernoulli trial.
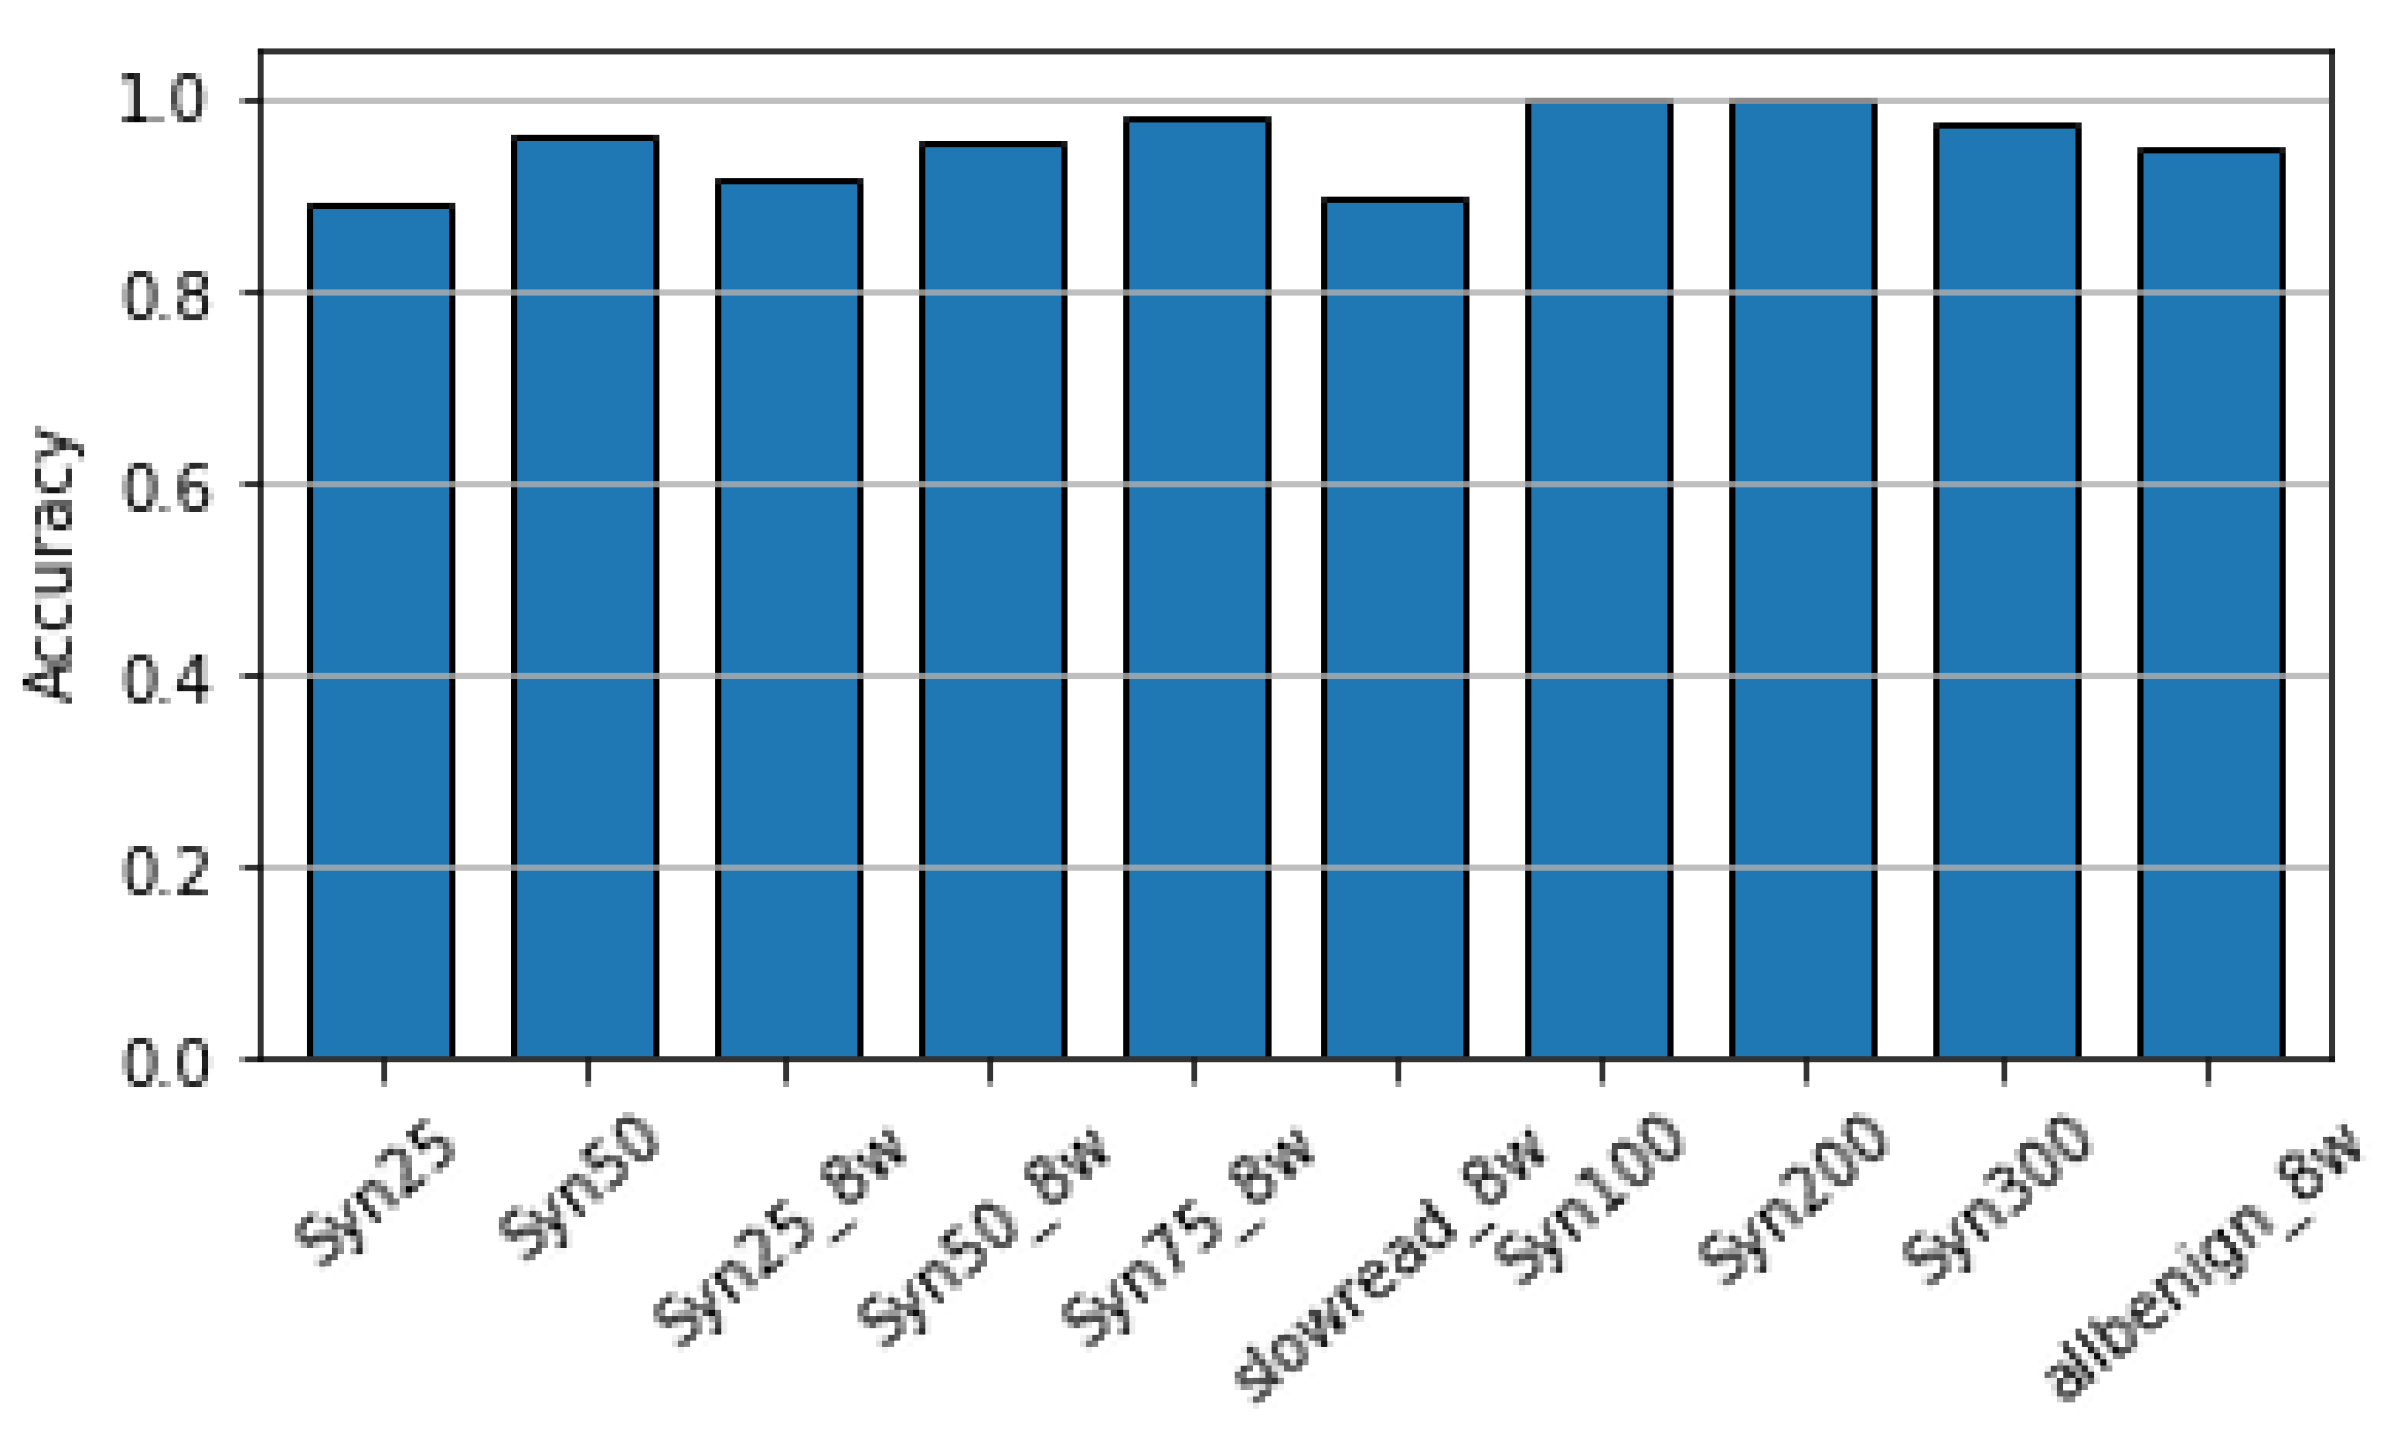
Figure 8 gives the accuracy of the LSTM-RF hybrid model for each traffic type present in the testing dataset.
Figure 9 shows the accuracy, F1-score, and ROC AUC score of the LSTM-RF hybrid model for window sizes 50, 100 and 150. The window size of 100 flows provides the best results for all three metrics.
5.3. Detection of Attacks in Data Slices
We used the PCA-SVM model described in
Section 3.4 to detect the presence of attacks in slices of network traffic. We partition the traffic dataset into 0.1-s samples. Each sample gives a number representing a flow value such as the number of new TCP flows or active TCP flows in that sample. A 10-s data slice, the duration used in [
41], is an array of flow values from 100 consecutive samples. Consecutive data slices form a two-dimensional matrix of flow values. Since Zhang et al. [
41] do not indicate what is considered as a TCP flow value, we tried the number of new flows, active flows, packets, or bytes per sample as the flow values. Our analysis shows that the number of bytes and the number of packets as TCP flow values give low detection accuracy and high false-negative rates. Therefore, we present the performance of the PCA-SVM model with the number of new TCP flows or active TCP flows as the flow values in
Table 4 for the all traffic and sparse traffic cases. Using the number of new flows as TCP flow values gives the best performance and matches the results by Zhang et al. for continuous TCP flows.
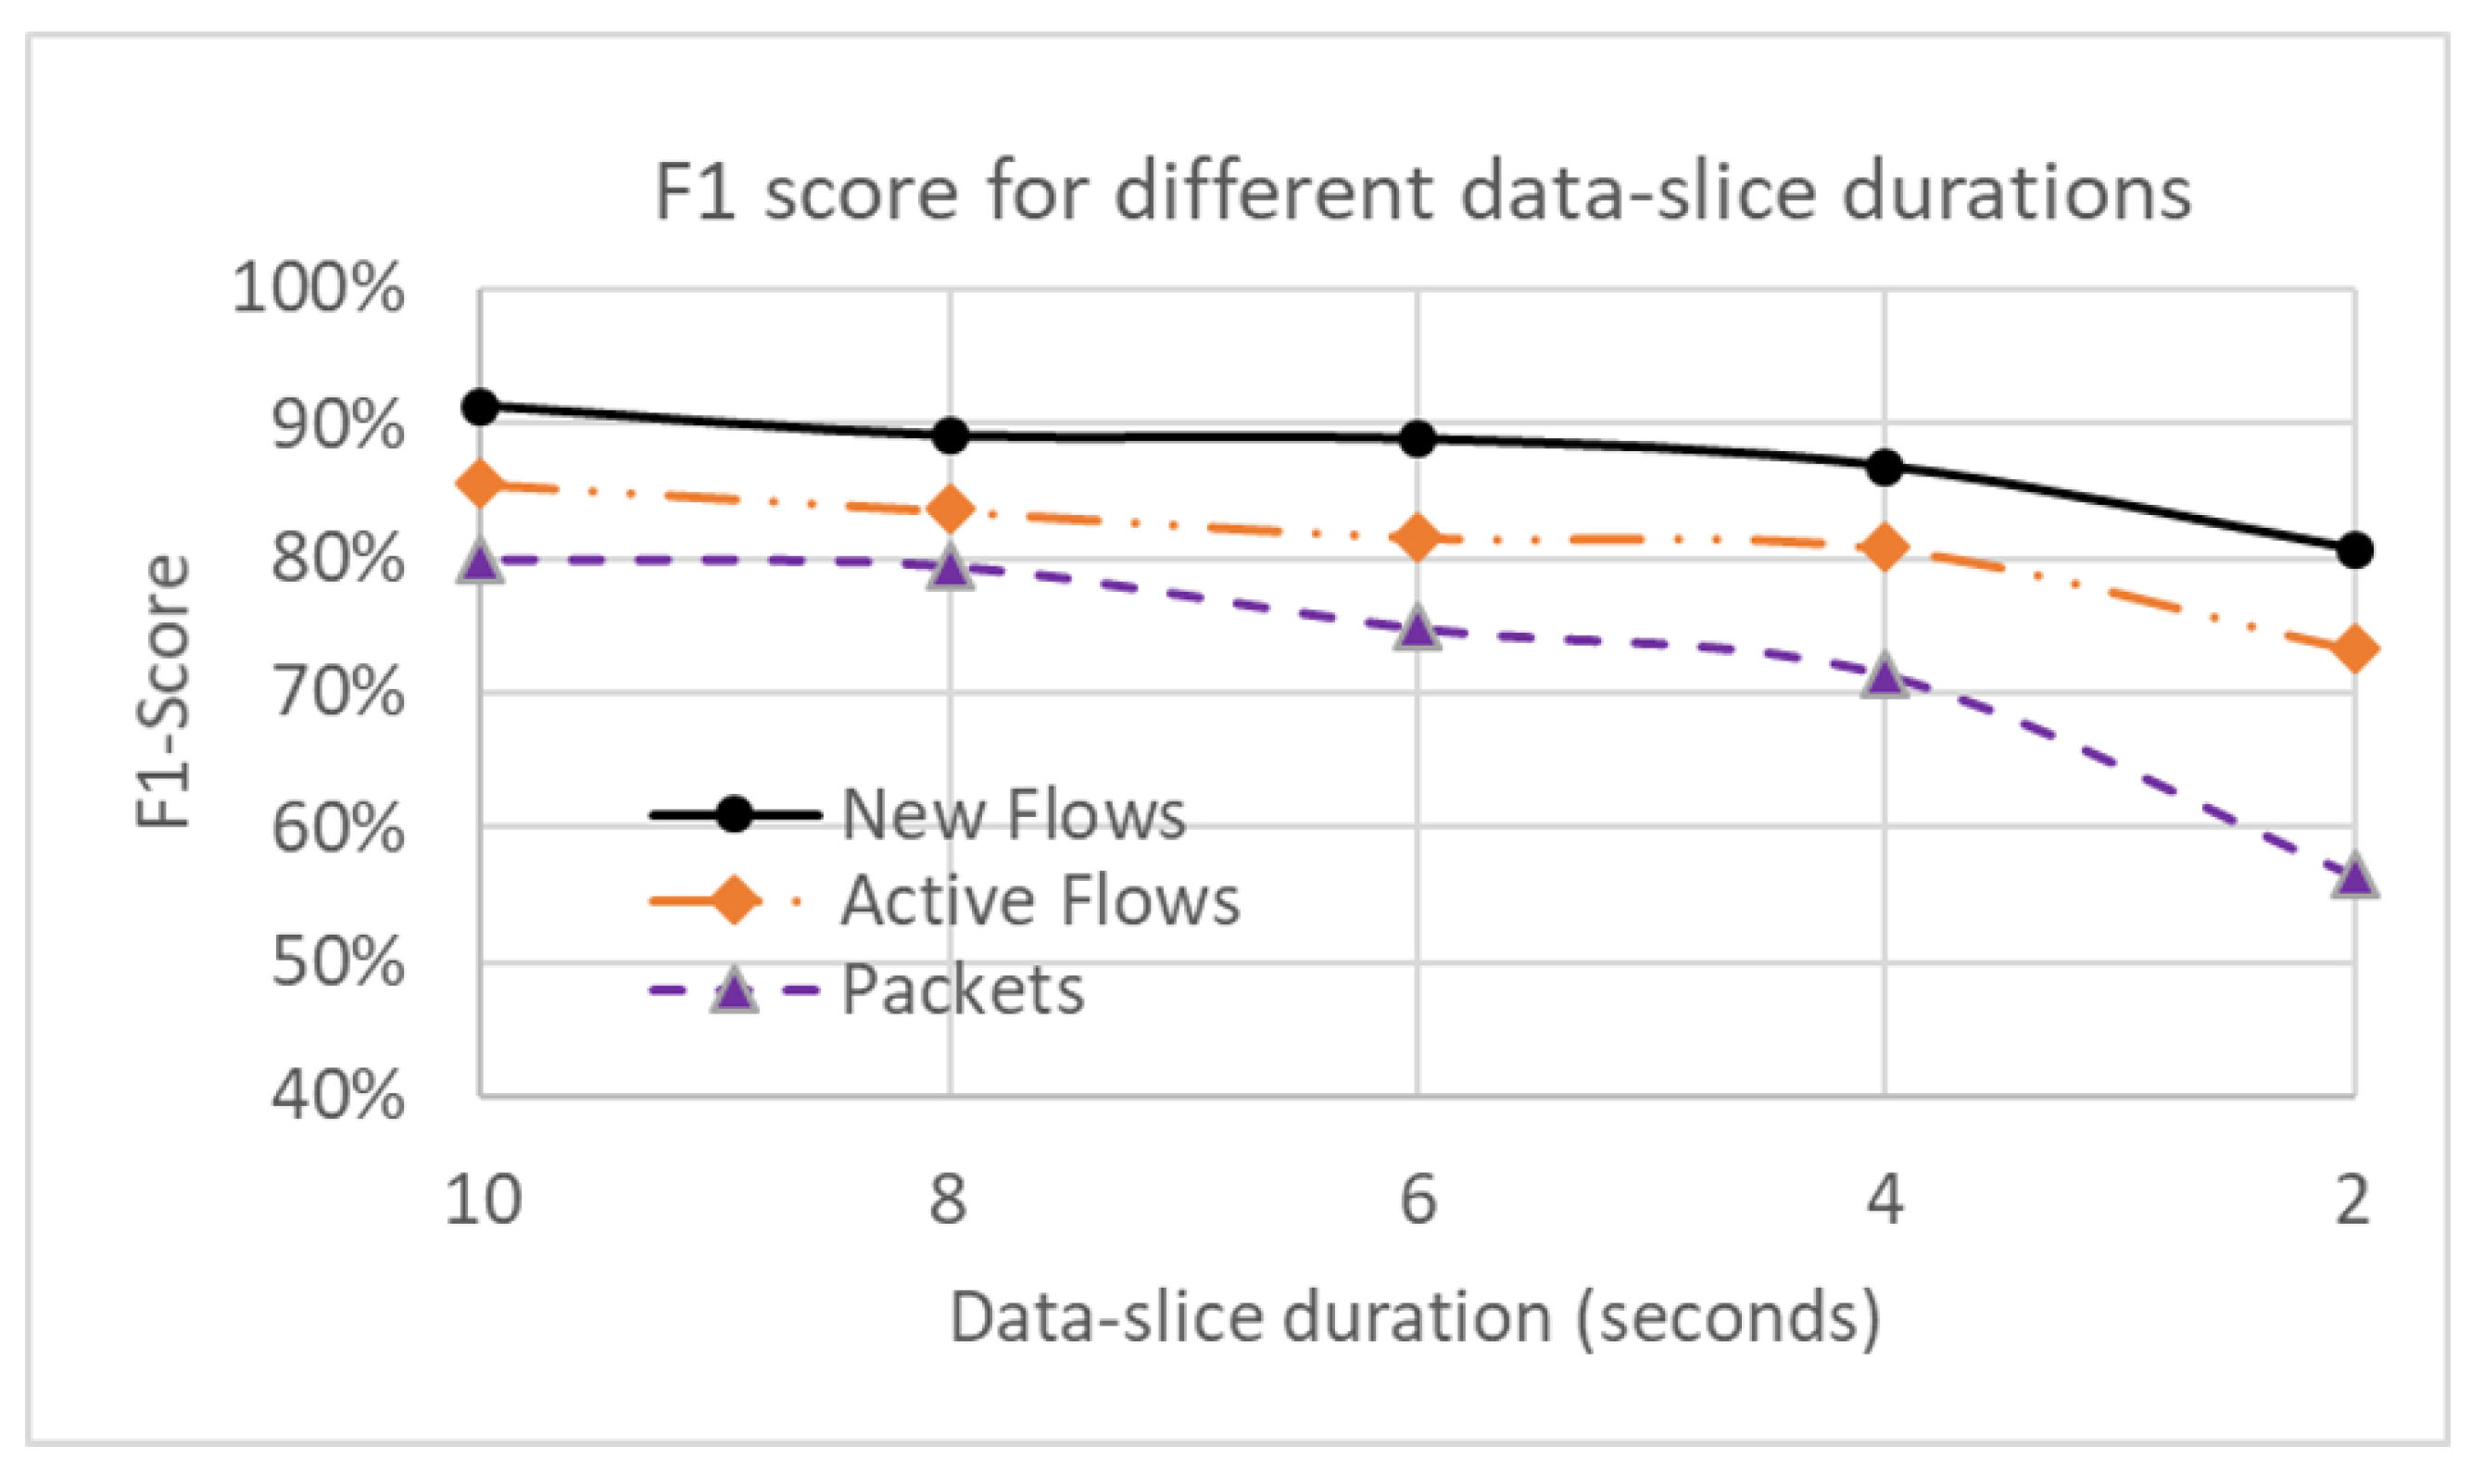
The data-slice duration determines the time required to form a data slice for detection; ten seconds could be too long to wait during a DDoS attack. Therefore, we analyzed the performance of the PCA-SVM model with 2, 4, 6, and 8 s as data-slice durations for the all traffic case. Our analysis shows that the performance decreases with shorter data-slice durations.
Figure 10 presents F1-scores for various data-slice durations with the number of new flows, active flows, and packets per sample as TCP flow values.
5.4. Practical Applications of Detection Models
The three detection models—flow, window, and data-slice—have different data processing and analysis overheads. The flow model has the highest data processing overheads since the data for its features are extracted from each flow by collecting multiple packets per flow, which is hard to accomplish in real-time. It has high detection accuracy, but the detection is delayed by the flow data collection duration, which is two seconds in our analyses.
The window and data-slice models detect attacks in groups of flows. These models have lower overhead than the flow model but require additional analysis to identify specific malicious flows so that appropriate countermeasures may be taken. Both types of models have low data processing overheads since they do not require keeping track of packets by flows. For the data-slice model, each new flow requires incrementing a counter. For the window model, each new flow requires the computation of the time elapsed since the previous new flow and recording the destination IP address to compute the Shannon entropy used in the second stage. The data-slice model is traffic rate-oblivious since the data used for detection is based on the data-slice duration and not on the traffic rate. The window model is traffic rate-adaptive since the time required to collect a window of flows depends on the combined benign and attack traffic rates. The PCA-SVM data-slice model has a low overhead but performs poorly for shorter data-slice durations. The LSTM-RF window model has low overhead and high detection accuracy.
Compared to the results in the literature, the models we presented have lower overhead, higher accuracy, or both for each detection granularity level.
Table 5 provides a comparison of our results for all traffic with the most relevant recent results.
We believe that it is practical to monitor seemingly normal traffic for the presence of low-rate malicious traffic using window or data-slice models and then switch over to flow models to identify the attack flows and block them. Our window-detection model acts like an ML/DL-based sampling method that flags the flows or packets that need to be examined in depth.
6. Conclusions
Distributed denial of service attacks are disruptive. They exhaust the network bandwidth and computing resources of a target and also camouflage other malware traffic. Compared to high-rate flooding attacks, low-rate DDoS attacks do not attract much attention since the average rate of attack flows from an attacker is about the same as that of a normal client. Instead, these attacks exploit protocol features such as the TCP congestion control to reduce the throughputs of normal flows. There have been several results in detecting LDDoS attacks. They tend to have high data processing overhead, low detection accuracy, or both, making them suitable for mostly offline analysis and detection. To cope up with high data processing overheads, traffic sampling is often used [
53]. However, sampling distorts the composition of the attack packets examined, which adversely impacts the detection accuracy.
In this paper, we have focused on DL/ML models to detect LDDoS attacks at various levels of granularity: individual flows, windows of flows, and slices of network traffic. In particular, we have presented a novel two-stage LSTM-RF model that requires only two features and detects the presence of one or more attack flows in a window of flows with high accuracy. The processing overhead is low since the data for the features is easily gathered using only the first packets of the flows.
We have also presented an LSTM Autoencoder model to detect individual attack flows with high accuracy. This model has a higher overhead than the two-stage model: it requires data from the packets in the first two seconds of each flow. Compared to the ML/DL models presented in the literature, however, the number of features used and the processing overheads are significantly lower. Finally, we have presented a detailed analysis of an SVM model with feature reduction using PCA [
41] to detect attacks in slices of network traffic. This model also has a very low data processing overhead, but its accuracy suffers if the data slices are not large.
Compared to the detection techniques presented in the literature, our results provide a choice of models based on the granularity of detection and overhead. If on-the-fly detection of attacks without resorting to sampling is needed, the window detection model is useful owing to its low overhead and high accuracy. Flows in the windows that are flagged by the window model may then be analyzed to detect individual attack flows followed by suitable mitigative actions. In such a setup, our window-detection model acts like an ML/DL-based sampling method that flags flows or packets that need to be examined in depth.
Our results are applicable to TCP-based attacks and traffic. We have not investigated the impact of UDP-based DDoS attacks on normal TCP and UDP traffic. We intend to investigate this in our future work.
Author Contributions
V.V.’s contributions include dataset generation, data preprocessing, development of the ML models, and writing the paper. P.L.’s contributions include the development of ML models, data preprocessing, and writing the paper. R.V.B.’s contributions include dataset generation, data preprocessing, verifying the models and the results, writing the paper, and the management of the research. L.A.T.’s contributions include verifying the models and the results and writing the paper. All authors have read and agreed to the published version of the manuscript.
Funding
This research was partially supported by a grant from the University of Texas at San Antonio, USA, and Tecnologico de Monterrey, Mexico. The low-rate DDoS attack dataset generation was partially supported by a grant from the US National Security Agency under contract H98230-18-1-0335.
Data Availability Statement
Acknowledgments
The opinions expressed and any errors contained in the paper are those of the authors. This paper is not meant to represent the position or opinions of the authors’ institutions or the funding agencies.
Conflicts of Interest
The authors declare no conflict of interest.
References
- Garrido, G. Non-Flood/non-Volumetric Distributed Denial of Service (DDoS); Available online: https://research.nccgroup.com/wp-content/uploads/2020/07/non-volumetric-distributed-denial-of-service-ddos.pdf (accessed on 1 July 2017).
- Kurose, J.F.; Ross, K.W. Computer Networking. A Top-Down Approach, 8th ed.; Pearson: New York, NY, USA, 2021. [Google Scholar]
- Gamblin, J. Mirai Source-Code. 2017. Available online: https://github.com/jgamblin/Mirai-Source-Code (accessed on 5 March 2021).
- slowHTTPtest. Available online: https://github.com/shekyan/slowhttptest (accessed on 4 April 2021).
- Booter. Available online: https://www.stressthem.to/ (accessed on 8 March 2021).
- IPStresser. Available online: https://ripstresser.net/ (accessed on 15 March 2021).
- Cisco, U. Cisco Annual Internet Report (2018–2023) White Paper; Cisco: San Jose, CA, USA, 2020. [Google Scholar]
- Doshi, R.; Apthorpe, N.; Feamster, N. Machine learning ddos detection for consumer internet of things devices. In Proceedings of the 2018 IEEE Security and Privacy Workshops (SPW), San Francisco, CA, USA, 24 May 2018; pp. 29–35. [Google Scholar]
- Braga, R.; Mota, E.; Passito, A. Lightweight DDoS flooding attack detection using NOX/OpenFlow. In Proceedings of the IEEE Local Computer Network Conference, Denver, CO, USA, 10–14 October 2010; pp. 408–415. [Google Scholar]
- He, Z.; Zhang, T.; Lee, R.B. Machine learning based DDoS attack detection from source side in cloud. In Proceedings of the 2017 IEEE 4th International Conference on Cyber Security and Cloud Computing (CSCloud), New York, NY, USA, 26–28 June 2017; pp. 114–120. [Google Scholar]
- Cimpanu, C. AWS Said It Mitigated a 2.3 Tbps DDoS Attack, the Largest Ever; ZDNet: San Francisco, CA, USA, 2020. [Google Scholar]
- Kuzmanovic, A.; Knightly, E.W. Low-rate TCP-targeted denial of service attacks: The shrew vs. the mice and elephants. In Proceedings of the 2003 Conference on Applications, Technologies, Architectures, and Protocols for Computer Communications, Karlsruhe Germany, 25–29 August 2003; pp. 75–86. [Google Scholar]
- Luo, X.; Chang, R.K. On a new class of pulsing denial-of-service attacks and the defense. In Proceedings of the Network and Distributed System Security Symposium, San Diego, CA, USA, 3 February 2005. [Google Scholar]
- Guirguis, M.; Bestavros, A.; Matta, I. Exploiting the transients of adaptation for RoQ attacks on Internet resources. In Proceedings of the 12th IEEE International Conference on Network Protocols, ICNP 2004, Berlin, Germany, 8 October 2004; pp. 184–195. [Google Scholar]
- Maciá-Fernández, G.; Díaz-Verdejo, J.E.; García-Teodoro, P. Evaluation of a low-rate DoS attack against iterative servers. Comput. Netw. 2007, 51, 1013–1030. [Google Scholar] [CrossRef]
- Chen, Y.; Hwang, K. Collaborative detection and filtering of shrew DDoS attacks using spectral analysis. J. Parallel Distrib. Comput. 2006, 66, 1137–1151. [Google Scholar] [CrossRef]
- He, Y.X.; Cao, Q.; Liu, T.; Han, Y.; Xiong, Q. A low-rate DoS detection method based on feature extraction using wavelet transform. J. Softw. 2009, 20, 930–941. [Google Scholar]
- Zhijun, W.; Wenjing, L.; Liang, L.; Meng, Y. Low-rate DoS attacks, detection, defense, and challenges: A survey. IEEE Access 2020, 8, 43920–43943. [Google Scholar] [CrossRef]
- Zhang, J.; Qin, Z.; Ou, L.; Jiang, P.; Liu, J.; Liu, A.X. An advanced entropy-based DDOS detection scheme. In Proceedings of the 2010 IEEE International Conference on Information, Networking and Automation (ICINA), Kunming, China, 18–19 October 2010; Volume 2, pp. V2–V67. [Google Scholar]
- Xiang, Y.; Li, K.; Zhou, W. Low-rate DDoS attacks detection and traceback by using new information metrics. IEEE Trans. Inf. Forensics Secur. 2011, 6, 426–437. [Google Scholar] [CrossRef]
- Sahoo, K.S.; Puthal, D.; Tiwary, M.; Rodrigues, J.J.; Sahoo, B.; Dash, R. An early detection of low rate DDoS attack to SDN based data center networks using information distance metrics. Future Gener. Comput. Syst. 2018, 89, 685–697. [Google Scholar] [CrossRef]
- Liu, Z.; Manousis, A.; Vorsanger, G.; Sekar, V.; Braverman, V. One Sketch to Rule Them All: Rethinking Network Flow Monitoring with UnivMon. In Proceedings of the 2016 ACM SIGCOMM Conference, SIGCOMM ’16, Florianopolis, Brazil, 22–26 August 2016; Association for Computing Machinery: New York, NY, USA, 2016; pp. 101–114. [Google Scholar]
- Sekar, V.; Reiter, M.K.; Zhang, H. Revisiting the Case for a Minimalist Approach for Network Flow Monitoring. In Proceedings of the 10th ACM SIGCOMM Conference on Internet Measurement, IMC ’10, Melbourne, Australia, 1–3 November 2010; pp. 328–341. [Google Scholar]
- Systems and Networks Lab. UTSA 2021 Low rate DoS Attack. 2021. Department of Computer Science, The University of Texas at San Antonio. Available online: https://github.com/utsanetsys/UTSA-2021-Low-rate-DoS-Attack (accessed on 8 August 2021).
- Yuan, X.; Li, C.; Li, X. DeepDefense: Identifying DDoS attack via deep learning. In Proceedings of the 2017 IEEE International Conference on Smart Computing (SMARTCOMP), Hong Kong, China, 29–31 May 2017; pp. 1–8. [Google Scholar]
- Li, C.; Wu, Y.; Yuan, X.; Sun, Z.; Wang, W.; Li, X.; Gong, L. Detection and defense of DDoS attack–based on deep learning in OpenFlow-based SDN. Int. J. Commun. Syst. 2018, 31, e3497. [Google Scholar] [CrossRef]
- ISCX-2012. Available online: https://www.unb.ca/cic/datasets/ids.html (accessed on 11 July 2021).
- Osanaiye, O.; Cai, H.; Choo, K.K.R.; Dehghantanha, A.; Xu, Z.; Dlodlo, M. Ensemble-based multi-filter feature selection method for DDoS detection in cloud computing. EURASIP J. Wirel. Commun. Netw. 2016, 2016, 1–10. [Google Scholar] [CrossRef] [Green Version]
- Zekri, M.; El Kafhali, S.; Aboutabit, N.; Saadi, Y. DDoS attack detection using machine learning techniques in cloud computing environments. In Proceedings of the 2017 IEEE 3rd International Conference of Cloud Computing Technologies and Applications (CloudTech), Rabat, Morocco, 24–26 October 2017; pp. 1–7. [Google Scholar]
- Niyaz, Q.; Sun, W.; Javaid, A.Y. A deep learning based DDoS detection system in software-defined networking (SDN). arXiv 2016, arXiv:1611.07400. [Google Scholar] [CrossRef] [Green Version]
- Idhammad, M.; Afdel, K.; Belouch, M. Semi-supervised machine learning approach for DDoS detection. Appl. Intell. 2018, 48, 3193–3208. [Google Scholar] [CrossRef]
- Suresh, M.; Anitha, R. Evaluating machine learning algorithms for detecting DDoS attacks. In Proceedings of the International Conference on Network Security and Applications, Chennai, India, 15–17 July 2011; pp. 441–452. [Google Scholar]
- Kokila, R.; Selvi, S.T.; Govindarajan, K. DDoS detection and analysis in SDN-based environment using support vector machine classifier. In Proceedings of the 2014 IEEE Sixth International Conference on Advanced Computing (ICoAC), Chennai, India, 17–19 December 2014; pp. 205–210. [Google Scholar]
- Agrawal, N.; Tapaswi, S. Low rate cloud DDoS attack defense method based on power spectral density analysis. Inf. Process. Lett. 2018, 138, 44–50. [Google Scholar] [CrossRef]
- Brynielsson, J.; Sharma, R. Detectability of low-rate HTTP server DoS attacks using spectral analysis. In Proceedings of the 2015 IEEE/ACM International Conference on Advances in Social Networks Analysis and Mining (ASONAM), Paris, France, 25–28 August 2015; pp. 954–961. [Google Scholar]
- Wu, X.; Tang, D.; Tang, L.; Man, J.; Zhan, S.; Liu, Q. A low-rate dos attack detection method based on hilbert spectrum and correlation. In Proceedings of the 2018 IEEE SmartWorld, Ubiquitous Intelligence & Computing, Advanced & Trusted Computing, Scalable Computing & Communications, Cloud & Big Data Computing, Internet of People and Smart City Innovation (SmartWorld/SCALCOM/UIC/ATC/CBDCom/IOP/SCI), Guangzhou, China, 8–12 October 2018; pp. 1358–1363. [Google Scholar]
- Wu, Z.; Zhang, L.; Yue, M. Low-rate DoS attacks detection based on network multifractal. IEEE Trans. Dependable Secur. Comput. 2015, 13, 559–567. [Google Scholar] [CrossRef]
- Liu, D.; Shuai, D. Multifractal characteristic quantities of network traffic models. In Proceedings of the International Conference on Grid and Cooperative Computing, Shanghai, China, 7–10 December 2003; pp. 413–417. [Google Scholar]
- Zhang, C.; Cai, Z.; Chen, W.; Luo, X.; Yin, J. Flow level detection and filtering of low-rate DDoS. Comput. Netw. 2012, 56, 3417–3431. [Google Scholar] [CrossRef] [Green Version]
- Yan, Y.; Tang, D.; Zhan, S.; Dai, R.; Chen, J.; Zhu, N. Low-rate dos attack detection based on improved logistic regression. In Proceedings of the 2019 IEEE 21st International Conference on High Performance Computing and Communications; IEEE 17th International Conference on Smart City; IEEE 5th International Conference on Data Science and Systems (HPCC/SmartCity/DSS), Zhangjiajie, China, 10–12 August 2019; pp. 468–476. [Google Scholar]
- Zhang, D.; Tang, D.; Tang, L.; Dai, R.; Chen, J.; Zhu, N. Pca-svm-based approach of detecting low-rate dos attack. In Proceedings of the 2019 IEEE 21st International Conference on High Performance Computing and Communications; IEEE 17th International Conference on Smart City; IEEE 5th International Conference on Data Science and Systems (HPCC/SmartCity/DSS), Zhangjiajie, China, 10–12 August 2019; pp. 1163–1170. [Google Scholar]
- Liu, L.; Wang, H.; Wu, Z.; Yue, M. The detection method of low-rate DoS attack based on multi-feature fusion. Digit. Commun. Netw. 2020, 6, 504–513. [Google Scholar] [CrossRef]
- Zhijun, W.; Qing, X.; Jingjie, W.; Meng, Y.; Liang, L. Low-rate DDoS attack detection based on factorization machine in software defined network. IEEE Access 2020, 8, 17404–17418. [Google Scholar] [CrossRef]
- Pascoal, T.A.; Dantas, Y.G.; Fonseca, I.E.; Nigam, V. Slow TCAM exhaustion DDoS attack. In Proceedings of the IFIP International Conference on ICT Systems Security and Privacy Protection, Rome, Italy, 29–31 May 2017; pp. 17–31. [Google Scholar]
- Pérez-Díaz, J.A.; Valdovinos, I.A.; Choo, K.K.R.; Zhu, D. A flexible SDN-based architecture for identifying and mitigating low-rate DDoS attacks using machine learning. IEEE Access 2020, 8, 155859–155872. [Google Scholar] [CrossRef]
- ISCX-2016. Available online: http://205.174.165.80/CICDataset/ISCX-SlowDoS-2016/Dataset/ (accessed on 9 April 2021).
- Raschka, S.; Mirjalili, V. Python Machine Learning: Machine Learning and Deep Learning with Python. In Scikit-Learn, and TensorFlow, 2nd ed.; Packt: Birmingham, UK, 2017. [Google Scholar]
- Sutskever, I.; Vinyals, O.; Le, Q.V. Sequence to Sequence Learning with Neural Networks. In Proceedings of the 27th International Conference on Neural Information Processing Systems, NIPS’14, Montreal, QC, Canada, 8–13 December 2014; MIT Press: Cambridge, MA, USA, 2014; Volume 2, pp. 3104–3112. [Google Scholar]
- Osanaiye, O.; Choo, K.K.R.; Dlodlo, M. Change-point cloud DDoS detection using packet inter-arrival time. In Proceedings of the 8th Computer Science and Electronic Engineering (CEEC), Colchester, UK, 28–30 September 2016; pp. 204–209. [Google Scholar]
- Sharafaldin, I.; Lashkari, A.H.; Hakak, S.; Ghorbani, A.A. Developing Realistic Distributed Denial of Service (DDoS) Attack Dataset and Taxonomy. In Proceedings of the International Carnahan Conference on Security Technology (ICCST), Chennai, India, 1–3 October 2019; pp. 1–8. [Google Scholar]
- CICDDoS-17. Available online: https://www.unb.ca/cic/datasets/ids-2017.html (accessed on 20 April 2021).
- CICDDoS-19. Available online: https://www.unb.ca/cic/datasets/ddos-2019.html (accessed on 27 April 2021).
- Jazi, H.H.; Gonzalez, H.; Stakhanova, N.; Ghorbani, A.A. Detecting HTTP-based application layer DoS attacks on web servers in the presence of sampling. Comput. Netw. 2017, 121, 25–36. [Google Scholar] [CrossRef]
- Nadeau, T.D.; Gray, K. SDN: Software Defined Networks: An Authoritative Review of Network Programmability Technologies; O’Reilly Media Inc.: Sebastopol, CA, USA, 2013. [Google Scholar]
- Hping3. Available online: https://linux.die.net/man/8/hping3 (accessed on 8 January 2021).
- Flowtbag. Available online: https://github.com/DanielArndt/flowtbag (accessed on 28 April 2021).
- CICFlowMeter. Available online: https://github.com/ahlashkari/CICFlowMeter (accessed on 8 June 2021).
- Data Splitting. Available online: https://www.youtube.com/watch?v=rjbkWSTjHzM (accessed on 1 August 2021).
Figure 1.
The impact of a pulse-shaped SYN flooding attack with an average rate of 2.5 rps (and peak rate of 50 rps) on benign traffic. The x-axis is marked by 10-s intervals, and the y-axis represents number of new benign and attack flows in each interval.
Figure 1.
The impact of a pulse-shaped SYN flooding attack with an average rate of 2.5 rps (and peak rate of 50 rps) on benign traffic. The x-axis is marked by 10-s intervals, and the y-axis represents number of new benign and attack flows in each interval.
Figure 2.
Attacks and models explored.
Figure 2.
Attacks and models explored.
Figure 3.
LSTM Autoencoder for DDoS flow detection.
Figure 3.
LSTM Autoencoder for DDoS flow detection.
Figure 4.
LSTM-RF hybrid model.
Figure 4.
LSTM-RF hybrid model.
Figure 5.
The features used to train the random forest model in Stage 2. The lower right graph shows the entropies of windows with all benign or with one or more attack flows. The other five are the reconstruction errors produced by the LSTM model in Stage 1. The LSTM model was trained prior to this with all benign traffic. The data are plotted on a log scale.
Figure 6.
PCA-SVM model [
41] adapted for HTTP traffic.
Figure 6.
PCA-SVM model [
41] adapted for HTTP traffic.
Figure 7.
Attack burst (l) = 0.1 s; attack period (T) = 1 s. The attack is ongoing during the odd 100 s intervals of the experiment.
Figure 7.
Attack burst (l) = 0.1 s; attack period (T) = 1 s. The attack is ongoing during the odd 100 s intervals of the experiment.
Figure 8.
LSTM-RF detection accuracy for different traffic types.
Figure 8.
LSTM-RF detection accuracy for different traffic types.
Figure 9.
LSTM-RF detection results for various window sizes.
Figure 9.
LSTM-RF detection results for various window sizes.
Figure 10.
F1-scores of PCA-SVM for different data-slice durations.
Figure 10.
F1-scores of PCA-SVM for different data-slice durations.
Table 1.
The attack traffic in the UTSA-2021 dataset. Syn25 through Syn300 denote traffic with benign flows and TCP SYN floods. Slowread denotes the traffic with benign flows and Slow Read attack flows. Benign denotes traffic with only benign flows. All benign traffic is generated using the web client and server codes we created. There are two types of benign traffic scenarios. In the one-client scenario, a web client downloads a file from a web server back to back. In the eight-client scenario, eight web clients download files from two web servers back to back, but at a slower rate owing to contention.
| Dataset | Peak | Attack | Benign | Total | Total | Duration |
|---|
| | Attack Rate | (rps) | (rps) | Benign Flows | Attack Flows | (min) |
|---|
| With 1 benign client |
| Syn25 | 25 | 2.5 | 26.41 | 7925 | 819 | 5 |
| Syn50 | 50 | 5 | 27.09 | 8127 | 1461 |
| Syn100 | 100 | 10 | 27.06 | 8119 | 2749 |
| Syn200 | 200 | 20 | 22.98 | 6896 | 5270 |
| Syn300 | 300 | 30 | 22.83 | 6850 | 7913 |
| With 8 benign clients |
| Benign | 0 | 0 | 4 | 40,755 | 0 | 150 |
| Syn25 | 25 | 1.25 | 8.01 | 21,640 | 6930 | 90 |
| Syn50 | 50 | 2.5 | 6.79 | 18,351 | 12,520 |
| Syn75 | 75 | 3.75 | 6.12 | 16,529 | 17,448 |
| Slowread | 1.29 | 1.29 | 8.07 | 21,801 | 3484 |
Table 2.
LSTM Autoencoder flow detection results.
Table 2.
LSTM Autoencoder flow detection results.
| Metric | All Traffic | Sparse Traffic |
|---|
| Accuracy (%) | 99.24 | 99.37 |
| Precision (%) | 97.98 | 98.07 |
| Recall (%) | 100 | 100 |
| F1-Score (%) | 98.98 | 99.02 |
| False Positive Rate (%) | 1.18 | 0.9 |
| False Negative Rate (%) | 0 | 0 |
| ROC AUC | 0.997 | 0.996 |
Table 3.
LSTM-RF window detection results.
Table 3.
LSTM-RF window detection results.
| Metric | All Traffic | Sparse Traffic |
|---|
| Accuracy (%) | 94 | 93.5 |
| Precision (%) | 90.8 | 86.1 |
| Recall (%) | 96.1 | 94.3 |
| F1-Score (%) | 93.3 | 90 |
| False Positive Rate (%) | 7.7 | 6.8 |
| False Negative Rate (%) | 3.9 | 5.7 |
| ROC AUC | 0.98 | 0.98 |
Table 4.
PCA-SVM detection results for 10-s data slices with new and active flows as TCP flow values.
Table 4.
PCA-SVM detection results for 10-s data slices with new and active flows as TCP flow values.
| Metric | All Traffic | Sparse Traffic |
|---|
| New Flows | Active Flows | New Flows | Active Flows |
|---|
| Accuracy (%) | 97.20 | 95.52 | 97.80 | 96.72 |
| Precision (%) | 95.47 | 93.73 | 93.33 | 95.05 |
| Recall (%) | 87.53 | 78.67 | 90.15 | 79.92 |
| F1-Score (%) | 91.33 | 85.54 | 91.71 | 86.83 |
| False Positive Rate (%) | 0.84 | 1.07 | 1.01 | 0.65 |
| False Negative Rate (%) | 12.47 | 21.33 | 9.85 | 20.08 |
| ROC AUC | 0.933 | 0.888 | 0.946 | 0.896 |
Table 5.
Comparison of DL/ML-based LDDoS detection techniques. MLP: multilayer perceptron, FM: factorization machine, ILR: improved logistic regression, and MFF: multi-feature fusion. ‘-’: data not available.
Table 5.
Comparison of DL/ML-based LDDoS detection techniques. MLP: multilayer perceptron, FM: factorization machine, ILR: improved logistic regression, and MFF: multi-feature fusion. ‘-’: data not available.
| Model | Granularity | Data | Results | Remarks |
|---|
| ROC AUC | F1-Score | Accuracy | Recall |
|---|
| LSTM-RF | window | 1st packets of flows | 0.98 | 0.93 | 0.94 | 0.96 | Results from this paper.
UTSA-2021 dataset [24] |
| LSTM | flow | first 2 s of flow | 0.99 | 0.99 | 0.99 | 1.0 |
| PCA-SVM | data-slice | 10 s | 0.93 | 0.91 | 0.97 | 0.87 |
| PCA-SVM | data-slice | 2 s | 0.86 | 0.81 | 0.94 | 0.73 |
| PCA-SVM [41] | data-slice | 10 s | - | - | 0.95 | 0.98 | Continuous TCP flows |
| MLP [45] | flow | entire flow | - | 0.95 | 0.95 | 0.94 | Custom slow-read
traffic for testing |
| RF [45] | flow | entire flow | - | 0.80 | 0.94 | 0.82 |
| FM [43] | flow | entire flow | 0.89 | 0.92 | 0.92 | 0.91 | Data for the lowest attack rate: 1.6 Mbps |
| ILR [40] | flow | entire flow | - | 0.98 | 0.99 | 0.98 | Testbed results |
| MFF [42] | packet | arrival time of packet | - | - | - | 0.99 | Custom dataset of continuous TCP flows |
| Publisher’s Note: MDPI stays neutral with regard to jurisdictional claims in published maps and institutional affiliations. |
© 2021 by the authors. Licensee MDPI, Basel, Switzerland. This article is an open access article distributed under the terms and conditions of the Creative Commons Attribution (CC BY) license (https://creativecommons.org/licenses/by/4.0/).


