1. Introduction
COVID-19, caused by the severe acute respiratory syndrome coronavirus 2 (SARS-CoV-2 virus), has emerged as a highly infectious pandemic disease, rapidly spreading and severely compromising world health systems. It causes severe acute respiratory syndrome and has resulted in significant disruption to the lives of the people and economies worldwide. At the time of writing this paper, more than 3.4 million people have died, and over 164 million people are infected with SARS-CoV-2 [
1]. The transmission rate is high compared to other recent diseases as most individuals infected with SARS-CoV-2 are asymptomatic but can still transmit the virus to others [
2,
3]. Therefore, it is crucial to identify SARS-CoV-2 infection at the earliest possible opportunity to reduce virus spread and mitigate the economic impact and burden to healthcare systems [
4]. Therefore, improving testing capacity and enabling rapid SARS-CoV-2 testing outside designated laboratories are of paramount importance.
Despite the revolutionary technological advances in healthcare and disease tracking, the existing SARS-CoV-2 clinical tests are expensive and inadequate for rapidly monitoring the community spread of COVID-19 infection. The current diagnostic solutions are mostly dominated by the quantitative reverse transcription-polymerase chain reaction (RT-qPCR) test, which is time-consuming and relies on expensive facilities as well as scientifically trained staff. Therefore, it is currently not feasible to undertake rapid individual testing in offices, airports, etc. This bottleneck may be associated with a rapidly rising number of cases remaining untested, adding pressure on the healthcare systems and national economies and delaying the plan to return to normality. Moreover, travelling to a testing centre to obtain an RT-qPCR test is not always practical.
Therefore, it is critical that inexpensive, rapid, and easy-to-use consumer device are developed that can be used to detect SARS-CoV-2 in resource-limited laboratories, factories, schools, universities, airports, offices, and homes with excellent sensitivity and specificity. This study describes the development of a low-cost rapid molecular diagnostic device integrated with a smartphone application for the rapid detection of SARS-CoV-2 using the artificial intelligence (AI) assisted reverse transcription loop-mediated isothermal amplification (RT-LAMP) method.
2. Background
Understanding the molecular characteristics and epidemiological distribution of pathogens provides essential insights into their origins and genetic nature, which may help to develop more effective diagnostics and associated control strategies. Early diagnosis will aid in the prevention and control of disease outbreaks in humans and animals.
The use of rapid molecular diagnostics has been significant in the improvement of human, plant, and animal health. It has great potential for improving, health, welfare, and economics if implemented efficiently and rapidly and integrated into a surveillance system. The World Health Organization (WHO) has deemed nucleic acid amplification tests (NAATs), including RT-qPCR and RT-LAMP, as gold standards for diagnosing SARS-CoV-2 [
5]. The diagnostic solutions are mostly dominated by expensive lab-based qPCR and real-time PCR devices. Standard molecular test methodologies use RT-qPCR, which has several drawbacks such as the need for expensive instruments, trained personnel, sophisticated facilities, and complex thermal cycling for the PCR reaction, and it is time-consuming [
2,
6]. These constraints make it challenging to miniaturise real-time PCR instruments and real-time disease monitoring to identify disease outbreaks at an earlier stage.
Isothermal loop-mediated isothermal amplification (LAMP) assays do not require complex thermocycling equipment, and the presence of the target can be identified by a simple colour change [
2,
7]. The LAMP assay is a unique nucleic acid amplification technique introduced by Notomi et al. [
8]. LAMP assays have been demonstrated to produce diagnostic results with increased sensitivity and specificity [
5]. It is a very rapid, sensitive, and efficient nucleic acid amplification technique that amplifies a few copies of nucleic acid into millions of copies. This approach is fast compared to PCR and other similar techniques [
2]. Additionally, the robustness of isothermal technologies to tolerate known PCR inhibitors allows for more straightforward sample preparation methodologies making these technologies ideal for field use [
9,
10]. LAMP results detection can be obtained based on pH changes due to nucleic acid accumulation: colourimetric detection or incorporation of fluorescent DNA binding dye: fluorometric detection. LAMP can be multiplexed for the simultaneous identification of several pathogens, and early information could be obtained about the presence and distribution of the targeted pathogens.
Several studies have been published describing RT-LAMP assays for the detection of COVID-19 and other infectious diseases [
2,
6,
9,
10,
11,
12,
13]. However, the heating required for the LAMP process is manually controlled, and results are interpreted manually. These factors limit the use of these assays in a laboratory setting. The device described here can be used as a portable device that non-scientific staff can use.
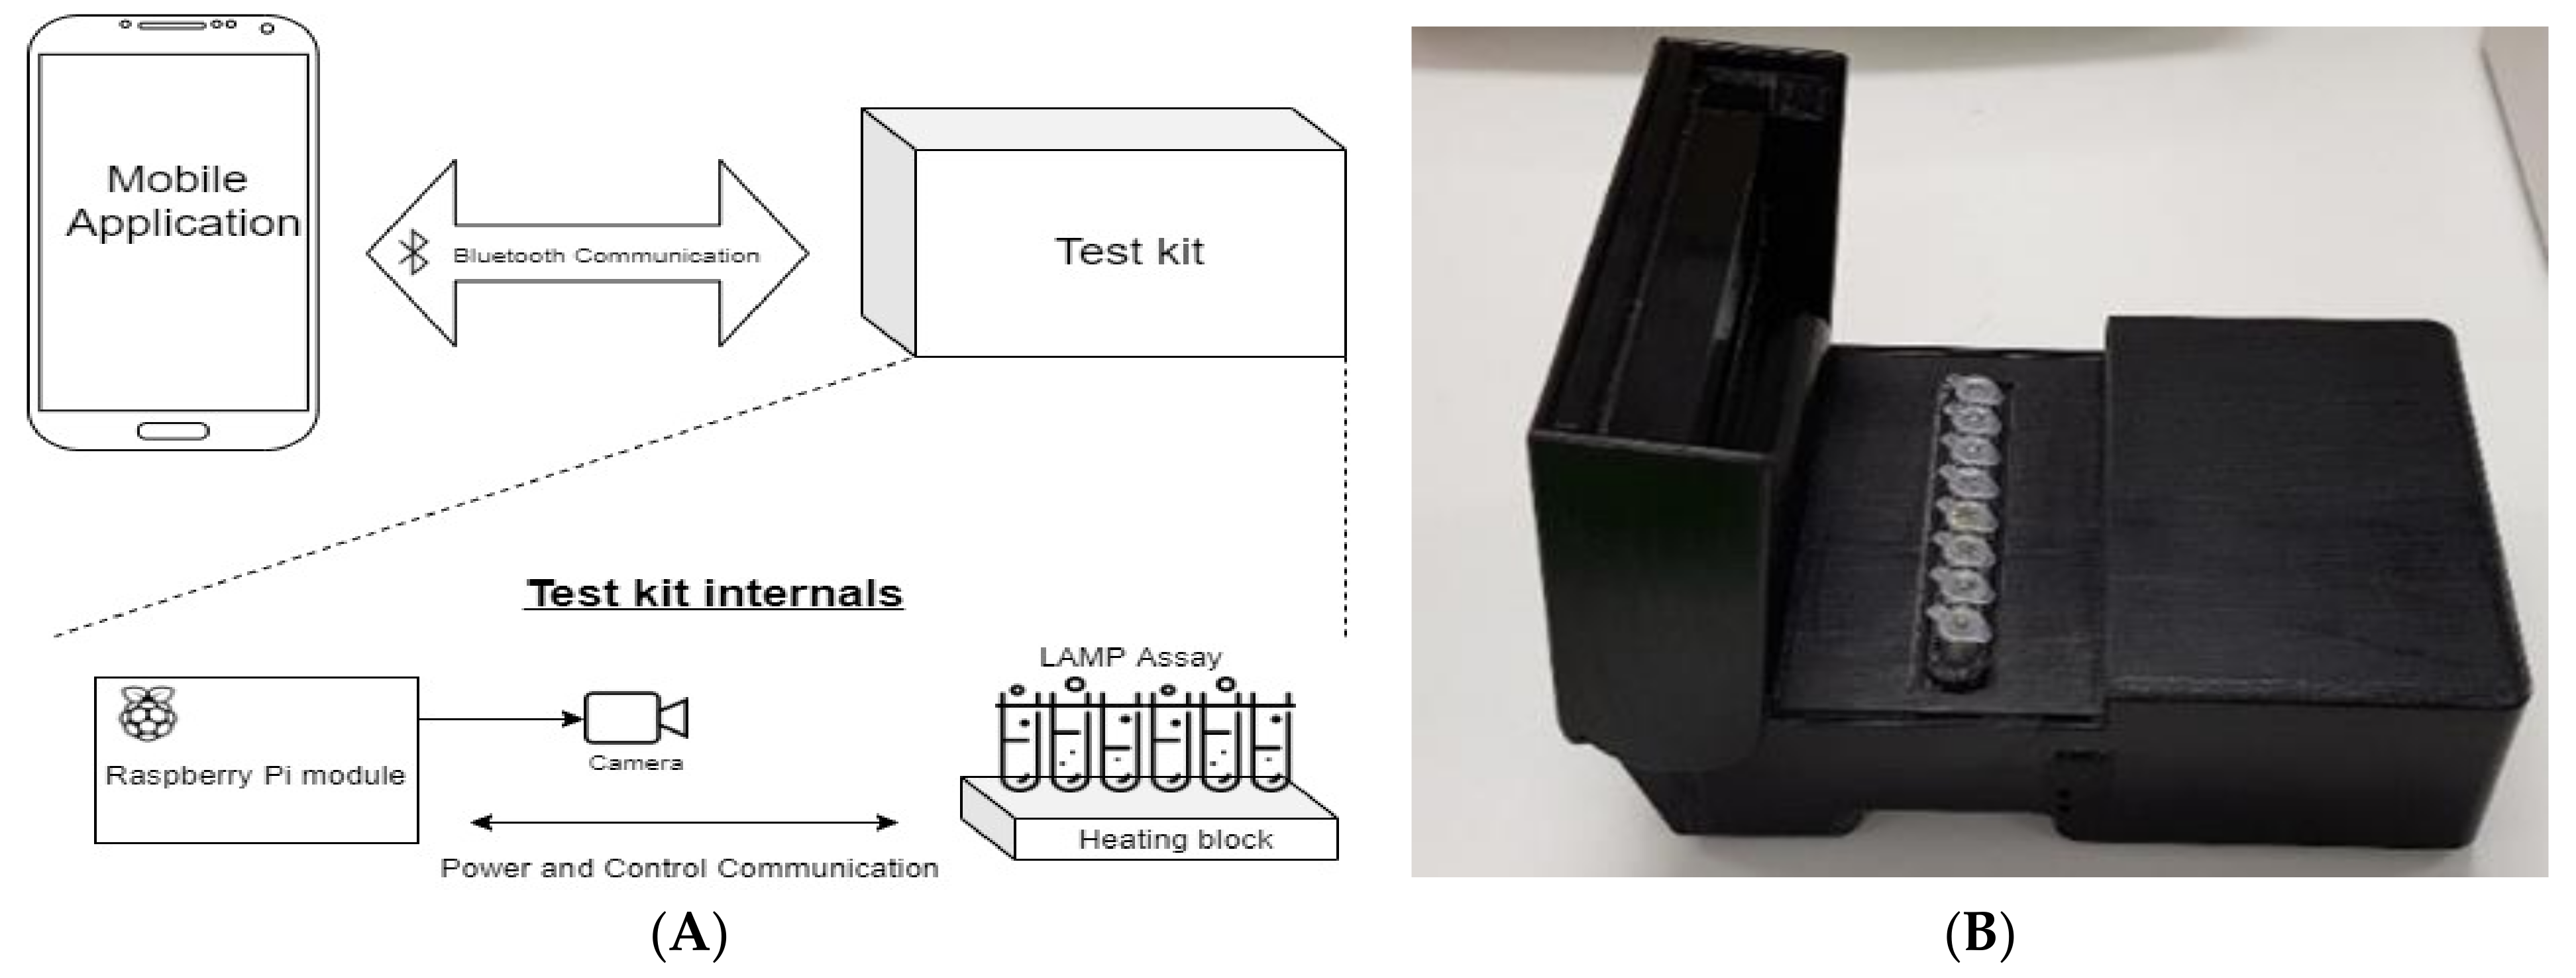
To enable field deployment, we have developed an ultralow-cost handheld molecular diagnostic device with integrated imaging and artificial intelligence-based image processing capability to expedite diagnosis, as shown in
Figure 1. This platform will automatically control the assay environment and display the results in a mobile app using an algorithm to automate the image acquisition and identify colourimetric changes in the LAMP assay.
3. Portable Molecular Diagnostic Device
A platform was built with a smartphone app, with Raspberry Pi (RPi) as a processing unit, and an RT-LAMP-based test unit which houses eight temperature-maintained portable isothermal nucleic acid amplification tubes illuminated by LEDs and an in-built camera, as shown in
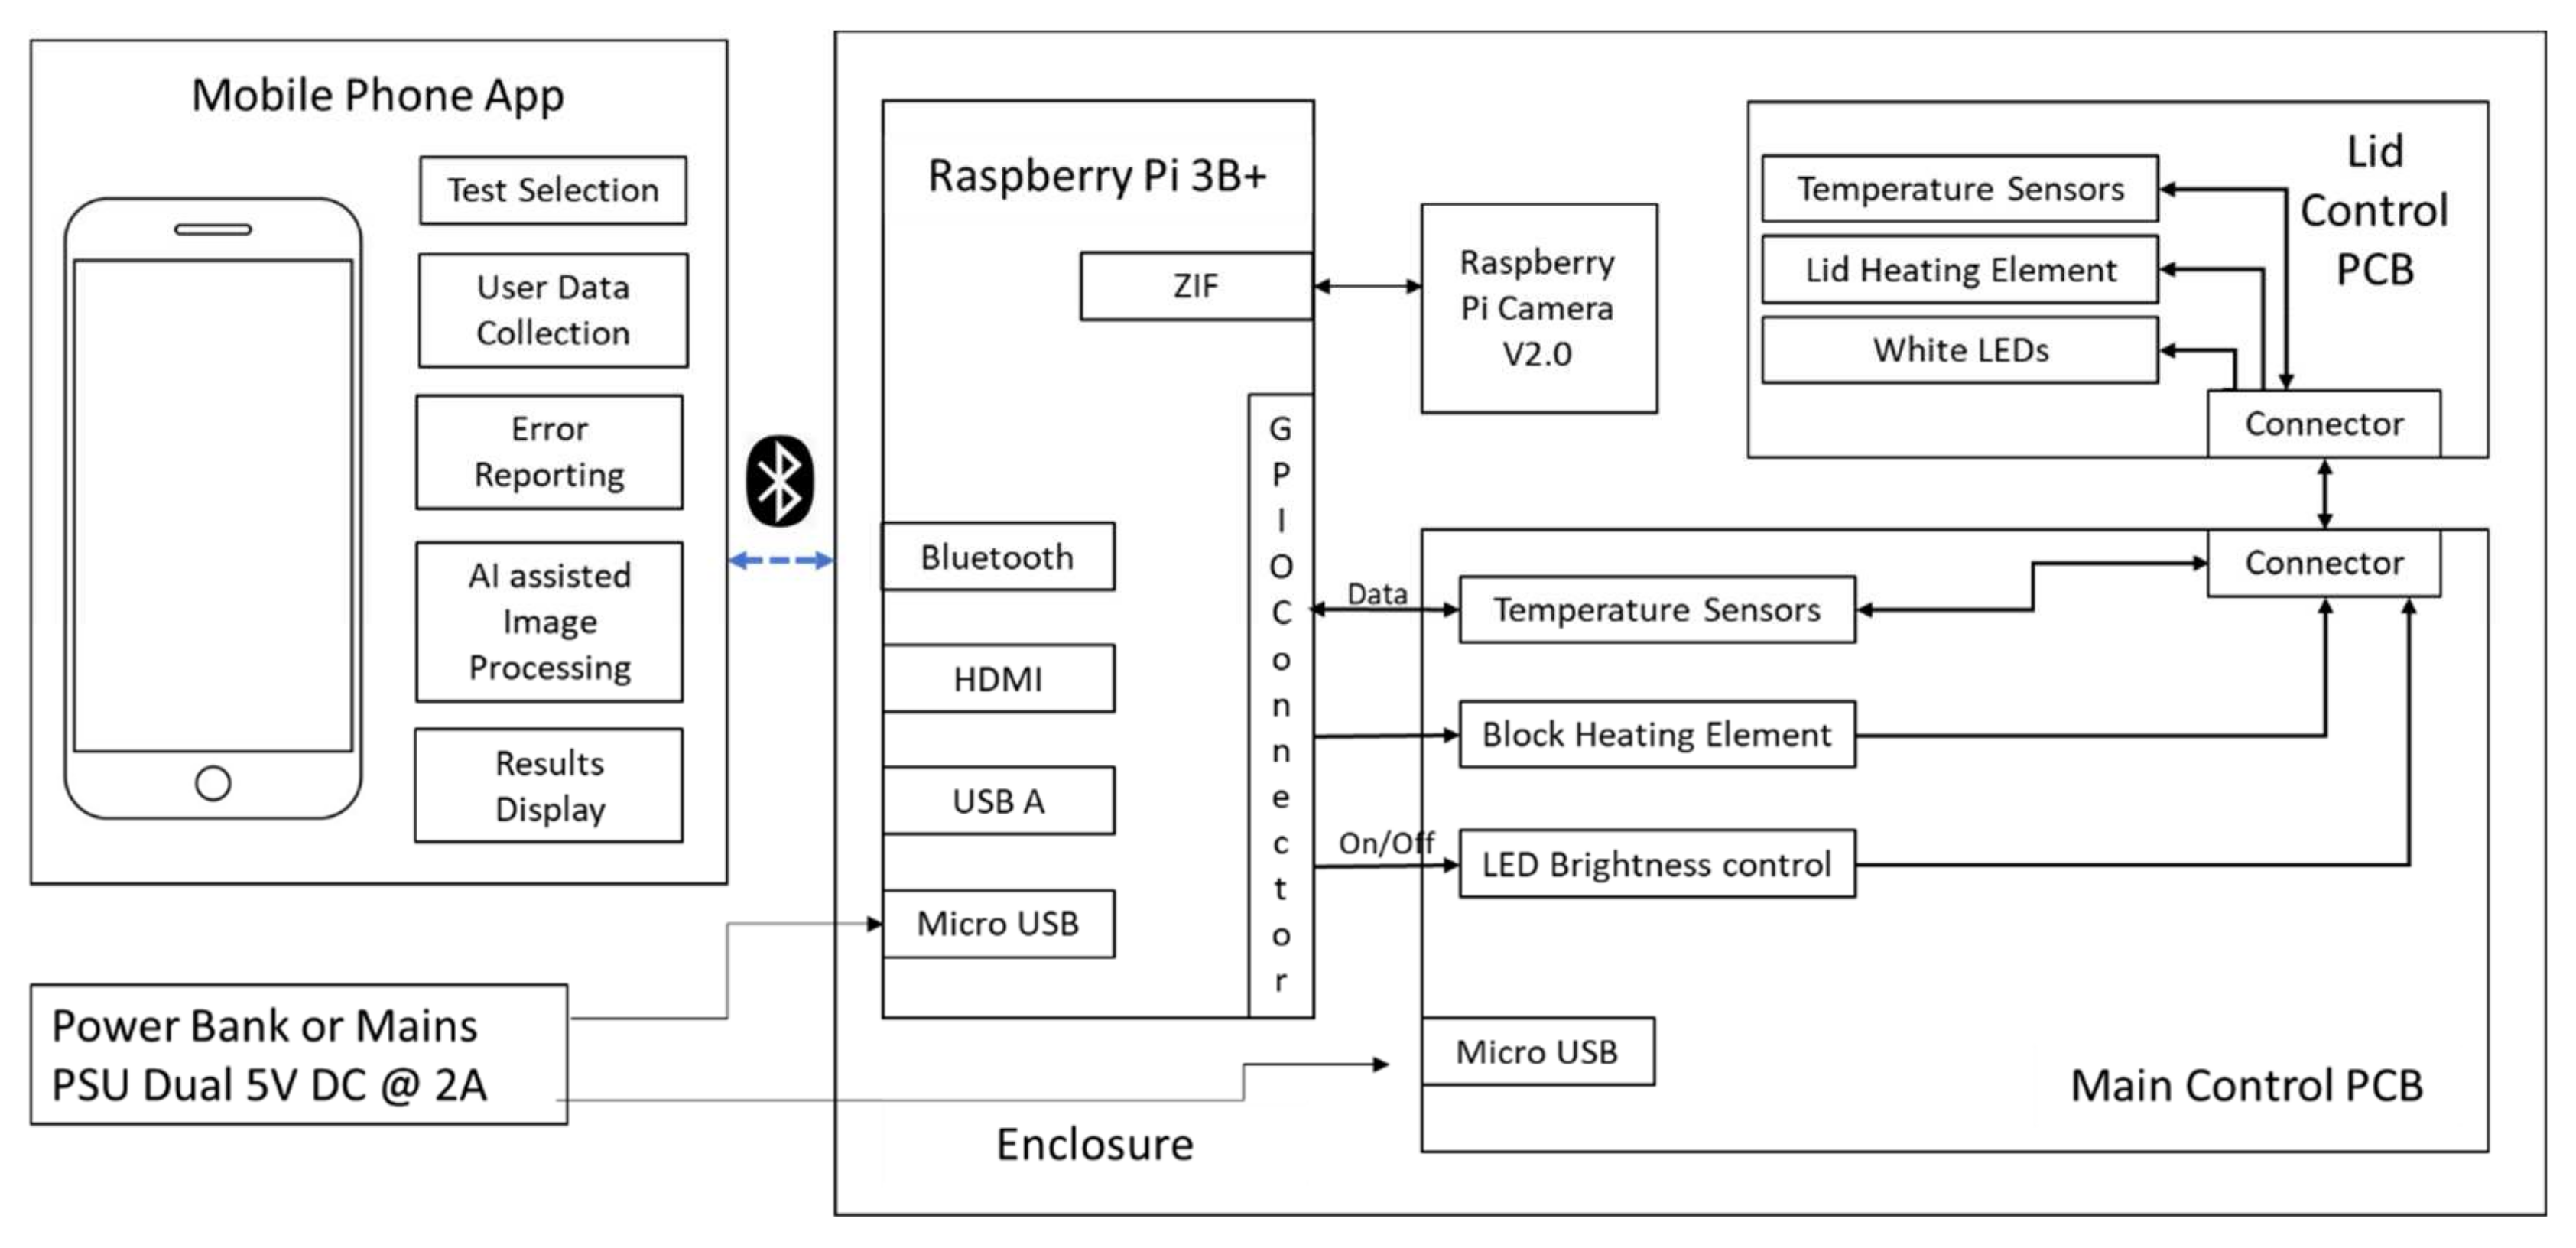
Figure 1. The RT-LAMP-based test kit has assays for testing, a heating block to provide the required heating for the RT-LAMP reactions, and sensors to check the temperatures and control the heating. Battery-powered Raspberry Pi is connected with a camera to analyse the results and to control the testing. All the above components were assembled into a 3D printed enclosure (14.3 × 10.8 × 6 cm) with the USB and TCP/IP ports having access to the RPi. This system was designed to take commands from smartphones regarding the test, execute the commands, and return the mobile app results. A detailed description of the device developed to detect SARS-CoV-2 can be found in
Figure 2.
3.1. RT-LAMP-Based Test Unit
In contrast to RT-qPCR, RT-LAMP reactions can occur at a fixed temperature (63 °C to 65 °C), simplifying instrumentation and reducing power consumption [
14]. In our platform, the temperature required to carry out the RT-LAMP reaction is maintained through an aluminium heating block with many off-the-shelf electronic components and custom flexible resistive heating elements. A detailed description of the device and the RT-LAMP assay developed to diagnose SARS-CoV-2 can be found elsewhere [
15].
As shown in
Figure 2, two custom resistive heating elements (5W, NEL, Newcastle upon Tyne, UK) and ten digital temperature sensors (DS18B20, Maxim Integrated, San Jose, CA, USA) are used to provide the necessary temperature to perform the RT-LAMP assay and control the temperature within the set range, respectively. A Raspberry Pi Camera (RPi Camera) is used to image the assay progression, and eight LEDs (LW T733, Osram, Munich, Germany) are used to provide consistent lighting to aid imaging. The device is powered by a 20,000 mAh power bank (Anker Power Core, Anker, Shenzhen, China) with two 5 V, 2 A outputs.
Two custom-designed aluminium heater blocks were used in the device fabrication. These heater blocks were uniquely designed to enable uninterrupted imaging of the RT-LAMP assay progression and provide consistent lighting. The heater block, which holds the reaction tubes, contains cuts to expose equal parts of the reaction tubes to the camera. This is achieved by matching the angle of the cuts on the heater block to that of the viewing angle of the camera. This enables equal areas of all the tubes to be captured, which is vital for image processing. Similarly, the lid heating element contains two aluminium pieces bonded together with a heat transferring adhesive (TermoGlue, Termopasty Grzegorz Gasowski, Sokoły, Poland) with the custom resistive heating element sandwiched in between. The cut-through holes in the three components are aligned and fixed to the lid mounted PCB to allow the LEDs to shine directly through the cut-out holes into the reaction tubes.
3.2. Raspberry Pi
As shown in
Figure 2, Raspberry Pi (RPi) is used to control the device. The one-wire interface of the RPi was used to connect ten digital temperature sensors positioned directly on the PCB boards to monitor heater block temperature changes and provide real-time feedback control. Python-based control software is used to control the heating, image the progression of the RT-LAMP assay, and store the time-lapse images and temperature data within a specified folder. These images are then used by the AI-based image processing algorithm to identify the test results. Once Raspberry Pi starts, it runs autorun, the python script to start the Bluetooth channel to listen to the commands from the smartphone. The user can then initiate a test by pairing the device with the mobile app via Bluetooth and selecting the required diagnostic assay.
3.3. Mobile App
The mobile app is able to connect with the RPi computer to send control commands, system messages, and software updates, and display test results. A Bluez package [
16], the official Linux Bluetooth stack supporting the core Bluetooth layers and protocols, is used to communicate between RPi and mobile applications. Once a Bluetooth client is connected through the mobile app to the server in RPi, the mobile app starts to send command messages to the RPi to control the SARS-CoV-2 testing environment. Once testing has started in the RPi, the mobile app will disconnect the connection to the server to minimize the power consumption in the smartphone and RPi. After 20 min, the connection is re-established to check the status of the test and wait until all the tests are completed before closing the connections.
4. Methodology
The RT-LAMP assay was conducted in 8 tubes and remotely instructed to initiate testing at 65 °C. Once the samples (lysates) were introduced into the test tubes and the start button was activated from the smartphone app, the Bluetooth server running on RPi received the command message and increased the temperature of the test tubes to 65 °C to commence amplification (RT-LAMP) process and started to capture the images of test tubes at 20 s intervals. Each image consisted of 8 frames around each tube with a black background. Once required images were collected for 20–25 min, analysis on those images was executed within the RPi to detect the colour change from pink to yellow, confirming that the contents of that tube have a positive sample. If the colour remained pink, it was then deemed as negative.
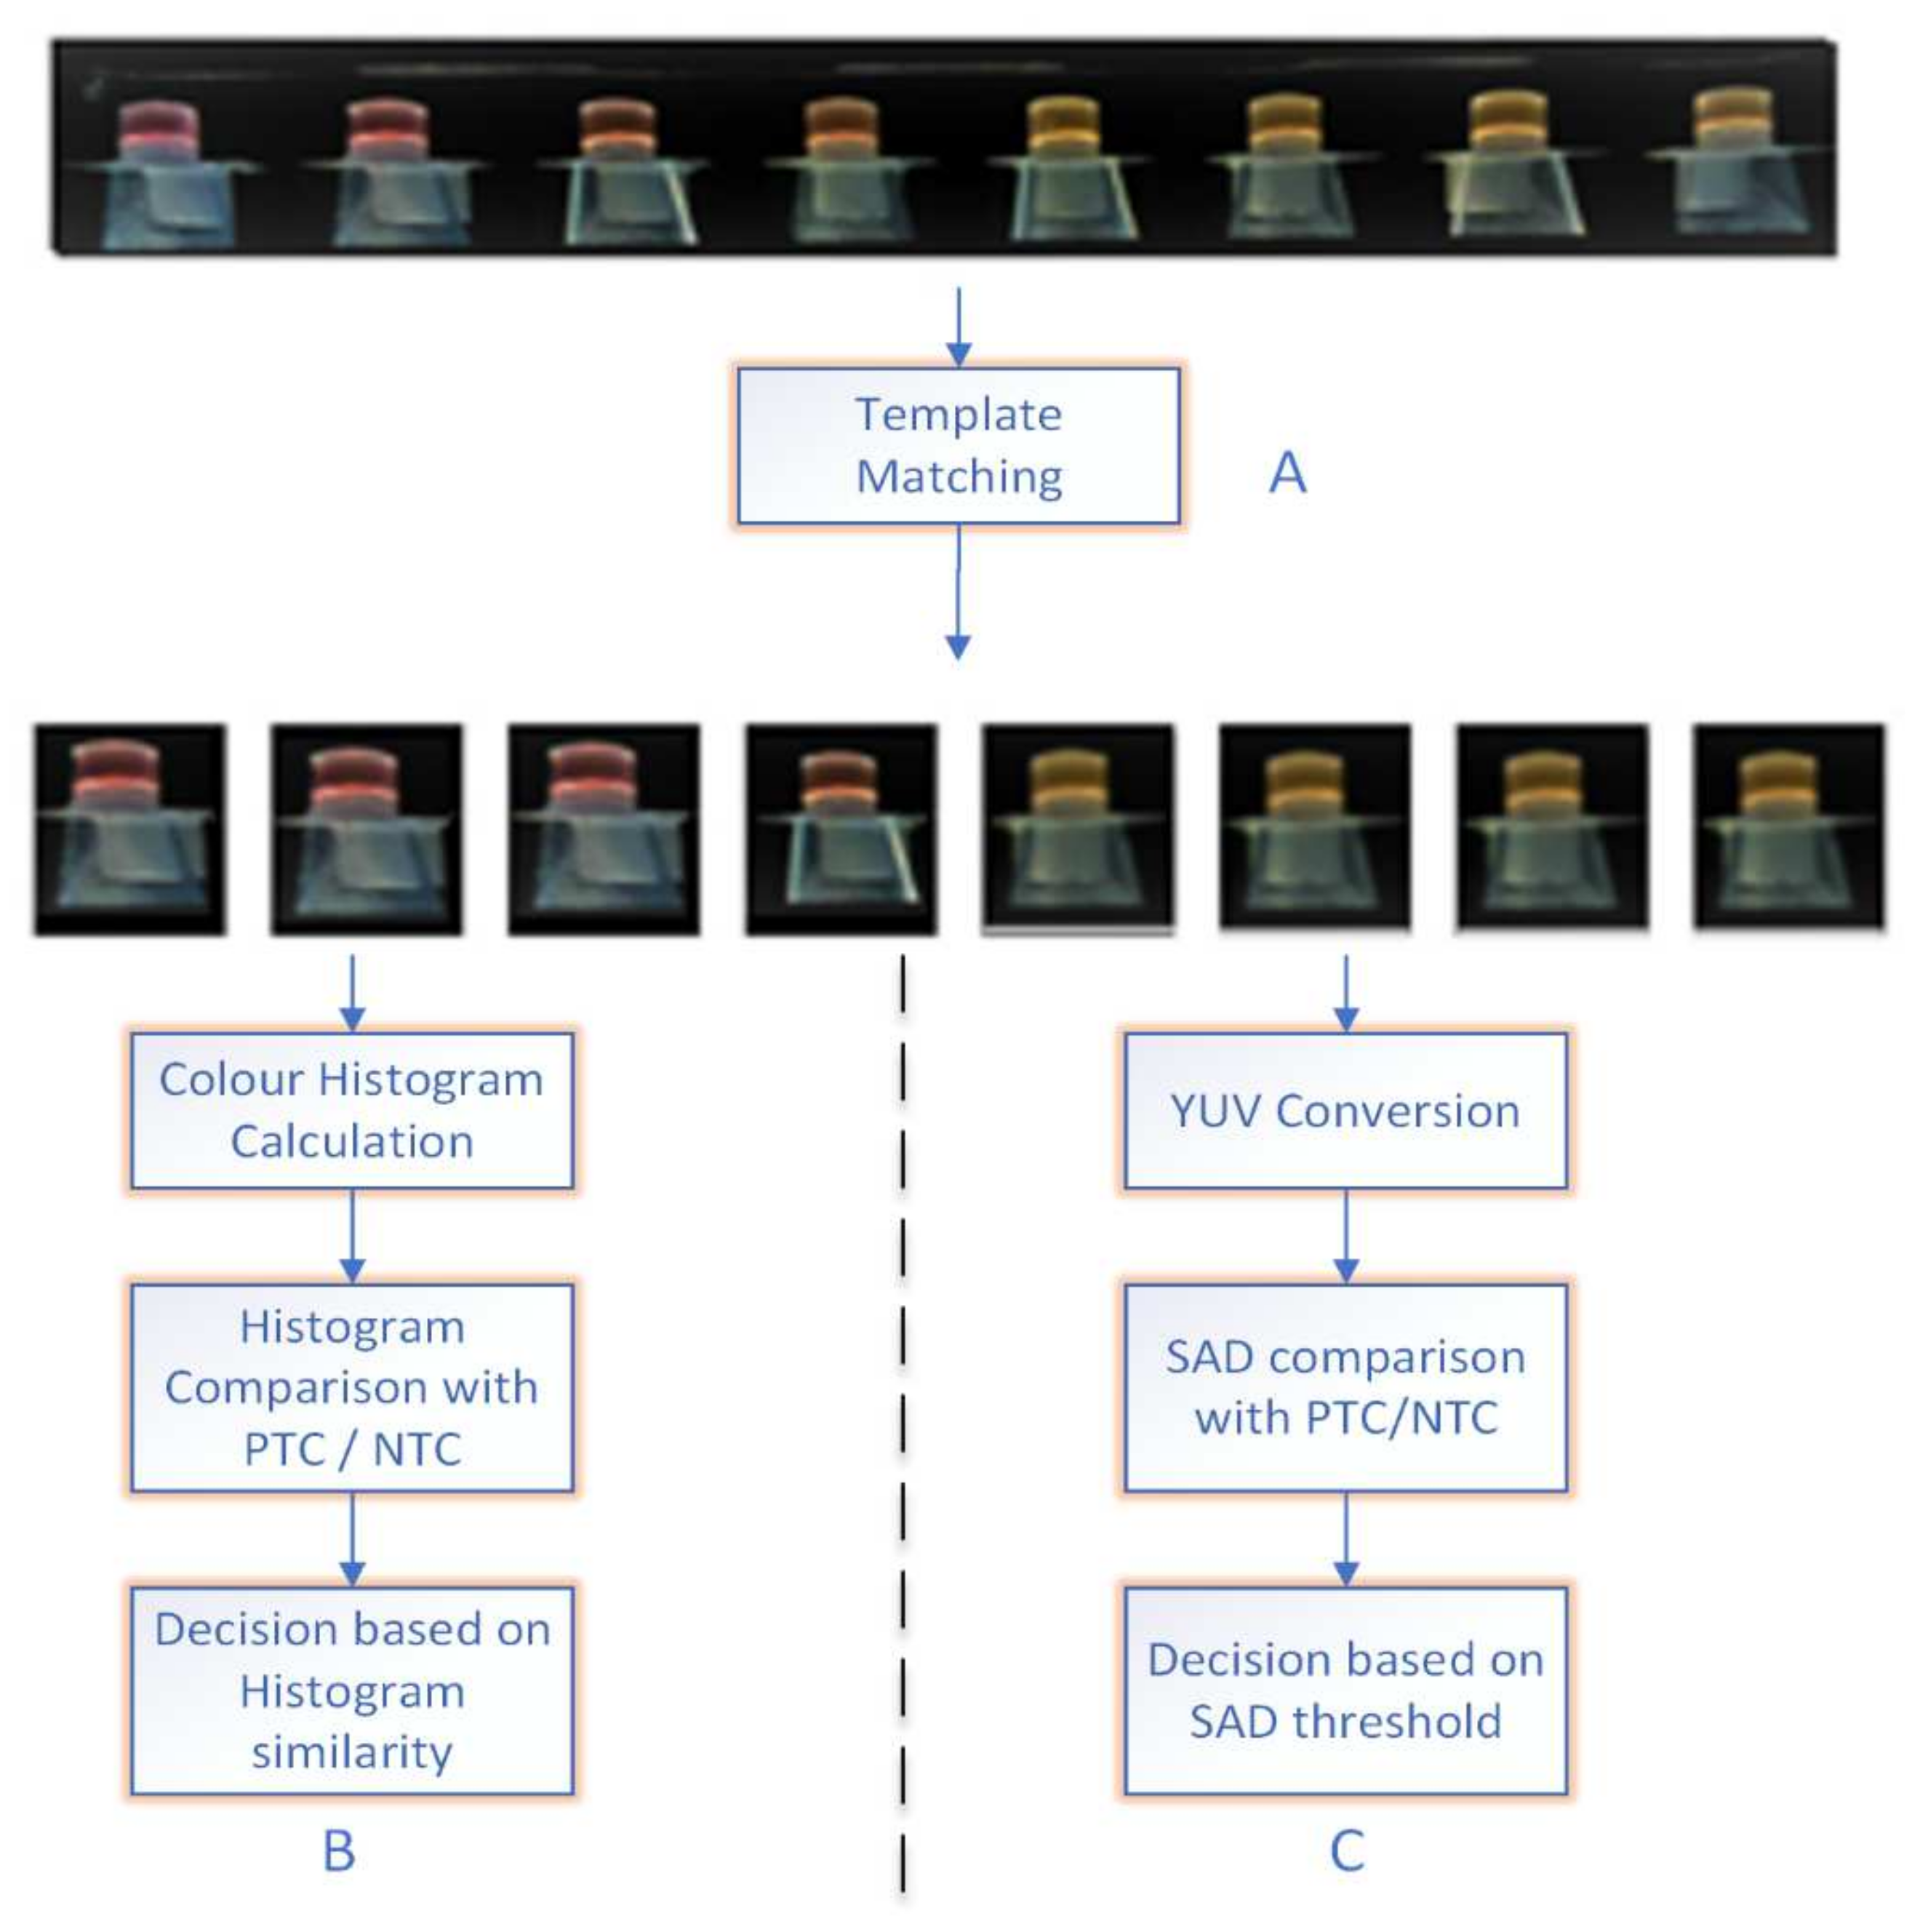
These images were then forwarded to an image processing algorithm implemented using OpenCV to identify the results. As shown in
Figure 3, different algorithms were tested to separately extract test tube images, identify test results, and reduce the testing time. The results of the image analysis were transmitted to the mobile app available through the Bluetooth connection. In this way, the test results were displayed on the smartphone and saved in a database for later use.
4.1. Data Collection
To train the AI model and validate the models, images were acquired from the prototype device, which carried 8 test tubes including a NTC (negative test control) and PTC (positive test control), every 20 s during the isothermal amplification stage for nearly 200 assays, including a few patient samples for SARS-CoV-2 collected by the University of Surrey and Lancaster University and synthetic RNA assays with different dilutions which were the same genetic sequence as that of the N-gene of SARS-CoV-2 [
15]. The clinical samples were individually collected from COVID-19 suspected patients through routine NHS screening. These samples were then anonymised using a unique (UoS) identifier and transported in virus transport media (VTM) to the laboratories. For this study, total RNA was extracted using 140 µL of the spiked VTM and a commercial kit (QIAamp Viral RNA and mini kit (Qiagen, Valencia, CA, USA) and QIAgen RNeasy). A total of 4 µL of the extracted RNA was then used in the LAMP reaction as per the manufacturer instructions (NEB, UK) [
15] and inserted in the device for amplification and image analysis. As shown in
Figure 4, 5712 test tubes images were extracted from the images of these experiments, and 4339 images were used to train the models and 482 images were used to validate the model. Once validated in the training process, 891 images were used to report the performance of the selected models in our study.
4.2. Ethics Statement
This study was undertaken across two universities. For the study and validation undertaken at the University of Surrey, the use of human nasopharyngeal swabs was approved by the Health Research Authority (HRA) NHS Research and Ethics Committee (REC) (University of Surrey IRAS project ID: 283201, NHS REC number: 20/EE/0125). For the study and validation undertaken at Lancaster University, the clinical samples were collected and processed according to the guidelines and approval of the Faculty of Health and Medicine Research Ethics Committee (FHMREC) of Lancaster University, UK. The study was approved by the FHMREC on 8 June 2020 under the reference number FHMREC19112.
As shown in
Figure 4, a total of 5712 test tube images were extracted from those datasets. The study was exempt from requiring specific patient consent as it only involved the use of anonymised extracted RNA and existing collections of data or records that contained non-identifiable data about human patients.
4.3. Data Processing with a Template Matching-Based Algorithm
As the area within the tube displaying the colour change was fractionally smaller than its background in the images collected with this device, each targeted tube frame was extracted from the image before applying an image processing algorithm. A reference tube was selected as a template, and a template matching algorithm [
17] was applied to extract all tubes from the first image. The rationale for the template matching was to search and find the location of tubes in a larger image. It merely moved the template image over the input image to perform the 2-dimensional convolution and compared values to get the maximum overlap on deciding the exact similar areas. As the test tube positions did not change over time within the given test environment, the template matching algorithm was only applied to the first timeframe image. After getting the precise locations of the tubes, the coordinates of the extracted areas were only considered for analysis for the remaining images. This approach decreased the size of the problem drastically to a manageable size compared to taking the whole image.
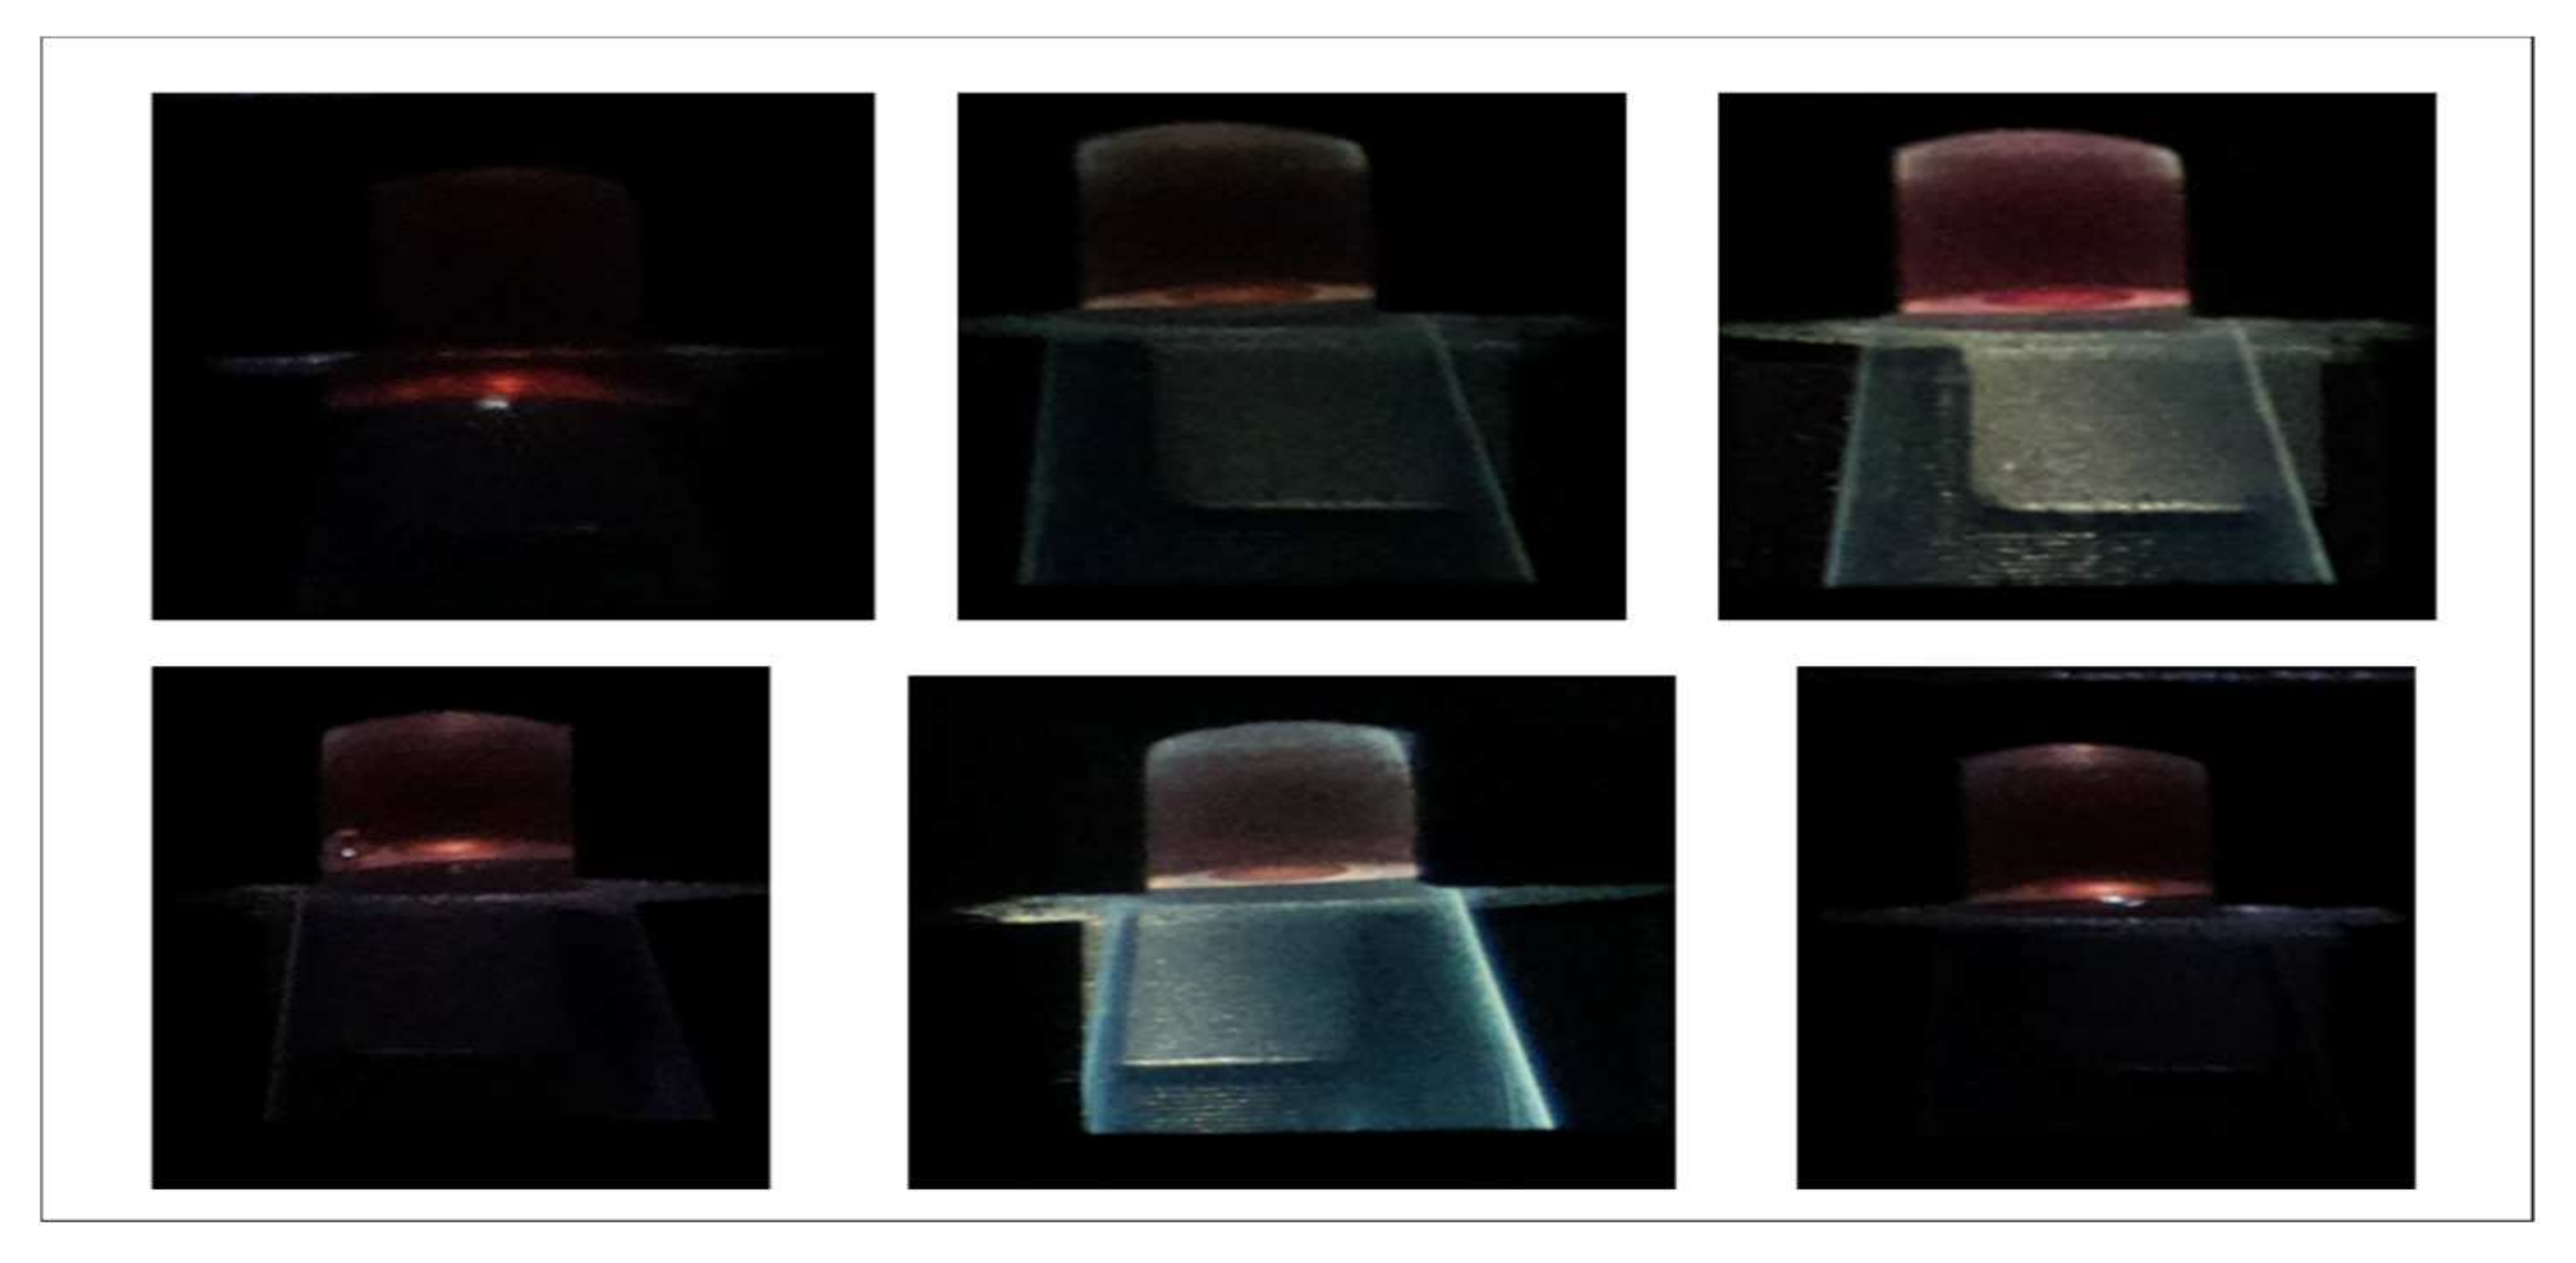
The main challenges of using the RT-LAMP-based colourimetric approach were bubbles in the test tubes, a relatively small area to detect the colour change, pixel variations and data drift due to camera flash, and background reflections, as shown in
Figure 5. Different algorithms were applied for the images taken during the experiments to overcome these challenges.
4.4. Histogram Comparison
Once the positions of the tubes were extracted, the histogram method was applied as a method of comparing and classifying the tubes based on their colours. Histograms were calculated in a few different colour spaces. The histogram represents the frequency of pixel intensities present within the tubes for all the channels [
18]. The number of bins, the range of intensities, and the channel selection were the three primary parameters for calculating the histograms. The number of bins selected should be sufficiently broad to capture the significant features in the data by ignoring fine details due to noise and fluctuations [
19]. After experimentation, a bin size of 32 gave better results for our experiments. The range of intensities was selected as a [30–200] pixels channel in our experiments to reduce the complexity of calculating histogram range and remove the effect of white colour due to light and the significant portion of black background pixels.
4.5. Sum of Absolute Difference
Sum of absolute differences (SAD) was another basic image processing algorithm applied to classify colours in our experiments. SAD is a method for evaluating the similarity between two regions of images of the same size. As our images were heavily affected by different light levels, images were converted to the YUV colour space to reduce the effect of variant light, and then SAD algorithms were applied.
In YUV colour space, the Y channel represents luminance, whereas the U and V channels represent the chrominance. Separating the luminance from the chrominance reduced the effect of light changing and shadow noises in each test tube [
20]. Finally, the chrominance (U,V) channels from the YUV image were considered for the next step of image processing. The chrominance (U,V) values of those extracted test tubes were compared with reference orange test tubes in positive control and reference pink images in negative control test tubes to calculate the sum of absolute difference (SAD) for each pixel value.
For this pixel comparison approach and colour classification, three different strategies were investigated.
Using negative test control (NTC)/positive test control (PTC) of each timeframe image as a reference image and comparing other tubes present within the same timeframe.
Using NTC/PTC of the first timeframe image as a reference image and comparing all other tubes in all the timeframes.
The sum of two comparisons where the first was a comparison between tubes and NTC/PTC from the same time frame and the second compared the same tube to its first timeframe.
The third approach provided the best results out of the three as it not only looked for local colour changes but also tracked colour changes over time. In addition, this technique was less affected by colour and brightness variations. The resulting SAD values were then normalized using a moving average with a window size of 5.
Typical SAD approaches use a reference image block to slide around the image and find the minimum sum of absolute difference to identify similar images to the reference image. As these algorithms were run on RPi, the complexity of those SAD calculations needed to be reduced to make it run as efficiently as possible on the RPi. Therefore, we applied a decoupled approach where the test tube areas were extracted using a template matching in the first soft comparison phase, and then colour differences were identified based on the YUV space of the nearby area of extracted tubes in the hard comparison approach.
4.6. Deep Learning Approach
Even though a SAD-based approach gave a better result for better image sets, this approach failed to generalize in tests where tubes with bubbles and different background light conditions were present. In addition to that, the SAD method required manual intervention in finding the best threshold for each experiment. Therefore, a more dynamic and robust technique was required. Keeping that in mind, a deep learning-based approach was used in our experiments to generalize the classification and make the process invariant to the noise present in the data. As image background and quality change in the images are captured by this SARS-CoV-2 testing device, a bespoke artificial intelligence (AI)-based colour detection was proposed to identify colour changes and to reduce the test running time. As with previous approaches, the first step in the process was extracting 8 test tubes from each image by applying a template matching algorithm. The main challenges of using the colourimetric approach were the colour perspective change due to background change, problems in identifying small changes, bubbles in the test tubes, a relatively small area corresponding to colour change, and pixel variation due to camera flash and background reflections.
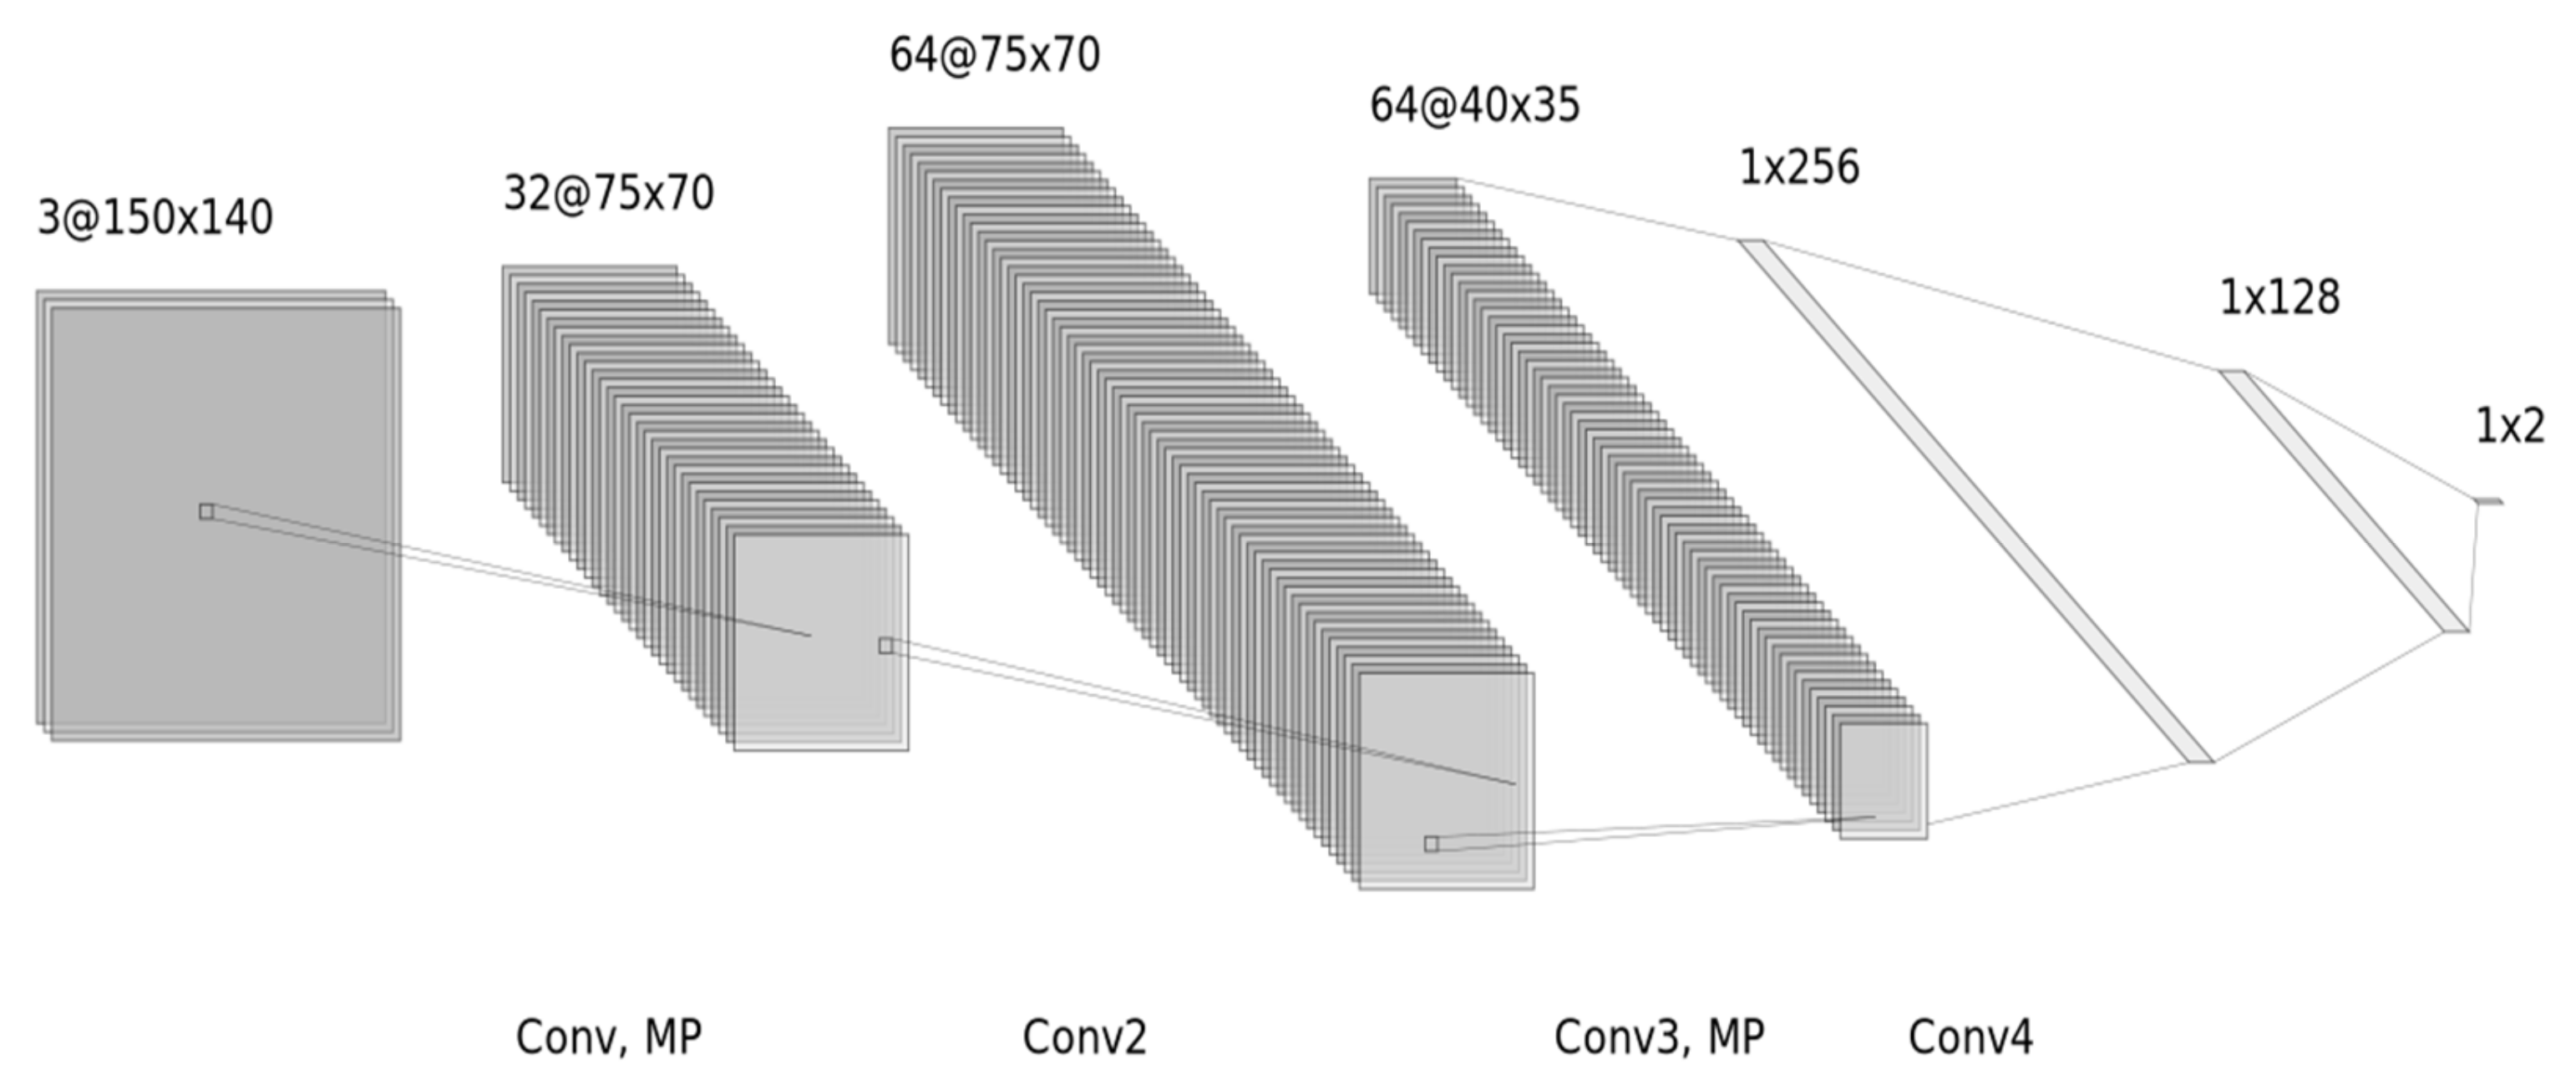
Deep learning is a subdomain of AI that does not require any domain knowledge to work; instead, it learns hidden patterns from examples present in the dataset. Deep learning architecture was proposed with the bespoke eight layers, as shown in
Figure 6. It consisted of four convolutional layers (Con2D) followed by two dense and an output layer. Binary cross-entropy was used as a loss function as it is a binary classification, 0.001 was used as the initial learning rate, and Adam as an optimizer to compile the model. A 5 × 5 size kernel has been used but the filter size after every two Con2D layers increases. At the 1st, 2nd, 3rd, and 4th layers of Con2D, 3, 32, 64, and 64 filters have been used, respectively, to learn from the input. After each Con2D layer, the max-pooling layer with a 2 × 2 pooling size has been applied to decrease the spatial size of the feature map and return the important features to avoid overfitting. As the final pooling and convolutional layer gives a three-dimensional matrix as output, a flattening layer has been applied before passing the output as input to the dense layers. A rectified linear unit (ReLU) has been applied in the activation functions with the four convolutional layers and three dense layers, and a sigmoid activation function has been applied with the output layer to increase the nonlinearity in the input image, as the images are fundamentally nonlinear in nature.
MobileNet [
21] is a CNN architecture model mainly used for image classification with devices with less computation power such as mobile devices and embedded devices. MobileNets are based on a streamlined architecture that uses depth-wise separable convolutions to build lightweight deep neural networks [
21]. Other than the mentioned CNN architecture, MobileNet architecture was also used for our experiments to improve the performance [
21]. Although the bespoke AI model worked better than SAD techniques, MobileNet [
21] provided the best performance. MobileNet, being designed for mobile applications, provided better performance and inferred smoothly on RPi.
A data generator was implemented with bespoke CNN and MobileNet to read the images in batches and feed them to the model. This data generator implementation helps to consume less memory and to use real-time data augmentation by adding variation to the samples by adding small horizontal flips, horizontal and vertical shifts ranging from 10–20 pixels, and random brightness change. To reduce overfitting, early stopping with the patience of three epochs was used on validation error, which means if validation error does not drop for three consecutive epochs, training would stop.
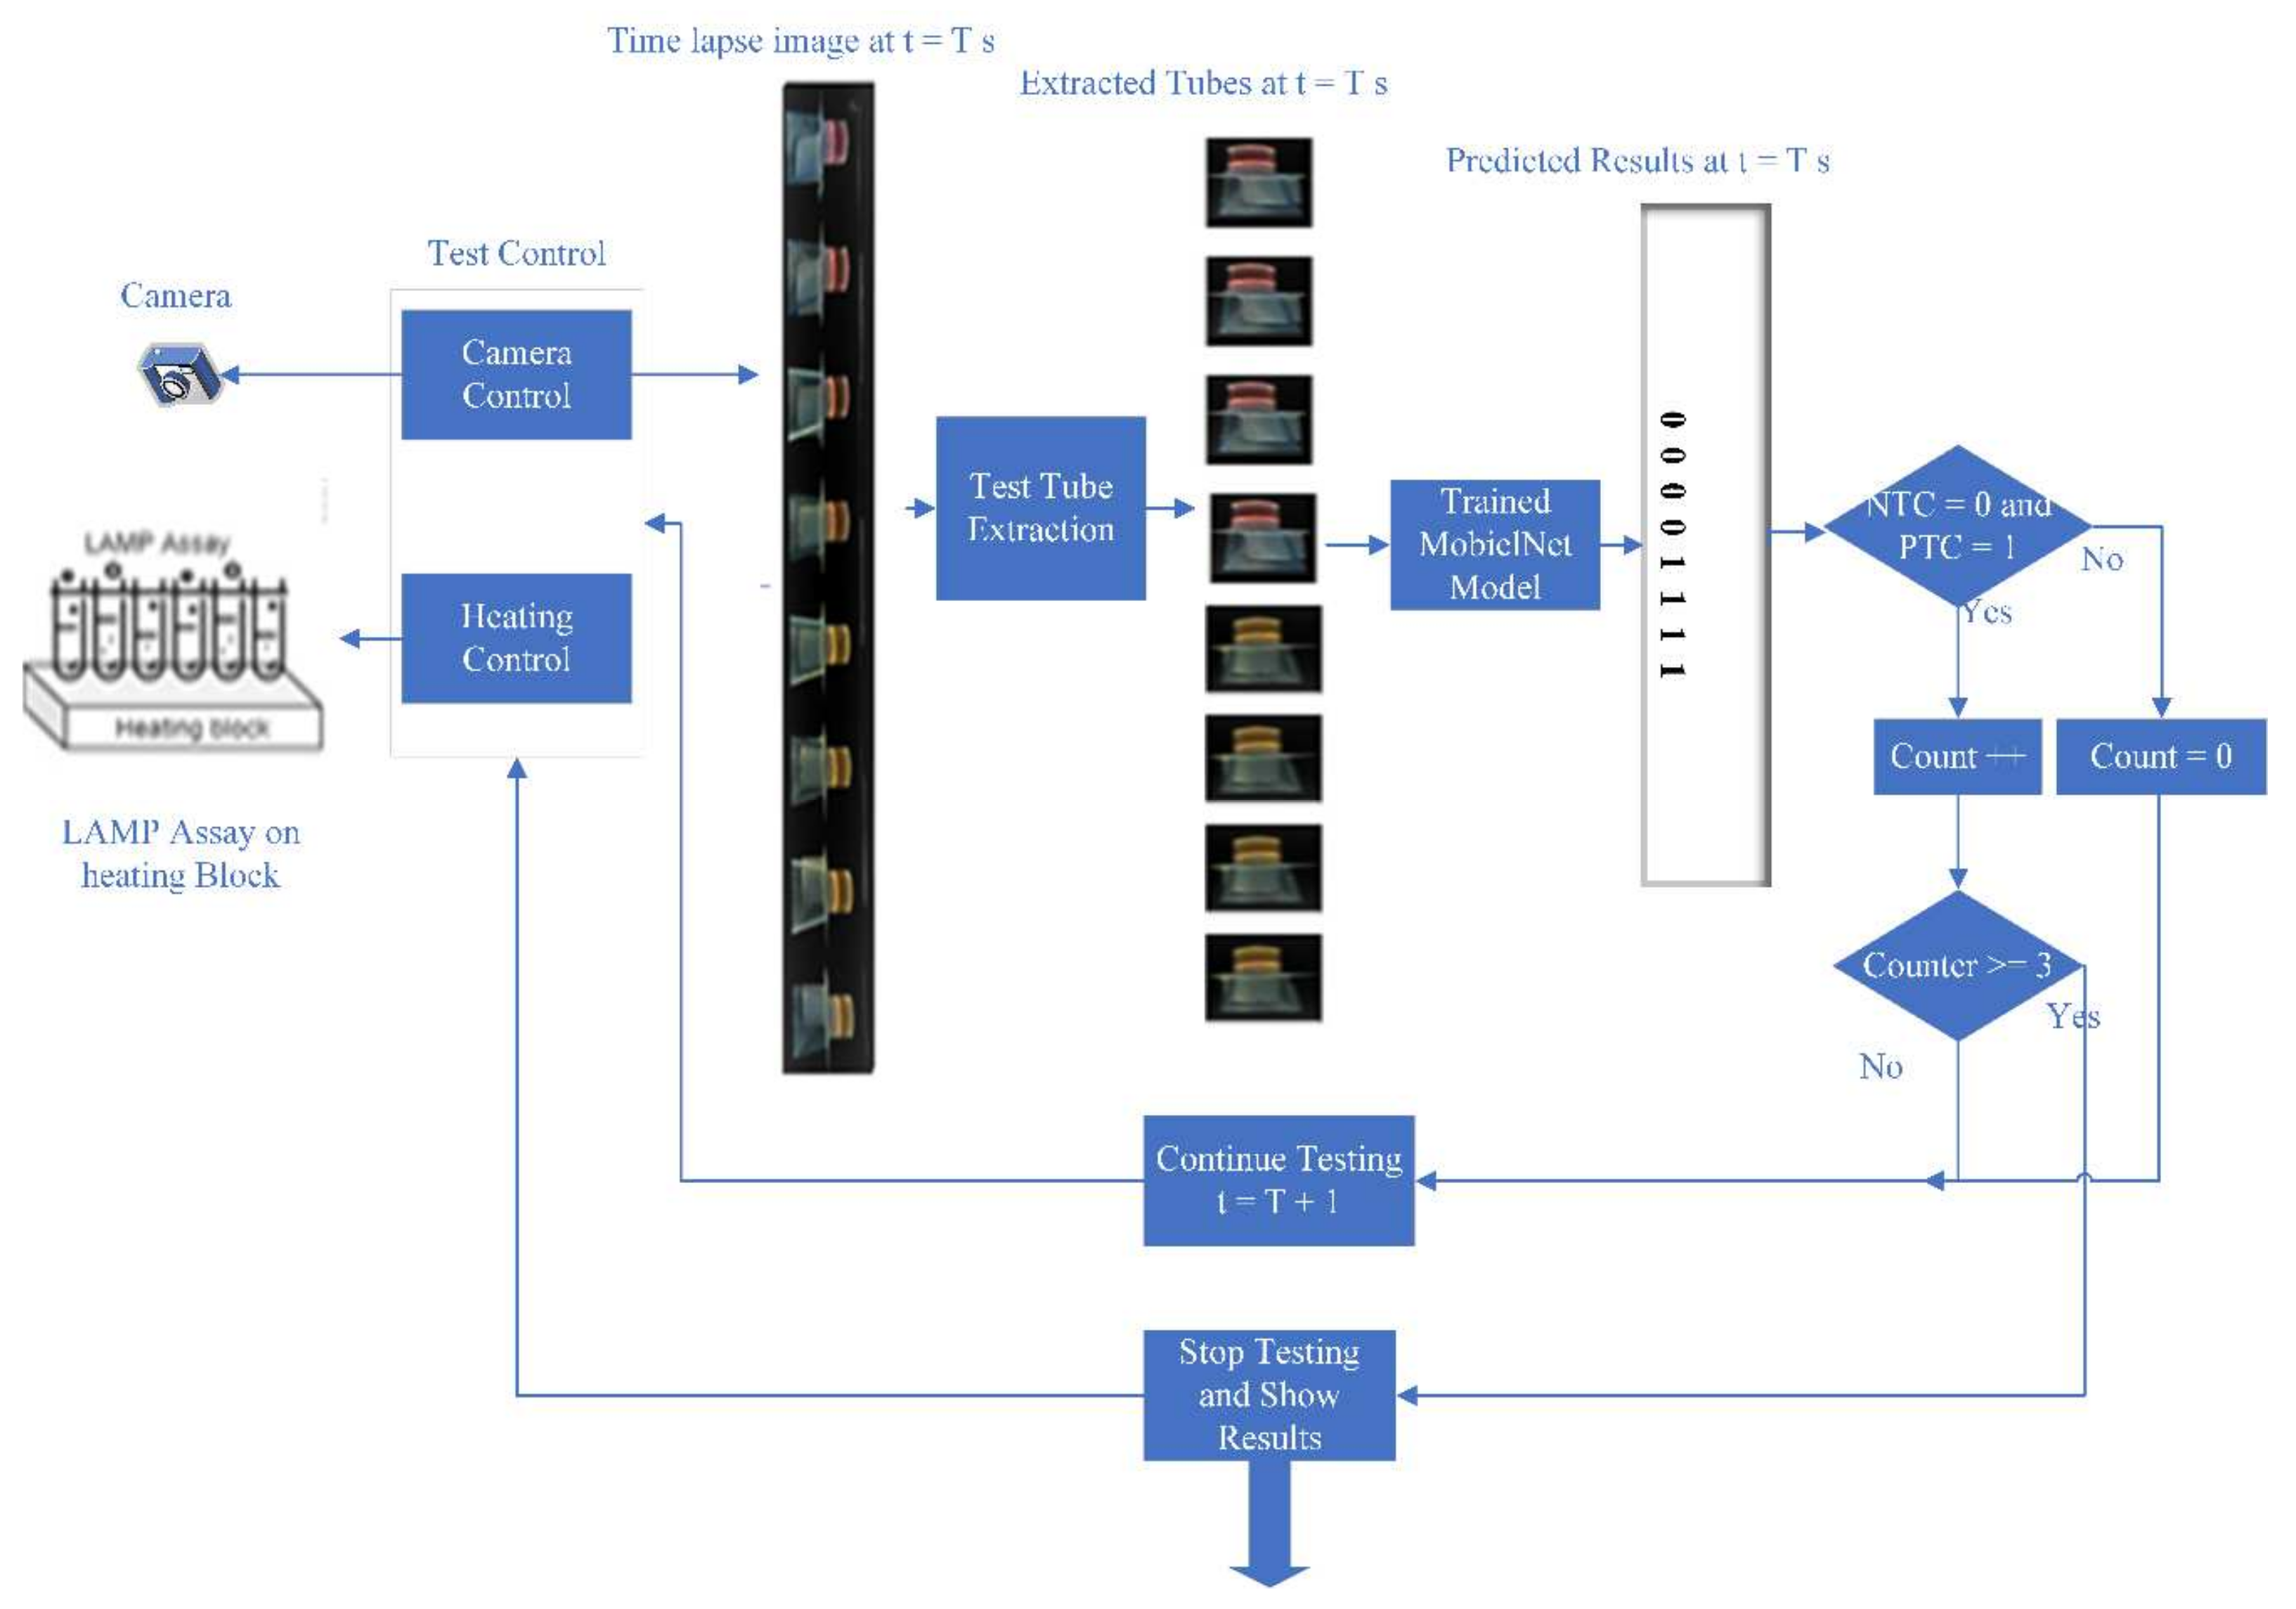
4.7. Time Optimization for SARS-CoV-2 Test
With the naked eye, colour changes can be identified after an average time of 20 min. The trained models were used with a positive test control (PTC) and negative test control (NTC) in the newly developed device to identify gradual colour changes at an earlier stage, as shown in
Figure 7. During the experiment, one positive control and one negative control were used. Once the PTC was identified as positive, and the NTC was identified as negative consecutively three times, the tests were stopped, and the results were returned to reduce the waiting time and power consumption.
5. Results and Discussion
This study is the first to demonstrate the implementation of unique image processing and AI-based algorithms in a portable, low-cost molecular diagnostic device for SARS-CoV-2 (COVID-19) detection and to evaluate its performance. The classification performance of the proposed methodologies with the developed device was demonstrated by measuring the area under the receiver operating characteristic (AUROC) on the image datasets taken by the developed devices, as mentioned in
Figure 4. AUROC is chosen as it can be used as a criterion to measure the discriminative ability of the device for COVID-19 positive and negative. All the algorithms were applied after extracting separate tubes using a template matching algorithm.
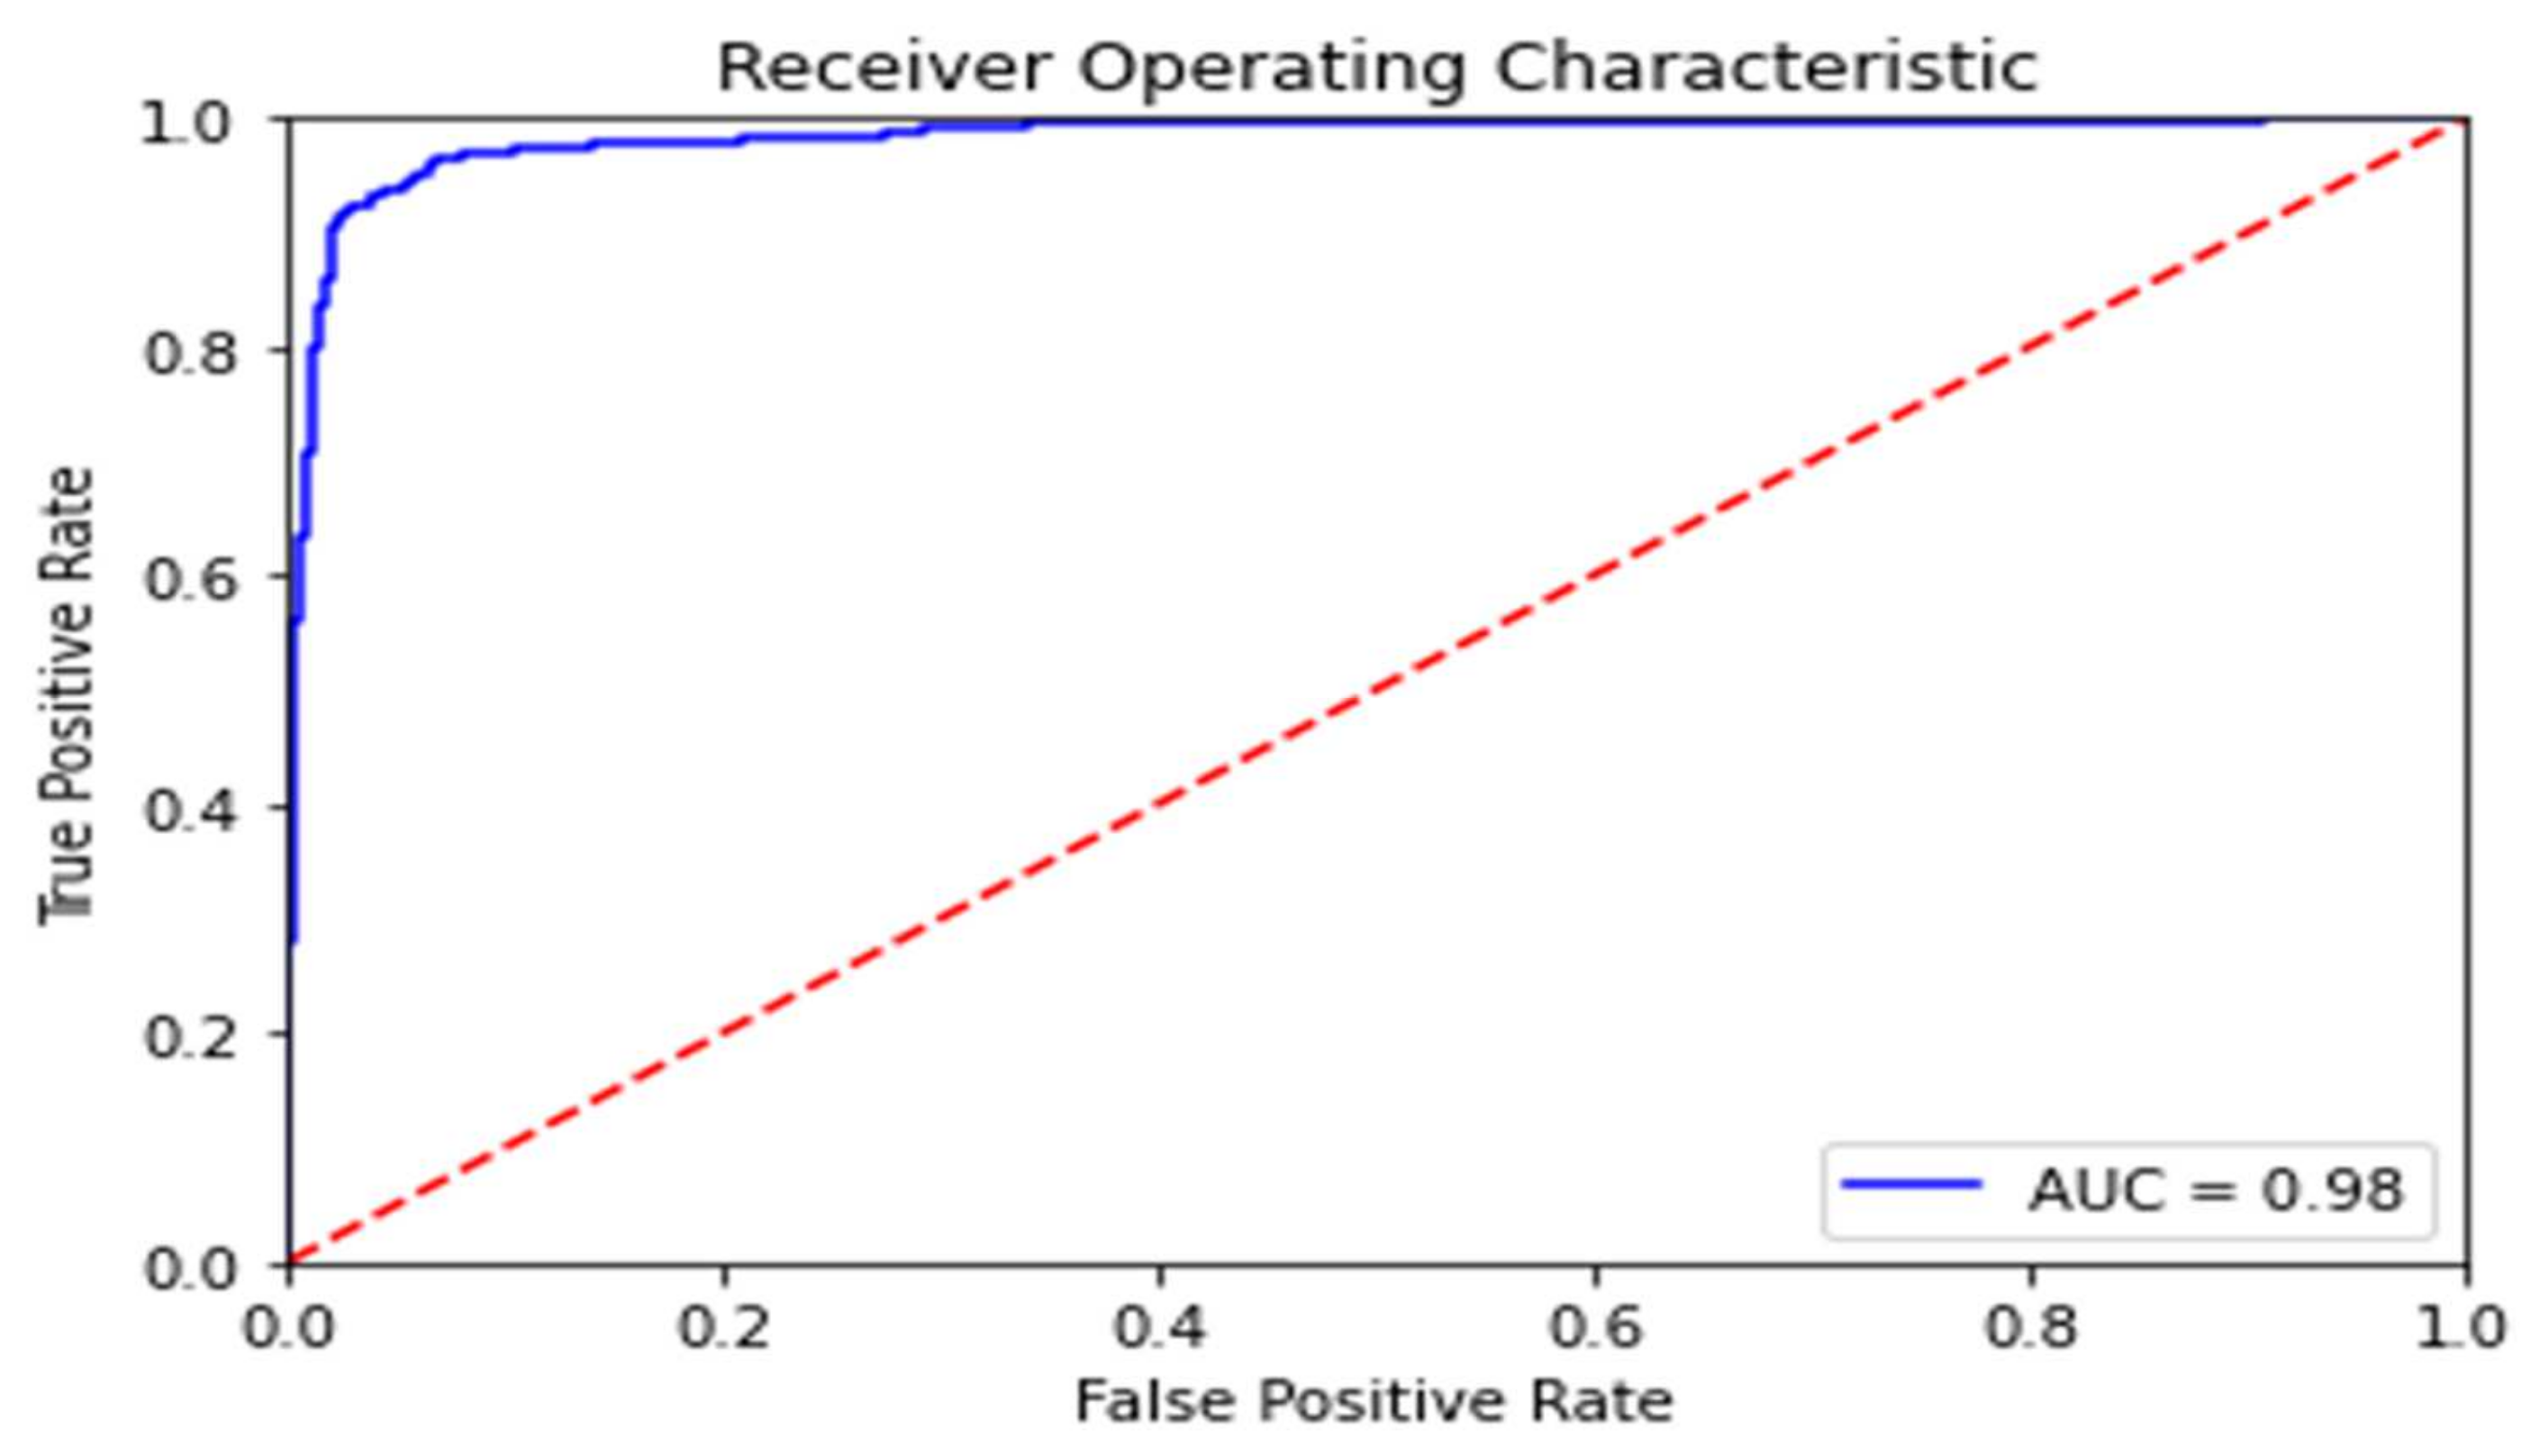
Table 1 lists the performances of those algorithms. Receiver operating curves were plotted by varying the operating threshold. As shown in
Figure 8, the results indicate that MobileNet performs best with 98% AUROC for different background lights to classify colour amid the bubbles and different background light settings while the bespoke CNN algorithm gives 91.7% AUROC. Two operating points from the receiver operating curves were chosen as the best compromise between sensitivity and specificity. The high sensitivity point has a sensitivity value of 99.12% and specificity value of 70.8%, while at the high specificity point, the sensitivity is 96.05% and the specificity 93.59% for the MobileNet model in the test dataset.
During the RT_LAMP-based experiment, gradual colour changes for positive samples were detectable with the naked eye in a 25 min to 30 min time gap depending on viral load. The corresponding samples were run on this prototype device with the inbuilt MobileNet model with a template matching algorithm, and temporal and real-time colour changes were monitored as described earlier. A clear colour change was detected and calibrated as early as 20 min on average and the RT-LAMP-based experiments are automatically stopped once the colour change is detected by the device, thus reducing the waiting time and power consumption.
Collectively, our results demonstrate that the newly designed portable AI-assisted device has high sensitivity and specificity for the detection of the SARS-CoV-2 virus causing COVID-19 and reduces the waiting time and power consumption of the device. In addition, this device can be operated by a non-scientifically trained user as it removes the subjectivity associated with operator interpretation of the colourimetric RT-LAMP results and the testing steps are automatically controlled through mobile app commands.
6. Conclusions
This portable, low-cost SARS-CoV-2 detection device has the potential to have a significant positive impact on the population at large. Two main challenges in controlling the effect of the COVID-19 pandemic are identifying infections and tracking the possible contacted person to stop the disease from spreading. The proposed technology highlights the power of electronic, AI, and mobile technology to control the SARS-CoV-2 pandemic by providing rapid and affordable test results in resource-limited laboratories, airports, and homes and helping the authorities to reduce the spread of the virus.
In this study, we have developed a portable, low-cost system that allows detection of SARS-CoV-2 viruses in six separate patient samples within an average time of 20 min with 99.12% and 95.17% sensitivity and 70.80% and 89.75% specificity in the selected operating points, even by a non-medically trained user. The template matching algorithm and MobileNet CNN approach in RPi will learn the patterns through the training to classify colours of the tube amid the noise. The use of this novel RT-LAMP test will be helpful especially for detecting SARS-CoV-2 with low viral loads when testing upper respiratory tract specimens from patients.
The developed low-cost portable SARS-CoV-2 detection device will automatically run an RT-LAMP-based assay and return the results to a mobile app. In the future, we plan to integrate the device with the cloud, schedule the results through the unified app, upload the results automatically to the secured location, and connect it to the contact tracing app to help further mitigate the disease spread. The development of an AI-assisted detection device with multiplexed assay capability could simultaneously detect other pathogens and increase its clinical utility in multiple applications in human, plant, and animal health.
To commercialise this prototype, the device must have CE marking and medical body approval in the given country (e.g., MHRA approval for the UK). In addition, steps are required to ensure no sample contamination occurs inside the device and the tested samples can be safely and easily disposed of. There are limitations to this system, including the fact that colorimetric RT-LAMP relies on pH changes due to nucleic acids amplification, in the presence of the target RNA. Therefore, the pH of samples needs to be stable, by using a standard method of extraction, to avoid false positives. In addition, knowledge of the target pathogen genome sequence is required in order to design the test primers. In this study, relatively few patients’ samples were processed to train the algorithm. Therefore, in the future, additional processing of clinical samples may help to further enhance the system.
Author Contributions
The major contributions of all the authors are summarized as: conceptualization, A.F., M.M., R.M.L.R. and W.B.; methodology, M.T., N.S.C., M.B. and A.F.; data preparation and collection, A.C.P. and M.A.R.; validation, M.T., N.S.C. and M.B.; formal analysis, M.B. and A.F.; investigation, R.M.L.R. and M.M.; resources, A.F., W.B., M.M. and R.M.L.R.; writing—original draft preparation, M.T.; writing—review, and editing, N.S.C., M.B., A.F., W.B., M.A.R., A.C.P., M.M. and R.M.L.R.; supervision, A.F., M.M., W.B. and R.M.L.R.; project administration, W.B. All authors have read and agreed to the published version of the manuscript.
Funding
This project was supported by a UK Biotechnology and Bioscience Research Council (BBSRC) grant (Reference BB/R012695/1) and Zoetis via the vHive initiative at the University of Surrey. The project was also funded by EPSRC Impact Acceleration Account Seed Funding at Lancaster University.
Institutional Review Board Statement
This study was conducted according to the guidelines and approval from the Health Research Authority (HRA) NHS Research and Ethics Committee (REC) (University of Surrey IRAS project ID: 283201, NHS REC number: 20/EE/0125), and the Faculty of Health and Medicine Research Ethics Committee (FHMREC) of Lancaster University, UK (reference number FHMREC19112, date of approval 8 June 2020).
Informed Consent Statement
The study was exempt from requiring specific patient consent as it only involved the use of anonymised extracted RNA and existing collections of data or records that contained non-identifiable data about human patients.
Data Availability Statement
Data for the study were generated by the device as mentioned in the data collection steps. The images generated by the prototype device are available on reasonable request from the corresponding author.
Conflicts of Interest
The authors declare no conflict of interest. The funders had no role in the design of the study; in the collection, analyses, or interpretation of data; in the writing of the manuscript, or in the decision to publish the results.
References
- Dong, E.; Du, H.; Gardner, L. An interactive web-based dashboard to track COVID-19 in real time. Lancet Infect. Dis. 2020, 20, 533–534. [Google Scholar] [CrossRef]
- Yu, L.; Wang, X.; Han, L.; Chen, T.; Wang, L.; Li, H.; Li, S.; He, L.; Fu, X.; Chen, S.; et al. Rapid colorimetric detection of COVID-19 coronavirus using a reverse tran-scriptional loop-mediated isothermal amplification (RT-LAMP) diagnostic plat-form: iLACO. medRxiv 2020. [Google Scholar] [CrossRef]
- Liu, Y.; Gayle, A.A.; Wilder-Smith, A.; Rocklöv, J. The reproductive number of COVID-19 is higher compared to SARS coronavirus. J. Travel Med. 2020, 27, 13. [Google Scholar] [CrossRef] [PubMed]
- Shen, M.; Zhou, Y.; Ye, J.; Al-Maskri, A.A.A.; Kang, Y.; Zeng, S.; Cai, S. Recent advances and perspectives of nucleic acid detection for coronavirus. J. Pharm. Anal. 2020, 10, 97–101. [Google Scholar] [CrossRef]
- Vogels, C.B.F.; Brito Anderson, F.; Wyllie, A.L.; Fauver, J.R.; Ott, I.M.; Kalinich, C.C.; Petrone, M.E.; Casanovas-Massana, A.; Muenker, M.C.; Moore, A.J.; et al. Analytical sensitivity and efficiency comparisons of SARS-COV-2 qRT-PCR primer-probe sets. Nat. Microbiol. 2020, 5, 1299–1305. [Google Scholar] [CrossRef]
- Zhang, Y.; Odiwuor, N.; Xiong, J.; Sun, L.; Nyaruaba, R.O.; Wei, H.; Tanner, N.A. Rapid Molecular Detection of SARS-CoV-2 (COVID-19) Virus RNA Using Colorimetric LAMP. medRxiv 2020. [Google Scholar] [CrossRef]
- Kaarj, K.; Akarapipad, P.; Yoon, J.-Y. Simpler, Faster, and Sensitive Zika Virus Assay Using Smartphone Detection of Loop-mediated Isothermal Amplification on Paper Microfluidic Chips. Sci. Rep. 2018, 8, 12438. [Google Scholar] [CrossRef]
- Notomi, T.; Okayama, H.; Masubuchi, H.; Yonekawa, T.; Watanabe, K.; Amino, N.; Hase, T. Loop-mediated isothermal amplification of DNA. Nucleic Acids Res. 2000, 28, E63. [Google Scholar] [CrossRef]
- Kashir, J.; Yaqinuddin, A. Loop mediated isothermal amplification (LAMP) assays as a rapid diagnostic for COVID-19. Med. Hypotheses 2020, 141, 109786. [Google Scholar] [CrossRef]
- Yan, C.; Cui, J.; Huang, L.; Du, B.; Chen, L.; Xue, G.; Li, S.; Zhang, W.; Zhao, L.; Sun, Y.; et al. Rapid and visual detection of 2019 novel coronavirus (SARS-CoV-2) by a reverse transcription loop-mediated isothermal amplification assay. Clin. Microbiol. Infect. 2020, 26, 773–779. [Google Scholar] [CrossRef]
- Mahony, J.; Chong, S.; Bulir, D.; Ruyter, A.; Mwawasi, K.; Waltho, D. Development of a sensitive loop-mediated isothermal amplification assay that provides specimen-to-result diagnosis of respiratory syncytial virus infection in 30 min. J. Clin. Microbiol. 2013, 51, 2696–2701. [Google Scholar] [CrossRef]
- Craw, P.; Mackay, R.E.; Naveenathayalan, A.; Hudson, C.; Branavan, M.; Sadiq, S.T.; Balachandran, W. A Simple, Low-Cost Platform for Real-Time Isothermal Nucleic Acid Amplification. Sensors 2015, 15, 23418–23430. [Google Scholar] [CrossRef]
- Park, G.-S.; Ku, K.; Baek, S.-H.; Kim, S.-J.; Kim, S.I.; Kim, B.-T.; Maeng, J.-S. Development of Reverse Transcription Loop-Mediated Isothermal Amplification Assays Targeting Severe Acute Respiratory Syndrome Coronavirus 2 (SARS-CoV-2). J. Mol. Diagn. 2020, 22, 729–735. [Google Scholar] [CrossRef]
- El-Tholoth, M.; Bau, H.H.; Song, J. A Single and Two-Stage, Closed-Tube, Molecular Test for the 2019 Novel Coronavirus (COVID-19) at Home, Clinic, and Points of Entry. ChemRxiv 2020. [Google Scholar] [CrossRef]
- Rohaim, M.A.; Clayton, E.; Sahin, I.; Vilela, J.; Khalifa, M.E.; Al-Natour, M.Q.; Bayoumi, M.; Poirier, A.C.; Branavan, M.; Tharmakulasingam, M.; et al. Artificial Intelligence-Assisted Loop Mediated Isothermal Amplification (AI-LAMP) for Rapid Detection of SARS-CoV-2. Viruses 2020, 12, 972. [Google Scholar] [CrossRef]
- Bote, A.S.; Ghare, N.; Rahurkar, P.K.; Latkar, M. Bluetooth Chat Application: Bluez. Int. J. Eng. Comput. Sci. 2015, 4, 10674–10679. Available online: http://103.53.42.157/index.php/ijecs/article/view/925 (accessed on 28 September 2020).
- Sun, Y.; Mao, X.; Hong, S.; Xu, W.; Gui, G. Template Matching-Based Method for Intelligent Invoice Information Identification. IEEE Access 2019, 7, 28392–28401. [Google Scholar] [CrossRef]
- Kaur, H.; Sohi, N. A Study for Applications of Histogram in Image Enhancement. Int. J. Eng. Sci. 2017, 6, 59–63. [Google Scholar] [CrossRef]
- Knuth, K.H. Optimal Data-Based Binning for Histograms. arXiv 2013, arXiv:physics/0605197. Available online: http://arxiv.org/abs/physics/0605197 (accessed on 28 September 2020).
- Al-Tairi, Z.H.; Rahmat, R.W.; Saripan, M.I.; Sulaiman, P.S. Skin Segmentation Using YUV and RGB Color Spaces. J. Inf. Process. Syst. 2014, 10, 283–299. [Google Scholar] [CrossRef]
- Howard, A.G.; Zhu, M.; Chen, B.; Kalenichenko, D.; Wang, W.; Weyand, T.; Andreetto, M.; Adam, H. MobileNets: Efficient Convolutional Neural Networks for Mobile Vision Applications. arXiv 2017, arXiv:1704.04861. Available online: http://arxiv.org/abs/1704.04861 (accessed on 8 October 2020).
| Publisher’s Note: MDPI stays neutral with regard to jurisdictional claims in published maps and institutional affiliations. |
© 2021 by the authors. Licensee MDPI, Basel, Switzerland. This article is an open access article distributed under the terms and conditions of the Creative Commons Attribution (CC BY) license (https://creativecommons.org/licenses/by/4.0/).


 ,
, 


