Article

Motor Unit Discharges from Multi-Kernel Deconvolution of Single Channel Surface Electromyogram

Mathematical Biology and Physiology, Department of Electronic and Telecommunication, Politecnico di Torino, 10129 Turin, Italy
Electronics 2021, 10(16), 2022; https://doi.org/10.3390/electronics10162022
Submission received: 29 July 2021 / Revised: 13 August 2021 / Accepted: 18 August 2021 / Published: 21 August 2021

Abstract

:
Surface electromyogram (EMG) finds many applications in the non-invasive characterization of muscles. Extracting information on the control of motor units (MU) is difficult when using single channels, e.g., due to the low selectivity and large phase cancellations of MU action potentials (MUAPs). In this paper, we propose a new method to face this problem in the case of a single differential channel. The signal is approximated as a sum of convolutions of different kernels (adapted to the signal) and firing patterns, whose sum is the estimation of the cumulative MU firings. Three simulators were used for testing: muscles of parallel fibres with either two innervation zones (IZs, thus, with MUAPs of different phases) or one IZ and a model with fibres inclined with respect to the skin. Simulations were prepared for different fat thicknesses, distributions of conduction velocity, maximal firing rates, synchronizations of MU discharges, and variability of the inter-spike interval. The performances were measured in terms of cross-correlations of the estimated and simulated cumulative MU firings in the range of 0–50 Hz and compared with those of a state-of-the-art single-kernel algorithm. The median cross-correlations for multi-kernel/single-kernel approaches were 92.2%/82.4%, 98.1%/97.6%, and 95.0%/91.0% for the models with two IZs, one IZ (parallel fibres), and inclined fibres, respectively (all statistically significant differences, which were larger when the MUAP shapes were of greater difference).

1. Introduction

Different information on muscle activity can be collected with surface electromyograms (EMGs), e.g., concerning the muscle itself (peripheral properties) or its central control. Discriminating among peripheral and central myoelectric manifestations is very important, for example, in the investigation of fatigue [1]. Moreover, studying the central control strategy is important in many fields. Indeed, the control of motor units (MU) reflects training [2], fatigue [3], exerted force [4], and pathology [5].
Many important physiological problems can also be investigated by studying MU control, as common drive [6], muscle synergies [7], intra-muscle and inter-muscles coherence [8], corticomuscular synchronization [9]. Moreover, detailed information on MU recruitment allows improving the accuracy in many applications, such as in the estimation of the muscle force [10], contraction velocity [11], and joint angle [12] and in the control of a myoelectric prosthesis [13].
Different approaches have been attempted to extract information on MU firings. When only few EMG channels are available, the low frequency portion of the power spectral density (PSD, until about 40 Hz, i.e., the highest possible MU firing rate, FR) can be investigated [14], possibly after rectification [15]. However, the information is available only for low contraction levels [14], and the enhancement by non-linear processing, such as rectification, was questioned [16].
As an alternative, using high density acquisition systems, surface EMG can be decomposed into single MU contributions [17,18]. This approach provided important insights [19] but has some problems limiting its spreading: it requires a complicated detection system, it is computationally intensive, and only a portion of the EMG energy can be recovered.
Thus, focusing on single channel EMG is still important, as it is comfortable, easy to use, quick to apply, has little interference with movement, and requires a low cost in terms of memory storage and power consumption. Recently, methods have been proposed to extract information on MU activity by fast algorithms applied to simple low density recordings. One method is based on the separation of monopolar surface EMG into propagating and non-propagating components [20]. It employs a few electrodes aligned to the muscle fibres. The PSD of the non-propagating components reflects the average MU FRs in the low frequency range [21].
Another approach has been applied on a single differential (SD) channel (which is the most common acquisition modality in applied studies). It was successfully applied to simulated EMGs to extract the mean MU FR [22] and to experimental data to improve the myoelectric control [23]. It is based on a deconvolution procedure, which allows to approximate the recorded signal as the convolution of a prototype function (adapted to the signal) with an estimated firing pattern. The deconvolution problem is regularized (to enhance stability) and defined as a least L 1 error problem, obtaining a sparse solution [24], which resembles the cumulative firings of MUs.
Using a single SD channel, the method can be applied in many different applications. However, it has some limitations.
  • A single kernel is unlikely to be sufficient to represent a general EMG, including MUAPs corresponding to different conduction velocities (CV). Indeed, a widespread delay distribution is expected to be used to recover a MUAP with a larger support than the kernel (corresponding to a MU with a low muscle fibre CV), whereas, there will be problems in rebuilding MUAPs shorter than the kernel.
  • Problems are expected if there are more innervation zones (IZs) and MUAPs are propagating in different directions under the detection point so that the single SD channel records waves with opposite phases.
  • In ideal conditions, the deconvolution process would recover exactly the original data by convoluting the estimated cumulative firings with the selected kernel. As coherence is unaffected by filtering, it would be the same if applied to the original or the processed data. Thus, a generalization is needed to make the method applicable to important fields, such as intra- or inter-muscular coherence, overcoming the limitations of using the raw EMG.
These limitations ask for an improvement of the method. The purpose of the present work is thus to generalize it to include more kernels. This would allow to overcome the limitations of the previous method listed above. Indeed, a multi-kernel method could represent MUAPs with different durations (i.e., associated to different muscle fibre CVs) or corresponding to different directions of propagation. Moreover, the coherence of cumulative estimated firing patterns from two signals will be different from that of the raw data, possibly better reflecting the coupling between MU firings. In the following sections, the method is introduced, examples of applications are provided, and a comparison on simulated data with the single-kernel approach is provided.

2. Methods

2.1. Signal Processing

As in [22], the interference EMG was considered as the asynchronous summation of different MUAPs
s ( t ) = m = 1 N j = 1 J m M m ( t τ m j ) + n ( t )
where s ( t ) is the EMG, N is the number of active MUs, M m is the mth MUAP (each firing J m times in the considered epoch), τ m j is the jth time in which the mth MUAP fires, and n ( t ) is an additive noise. Notice that the signal is assumed to be stationary and, thus, MUAP variations (e.g., induced by fatigue) are neglected within the signal epoch.
Our interpretation model can be written in the following form
s ( t ) = n = 1 N M n ( t ) F n ( t ) + n ( t )
where ∗ indicates the convolution operator, and F n ( t ) = j = 1 J m δ ( t τ m j ) is the firing pattern of the mth MUAP.
In [22], a single kernel was used to approximate the waveforms of different MUAPs. On the other hand, multiple kernels are used here to fit the data
s ˜ ( t ) = i = 1 N K K i ( t ) f i ( t ) + p ( t )
where K i ( t ) is the ith kernel, f i ( t ) the corresponding estimated firing pattern and p ( t ) a perturbation, representing all approximation errors, due to noise and to the limited number N K of kernels used. Indeed, only few kernels can be included, as the problem is under-determined, and its complexity grows as the number of unknowns (kernels and firing patterns) increases.
The kernels were written as first derivatives of Gaussian functions, as this shape resembles that of MUAPs recorded in SD configuration. Three different tests were considered in the following, corresponding to two choices of kernel waveforms.
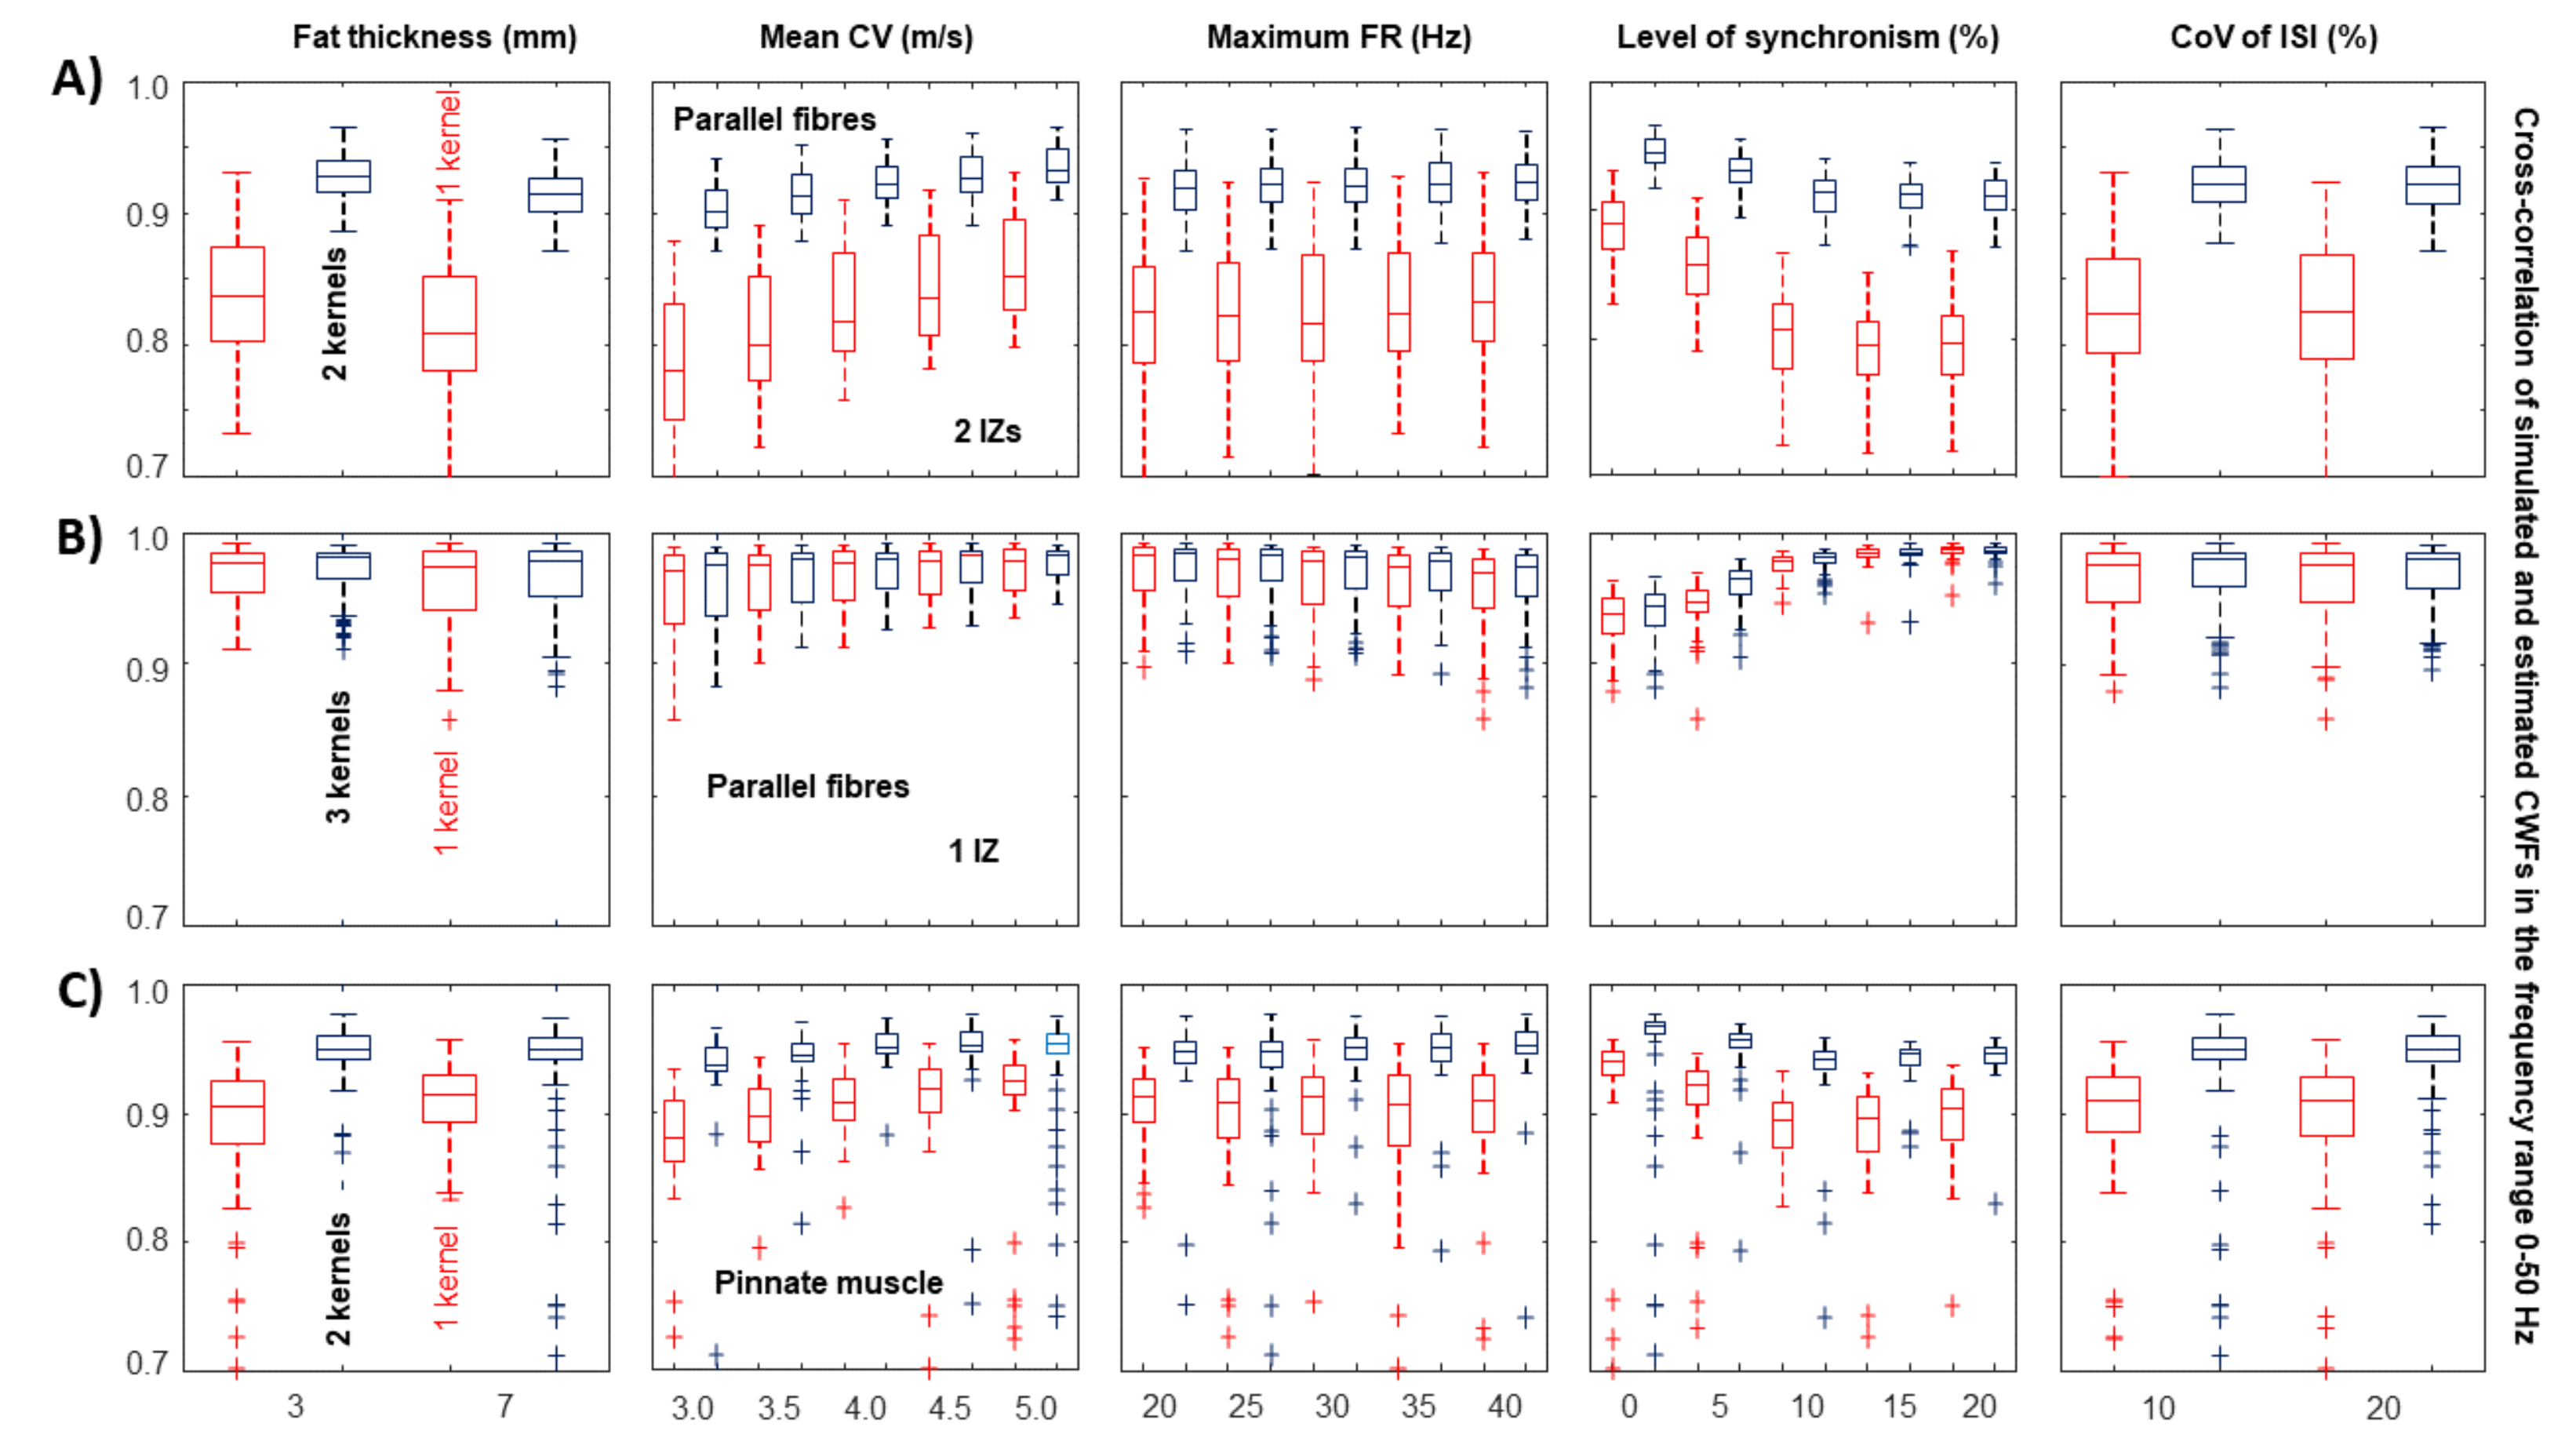
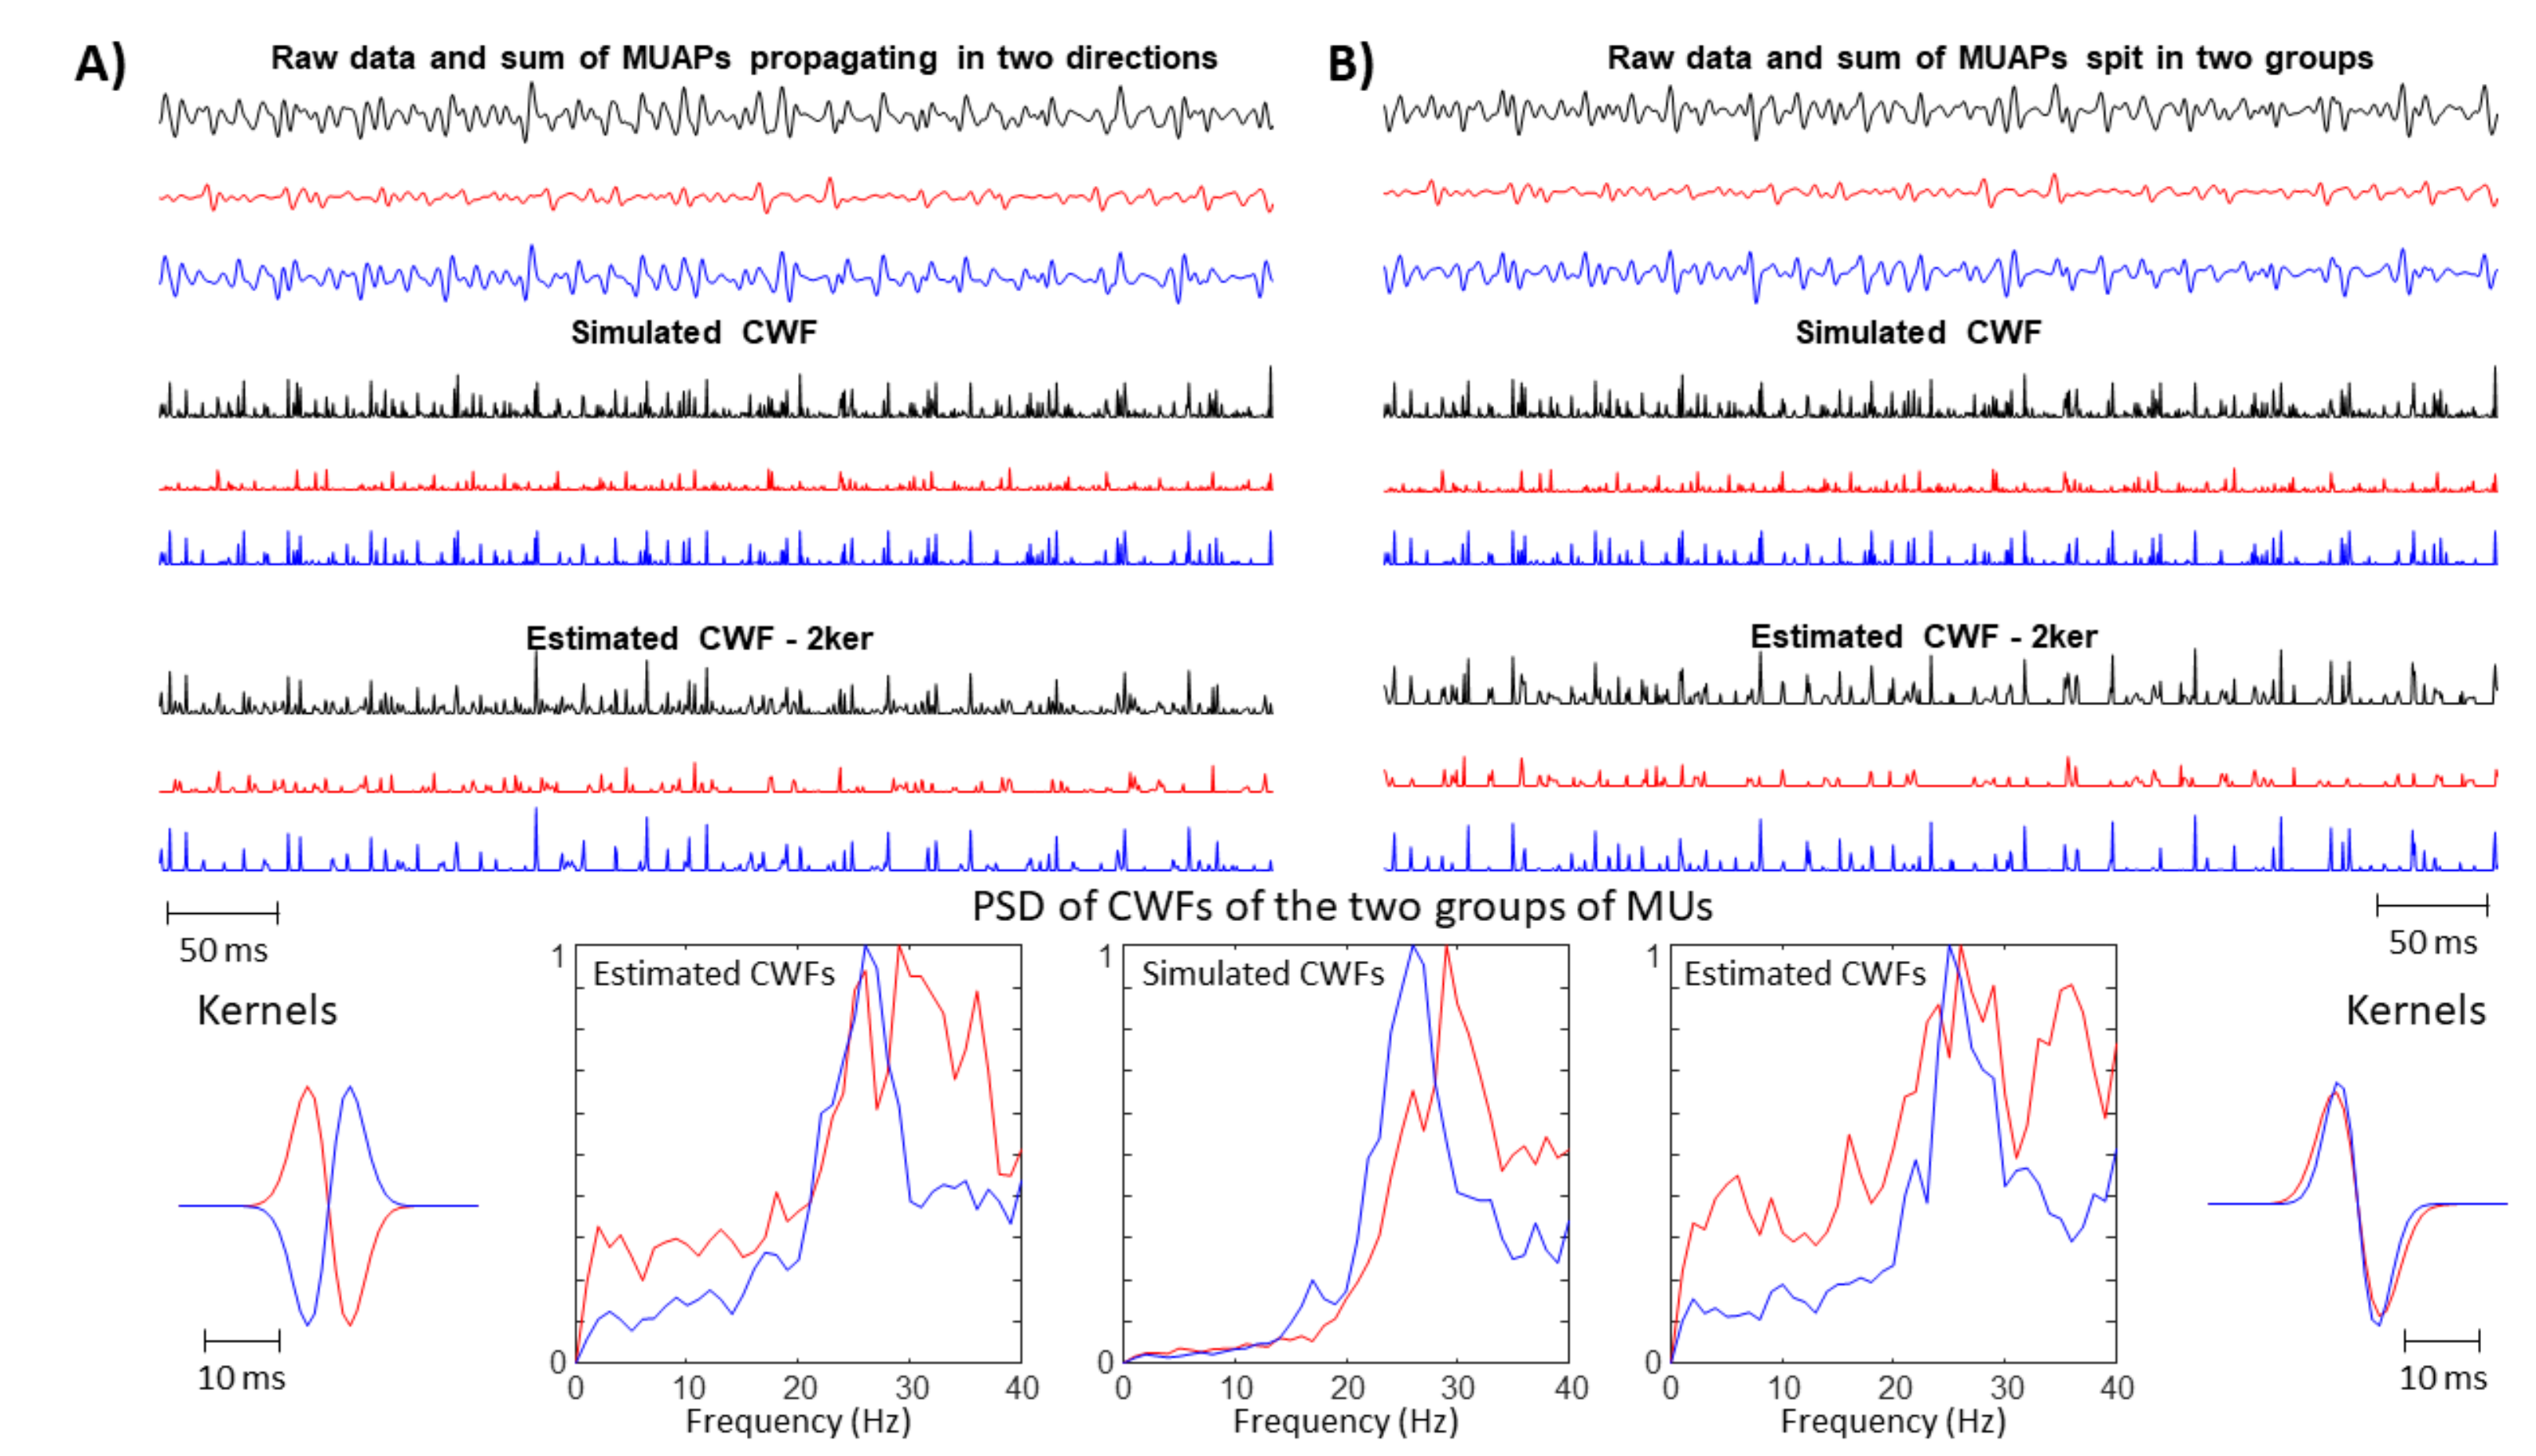
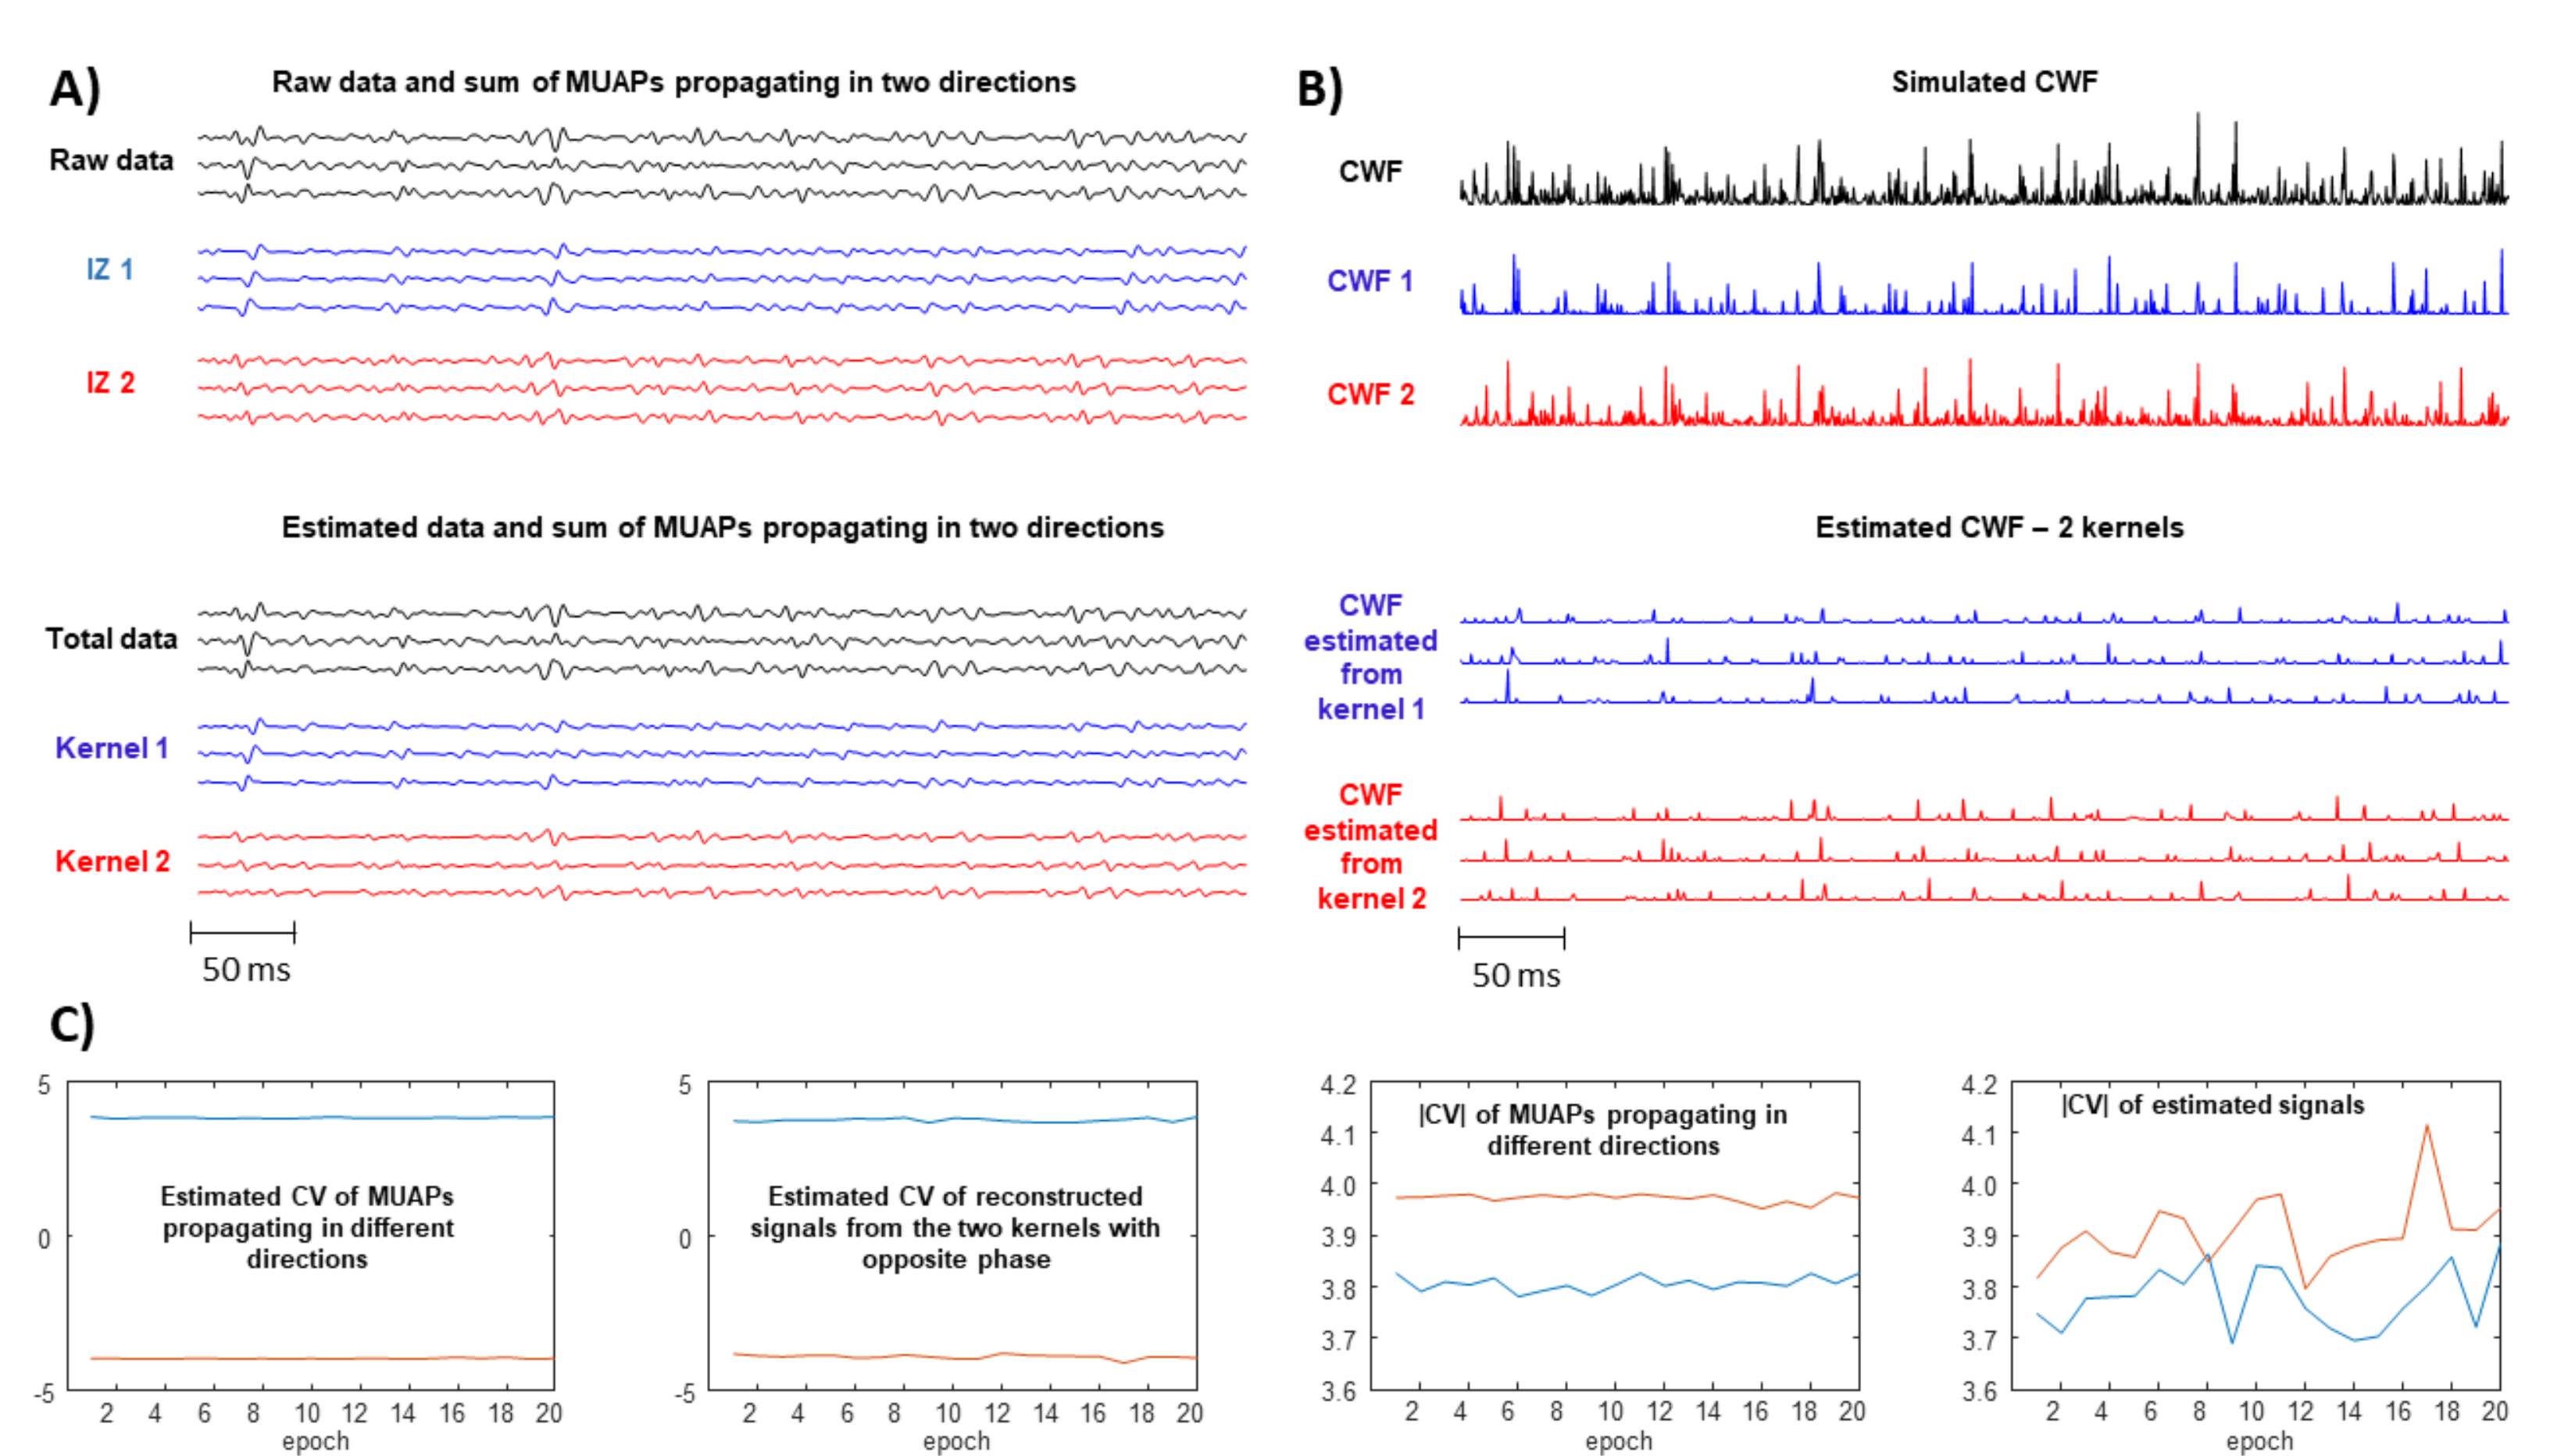
  • A large spread of IZs was assumed, so that MUAPs could propagate under the electrodes in two opposite directions. This happens in many different conditions, e.g., in sphincter muscles [25], in the case of fibre pinnation or, in general, when the distribution of IZs is not perpendicular to the fibre direction [26]. As a consequence, waveforms with opposite phases are recorded by the considered SD channel. In such a case, two kernels were considered, with the same PSD resembling that of the original data but with opposite phase. Specifically, the PSD of the first derivative of a Gaussian function is -4.6cm0cm
    G ˙ ( t ) = d d t e t 2 2 σ 2 2 π σ 2 F [ G ˙ ( t ) ] = j 2 π f e 2 π 2 f 2 σ 2 P S D = | F [ G ˙ ( t ) ] | 2 = 4 π 2 f 2 e 4 π 2 f 2 σ 2
    where F indicates the Fourier transform. In order to estimate the variance σ 2 , the following 1D curve can be studied
    Γ ( t ) = f 2 , log P S D 4 π 2 f 2 = ( f 2 , 4 π 2 f 2 σ 2 )
    It is clear that σ 2 can be estimated by the slope of this curve divided by 4 π 2 . This procedure was applied to the PSD of the EMG, which is more complicated than the above expression, as different waveforms are summed, none of them are exactly obtained as a derivative of a Gaussian function, and noise is present. Thus, the PSD of the EMG was considered in a frequency range in which most of the power is found, i.e., in ( F M e d F s t d , F M e d + 2 F s t d ), where F M e d is the median frequency and F s t d the standard deviation of the PSD (preliminary tests showed that this range provided stable results). Curve (5) was approximated by a straight line within this range and its slope was used to estimate σ 2 . As detailed below, two different simulators were used to test this condition: a model with parallel fibres [27] and two different IZs and a simulator of pinnate muscle with fibres inclined with respect to the skin surface [28,29].
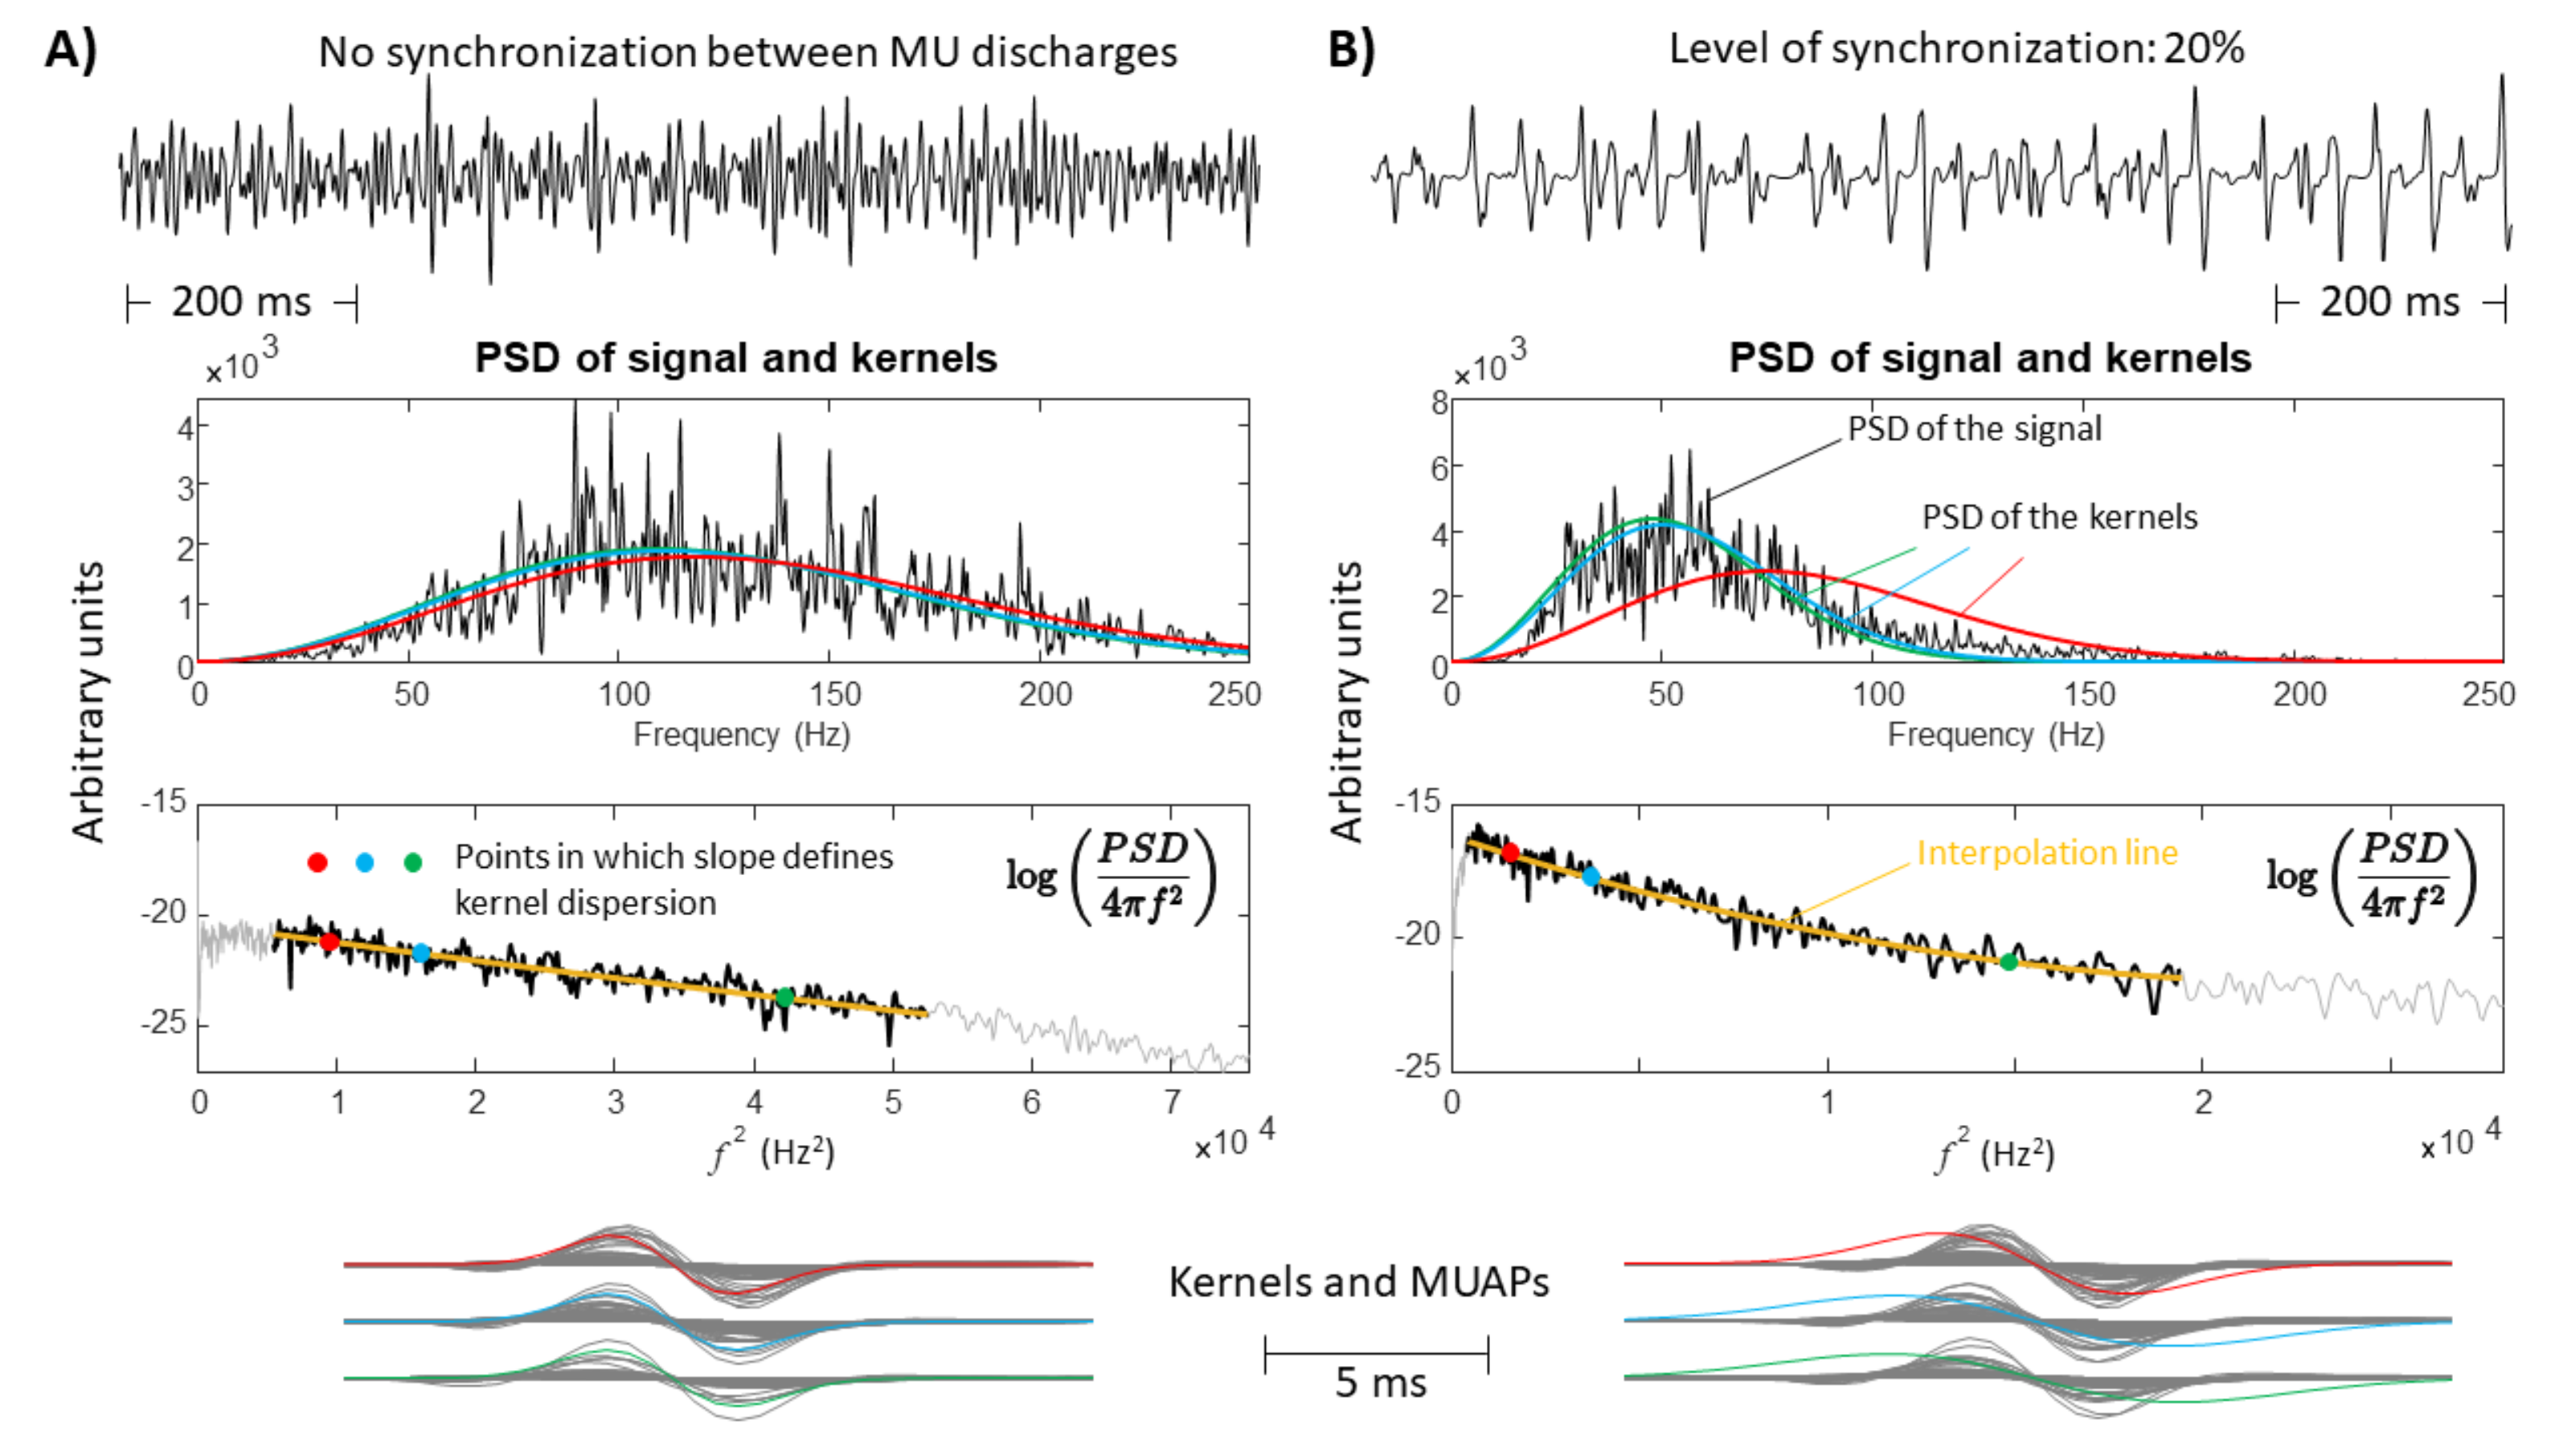
  • A single direction of propagation was assumed, such as when electrodes are placed beyond the last IZ over a muscle with parallel fibre architecture. As MUAPs are generated by MUs with different CVs, the PSD of the EMG sometimes provides a curve (5) that is not well approximated by a straight line. The curve was then fit by a parabola, and its slopes in the 15th, 50th, and 85th percentile of the frequency range mentioned above were used to estimate the variances of three kernels. Those kernels ideally reflect MUAP prototypes of MUs with small, medium, and large values of CV. This way, the proposed method for the selection of the kernels adapts to the signal. Eventually, the method can come back to the single kernel case in the limit in which the curve (5) is linear, so that the three kernels are identical.
Given the kernels, the corresponding firing patterns were estimated, by deconvolution, which is an unstable inverse problem, calling for regularization. The Tikhonov approach was considered [30]
a r g m i n f i ^ ( t ) s ( t ) i = 1 N K K i ( t ) f ^ ( t ) 2 2 + α f ^ ( t ) 2 2
where α is the regularization parameter chosen as detailed below. The problem was discretized as in [22,31], writing convolution as the multiplication of the unknown firing patterns with a matrix. Specifically, A X b , where A is the matrix collecting the samples of the kernel, b = { b i } = { s ( t i ) } is the vector of recorded data samples, and X is the unknown MU firings. Here, as more kernels are considered, the matrices discretizing the convolution with each of them were collected in blocks, and the unknowns were placed in a single vector as follows -4.6cm0cm
A = K 1 K 2 = K 1 [ 1 ] 0 0 K 2 [ 1 ] 0 0 K 1 [ 2 ] K 1 [ 1 ] K 2 [ 2 ] K 2 [ 1 ] 0 0 K 1 [ M ] K 1 [ 2 ] K 1 [ 1 ] K 2 [ M ] K 2 [ 2 ] K 2 [ 1 ] X = f 1 ( t ) f 2 ( t )
where the case of two kernels is considered.
The functional to be optimized in (6) can now be written as
A X b 2 + α X 2 = A α I X b 0 2 = B X c 2
where
B = A α I , c = b 0
The solution of the regularized problem can be obtained analytically as
X = ( B T B ) 1 B T b = ( A T A + α I ) 1 A T b
The regularization parameter α was chosen as the 1% of the maximum eigenvalue of A T A , so that the condition number of the matrix A T A + α I to be inverted in Equation (10) is not higher than 100. As noticed in [22], the mean squared error is affected by outliers and is overly tolerant to small values. Using the L 1 instead of the L 2 norm, the solution becomes more stable to outliers and sparse values [32] resembling a firing pattern. The iterative reweighted least squares (IRLS) method was used to solve the L 1 problem [30], using 10 iterations. Thus, the following error functional was minimized
A α I x b 0 L 1 = W T · A α I x b 0 2
where W is a vector of weights that should be equal to the reciprocal of the square root of the L 1 error. For each iteration, such weights were defined based on the last solution available and used to compute the new one. For each iteration, the solution was also imposed to be positive, by putting its negative values to zero.

2.2. Test Data

Two different simulation models were used to generate test EMG data: a cylindrical volume conductor [27] and a model of pinnate muscle with fibres inclined with respect to the skin surface [28]. The two volume conductors were used to simulate single fibre action potentials (SFAP).
Considering the cylindrical simulation model, data were generated as in [20,21,22]: fat layer thickness of either 3 or 7 mm, symmetrical fibres with average semi-length of 60 mm, spread of IZ and tendons equal to 10 mm, and sample frequency of 2048 Hz. MUAPs were built as sum of SFAPs of the closest fibres (simulated with density of 20/mm 2 ) to their centres, randomly chosen within the muscle (400 MUAPs were generated). To simulate MUAPs with different directions of propagation, half of the SD MUAPs were reversed (i.e., multiplied by −1).
Except for the representative tests detailed below, MUs were listed in size order, and those corresponding to even numbers were phase reversed. Imposing a phase reversal is like assuming that two IZs were present in mirror positions with respect to the detection point. Some representative tests were performed considering three SD channels aligned to the muscle fibres to test the possibility of discriminating the two directions of propagation and computing muscle fibre CV. Moreover, representative simulations were considered in which the smallest and largest MUs were innervated under different IZs: this way, their average FRs and CVs were different and the sensitivity of the algorithm to these differences could be tested.
Concerning the pinnate muscle, the same simulator as in [29] was considered, with a sampling frequency of 2 kHz, pinnation angle of 25 , fat layer thickness of either 3 or 7 mm, symmetrical fibres with an average semi-length of 25 mm, spread of IZ and tendons of 5 mm approximately simulated by smoothing the SFAPs, which were then multiplied by the MU sizes to generate the MUAPs. SFAPs (and hence also MUAPs) were generated shifting by steps of 2 mm a single simulated fibre in the longitudinal and transverse directions (with ranges of ±30 mm and ±12 mm, respectively, obtaining 403 SFAPs).
For all considered simulation models, MU CVs had Gaussian distribution with standard deviation 0.3 m/s and a mean value in the range 3–5 m/s (with steps of 0.5 m/s).
MU recruitment was described as in [33], simulating force levels of different maximal voluntary contraction (MVC; for most tests, 80% of MVC was considered). The FR distribution provided by the simulator was linearly mapped into the range [FR m i n , FR m a x ], where FR m a x was chosen in the range 20–40 Hz (with step 5 Hz) and FR m i n = 5 Hz + 0.25 FR m a x . The inter-spike interval (ISI) was randomly varied with the coefficient of variation (CoV) either 10% or 20% in different simulations. Finally, different levels of synchronization of MU discharges were simulated as in [1], with the percentage of firings synchronized in each MU train and, for each synchronization event, assumed to be equal and varied within 0 and 20% (with steps of 5%) in different sets of simulations.
A representative test on coherence was also considered: in such a case, half of the MUAPs (randomly chosen) were used to generate the EMG from a muscle and the others to simulate the EMG recorded over a second muscle. The synchronization of MU discharges was used to obtain coherent firings.
Stationary interference signals lasting 10 s were simulated and then detected by a single SD channel with an inter-electrode distance of 10 mm and the first electrode at 15 mm from the IZ. As exceptions to this default simulation, for the tests on CV, three SD channels aligned to the muscle fibres were considered (instead of a single SD channel), placing the other two electrodes at 35 and 45 mm from the IZ; moreover, for the representative tests on inter-muscular coherence, one SD channel was placed on each of the two considered muscles.

2.3. Assessment of Performance

The aim of the proposed algorithm is to estimate the cumulative weighted firings (CWF) of the simulated MUs. Specifically, the CWF is defined as the sum of MU firing trains weighted by the root mean square amplitudes of the corresponding MUAPs [22], thus, accounting for the detection volume of the considered SD channel.
The new algorithm was compared to the one including a single kernel [22] in terms of the accuracy in measuring the low frequency content of the simulated CWF. Indeed, the high frequency portion of the estimations is only related to how spiky they are, whereas the low frequency range reflects the average FRs of different MUs [21,22]. The cross-correlation was computed between the simulated and estimated CWF time series, low pass filtered at 50 Hz (Chebyshev type II filter, with a 1 dB ripple in the pass-band and 20 dB of minimum attenuation in the stop-band, starting at 55 Hz)
C C = S C W F ( t ) , E C W F ( t ) S C W F ( t ) , S C W F ( t ) E C W F ( t ) , E C W F ( t )
where · , · indicates the scalar product and S C W F ( t ) , and E C W F ( t ) are the filtered simulated and estimated CWF, respectively. For each method (either single or multi-kernel), the dataset included 500 estimations, i.e., obtained considering simulated data from the combination of two fat thicknesses, five means of MU CV distributions, five maximal MU FRs, five levels of synchronization between MU discharges, and two CoVs of ISI.
As the Kolmogorov–Smirnov and Lilliefors tests excluded the null hypothesis that the distributions of cross-correlations were Gaussian (as expected), non parametric statistics was applied to explore possible statistical differences in performances. Specifically, Wilcoxon rank sum and signed rank tests were used (considering data as either not-paired or paired, respectively) to test couples of distributions by fixing a parameter and pooling data with respect to the others. Significance was set with a p value lower than 0.05.
Additional representative examples of applications are provided, focusing on outputs that only the new algorithm can provide: discrimination of MUAPs propagating in different directions to estimate their CWFs or global CVs; inter-muscular coherence, for which the coherence of the simulated CWFs was the reference.

3. Results

Figure 1 shows two examples of applications. The same simulator with cylindrical volume conductor was used for two cases, considering a muscle with 100 MUs, obtained undersampling by a factor of 4 for the simulated MUAPs used for the following tests. A series of MU discharges were generated and were used to simulate two different EMGs by either using the simulated MUAPs or inverting the phase of the last 25% of them (the latter case simulating a muscle with two different IZs). In Figure 1A, a muscle with two IZs is considered. The overall signal and the two separated contributions (each including only MUAPs with same phase) are shown on top.
The signal was reconstructed using two kernels with opposite phase: their time scale was chosen to fit the PSD of the signal (as explained in the Methods section). The simulated and estimated CWFs are then provided: larger MUs were innervated under the second IZ and had, on average, a lower FR with respect to smaller MUs. This is reflected by the low frequency peaks of the PSDs of CWFs (at the bottom of the Figure, both simulated and estimated).
In Figure 1B, the same condition is studied: the only difference is that all MUAPs have the same phase (as a single IZ is considered). The EMG was approximated using again two kernels, which are first derivatives of Gaussian functions with different time scales: they were obtained by scaling, by factors 0.9 and 1.1, the kernel with the PSD best fitting that of the data. Those kernels should fit the behaviour of MUs with different CVs (with the first/second kernel resembling those with lower/larger CVs).
Small MUs have lower CVs and fires at higher frequencies. The overall signal is shown on top, together with two separated contributions provided by the sum of the first 75% and last 25% of MUAPs (in practice, it is the same signal as in Figure 1A, but with the second contribution with different sign). The simulated and estimated CWF are then shown, both in time and frequency domain.
Figure 2 shows the estimation of the three kernels in the case of different signals from a simulated muscle with cylindrical volume conductor and a single IZ. The kernels are defined as derivatives of Gaussian functions with the standard deviations defined as slopes of a second order polynomial interpolating log P S D 4 π 2 f 2 versus f 2 , determined on specific points (as explained in the Methods section). Notice that, in the case of high level of synchronization of MU discharges, the PSD had low frequency contributions and also the kernels. Specifically, two estimated kernels were much smoother than MUAPs to fit large low frequency spikes that are generated in the signal by the superimposition of synchronized MUAPs; the third kernel includes spectral contributions of larger frequency (which is useful to fit not synchronized MUAPs).
Figure 3 shows the possibility to discriminate between signals propagating in different directions by using deconvolution with kernels with opposite phase. Small MUs were simulated as innervated under one IZ, whereas the large ones were innervated under a second IZ. Three SD channels aligned to muscle fibres were considered. The method approximately reconstructed the two components by deconvolving the channels using kernels with opposite phase (thus without integrating information from different channels to discriminate the two directions of propagation). Positive and negative values of CV were obtained respectively for the two reconstructed components, obtained by convolution of the estimated CWFs with the corresponding kernels. Moreover, the absolute value of the estimated CV was larger for the signal corresponding to larger MUs.
Figure 4 considers the estimation of coherence. Two EMGs were simulated, produced by two separate muscles, constituted by different MUs chosen by randomly selecting MUAPs generated by the three models (muscle with two IZs, with one IZ and pinnate muscle with fibres inclined with respect to the skin surface). Coherent behaviour was obtained by introducing a 10% synchronization between MU discharges. Estimating the coherence using the raw signal is not possible when the muscles have more IZs or the fibres are pinnated, whereas deconvolution shows some coherency also in those cases.
Figure 5 shows the results of the overall tests obtained considering different simulation parameters. EMGs of 10 s duration were generated by the three simulation models with a force level of 80% and processed by either the single-kernel or the multi-kernel method. The performance parameter is the cross-correlation between simulated and estimated CWF. The distributions of the correlation coefficients obtained when using either the single- or the multi-kernel approach are compared. Considering the entire datasets for the three simulation models, i.e., with two IZs, 1 IZ (parallel fibres) and inclined fibres, the mean/median cross-correlations for the single-kernel approach were 82.5%/82.4%, 96.5%/97.6%, and 85.8%/91.0%, respectively. In the case of the multi-kernel method, the performances increased to 92.1%/92.2%, 97.0%/98.1%, and 93.0%/95.2%, respectively. The differences were highly statistically significant for all simulation models (both considering the data as paired or not). They were larger when the MUAP shapes were more different. On the other hand, in the case of parallel fibres and 1 IZ, even the single-kernel method showed very high performances, and the improvement by the multi-kernel approach was lower.
Splitting the results by fixing specific simulated conditions (i.e., pooling all simulations with a fixed value of either fat layer thickness, or mean CV, or maximum FR, or synchronization, or CoV of ISI), the effect of a single simulation parameter can be studied. In the cases of MUAPs propagating in two directions (Figure 5A) and pinnate muscle (Figure 5C), the multi-kernel method provided a statistically significant improvement in all cases, both considering data as not-paired and paired (with all negligible p values, lower than 10 10 ).
In the case of simulated muscle with parallel fibres and a single IZ (Figure 5B), the performances were larger than when using the other two simulators, with correlation coefficients close to 1 for both methods (including one or three kernels, respectively). However, the multi-kernel method showed average superior performances than those of the single-kernel one also in this case. Statistical significance was always obtained considering data as paired, with the exception of the case in which the synchronization level was 20%. Moreover, there were statistically different performances even when considering data as not paired, but only in the following cases: fat layer thickness of 7 mm, level of synchronization up to 10%, and CoV of ISI equal to 20%.

4. Discussion

The large pick-up volume of surface EMG allows to detect more information than using intramuscular sensors; however, disentangling the recruitment strategy of MUs is more difficult [34], e.g., due to the lower selectivity [35], possible cross-talk [36], the smoothing effect of the volume conductor [37,38], and the large phase cancellations [39].
High density surface EMG can recover information on MU recruitment [18,19], but the recording system is cumbersome, and data storing and processing are intensive. As a result, few EMG channels are preferred in many applied fields, such as sport [40], gait analysis [41], ergonomic assessments [42], diagnosis [31,43], myoelectric control [44]. It is then important to be able to extract more information from single channel recordings, going beyond basic analysis, such as the estimation of activity intervals or amplitude and spectral indexes.
Any information that could be of great interest is indeed related to the timings of MU discharges. In this paper, previous results in this direction are deepened. Specifically, in a previous work [22], a single channel EMG was recovered as the convolution of a kernel (adapted to the signal) and a firing pattern, ideally approximating the cumulative firings of active MUs. This approach has been generalized here to include more kernels. This can be useful when the MUAPs summed in the recorded EMG are very different from each other, and a single kernel cannot represent them accurately.
Different MUAP shapes are found when complicated volume conductors are under study, such as in the case of pinnate muscles with fibres inclined with respect to the skin surface [29]. Waveforms with different polarities can be observed, depending on the relative position of the SD channel and the MUs. MUAPs with opposite phases are also obtained when different IZs are present [26]. Moreover, different MUAPs are observed when there is a large spread of CVs (determining different durations of the MUAPs).
The waveforms are also affected by the degree of synchronization of MU firings: indeed, synchronized discharges determine superimposed MUAPs, resulting in waveforms with large amplitude; moreover, a small jitter between synchronized firings makes the compound wave-shape smooth, thus, including large contributions of low frequency components (very different from MUAP shapes recorded during discharges, which are not synchronized with others).
The proposed method estimates the kernels on the basis of the signal. In the case of different directions of MUAP propagation (i.e., more IZs or pinnate muscle), a single kernel was chosen to fit the PSD of the data and it was selected together with a second one with opposite phase. On the other hand, when a muscle with parallel fibres and a single IZ was considered (so that small differences in MUAP shapes were determined only by different CVs and positions of the MUs), kernels with different time scales were selected, again based on the PSD of the signal (as shown in Figure 2).
Notice that, if the spread of MU CVs is small, the kernels are all similar. On the other hand, the estimated kernels can be different when many MUAPs are asynchronously summed in the EMG, with high contraction levels, large range of CVs and low volume conductor filtering effect (e.g., a small thickness of the subcutaneous tissue). They were quite different also when high levels of MU synchronization were simulated, as many MUAPs were superimposed and the PSD was pushed toward lower frequency ranges: superimposed MUAPs provided smooth waveforms approximated by low frequency kernels, whereas the other MUAPs (asynchronously summed) were approximated by another kernel with higher frequency contributions (Figure 2B).
This approach allowed to obtain a statistically significant improvement of performance in estimating the simulated cumulative firings with respect to the single-kernel method (see Figure 5). Clearly, the greater the differences between MUAP shapes (e.g., with pinnate muscles or MUAPs with different phases), the larger the improvements are when using the multi-kernel approach instead of the single-kernel. However, significant improvements were found even when considering a muscle with parallel fibres and a single IZ, for which the SD MUAP shapes were quite similar. In a representative example (shown in Figure 1), the sharper kernel (representing faster MUs) showed a deconvolution signal with PSD with a peak at a lower frequency than that associated to the smoother kernel (approximating slow MUs): this proves some sensitivity to the simulated behaviour of different groups of MUs, approximated by the different kernels. However, more stable information can be obtained when MUAP shapes are more different: in Figure 3, MUs were split into two groups (of small and large MUs, respectively), with different IZs, and the algorithm was able to separate the two groups so that, considering different channels aligned to the fibres, a reliable estimation of their CVs could be obtained (i.e., with different signs for the two groups and with larger absolute value for the group with larger MUs (This should not be considered an efficient method for this application, as it would be better to integrate the information from different channels. However, the reliable results indicate the plausibility of the estimations on each channel)).
Consider also that alternative methods to optimally select the kernels can be proposed to adapt to specific applications. For example, different MUAPs could be decomposed (e.g., considering preliminary detections at low force levels and an algorithm for spike identification) and used as kernels.
The results suggest that the proposed deconvolution approach can in part compensate for different waveforms, possibly supporting a reliable estimation of muscular coherence. Figure 4 shows some representative examples, in which the same MU firings were simulated and used to generate different EMGs from two muscles, using MUAPs obtained by the three volume conductor models employed for the tests (parallel fibres with two and one IZs and pinnate muscle). The coherence in the simulated CWFs could be fairly estimated using the raw EMGs only in the case of parallel fibres including a single IZ. On the other hand, when considering MUAPs with different phases (i.e., when using either the model with two IZs or with pinnate fibres) no coherence among the raw EMGs was found, whereas deconvoluted data indicated some coherent behaviour even in those cases. MUAPs with different phases have been also simulated in [45], obtaining similar results; rectification was suggested in that case to recover some information on muscular coherence. Rectification could improve the estimation of coherence also using the simulated data shown here, but with lower performances than when using deconvolution. Indeed, deconvolution showed in the 0–100 Hz range a median coherence that was the 93% and the 54% higher than those obtained from the signals in Figure 4 after rectification, for the cases of two IZs and pinnate muscle, respectively. This indicates that, in those cases, it was important to compensate for phase cancellations and MUAP shapes beyond simply removing phase differences by rectification.
The proposed method has some limitations, mainly due to model approximations, the general instability of the inverse problem, poor recorded information, and the computational cost.
Specifically, the EMG is the asynchronous sum of different MUAPs that have different shapes due to the specific volume conductor (which could include inhomogeneities [46,47,48], different fibre directions [28,49,50], etc.) and the relative location with respect to the detection channel (which reflects into a different contribution of propagating and non-propagating components [20]). Representing the sum of MUAPs with different shapes with a few kernels introduces a model approximation that will reflect into mistakes in the estimation of MU firings.
A second limitation mentioned above is intrinsic to all inverse problems, whose solution is unstable. This is due to the direction of the problem to be solved, which is inverse with respect to causality: from the effect (i.e., the EMG data), the cause is estimated (i.e., the MU firings), by a single channel blind separation of the different sources, without knowing neither the kernel waveforms nor the timings of discharges. Very different solutions could provide a similar fit of the data, calling for a regularization, which introduces some a-priori information on the solution. Tikhonov regularization was chosen, which imposes a small energy, thus requiring to limit the phase cancellations. Then, as MU discharges are sparse, the L 1 norm was used (instead of the popular L 2 ) to define the optimization problem to be solved (as already proposed in [22]).
Moreover, limitations are imposed by the poor information that is recorded. Indeed, a single SD channel has a limited pick-up volume, so that only a portion of the muscle can be explored, with MUs closer to the detection point largely affecting the EMG. Moreover, important phase cancellations are expected, mainly with large effort levels [39]. Furthermore, considering a single channel, it is not easy to discriminate MUAPs propagating with different CVs or in different directions, especially when the interference is important, as in the case of large force levels. It is then difficult to provide a stable discrimination of the behaviors of different MUs (unless the MUAP shapes are very different or the force level is small, so that phase cancellation is limited). For example, sharpness of MUAPs is affected both by MUs CV and depth within the muscle, so that MUs with different types could be even approximated by the same kernel, impeding their discrimination.
Finally, the multi-kernel method has a larger computational cost than the single-kernel approach. Indeed, the dimension of the matrix to be pseudo-inverted increases when more kernels are included. Preliminary tests indicated that, when using two and three kernels, the computation time was, respectively, 3.6- and 7.6-times larger than when using a single kernel. This impedes the real time application with the present implementation (interpreted code in Matlab, data sampled at 2 kHz); however, by down-sampling the data to 1 kHz (as suggested in [22]) and using a compiled implementation, the computational time could be greatly decreased.

5. Conclusions and Further Work

An innovative method is introduced, extending a previous algorithm to estimate the cumulative firings of MUs from a single EMG recorded in SD configuration. As for the previous method, it deconvolves the surface EMG to estimate the cumulative MU firings; however, it uses multiple kernels fit to the data, instead of a single one. The new method outperformed the single-kernel approach in estimating simulated cumulative firings. Moreover, it extends the possible applications to cases in which a single kernel cannot approximate the different MUAPs, as when they have opposite phases or shapes that are greatly different.
Validation in experiments is needed. Future applications are expected in many conditions in which the study of MU control is of interest but high-density recording systems are not used.

Funding

This research received no external funding.

Conflicts of Interest

The author declares no conflict of interest.

Abbreviations

The following abbreviations are used in this manuscript:
CoVCoefficient of Variation
CVConduction Velocity
CWFCumulative Weighted Firings
EMGElectroMyoGram
FRFiring Rate
ISIInter-Spike Interval
MVCMaximal Voluntary Contraction
SDSingle Differential

References

  1. Mesin, L.; Dardanello, D.; Rainoldi, A.; Boccia, G. Motor unit firing rates and synchronisation affect the fractal dimension of simulated surface electromyogram during isometric/isotonic contraction of vastus lateralis muscle. Med. Eng. Phys. 2016, 38, 1530–1533. [Google Scholar] [CrossRef] [Green Version]
  2. Herda, T.J.; Siedlik, J.A.; Trevino, M.A.; Cooper, M.A.; Weir, J.P. Motor unit control strategies of endurance- versus resistance-trained individuals. Muscle Nerve 2015, 52, 832–843. [Google Scholar] [CrossRef]
  3. Contessa, P.; Adam, A.; De Luca, C.J. Motor unit control and force fluctuation during fatigue. J. Appl. Physiol. 2009, 107, 235–243. [Google Scholar] [CrossRef] [PubMed] [Green Version]
  4. Basmajian, J.; De Luca, C.J. Muscles Alive: Their Function Revealed by Electromyography, 5th ed.; Williams and Wilkins: Baltimore, MD, USA, 1985. [Google Scholar]
  5. Hu, X.; Suresh, A.K.; Rymer, W.Z.; Suresh, N.L. Altered motor unit discharge patterns in paretic muscles of stroke survivors assessed using surface electromyography. J. Neural Eng. 2016, 13, 046025. [Google Scholar] [CrossRef] [PubMed]
  6. De Luca, C.J.; Erim, Z. Common drive of motor units in regulation of muscle force. Trends Neurosci. 1994, 17, 299–305. [Google Scholar] [CrossRef]
  7. De Luca, C.J.; Erim, Z. Common drive in motor units of a synergistic muscle pair. J. Neurophysiol. 2002, 87, 2200–2204. [Google Scholar] [CrossRef] [PubMed] [Green Version]
  8. Baker, S.N.; Kilner, J.M.; Pinches, E.M.; Lemon, R.N. The role of synchrony and oscillations in the motor output. Exp. Brain Res. 1999, 128, 109–117. [Google Scholar] [CrossRef]
  9. Conway, B.A.; Halliday, D.M.; Farmer, S.F.; Shahani, U.; Maas, P.; Weir, A.I.; Rosenberg, J.R. Synchronization between motor cortex and spinal motoneuronal pool during the performance of a maintained motor task in man. J. Physiol. 1995, 489 Pt 3, 917–924. [Google Scholar] [CrossRef] [PubMed]
  10. Zhang, X.; Zhu, G.; Chen, M.; Chen, X.; Chen, X.; Zhou, P. Muscle Force Estimation Based on Neural Drive Information From Individual Motor Units. IEEE Trans. Neural Syst. Rehab. Eng. 2020, 28, 3148–3157. [Google Scholar] [CrossRef]
  11. Vecchio, A.; Negro, F.; Holobar, A.; Casolo, A.; Folland, J.P.; Felici, F.; Farina, D. You are as fast as your motor neurons: Speed of recruitment and maximal discharge of motor neurons determine the maximal rate of force development in humans. J. Physiol. 2019, 597, 2445–2456. [Google Scholar] [CrossRef] [Green Version]
  12. Dai, C.; Hu, X. Finger Joint Angle Estimation Based on Motoneuron Discharge Activities. IEEE J. Biomed. Health Inform. 2020, 24, 760–767. [Google Scholar] [CrossRef]
  13. Chen, C.; Yu, Y.; Sheng, X.; Farina, D.; Zhu, X. Simultaneous and proportional control of wrist and hand movements by decoding motor unit discharges in real time. J. Neural Eng. 2021, 18, 056010. [Google Scholar] [CrossRef] [PubMed]
  14. Van Boxtel, A.; Schomaker, L.R. Motor unit firing rate during static contraction indicated by the surface EMG power spectrum. IEEE Trans. Biomed. Eng. 1983, 30, 601–609. [Google Scholar] [CrossRef]
  15. Myers, L.J.; Lowery, M.; O’Malley, M.; Vaughan, C.L.; Heneghan, C.; St Clair Gibson, A.; Harley, Y.X.; Sreenivasan, R. Rectification and non-linear pre-processing of EMG signals for cortico-muscular analysis. J. Neurosci. Methods 2003, 124, 157–165. [Google Scholar] [CrossRef]
  16. Neto, O.P.; Christou, E.A. Rectification of the EMG signal impairs the identification of oscillatory input to the muscle. J. Neurophysiol. 2010, 103, 1093–1103. [Google Scholar] [CrossRef] [PubMed] [Green Version]
  17. De Luca, C.J.; Adam, A.; Wotiz, R.; Gilmore, L.D.; Nawab, S.H. Decomposition of surface EMG signals. J. Neurophysiol. 2006, 96, 1646–1657. [Google Scholar] [CrossRef] [PubMed]
  18. Holobar, A.; Zazula, D. Multichannel blind source separation using convolution kernel compensation. IEEE Trans. Sig. Proc. 2007, 55, 4487–4496. [Google Scholar] [CrossRef]
  19. Farina, D.; Merletti, R.; Enoka, R.M. The extraction of neural strategies from the surface EMG: An update. J. Appl. Physiol. 2014, 117, 1215–1230. [Google Scholar] [CrossRef] [Green Version]
  20. Mesin, L. Separation of interference surface electromyogram into propagating and non-propagating components. Biomed. Signal Process. Control 2019, 52, 238–247. [Google Scholar] [CrossRef]
  21. Mesin, L. Non-propagating components of surface electromyogram reflect motor unit firing rates. IEEE Access 2019, 7, 106155–106161. [Google Scholar] [CrossRef]
  22. Mesin, L. Single channel surface electromyogram deconvolution to explore motor unit discharges. Med. Biol. Eng. Comput. 2019, 57, 2045–2054. [Google Scholar] [CrossRef] [PubMed]
  23. Bourges, M.; Naik, G.R.; Mesin, L. Single channel surface electromyogram deconvolution is a useful pre-processing for myoelectric control. IEEE Trans. Biomed. Eng. 2021. submitted. [Google Scholar]
  24. Boyd, S.; Vandenberghe, L. Convex Optimization; Cambridge University Press: Los Angeles, CA, USA, 2004. [Google Scholar]
  25. Cescon, C.; Mesin, L.; Nowakowski, M.; Merletti, R. Geometry assessment of anal sphincter muscle based on monopolar multichannel surface EMG signals. J. Electromyogr. Kinesiol. 2011, 21, 394–401. [Google Scholar] [CrossRef] [PubMed]
  26. Mesin, L.; Damiano, L.; Farina, D. Estimation of average muscle fiber conduction velocity from simulated surface EMG in pinnate muscles. J. Neurosci. Methods 2007, 160, 327–334. [Google Scholar] [CrossRef] [Green Version]
  27. Farina, D.; Mesin, L.; Martina, S.; Merletti, R. A surface EMG generation model with multilayer cylindrical description of the volume conductor. IEEE Trans. Biomed. Eng. 2004, 51, 415–426. [Google Scholar] [CrossRef] [Green Version]
  28. Mesin, L.; Farina, D. Simulation of surface EMG signals generated by muscle tissues with inhomogeneity due to fiber pinnation. IEEE Trans. Biomed. Eng. 2004, 51, 1521–1529. [Google Scholar] [CrossRef]
  29. Mesin, L.; Merletti, R.; Vieira, T.M. Insights gained into the interpretation of surface electromyograms from the gastrocnemius muscles: A simulation study. J. Biomech. 2011, 44, 1096–1103. [Google Scholar] [CrossRef] [PubMed] [Green Version]
  30. Burrus, C.S. Iterative Reweighted Least Squares. OpenStax CNX. Available online: http://cnx.org/contents/92b90377-2b34-49e4-b26f-7fe572db78a1@12 (accessed on 24 December 2012).
  31. Mesin, L.; Cocito, D. A new method for the estimation of motor nerve conduction block. Clin. Neurophysiol. 2007, 118, 730–740. [Google Scholar] [CrossRef] [PubMed] [Green Version]
  32. Craven, D.; McGinley, B.; Kilmartin, L.; Glavin, M.; Jones, E. Compressed sensing for bioelectric signals: A review. IEEE J. Biomed. Health Inform. 2015, 19, 529–540. [Google Scholar] [CrossRef] [PubMed]
  33. Contessa, P.; De Luca, C.J. Neural control of muscle force: Indications from a simulation model. J. Neurophysiol. 2013, 109, 1548–1570. [Google Scholar] [CrossRef] [Green Version]
  34. Meekins, G.D.; So, Y.; Quan, D. American Association of Neuromuscular & Electrodiagnostic Medicine evidenced-based review: Use of surface electromyography in the diagnosis and study of neuromuscular disorders. Muscle Nerve 2008, 38, 1219–1224. [Google Scholar]
  35. Perry, J.; Easterday, C.S.; Antonelli, D.J. Surface versus intramuscular electrodes for electromyography of superficial and deep muscles. Phys. Ther. 1981, 61, 7–15. [Google Scholar] [CrossRef] [PubMed]
  36. Mesin, L. Crosstalk in surface electromyogram: Literature review and some insights. Phys. Eng. Sci. Med. 2020, 43, 481–492. [Google Scholar] [CrossRef] [PubMed]
  37. Mesin, L. Volume conductor models in surface electromyography: Computational techniques. Comput. Biol. Med. 2013, 43, 942–952. [Google Scholar] [CrossRef] [PubMed]
  38. Mesin, L. Volume conductor models in surface electromyography: Applications to signal interpretation and algorithm test. Comput. Biol. Med. 2013, 43, 953–961. [Google Scholar] [CrossRef] [PubMed]
  39. Keenan, K.G.; Farina, D.; Maluf, K.S.; Merletti, R.; Enoka, R.M. Influence of amplitude cancellation on the simulated surface electromyogram. J. Appl. Physiol. 2005, 98, 120–131. [Google Scholar] [CrossRef] [Green Version]
  40. Boccia, G.; Zoppirolli, C.; Bortolan, L.; Schena, F.; Pellegrini, B. Shared and task-specific muscle synergies of Nordic walking and conventional walking. Scand. J. Med. Sci. Sports 2018, 28, 905–918. [Google Scholar] [CrossRef] [Green Version]
  41. De Stefano, A.; Burridge, J.H.; Yule, V.T.; Allen, R. Effect of gait cycle selection on EMG analysis during walking in adults and children with gait pathology. Gait Posture 2004, 20, 92–101. [Google Scholar] [CrossRef]
  42. Reinvee, M.; Vaas, P.; Ereline, J.; Paasuke, M. Applicability of Affordable sEMG in Ergonomics Practice. Procedia Manuf. 2015, 3, 4260–4265. [Google Scholar] [CrossRef] [Green Version]
  43. Uslu, S.; Nuzket, T.; Uysal, H. Modified motor unit number index (MUNIX) algorithm for assessing excitability of alpha motor neuron in spasticity. Clin. Neurophysiol. Pract. 2018, 3, 127–133. [Google Scholar] [CrossRef]
  44. Javaid, H.A.; Tiwana, M.I.; Alsanad, A.; Iqbal, J.; Riaz, M.T.; Ahmad, S.; Almisned, F.A. Classification of Hand Movements Using MYO Armband on an Embedded Platform. Electronics 2021, 10, 1322. [Google Scholar] [CrossRef]
  45. Boonstra, T.W.; Breakspear, M. Neural mechanisms of intermuscular coherence: Implications for the rectification of surface electromyography. J. Neurophysiol. 2012, 107, 796–807. [Google Scholar] [CrossRef] [PubMed]
  46. Mesin, L. Simulation of surface EMG signals for a multilayer volume conductor with a superficial bone or blood vessel. IEEE Trans. Biomed. Eng. 2008, 55, 1647–1657. [Google Scholar] [CrossRef] [PubMed]
  47. Mesin, L.; Farina, D. A model for surface EMG generation in volume conductors with spherical inhomogeneities. IEEE Trans. Biomed. Eng. 2005, 52, 1984–1993. [Google Scholar] [CrossRef]
  48. Mesin, L.; Farina, D. An analytical model for surface EMG generation in volume conductors with smooth conductivity variations. IEEE Trans. Biomed. Eng. 2006, 53, 773–779. [Google Scholar] [CrossRef]
  49. Mesin, L. Simulation of surface EMG signals for a multilayer volume conductor with triangular model of the muscle tissue. IEEE Trans. Biomed. Eng. 2006, 53, 2177–2184. [Google Scholar] [CrossRef] [PubMed]
  50. Mesin, L.; Joubert, M.; Hanekom, T.; Merletti, R.; Farina, D. A finite element model for describing the effect of muscle shortening on surface EMG. IEEE Trans. Biomed. Eng. 2006, 53, 593–600. [Google Scholar] [CrossRef]
Figure 1. Example of simulated data (muscle with 100 MUs) and estimation of cumulative firings. (A) EMG from a muscle with two IZs (70% MVC, fat layer thickness of 3 mm, mean CV of 4 m/s, no synchronization between MU firings, CoV of ISI 10%, maximum FR 40 Hz), showing SD MUAPs with different phases. Small and large MUs are associated to different IZs (split into 75% of small MUs and 25% of large MUs, so that the amplitude of the two contributions is similar). The total signal and those corresponding to the activation of MUs innervated at different IZs are considered, showing (from up to down) a portion of EMG (0.5 s out of the simulated 10 s), the simulated CWF and the estimated CWF (considering two kernels, with opposite phase, with PSD fit to that of the data). Finally, the PSD of the simulated and estimated CWFs are shown. (B) The same as in (A) but considering a single IZ: in practice, the red signal is the same as in (A), whereas the blue one has the opposite phase. Two kernels are considered, with the same phase but different time scales (0.9 and 1.1 rescaling with respect to the kernel fit to the data). Abbreviations: cumulative weighted firings—CWF; firing rate—FR; innervation zone—IZ; maximal voluntary contraction—MVC; power spectral density—PSD; single differential—SD; motor unit (MU) action potential—MUAP; and coefficient of variation of interspike interval—CoV of ISI.
Electronics 10 02022 g001
Figure 2. Estimation of three kernels, in the cases of (A) no synchronization between MU discharges or (B) high synchronization (signal with one IZ; 80% MVC, fat layer thickness of 3 mm, mean CV of 4 m/s, CoV of ISI 10%, and maximum FR 40 Hz). From top to bottom, the following panels are shown: the signal; its PSD (black) and the ones of the three estimated kernels (in red, blue, and green, keeping the same colours for indicating the same kernels in the following panels); the function of the PSD used to estimate the kernels (in black is the data in the range of interest, in gray is the part out of this range; the interpolation line is in yellow; the points used to estimate the kernels are coloured); and the kernels (with their colour) are superimposed to the MUAPs (in gray) whose CWF best correlates with its deconvolution signal.
Electronics 10 02022 g002
Figure 3. Example of estimation of the CV from a signal with two IZs and MUAPs propagating in two directions. A contraction level of 30% MVC was simulated, considering a volume conductor with fat layer thickness of 3 mm, mean CV of 4 m/s, no synchronization between MU firings, CoV of ISI 10%, and maximum FR 40 Hz. The smallest MUs (which were the 75% of the active MUs) were innervated in one IZ and the others were under the second one. (A) A portion of signal of half a second (10 s were simulated), showing three SD channels aligned to the muscle fibers. The contributions of MUAPs propagating in either of the two directions are also shown. Under the simulated signals, those obtained by deconvolution using two kernels with opposite phase are shown. (B) CWFs, simulated (up) and estimated (down). The estimated CWFs were obtained processing the three SD channels using the same kernels (chosen based on the first of the three SD channels, i.e., the one shown above the others). (C) Estimation of CV from adjacent, non overlapping epochs of 500 ms, using either the simulated or the estimated signals, corresponding to MUAPs propagating in single directions or to data deconvolved using each kernel, respectively. Both signed CV and its absolute value are considered.
Electronics 10 02022 g003
Figure 4. Example of the estimation of coherence in different conditions. The same firings were generated and then applied to simulate different EMGs considering different sets of MUAPs obtained using three models. A contraction level of 40% MVC was simulated, considering a volume conductor with fat layer thickness of 3 mm, mean CV of 4 m/s, CoV of ISI 10%, maximum FR 40 Hz, and level of synchronization between MU firings of 10%. MUs were randomly split into two sets, used to generate two EMGs (as they were recorded by two SD channels, each one placed over one of the two different muscles, each constituted by 200 MUs). (A) Simulated CWFs of the two muscles (portion of half a second on the left) and coherence (right, considering signals of 10 s duration). (B) EMGs of two muscles with two IZs (left, same time range as for the CWFs in (A) and estimated coherence (right), using either the raw signals or the estimated CWFs using two kernels with opposite phase, for each muscle. (C) Same as (B), but considering a signal with a single IZ and three kernels for the deconvolution. (D) Same as (B), but considering a simulated volume conductor with fibres inclined of 25° with respect to the skin surface.
Electronics 10 02022 g004
Figure 5. Cross -correlation of the low frequency contributions (up to 50 Hz) of the simulated CWF and estimated by either the single-kernel (red) or multi-kernel method (black). Each estimation was obtained considering single channel SD EMG at 80% MVC with a duration of 10 s. Data are shown after pooling with respect to specific values of fat layer thickness, mean MU CV, maximal FR, level of synchronization of MU firings, and CoV of ISI. Different simulation models are considered: (A) cylindrical volume conductor with parallel fibres and two IZs (50% of MUs innervated under each IZ; uniform distribution of MU size among different IZs); (B) same volume conductor as in (A), but considering a single IZ; (C) pinnate muscle with fibre inclined with respect to the skin surface.
Electronics 10 02022 g005
Publisher’s Note: MDPI stays neutral with regard to jurisdictional claims in published maps and institutional affiliations.

