Abstract
In recent years, the rapid improvement in computing facilities combined with that achieved in algorithms and the immense amount of available data led to a great interest in machine learning (ML), which is a subset of artificial intelligence. Nowadays, the ML technique is used mostly in all applications for various purposes, whereby ML will be possible to learn from data, predict, identify patterns, and make decisions. In this regard, the ML was successfully used to predict the oxygen uptake during physical activity without the need for complicated procedures used in the direct measurement. Accordingly, in the present work, the state-of-art and recent advances related to the oxygen uptake prediction using ML were presented. Various exercise and non-exercise predictive models also were discussed.
1. Introduction
During everyday life activities and exercises, oxygen is consumed; and consumption increases by increasing the intensity of these activities and exercises, hereafter called oxygen uptake () [1]. When the reaches a maximum point (), the body will have to spend other energy resources which work under limited amount of oxygen, such as anaerobic glycolysis to transform glucose to lactate. Even the rates, by which the ATP (adenosine triphosphate) is synthesized using the anaerobic system, are higher than those achieved by the aerobic path, the capacity of the anaerobic system is much less, leading to a rapid fatigue. Here, there will be a great interest on the determination of in order to avoid the rapid fatigue and other risky problems [2].
Usually, direct measurements can be conducted during a physical activity using various techniques, like metabolic gas analyzers, and those can be portable devices or standard laboratory systems. The physical activity to measure the can be GXT (graded exercise test) [3]. Up to this end, it is to say that using the direct methods to measure the is usually hindered by various factors, like the complexity of such procedures and the high cost. Developing less complicated and cheap methods, through which accurate values can be determined, are needed. Indeed, many works were reported on the use of data mining and machine learning (ML) techniques to develop predictive models [4]. Through these models, the can be predicted (indirect way) with less cost, efforts, and complexity, that might be presented in the direct measurements. The ML models are usually built based on features influencing the using ML algorithms.
In the present work, state-of-art and future trends of the prediction of the aided by ML will be discussed in detail using results reported in other studies between 2005–2020. The work is arranged to introduce (I) the main concept of the oxygen uptake, (II) oxygen uptake measurements and kinetics, and finally (III) to present the application of the oxygen uptake measurements in sport science. In terms of prediction, (I) the application of ML in sport science, and (II) the ML-based models are discussed in detail.
2. Oxygen Uptake ()
While moving or doing any activity during our everyday life, energy will be needed, and this is provided through the oxygen supplied to the mitochondria presented in muscles (aerobic energy system (AES) [1]. Due to the very limited non-oxidative energy stores in muscles and to transit from rest to activity, there must be an arranged response by pulmonary, cardiovascular, and muscular systems. This response enhances the flux of oxygen from the atmosphere to the muscle mitochondria, where the energy molecules (ATP) are aerobically produced. Accordingly, an athlete’s capability to perform exercises and physical activities will be related to how quickly this athlete can turn on such a process (AES). Here, the utilization of mitochondrial oxygen in muscles is more significant to control the total process of (shown in Figure 1) as compared to the oxygen upstream in lungs. Up to this end, the oxygen uptake concept is dealing with the amount of oxygen consumed during various activities, and this can be compared using the maximal oxygen uptake (). In addition, the response of to exercises and activities is known as the oxygen uptake kinetics. In the following sections, accordingly, the methods used in the kinetics, maximal oxygen uptake, submaximal, (which is equal to or less than 85% of maximal), and its applications in sport science will be introduced.
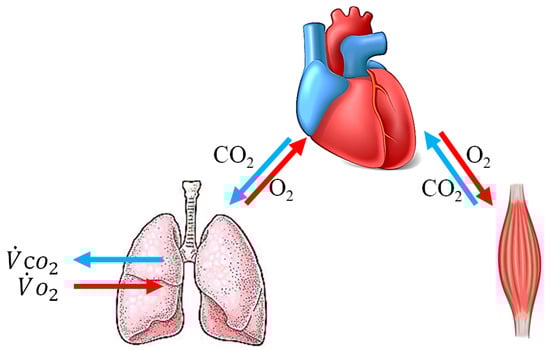
Figure 1.
The mechanism of oxygen uptake.
2.1. Oxygen Uptake Measurements and Kinetics
Usually, is directly measured by determining the amount of oxygen in both the inspired and expired air during an activity. This is carried out based on the gold standard, where direct measurement of gas exchange during a graded activity is conducted using laboratory-based indirect calorimetry [5]. The selection of graded activity for this test is usually dependent on the type of sport in which the measurement is needed. For example, in soccer, the test of the treadmill with speed-controlled protocol is used rather than the incline based one. Based on this procedure used in the direct method, the value of can be calculated at a certain time (t) using the following equation [1]:
where, and are the volume per time (L/min) of the inspired and expired air, respectively. and are the fraction of oxygen in the inspired and expired air, respectively. In the earlier stages of any activity such as running, swimming, or cycling, the increases sharply due to the great demand for oxygen in the lungs at these stages (pulmonary ), where the value of might jump from ~0.25–1.0 L/min in the unloaded condition to more than ~2.0–6.0 L/min within seconds or minutes of the loading. This depends on the type of activity, i.e., normal, heavy, or severe (Figure 2a). Following this, a steady-state stage might be reached, leading to a bit stable value of and through this the max. can be determined. Accordingly, the curve of the with time can be divided into three stages, by which the physical status of an individual can be examined. Those stages are (I) gas exchange threshold (GET), (II) critical power (CP), and (III) steady-state (SS), as shown in Figure 2b. For example, aged individuals or those with pulmonary disease may take longer to reach the SS stage, leading to premature fatigue. For moderate activity where the SS stage is reachable, an equation to represent the changes with the time of ( (t)) can be given as follows:
where, is the oxygen uptake at the steady-state stage, k is the rate constant, and τ is the time constant.
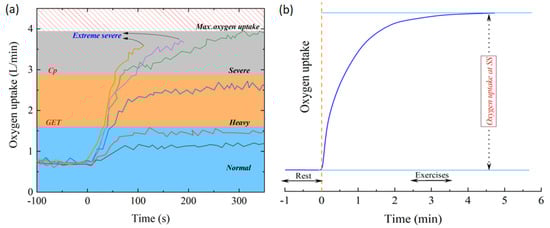
Figure 2.
(a,b): the stages of in various types of exercises (normal, heavy, and severe).
In addition to this direct method used to determine the , less accurate indirect methods can also be used for the same purpose. For example, the is determined using an equation built based on a multistage 20 m shuttle run test [6], run 20 m back and forth across a marked track keeping time. In this test, individuals run two-way 20 m with an initial speed of 8.5 Km/h, then the speed is increased every minute by 0.5 Km/h until the individual is no longer able to follow the speed increment (as shown in Figure 3). Here, the number of this stage is used as an index of . After measuring the for each condition, the equation was made as follows:
where X1 and X2 are the speed and age of an individual, respectively. Another simple method for determining the indirectly is by using Wasserman/Hansen (WH) model [7]. In this model, the is calculated based on the age, weight (W) and height (H) of the subject. In spite of their simplicity, the results of these methods were found to be less accurate as compared to those measured using the direct method.
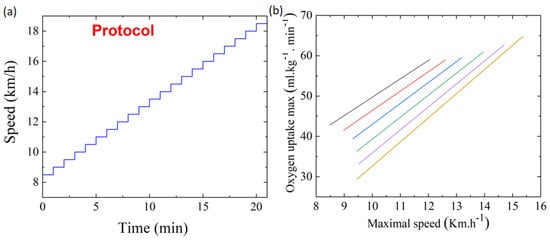
Figure 3.
(a) The multistage 20 m shuttle run test used to estimate the [6]. (b) The max. as function to the maximal speed in the shuttle run test for subjects.
2.2. Oxygen Uptake in Sport Science Applications
In general, the measurements can effectively contribute to the evaluation of athlete capabilities and performance in various kinds of sport. For example, during the 90 min of the soccer match, the athlete performance is mainly dependent on the aerobic metabolism, which is evaluated using the measurements. The evaluation was used to study the skill-based maximal intensity interval training in female futsal players and this training mode’s effect on aerobic and anaerobic performance [8].
3. How Machine Learning Avails of Sports Science?
In recent years, the rapid improvement in computing facilities combined with algorithms and the significant amount of available data led to a great interest in machine learning (ML). In this technique, a model to relate between a property (performance) and various parameters (features) that influence this property can be built through feeding these data (property and features) to the machine and training it to learn the correlation among these data [9]. By this model, not only unexplored properties can be predicted, but also how various features influence the property and whether such features are enough to describe the property can be determined. ML has shown a high potential in various fields, including medicine, biology, chemistry, and physics [10,11], with a long history in those fields. For example, some ML works were conducted for interpreting cardiopulmonary exercise tests [12]. In some other areas, this technique has come forward very recently, and among those, ML-supported sport science issues are gaining much interest.
In this regard, ML algorithms have been applied for predicting the performance of an athlete under suggested conditions without real experiments [11]. In addition, various factors that might influence the performance in a specific sport or activity can be predicted using the ML technique. For example, in a very recently reported work, the relationship between both age and body weight on the performance of powerlifters have been investigated using an ML algorithm (kernel extreme learning machine (KELM)) [12]. In this study, the data of 1700 male powerlifters, including age, body weight, and performance, was collected from a sports website (Kaggle website). The data were containing information related to various international powerlifting competitions (1972–2017). The performance of powerlifters was presented in terms of the best squat. According to the study results, the best squat can be predicted with less than 15% error (R2 = 0.86) based on the age and the bodyweight of the powerlifter. The high performance in this sport was achievable in age range between 20–40 years, which became more significant by increasing body weight (Figure 4).
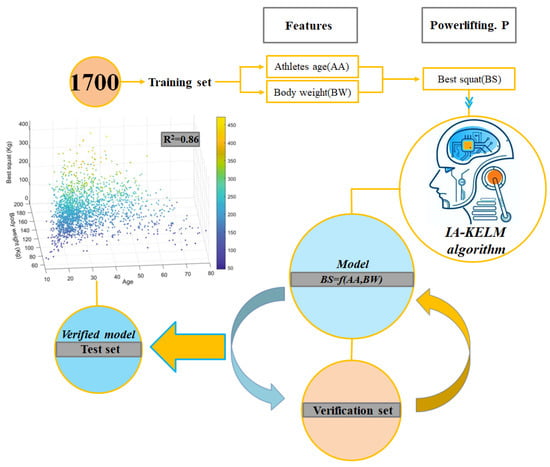
Figure 4.
The learning loop used for the prediction of powerlifter performance [14].
Up to this end, considering the importance of measurements in sport science, difficulties related to the direct method of determination, and the less accuracy of indirect methods, one can think about the investment of the high potentiality of ML technique for predicting without the need for complicated procedures and less certainty of direct and indirect methods, respectively. In this regard, and since 2009, many works have been introduced to address the ML guided prediction of . For this purpose, various kinds of ML algorithms have been used, and those are mostly multiple linear regression (MLR) [13], multilayer perceptron (MLP) [14], and support vector machine (SVM) [15], showing an error range between 5 and 37% (R2 = 0.63–0.95). This wide range of results is mainly explained based on the different conditions used in these works, such as the number of cases in the study, the number of features employed to train the model, the type of algorithm, and data characteristics. Accordingly, in the following sections, the various works reported on this issue are to be presented, and thus, the factors influencing the reliability of results will be drawn.
4. Oxygen Uptake Prediction Based on Machine Learning Algorithms
Recently, the prediction-based on ML technique has received a lot of attention due to its reliability and accurate values obtained using such a technique. Furthermore, most of the works reported on this topic were based on the data that was collected from either exercise or non-exercise tests. In the former, several features, exercise tests, such as treadmill running, treadmill jogging, treadmill walking, perceptually regulated three minute walk distance (3MWD), shuttle running, and swimming, were conducted. In the latter, rather than performing any exercise, questions related to the expected physical activity are given to every subject contributed to the study. The collected answers, accordingly, are used as inputs together with measured by the direct way to build the model. Hereafter the two procedures used to construct the dataset used for building the prediction model will be discussed separately, and the procedures and reported results from discussed works are presented in Table A1 of Appendix A.
4.1. Exercise-Based Models
Several works were conducted to establish accurate models that can be employed to predict the using dataset prepared by exercise tests. In those works, both and were targeted. Under some conditions, getting the peak of oxygen uptake is quite difficult, especially for older adults, and here the use of instead of becomes less expensive, where no special medical care would be needed. In addition, some works were focused on the direct measurements and prediction of the oxygen uptake during the activity using wearable sensors. Hereafter the various methods, related experiments, and reached results will be introduced and compared.
One of the earlier works reported on the prediction of using ML was done by Swank et al. [16]. In this work, the values were predicted based on data collected from 37 subjects (19 F + 18 M) upon treadmill walking tests. The features used in this work were body weight (BW), body weight index (BWI), age, maximum heart rate (max. HR), and respiratory exchange ratio (RER). The model built in this work showed a good predictability with R2 of 0.89, as shown in Figure 5. In another work reported by Su et al. [17], the oxygen uptake was dynamically predicted under free-living conditions using portable wireless sensors. For this purpose, six males (untrained) with average age, body weight, and height of 28 ± 5.5 years, 70 ± 11 Kg, and 176 ± 5 cm, respectively, were subjected to a treadmill walking test. The male subjects were asked to walk at various speeds (2, 3, 4, 5, 6, and 7 km/h) for 5 min in each. The dataset used for training and later for testing the built model consisted of , triaxial accelerometers (TA) and heart rate (HR) and TA and HR were used as features in the model and were directly measured during the walking test using portable devices. The values, in turn, were determined during the test using a gas analyzer (MOXUS Metabolic Cart). The collected dataset was used to build the model using the support vector regression (SVR) algorithm, and, accordingly, a direct relationship between the features (TA and HR) and property () was established. Using such an equation, the oxygen uptake was predictable based on TA and HR direct measurements using the portable sensors. In addition to the suitable and adequate research facilities, selecting the features to be used in the model is very important to get enough accuracy in the predictive model. In this regard, various features were employed in the works reported on the prediction using ML methods, such as age, sex, weight, etc. These features, initially, are chosen based on the type of exercise and the related measurements. Then they can be subjected to a feature-selection process in which the non-effective features are eliminated from the final predictive model. For example, in work reported by Chatterjee et al. [18], the predictive model was built based on the data collected from the direct measurements of conducted after a 20 m multi-stage shuttle run test done by 40 female subjects. In this work, just the maximal speed during the shuttle run (X) was considered as a feature. This test involves continuous running between two lines 20 m apart in time to recorded beeps. The speed at the start is quite slow. The subject continues running between the two lines, turning when signaled by the recorded beeps. If the line is reached before the beep sounds, the subject must wait until the beep sounds before continuing. The dataset consisting of the (property) and X (feature) was employed to learn the machine, where the multiple linear regression (MLR) algorithm was used. The results showed a linear relation between and X with an R2 equal to 0.94:
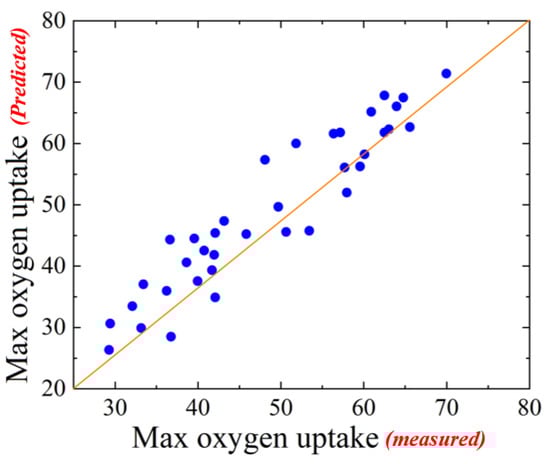
Figure 5.
Predicted values versus directly-measured values [18].
Considering the type of exercise used in this study, the obtained equation might be useless in other exercise types, like swimming or cycling. In addition, additional features, such as weight and age, should be considered in this equation. The 20 m shuttle run test was also carried out by another group to build a predictive model for estimating the [19]. In this work, the test was done on 84 stationary male students from various universities in India, and the features employed to build the model were age (A), body weight (BW), body height (BH), and speed (X). The features and values measured directly were employed to train the model using the MLR algorithm. Three different predictive models were built presenting the correlation between and the A and X, BW and X, and BH and X, as shown the following equations:
Those models showed reasonable accuracy with R2 values equal to 0.87, 0.88, and 0.88, respectively. Even those equations presented an easy way to estimate , more features are still missing from the equations. In addition, a general equation, including all features, would be needed. In this regard, Maher et al. [20] used a more comprehensive range of subjects, where the two genders (244) with ages between 10–16 years were included in the study. In addition, the test of progressive aerobic cardiovascular endurance run (PACER) 20 m multistage shuttle run was carried out. Accordingly, the features used were PACER (the number of completed laps), gender (0 for female and 1 for male), age, and the body mass index (BMI), which is the measure of body fat based on height and weight. In this study, a cross-validation process was used to build the model by the MLR algorithm. A more general predictive equation was obtained to estimate the based on sex, age, BWI, and PACER, as follow:
Through the same algorithm (MLR) and using more features, a predictive model was also reached in work reported by Akay et al. [21]. In their work, the authors used a new set of features and age, sex, and BMI, and those features are related to the body fat percentage (BF%) and heart rate (HR). In addition, other features related to the conducted treadmill tests were considered, those are respiratory exchange ratio (RER), self-reported rating of perceived exertion (RPE), and time to exhaustion (tex) during the test. Accordingly, a model with higher predictability as compared to those reported in other works was reached in this study, where the various types of features were included in the model to get the predictive equation. In addition to the feature selection and training data accuracy, the employed algorithm is of importance and was needed to be considered carefully. In this regard, Akay et al. [21] applied the same conditions used in the MLR algorithm in other algorithms, including multilayer perceptron (MLP), support vector machine (SVM), and generalized regression neural network (GRNN). These algorithms successfully led to building various models based on the data collected from 211 + 228 subjects (male + females) with an age range between 20–79 years using a treadmill test. Using 10-fold cross-validations in all algorithms, the MLP algorithm’s model was the most effective, where R and SEE values of 0.91 and 3.73 were recorded, respectively.
To reduce the predictive model’s complexity, fewer features needed to be included in the predictive model’s training and testing. Here, the collected data should be subjected to a processing step. In such a process, the outliers (less accurate data) and the less important features (the features that do not affect the performance) are removed from the training dataset. By the feature selection process, faster training of the ML algorithm can be achieved, the predictive model becomes easier to interpret, and finally, this process can reduce overfitting. The feature selection to find the most effective features is done using various ways, including filter methods, wrapper methods, and embedded methods. In the filter, methods include multiple procedures, such as Pearson’s correlation, linear discriminant analysis, Chi-square, and Relief-F. The first use of the feature selection for the prediction of was reported by Akay el al., who used Relief-F as a feature selector, and then the feature-reduced dataset was trained using the SVM algorithm [21]. The dataset used in this work was collected under the condition described in the previous work. The full dataset, including seven features (age, sex, BMI, max. HR, RER, RPE, and tex) and the measured was subjected to the feature selection process using the Relief-F method, and as a result, two features were excluded from a further processing—RER and RPE. The Relief-F-SVM based model showed reasonable accuracy with R and SEE values of 0.9 and 4.58 mL·kg−1·min−1, respectively. This result was compared with that obtained using the MLR algorithm and it was found that the Relief-F-MLR based model had less predictability, where values of 0.88 and 4.77 mL·kg−1·min−1 were determined for R and SEE, respectively, in the Relief-F-MLR model. Up to this end, on can note that, the quality of the final predictive exercise-based model can be dependent on a set of factors, this involves: the characteristics of the sample (number of subjects and the gender), the number of included features, feature selection procedures, and employed algorithm. In between these efforts to develop such a predictive model for indirect determination of and up to 2015, several works were also done [4]. Different types of features, algorithms, and procedures were used in these works, and the results showed a wide range of predictabilities.
Later on, and starting from 2016, with more development in the fields of wearable sensors and machine learning algorithms, predictive models have reached. Beltrame et al. [22] used artificial neural network (ANN) analysis and wearable sensors to build a model that can predict the kinetics of oxygen uptake. In this work, 5 + 5 healthy young subjects (male + female) were included in the study, and treadmill walking tests were conducted. The direct measurements of the and HR were carried out during the test, and the counterparts’ values were recorded with time. Accordingly, the features used in the work were sex, body mass, speed, grade, time of exercise (time on), time to recover (time off), and HR. The effect of sample size on the predictability of the built model was also considered. The results showed that such experiments lead to an accurate model, where R values of 0.94 and 0.97 were recorded for the sample size of n = 12,250 and n = 86,522, respectively. In another work reported by Borror et al. [23], the ANN was also used to analyze the data collected from 12 adult males during cycling tests. The subjects (age: 21.1 ± 2.5 yrs; weight: 82.1 ± 11.7 kg; height: 179.3 ± 8.9 cm) were asked to perform a 50 min bout of cycling on the cycle ergometer, and the power output, and HR were directly measured. The features included in this work were power output, cadence, body mass, HR, and time derivative of HR (dHR/dt), as shown in Figure 6. The ANN-based predictive model was found for each subject, and those models showed a promising performance to predict the during cycling (Figure 6).
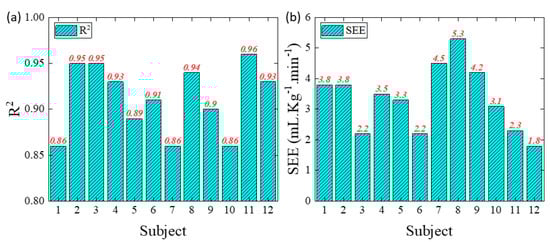
Figure 6.
The performance of the ANN-based predictive model as measured by R2 (a) and standard error of the estimate (SEE) (b) [23]. These results were recorded separately for each subject (12) included in this work.
Very recently, a different type of experimentation was reported by Shandhi et al. [24]. In this work, the authors used the cardio-electromechanical and environmental sensing measurements to predict the . Singles of seismocardiogram (SCG), electrocardiogram (ECG), and atmospheric pressure (AP) were recorded using a low-cost wearable device during indoor treadmill exercise (controlled conditions) and outdoor walking exercise (uncontrolled conditions). The was measured directly using the COSMED K5 wearable metabolic system. The recorded singles were analyzed to extract the features to be used in the predictive model. Figure 7 shows the summery of this work and the obtained regression model. The results showed that the built based on the cardio-electromechanical and environmental sensing measurements done, the low-cost wearable sensors can be used effectively to estimate for various applications. In another work reported by Beltrame et al. [25], wearable sensors, including hip accelerometer, ECG, and respiration band, were used. The singles recorded using these sensors were used to extract various features employed in training and testing the model. As shown in Figure 8, 17 healthy, active male adults were contributed to this study, where a treadmill walking test was done. The extracted features, including heart rate (HR), minute ventilation (VE), breathing frequency (BF), total hip acceleration (HAcc), and walking cadence (CAD) and the directly measured were trained using the random forest algorithm (RF). The results from two different sample sizes (n = 12,480 and n = 20,868) showed reasonable predictability using the bigger sample with R = 0.87.
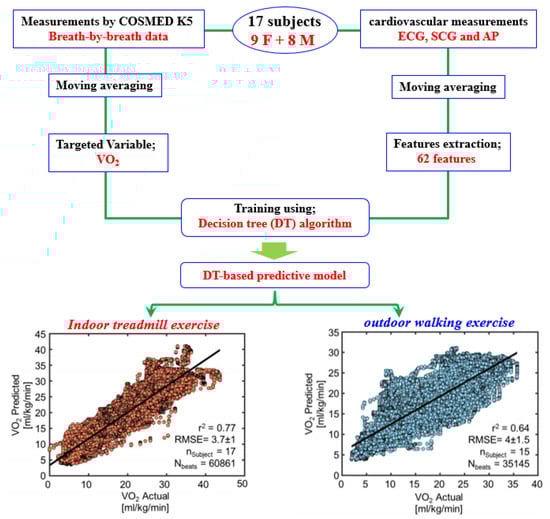
Figure 7.
The learning loop used for the prediction of [24].
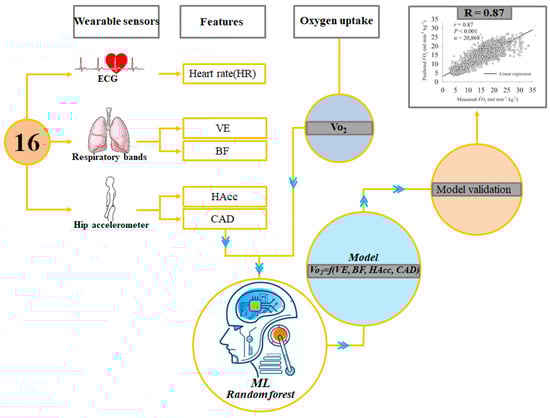
Figure 8.
The learning loop used for the prediction of [25].
4.2. Non-Exercise-Based and Hybrid Models
The non-exercise-based features were also employed to build the predictive models. This was conducted in order to avoid the completed procedures related to the data collection and processing used in the exercise-based predictive models. Accordingly, these can provide an efficient and practical way to estimate the with no need to carry out the costly experimentation or tiring exercise tests. In this regard, questionnaires were used to collect the data and arrange the dataset for training and test the predictive model. Several types of questionnaires were used for this purpose, such as physical activity readiness (PAR) [26] and perceived functional ability (PFA) [27]. Based on the PFA questionnaire, for example, the contributed subjects are usually asked to report their ability to sustain physical activity, such as walking, jogging, or running.
At the very beginning, the non-exercise prediction method was used in work reported by Bradshaw et al. [28]. In this work, the MLR algorithm was employed to train the data collected from 100 male and female adults (18–65 years) using the PFA and PAR questionnaires (features) and the GXT method (). The features used to build these models were sex, age, BMI, and questionnaires (PFA and PAR). An MLR based model was obtained in this work as follow:
This model resulted in reasonable predictability with R and SEE values equal to 0.91 and 3.63 mL·kg−1·min−1. In another work [29], SVM and multilayer feedforward neural networks (MFFNN) were employed to train the data collected using the PFA and PAR questionnaires (features) and the GXT method (). The results reported in this work showed that the SVM model gave a higher R-value (0.93) as compared to the MFFNN model, whereas the latter showed a lower SEE value (3.23 mL·kg−1·min−1). Later on, several works were presented to build non-exercise-based ML models using various algorithms like MLR [30]. In addition to the PFA and PAR, other questionnaires were also used, like leisure-time physical activity (LPA) [31] and work-related physical activity (WPA) [32]. Most of these works showed an acceptable range of predictabilities. Recently, Henriques et al. [33] employed the fitness registry and the importance of exercise (FRIEND), which is a national database, to build the predictive model using the generalized regression neural network (GRNN) technique. Using this base, the data including; age, height, weight, HR, systolic blood pressure (SBP), and diastolic blood pressure (DBP), were obtained for 65,000 subjects aged between 20 and 79. The values predicted by the GRNN-based model were found to be more accurate as compared to those determined by the WH model (Wasserman/Hansen model) in which gender, age, weight and height are only considered. In addition to the previous features, the HR, SBP and DBP were included GRNN-based model, leading to the higher accuracy.
Recently, models based on both exercise and non-exercise data were built to predict the , hereafter those are indicated as hybrid models. For example, in work carried out by Nielson et al. [34], features obtained from submaximal cycle ergometry test (exercise), maximal treadmill graded test (exercise), and PFA questioner (non-exercise) were used to build the predictive model. The of 105 subjects (52 female and 53 male) included in the work measured after completing the tests, wherein the 1st test, a steady-state heart rate (HRss) equal to 70% of the age-predicted maximum heart rate (220-age) should be achieved. In contrast, in the second test, the subjects should exercise volitional fatigue, and the work rate (WR) is accordingly estimated. Based on the carried out tests and questionnaire, gender, body mass (BM), PFA, WR, and HRss were the features that were used in the model. The collected data (features and ) were employed to train and test the model using the MLR algorithm. The model equation obtained in this work is shown below:
The results showed that the hybrid predictive model had enough accuracy, which, somehow, was better than those obtained by either exercise-based or non-exercise-based models, where R and SEE values of 0.90 and 3.56 mL·kg−1·min−1 were recorded for this model, respectively. Recently, exercise (submaximal and maximal) and non-exercise features were employed to build a predictive model using SVM, MLP, and TB algorithms [15]. In this work, prior to the model training and testing, the features were processed using Relief-F selector to reveal the distinct predictors of . The exercise-based features were obtained using a treadmill test. The submaximal heart rate higher than 70% of the age-predicted maximum heart rate (220-age) (SM-HR), submaximal exercise stage (SM-stage), submaximal ending speed (SM-ES), maximal heart rate (MX-HR), maximal perceived exertion (MX-PRE), and maximal respiratory exchange (MX-RER) were collected from the test. These features (submaximal and maximal) together with the physiological variables (weight, age, etc.) and the results of the questionnaires went through the feature selection process followed by training and testing using the various algorithms used in work (SVM, MLR, and TB). The selection process showed the PFA, PAR, SM-ES, SM-stage, SM-HR, gender, age, weight, and height are the promising features (high Relief-F score) to be employed in the predictive model. The train and testing process revealed that the SVM-based model showed high predictability, where the values of R and RMSE (root mean square error) were found to be 0.93 and 3.14, respectively. Based on these results, the SVM model can be estimated using the physiological, questionnaire, and submaximal features, and accordingly, the maximal tests and related features will be unrequired.
5. The Latest Update on the Oxygen Uptake Predictions Guided by ML
Very recently, several works were conducted to investigate the application of machine learning techniques in the field of oxygen uptake predication [35,36,37,38]. In those works, new techniques and procedures were employed to enhance the predictability of built models. Jensen et al. [36] used a maximal rowing ergometer protocol to generate descriptors, which are used to train the max. model. In this regard, data of maximal power output (MPO) in an individualized 7 × 2 min incremental (INCR) test and average power in a 2k (W2k) rowing ergometer test were obtained from 34 male club rowers (18–30 year), and then, the max. values were measured for the rowers. The obtained data was used to train the model using a linear regressor, and very simple predictive models were final obtained as follows:
The relative errors recorded for these models were 3.1% and 3.6%, respectively.
In another work done by Deka et al. [37], the max. predication was conducted on heart failure patients (119 subjects) using a 6 min walk test (6MWT), where max. determined through a cardiopulmonary exercise (CPX) recorded for the patients together with their distance scores from the 6 MWT (6MWD).
The 6 MWT was also used in the max. predication experiments on young healthy adults (university students aged 21 ± 1 years), as conducted by Liu et al. [38], and to improve the quality of the predictive model, cardiovascular indices derived by impedance cardiography (ICG) during the test (6MWT) were included in the learning process. Two 6MWTs and one CPX at the end of the 6MWTs were conducted, and during these tests, HR, SV, and cardiac output (CO) were measured by the ICG. To show the importance of the cardiovascular indices, the predictive model was built with or without the indices as descriptors. A liner regressor was used in the learning process, and two different predictive models were built by the learning process as follows:
The results showed that the model, in which the cardiovascular indices were employed as descriptors, showed a better performance (R2 = 0.86) as compared to that without the indices (R2 = 0.54). It is clearly seen that in the works introduced in this section, liner regressions were mainly employed, and accordingly, simple predictive models were built. More advanced and complex algorithms were also employed also to reach high performance predictive models. In this regard, and recently, Zignoli et al. [35] employed a recurrent neural network (RNN) to build a model using cardiovascular features. Using the RNN, a smaller number of cases can be needed to build an accurate model without complicated procedures to prepare the training and testing datasets.
6. Future Trends
Further research on the ML guided prediction of is still needed to build a more accurate model with high predictability compared to those already reached up to now. To achieve this target, one can think in two different directions. In the first direction, the data quality and size should be considered when preparing the training and testing dataset. In this regard, more features influencing the kinetic should be measured or determined accurately and then should be included in the dataset. For example, the sport type of the subject contributed in the study can be included as a feature to build the model, and accordingly, how does the body construction of athletes influence their kinetic. On the other hand, the second direction should be focused on using more advanced learning techniques.
7. Conclusions
In the present work, the various concepts related to the oxygen uptake () and the application of machine learning to predict the during physical activities were reviewed. Using the ML algorithms, successful predictive models were mostly built to determine the values of with no need for the completed procedures associated with the direct ways. Those models are usually built using data obtained from either exercise, non-exercise, or hybrid procedures. According to the results obtained in various works reported on the prediction of the using the ML technique, one can find that reasonable predictability can be reached considering several points. (I) Features employed in the model construction process should cover a wide range, and thus, all parameters that influence the targeted behavior or property can be considered. (II) Data pre-processing in order to select promising features (predictors) is needed. (III) The selection of ML algorithms that can give the best combination of higher R and smaller SEE, and in this regard, the results of various ML algorithms such as SVM and linear regressions should be investigated and compared with each other to get the optimal predictability.
Author Contributions
H.A. designed the idea and collected the required references, H.A. and K.H. prepared the manuscript, T.A. revised the first draft, all authors contributed to the discussion of main concepts. All authors have read and agreed to the published version of the manuscript.
Funding
This research was funded by National Research Foundation (NRF) of South Korea, grant number (2020R1A2C1004720). And the APC was funded by National Research Foundation (NRF) of South Korea, grant number (2020R1A2C1004720).
Acknowledgments
This research was supported by National Research Foundation (NRF) of South Korea (2020R1A2C1004720).
Conflicts of Interest
The authors declare no conflict of interest.
Appendix A

Table A1.
The procedures and reported results from discussed works.
Table A1.
The procedures and reported results from discussed works.
| Ref. | Type | Algorithm | Metric | ||||
|---|---|---|---|---|---|---|---|
| R2 | R | SE (mL·kg−1·min−1) | EMES (mL·kg−1·min−1)2 | RMSE (mL·kg−1·min−1) | |||
| [16] | Exercise | Multiple linear regression | 0.89 | 4.56 | |||
| [17] | Exercise | Support vector machine | 4.2 | ||||
| [19] | Exercise | Multiple linear regression | 0.88 | ||||
| [20] | Exercise | Multiple linear regression | 6.43 | ||||
| [21] | Exercise | Multiple linear regression | 0.91 | 3.73 | |||
| [21] | Exercise | Support vector machine | 0.88 | 4.82 | |||
| [21] | Exercise | Generalized regression neural network | 0.79 | 5.39 | |||
| [22] | Exercise | Artificial neural network | 0.94 | ||||
| [23] | Exercise | Artificial neural network | 0.90 | ||||
| [24] | Exercise | Ensemble regression | 0.64 | 4.3 | |||
| [25] | Exercise | Random forest | 0.87 | ||||
| [28] | Non-exercise | Multiple linear regression | 0.91 | 3.63 | |||
| [29] | Non-exercise | Support vector machine | 0.93 | 3.55 | |||
| [29] | Non-exercise | Multilayer feedforward neural networks | 0.90 | 3.23 | |||
| [34] | Non-exercise | Multiple linear regression | 0.90 | 3.56 | |||
| [15] | Hybrid | Support vector machine | 0.94 | 2.97 | |||
| [15] | Hybrid | Multiple linear regression | 0.93 | 3.18 | |||
| [15] | Hybrid | Tree boost | 0.92 | 3.42 | |||
References
- Jones, A.M.; Poole, D.C. Oxygen Uptake Kinetics in Sport, Exercise and Medicine; Routledge: London, UK, 2013. [Google Scholar] [CrossRef] [Green Version]
- Killer, S.C.; Svendsen, I.S.; Gleeson, M. The influence of hydration status during prolonged endurance exercise on salivary antimicrobial proteins. Eur. J. Appl. Physiol. 2015, 115, 1887–1895. [Google Scholar] [CrossRef] [Green Version]
- Leddy, J.J.; Baker, J.G.; Kozlowski, K.; Bisson, L.; Willer, B. Reliability of a graded exercise test for assessing recovery from concussion. Clin. J. Sport Med. 2011, 21, 89–94. [Google Scholar] [CrossRef] [Green Version]
- Abut, F.; Fatih Akay, M. Machine learning and statistical methods for the prediction of maximal oxygen uptake: Recent advances. Med. Devices Evid. Res. 2015, 8, 369–379. [Google Scholar] [CrossRef] [Green Version]
- Sargent, C.; Scroop, G.C.; Nemeth, P.M.; Burnet, R.B.; Buckley, J.D. Maximal oxygen uptake and lactate metabolism are normal in chronic fatigue syndrome. Med. Sci. Sports Exerc. 2002, 34, 51–56. [Google Scholar] [CrossRef]
- Paradisis, G.P.; Zacharogiannis, E.; Mandila, D.; Smirtiotou, A.; Argeitaki, P.; Cooke, C.B. Multi-stage 20-m shuttle run fitness test, maximal oxygen uptake and velocity at maximal oxygen uptake. J. Hum. Kinet. 2014, 41, 81–87. [Google Scholar] [CrossRef] [PubMed] [Green Version]
- Arena, R.; Myers, J.; Abella, J.; Pinkstaff, S.; Brubaker, P.; Moore, B.; Kitzman, D.; Peberdy, M.A.; Bensimhon, D.; Chase, P.; et al. Determining the preferred percent-predicted equation for peak oxygen consumption in patients with heart failure. Heart Fail. 2009, 2, 113–120. [Google Scholar] [CrossRef] [PubMed] [Green Version]
- Karahan, M. The effect of skill-based maximal intensity interval training on aerobic and anaerobic performance of female futsal players. Biol. Sport 2012, 29, 223–227. [Google Scholar] [CrossRef]
- Kotsiantis, S.B.; Zaharakis, I.D.; Pintelas, P.E. Machine learning: A review of classification and combining techniques. Artif. Intell. Rev. 2006, 26, 159–190. [Google Scholar] [CrossRef]
- Carleo, G.; Cirac, I.; Cranmer, K.; Daudet, L.; Schuld, M.; Tishby, N.; Vogt-Maranto, L.; Zdeborová, L. Machine learning and the physical sciences. Rev. Mod. Phys. 2019, 91, 45002. [Google Scholar] [CrossRef] [Green Version]
- Mȩyk, E.; Unold, O. Machine learning approach to model sport training. Comput. Hum. Behav. 2011, 27, 1499–1506. [Google Scholar] [CrossRef]
- Chau, V.H.; Vo, A.T.; Le, B.T. The effects of age and body weight on powerlifters: An analysis model of powerlifting performance based on machine learning. Int. J. Comput. Sci. Sport 2019, 18, 89–99. [Google Scholar] [CrossRef] [Green Version]
- Chatterjee, P.; Banerjee, A.K.; Das, P.; Debnath, P. A regression equation for the estimation of maximum oxygen uptake in Nepalese adult females. Asian J. Sports Med. 2010, 1, 41–45. [Google Scholar] [CrossRef] [PubMed] [Green Version]
- Akay, M.F.; Zayid, E.I.M.; Aktürk, E.; George, J.D. Artificial neural network-based model for predicting VO2max from a submaximal exercise test. Expert Syst. Appl. 2011, 38, 2007–2010. [Google Scholar] [CrossRef]
- Abut, F.; Akay, M.F.; George, J. Developing new VO2max prediction models from maximal, submaximal and questionnaire variables using support vector machines combined with feature selection. Comput. Biol. Med. 2016, 79, 182–192. [Google Scholar] [CrossRef] [PubMed]
- Swank, A.M.; Serapiglia, L.; Funk, D.; Adams, K.J.; Durham, M.; Berning, J.M. Development of a Branching Submaximal treadmill test for predicting VO2max. J. Strength Cond. Res. 2001, 15, 302. [Google Scholar] [CrossRef] [PubMed]
- Su, S.W.; Celler, B.G.; Savkin, A.V.; Nguyen, H.T.; Cheng, T.M.; Guo, Y.; Wang, L. Portable sensor based dynamic estimation of human oxygen uptake via nonlinear multivariable modelling. In Proceedings of the 2008 30th Annual International Conference of the IEEE Engineering in Medicine and Biology Society, Vancouver, BC, Canada, 14 October 2008; IEEE: Piscataway, NJ, USA, 2008; pp. 2431–2434. [Google Scholar] [CrossRef] [Green Version]
- Chatterjee, P.; Banerjee, A.K.; Das, P.; Debnath, P.; Chatterjee, P. A regression equation to predict VO2 max of trainee badminton players. Biomedicine 2006, 26, 47–52. [Google Scholar]
- Bandyopadhyay, A. Validity of 20 m multi-stage shuttle run test for estimation of maximum oxygen uptake in female university students. Indian J. Physiol. Pharmacol. 2013, 57, 77–83. [Google Scholar] [CrossRef]
- Mahar, M.T.; Guerieri, A.M.; Hanna, M.S.; Kemble, C.D. Estimation of Aerobic Fitness from 20-m Multistage Shuttle Run Test Performance. Am. J. Prev. Med. 2011, 41, S117–S123. [Google Scholar] [CrossRef]
- Aktürk, E.; Mfann, S.A.; Vektör, D.; Svr, R. Performance comparison of different regression methods for VO2max estimation. In Proceedings of the 2013 21st Signal Processing and Communications Applications Conference (SIU), Haspolat, Turkey, 24–26 April 2013; IEEE: Piscataway, NJ, USA, 2013; pp. 6–9. [Google Scholar] [CrossRef]
- Beltrame, T.; Amelard, R.; Villar, R.; Shafiee, M.J.; Wong, A.; Hughson, R.L. Estimating oxygen uptake and energy expenditure during treadmill walking by neural network analysis of easy-to-obtain inputs. J. Appl. Physiol. 2016, 121, 1226–1233. [Google Scholar] [CrossRef] [PubMed] [Green Version]
- Borror, A.; Mazzoleni, M.; Coppock, J.; Jensen, B.C.; Wood, W.A.; Mann, B.; Battaglini, C.L. Predicting oxygen uptake responses during cycling at varied intensities using an artificial neural network. Biomed. Hum. Kinet. 2019, 11, 60–68. [Google Scholar] [CrossRef] [Green Version]
- Shandhi, M.M.H.; Bartlett, W.H.; Heller, J.; Etemadi, M.; Young, A.; Ploetz, T.; Inan, O. Estimation of Instantaneous Oxygen Uptake during Exercise and Daily Activities using a Wearable Cardio-Electromechanical and Environmental Sensor. J. Biomed. Health Inform. 2020, 2194, 634–646. [Google Scholar] [CrossRef] [PubMed]
- Beltrame, T.; Amelard, R.; Wong, A.; Hughson, R.L. Prediction of oxygen uptake dynamics by machine learning analysis of wearable sensors during activities of daily living. Sci. Rep. 2017, 7, 1–8. [Google Scholar] [CrossRef] [Green Version]
- Zhao, J.; Zhu, P.; Lu, X. On the power-law of the internet and the prediction of BGP convergence. In Proceedings of the International Conference on Internet Surveillance and Protection (ICISP’06), Cote d’Azur, France, 26–29 August 2006. [Google Scholar] [CrossRef]
- Matheson, L.N.; Matheson, M.L.; Grant, J. Development of a measure of perceived functional ability. J. Occup. Rehabil. 1993, 3, 15–30. [Google Scholar] [CrossRef]
- Bradshaw, D.I. An Accurate VO2max Non-exercise Regression Model for 18 to 65 Year Old Adults. Res. Q. Exerc. Sport 2003, 76, 426–432. [Google Scholar] [CrossRef] [Green Version]
- Akay, M.F.; Inan, C.; Bradshaw, D.I.; George, J.D. Support vector regression and multilayer feed forward neural networks for non-exercise prediction of VO2max. Expert Syst. Appl. 2009, 36, 10112–10119. [Google Scholar] [CrossRef]
- Jang, T.W.; Park, S.G.; Kim, H.R.; Kim, J.M.; Hong, Y.S.; Kim, B.G. Estimation of maximal oxygen uptake without exercise testing in Korean healthy adult workers. Tohoku J. Exp. Med. 2012, 227, 313–319. [Google Scholar] [CrossRef]
- Burton, N.W.; Turrell, G. Occupation, hours worked and leisure-time physical activity. Prev. Med. 2000, 31, 673–681. [Google Scholar] [CrossRef]
- White, R.L.; Bennie, J.; Abbott, G.; Teychenne, M. Work-related physical activity and psychological distress among women in different occupations: A cross-sectional study. BMC Public Health 2020, 20, 1007. [Google Scholar] [CrossRef] [PubMed]
- Henriques, J.; Carvalho, P.; Rocha, T.; Paredes, S.; Cabiddu, R.; Trimer, R.; Mendes, R.; Borghi-Silva, A.; Kaminsky, L.; Ashley, E.; et al. A non-exercise based V02max prediction using FRIEND dataset with a neural network. In Proceedings of the 2017 39th Annual International Conference of the IEEE Engineering in Medicine and Biology Society (EMBC), Jeju, Korea, 11 July 2017; IEEE: Piscataway, NJ, USA, 2017; pp. 4203–4206. [Google Scholar] [CrossRef]
- Nielson, D.E.; George, J.D.; Vehrs, P.R.; Hager, R.L.; Webb, C.V. Predicting VO2max in college-aged participants using cycle ergometry and perceived functional ability. Meas. Phys. Educ. Exerc. Sci. 2010, 14, 252–264. [Google Scholar] [CrossRef]
- Zignoli, A.; Fornasiero, A.; Ragni, M.; Pellegrini, B.; Schena, F.; Biral, F.; Laursen, P.B. Estimating an individual’s oxygen uptake during cycling exercise with a recurrent neural network trained from easy-to-obtain inputs: A pilot study. PLoS ONE 2020, 15, e0229466. [Google Scholar] [CrossRef] [PubMed] [Green Version]
- Jensen, K.; Frydkjær, M.; Jensen, N.M.B.; Bannerholt, L.M.; Gam, S. A maximal rowing ergometer protocol to predict maximal oxygen uptake. Int. J. Sports Physiol. Perform. 2021, 16, 382–386. [Google Scholar] [CrossRef]
- Deka, P.; Pozehl, B.J.; Pathak, D.; Williams, M.; Norman, J.F.; Alonso, W.W.; Jaarsma, T. Predicting maximal oxygen uptake from the 6 min walk test in patients with heart failure. ESC Heart Fail. 2021, 8, 47–54. [Google Scholar] [CrossRef] [PubMed]
- Liu, F.; Tsang, R.C.C.; Jones, A.Y.M.; Zhou, M.; Xue, K.; Chen, M.; Wang, Y. Cardiodynamic variables measured by impedance cardiography during a 6-min walk test are reliable predictors of peak oxygen consumption in young healthy adults. PLoS ONE 2021, 16, e0252219. [Google Scholar] [CrossRef]
Publisher’s Note: MDPI stays neutral with regard to jurisdictional claims in published maps and institutional affiliations. |
© 2021 by the authors. Licensee MDPI, Basel, Switzerland. This article is an open access article distributed under the terms and conditions of the Creative Commons Attribution (CC BY) license (https://creativecommons.org/licenses/by/4.0/).