Abstract
The transmission performance of a multi-path transmission control protocol (MPTCP) is affected by many parameters, such as path management, congestion control, buffer size, and subflow bandwidth. Most of the previous studies have focused almost exclusively on the improvement of a single parameter, without a holistic view. In this paper, a multi-parameter comprehensive optimized algorithm (MPCOA) is proposed to comprehensively optimize the above parameters. The MPCOA algorithm can find a smaller buffer size and select an appropriate congestion control and path management algorithm on the premise of ensuring better throughput. Experiments in three scenarios show that MPCOA can save buffer space and subflow resources, and achieve a high throughput. Meanwhile, a set of quantitative improvement results given by MPCOA is convenient for us to evaluate the quality of the MPTCP network and provide reference for our ongoing future work.
1. Introduction
MPTCP [1,2] is an extension of the well-known Transmission Control Protocol (TCP) [3]. It realizes multi-path transmission on the transport layer. TCP only establishes a single-path connection for the communication between two hosts. When losing connectivity on the interface selection for a TCP connection, the connection is broken. It needs to be re-established over the other interface (with the other interface’s IP address). However, MPTCP can dynamically conduct a multi-path connection consisting of multiple flows. Figure 1a illustrates the MPTCP protocol stack [2,4]. MPTCP transfers data simultaneously over different subflows, as depicted in Figure 1a. MPTCP uses all the available subflows, including IPv4 and IPv6. Figure 1b shows the details of the MPTCP protocol functions, which consist of path management (PM) and packet scheduling (PS). PM [5] denotes the establishment, teardown and management of subflows, while PS is the scheduling of payload data onto the existing subflows. The main task of PM is to organize and manage those subflows that can participate in the end-to-end data transmission and make contributions. Through the PM algorithm, it is possible to dynamically add or delete subflows to participate in the concurrent transmission. MPTCP can improve the bandwidth and throughput as well as enhance the robustness and fast recovery of the network by using the existing network infrastructure.
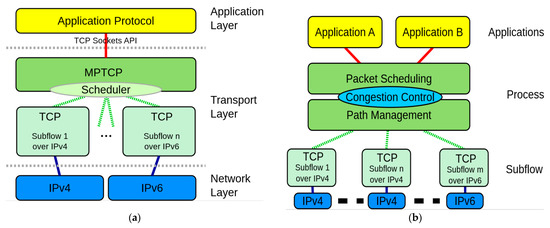
Figure 1.
The architecture of MPTCP: (a) protocol stack; (b) functions.
With the rapid development of various access technologies, mobile communications, satellite communications and Star Link technologies, multi-network convergence has become an inevitable direction of future network development. Therefore, heterogeneous fusion communication of the next generation Internet is a general case, while homogeneous fusion network communication is a special case. When MPTCP integrates the interconnection of different path attributes and path qualities into a single concurrent transport, many problems arise in multi-path transport systems, which will produce many issues.
Issue 1: The FullMesh path management algorithm uses all available subflows to transmit concurrently, without considering the characteristics of subflows and traffic. The path characteristic data characteristic (PCDC) algorithm [6] introduces the impact factor (IF) of each subflow, only these subflows whose IF is greater than 0 can participate in concurrent transmission. Practice has proven that the concurrent use of all subflows does not necessarily improve the overall performance of the network, or even drag down the system, resulting in the reduction of throughput [6]. This is especially true in heterogeneous converged networks. However, it is not the best way to access only the subflows with IF greater than 0, because the network environment and load are changing rapidly. The IF at one moment is greater than 0, and at the next time it may be less than 0. Therefore, according to the transmission scenario, only a dynamic selection by the PM algorithm is in line with the actual scenario, but how to choose it remains to be solved.
Issue 2: In heterogeneous networks, computing the buffer size B of a multi-path concurrent transmission with the traditional formula will greatly increase the buffer size requirements of devices at each end, because the calculation formula of buffer size is to sum the bandwidths BW of each subflow of the concurrent transmission, and then multiply by the sum of the maximum round-trip time (RTT) RTT and the maximum retransmission timeout (RTO) RTO. Then, the formula for B is as follows [7]:
A much more detailed introduction of the underlying mechanisms is provided in [7].
However, a large number of test studies show that configuration according to the above formula in multi-path transmission will cause a lot of waste of buffer resources.
Issue 3: At present, many congestion control (CC) algorithms are used in multi-path transmission systems, such as Cubic [8,9], Hybla [10], opportunistic linked-increases algorithm (OLIA) [11], Reno [12], Scalable [13], and Vegas [14]. In practice, it has been found that in order to achieve the best transmission performance in different scenarios of heterogeneous multi-path transmission, the CC algorithm used is also different. How to choose different CC algorithms dynamically, according to the different transmission scenarios, has not been solved.
At present, no one has proposed a comprehensive technology to solve the above problems. Therefore, this paper proposes an algorithm to concurrently optimize the performance indicators (such as throughput, buffer size, PM, and CC) of a multi-path transmission system to achieve the overall improvement.
This paper is organized as follows: In Section 2, we briefly introduce the PM, CC and buffer configuration. The MPCOA algorithm is proposed in Section 3. Section 4 describes the measurement scenario design, and Section 5 shows the measurement results and detailed data analysis. Finally, Section 6 concludes this paper.
2. Path Management, Congestion Control and Buffer Configuration
2.1. Path Management Algorithms
As shown in Figure 1, PM is a major part of MPTCP. Using a PM algorithm, subflows can be dynamically added or deleted to participate in the concurrent transmission. The FullMesh is designed to create all possible connections or subflows between the client and the server by attempting to connect each network interface of the client to each interface of the server. It establishes the full mesh of the subflows [15]. One subflow is created for each network interface on the client side. The current implementation of the FullMesh subflow is static. The subflows are created immediately after the creation of the initial subflow. It can create a subflow for each network layer address, like IPv4 and IPv6. For the client that has N network layer addresses and the server that has M network layer addresses, FullMesh path manager will establish MN subflows, which is probably not optimal in the most of scenarios and the desired throughput might not be obtained.
The PCDC PM, proposed by our team in [6], is based on path characteristic and data characteristic, in which a subflow’s IF is used as a subflow characteristic to predict the impact of a subflow on the overall network throughput. The previous studies of our research group have shown that the IF of the subflow can be used to quantitatively describe the contribution rate of the current subflow to the overall transmission performance of the network payload communication. The IF of a subflow is described by the degree of influence on the throughput of the whole network payload, and the throughput of other subflows after a certain subflow does not participate in the payload transmission. This can be categorized into positive and negative IF effects. When a subflow does not participate in the payload transmission, and the overall network throughput increases, it proves that the subflow plays a negative role in the overall payload transmission performance. On the other hand, the throughput decreases when the subflow does not participate in the payload transmission, proving that the subflow plays a positive role in the overall payload transmission performance.
2.2. Congestion Control Algorithms
The Internet is used by many independent users, and as we all know, its resources (link capacities) are always finite. If every user sends data at very high rate, it will cause congestion and packets will be dropped. If every user sends data at very low rate, then the resources of the network will not be properly utilized. Users need to send data at the correct rate, so that resources are well utilized and shared fairly. Congestion control algorithms can handle such issues properly, according to the heterogeneous network situation. Congestion control is used to regulate the congestion windows of subflows, in order to command each subflow’s rate of data transmission. In MPTCP, six kinds of CC algorithm are commonly used, which are Cubic, Reno, Hybla, Scalable, Vegas and OLIA.
Cubic [9] is the default algorithm used by Linux for TCP and MPTCP. It can achieve high-bandwidth connections over the network quickly and reliably in the face of high latency. The window size of Cubic is a cubic function of time since the last congestion incident, with the inflection point set to the window size former to the incident. Cubic window size is dependent only on the last congestion event.
Reno [12] is the IETF standard for TCP CC. It improves retransmission during the fast-recovery phase of TCP Reno. Reno can send new packets at the end of the congestion window during fast recovery by maintaining high throughput.
Hybla [10] makes sure of fairness between subflows with different RTTs through calculating the congestion window increase. Hybla aims to remove penalties to TCP connections that incorporate high-latency terrestrial or satellite radio links. These issues stem from packet loss due to inaccuracy in the transmission link being mistaken for congestion and long RTTs.
Scalable [13] aims to make the recovery time from loss events constant, regardless of the window size. Efficiently, this procedure keeps halving the throughput until packet loss stops. Once the packet loss is moderate, a slow start kicks in to slope the speed back up.
Vegas [14] is a congestion avoidance TCP algorithm that highlights data packet delay, rather than data packet loss, as a signal to command the rate at which to send packets. It detects congestion at an incipient stage based on increasing RTT values of the packets in the connection, unlike other CC flavors such as Reno, Cubic, etc., which acknowledges congestion only after it has actually happened via data packet loss. Vegas makes fixed size data packet adjustment to the rate, independent of how far the current rate is from the target rate. It estimates the queuing delay, and linearly increases or decreases the window so that a constant number of packets per flow are queued in the network. Vegas implements proportional fairness.
OLIA [11] is a further advancement of linked increases (LIA) [16], which is a coupled algorithm. OLIA (and LIA) are based on Reno, and just add the path coupling. OLIA is the main coupled algorithm of Linux MPTCP. OLIA gives better TCP fairness and best congestion balancing. However, the problem with OLIA is that it can be unresponsive to changes in the network situations in some cases like when the paths used by a user all have similar RTT.
2.3. Buffer Function and Configuration
Buffers are utilized to decrease packet loss by a compelling continuous burst of traffic when routers cannot forward them at that moment. They are instrumental in keeping output links completely utilized through congestion times. Data packets that are being transmitted or have been sent but not yet acknowledged by the receiver side, are still stored in the send buffer. Since there may be a need for a retransmission, the data needs to be remained in the send buffer until it is finally acknowledged by a receiver side.
Modern TCP implementations [12] apply fast retransmission, i.e., once a packet is seen as missing (by analysis the incoming acknowledgements) three times, it is immediately scheduled for retransmission. Further retransmissions are scheduled by the retransmission timer set to a dynamically configured retransmission timeout. While fast retransmissions are repeated (because of the network’s feedback on congestion by packet losses), timer-based retransmissions should be rare (they are usually a sign of severe network congestion). Clearly, in the ideal case, a packet is completely transmitted and acknowledged by the receiver side. In this case, it takes only one RTT to receive the data packet acknowledgement.
While using MPTCP, the buffer handling becomes difficult and challenging. These challenges are generic and apply to other multi-path transport protocols, particularly to concurrent multi-path transfer for the stream control transmission protocol (CMT-SCTP) [7,17] as well.
For MPTCP, send and receive buffers are shared among all subflows. When path characteristics (i.e., bandwidth, delay, loss rate and error rate) become different, which is very likely when using the Internet, blocking issues can occur. That is, as shown by [7,18], some low-performance subflows may hold a major share of the buffers, leaving no room to fully utilize other subflows. Mechanisms like buffer splitting [19], non-renegable selective acknowledgements [20,21], chunk rescheduling [7,19], opportunistic retransmission [22], buffer bloat mitigation [23] and smart scheduling decisions [23,24] are necessary to avoid these issues. However, in any case, the buffers must be big enough to cope with the maximum RTT of any of the subflows. Considering a server with hundreds, thousands, or even more concurrent connections, this becomes expensive and inefficient. Timer-based retransmissions may also be incorporated in the computation, and the buffer size requirements become inconveniently large. Furthermore, it is principal to note that an RTO of 1 s is still quite small, and much higher values e.g., in case of buffer-bloated ADSL or 2G/3G networks [18,25] are not unusual. The RTO setting is dynamically calculated according to [7,12].
As discussed above, in heterogeneous networks, computing the buffer size of concurrent multi-path transmission with the traditional formula (Equation (1)), will greatly increase the buffer configuration of devices at each end, and usually cause a significant waste of buffer resources.
3. MPCOA Algorithm
Based on the above description, this paper puts forward a comprehensive optimized algorithm (referred to as MPCOA). The input/output parameter set of this algorithm can be expressed as follows.
Input parameter set:
where,
- TOP: = [Site Name, Internet Service Provider, Bandwidth], a topology structure information set of heterogeneous transmission network;
- PM: = {PCDC, FullMesh}, a set of path management policies, an enumerated value;
- CC: = {Cubic, OLIA, Hybla, Reno, Scalable, Vegas}, a set of congestion control algorithms, an enumerated value.
Output set of optimized performance indicators:
where,
- OTP: = the relative maximum throughput, which is the main constraint of this algorithm;
- OBS: = the relative minimum buffer size;
- OCC: = the suitable CC algorithm, one of CC;
- OPM: = the suitable PM policy, one of PM.
- These four parameters are output simultaneously.
According to the definition of above IPS and OOPS two sets, the MPCOA can be expressed by the following function:
The function F can be decomposed into the following five sub-functions f1, …, f5, which can be seen in Equations (3)–(8) respectively. The corresponding algorithm execution steps are illustrated in Figure 2.
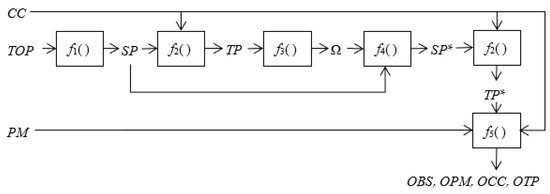
Figure 2.
Algorithm working mechanism.
This algorithm involves the following key steps:
- According to the topology of the MPTCP network, the available subflow’s set is obtained,where Ns is the number of interfaces at the sending side (i.e., the number of local ISPs); Mr is the number of interfaces at the receiving side (i.e., the number of remote ISPs). Actually, this available subflows of SP are all used for transmission in FullMesh policy;
- Based on the set of input parameters, the throughput TP of each available subflow can be measured,
- With the obtained TP, the IF value Ω of all available subflows are calculated by:where Ωi is the IF value of i-th subflow, TP0(t) is the total throughput at the time t, TPi(t) is the throughput at time t when the i-th subflow does not participate in transmission, and T is the transmission time, see Figure 3. In Figure 3, from time 0 to time T, all subflows participate in transmission, and the throughput TP0(t) at each time is calculated, which is a function of time t (t[0, T]). From time T to time 2T, the i-th subflow (i[1, N]) does not participate in the transmission, other subflows continue to transmit data, and the throughput TPi(t) is calculated which is also a function of time t (t[T, 2T]). Then the IF value Ω can be calculated by Equation (5);
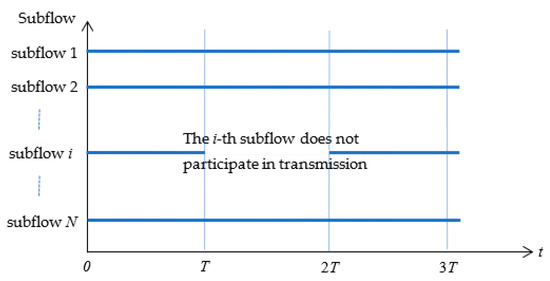 Figure 3. Time sequence diagram of measuring impact factor of subpath.
 - Using IF value, the available subflow set SP is divided into optional subflow subset SP* and standby subflow subset. The optional subflow SP* is used for transmission in PCDC,
- According to the SP* sets obtained in Step 4 and CC, remeasure the throughput to obtain TP* (for FullMesh, throughput does not need to remeasure, TP is TP*),
- Based on the result of Step 5, taking the input parameter set CC, PM, TP* and BS as input, a prediction model between buffer size BS and throughput TP, which varies with CC and PM, can be established by using multiple regression analysis method through a scikit-learn tool [26]. The model shows like function f5, see Equation (8). When the most essential two criteria values of prediction model after N times run: once R-Squarer and p-value have reached the idea range (R-Square ≥ 0.90 (interval [0, 1]) and p-value ≤ 0.05), which means that this prediction model is a commonly accepted in statistical society. The detail of model construction can be seen in [4],
- Obtain the comprehensive optimized outputs. The final goal of this algorithm is to find the minimum buffer size BS when maximizing the throughput TP, and determine the corresponding PM and CC accordingly,
However, when the throughput is maximum, the corresponding BS is not the minimum. Therefore, we need to seek the minimum BS in a certain range (e.g., 1 − δ) of the maximum throughput, and obtain the minimum value of BS by sacrificing δ throughput, e.g., empirical value δ = 7%, which can be mathematically described as follows:
According to the corresponding i and j, the corresponding output can be given as follows,
Algorithm 1 shows the pseudo code.
| Algorithm 1:MPCOA | |
| 1: | Inputs: CC = {Cubic,OLIA,Hybla,Reno,Scalable,Vegas}, PM = {PCDC, FullMesh}, TOP = [Site Name, ISP, Bandwidth] |
| 2: | Outputs: OTP, OBS, OCC, OPM |
| 3: | Initialize: BS = {0.5,1.0,1.5,…,30.0}, SP* = {}, δ = 0.07 |
| 4: | Start: |
| 5: | Obtain SP from TOP |
| 6: | For cc in CC do |
| 7: | For pm in PM do |
| 8: | If pm is PCDC then |
| 9: | Calculate TPi for each subflow spi in SP, then obtain Ωi |
| 10: | |
| 11: | If Ωi > 0 then |
| 12: | SP* = SP* + spi |
| 13: | End If |
| 14: | Else If pm is FullMesh then |
| 15: | SP* = SP |
| 16: | End If |
| 17: | End For |
| 18: | Measure and obtain the throughput TP* |
| 19: | Using sklearn.LinearRegression(BS,PM,TP*), get the regression model |
| 20: | |
| 21: | Calculate the maximum tpcc of TP |
| 22: | Calculate the minimum bscc in [(1-δ)tpcc, tpcc] according to the inverse function |
| 23: | End For |
| 24: | bsmin = min(bscc) |
| 25: | OBS = bsmin |
| 26: | Making use of OBS and the function , obtain OTP, OCC and OPM |
| 27: | Outputs: OTP, OBS, OCC, OPM |
Note that MPCOA can control the usage of subflows for the transport of user data. Regardless of whether subflows are used or not, they are always established. That is, the resilience of plain MPTCP remains: as long as there is at least one working subflow in each direction, the connection does not break. If a subflow used for data transmission is detected as broken, the best currently unused subflow—according to its IF value—can be used.
For our proof-of-concept evaluation in Section 5, we implemented MPCOA by Python code interacting with the kernel to control the subflow usage. For the future, we plan to integrate it directly into the kernel as additional path manager module.
4. Measurement Scenario
We designed measurement scenarios on the distributed and programmable nodes of the NorNet Core testbed [27,28,29] to verify our proposed algorithm, which were spread over 23 sites on four continents. These sites were multi-homed systems and connected with multiple different ISPs over different access technologies, and most of them deployed IPv4 as well as IPv6. Figure 4 shows the sites and connectivity of the testbed.
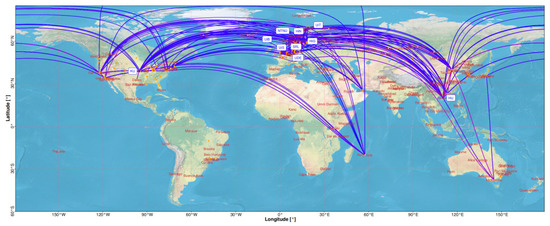
Figure 4.
The NorNet Core sites and their connectivity in the Internet.
In order to verify the performance and reliability of our proposed algorithm, considering geographical distribution and heterogeneity of networks [27,30], we chose six sites, and their detailed information is listed in Table 1. In this paper, we planned three measurement scenarios. In order to avoid experimental error, the average value of at least nine measurement runs was taken, over a time period of several days—including working days as well as weekends—to make sure we covered different times of the day. The effective throughput of the network was measured within a certain time (30 s). For buffer experiment, the buffer size started from 0.5 MiB, and we designed the step size with 0.5 MiB value up to the limit of 30 MiB, in total 60 sampling points for each run. The following Linux kernel setups and tools were used for the experiment:

Table 1.
The NorNet Core sites used for the measurements in this paper.
- Ubuntu Linux 16.04 “Xenial Xerus” LTS with Linux kernel version 4.19.128;
- Linux MPTCP version 0.95;
- Buffer size limit set to 30 MiB, unless otherwise specified, to prevent throughput limitations by lack of buffer space [2].
The bandwidth measurements were performed by using the NetPerfMeter (NetPerfMeter: https://www.uni-due.de/~be0001/netperfmeter/ (accessed on 10 August 2021)) [7,31,32] tool. It measures the application payload throughput performance of different transport connections and protocols. In particular, MPTCP was supported by NetPerfMeter as well [33,34]. Furthermore, it allowed us to configure the send and receive buffer sizes for a connection by using the SO_SNDBUF and SO_RCVBUF socket options.
Note that the sites of Table 1 contain independent ISP connections, i.e., multiple paid subscriptions for Internet access. As discussed in [35], there are different perspectives of “fairness” for multi-path transport. In our case here, we did not assume that all subflows are guaranteed to be disjointed. However, since we paid for each ISP independently, we assumed that it was “fair” to use each of the sites’ ISP as it would be the site’s only connection to the Internet.
Note further that while the ISP connections of Table 1 look static, there is ongoing variation in the network layer’s routing, depending on different times of the day. We provide an analysis of such details in our paper [27], by analyzing HiPerConTracer measurements in detail. For this paper, we assumed the underlying network layer behavior as given (since MPTCP has no influence on the underlying routing). We covered the variation, as seen in Figure 4, by multiple runs over several days (see above).
5. Result Analysis
In this section, we chose six sites from the NorNet Core testbed and design three scenarios to test the performance of the proposed algorithm. The effective throughput of the network was measured within 30 s. Six CC algorithms (Cubic, OLIA, Hybla, Reno, Scalable, and Vegas) and two path management algorithms (FullMesh and PCDC) were considered for comparison.
The scenarios in this section were chosen to present three different kinds of scenarios:
- An inter-continental setup (between Norway and China) in Section 5.1;
- A regional setup (between two cities in Norway) in Section 5.2;
- A trans-continental setup (between two cities in different countries of Europe) in Section 5.3.
For the sites, we used NorNet Core sites with different access technologies (research network, business-grade fiber, consumer-grade fiber and ADSL) to have heterogeneous network connectivity.
5.1. SRL to HU
In this scenario, we examined an inter-continental transmission between SRL in Norway and HU in China (see Table 1). The geographical distance between the two sites is around 8600 km, and the network communication [15,27] can take paths from Europe westwards via North America to Asia, as well as from Europe eastwards directly to Asia. SRL is connected with consumer-grade ADSL connections from PowerTech and Telenor, the Norwegian research network fiber connection from Uninett, and a business-grade fiber connection from Kvantel. HU is connected via the research network from CERNET, and the consumer-grade fiber connection from China Unicom (CnUnicom). Therefore, according to Equation (3), the total number of subflows is 8, and the subflows are named K-C, K-CU, P-C, P-CU, T-C, T-CU, U-C, and U-CU. For simplification, we label the subflows according to the “abbreviated ISP name at local site”-“abbreviated ISP name at remote site” (see Table 1; e.g., K-C refers to Kvantel-CERNET).
First, we measured the throughput utilizing Equation (4), and then calculated the of each subflow using Equation (5). The results of three scenarios are listed in Table 2, for each CC and combination of ISPs. Based on the results from Table 2, the optional subflow subset can be obtained according to Equation (6), as shown in Table 3, and the throughput is re-measured by Equation (7).
Table 2.
Impact factors for SRL to HU, UNIS to HiN, and UiT to HAW.
Table 3.
Optional subflow subsets for SRL to HU, UNIS to HiN, and UiT to HAW.
Taking the CC, PM and BS as input, the prediction model of them with recalculated throughput can be established by multiple regression analysis according to Equation (8) in Section 3. Following the Step 7 in Section 3, we find the minimum BS in a certain range of maximum throughput. By using Equation (9), the relationship between BS and throughput for each CC and PM is obtained, as shown in Equation (13). The calculation results based on Equation (13) are presented in Table 4 (e.g., when PM is FullMesh, for Cubic, CC1 = 1, CC2 = CC3 = CC4 = CC5 = CC6 = 0, then tp = 3.49 + 4.85bs−0.15bs2).
Table 4.
Maximum throughput calculation with different PM and CC for SRL to HU, UNIS to HiN, and UiT to HAW.
Table 4 shows that the R-square value 0.80 is less than 0.90, due to the volatility of the data. A detailed analysis of the SRL-HU site connectivity is presented in [26]: There is a significant performance variance of the underlying intercontinental connections during the day, depending on network usage during office hours, etc. The p-value of each variable is less than 0.00001. For example, p-value of coefficient 4.17 is <0.00001, indicating that there is less than 0.00001 probability that impact of variable bs on tp is null, i.e., buffer size does significantly affect throughput. Nevertheless, Equation (13) is still the best model we may get. From Table 4, it is easy to calculate the maximum throughput which is tpmax = 80.27 Mbit/s, and the corresponding BS is bs = 18.12 MiB, PM is PCDC and CC is Hybla. Considering Equation (10), with sacrificing δ = 7% the throughput, the throughput is 74.65 Mbit/s, and the corresponding buffer size is 12.36 MiB. 7% is the empirical value obtained through many experiments. Since buffer resources are more precious, we can reduce the waste of buffer resources by sacrificing a little throughput without affecting network performance. Therefore, the final output of the MPCOA algorithm is OBS = 12.36 MiB, OPM = PCDC, OCC = Hybla, and OTP = 74.65 Mbit/s.
Figure 5 shows the relationship between buffer size and throughput, and illustrates how Equation (13) fits the data. As shown in Figure 5, PCDC with Hybla can achieve the highest throughput when the buffer size is around 18 MiB. Note that an overly large buffer—while being sufficiently big to cover a full bandwidth-RTT product—leads to “buffer bloat” [36,37]: when reaching the network capacity, queues in routers start filling up, increasing the RTT, and therefore leading to a slower reaction time on packet loss. This causes a reduced performance, i.e., for buffer sizes that are too high, the throughput decreases again. Therefore, it is not that the larger the buffer size, the better the throughput performance. It is necessary to obtain the buffer size by the MPCOA algorithm.
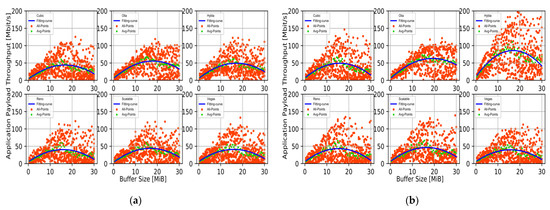
Figure 5.
Relationship between buffer size and throughput for SRL to HU with: (a) FullMesh; (b) PCDC.
Figure 6 presents the throughput test results on the NorNet Core testbed for both path managers and all CC algorithms without considering the MPCOA algorithm, where the buffer size is set to be 30 MiB. In addition to the average shown by the main bars, the thin error bars present the range from absolute minimum to maximum, and the thick error bars show the range from 10% quantile to 90% quantile. As can be seen, the performance of PCDC with different CC is better than that of FullMesh with different CC. For Cubic, 26.7 Mbit/s of FullMesh vs. 32.6 Mbit/s of PCDC; For Reno, 30.8 Mbit/s vs. 33.8 Mbit/s; For Scalable, 27.5 Mbit/s vs. 34.9 Mbit/s; For Vegas, 29.2 Mbit/s vs. 31.2 Mbit/s; For OLIA, 43.0 Mbit/s vs. 50.2 Mbit/s. In particular, for Hybla, PCDC can achieve much better performance than FullMesh, 41.7 Mbit/s of FullMesh vs. 71.9 Mbit/s of PCDC, i.e., 72.4% improvement. Obviously, for this scenario, the actual test results show that PCDC with Hybla is the best option to obtain the maximum throughput.
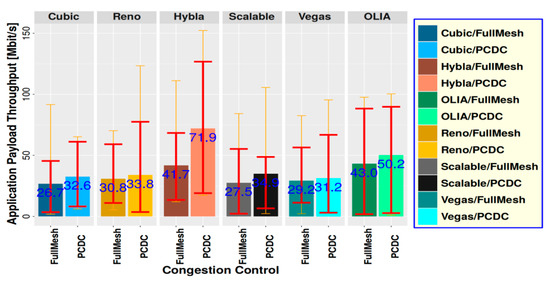
Figure 6.
Throughput test results on NorNet Core testbed for SRL to HU with different PM and CC, without MPCOA.
Comparing the output of the MPCOA algorithm with the test results shown in Figure 6, we can find that our MPCOA algorithm can indeed provide an optimized solution for SRL-HU. We also use Equation (10) to deal with the following two scenarios, and a reasonable amount of buffer resource can be saved with sacrificing a small proportion throughput.
5.2. UNIS to HiN
In this scenario, we examined an inter-city transmission between UNIS and HiN in the same country (see Table 1). The distance between the site of HiN and the site of UNIS is around 1089 km. UNIS is located in Longyearbyen, on the remote island of Spitsbergen, about 1200 km from the North Pole. Uninett is the Norwegian research network ISP (fiber), while BKK is a commercial ISP providing a business-grade fiber connection. Telenor provides a consumer-grade fiber connection. For FullMesh and PCDC path management, according to Table 1, the total number of effective subflows is six and the names of subflows are Uninett-Uninett, Uninett-Broadnet, Uninett-PowerTech, Telenor-Uninett, Telenor-Broadnet, and Telenor-PowerTech. See Table 2 for the values of the IF .
Based on the results from Table 2, according to Equation (6), the optional subflow subset is obtained for each CC, as shown in Table 3. Then, the throughput is remeasured. Taking the CC, PM and BS as input, the prediction model of them with recalculated throughput can be established by multiple regression analysis. Following step 7 in Section 3, we find the minimum BS in a certain range of maximum throughput. By using Equation (8), the relationship between BS and throughput for each CC and PM is obtained, as shown in Equation (14). The calculation results are presented in Table 4. The R-square value is 0.94, which is very close to 1, indicating that Equation (14) is a good fit. The p-values are less than 0.00001. Overall, this output shows that Equation (14) is a good model.
From Table 4, we find the maximum throughput is tpmax = 286.73 Mbit/s, and the corresponding BS is bs = 17.83 MiB when PM is PCDC and CC is Cubic. Considering Equation (10), by sacrificing δ = 7% throughput, the final output of the MPCOA algorithm is OBS = 9.22 MiB, OPM = PCDC, OCC = Cubic and OTP = 266.66 Mbit/s. Figure 7 presents the throughput test results on NorNet Core testbed for both path managers and all CC algorithms without considering MPCOA algorithm, where the buffer size is set to be 30 MiB. The test results show that the combination of PCDC and Cubic with the maximum throughput of 274.2 Mbit/s is the best choice, which is consistent with the MPCOA output.
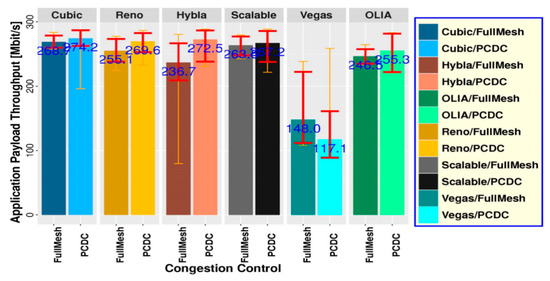
Figure 7.
Throughput test results on NorNet Core testbed for UNIS to HiN with different PM and CC, without MPCOA.
5.3. UiT to HAW
In this scenario, we examined an inter-national transmission between UiT and HAW in the same continent (see Table 1). The distance between the site of UiT and the site of HAW is around 1847 km, both are located in different European countries. In particular, UiT with 2 ISPs is located in Tromsø, a city in northern Norway, and HAW with 1 ISP is located in Hamburg, Germany. For FullMesh and PCDC, using Equation (3), the total number of subflows is two, and the names of subflows are PowerTech-DFN and Telenor-DFN for every CC. Table 2 gives the IF values, which show that all subflows can be used for transmission in PCDC. Therefore, in this scenario, the SP* used in PCDC is equivalent with the SP used in FullMesh.
By using the same method to handle this scenario as above two scenarios, we obtained Figure 8, Equation (15) and Table 4. The R-squares and p-values in Table 4 show that Equation (15) is a good model.
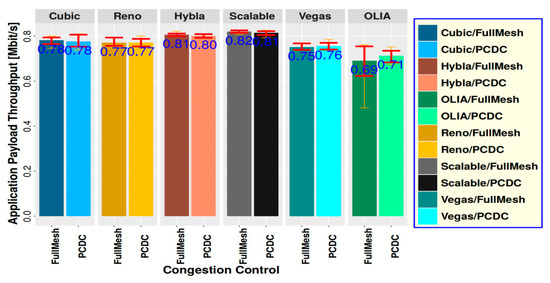
Figure 8.
Throughput test results on NorNet Core testbed for UiT to HAW with different PM and CC, without MPCOA.
From Table 4, we find the maximum throughput is tpmax = 0.87 Mbit/s, and the corresponding BS is bs = 30 MiB when CC is Scalable, and PM could be either FullMesh or PCDC. Actually, from Table 1, we can see that the two ISPs of UiT almost have the same bandwidth, and therefore the networks between UiT and HAW are homogeneous networks, where the IFs of all subflows are positive, see Table 2. In this case, PCDC is equivalent to FullMesh. In other words, both PM algorithms can achieve almost the same performance. Since PCDC is more complicated than FullMesh, we can directly choose to use FullMesh in a homogeneous network. According to Table 4, when bs decreases, tp does not change too much. Therefore, considering Equation (10), by sacrificing δ = 7% throughput, the final output of MPCOA algorithm is OBS = 0.5 MiB, OPM = FullMesh, OCC = Scalable and OTP = 0.81 Mbit/s. Comparing BS = 30 MiB and OBS = 0.5 MiB, it can be seen that a lot of buffer resource is saved by using Equation (10).
Figure 8 shows that for scenario UiT-HAW, the best choice is FullMesh and Scalable with throughput of 0.82 Mbit/s. The actual test results are consistent with the output results given by the MPCOA algorithm.
5.4. Optimized Solutions
Table 5 presents the optimized solutions for three scenarios. We can see that the different suitable PM and CC are used for different scenarios. In heterogeneous networks, such as the scenarios in Section 5.1 and Section 5.2, PCDC is more suitable than FullMesh. However, the scenario in Section 5.3 actually is a homogeneous network, therefore PCDC is equivalent to the FullMesh algorithm, FullMesh is a special case of PCDC. Considering the complexity of PCDC, it is recommended to choose FullMesh directly in homogeneous networks, and choose PCDC in heterogeneous networks.
Table 5.
Solutions for three scenarios.
The results of the above three scenarios have exhibited the dynamic relationship of mutual influence and action from ISP, impact factor , SP, SP*, OCC and OTP as well as OBS multi-parameters in a running MPTCP system, and the MPCOA algorithm can capture the relationship correctly, and make effective judgments and provide the optimized outputs consistent with the reality. Meanwhile, for comparison, we also calculated the traditional solutions of buffer size using Equation (1) and list the comparison results in Table 5. It is very clear that the OBSs given by MPCOA algorithm are much lower than traditional solutions, only 3.76% of traditional solutions for SRL-HU, 17.07% for UNIS-HiN and 40.98% for UiT-HAW. That is, MPCOA can save at least 50% of buffer resources by sacrificing 7% of throughput.
6. Conclusions and Outlook
In this work, we utilize our multi-parameter comprehensive optimized algorithm (MPCOA) algorithm proposed in Section 3, trying to obtain optimized multi-performance parameter output in MPTCP networks. The results of three scenarios involving six sites of the multi-homed NorNet Core testbed in Section 5 show that it is feasible to increase the network performance by choosing appropriate PM and CC and setting reasonably small buffer size. Using the MPCOA algorithm can improve the throughput and reduce the waste of buffer resources. Actually, the MPCOA algorithm first tries to find the minimum BS, appropriate CC algorithm and PM algorithm while maximizing the throughput. However, if the throughput is maximum, the corresponding BS is usually not the minimum. In this case, the algorithm will seek the minimum BS in a certain range of maximum throughput, and find the minimum size of BS by sacrificing δ throughput. Through repeated experiments in multiple scenarios, we can draw four useful conclusions: (1) for homogeneous networks, the path management algorithm can choose FullMesh directly; (2) for heterogeneous networks, PCDC can be directly used for path management; (3) δ generally takes the empirical value of 7%. If the buffer resource is tight, a larger δ can be selected. If the communication scenario has sufficient buffer resource and requires higher throughput, δ can be set smaller, or even set to 0; (4) when the MPCOA algorithm is used in practice, because regression modeling takes a long time, we can directly set the buffer size according to 50% of the traditional solution, which can greatly save time. Of course, this is only a compromise due to the current lack of computing power.
As part of our ongoing and future work, we are going to further observe the usage of the sacrificing factor δ for different corner scenarios, and analyze more corner cases, such as the examined inter-continental setup with its very dissimilar paths and highly volatile path characteristics. Furthermore, we are working on the impact of the MPCOA path manager on bottlenecks and scheduler policies to maximize MPTCP’s performance benefits in heterogeneous networks.
Author Contributions
Conceptualization, X.Z. and T.D.; methodology, M.C.; software, M.W.R. and T.D.; validation, M.C., and X.Z.; formal analysis, M.C., X.Z. and T.D.; investigation, Y.T.; resources, M.W.R. and T.D.; data curation, M.W.R. and Y.T.; writing—original draft preparation, M.C. and M.W.R.; writing—review and editing, M.C. and X.Z.; visualization, M.W.R.; supervision, X.Z. and Y.T.; project administration, X.Z. and M.C.; funding acquisition, M.C. and X.Z. All authors have read and agreed to the published version of the manuscript.
Funding
This work was supported in part by the National Natural Science Foundation of China under Grant No. 61662020, and in part by the Hainan Provincial Natural Science Foundation of China under Grant No. 620MS023, in part by the CERNET NGI Technology Innovation Project under Grant No. NGII20160110, and in part by the Research Council of Norway (Forskingsrådet, No. 208798/F50).
Institutional Review Board Statement
Not applicable.
Informed Consent Statement
Not applicable.
Data Availability Statement
Not applicable.
Acknowledgments
The authors would like to thank the editors and the reviewers for their valuable time and constructive comments.
Conflicts of Interest
The authors declare no conflict of interest.
References
- Ford, A.; Raiciu, C.; Handley, M.; Bonaventure, O. TCP Extensions for Multipath Operation with Multiple Addresses. IETF, RFC 6824. January 2013. Available online: https://datatracker.ietf.org/doc/rfc6824/ (accessed on 18 June 2021).
- Zhou, F.; Dreibholz, T.; Zhou, X.; Fu, F.; Tan, Y.; Gan, Q. The Performance Impact of Buffer Sizes for Multi-Path TCP in Internet Setups. In Proceedings of the IEEE International Conference on Advanced Information Networking and Applications (AINA), Taipei, Taiwan, 27–29 March 2017; pp. 9–16. [Google Scholar]
- Postel, J.B. Transmission Control Protocol. IETF, Standards Track RFC 793. September 1981. Available online: https://datatracker.ietf.org/doc/rfc793/ (accessed on 18 June 2021).
- Tan, Q.; Yang, X.; Zhao, L.; Zhou, X.; Dreibholz, T. A Statistic Procedure to Find Formulae for Buffer Size in MPTCP. In Proceedings of the 3rd IEEE Advanced Information Technology, Electronic and Automation Control Conference (IAEAC), Chongqing, China, 12–14 October 2018; pp. 900–907. [Google Scholar]
- Wang, K.; Dreibholz, T.; Zhou, X.; Fu, F.; Tan, Y.; Cheng, X.; Tan, Q. On the Path Management of Multi-Path TCP in Internet Scenarios based on the NorNet Testbed. In Proceedings of the IEEE International Conference on Advanced Information Networking and Applications (AINA), Taipei, Taiwan, 27–29 March 2017; pp. 1–8. [Google Scholar]
- Chen, M.; Dreibholz, T.; Zhou, X.; Yang, X. Improvement and Implementation of a Multi-Path Management Algorithm Based on MPTCP. In Proceedings of the 45th IEEE Conference on Local Computer Networks (LCN), Sydney, New South Wales, Australia, 16–19 November 2020; pp. 134–143. [Google Scholar]
- Dreibholz, T. Evaluation and Optimisation of Multi-Path Transport using the Stream Control Transmission Protocol. Habilitation Treatise, University of Duisburg-Essen, Faculty of Economics, Institute for Computer Science and Business Information Systems. March 2012. Available online: https://www.simula.no/publications/evaluation-and-optimisation-multi-path-transport-using-stream-control-transmission (accessed on 18 June 2021).
- Rhee, I.; Xu, L.; Ha, S.; Zimmermann, A.; Eggert, L.; Scheffenegger, R. CUBIC for Fast Long-Distance Networks. IETF, Informational RFC 8312. February 2018. Available online: https://datatracker.ietf.org/doc/rfc8312/ (accessed on 18 June 2021).
- Ha, S.; Rhee, I.; Xu, L. CUBIC: A New TCP-friendly High-Speed TCP Variant. ACM SIGOPS Oper. Syst. Rev. 2008, 42, 64–74. [Google Scholar] [CrossRef]
- Firrincieli, C. TCP Hybla: A TCP Enhancement for Heterogeneous Networks. Int. J. Satell. Commun. Netw. 2005, 22, 547–566. [Google Scholar]
- Khalili, R.; Gast, N.G.; Popovic, M.; Boudec, J.Y.L. Opportunistic Linked-Increases Congestion Control Algorithm for MPTCP. IETF, Individual Submission, Internet Draft Draft-Khalili-Mptcp-Congestion-Control-05. July 2014. Available online: https://datatracker.ietf.org/doc/html/draft-khalili-mptcp-congestion-control (accessed on 18 June 2021).
- Allman, M.; Paxson, V.; Blanton, E. TCP Congestion Control. IETF, Standards Track RFC 5681. September 2009. Available online: https://datatracker.ietf.org/doc/rfc5681/ (accessed on 18 June 2021).
- Kelly, T. Scalable TCP: Improving Performance in Highspeed Wide Area Networks. SIGCOMM Comput. Commun. Rev. 2003, 33, 83–91. [Google Scholar] [CrossRef]
- Brakmo, L.S.; O’Malley, S.W.; Peterson, L.L. TCP Vegas: New Techniques for Congestion Detection and Avoidance. In Proceedings of the ACM SIGCOMM Conference, London, UK, 31 August–2 September 1994; pp. 24–35. [Google Scholar]
- Becke, M.; Adhari, H.; Rathgeb, E.P.; Fu, F.; Yang, X.; Zhou, X. Comparison of Multipath TCP and CMT-SCTP based on Intercontinental Measurements. In Proceedings of the IEEE Global Communications Conference (GLOBECOM), Atlanta, GA, USA, 9–13 December 2013; pp. 1360–1366. [Google Scholar]
- Raiciu, C.; Handley, M.; Wischik, D. Coupled Congestion Control for Multipath Transport Protocols. IETF, RFC 6356. October 2011. Available online: https://datatracker.ietf.org/doc/rfc6356/ (accessed on 18 June 2021).
- Dreibholz, T.; Rüngeler, I.; Seggelmann, R.; Tüxen, M.; Rathgeb, E.P.; Stewart, R.R. Stream Control Transmission Protocol: Past, Current, and Future Standardization Activities. IEEE Commun. Mag. 2011, 49, 82–88. [Google Scholar] [CrossRef]
- Adhari, H.; Dreibholz, T.; Becke, M.; Rathgeb, E.P.; Tüxen, M. Evaluation of Concurrent Multipath Transfer over Dissimilar Paths. In Proceedings of the 1st International Workshop on Protocols and Applications with Multi-Homing Support (PAMS), Singapore, 22–25 March 2011; pp. 708–714. [Google Scholar]
- Dreibholz, T.; Becke, M.; Rathgeb, E.P.; Tüxen, M. On the Use of Concurrent Multipath Transfer over Asymmetric Paths. In Proceedings of the IEEE Global Communications Conference (GLOBECOM), Miami, FL, USA, 6–10 December 2010; pp. 1–6. [Google Scholar]
- Natarajan, P.; Ekiz, N.; Yilmaz, E.; Amer, P.D.; Iyengar, J.R. Non-Renegable Selective Acknowledgments (NR-SACKs) for SCTP. In Proceedings of the 16th IEEE International Conference on Network Protocols (ICNP), Orlando, FL, USA, 19–22 October 2008; pp. 187–196. [Google Scholar]
- Deng, Z. Non-Renegable Selective Acknowledgements (NR-SACKs) for MPTCP. IETF, Individual Submission, Internet Draft Draft-Deng-Mptcp-Nrsack-00. December 2013. Available online: https://datatracker.ietf.org/doc/html/draft-deng-mptcp-nrsack-00 (accessed on 18 June 2021).
- Raiciu, C.; Paasch, C.; Barré, S.; Ford, A.; Honda, M.; Duchêne, F.; Bonaventure, O.; Handley, M. How Hard Can It Be? Designing and Implementing a Deployable Multipath TCP. In Proceedings of the 9th USENIX Conference on Networked Systems Design and Implementation (NSDI), San Jose, CA, USA, 25–27 April 2012; pp. 1–14. [Google Scholar]
- Ferlin, S.; Dreibholz, T.; Alay, Ö. Tackling the Challenge of Bufferbloat in Multi-Path Transport over Heterogeneous Wireless Networks. In Proceedings of the IEEE/ACM International Symposium on Quality of Service (IWQoS), Hong Kong, China, 26–27 May 2014; pp. 123–128. [Google Scholar]
- Hu, Q.; Zhou, R.; Zhou, L. Forward Prediction Data Scheduling Mechanism for MPTCP. Appl. Res. Comput. 2013, 30, 560–561. [Google Scholar]
- Ferlin, S.; Dreibholz, T.; Alay, Ö.; Kvalbein, A. Measuring the QoS Characteristics of Operational 3G Mobile Broadband Networks. In Proceedings of the 4th International Workshop on Protocols and Applications with Multi-Homing Support (PAMS), Victoria, BC, Canada, 13–16 May 2014; pp. 753–758. [Google Scholar]
- Scikit-Learn. Available online: https://scikit-learn.org/stable/supervised_learning.html#supervised-learning (accessed on 22 June 2021).
- Dreibholz, T. HiPerConTracer–A Versatile Tool for IP Connectivity Tracing in Multi-Path Setups. In Proceedings of the 28th IEEE International Conference on Software, Telecommunications and Computer Networks (SoftCOM), Split, Croatia, 17–19 September 2020; pp. 1–6. [Google Scholar]
- Dreibholz, T. NorNet at Hainan University in 2021: From Simulations to RealWorld Internet Measurements for Multi-Path Transport Research–A Remote Presentation. Keynote Talk at Hainan University, College of Information Science and Technology (CIST), Haikou, Hainan, China. January 2021. Available online: https://www.uni-due.de/~be0001/mptcp/ (accessed on 18 June 2021).
- Gran, E.G.; Dreibholz, T.; Kvalbein, A. NorNet Core–A Multi-Homed Research Testbed. Comput. Netw. 2014, 61, 75–87. [Google Scholar] [CrossRef] [Green Version]
- Golkar, F.; Dreibholz, T.; Kvalbein, A. Measuring and Comparing Internet Path Stability in IPv4 and IPv6. In Proceedings of the 5th IEEE International Conference on the Network of the Future (NoF), Paris, France, 3–5 December 2014; pp. 1–5. [Google Scholar]
- Dreibholz, T.; Becke, M.; Adhari, H.; Rathgeb, E.P. Evaluation of a New Multipath Congestion Control Scheme using the NetPerfMeter Tool-Chain. In Proceedings of the 19th IEEE International Conference on Software, Telecommunications and Computer Networks (SoftCOM), Split, Croatia, 15–17 September 2011; pp. 1–6. [Google Scholar]
- Dreibholz, T. NetPerfMeter: A Network Performance Metering Tool. Multipath TCP Blog. Available online: http://blog.multipath-tcp.org/blog/html/2015/09/07/netperfmeter.html (accessed on 18 June 2021).
- Fu, F.; Zhou, X.; Dreibholz, T.; Wang, K.; Zhou, F.; Gan, Q. Performance Comparison of Congestion Control Strategies for Multi-Path TCP in the NorNet Testbed. In Proceedings of the 4th IEEE/CIC International Conference on Communications in China (ICCC), Shenzhen, Guangdong, China, 2–4 November 2015; pp. 607–612. [Google Scholar]
- Dreibholz, T.; Zhou, X.; Fu, F. Multi-Path TCP in Real-World Setups–An Evaluation in the NorNet Core Testbed. In Proceedings of the 5th International Workshop on Protocols and Applications with Multi-Homing Support (PAMS), Gwangju, Korea, 24–27 March 2015; pp. 617–622. [Google Scholar]
- Becke, M.; Dreibholz, T.; Adhari, H.; Rathgeb, E.P. On the Fairness of Transport Protocols in a Multi-Path Environment. In Proceedings of the IEEE International Conference on Communications (ICC), Ottawa, ON, Canada, 10–15 June 2012; pp. 2666–2672. [Google Scholar]
- Cerf, V.; Jacobson, V.; Weaver, N.; Gettys, J. BufferBloat: What’s Wrong with the Internet? ACM Queue 2011, 9, 10–20. [Google Scholar] [CrossRef]
- Gettys, J. Bufferbloat: Dark Buffers in the Internet. IEEE Internet Comput. 2011, 15, 95–96. [Google Scholar] [CrossRef] [Green Version]
Publisher’s Note: MDPI stays neutral with regard to jurisdictional claims in published maps and institutional affiliations. |
© 2021 by the authors. Licensee MDPI, Basel, Switzerland. This article is an open access article distributed under the terms and conditions of the Creative Commons Attribution (CC BY) license (https://creativecommons.org/licenses/by/4.0/).