
Study on the Effect of Gaze Position and Image Brightness on Peripheral Dimming Technique


Abstract
:1. Introduction
2. Psychophysical Experiment
2.1. Hardware Setup
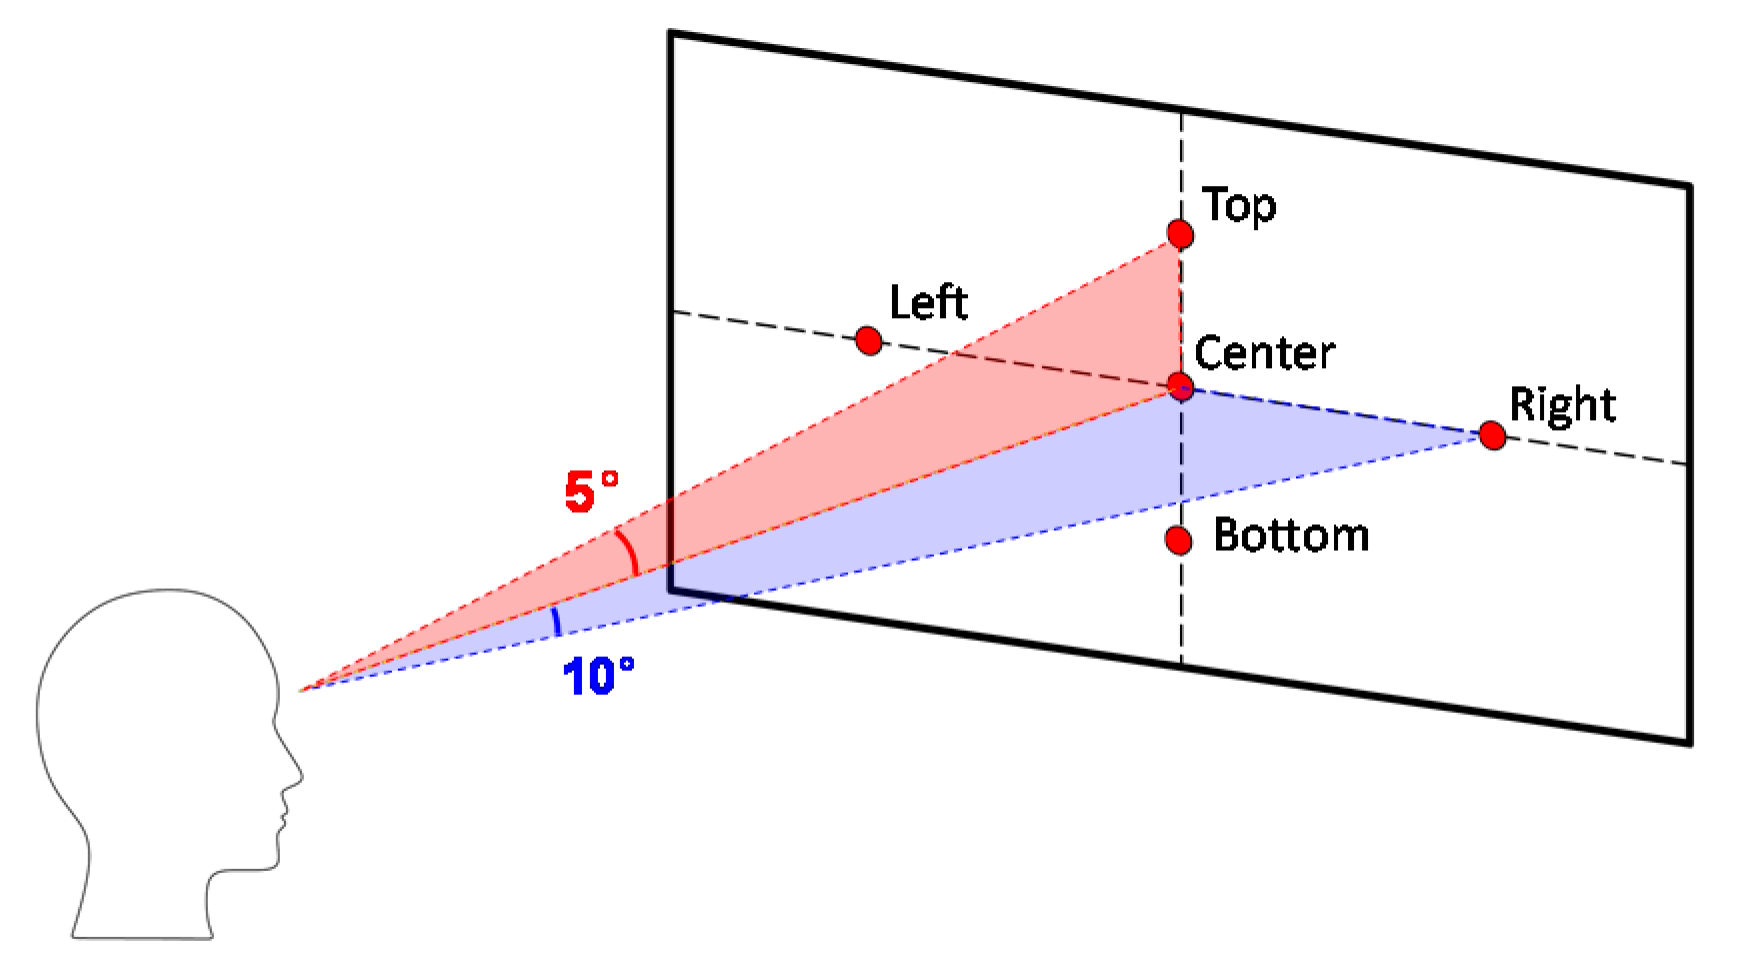
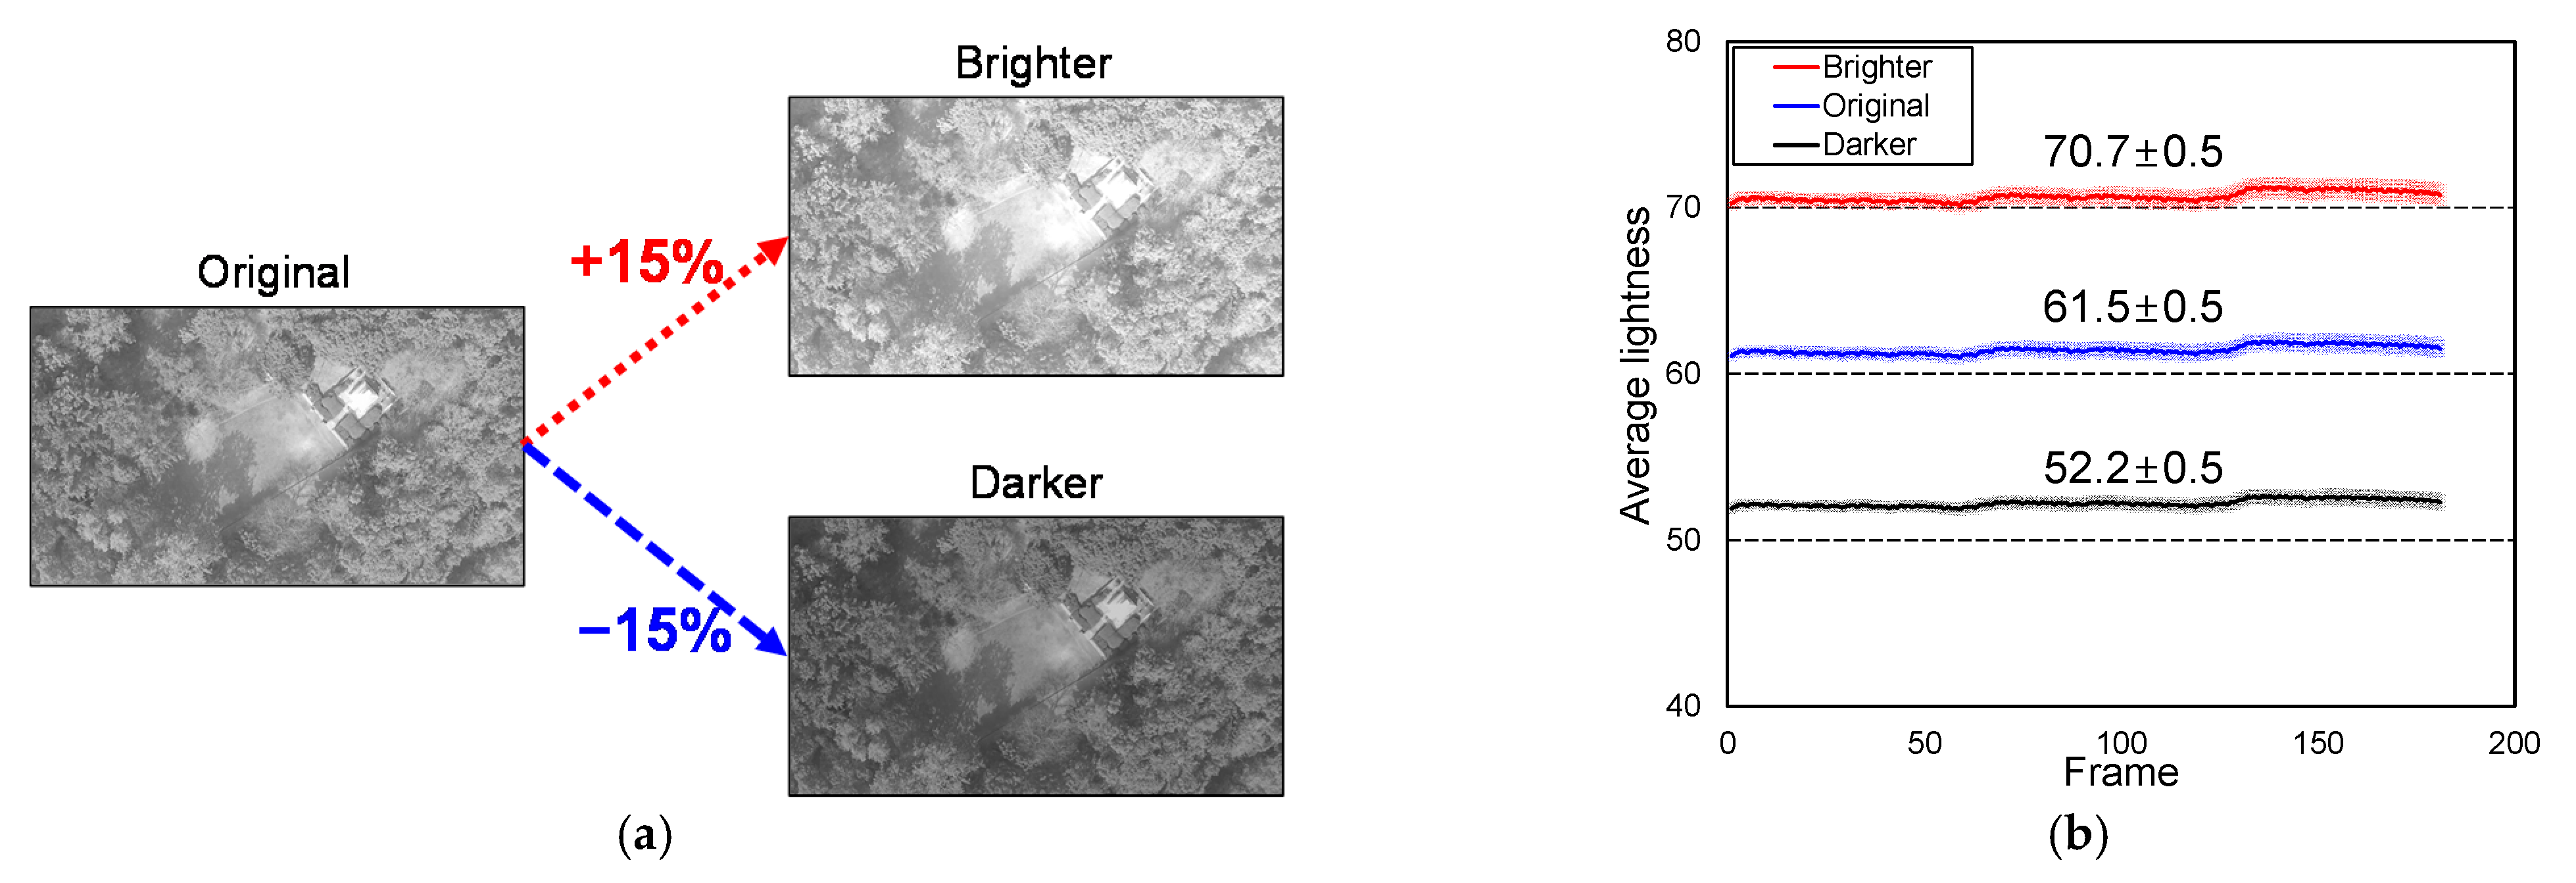
2.2. Conditions
2.3. Participants
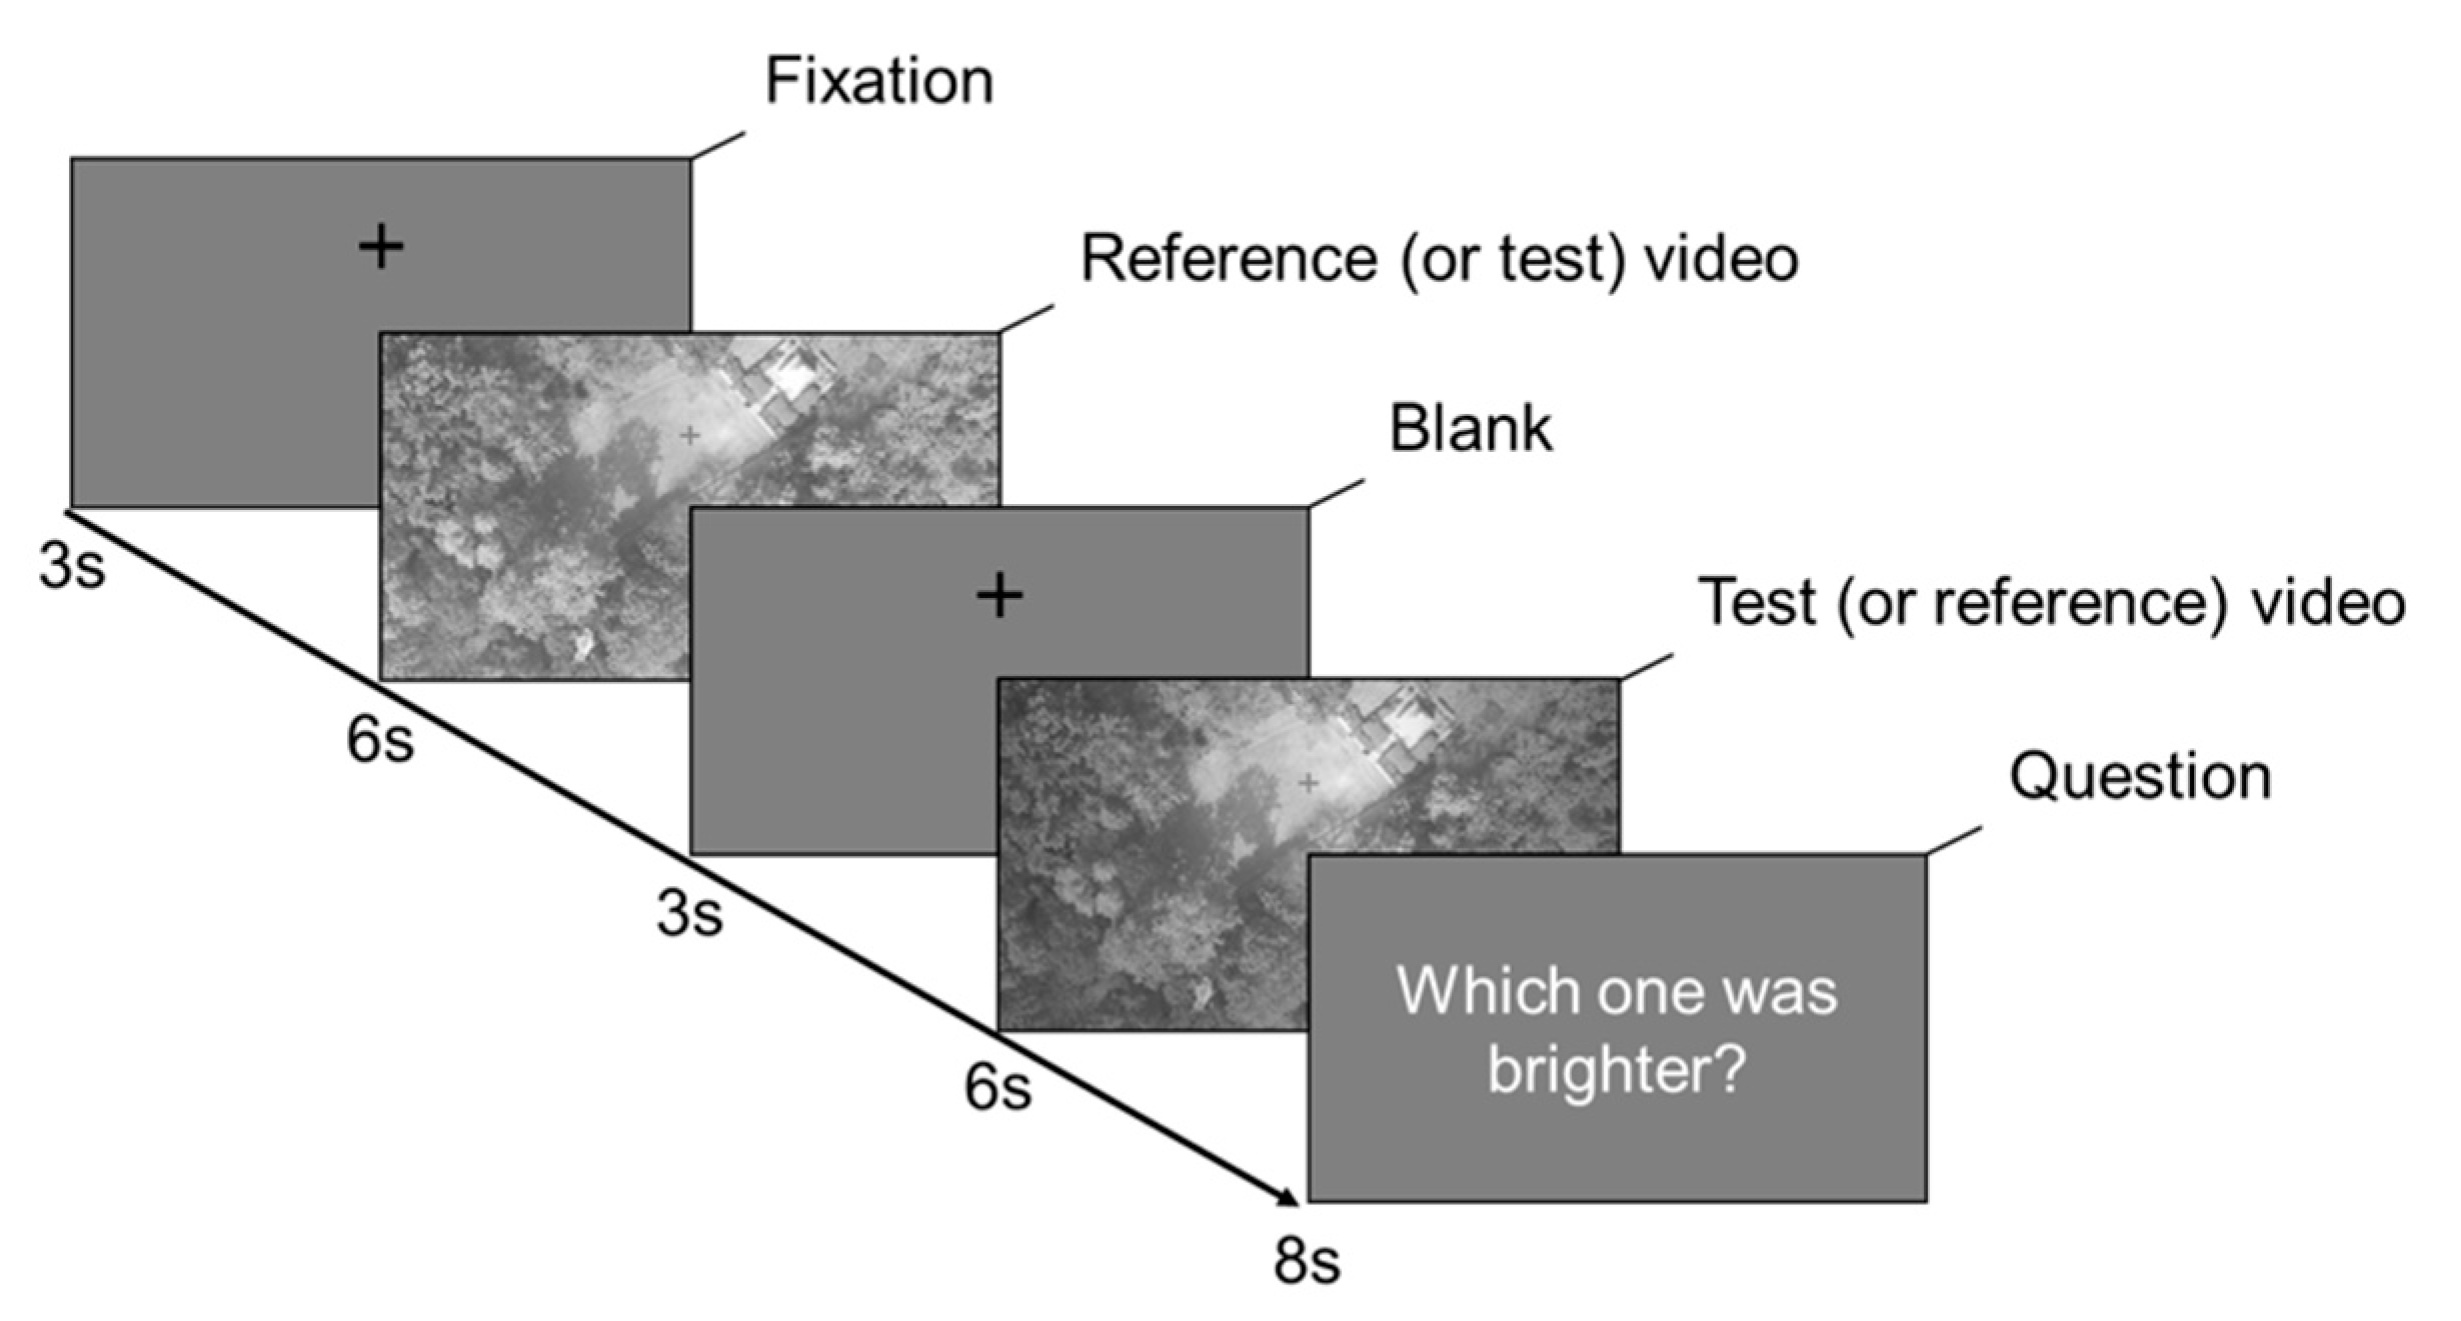
2.4. Procedure
3. Results
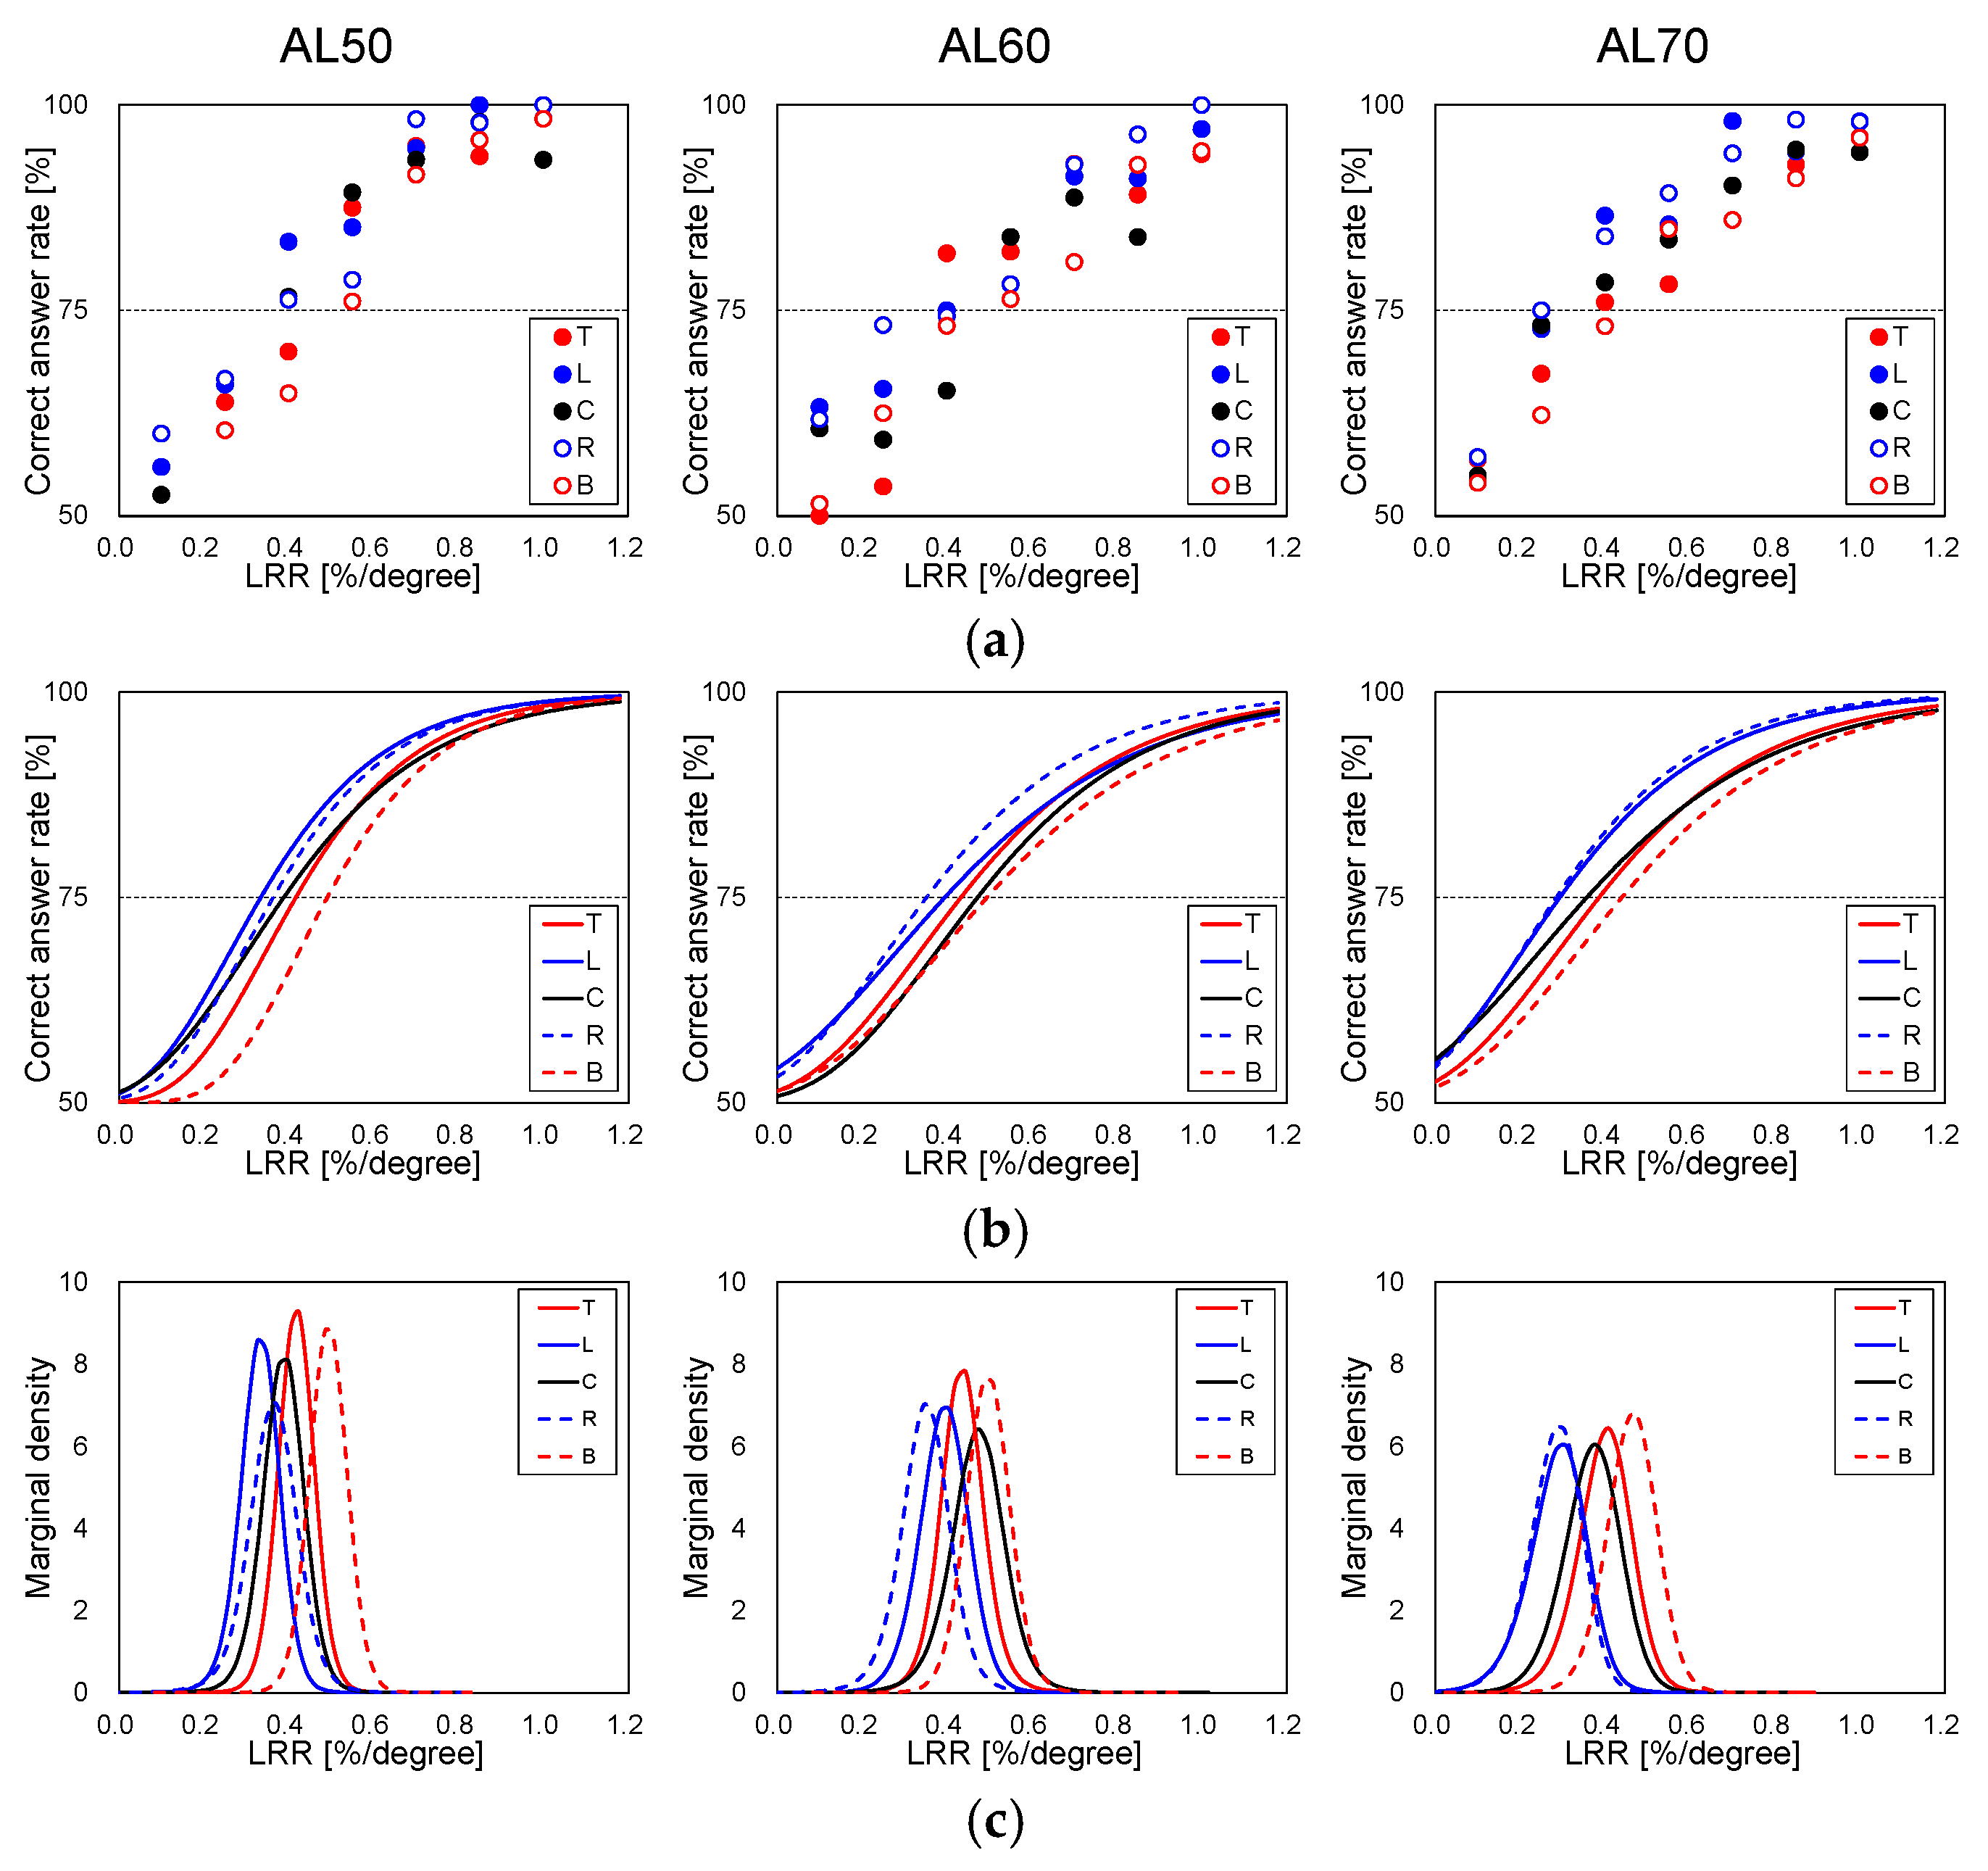
3.1. Psychophysical Results
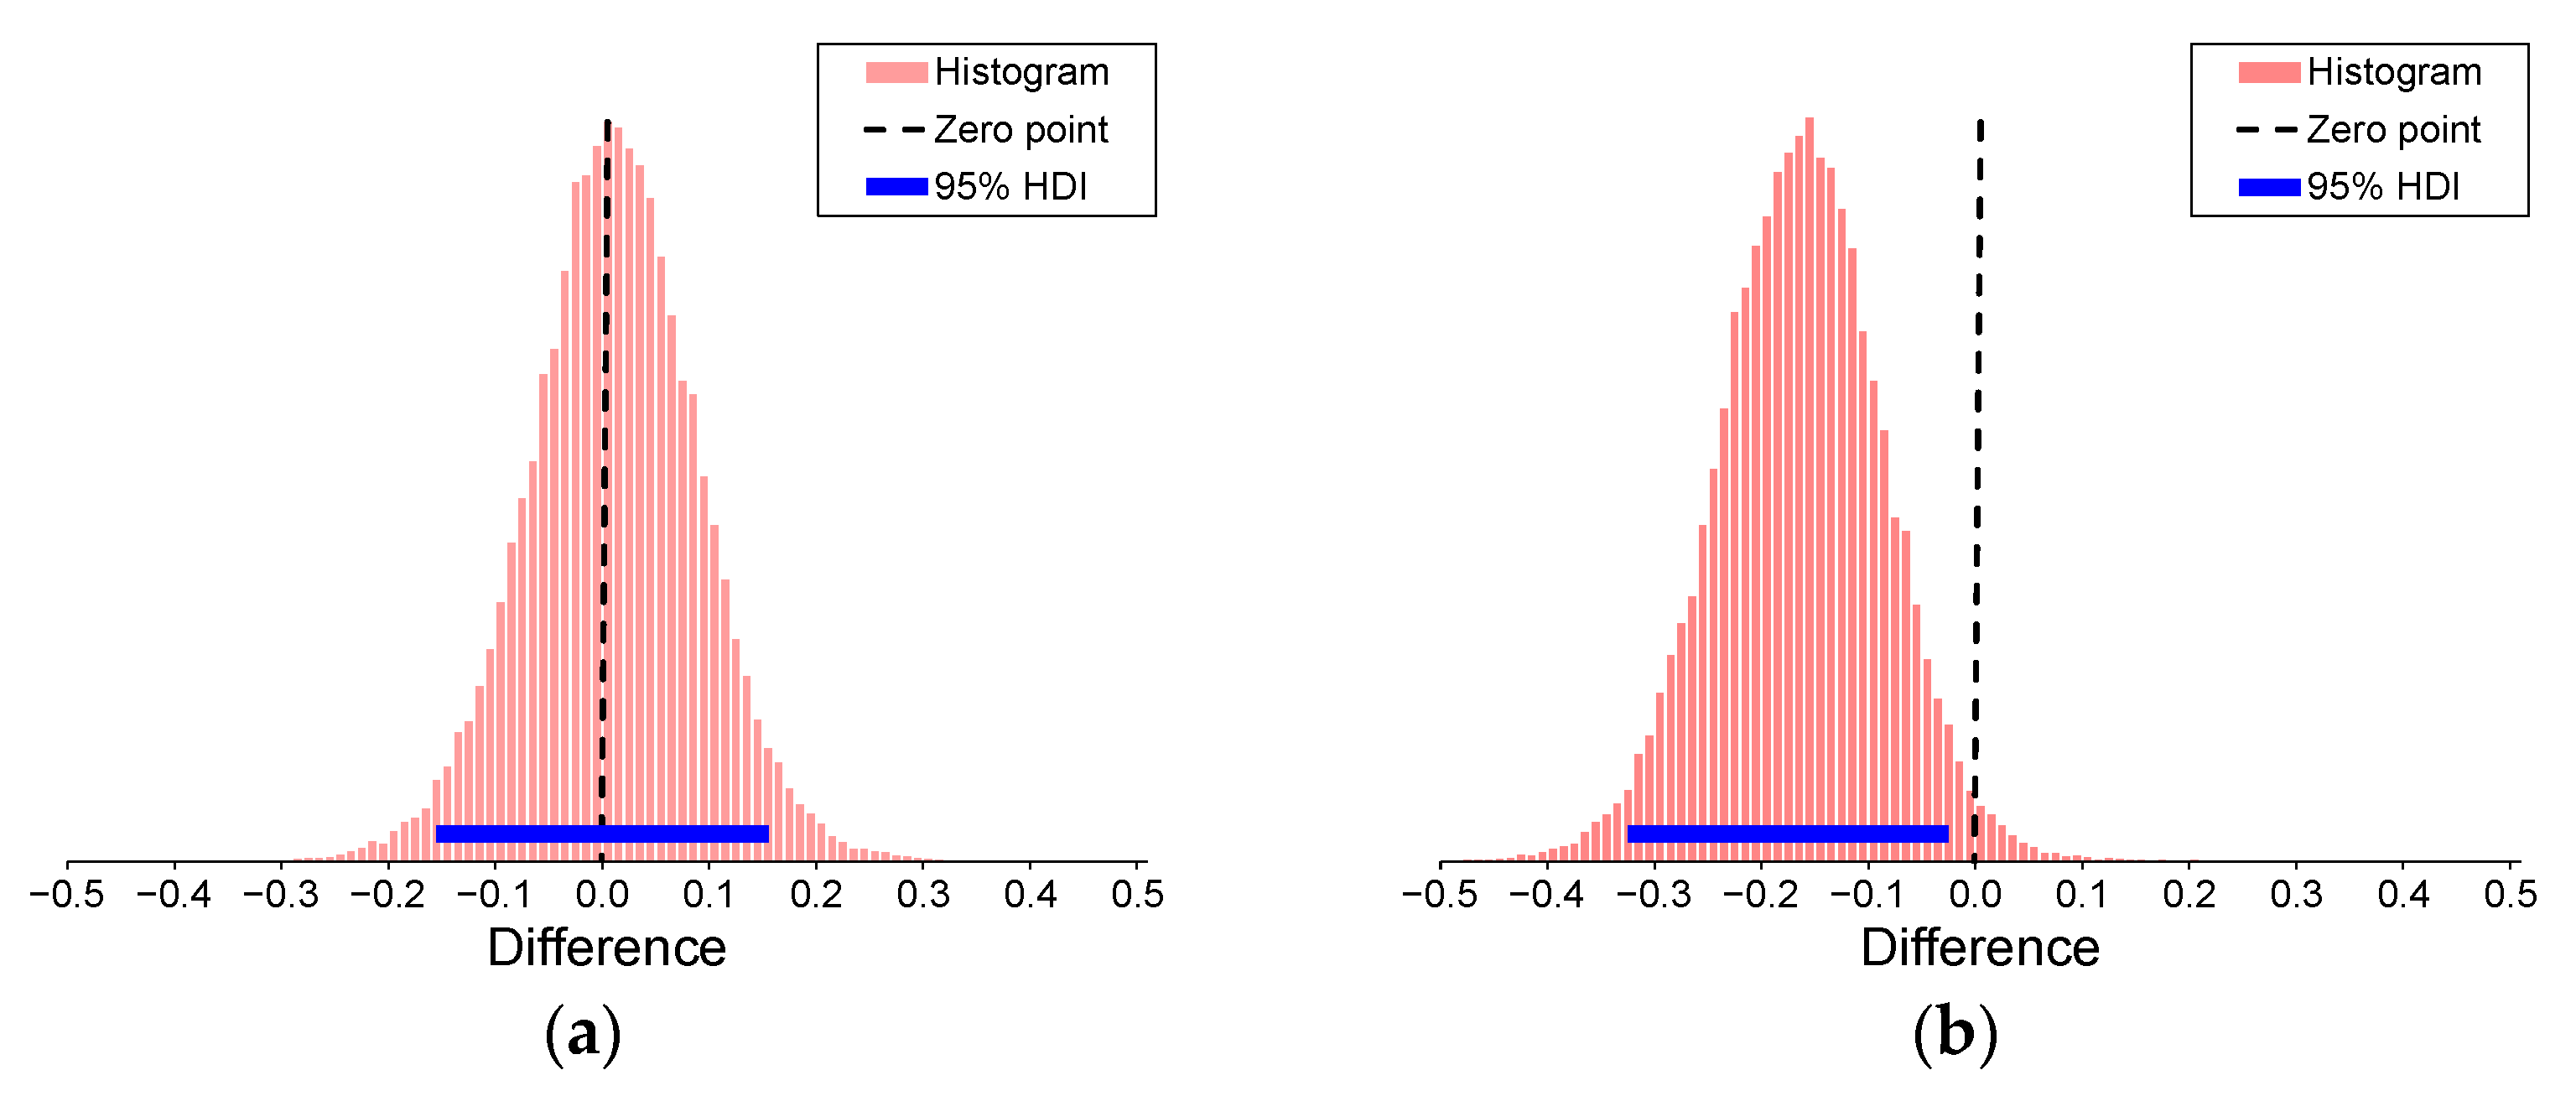
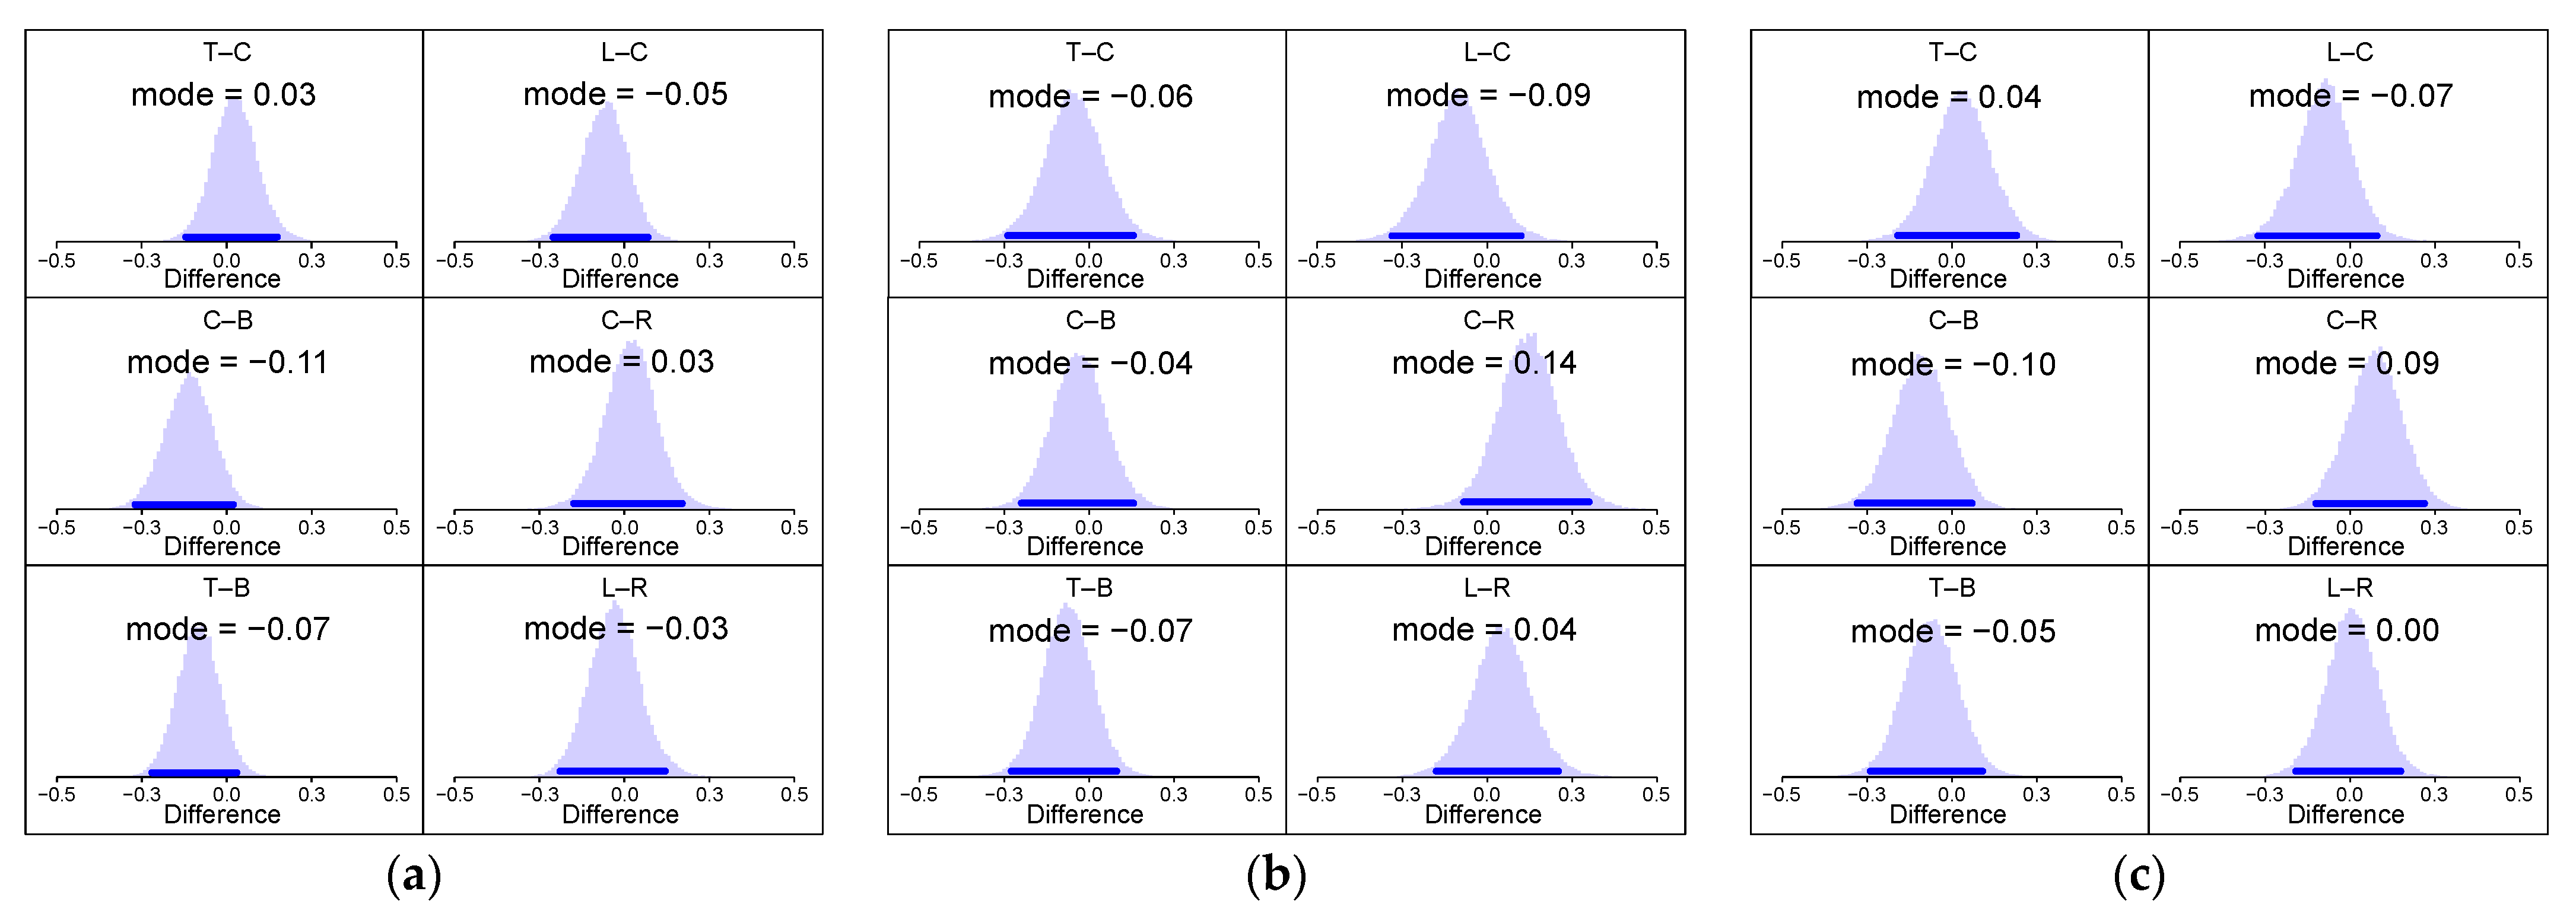
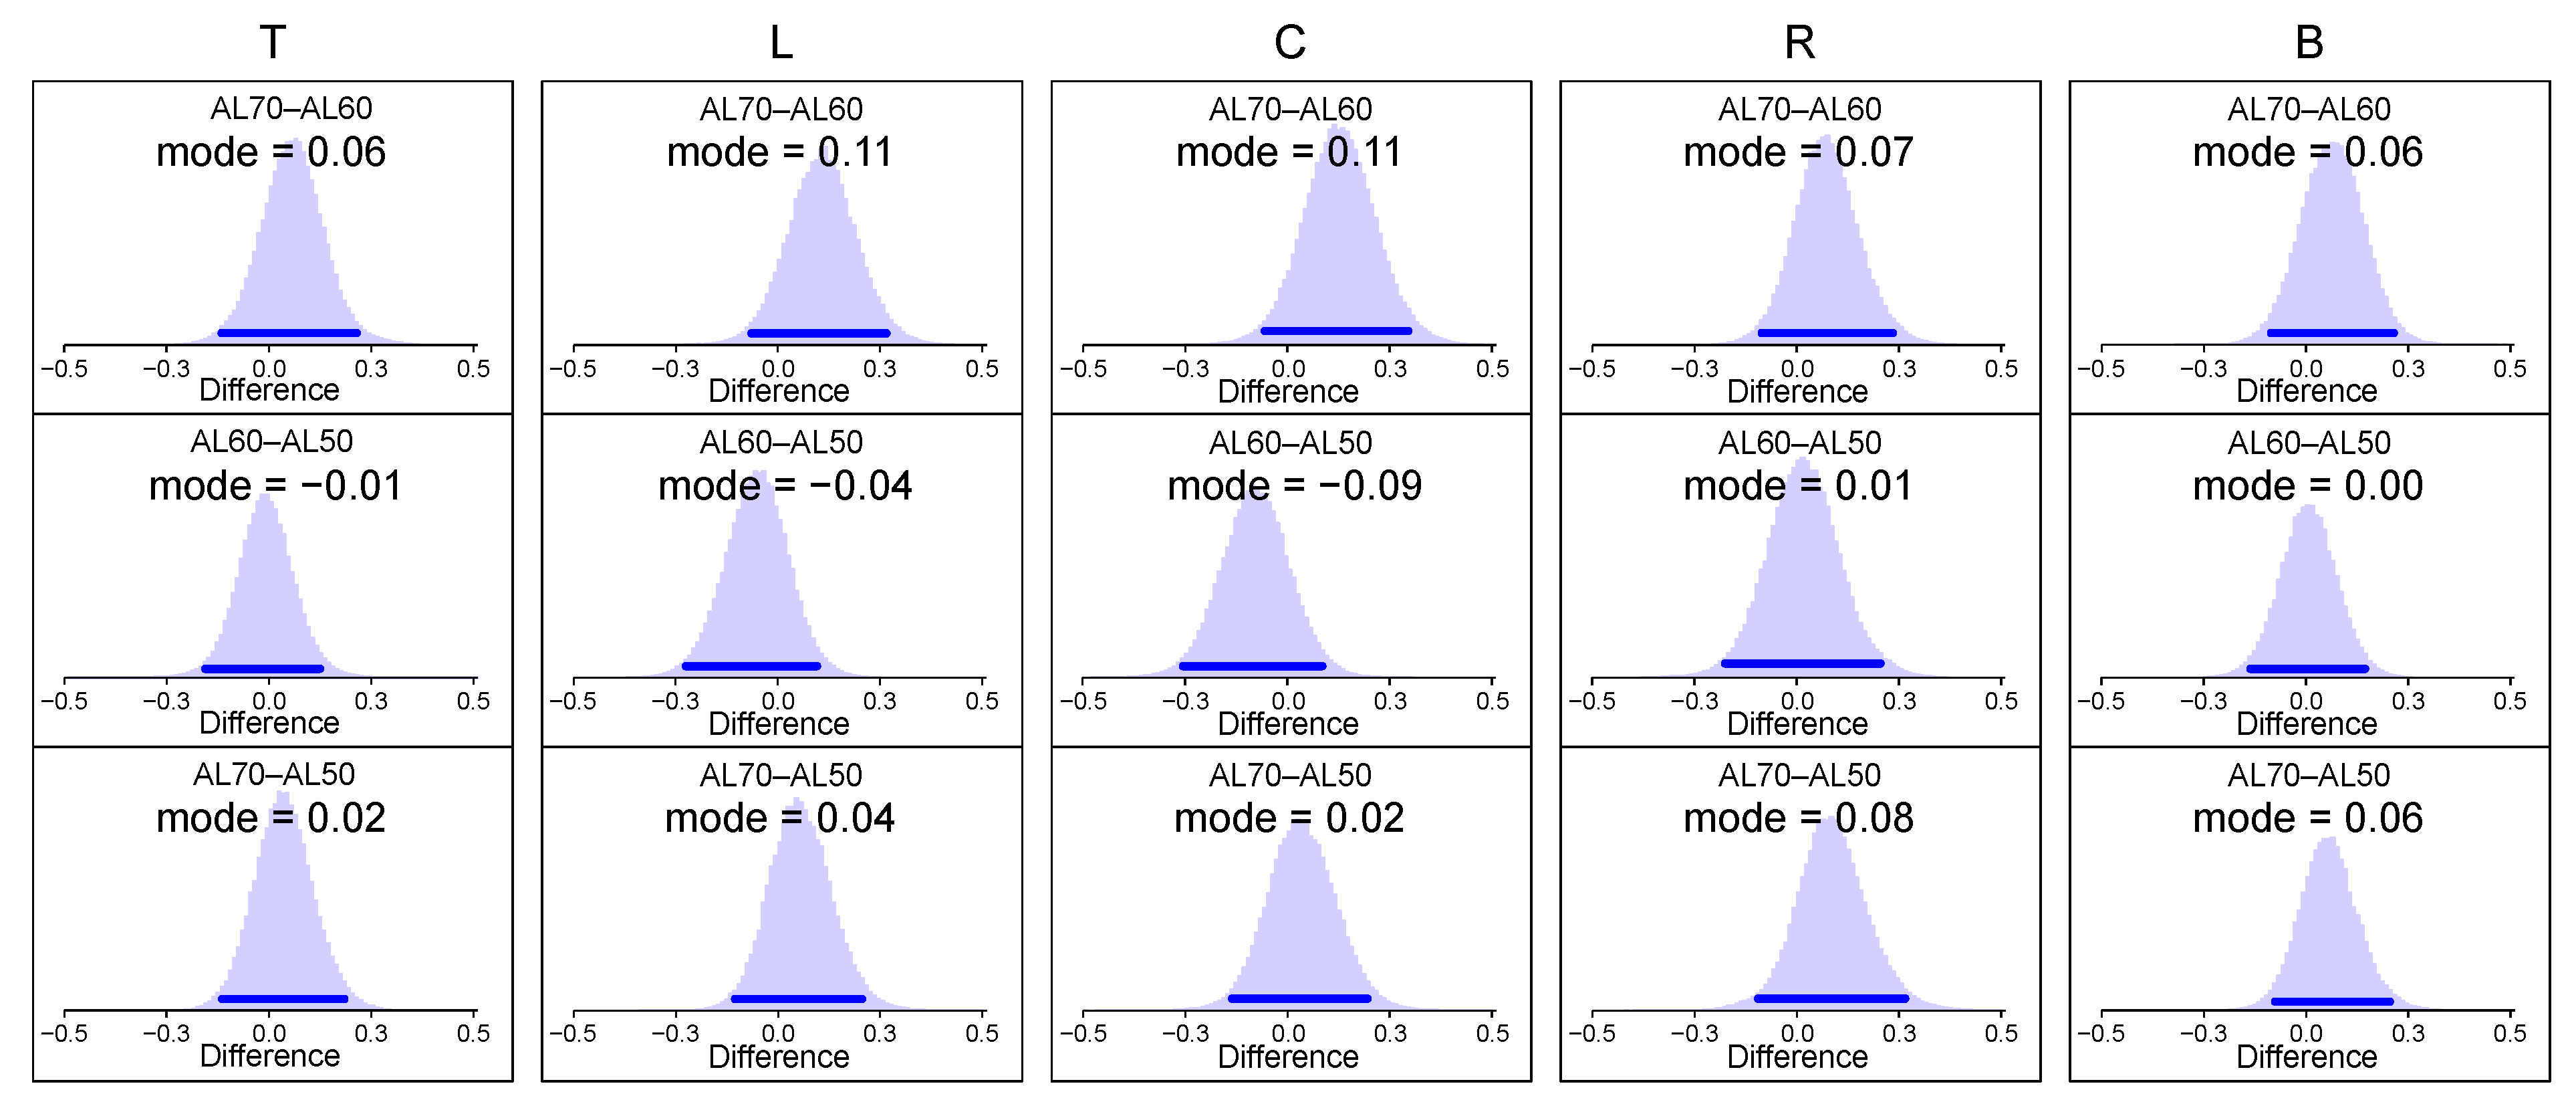
3.2. Bayesian Estimation Analysis
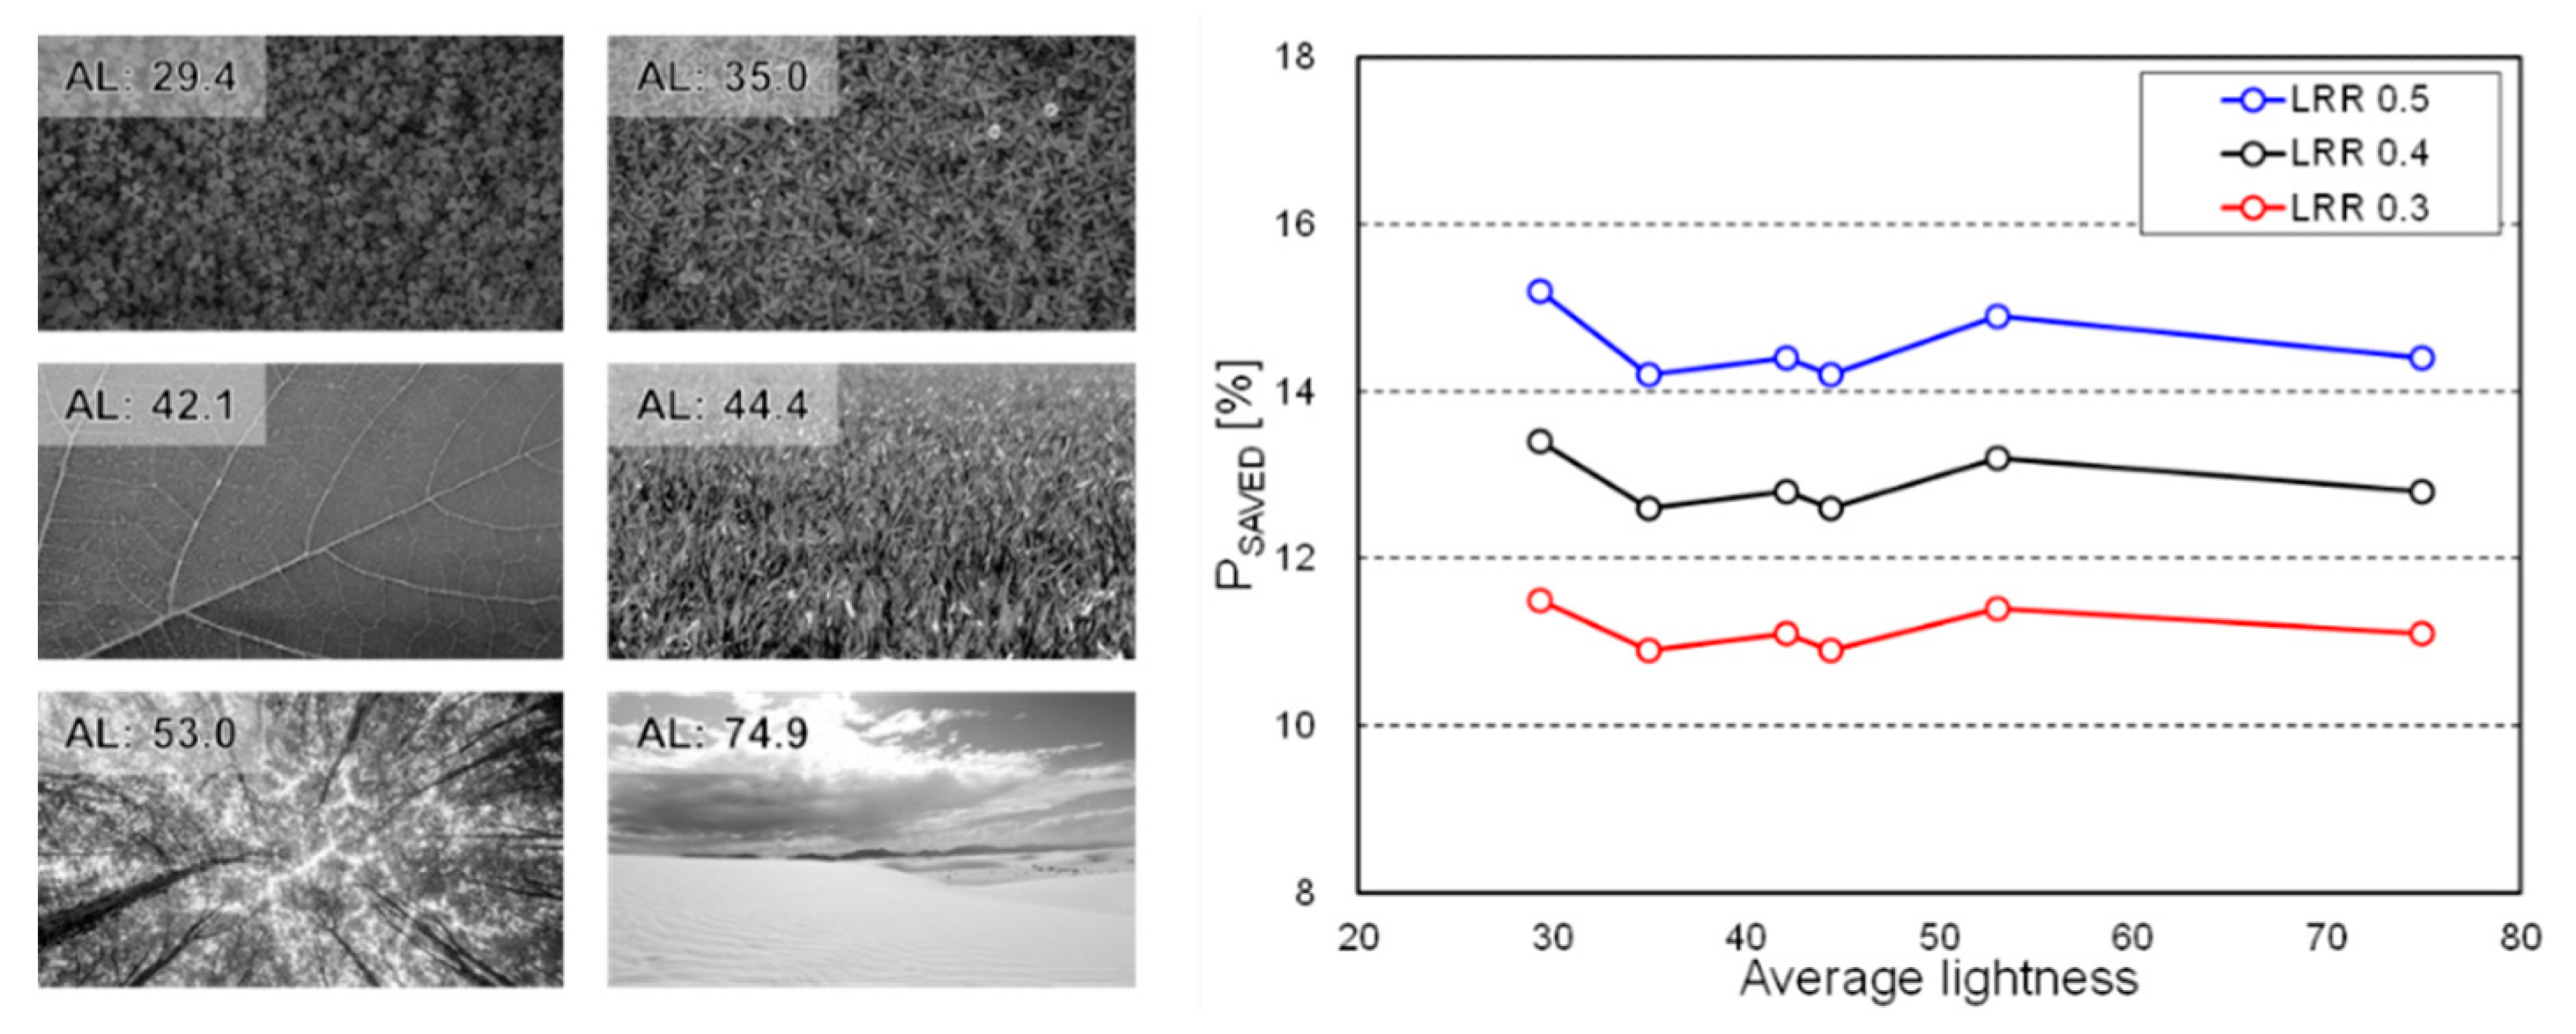
3.3. Performance Evaluation for Power-Saving
4. Discussion
Author Contributions
Funding
Institutional Review Board Statement
Informed Consent Statement
Conflicts of Interest
References
- Nathan, A.; Chaji, G.R.; Ashtiani, S.J. Driving schemes for a-Si and LTPS AMOLED displays. J. Display Technol. 2005, 1, 267–277. [Google Scholar] [CrossRef]
- Chen, D.; Huang, J.; Lee, C.Y.; Lee, Y.J.; Wu, Y.C.; Zhang, X.; Chun, P.; Kim, S. On the Display Technology Trends Resulting from Rapid Industrial Development. SID’s Dig. Tech. Pap. 2018, 48, 316–321. [Google Scholar] [CrossRef]
- Chen, X.; Chen, Y.; Ma, Z.; Fernandes, F.C. How is energy consumed in smartphone display applications? In Proceedings of the 14th Workshop on Mobile Computing Systems and Applications, Jekyll Island, GA, USA, 26–27 February 2013; Association for Computing Machinery: New York, NY, USA, 2013. [Google Scholar]
- Lee, C.; Lee, C.; Lee, Y.Y.; Kim, C.S. Power-constrained contrast enhancement for emissive displays based on histogram equalization. IEEE Trans. Image Process 2012, 21, 80–93. [Google Scholar]
- Chen, X.; Chen, Y.; Xue, C.J. DaTuM: Dynamic tone mapping technique for OLED display power saving based on video classification. In Proceedings of the 52nd ACM/EDAC/IEEE Design Automation Conference, San Francisco, CA, USA, 8–12 June 2015; IEEE: New York, NY, USA, 2015. [Google Scholar]
- Pagliari, D.J.; Macii, E.; Poncino, M. LAPSE: Low-overhead adaptive power saving and contrast enhancement for OLEDs. IEEE Trans. Image Process. 2018, 27, 4623–4637. [Google Scholar] [CrossRef] [PubMed]
- Pagliari, D.J.; Cataldo, S.D.; Patti, E.; Macii, A.; Macii, E.; Poncino, M. Low-overhead adaptive brightness scaling for energy reduction in OLED displays. IEEE Trans. Emerg. Top. Comput. 2019. early access. [Google Scholar]
- Ahn, Y.; Kang, S.J. OLED Power Reduction Algorithm Using Gray-level Mapping Conversion. SID’s Dig. Tech. Pap. 2015, 46, 254–257. [Google Scholar] [CrossRef]
- Shin, Y.G.; Park, S.; Yeo, Y.J.; Yoo, M.J.; Ko, S.J. Unsupervised deep contrast enhancement with power constraint for OLED displays. IEEE Trans. Image Process. 2019, 29, 2834–2844. [Google Scholar] [CrossRef]
- Choubey, P.K.; Singh, A.K.; Bankapur, R.B.; Vaisakh, P.C.; Manoj, P.B. Content aware targeted image manipulation to reduce power consumption in OLED panels. In Proceedings of the 8th International Conference on Contemporary Computing, Noida, India, 20–22 August 2015; IEEE: New York, NY, USA, 2015. [Google Scholar]
- Chen, X.; Nixon, K.W.; Zhou, H.; Liu, Y.; Chen, Y. FingerShadow: An OLED Power Optimization based on Smartphone Touch Interactions. In Proceedings of the 6th Workshop on Power-Aware Computing and Systems, Broomfield, CO, USA, 5 October 2014; USENIX Association: Berkeley, CA, USA, 2014. [Google Scholar]
- Mohammadi, P.; Ebrahimi-Moghadam, A.; Shirani, S. Subjective and objective quality assessment of image: A survey. arXiv 2014, arXiv:1406.7799. [Google Scholar]
- Kim J., S.; Lee, S.W. Peripheral Dimming: A New Low-Power Technology for OLED Display Based on Gaze Tracking. IEEE Access 2020, 8, 209064–209073. [Google Scholar] [CrossRef]
- Strasburger, H.; Rentschler, I.; Jüttner, M. Peripheral vision and pattern recognition: A review. J. Vis. 2011, 11, 1–82. [Google Scholar] [CrossRef] [Green Version]
- Hansen, T.; Pracejus, L.; Gegenfurtner, K.R. Color perception in the intermediate periphery of the visual field. J. Vis. 2009, 9, 1–12. [Google Scholar] [CrossRef] [PubMed]
- HTC Co. VIVE. Available online: https://www.vive.com/us/ (accessed on 30 July 2021).
- FOVE Co. FOVE. Available online: https://fove-inc.com/ (accessed on 30 July 2021).
- Patney, A.; Kim, J.; Salvi, M.; Kaplanyan, A.; Wyman, C.; Benty, N.; Lefohn, A.; Luebke, D. Perceptually-based foveated virtual reality. In Proceedings of the SIGGRAPH 16: ACM SIGGRAPH 2016 Emerging Technologies, New York, NY, USA, 24–28 July 2016; Association for Computing Machinery: New York, NY, USA, 2016. [Google Scholar]
- Patney, A.; Salvi, M.; Kim, J.; Kaplanyan, A.; Wyman, C.; Benty, N.; Luebke, D.; Lefohn, A. Towards foveated rendering for gaze-tracked. ACM Trans. Graph. 2016, 35, 1045. [Google Scholar] [CrossRef]
- Hutton, J.T.; Nagel, J.A.; Loewenson, R.B. Eye tracking dysfunction in Alzheimer-type dementia. Neurology 1984, 34, 99–102. [Google Scholar] [CrossRef] [PubMed]
- MacAvoy, M.G.; Gottlieb, J.P.; Bruce, C.J. Smooth-pursuit eye movement representation in the primate frontal eye field. Cereb. Cortex. 1991, 1, 95–102. [Google Scholar] [CrossRef]
- Bott, N.; Lange, A.L.; Cosgriff, R.; Hsiao, R.; Dolin, B. Method and System for Correlating an Image Capturing Device to a Human User for Analysis of Cognitive Performance. U.S. Patent US20180125404A1, 10 May 2018. [Google Scholar]
- Alves, J.; Vourvopoulos, A.; Bernardino, A.; Badia, S.B. Eye Gaze Correlates of Motor Impairment in VR Observation of Motor Actions. Methods Inf. Med. 2016, 55, 79–83. [Google Scholar]
- Morita, K.; Miura, K.; Kasai, K.; Hashimoto, R. Eye movement characteristics in schizophrenia: A recent update with clinical implications. Neuropsychopharmacol. Rep. 2020, 40, 2–9. [Google Scholar] [CrossRef] [Green Version]
- Lim, J.Z.; Mountstephens, J.; Teo, J. Emotion Recognition Using Eye-Tracking: Taxonomy, Review and Current Challenges. Sensors 2020, 20, 2384. [Google Scholar] [CrossRef]
- Wang, Y.; Zhai, G.; Chen, S.; Min, X.; Gao, Z.; Song, X. Assessment of eye fatigue caused by head-mounted displays using eye-tracking. Biomed. Eng. Online 2019, 18, 111. [Google Scholar] [CrossRef] [Green Version]
- Jeong, W.B.; Kim, J.S.; Lee, S.W. Dependence of Brightness Sensitivity on Gaze Point. In Proceedings of the 20th International Meeting on Information Display, Seoul, Korea, 25–28 August 2020; KIDS: Seoul, Korea, 2020. [Google Scholar]
- Pixabay. Available online: https://pixabay.com/ (accessed on 27 November 2019).
- Schütt, H.H.; Harmeling, S.; Macke, J.H.; Wichmann, F.A. Painfree and accurate Bayesian estimation of psychometric functions for (potentially) overdispersed data. Vis. Res. 2016, 122, 105–123. [Google Scholar] [CrossRef] [PubMed] [Green Version]
- Kruschke, K.K. Doing Bayesian Data Analysis, 2nd ed.; Elsevier: Amsterdam, The Netherlands, 2015. [Google Scholar]
- Cumming, G. The new statistics: Why and how. Psychol. Sci. 2014, 25, 7–29. [Google Scholar] [CrossRef]
- Schenker, N.; Gentleman, J.F. On judging the significance of differences by examining the overlap between confidence intervals. Am. Statist. 2001, 55, 182–186. [Google Scholar] [CrossRef]
- Kruschke, K.K.; Liddell, T.M. The Bayesian New Statistics: Hypothesis testing, estimation, meta-analysis, and power analysis from a Bayesian perspective. Psychon. Bull. Rev. 2018, 25, 178–206. [Google Scholar] [CrossRef] [PubMed] [Green Version]
- Andrieu, C.; Freitas, N.; Doucet, A.; Jordan, M.I. An introduction to MCMC for machine learning. Mach. Learn. 2003, 50, 5–43. [Google Scholar] [CrossRef] [Green Version]
- Dong, M.; Choi, Y.S.K.; Zhong, L. Power modeling of graphical user interfaces on OLED displays. In Proceedings of the 46th Design Automation Conference, San Francisco, CA, USA, 26–31 July 2009; Association for Computing Machinery: New York, NY, USA, 2009. [Google Scholar]
- Keil, J.; Edler, D.; Schmitt, T.; Dickmann, F. Creating Immersive Virtual Environments Based on Open Geospatial Data and Game Engines. KN J. Cartogr. Geogr. Inf. 2021, 71, 53–65. [Google Scholar] [CrossRef]
- Zhan, T.; Yin, K.; Xiong, J.; He, Z.; Wu, S.T. Augmented Reality and Virtual Reality Displays: Perspectives and Challenges. iScience 2020, 23, 101397. [Google Scholar] [CrossRef] [PubMed]
- Gou, F.; Chen, H.; Li, M.C.; Lee, S.L.; Wu, S.T. Submillisecond-response liquid crystal for high-resolution virtual reality displays. Opt. Exp. 2012, 25, 7984–7997. [Google Scholar] [CrossRef] [PubMed] [Green Version]
- Cuervo, E.; Chintalapudi, K.; Kotaru, M. Creating the Perfect Illusion: What will it take to Create Life-Like Virtual Reality Headsets? In Proceedings of the HotMobile 18: 19th International Workshop on Mobile Computing Systems & Applications, New York, NY, USA, 12–13 February 2018; Association for Computing Machinery: New York, NY, USA, 2018. [Google Scholar]
- Hou, X.; Lu, Y.; Dey, S. Wireless VR/AR with Edge/Cloud Computing. In Proceedings of the 2017 26th International Conference on Computer Communication and Networks, Vancouver, QC, Canada, 31 July–3 August 2017; IEEE: New York, NY, USA, 2017. [Google Scholar]
- Xiao, G.; Li, H.; Han, C.; Liu, Y.; Li, Y.; Liu, J. Cloud Rendering Scheme for Standalone Virtual Reality Headset. In Proceedings of the 2020 International Conference on Virtual Reality and Visualization, Recife, Brazil, 13–14 November 2020; IEEE: New York, NY, USA, 2020. [Google Scholar]
- Huawei iLab. Cloud VR Network Solution White Paper. Available online: https://www.huawei.com/minisite/pdf/ilab/cloud_vr_network_solution_white_paper_en.pdf (accessed on 31 July 2021).
- Leng, Y.; Chen, C.C.; Sun, Q.; Huang, J.; Zhu, Y. Energy-efficient video processing for virtual reality. In Proceedings of the ISCA ‘19: 46th International Symposium on Computer Architecture, New York, NY, USA, 22–26 June 2019; Association for Computing Machinery: New York, NY, USA, 2019. [Google Scholar]
- Jiang, N.; Liu, Y.; Guo, T.; Xu, W.; Swaminathan, V.; Xu, L.; Wei, S. QuRate: Power-efficient mobile immersive video streaming. In Proceedings of the MMSys ‘20: 11th ACM Multimedia Systems Conference, Istanbul, Turkey, 8–11 June 2020; Association for Computing Machinery: New York, NY, USA, 2020. [Google Scholar]
- Jiang, N.; Swaminathan, V.; Wei, S. Power Evaluation of 360 VR Video Streaming on Head Mounted Display Devices. In Proceedings of the NOSSDAV’17: 27th Workshop on Network and Operating Systems Support for Digital Audio and Video, Taipei, China, 20–23 June 2017; Association for Computing Machinery: New York, NY, USA, 2017. [Google Scholar]


| AL50 | AL60 | AL70 | |
|---|---|---|---|
| Number of participants | 16 | 19 | 15 |
| Mean age | 25.4 | 24.7 | 25.2 |
| T | L | C | R | B | Common | |
|---|---|---|---|---|---|---|
| AL50 [%/degree] | 0.33–0.51 | 0.23–0.42 | 0.28–0.48 | 0.23–0.48 | 0.40–0.58 | 0.40–0.42 |
| AL60 [%/degree] | 0.33–0.55 | 0.27–0.51 | 0.33–0.61 | 0.21–0.47 | 0.39–0.60 | 0.39–0.47 |
| AL70 [%/degree] | 0.25–0.50 | 0.17–0.39 | 0.23–0.47 | 0.16–0.38 | 0.32–0.55 | 0.32–0.38 |
| Common [%/degree] | 0.33–0.50 | 0.27–0.39 | 0.33–0.47 | 0.23–0.38 | 0.40–0.55 |
| Gaze Position | AL50 | AL60 | AL70 | Mean |
|---|---|---|---|---|
| T | 12.0% | 12.4% | 11.5% | 12.0% |
| L | 10.4% | 11.5% | 9.9% | 10.6% |
| C | 11.3% | 12.7% | 10.9% | 11.6% |
| R | 10.9% | 10.8% | 9.8% | 10.5% |
| B | 13.2% | 13.4% | 12.4% | 13.0% |
| Mean | 11.6% | 12.2% | 10.9% | 11.5% |
Publisher’s Note: MDPI stays neutral with regard to jurisdictional claims in published maps and institutional affiliations. |
© 2021 by the authors. Licensee MDPI, Basel, Switzerland. This article is an open access article distributed under the terms and conditions of the Creative Commons Attribution (CC BY) license (https://creativecommons.org/licenses/by/4.0/).
Share and Cite
Kim, J.-S.; Jeong, W.-B.; An, B.H.; Lee, S.-W. Study on the Effect of Gaze Position and Image Brightness on Peripheral Dimming Technique. Electronics 2021, 10, 1896. https://doi.org/10.3390/electronics10161896
Kim J-S, Jeong W-B, An BH, Lee S-W. Study on the Effect of Gaze Position and Image Brightness on Peripheral Dimming Technique. Electronics. 2021; 10(16):1896. https://doi.org/10.3390/electronics10161896
Chicago/Turabian StyleKim, Jeong-Sik, Won-Been Jeong, Byeong Hun An, and Seung-Woo Lee. 2021. "Study on the Effect of Gaze Position and Image Brightness on Peripheral Dimming Technique" Electronics 10, no. 16: 1896. https://doi.org/10.3390/electronics10161896
APA StyleKim, J.-S., Jeong, W.-B., An, B. H., & Lee, S.-W. (2021). Study on the Effect of Gaze Position and Image Brightness on Peripheral Dimming Technique. Electronics, 10(16), 1896. https://doi.org/10.3390/electronics10161896