1. Introduction
In order to achieve high crop yields, farmers use insecticides at scheduled times [
1]. A better approach would be to use insecticides only when the likelihood of the presence of pests in the field is higher than a pre-defined threshold. Therefore, insect monitoring and the evaluation of insect density in the field are very important tasks in agriculture because they make the forecast of insect invasion possible. Such a forecast has significant environmental and economic effects because farmers can apply insecticides at the right time to defend their crops. Thus, they can save money and time (less spraying, less amount of insecticide, etc.).
The most common information source of inspect density prediction is the outsourced (pheromone or other type) traps [
2]. The traditional trap-based insect monitoring requires an expert who manually recognizes and counts pests. Manually counting pests on pheromone trap images is a very slow, labor-intensive, and expensive process. In addition, it requires a skilled person capable of distinguishing insect species. Therefore, an automated pest management system would be a great improvement as it would solve additional problems such as the lack of agricultural experts. In such a system, an automated insect recognition method would be necessary in order to minimize human interaction.
Recently, IoT (Internet of Things) devices have been widely applied in agriculture and they allow remote farm monitoring with the use of camera(s). Among various vision systems, color cameras are the most popular due to their low price and ease of use [
3]. In this work, we used the OpenMV device, which is dedicated to embedded computer vision tasks.
Beyond remote sensing devices, an accurate insect-counting method is also needed. Insect counting can be seen as a special version of object detection. Fortunately, the rapidly developing machine vision and learning technologies can be used to solve object detection problems with promising performance, not just in computer science but also in agriculture.
In this paper, we propose a new pest trap which contains an embedded system with a deep learning-based insect-counting algorithm. Our primary goal was to detect and count a particular moth: the Cydia pomonella. However, due to the very small amount of Cydia pomonella images, we developed a general moth recognizer and counting model that works for several moth species.
2. Related Work
Earlier works in insect identification can be categorized according to several factors. The first is the image quality. Some authors used high quality images (uniform illumination, well-adjusted pose, lack of noise) made in the laboratory environment [
4,
5], while others used images taken in the field [
6]. Not surprisingly, a pest identification algorithm that has been trained on laboratory images will provide a significantly smaller recognition accuracy on field images [
7].
Another factor is the number of insects on the image. In several studies, images were captured with a mobile device and contained only one insect. In a smaller subset of studies, there were more than one insect on the images (typically trap images) [
8].
Images which have been taken on the field and contain more than one insect require a more complex segmentation phase to separate insects from each other before the identification step. Moreover, we should consider noise and artifacts such as herbs, very small insects, and stripes of glue. The survey of Matineau et al. [
9] on image-based insect classification well summarizes the different research directions, research conditions, and the state of the art until 2017.
2.1. Databases
Probably the biggest problem in insect counting is the lack of sample images. The authors of the survey in [
9] also did not find a freely available reference dataset until 2017. Several researchers worked on nonpublic datasets, while in other works the number of images was rather small, especially for training deep learning algorithms.
Xie et al. [
10] collected images of about 24 insect species such as the Cifuna locuples and Tettigella viridis, with approximately 60 images per class. Wang et al. [
3] worked on and made available 225 images that belong to 9 insect orders. Deng et al. [
11] acquired images of about 10 insect species with approximately 40–70 images per class.
To overcome the above-mentioned weakness, Wu et al. [
12] created a freely available database for pest recognition in 2019. It is called IP102. The IP102 database contains more than 75,000 images belonging to 102 categories. Out of all images, approximately 19,000 images have been annotated. The dataset has a hierarchical structure where insects that mainly affect a specific agricultural product are grouped into the same upper-level category. The authors of IP201 claimed that earlier deep learning approaches on insect pest recognition were restricted to small data sets, which do not contain enough samples. They also gave a review of the used databases in previous works.
In 2019, another freely available large-scale database (Fieldguide Challenge: Moths & Butterflies) was published by the Kaggle community [
13]. It contains 530,000 images and 5419 classes. The weakness of this database is the lack of species name (classes were identified by ID without name).
Unfortunately, none of the above datasets include the Cydia pomonella insect, which is the most harmful apple insect in Hungary. In addition, the above-mentioned database images contain an average of one insect, while our trap images (test images) may contain several insects. This huge difference between the available sample images and the trap images makes the design of a counting model very difficult. Overall, the lack of sufficient real samples prevents the optimization of the huge number of weights in deep classifier models.
2.2. Segmentation
Generally, insect detection (and counting) can be seen as an object detection problem that consists of three stages (regardless of the used method): segmentation, feature extraction, and classification.
At first glance, segmentation algorithms such as thresholding-based, clustering-based, contour-based, or region-based are possible solutions for automated insect counting. Among them, the simplest segmentation methods rely on thresholding where one or more threshold values are derived from the image histogram [
14]. However, threshold-based methods are efficient only when the image does not contain a large amount of noise or other objects (stripes of glue, discolorations, etc.).
In contour-based segmentation, the two key factors are edge and contour detection. Widely used edge detectors are the Sobel operator and the Canny detector. Contour detection can be applied on the image gradient and its outcome will provide an estimation of the object shapes on the image [
15]. However, contour-based algorithms are also not sufficiently robust against noise.
In the clustering-based segmentation category, the k-means technique is the most popular [
16]. It is used on color images to search for the centroid of regions where pixels have a similar color intensity. The weakness of the k-means clustering is its parameters such as the number of regions, which strongly influences the speed and performance of the algorithm.
In order to improve segmentation, some researchers have used multi-stage segmentation strategies. For example, Wen et al. [
17] used a two-stage morphology-based image segmentation. The first stage was a global thresholding (with the Otsu method + morphological opening), where small objects were eliminated and the remaining objects were labelled. In the second stage, the object center was predicted.
A detailed description of insect segmentation strategies can be found in the study of Bakkay et al. [
6]. They defined insect detection as an object segmentation problem that utilizes shape and color characteristics in non-homogeneous background. They established that region-based segmentation algorithms such as the watershed are able to separate touching insects. Based on this, they proposed an adaptive k-means clustering algorithm and introduced their own region-merging algorithm to separate touching insects. Unfortunately, their proposed algorithm has not been tested widely. In practice, there are many kinds of sticky traps with different backgrounds, for various insect types, and capable of holding a diverse number of insects.
Beyond “conventional” segmentation techniques, sliding window-based image segmentation is also popular in object detection and it has also been used to address the insect recognition problem. For example, Ding and Taylor [
18] used the sliding window-based image segmentation pipeline where the classifier model was a convolutional neural network. However, more efficient object proposal techniques than sliding window can be found in the literature. A qualitative evaluation of their work showed several false positive and false negative detections.
In the object detection literature, some additional and more sophisticated image segmentation (object proposal) techniques are available such as Edge Boxes or Multiscale Combinatorial Grouping [
19]. For object proposal, we used the selective search method, which is more powerful than the segmentation techniques used earlier; however, it is a time-consuming method. Fortunately, the time requirement of an insect-counting algorithm is not significantly limited because we take only one picture a day. Thus, selective search can be used without any problems.
2.3. Feature Extraction and Classification
In the last years, the automated insect detection methods have shifted from shallow machine learning techniques to deep learning. Shallow techniques are widely adopted to identify insects in combination with the texture, color, and shape features. However, their accuracy is limited [
3,
20]. Therefore, deep learning algorithms are currently more popular for this task.
Sun et al. [
2] tried to develop an automatic Red Turpentine Beetle (RTB) monitoring system with a self-developed lightweight deep network that could run on embedded devices to count adult RTB insects on trap images. They used their own dataset to train the insect detector model but unfortunately, this dataset is not available. In addition, their images were significantly different from ours because their trap was similar in size to a cup with a smaller number of cached insects.
Wen et al. [
17] also used a deep neural network architecture to identify moth species with 154 hand-crafted features (color, texture, shape, etc.). Their dataset is not publicly available.
The pest identification algorithm of Zhong et al. [
1] used two stages. In the first stage, the YOLO object detector produced coarse detections (segmentation); in the second stage, an SVM performed the final classification. The goal of this two-stage classifier model was to reduce the amount of necessary training samples.
Xia et al. [
21] also used a deep learning approach to detect insects on crop field images. They used the VGG19 (Visual Geometry Group) architecture (VGG16 with some additional convolutional layers) as a feature extractor in combination with a region proposal network.
Hong et al. [
22] tested seven deep object detector networks, including faster R-CNN (Region Based Convolutional Neural Network), SSD (Single-Shot Detector), and Mobilenet, in order to compare their speed and accuracy. Their results showed that mean average precision (mAP) was between 76 and 90, depending on the type of the model. Not surprisingly, the faster R-CNN model produced the highest recognition accuracy, but its inference time was also the highest.
In this work, we also used a deep classifier model to count the number of insects in a trap, but it has been designed in a totally different way as compared to the earlier studies due to our purpose.
2.4. Insect Pest Monitoring Systems
In the literature, the authors of some papers have already proposed wireless imaging systems for insect monitoring and counting. Zhong et al. [
1] designed an automatic pest counting system where the central unit was a Raspberry Pi, which executes a two-stage classification algorithm (as mentioned above).
Rustia et al. [
3] also used a Raspberry Pi 3 mini-computer as a controller board with a Raspberry Pi Camera, and some environmental sensors such as temperature, humidity, and light sensors.
Unlike the above-mentioned systems, which can be used only under limited circumstances (typically in greenhouses), our novel embedded system-based trap can be used anywhere in the field without restrictions.
3. Materials and Methods
3.1. The Structure of the Prototype Trap
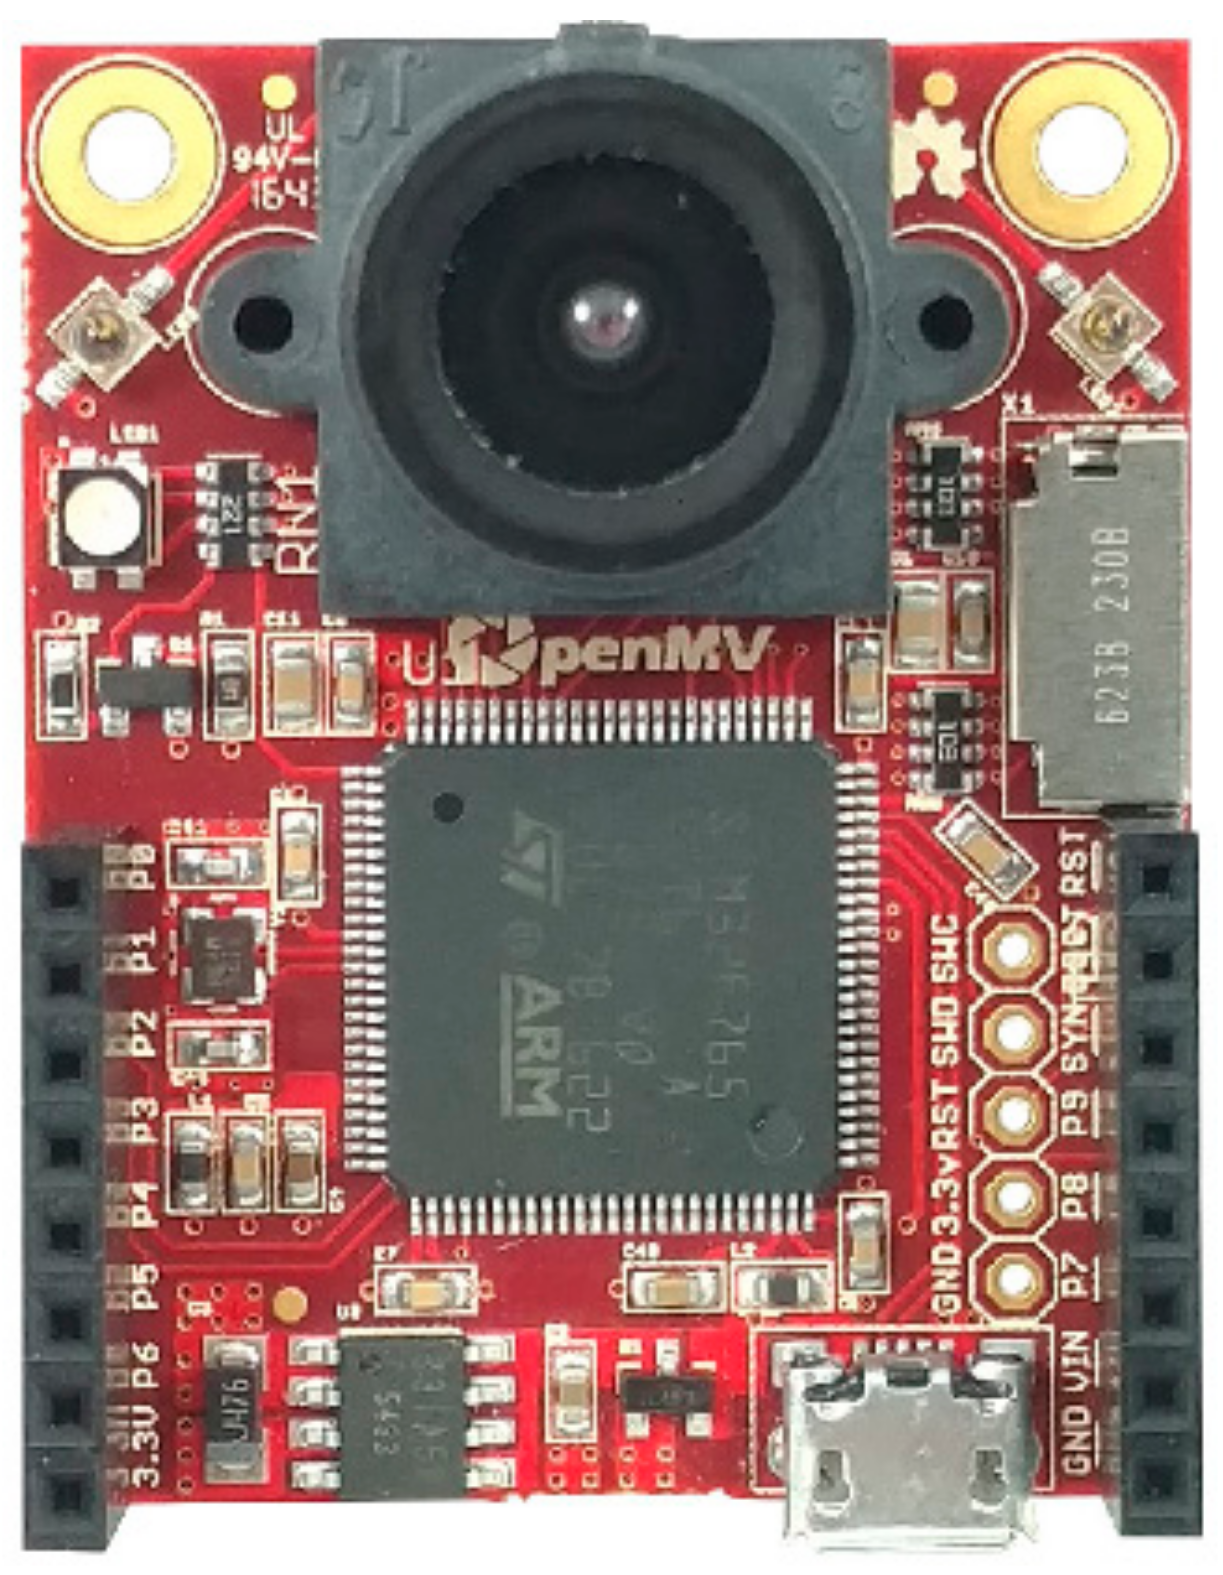
Owing to the rapid development of hardware technology, nowadays, more versatile devices are available for computer vision applications. One of them is the low-cost and Python-powered OpenMV microcontroller board. As the main controller board, we used the OpenMV Cam H7, which is dedicated to machine vision applications. In the OpenMV Cam H7, there is an STM32H743VI microcontroller unit (MCU) with an ARM Cortex M7 32-bit RISC processor core. This core includes hardware acceleration to floating-point arithmetic, and its clock frequency is 480 MHz.
Beyond the MCU, the board includes an OV7725 image sensor. It is capable of taking 640 × 480 grayscale and 16-bit RGB565 images at 75 FPS. An illustration of the OpenMV Cam H7 board can be seen in
Figure 1.
The OpenMV board runs the MicroPython operating system, which makes possible Python’s development. Today’s Python is the primary programming language for machine learning; in this high-level language, it is easier to deal with the complex structure of machine learning algorithms.
The OpenMV board is placed in a small circuit. This circuit (mother board) consists of 4 high-brightness LEDs, a battery connector, a GPS, and a GSM module. The Quectel GSM module is responsible for the daily insect pest information transmission. Beyond localization, a Quectel L80 GPS is used for time synchronization. Originally, the task of the 4 LEDs was to improve illumination conditions. However, the experimental results showed that the LED lighting caused reflection and degraded the image quality. Therefore, the 4 LEDs are not used now.
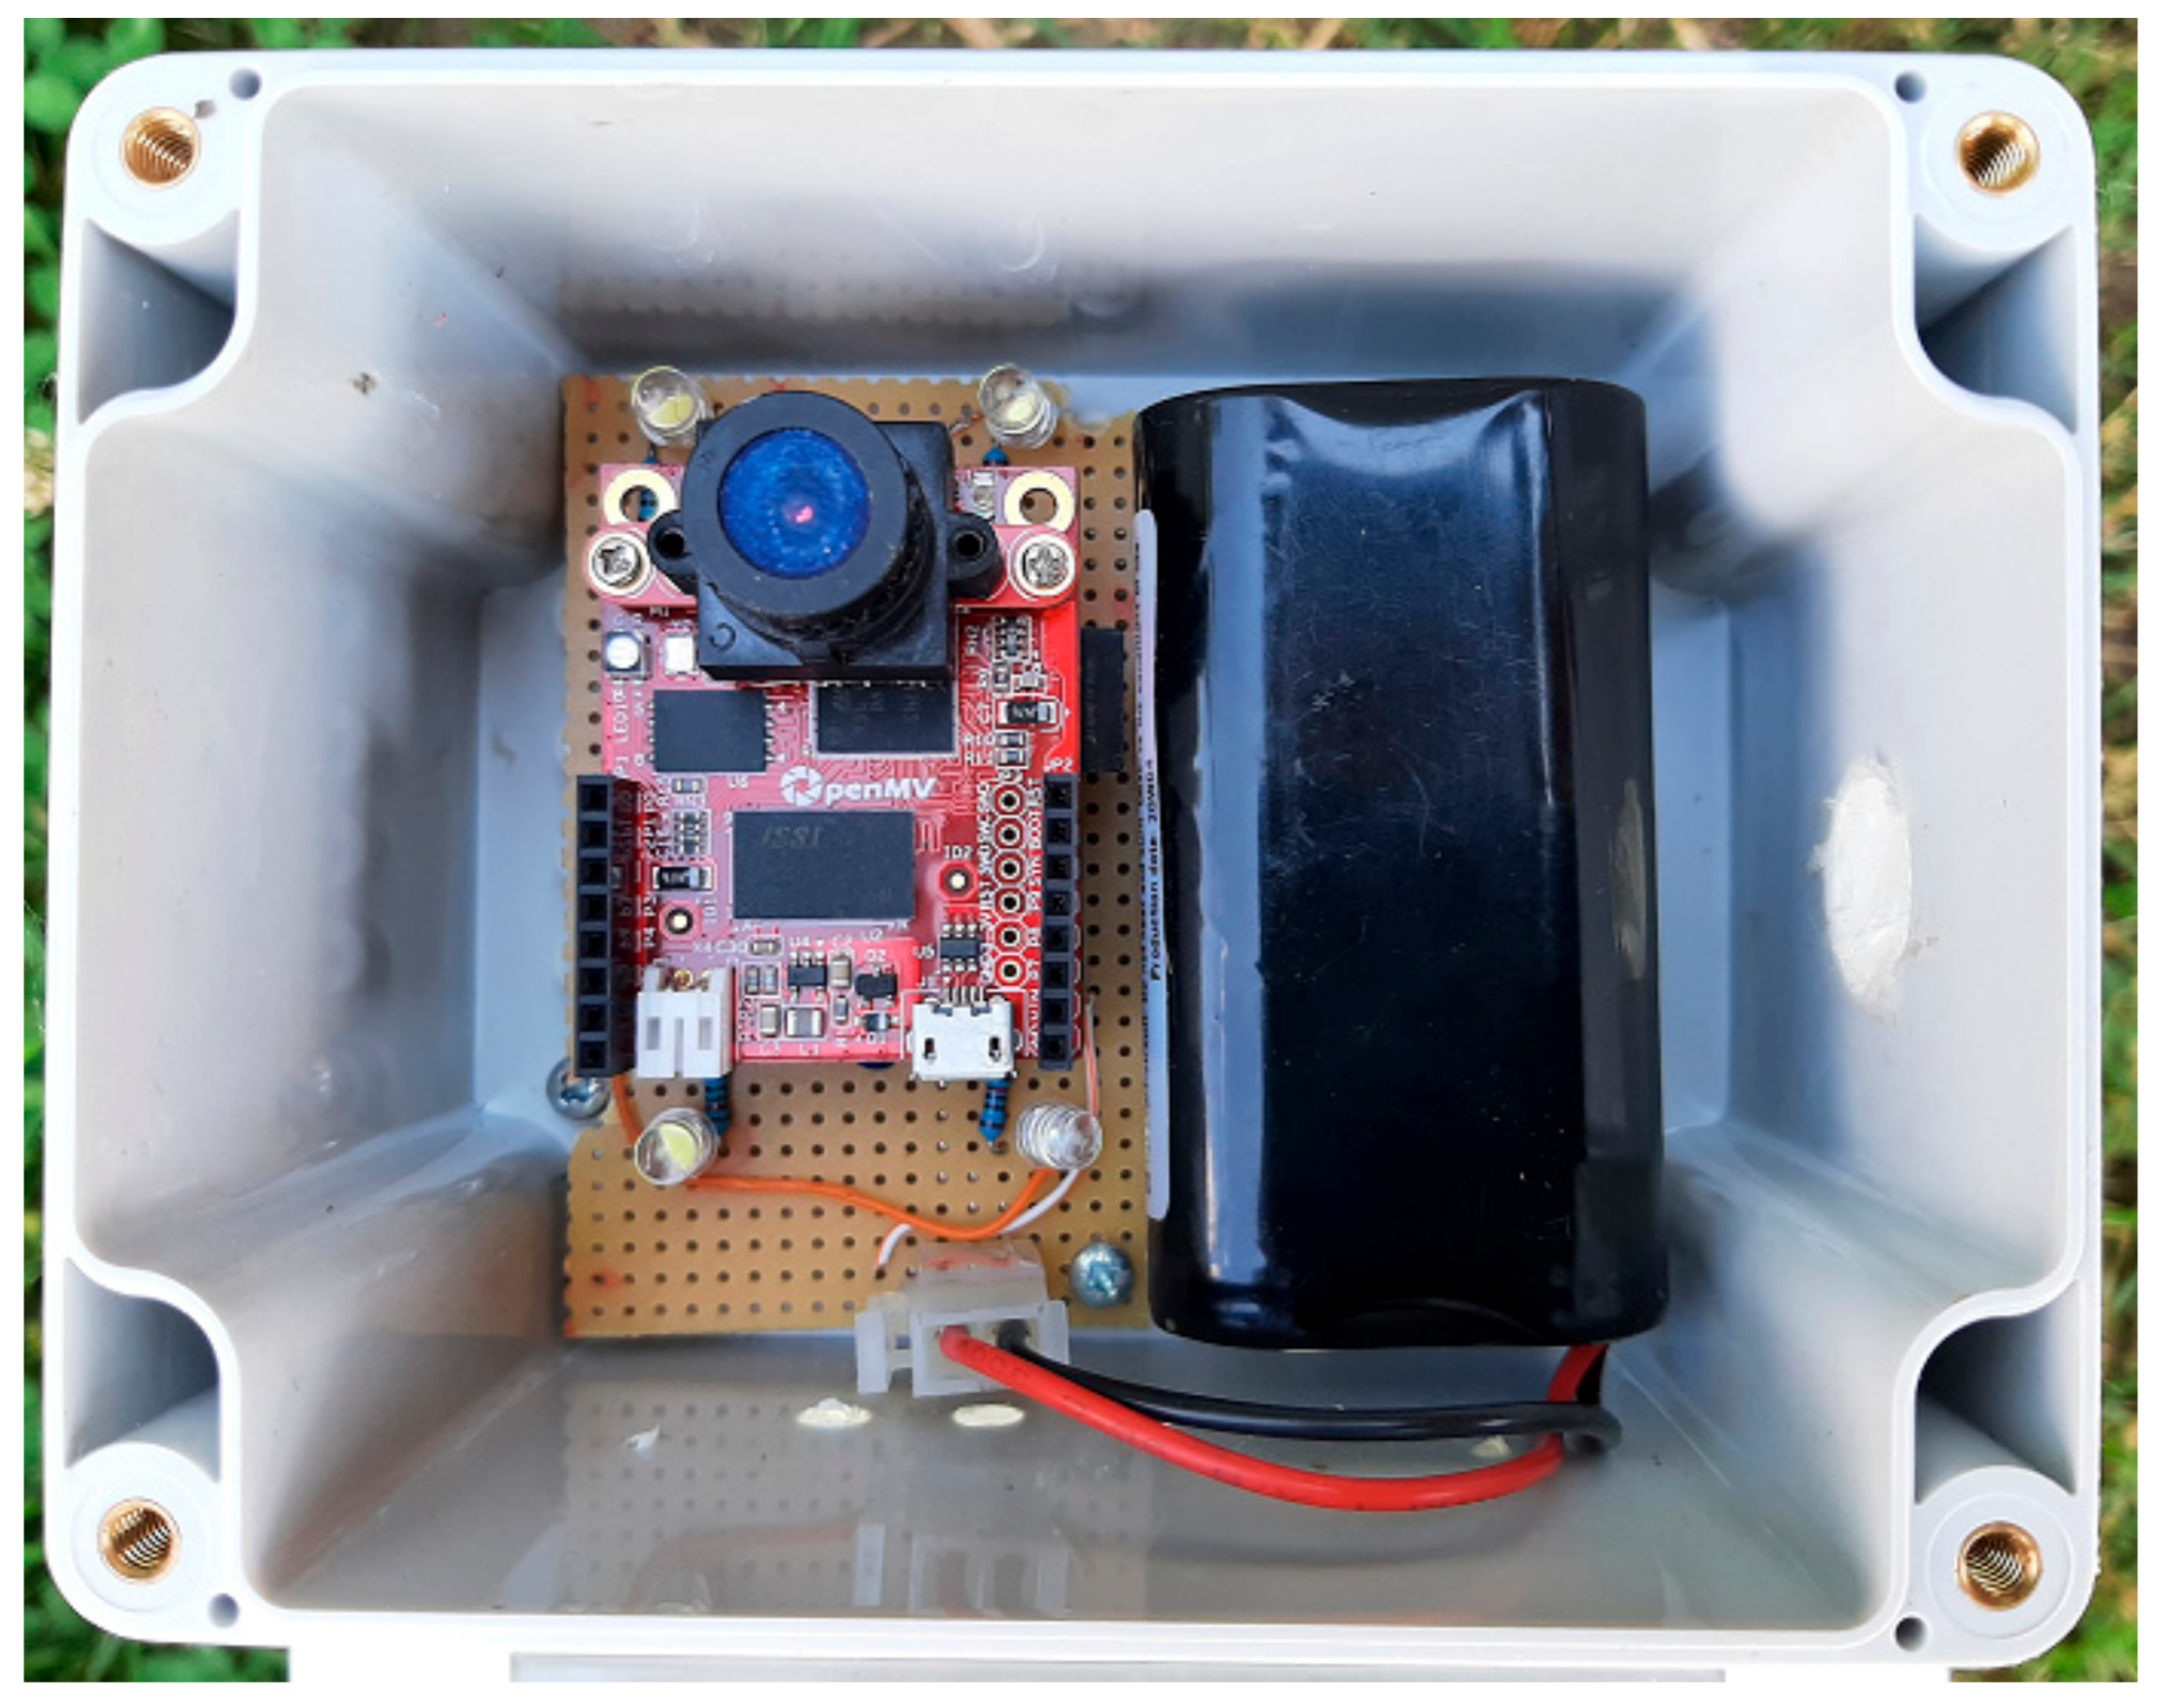
The power supply is provided by a 3.65 V, 11,000 mAh LiPo battery without solar panel charger electronics. Due to the low power consumption of the circuit, it is enough to rechange the battery once a year. In fact, the OpenMV board is on standby (or deep sleep) mode most of the time. In deep sleep mode, its energy consumption is less than 50 μA, while in active mode, it is 140 mA. The device is in active mode once a day for approximately 1 min. In this time period, it performs the image taking, time synchronization, and the information transmission.
The electronic components are placed inside a waterproof plastic box that has a transparent cover. A photo of its arrangement within the waterproof box can be seen in
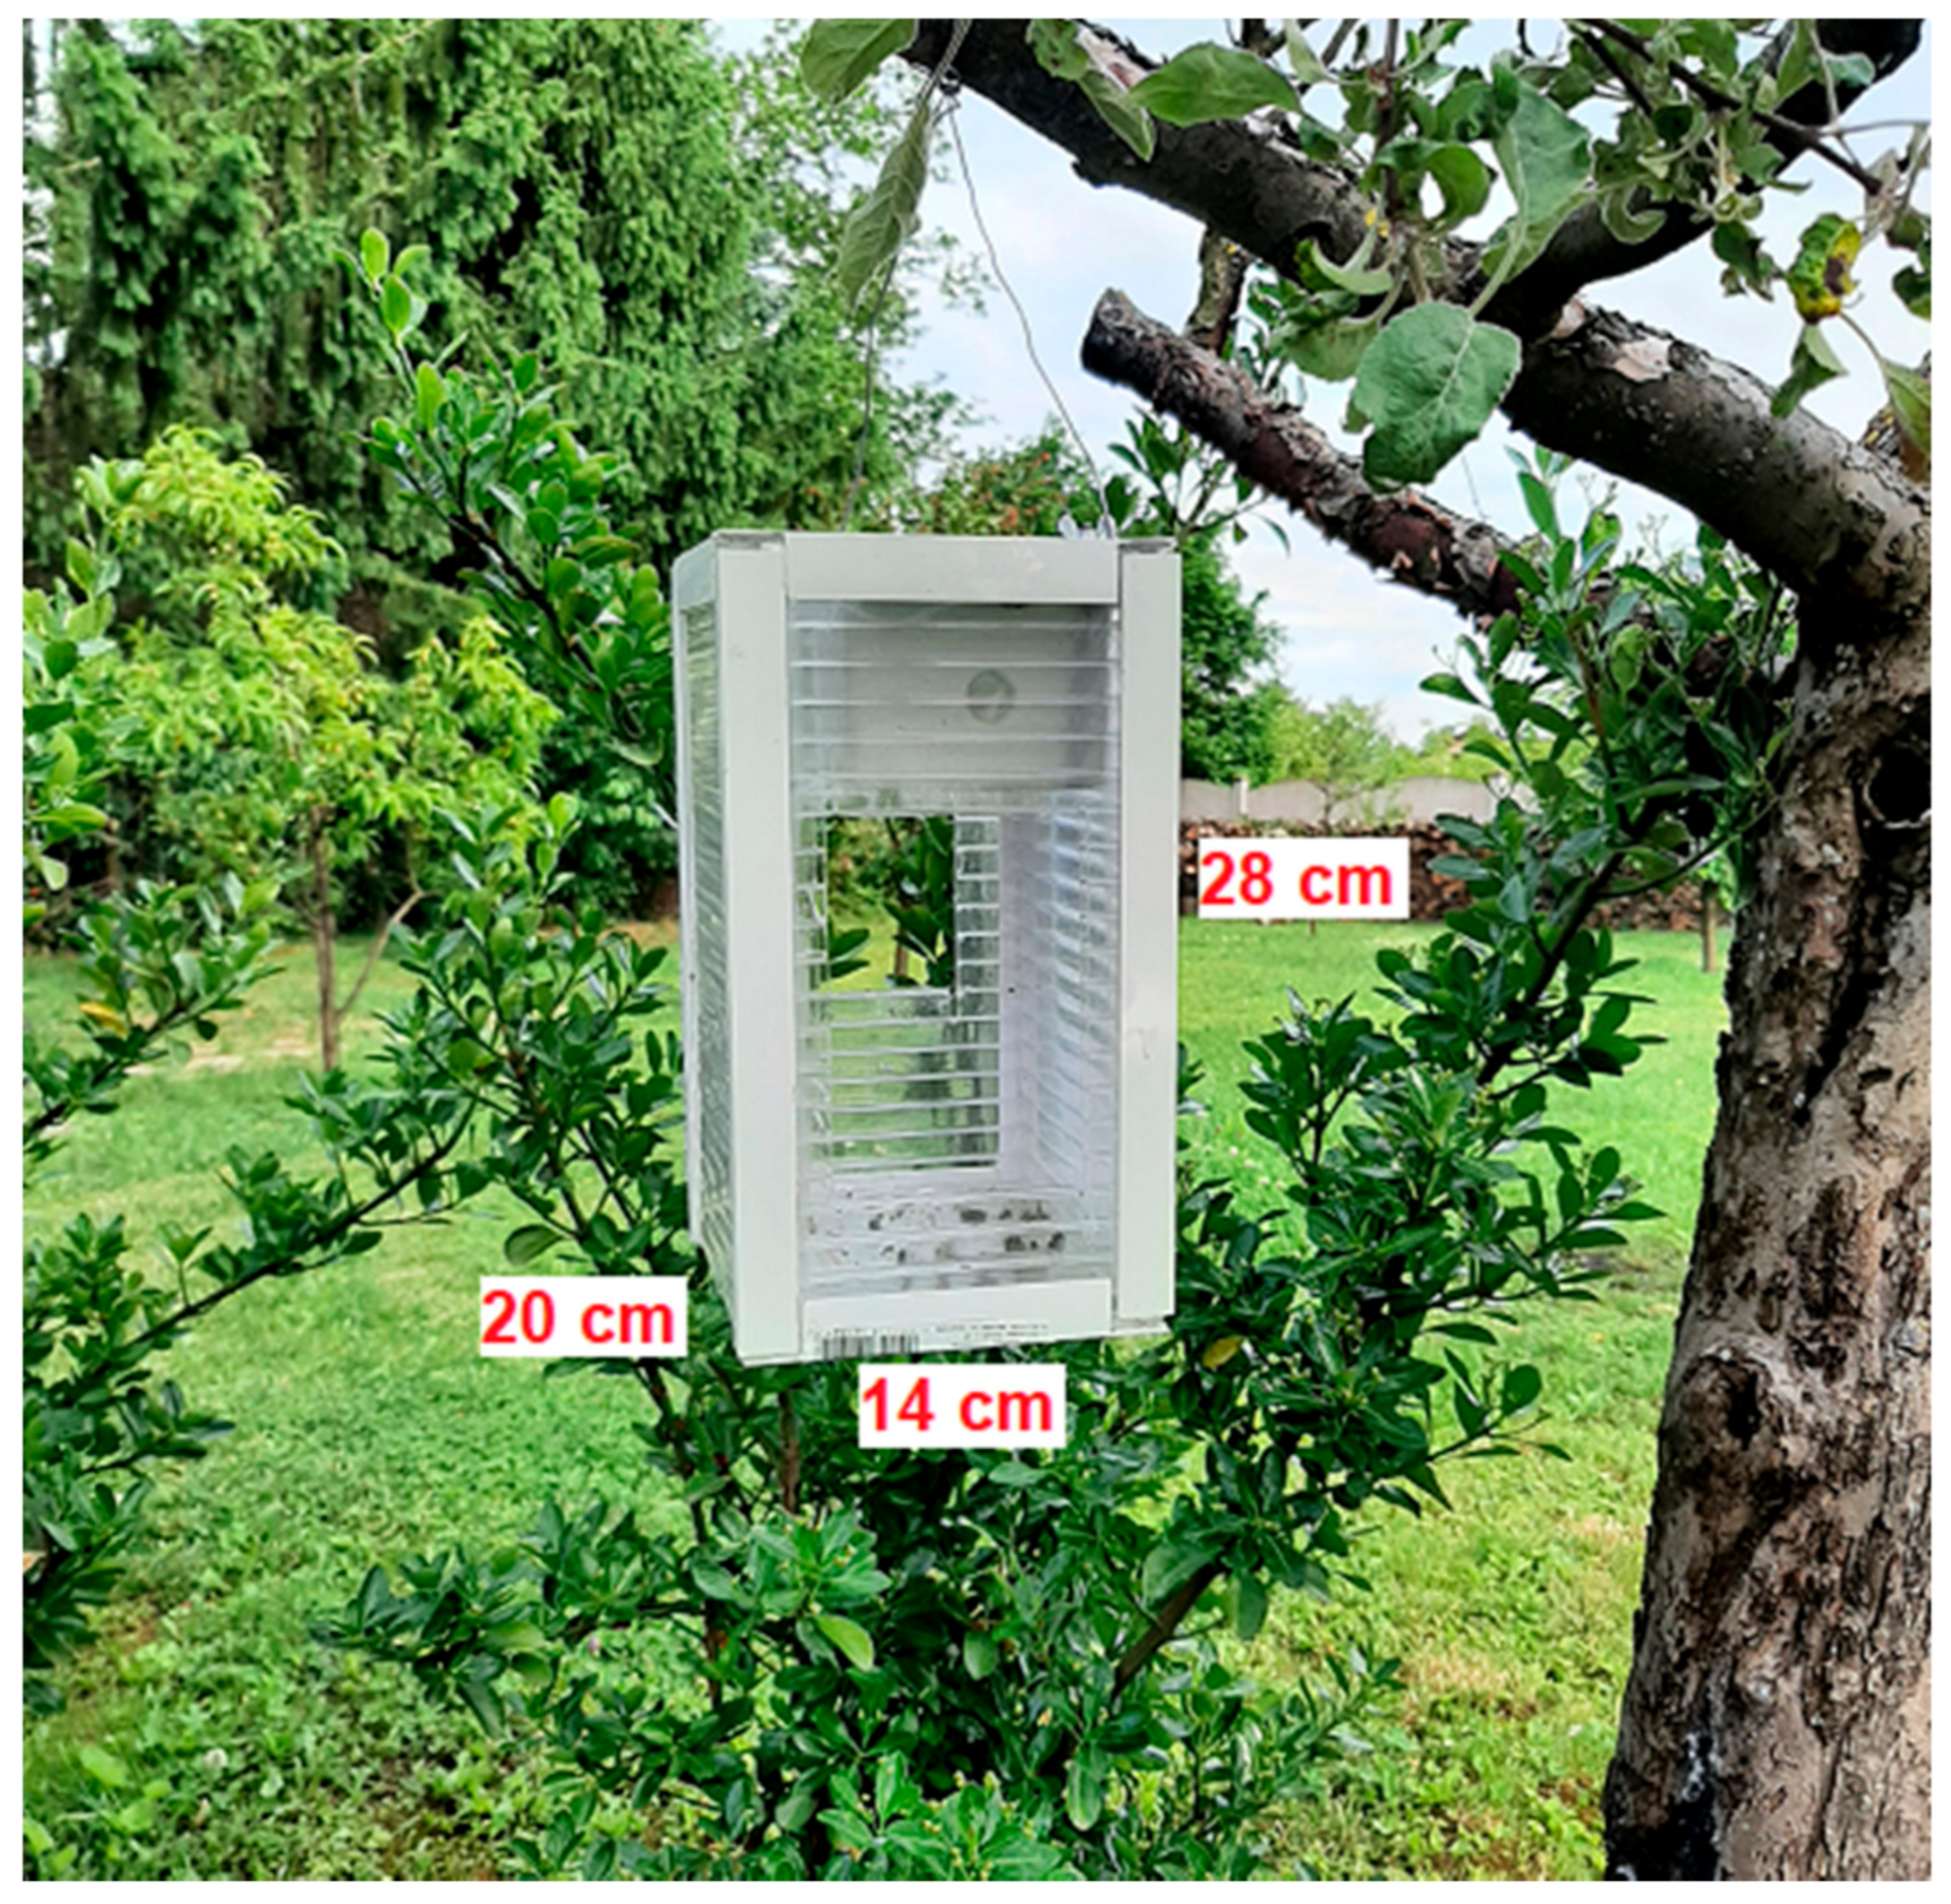
Figure 2. The box is connected to the top of the trap’s housing, while the sticky paper is placed at the bottom of the housing. The camera is positioned approximately 20 cm away from the sticky paper trap. The trap’s housing is made of a UV-resistant polycarbonate sheet. Its dimensions can be seen in
Figure 3.
Unlike earlier proposed insect pest monitoring systems, our embedded system-based trap does not require an indoor environment, AC power supply, WIFI coverage, and human interaction. In addition, using our trap does not require the installation of costly hardware infrastructure on the field.
3.2. Dataset Generation
In parallel to the hardware design, we started the development of a deep learning-based insect-counting model. The first step was the dataset construction. Unfortunately, we do not have our own dataset. As mentioned earlier, there are some freely available datasets for insect pest management, but none of them contain images of the Cydia pomonella insect pest. Therefore, at first, we tried to gather images of the Cydia pomonella from the Internet, but we were able to collect only 60 images.
After that, our idea was to gather images of moth species, which are visually similar to the Cydia pomonella, and use them to train a deep classifier model. After a detailed review of the available datasets, we found the Kaggle Fieldguide Challenge: Moths & Butterflies dataset to be the most useful for our purpose. Out of the 5419 classes of the Kaggle Fieldguide Challenge dataset, the images of 25 classes were used as additional source images in this study. Those 25 insect species were selected according to 3 criteria: the insect’s shape, texture, and tentacle length. All of the images were annotated by hand (using the Labelme software), using bounding boxes to indicate moth locations on the image [
23].
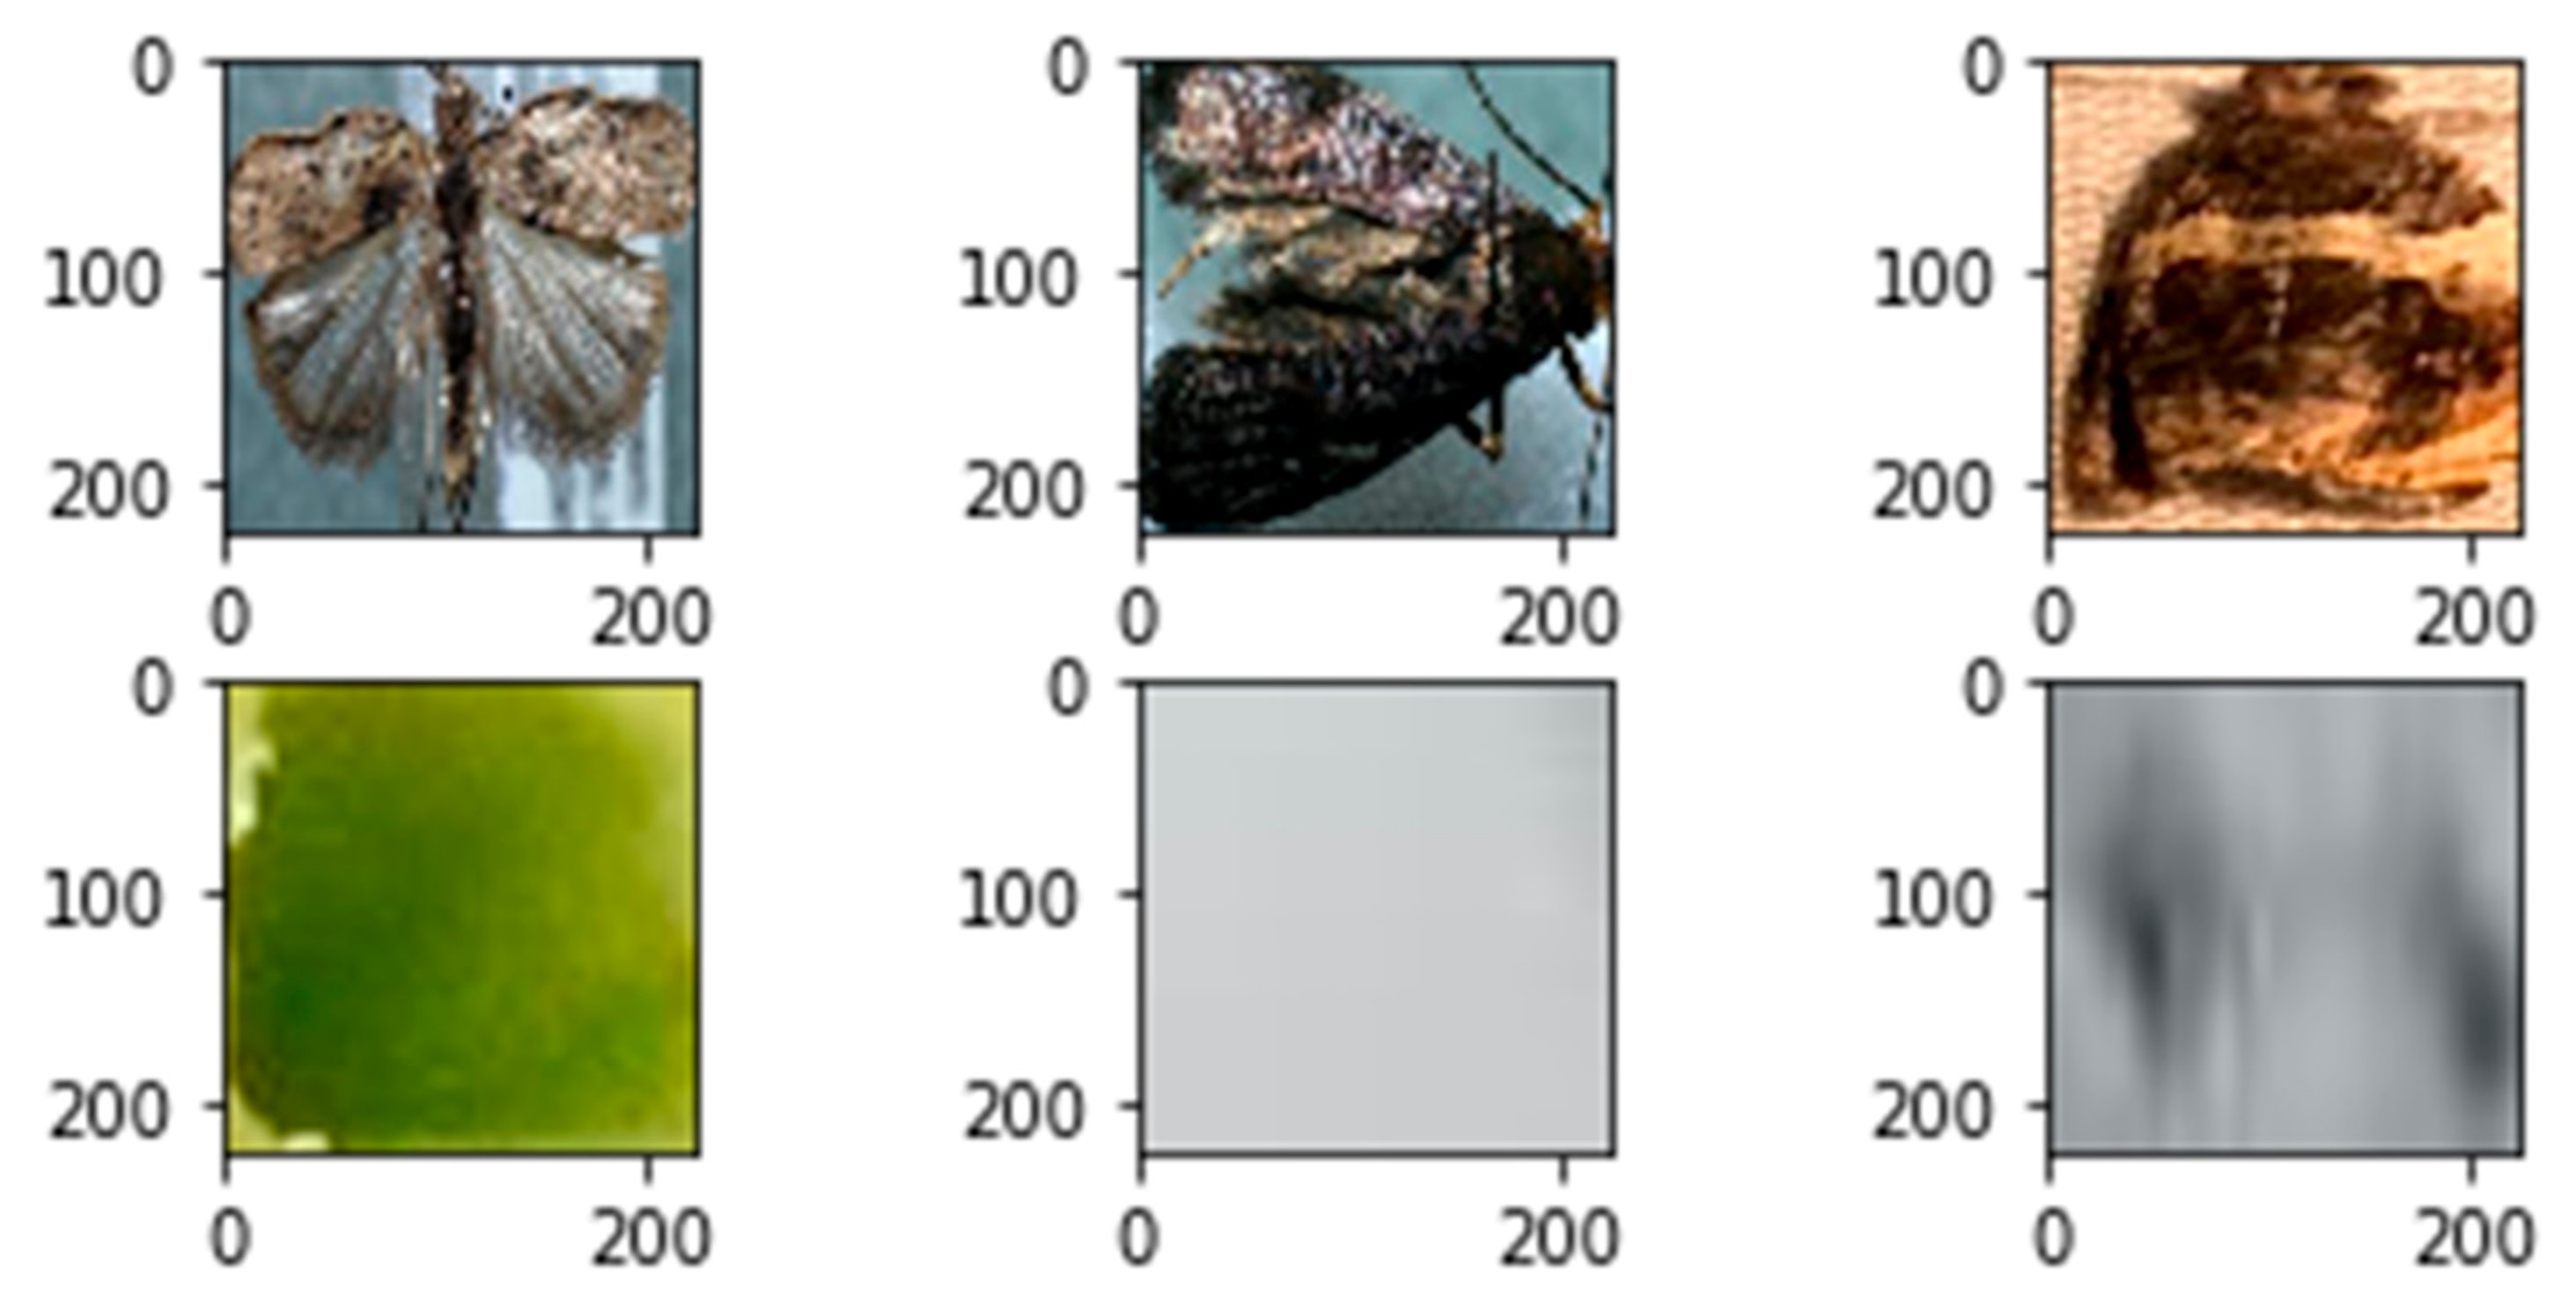
After the annotation of source images, a binary dataset was generated with positive (“moth”) and negative (“no moth”) classes. For dataset creation, we used the selective search [
24] region proposal algorithm. Selective search is a widely used algorithm in object detection research that examines an input image and then identifies where potential objects can be located. All of the annotated images passed through the selective search algorithm and the proposed regions (bounding boxes) were evaluated with the intersection over union (IoU) metrics. The IoU evaluation metrics is also widely used in object detection research to measure the localization accuracy of an object detector. More specifically, the IoU is a ratio where the numerator is the area of overlap between the ground truth bounding box and the predicted bounding box, while the denominator is the area of their union.
Out of the proposals where the IoU > 0.8, all bounding boxes were used (if available) as positive samples, and out of the proposals where IoU < 0.05, 10 bounding boxes were used (if available) as negative samples in the case of all images. At the end of the database generation process, 17,011 samples were available for us to use in training the classifier model. An illustration of 3 positive and 3 negative samples can be seen in
Figure 4.
3.3. Deep Classifier Model
A well-known fact about deep classifier models is their huge data requirement. Training deep classifier models requires a significantly larger set of sample images than shallow classifiers. Acquiring insect images is a more tedious process than using generic images. This issue was the main limitation to the use of deep classifier models in insect pest management. We tried to overcome this issue with the above detailed data generation process and a pre-trained deep classifier model base (convolutional and pooling layers). Pre-trained models use knowledge gained from huge, generic databases such as the famous ImageNet and can be a good initialization point in recognizing insect pests. In the literature, there are already several studies that demonstrate how pre-trained models can be used with great success in object classification problems even when the target object or objects are totally different from the object images used to train the model [
25].
Many pre-trained deep models can be found in machine learning-specific development environments. Choosing the “right” model requires compromise between accuracy and time requirement. We used the MobileNetV2 deep convolutional architecture (trained on ImageNet data) as our base model, which was designed for mobile devices. It has a significantly smaller architecture size and calculation complexity than other widely used object detector models such as the R-CNN. Therefore, this model is suitable for any device with low computational power. More information about the MobileNetV2 model can be found in the original paper [
26].
In our implementation, two fully connected layers were added to the MobileNetV2 base with 128 and 2 neurons each. The activation function on the output layer was softmax, while the cost function was binary cross-entropy. This extended MobileNetV2 architecture was fine-tuned on our dataset during the training process. More precisely, this means that only the fully connected layers were trained, while the weights of the MobileNetV2 base remained unchanged.
4. Results
Tests of the proposed prototype trap have only been performed since March 2021. During this time, very few useful images have been taken. Therefore, the required amount of data such as the training and test sets must be obtained from external sources.
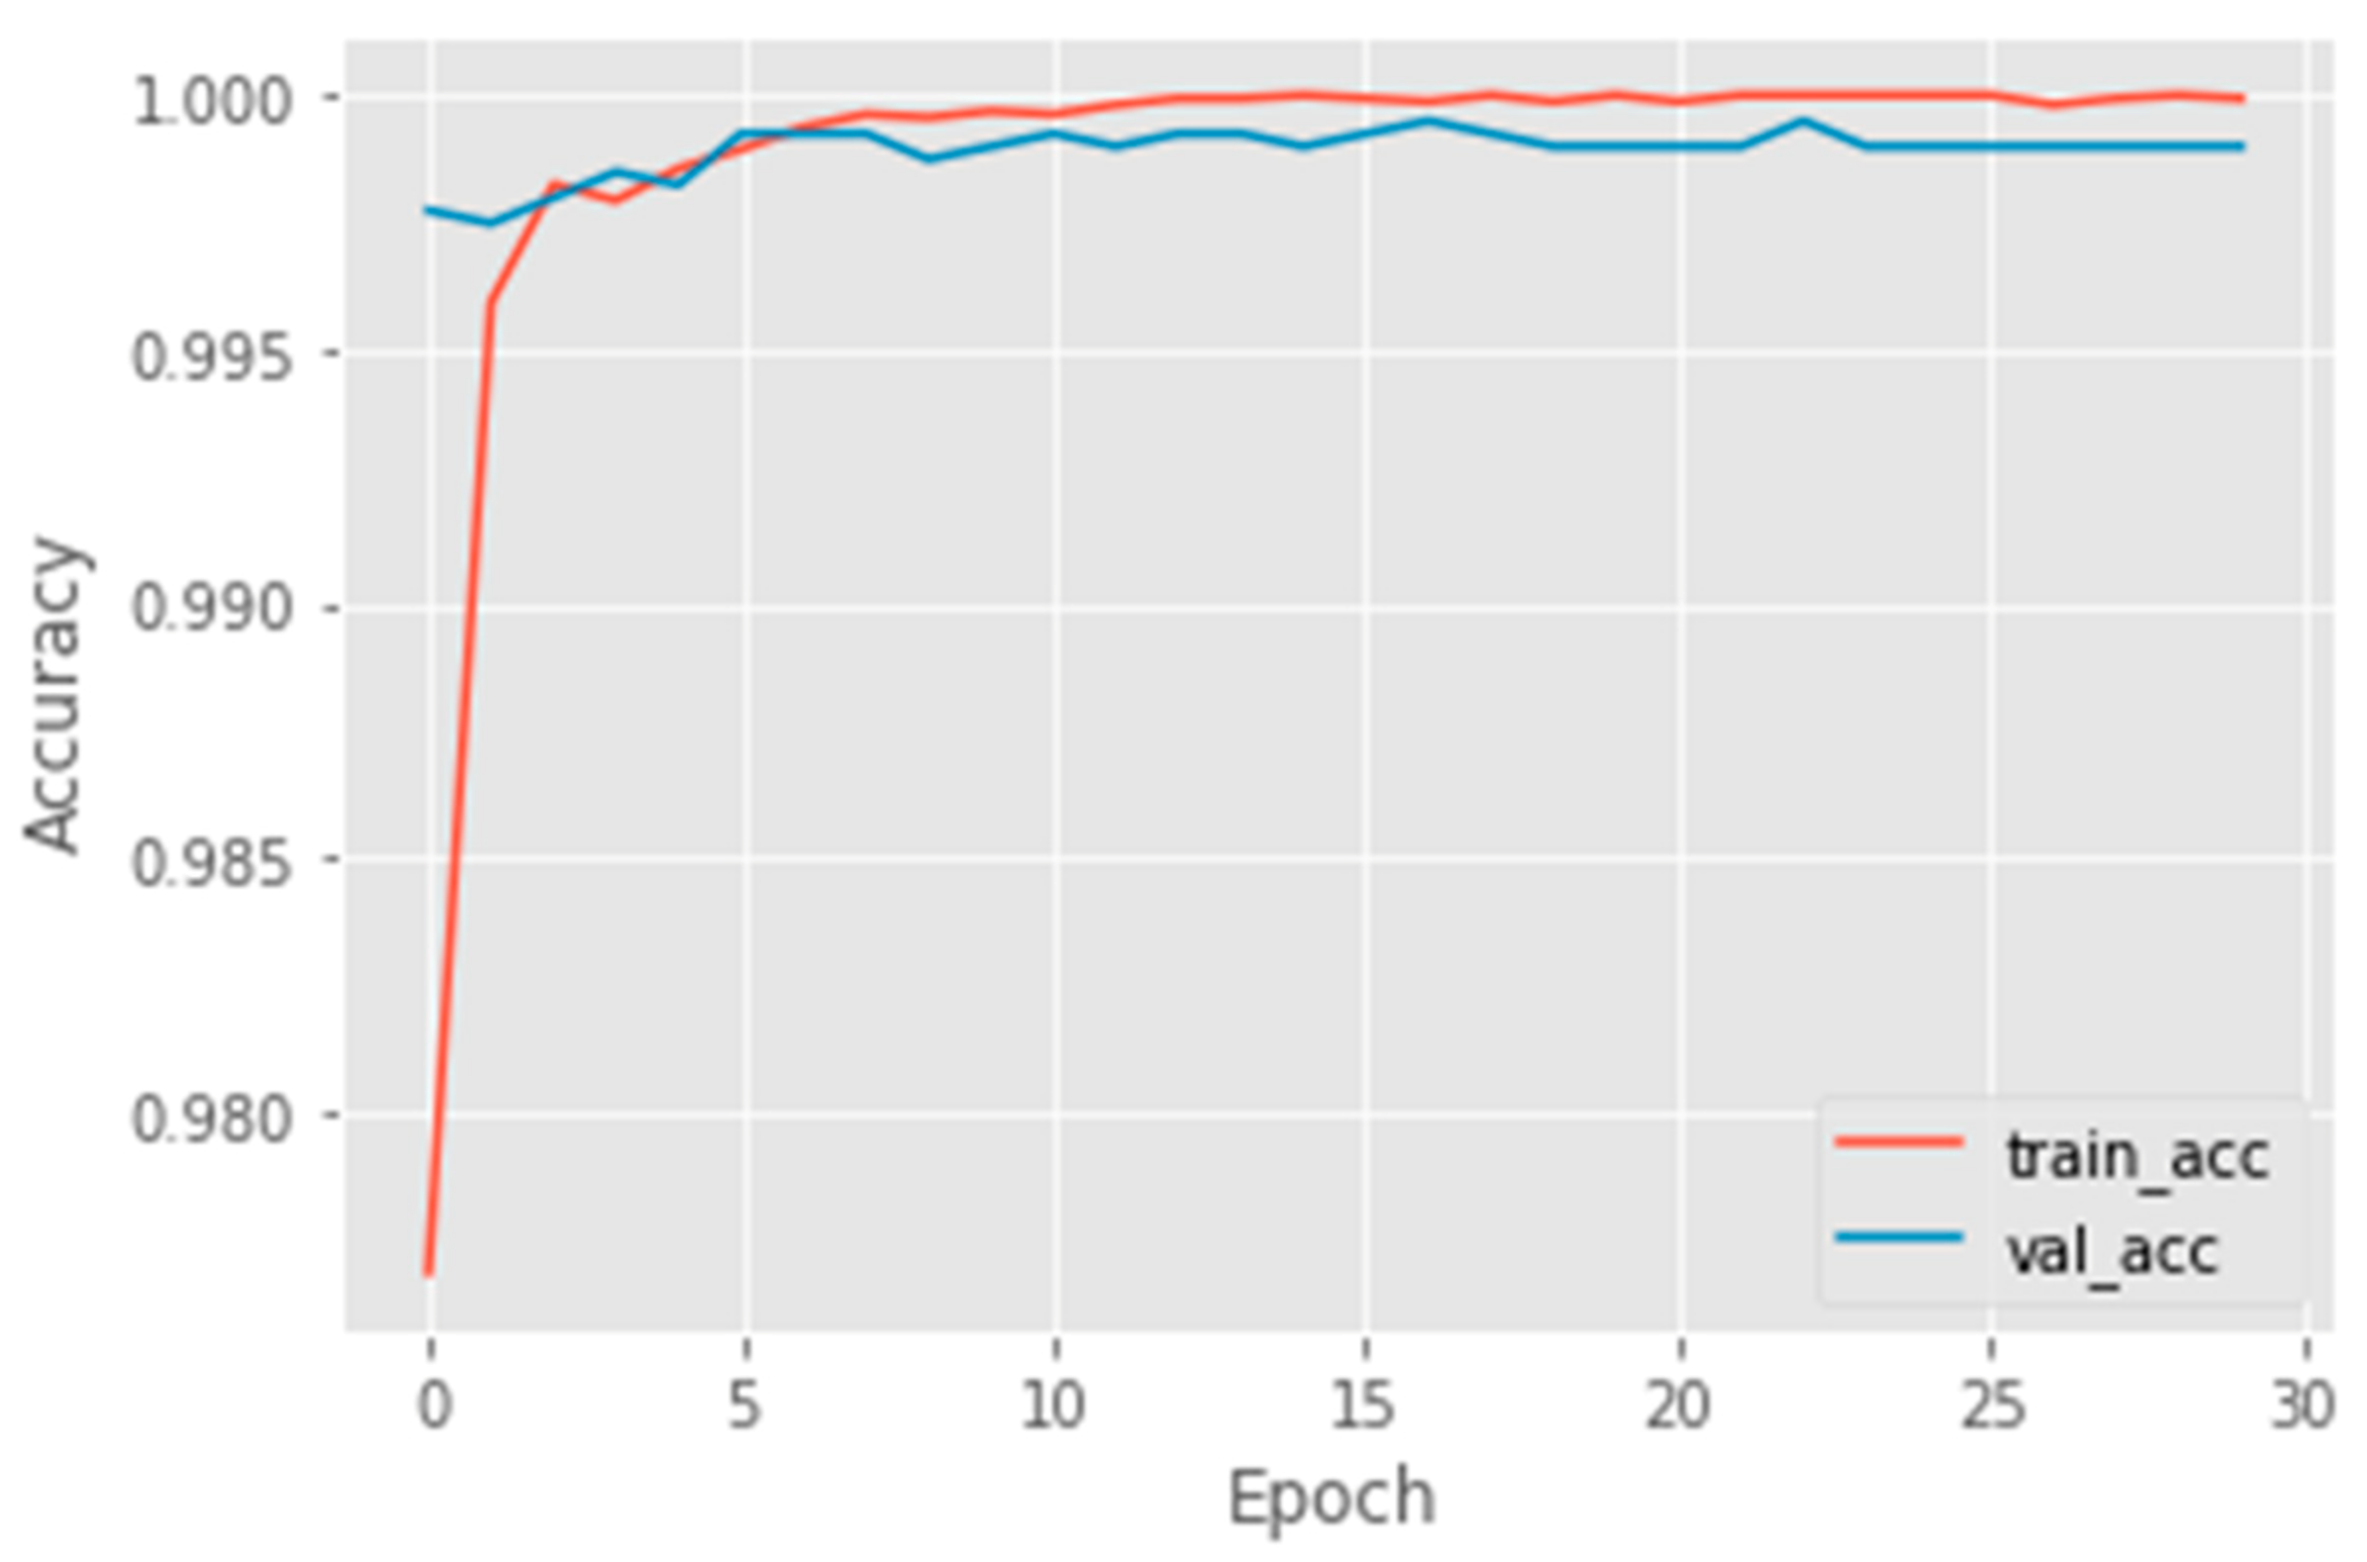
As described in the previous section, we generated a binary dataset to train the moth classifier model. As usual, the whole dataset was divided into training and validation sets. In total, 20% of all images were used for validation, while the remaining images were for the training set. After 30 epochs with a 0.0001 learning rate, the training process was terminated because the validation accuracy did not increase further. The graphs of training and validation accuracies can be seen in
Figure 5.
Unlike the sample images (cut out from general images of insects) used in the training process, trap images were used in the test phase. Our test set consists of 30 different and independent sticky trap images, which have also been annotated by hand [
23].
In order to find image regions on test (trap) images where insects could be located, we used the same selective search method used in the dataset generation step. Depending on the image, selective search may give back more than a thousand proposals. To filter out proposals with an inappropriate size, we defined a lower and upper size boundary. The lower limit was 2% of the test image size, while the upper limit was 30%. This means that the height and width of the bounding box proposed by the algorithm had to be greater than 2% of the image size (height and width) but less than 30% of the image size.
To measure the accuracy of the selective search method (with size restriction), we introduced the following metrics:
where
N is the number of test images and
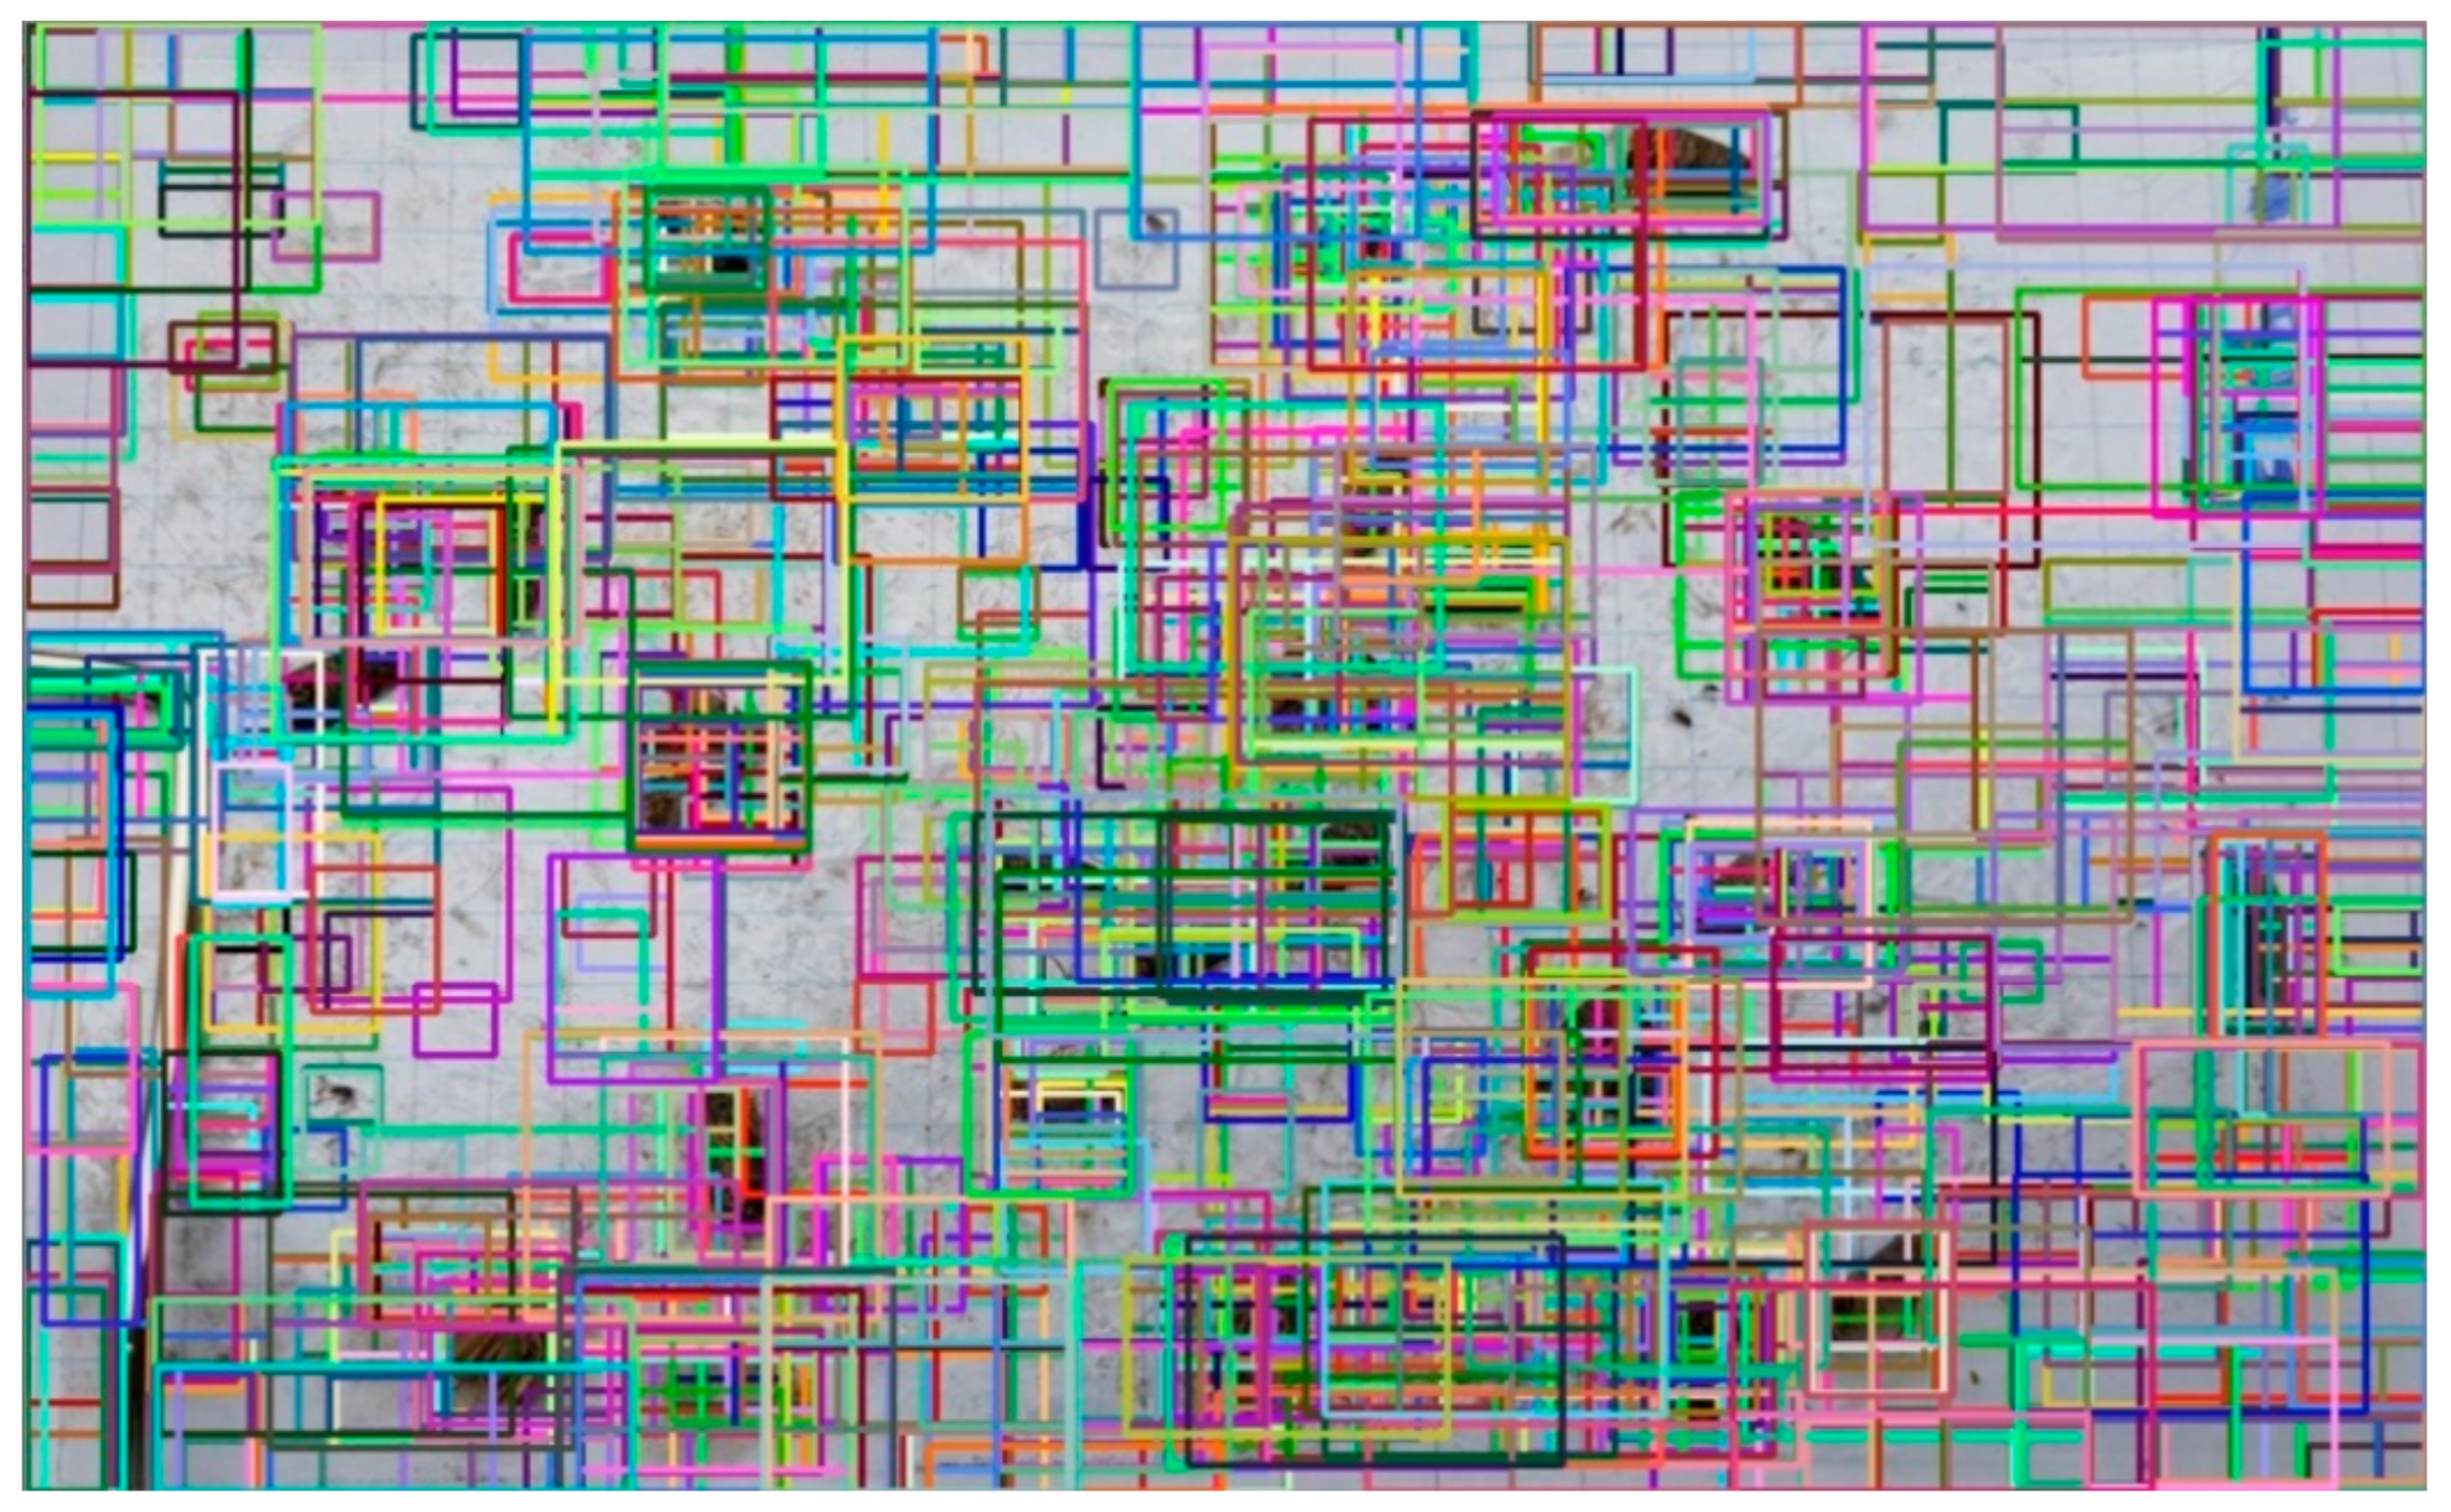
Mi is the number of ground truth boxes on the ith test image. This metric (in percentage) is 82% on our test set, which indicates that the selective search method can be used with high confidence. As an example,
Figure 6 shows all proposals on a test image where the original selective search method generated 4217 proposals, while the size restriction reduced this value to 1994. To visually demonstrate the efficiency of the used region proposal method,
Figure 7 shows only those proposals where the
IoU value between proposed and ground truth boxes was higher than 0.8. We can say that the region proposal method found one or more regions to all moths on a given test image; this was also true for other test images.
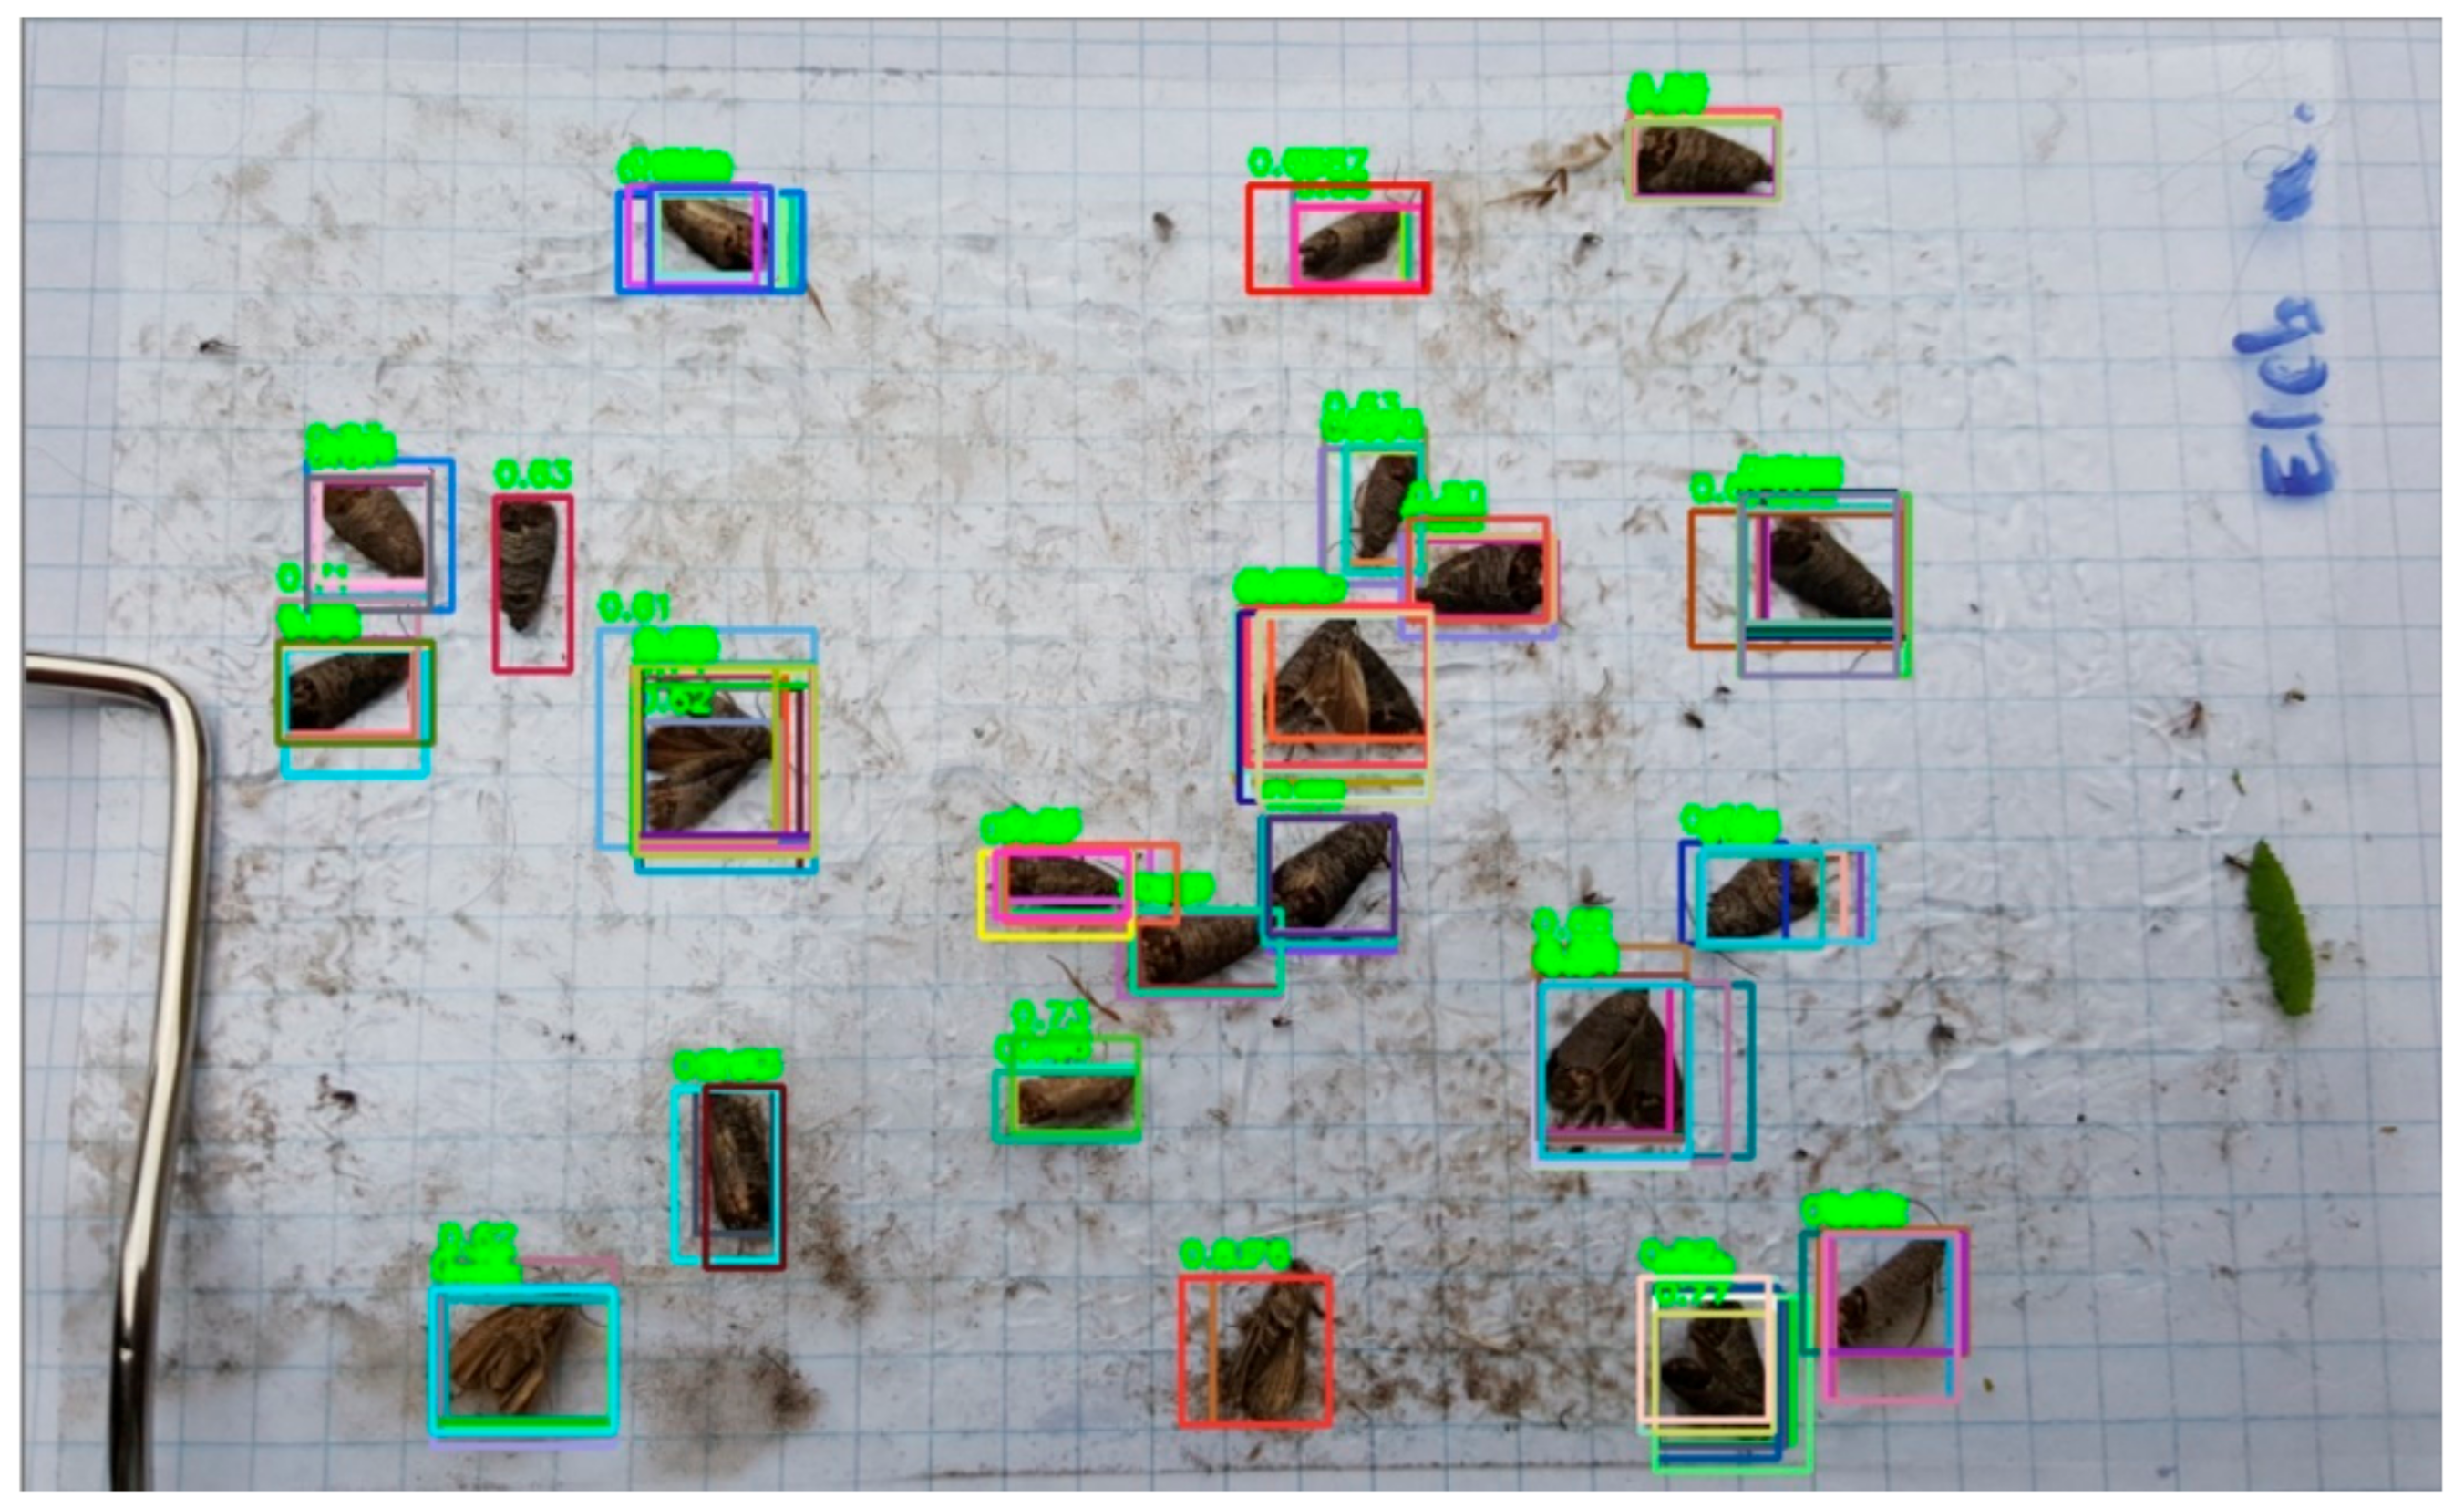
All of the selected image regions were passed to the trained moth classifier model. Since the model’s output activation function was softmax, the model output could be seen as a probability value indicating if the proposed region contains moths or not. The final decision would depend on those probability values. In this study, we used 0.5 as the probability threshold value. This means that if a probability value of a region is higher than the probability threshold, the region will be seen as a possible moth; otherwise, we will ignore that region. A sample image of the outcome of the classification step can be seen in
Figure 8.
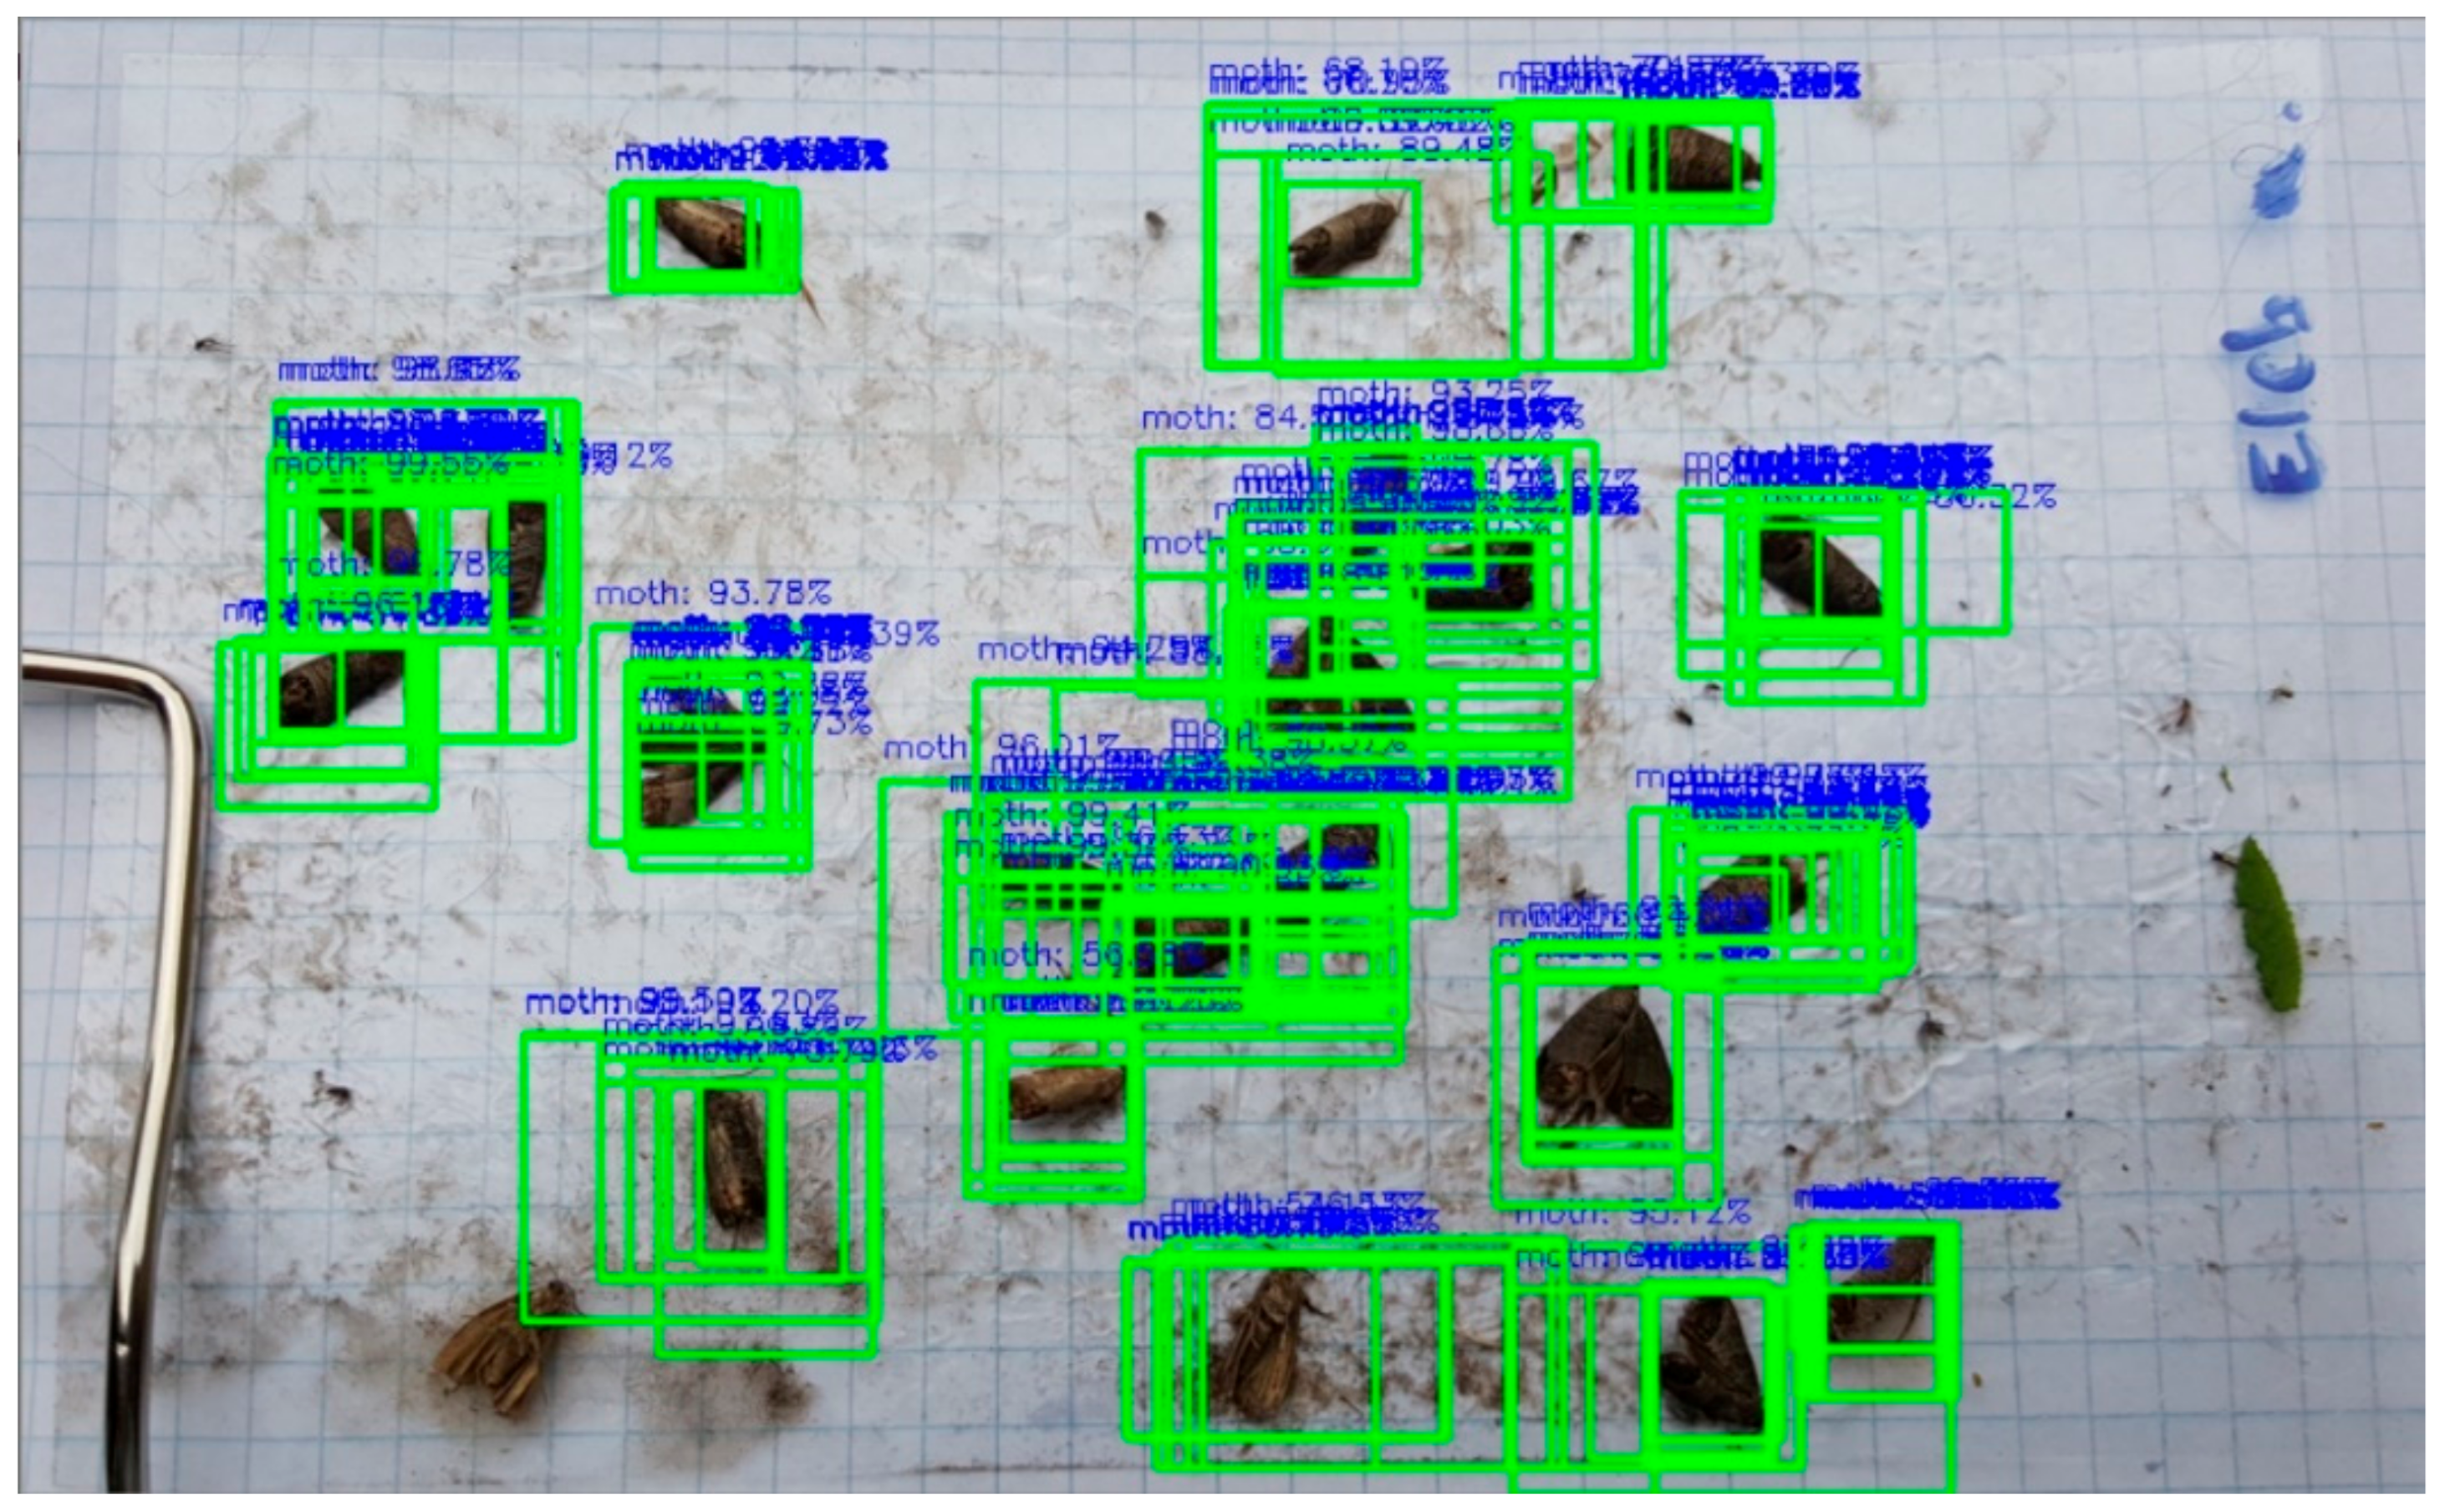
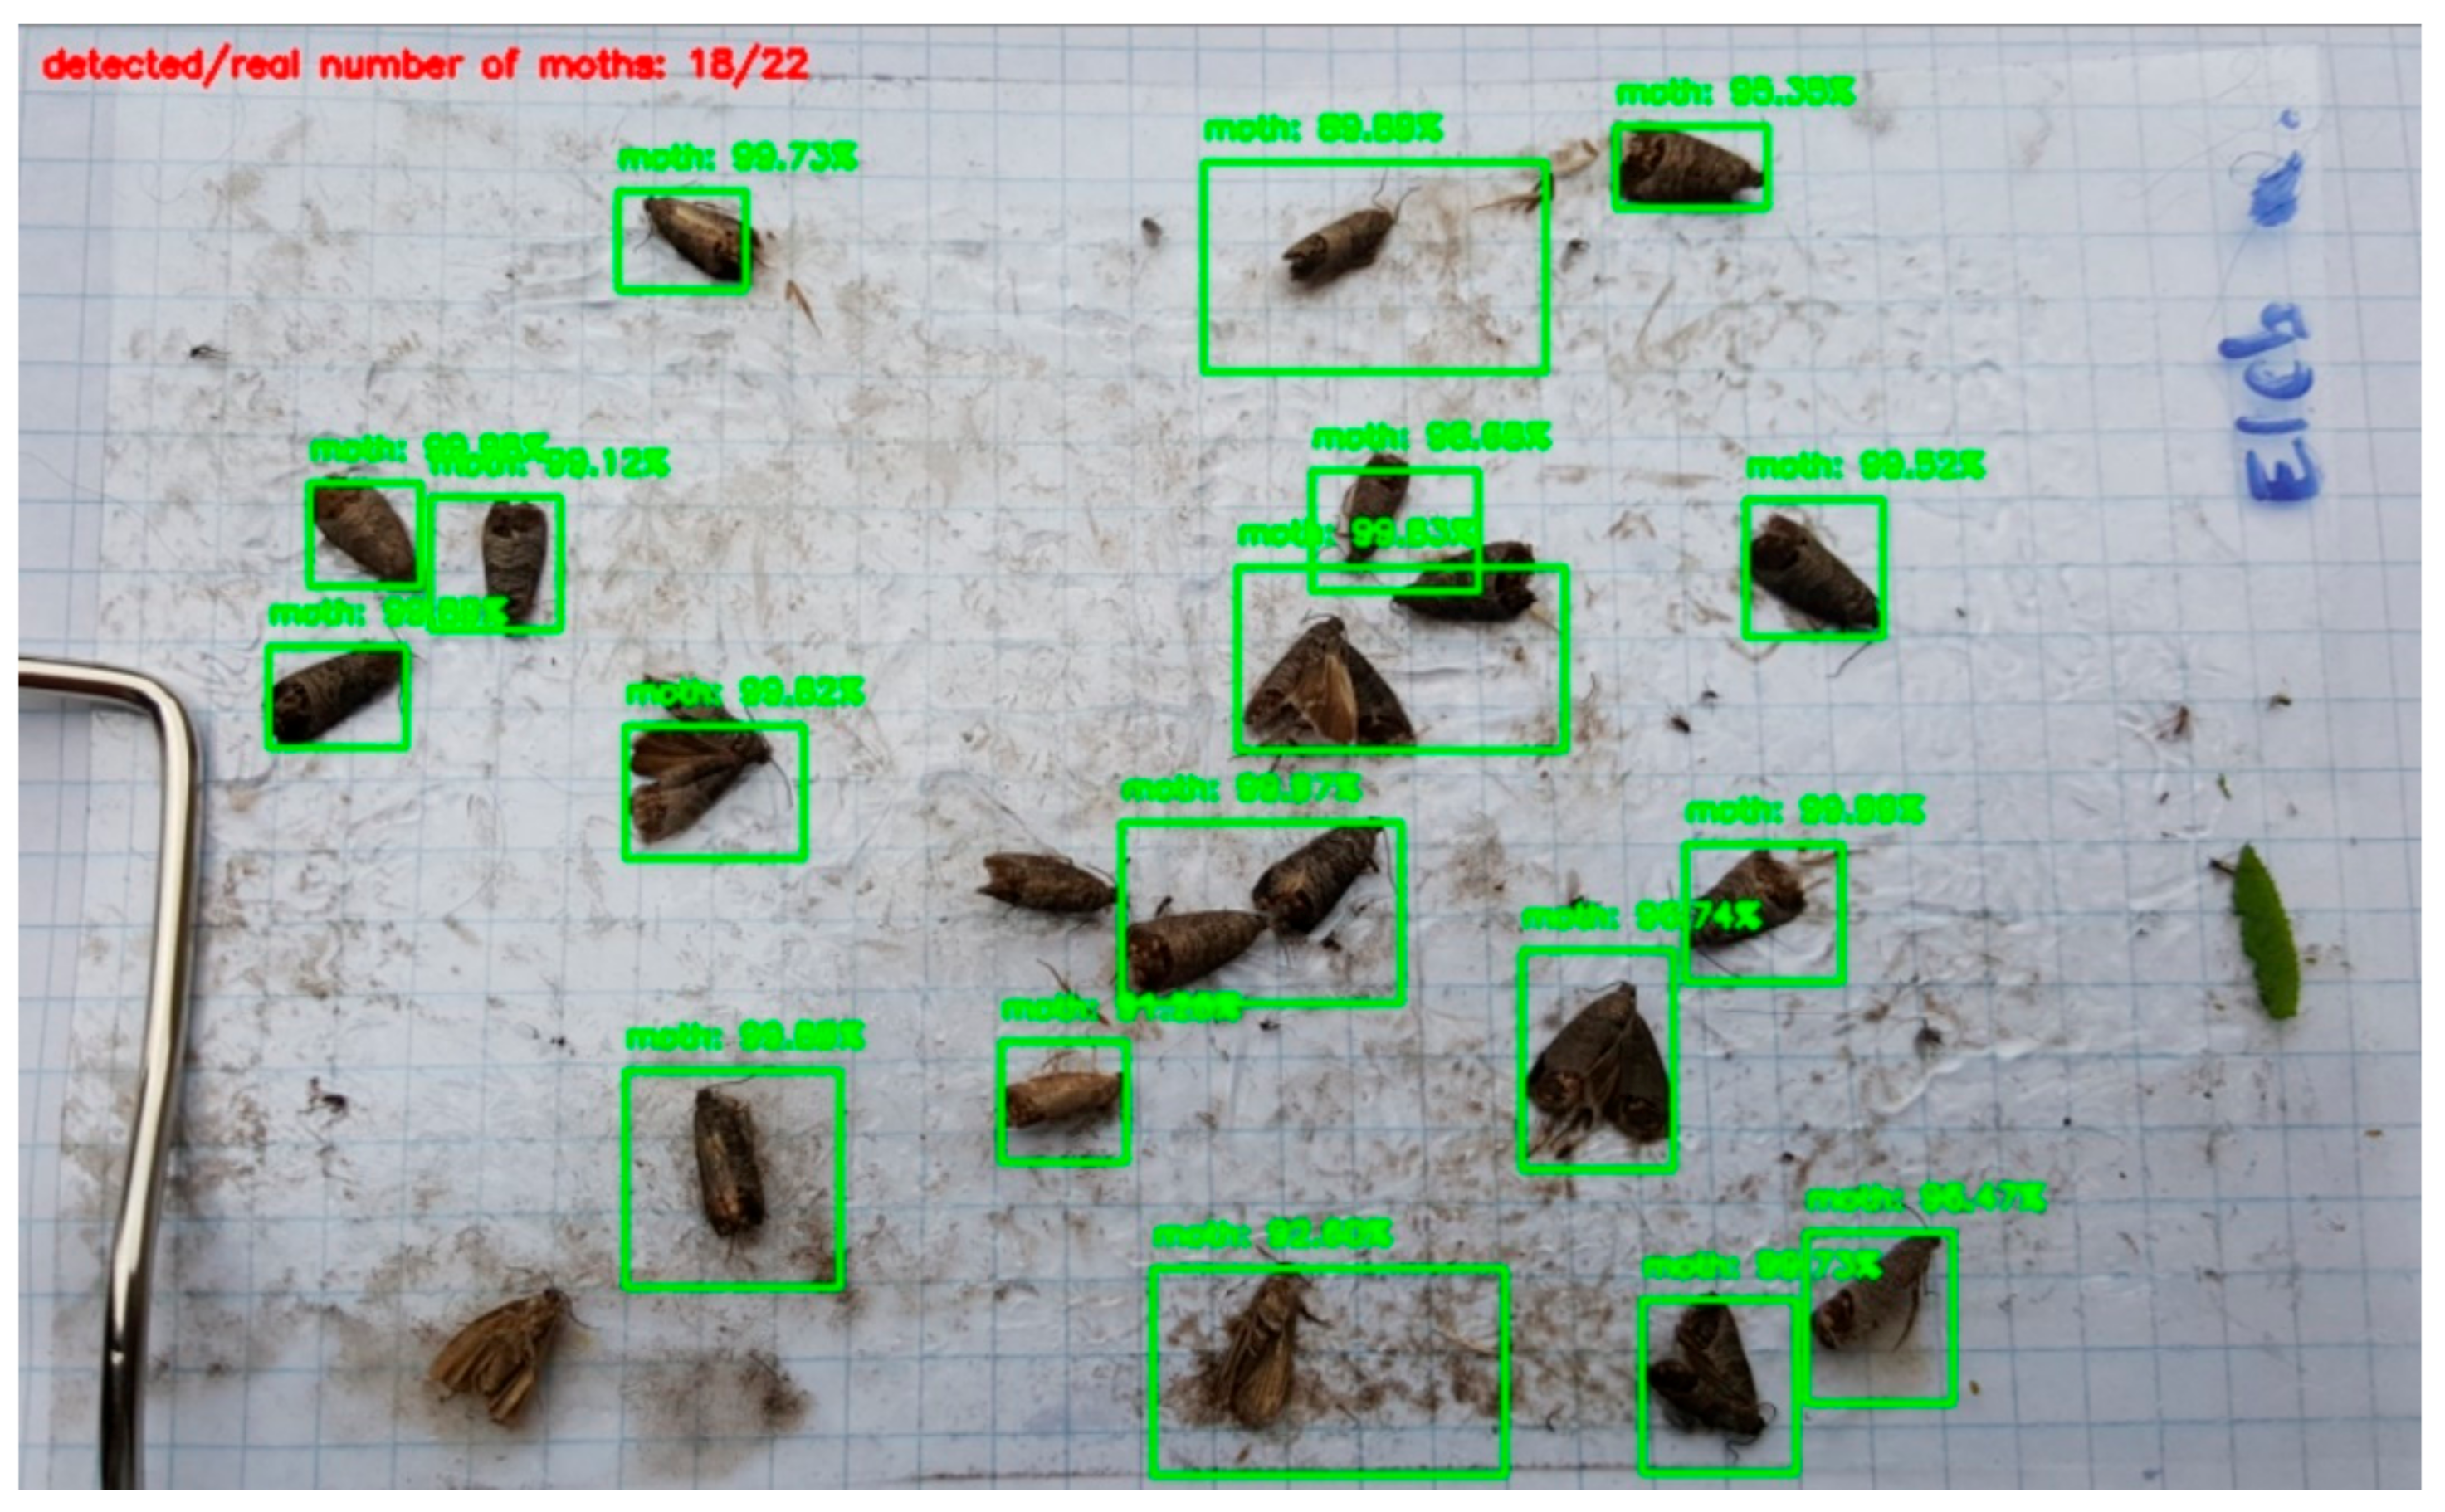
In
Figure 8, there are more regions that cover exactly the same moth. Therefore, in the last step of the classification process, we had to “suppress” overlapping regions. A commonly used solution for this problem is the application of the Non-Max Suppression (NMS). The goal of NMS is to eliminate the less likely bounding boxes and to keep only the best ones according to the probabilities and the IoU values of overlapping boxes. The effect of NMS can be seen in
Figure 9. The number of detected regions by NMS can be seen as the number of detected moths (
cp).
To measure the performance of our insect-counting method, we introduced the following loss function:
where
N is the number of sample images,
cp is the number of predicted boxes, and
cr is the number of real insects (ground truth boxes). The loss values of the insect-counting algorithm with the NMS can be seen in
Table 1. In the table, IoU Thr. values indicate the overlapping threshold levels in the NMS algorithm.
In the NMS algorithm, neighboring detections will be removed if their overlap is higher than a pre-defined threshold. In this case, other possible objects will be missed in neighboring detections. In other words, all of those proposed boxes (
bi) which are close to another object but have a lower score than
bx (neighbor object with a higher score) will be suppressed if the IoU threshold level is low. This means that true positive bounding boxes will be removed in those regions of the image where there are more nearby (or touching) insects. This phenomenon can be observed in
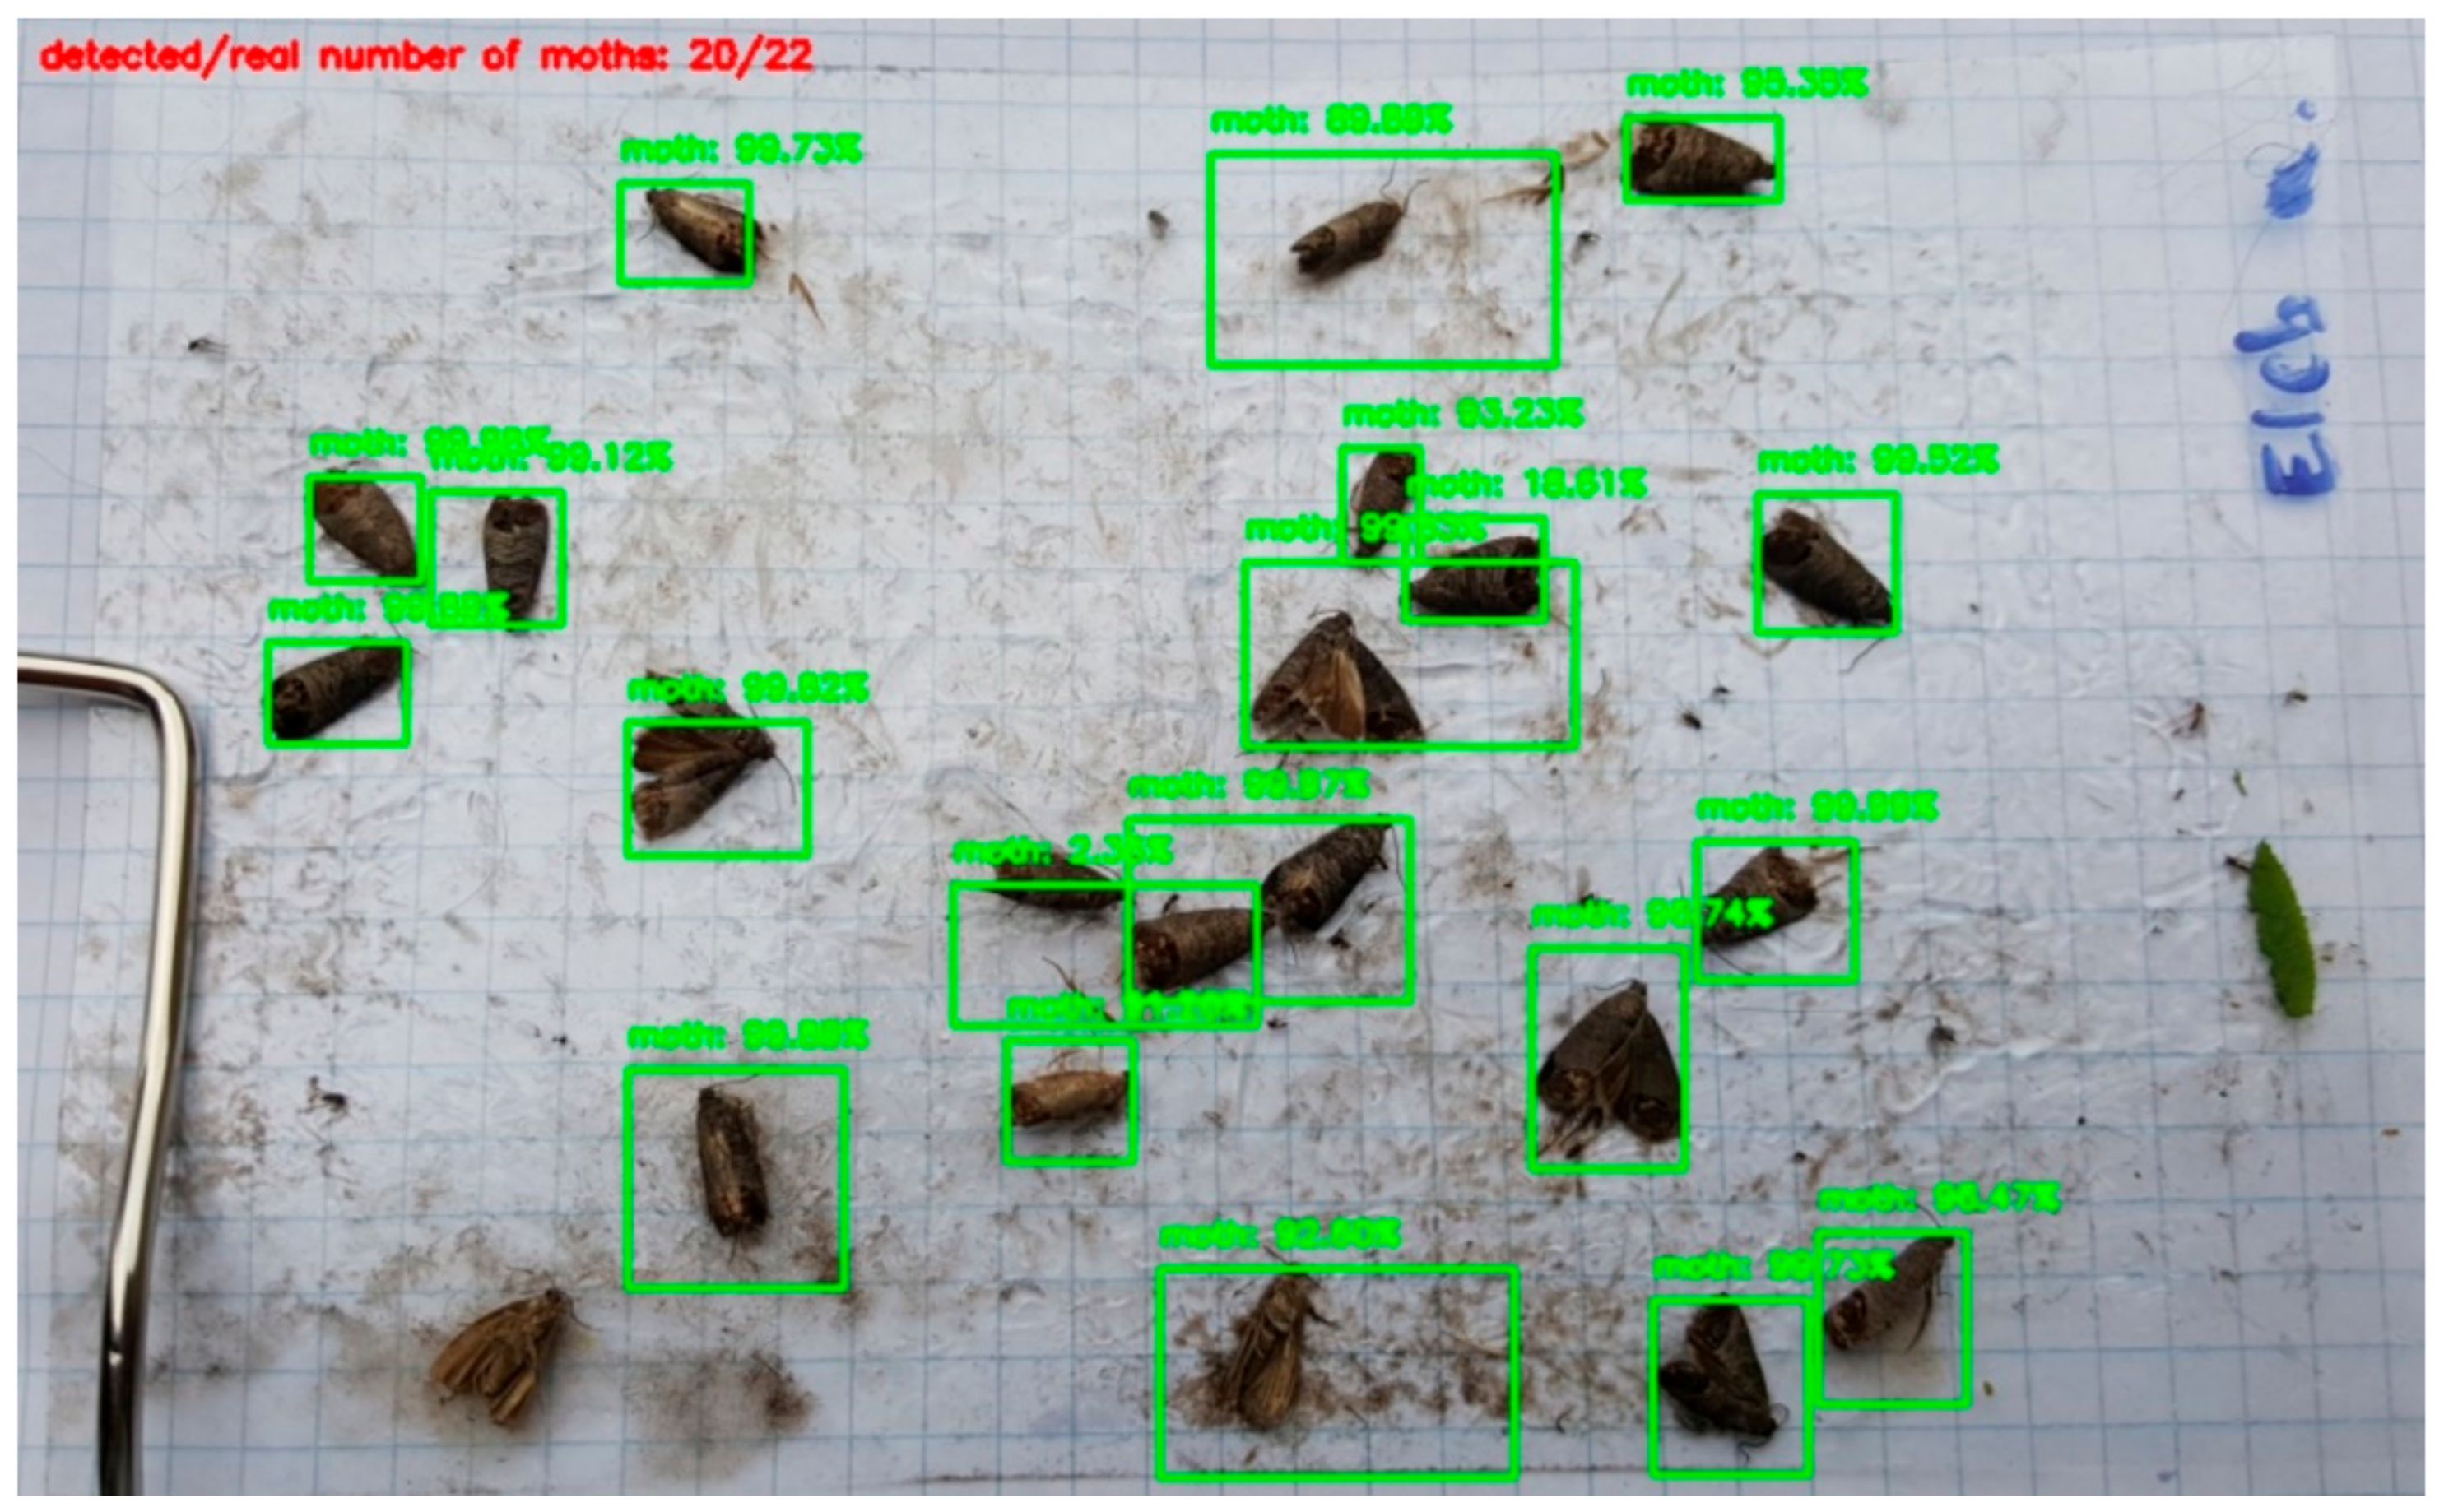
Figure 9 where the conventional NMS cannot handle touching insects well. To overcome this issue, we tried to use the Soft-NMS method [
27] instead of the conventional NMS.
The key idea of Soft-NMS is to keep neighboring detections with a decreased probability value (score) as a function of its overlap. The authors of Soft-NMS proposed Equation (3) for the rescoring of bounding boxes; in this equation,
si is the score of box
bi.
An important parameter in in the exponential penalty function above is the σ, which controls the penalty strength (score decrease) of overlapping boxes.
After rescoring overlapping boxes, we had to use another probability threshold to decide on which boxes were true positive. To analyze the capabilities of Soft-NMS, we tried more probability threshold levels in combination with more
σ values. The loss values of our insect-counting method with Soft-NMS can be found in
Table 2.
6. Conclusions
In this work, the hardware plus software design and the implementation of an automated insect pest counting system has been presented. We proposed a new embedded system-based insect trap with an OpenMV Cam H7 microcontroller board, which can be used anywhere in the field without the restrictions of previous traps.
In addition, we also proposed a deep learning-based insect-counting method instead of previously used segmentation techniques. To overcome the problem of having a lack of data seen in previous articles, we generated our own dataset and used a pre-trained deep model for the classification. The pre-trained model (MobileNetV2) was fine-tuned on our dataset, which is freely available for the scientific community.
For object proposal, the selective search algorithm was used. Using the IoU metric, we showed that the selective search algorithm can be applied reliably on trap images as object proposal. To suppress false proposals (bounding boxes), the NMS and the Soft-NMS algorithms were investigated. Our test results show that the Soft-NMS with the exponential penalty function achieves less loss (introduced in Equation (2)) than the conventional NMS method.
Even though the proposed insect-counting method is not yet perfect (due to the huge difference between training and test data), it can reliably be used in the field. In fact, spraying should be started when abrupt change occurs in the number of captured insects. This event can be accurately indicated by the proposed trap and insect-counting method. Consequently, time and cost can be saved and the environment will be better protected.


