Article

Intelligent Non-Contact Sensing for Connected Health Using Software Defined Radio Technology

1
Key Laboratory of High Speed Circuit Design and EMC of Ministry of Education, School of Electronic Engineering, Xidian University, Xi’an 710071, China
2
Department of Electrical and Computer Engineering, COMSATS University Islamabad, Attock 43600, Pakistan
3
Department of Electrical Engineering, HITEC University, Taxila 47080, Pakistan
*
Author to whom correspondence should be addressed.
Electronics 2021, 10(13), 1558; https://doi.org/10.3390/electronics10131558
Submission received: 12 May 2021 / Revised: 13 June 2021 / Accepted: 25 June 2021 / Published: 28 June 2021

Abstract

:
The unpredictable situation from the Coronavirus (COVID-19) globally and the severity of the third wave has resulted in the entire world being quarantined from one another again. Self-quarantine is the only existing solution to stop the spread of the virus when vaccination is under trials. Due to COVID-19, individuals may have difficulties in breathing and may experience cognitive impairment, which results in physical and psychological health issues. Healthcare professionals are doing their best to treat the patients at risk to their health. It is important to develop innovative solutions to provide non-contact and remote assistance to reduce the spread of the virus and to provide better care to patients. In addition, such assistance is important for elderly and those that are already sick in order to provide timely medical assistance and to reduce false alarm/visits to the hospitals. This research aims to provide an innovative solution by remotely monitoring vital signs such as breathing and other connected health during the quarantine. We develop an innovative solution for connected health using software-defined radio (SDR) technology and artificial intelligence (AI). The channel frequency response (CFR) is used to extract the fine-grained wireless channel state information (WCSI) by using the multi-carrier orthogonal frequency division multiplexing (OFDM) technique. The design was validated by simulated channels by analyzing CFR for ideal, additive white gaussian noise (AWGN), fading, and dispersive channels. Finally, various breathing experiments are conducted and the results are illustrated as having classification accuracy of 99.3% for four different breathing patterns using machine learning algorithms. This platform allows medical professionals and caretakers to remotely monitor individuals in a non-contact manner. The developed platform is suitable for both COVID-19 and non-COVID-19 scenarios.

1. Introduction

COVID-19 cases appeared at the end of December 2019 as an outbreak that rapidly spread throughout the whole world and produced the symptoms of cough, fever, and shortness of breath while mostly varying from person to person [1,2]. The severity of the third wave of COVID-19 is greater than the previous two waves, especially in third world countries that are thickly populated such as India, Pakistan, and Bangladesh. The world health organization already declared it a global pandemic on 11 March 2020 [3,4]. It is now a major health concern to the whole world and every country is searching for a solution for the containment of the virus [5]. Although trials of vaccination have started throughout the world, the current viable solution is still self-quarantine. Unfortunately, self-quarantine causes other health issues. Therefore, it is necessary to monitor continuously vital signs such as breathing, temperature, and heartbeat. It has been reported that breathing rate is a commonly ignored vital sign, which may be an indicator of health problems [6]. Recent research in medical science suggest that a person with a breathing rate of more than 20 breaths per minute is possibly sick and a person with a breathing rate of more than 24 breaths per minute is more likely to have serious health problem [6]. Dyspnea is a breathing abnormality in which patient suffers from shortness of breath. It is also one of the common symptoms of COVID-19, which may cause an increase in breathing rate and heart rate. The mostly hospitalized patient who suffers from COVID-19 had dyspnea [7,8]. It can be used for early diagnosis of COVID-19 and medical care services can provide timely treatment. As COVID-19 is a spreading disease, its observation requires a non-contact regular monitoring breathing sensing technology. Advances in wireless sensing technologies using radio frequency (RF) signals have the ability for reducing the load from the hospital and provides connected health services to an individual in his own home [9]. The deployment of wireless sensing technology for connected health monitoring is a viable and feasible solution to stop the spread of COVID-19. Various non-contact wireless sensing-based systems have been proposed for human activity monitoring and recognition [10,11,12,13,14]. The basic principle for detecting human body movements by exploiting a wireless sensing-based technology is that the human body is mostly made of water, which can reflect wireless signals. Therefore, human motion introduces variation in the received signal by a nearby wireless communication device. As a result, a unique pattern at the receiving end helps in recognizing the different type of motions for identifying human activity and the early diagnosis of vital signs such as breathing and heart rate compared to traditional human activities and health monitoring systems. RF signal-based systems have the following benefits. First, RF signal-based solutions are contactless and human movements can be identified exclusively through the received wireless signal reflected from the human body. Therefore, users do not need to attach or wear sensors on their body, which are inconvenient in many situations (e.g., for children and eldercare) and impossible in pandemic situations (e.g., for COVID-19). Second, RF signal-based solutions have an increased coverage area than camera technology. RF signals can pass through walls, windows, doors, and furniture, while camera technology has restricted viewing angles and require good lighting surroundings. Drawbacks of camera-based technology also include certain privacy issues because cameras also capture other sensitive information in private places such as a bathroom and changing room [15,16,17]. The ultra-wideband (UWB) based technology exploited RF signals and occupy a larger bandwidth. The larger bandwidth provides better time resolution and this technology is considered a favorable technology for indoor tracking and localization [18]. However, UWB technology occupies wideband and may enforce interference with other operating devices that operate at the same frequency.
Existing RF signals-based systems are used to monitor health by exploiting WCSI data. However, these systems require raw data to further process useful information regarding human health. The state-of-the-art machine and deep learning schemes are used to extract statistical features of WCSI patterns related to specific human body motion for specific health issues instead of developing models to rectify WCSI patterns [19]. The research study on wireless sensing technologies has shown potential and promise in improving the quality of life of human beings and the operational productivity of industry; however, there are still technical challenges to be resolved and innovative improvements need to be made to increase the use of the limited radio spectrum. Currently, the exploitation of Wi-Fi signals for non-contact sensing has shown great promise in improving connected healthcare services. The major benefit of the Wi-Fi sensing approach is that they can be installed in line-of-sight (LOS) environments as well as non-line-of-sight (NLOS) environments. Wi-Fi sensing reuses the infrastructure that is used for wireless communication and is easily accessible anywhere and so it is easy to deploy and is a low-cost solution [20]. Wi-Fi sensing techniques overcome traditional technological drawbacks [21]. However, secure, reliable, flexible, portable, and multifunctional non-contact sensing remains a challenge. The summary of drawbacks of the existing technologies used for connected health applications is provided in Table 1. SDR technology has the potential to monitor human health and early diagnosis of vital signs in a non-contact manner [22]. SDR technology is portable, flexible, has multifunctional capabilities, and it is cost-effective due to software-based modification without changing the hardware [23]. This research exploits SDR technology flexibility and portability with state-of-art machine learning algorithms. This research investigates and evaluates various challenges in the development of non-contact sensing platforms for connected health, especially with respect to the containment of COVID-19.
This research aimed to develop a non-contact intelligent sensing SDR platform for connected health applications. The developed platform monitors health by preserving individual privacy, providing comfort to patients, and the containment of deadly viruses. The developed platform is low-cost and can be accessed anywhere at any time. It is intelligent, reliable, portable, flexible, and multifunctional in resolving the challenges observed in the healthcare sector. The following are the contributions of this research:
This research highlights the design issues in extracting the correct CFR by simulating the wireless channel characteristics and evaluates the effect on the CFR.
This research provides a solution to counter the time and frequency offset by introducing the Van-De-Beek algorithm and channel noise reduction by using the wavelet filter and moving the average filter to extract the WCSI of human body movement.
The developed platform faithfully captures human breathing minute movement and intelligently classifies normal, slow, fast, and deep breaths using three machine learning algorithms.
The rest of the paper is presented as follows: In Section 2, related work on non-contact sensing is presented. In Section 3, material and methods are presented in developing the SDR technology-based platform for intelligent sensing of connected health applications. In Section 4, simulated, experimental, and classification results are presented. In Section 5, the significance of the achieved results is discussed. In Section 6, the conclusion of the design of the developed platform, the results achieved, the limitations of the platform, and future recommendations are presented.

2. Related Work

Over the past decade, the exploitation of RF signals for non-contact sensing of human body movements has shown great potential within the field of connected healthcare applications. Machine and deep learning algorithms are extensively used in the literature for the intelligent classification of health problems. The Wi-Fi signal-based health monitoring system used a network interface card (NIC) and a desktop PC along with Omni directional antennas for various health monitoring and diagnosis of vital signs such as breathing, heart rate, sleep disorder, fall, dementia, asthma attacks, freezing of gait, [24,25,26,27,28,29,30,31,32,33] etc. Although Wi-Fi-based sensing is a promising solution, there are still the concerns of flexibility and portability. In Reference [34], the flexible and portable SDR technology is exploited for activity recognition and classification (ARC) of human activities and explores a new research area in the field of connected healthcare. The proposed system used OFDM technology to extract fine-grained WCSI for sensing the wireless channel. In Reference [35] WCSI is used to analyze human hand movements by capturing both the magnitude and phase response. The SDR technology-based platform faithfully captured slow and fast waving human hand movements. The post-surgery of spinal cord patient for the classification of wrong and correct body posture was presented in [36]. The system used SDR-based technology for the collection of data and was successfully classified by using machine learning algorithms. The deep learning-based convolutional neural network (CNN) model and SDR technology were used to classify ankle movements after surgery. The WCSI based image data accurately detected the movement of the ankle of patients that had fractured ankle surgery [37]. A device-free system using SDR technology recognizes different human activities by exploiting WCSI in an indoor environment. Human body movements were detected in a quasi-real-time setting using SDR technology [38]. Patterns of WCSI presented unique variations caused by body movements to identify large-scale and small-scale movements. SDR technology-based system exploited radio wave signals to captured human body motion patterns [39]. The SDR based technology is widely used for connected health applications to efficiently detect large-scale body movements related to health abnormalities. The small-scall body movements related to health abnormalities such as breathing and heart rate remain a challenge in terms of designing an optimal SDR platform [40].

3. Materials and Methods

The material and methods used to develop a non-contact sensing platform for connected health using SDR technology and AI include the design of the SDR platform, data collection approach, data preprocessing techniques, feature extraction and selection, and classification algorithms.

3.1. Design for SDR Platform

The design for developing the SDR platform includes algorithm development using Simulink software on a host PC and hardware configuration using universal software-defined radio peripheral (USRP). The platform consists of two USRP devices equipped with one Omni-directional antenna and two host PCs. The software designs of the transmitter and receiver in Simulink, processing of transmitter and receiver USRP devices, and wireless channel for analyzing the human breathing are shown in Figure 1.

3.1.1. Transmitter Software Design

In transmitter software design, the OFDM technique-based signal is generated to capture the fine-grained WCSI. Initially, the random bits x(n) are generated at successive sample times and possess one channel per column. Signal columns may be buffered into frames by specifying the number of samples per frame as more than 1. This input signal is modulated using the quaternary phase-shift keying (QPSK) technique presented in Equation (1):
T ( k ) = x I ( n ) + j x Q ( n )
where signal x I ( n ) and j x Q ( n ) are in-phase and quadrature components. Furthermore, the modulated signals are converted into smaller parallel streams of subcarriers. The nulls and DC subcarriers are added to concatenate the signals of the same data type in order to create a continuous output signal. The subcarrier k = 0 is not used since its magnitude and phase would be influenced by the carrier frequency F C and subcarrier nulls are used for canceling inter-carrier interference (ICI) without the need for guard bands or expensive band-pass filters. Computing the inverse fast Fourier transform (IFFT) of the contiguous signal for transforming complex frequency domain signals into the time domain signal involves orthogonality between the subcarriers. The total number of subcarriers used is N-FFT points, including the DC and null subcarriers, and T ( k ) contains the QPSK modulated complex data. The complex data signal is transformed into the time domain by using Equation (2):
t ( n ) = 1 N k = 0 N 1 T ( k ) e j 2 π k N n
where n = 0 , 1 , 2 . . , N 1 , the cyclic prefix (CP) in the time domain is inserted at the start of the frame by replicating the last one-fourth samples, rendering the frame N + L . The CP addition in the OFDM frame is used for avoiding inter-symbol interference (ISI). The complete OFDM frame, including the CP, can be written mathematically as provided in Equation (3).
s ( n ) = t N + L ( n )
The flexible gain is added to enhance the transmitted signal strength. The software-defined flexible USRP hardware configuration is also a function of the transmitter PC. This function is used to control RF processing, such as operating carrier frequency, master clock, interpolation, system gain, etc.

3.1.2. Transmitter Hardware Functionality

The function of the transmitter USRP device is to interpolate the incoming signal s(n) from the transmitter host PC via universal serial bus (USB) cable by using digital up-conversion (DUC). The transformation of the digital signal to an analog signal is performed by using digital to analog conversion (DAC). The filtering is applied by using low-pass filtering (LPF), a mixer is used for operating at the desired carrier frequency, and transmit amplification (TA) is used for controlling the gain of the system. Finally, the signal is sent over to a wireless channel by using a Tx port through the transmitting antenna.

3.1.3. Wireless Channel

The wireless channel is modelled for the simulated and real-time wireless channel. The simulated channel includes ideal, AWGN, fading, and time-frequency dispersive channels to analyze the wireless channel characteristics and their effects on CFR. Wireless channel has rich information regarding the characteristics of the channel noise, Doppler shift, multipath fading, reflection, and diffraction as shown in Figure 2. Therefore, human body reflection information may be used for human health monitoring.

3.1.4. Receiver Hardware Functionality

The function of the receiver USRP device is to receive r ( n ) from the antenna. The Rx port amplifies the signal with the low noise amplification (LNA). It then multiplies the signal with an operating frequency by using a mixer, then it passes through LPF which converts the baseband frequency. It then converts the signal into the digital signal by ADC and decimates the signal for the software processing in the receiver PC by using the digital down converter (DDC).

3.1.5. Receiver Software Design

In the receiver software design, the wireless channel impairments and their effect on CFR are firstly analyzed by simulations for design problems. Simulation results help in removing the time and frequency offset. We introduced the Van-De-Beek algorithm in the receiver design to reduce time-delays and transmitter-receiver oscillator mismatch. This helps in the synchronization of OFDM frames and the correct removal of CP. In analyzing the channel impairment effects on CFR for designing a receiver, we considered the ideal, AWGN, fading, and dispersive channels. In the ideal channel, the transmitted OFDM frame, s ( n ) , is received exactly at the receiver without any channel impairment at the simulated channel, i.e.,   s ( n ) r ( n ) . The received signal r I ( n ) is provided in Equation (4) as the following.
r I ( n ) = s ( n )
The CFR for ideal channel C I ( k )   is directly measured by taking the Fourier transform of r I ( n ) as shown in Equation (5).
C I ( k ) = n = 0 N 1 r I ( n ) e j 2 π k N n
In the AWGN channel, the additive noise N ( n ) is added at the simulated channel to the transmitted OFDM frame s ( n ) . The received signal r A ( n ) is provided in Equation (6) as the following.
r A ( n ) = s ( n ) + N ( n )
The CFR for the AWGN channel C A ( k )   is directly measured by taking Fourier transform of r A ( n ) as shown in Equation (7).
C A ( k ) = n = 0 N 1 r A ( n ) e j 2 π k N n
In the fading channel, the Doppler shift Δ f is added at the simulated channel to the transmitted OFDM frame s ( n ) . The received signal r F ( n ) is provided in Equation (8).
r F ( n ) = s ( n ) e j 2 π ( f + Δ f ) / N
The CFR for the fading channel C F ( k ) in the presence of the Doppler shift is directly measured by taking the Fourier transform of r F ( n ) , as shown in Equation (9).
C F ( k ) = n = 0 N 1 r F ( n ) e j 2 π k N n
In the dispersive channel, the time and frequency offset are added at the simulated to the transmitted OFDM frame s ( n ) . The received signal r D ( n ) is provided in Equation (10).
r D ( n ) =   s ( n t O S ) e j 2 π f O S n / N
The CFR for dispersive channel C D ( k ) is directly measured by taking the Fourier transform of r D ( n ) , as shown in Equation (11).
C D ( k ) = n = 0 N 1 r D ( n ) e j 2 π k N n
In all the simulated channels, frame synchronization is not applied to analyze the CFR and CP is directly removed. While in the real-time software design of the receiver, CP is removed after the synchronization. The software-defined flexible USRP hardware configuration block is used to modify and control hardware parameters, such as carrier operating frequency, system gain, decimation, master clock rate, etc. The received signal, r ( n ) , possesses the WCSI which includes channel noise, reflection from human body motion, and carrier frequency and time offset, etc. The offset in carrier frequency between the transmitter and receiver oscillator mismatch destroys the orthogonality among the subcarriers and introduces ICI. Therefore, compensation and estimation of carrier frequency offset (CFO) are required at the receiver. The CFO compensation can be performed either in the time domain before the FFT or by directly adjusting the carrier frequency oscillator. Mathematically, the CFO is used as a multiplication of each s ( n ) sample by e j 2 π ε n N , where ε is the normalized CFO and N is the number of subcarriers. The received samples can now be modelled as shown in Equation (12):
r ( n ) = c ( n ) s ( n θ ) e j 2 π ε n N + N ( n )
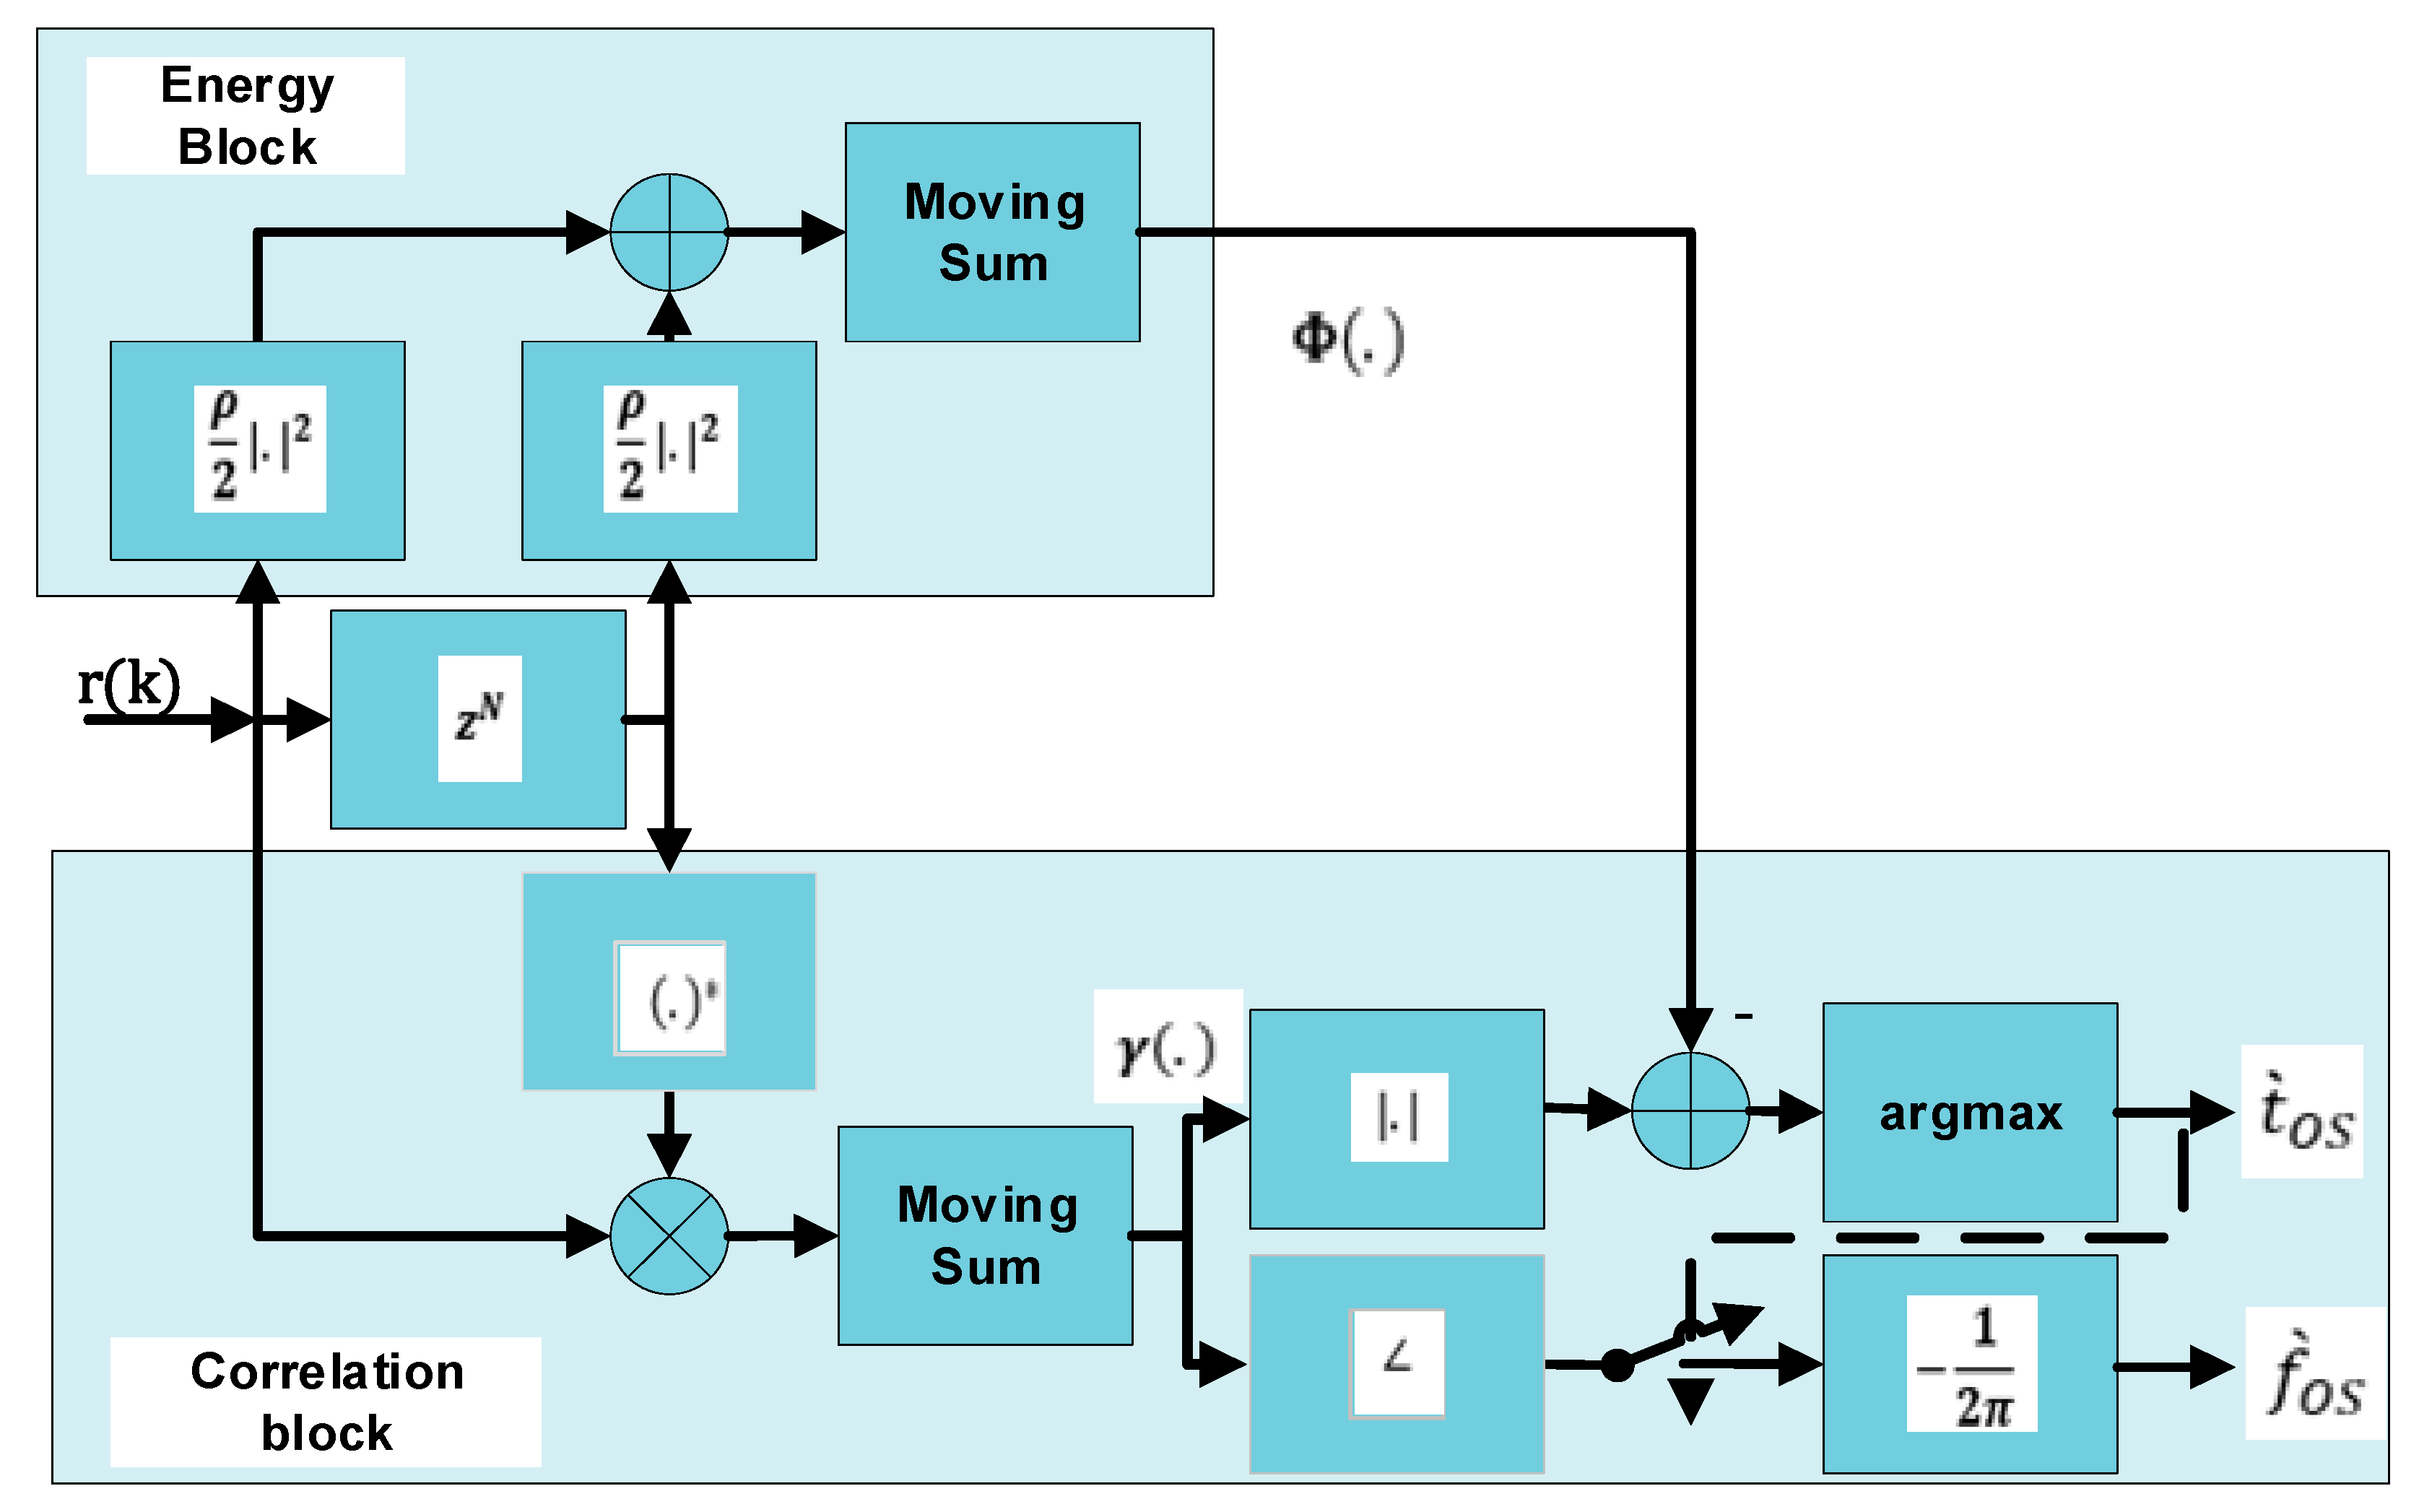
where c ( n ) is the channel response, θ is the unknown timing offset, ε is an unknown frequency offset, and N ( n ) is additive noise. Van de Beek algorithm is used to estimate and compensate the time-frequency offset [24]. This algorithm is also used for frame synchronization to eliminate the CP correctly. Figure 3 shows the workings of the algorithm. This algorithm finds estimates of time offset t ` O S and frequency offset f ` O S by using Equations (13) and (14), respectively:
t ` O S = arg   max {   | γ ( t O S | ρ Φ ( t O S ) }
f ` O S = 1 2 π γ ( t ` O S )
where γ ( t O S ) provided in Equation (13) is used to estimates time offset t ` O S and frequency offset f ` O S . The magnitude of γ ( t O S ) is compensated by energy term Φ ( t O S ) and peaks at time instant which provides t ` O S , while its phase at this time instant is proportional to f ` O S . The γ ( t O S ) is the correlation between two pairs of L samples of OFDM frame that are N samples apart. Φ ( t O S ) is the energy part and ρ is the magnitude of the correlation coefficient provided in Equations (15)–(17), respectively.
γ ( m ) = n = m m + L 1 r ( n ) r ( n + N )
Φ ( m ) = 1 2 n = m m + L 1 | r ( n ) | 2 + | r ( n + N ) | 2
ρ = | E { r ( k ) r ( k + N ) } | E { | r ( k ) | } 2   E { | r ( k + N ) | } 2  
The time and frequency offset are removed along with CP from each OFDM frame. Each OFDM frame will have N-points after CP removal. The FFT is then used to convert the time domain OFDM samples to the frequency domain OFDM samples. The expression for transforming time domain data into frequency domain data to measure CFR is provided in Equation (18).
R ( k ) = n = 0 N 1 r N ( n ) e j 2 π k N n
Since R ( k ) is the complex CFR value, it can be converted into magnitude and phase response provided in Equations (19) and (20), respectively.
| R ( k ) | = R R e 2 + R I m 2
The R R e and R I m are the real and imaginary parts of the CFR.
R ( k ) = t a n 1 ( R I m R R e )
The magnitude and phase response of the multiple OFDM frames is expressed in the Equations (21) and (22).
| R ( k ) | k , F = [ | R ( e j ω ) | 1 , 1 | R ( e j ω ) | 1 , 2 | R ( e j ω ) | 1 , F | R ( e j ω ) | 2 , 1 | R ( e j ω ) | 2 , 2 | R ( e j ω ) | 2 , F | R ( e j ω ) | k , 1 | R ( e j ω ) | K , 2 | R ( e j ω ) | k , F ]
k is used for the total number of subcarriers and F is used for the total number of OFDM frames received.
R ( e j ω ) k . F = [ R ( e j ω ) 11 R ( e j ω ) 1 , 2 R ( e j ω ) 1 , F R ( e j ω ) 21 R ( e j ω ) 2 , 2 R ( e j ω ) 2 , F R ( e j ω ) k , 1 R ( e j ω ) k , 2 R ( e j ω ) k , F ]
The CFR presented in the magnitude and phase in Equations (21) and (22) is used for data preprocessing and classification.

3.2. Data Collection and Preprocessing

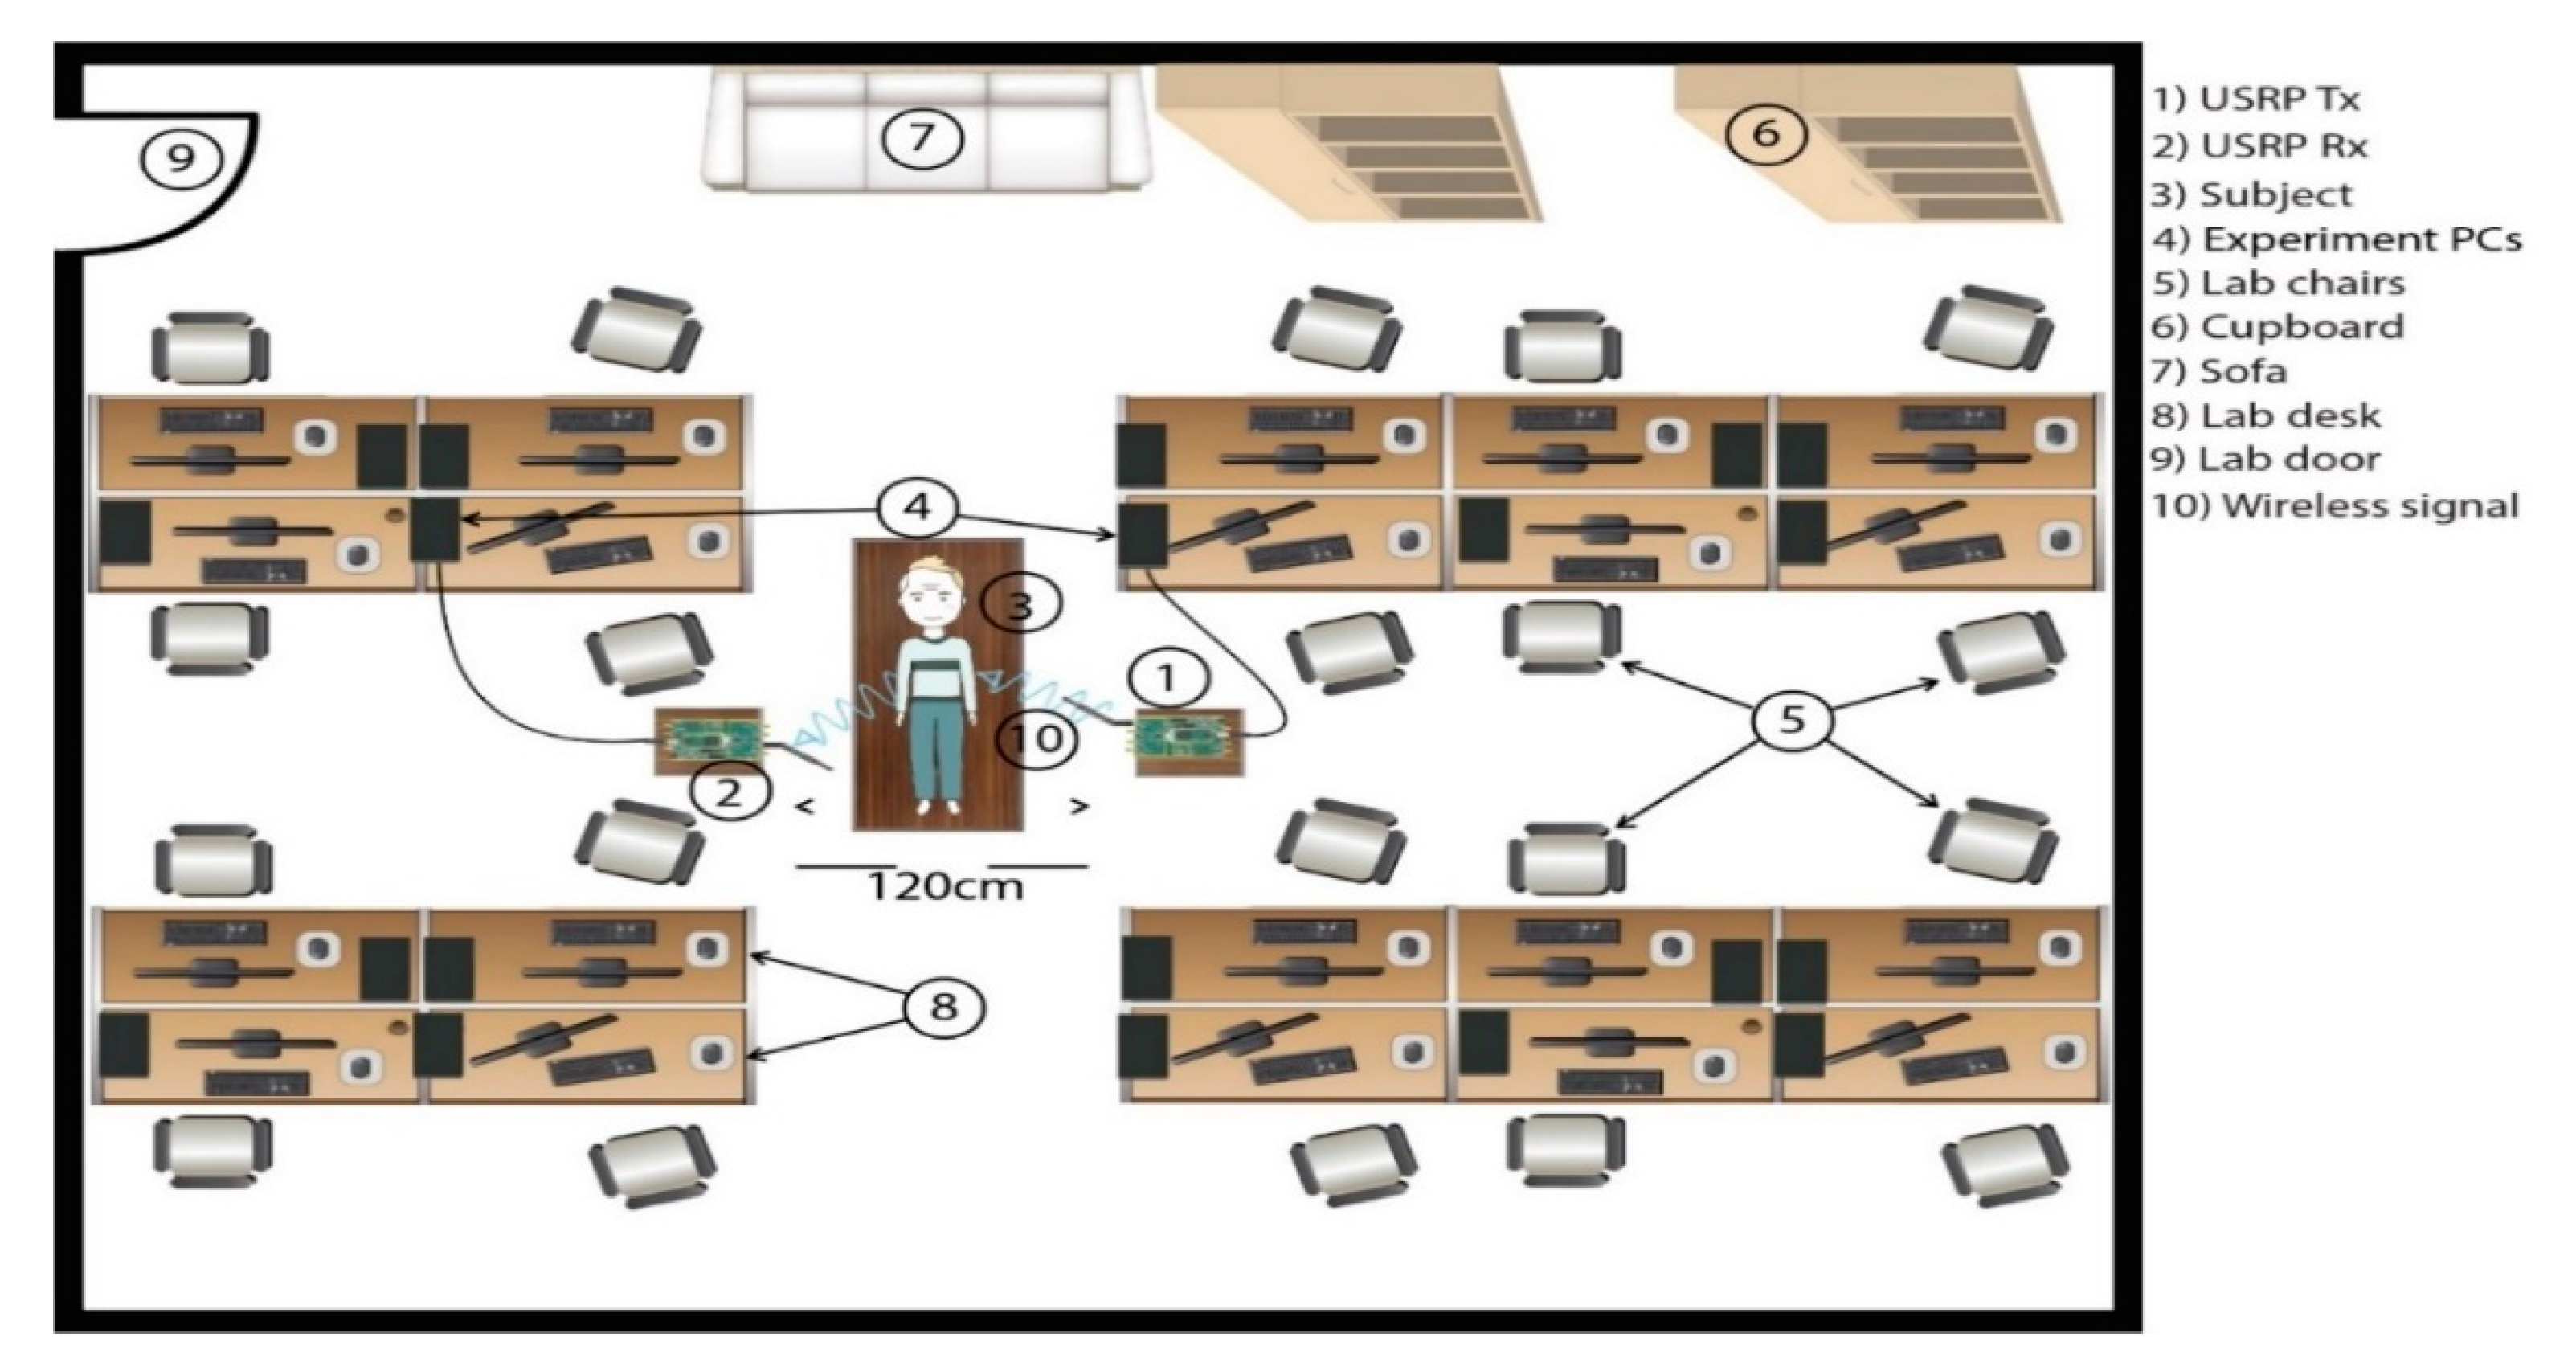
The data is collected in a real-time lab environment as shown in Figure 4. The experimental setup used two desktop PC and two USRP devices equipped with two Omni-directional antennas. The distance between the two antennas is 120 cm. The breathing experiments are conducted in a quiet environment without any humans in the lab except the person performing the experiments. The developed platform is very sensitive to human movements so it was necessary to conduct experiments in a quiet environment. The desktop PC used on the transmitter side is a Lenovo Intel(R) Core (TM) i5-7400 3.00 GHz processor, 8 GB RAM with the Windows 10 64-bit operating system. The desktop PC on the receiver side is a Lenovo Intel(R) Core (TM) i5-7500 3.40 GHz processor, 16 GB RAM with Windows 10 64-bit operating system. Two B210 USRP devices are used and their hardware configuration parameters are provided in Table 2. Five healthy subjects are selected and trained by using video demonstration for performing the experiments. The details of the subjects for performing the experiments are provided in Table 3. The breath patterns used to conduct experiments are normal breath (Eupnoea), slow breath (Bradypnea), fast breath (Tachypnea), and deep breath (Kussmaul). Normal breath experiments are conducted when the subject breathes at a normal rate. The “normal” rate depends on age but a typical adult takes between 12 and 20 breathe per minute when resting. Slow breath experiments are conducted when the subject breathes slower than what is considered normal. This means that the body is not getting sufficient oxygen. The slow breath may be a symptom of a condition that affects metabolism or another problem, such as carbon monoxide poisoning, drug overdose, or sleep apnea. Fast breath experiment is the opposite of slow breathing. In this case, the subject breathes faster than normal. It can be a symptom of lung illness that limits the intake of air. Deep breath experiments are conducted when humans breathe deep and fast. This type of breathing occurs in humans having problems related to diabetes. Due to diabetes, the body does not use appropriate sugar for energy, instead, it burns stored fat in place of energy. This causes a rise in the acid level in the blood, which causes the human body to get rid of extra carbon dioxide by breathing deep and fast [42].
The CFR of breathing data is in the raw form and this requires data preprocessing in order to obtain accurate, significant, and efficient data. Firstly, the wavelet filter is used for de-noising. This filter not only removes outliers from data but also preserves the sharp transitions present in the data. Especially, when we applied the “soft heuristic SURE” thresholding with scaling down of noise. The coefficient obtains from the decomposition of raw data by selecting the subcarriers level 4 by the “sym5” wavelet. Finally, a moving average filter is applied for smoothing the data and to eliminate the high-frequency component noise which is not generated by the breathing movement.

3.3. Features Extraction

The features extraction and selection methods are useful for the transformation of data, which translates the preprocess data into significant trends to process data. Features extraction is an important approach for the reduction in data size and provides useful information in developing a classification model. Most researchers used the statistical characteristics approaches for features extraction. In this research, features extraction reduced 3.5 k dimensions to 18 statistical time and frequency domain features for developing the classification model. The list of statistical features used in developing the classification model are provided in Table 4. The features extractions are as follows: The maximum and minimum data values are used to extract the trend from the data; the mean value is used to extract the stable component from the data; the standard deviation extracts the degree of dispersion between the data sampling points; the variance extracts variations from the mean; the root mean square (RMS) extracts the magnitude of the data; the peak-to-peak value extracts amplitude range; the kurtosis extracts the tailedness in the data; the skewness extracts symmetry present in the data; the peak factor extracts whether there are any significant impacts in the data or not; the interquartile range extracts statistical dispersion and it is equal to the difference between 75th and 25th percentiles; waveform factor extracts the ratio between RMS values to the average values in data; FFT extracts the frequency component with the maximum and minimum components present in the data; spectral probability, signal energy, and spectrum entropy extracts data for frequency domain analysis.

3.4. Classification

Machine learning algorithms are used to develop classification models for predicting abnormalities based on breathing data in the presence of uncertainty. These adaptive algorithms classify normal and abnormal patterns from the trends present in the different breathing patterns. When a learning machine is trained with more experimental data, the processing on large data set improves its identification performance. All the features extracted from CFR data is converted into the heterogeneous matrix. Breathing CFR data is interpreted as a column vector where each row is labelled with the corresponding breathing pattern. The cross-validation (CV) technique is used for the assessment of a model by evaluating the performance of the machine learning algorithm on new data by giving predictions that were not trained before. In this technique, the training of algorithms is performed by splitting the known dataset into subset size to train and test the data. CV takes in random splits of the original dataset in each repetition into the training group and the testing group. The supervised learning techniques are then used to train and test datasets for evaluating the performance. This step is repeated several times and the performance is evaluated as the average error. When training on developing a model, CV plays a vital role to avoid underfitting and overfitting. However, partitioning the dataset to capitalize both the learning and rationality of test results is challenging. This is the stage where CV plays its role in practice. CV offers several approaches that partition the dataset in a different fashion for finding the optimal algorithm to develop a model. In this research, K-fold CV is used for splitting the dataset randomly into an equal size dataset by selecting 5-folds. One-fold is used for testing to validate a trained model using the leftover folds. This step reiterated five times in a manner such that each fold is used once for successful validation. The average error occurs across the number of partitions and results in the average error occurring in 5-folds. This is one of the most popular techniques used for CV and it has better performance but requires increased execution time because the training of the model requires repetitions. The information about the conducted experiments is provided in Table 5. The accuracy of a model is used as a diagnostic measure to reflect the validated model results. The performance of the classifier is analyzed by accuracy in percentage, prediction speed in observations/s, and training in seconds.

4. Results

The results are presented based on simulations and experiments for analyzing the effects on CFR due to various channel effects and human body movement during breathing. The classification results are presented to analyze the accuracy of the developed system for the detection of abnormal breathing.

4.1. Simulations Results

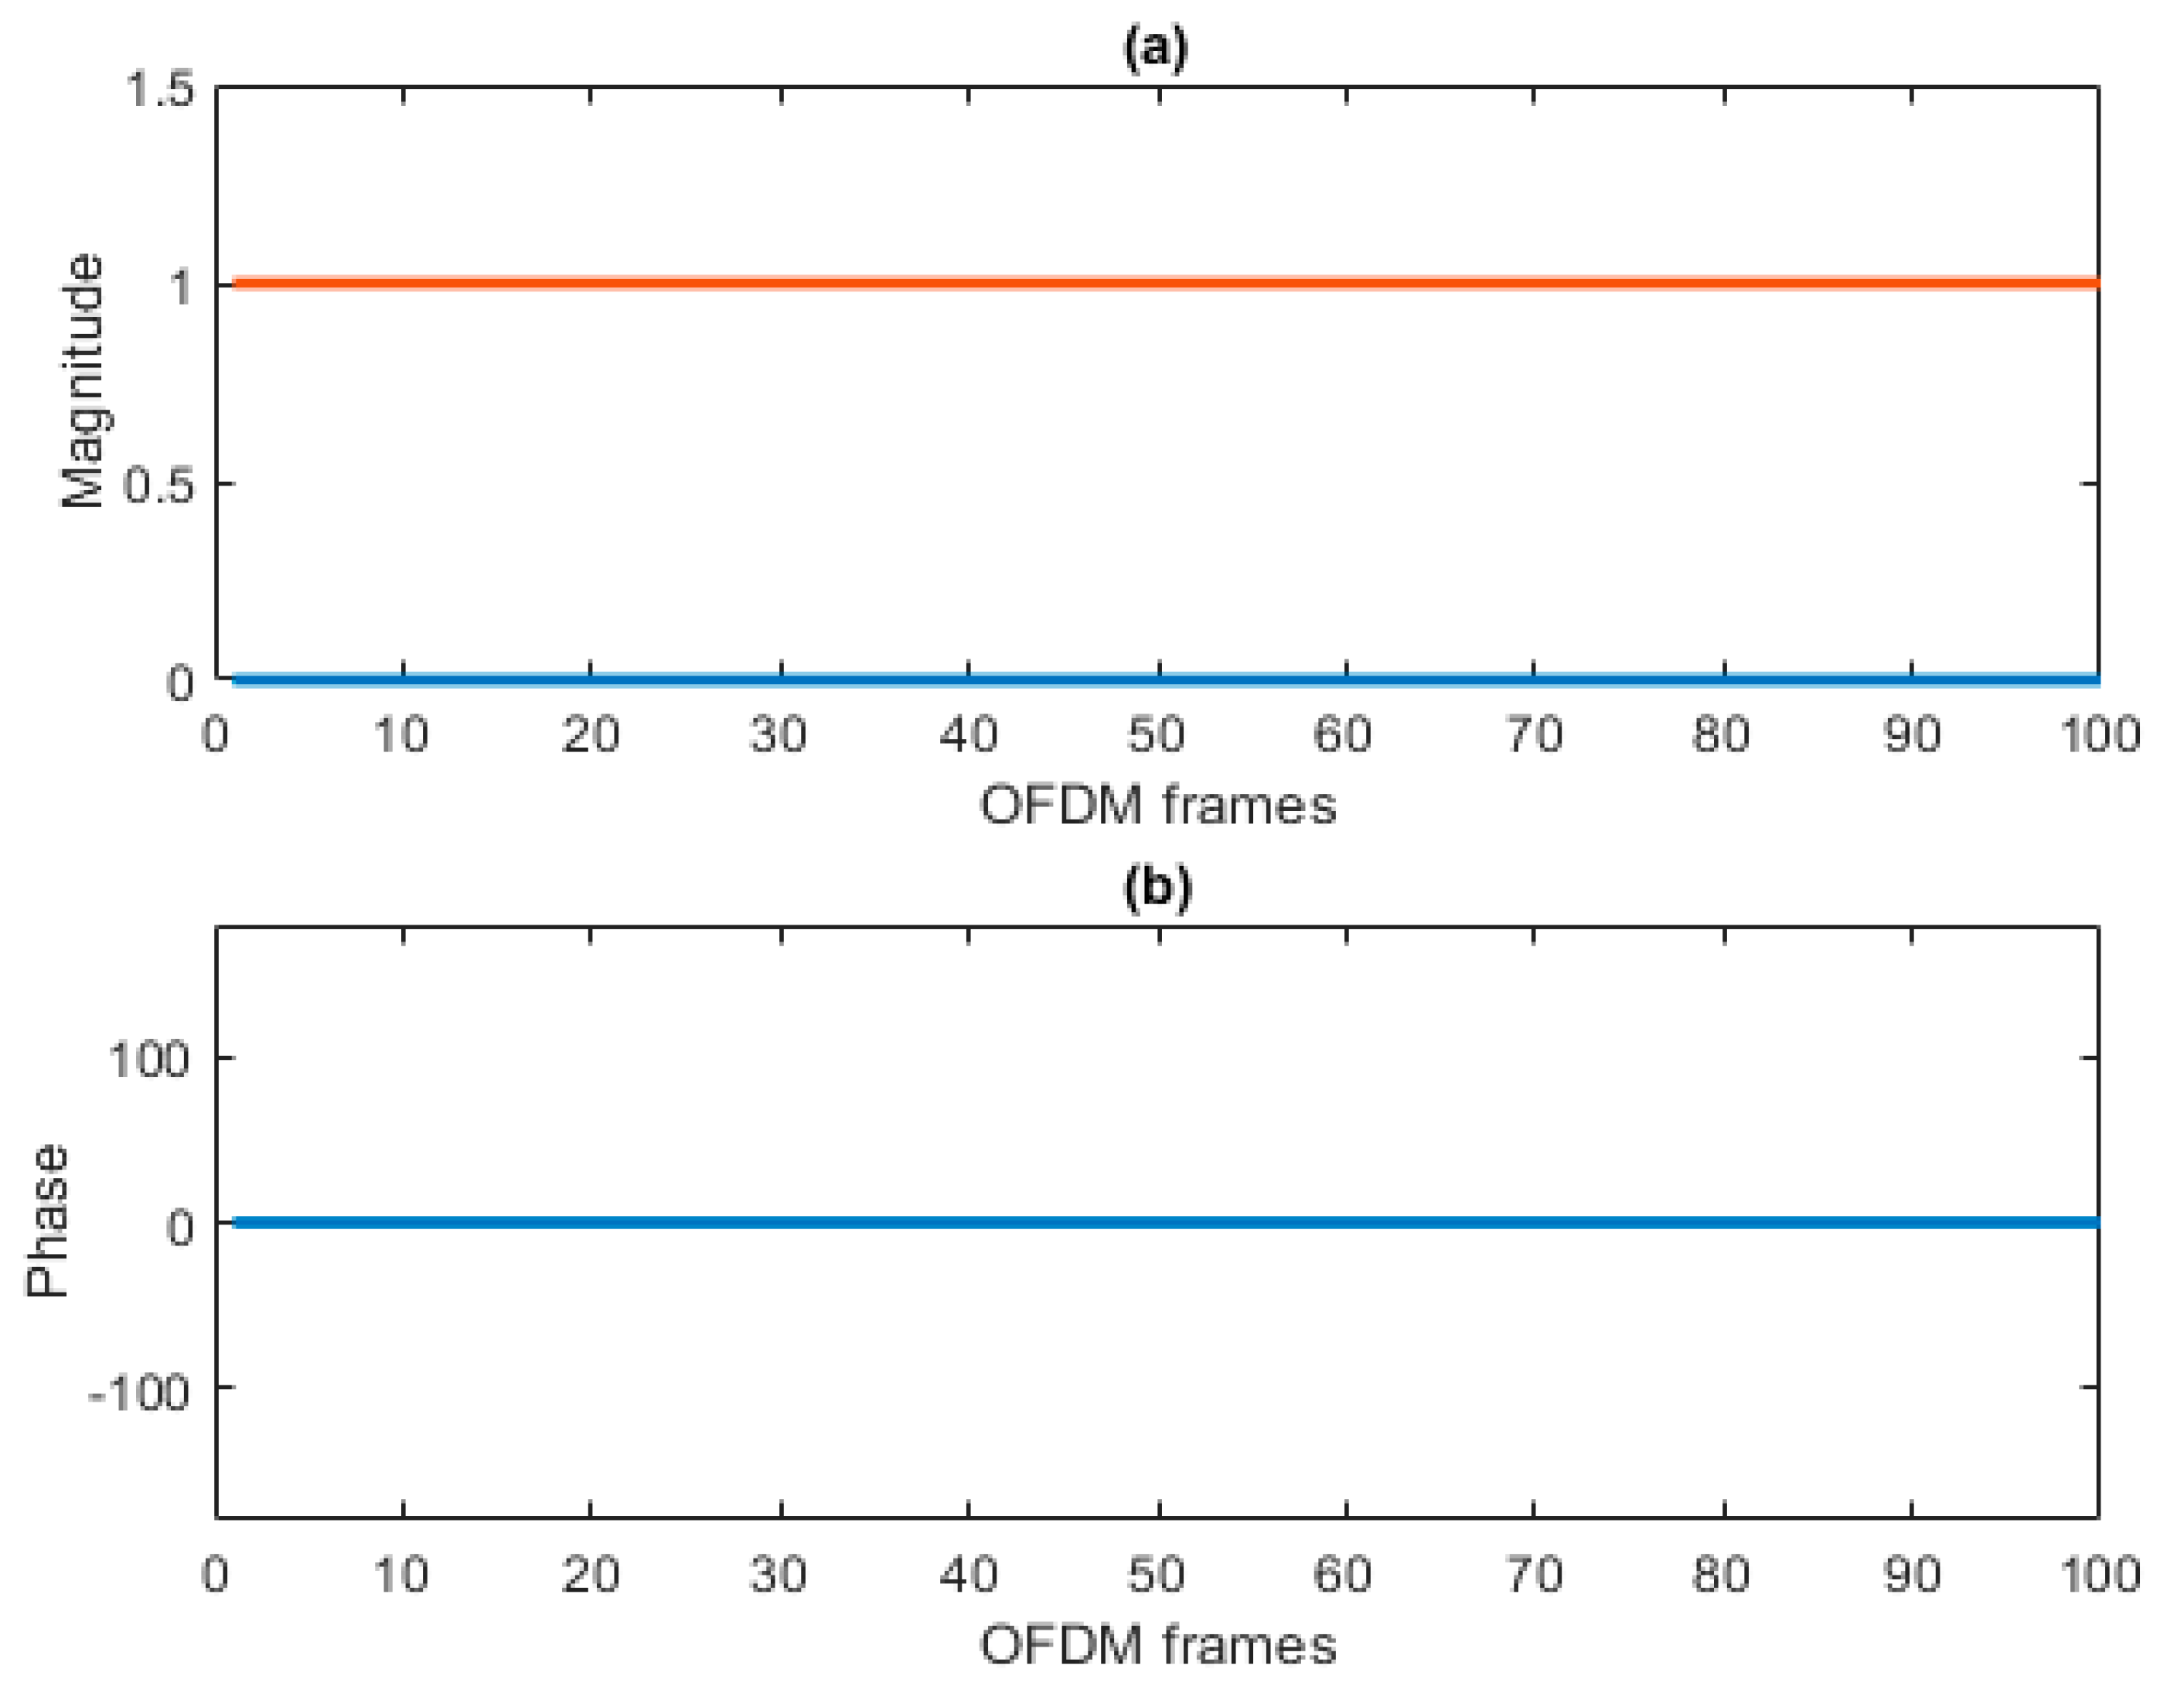
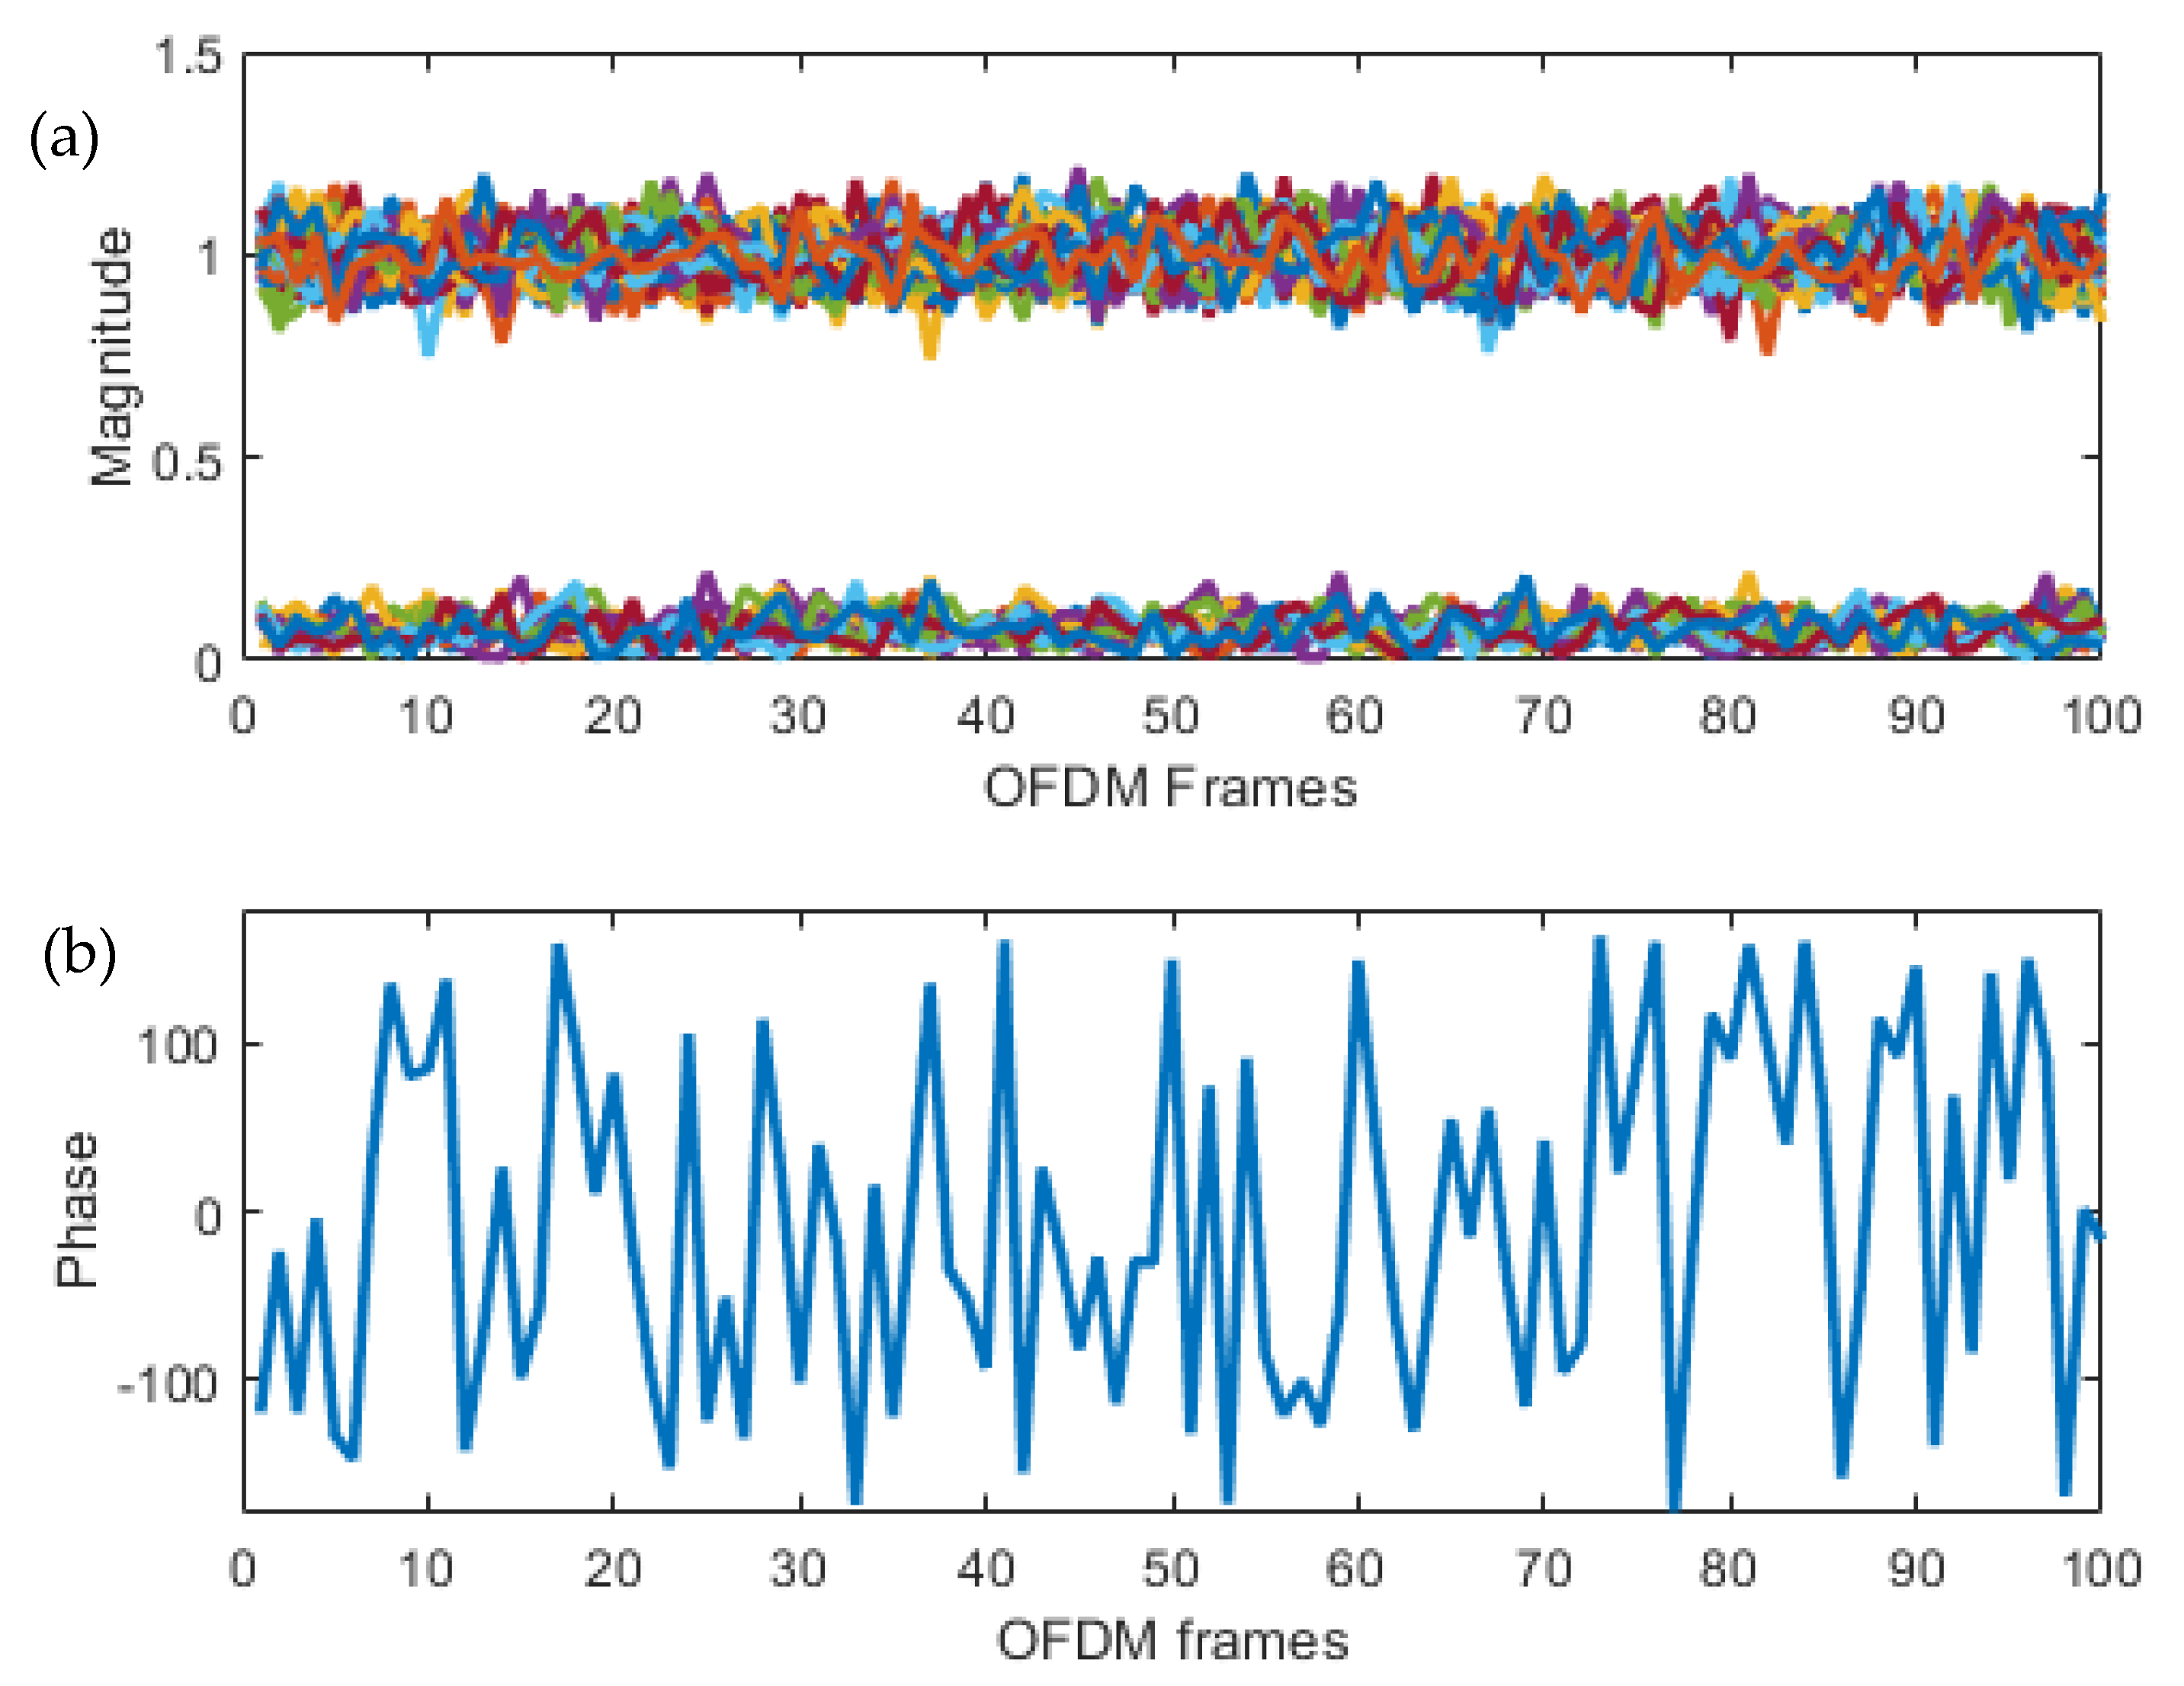
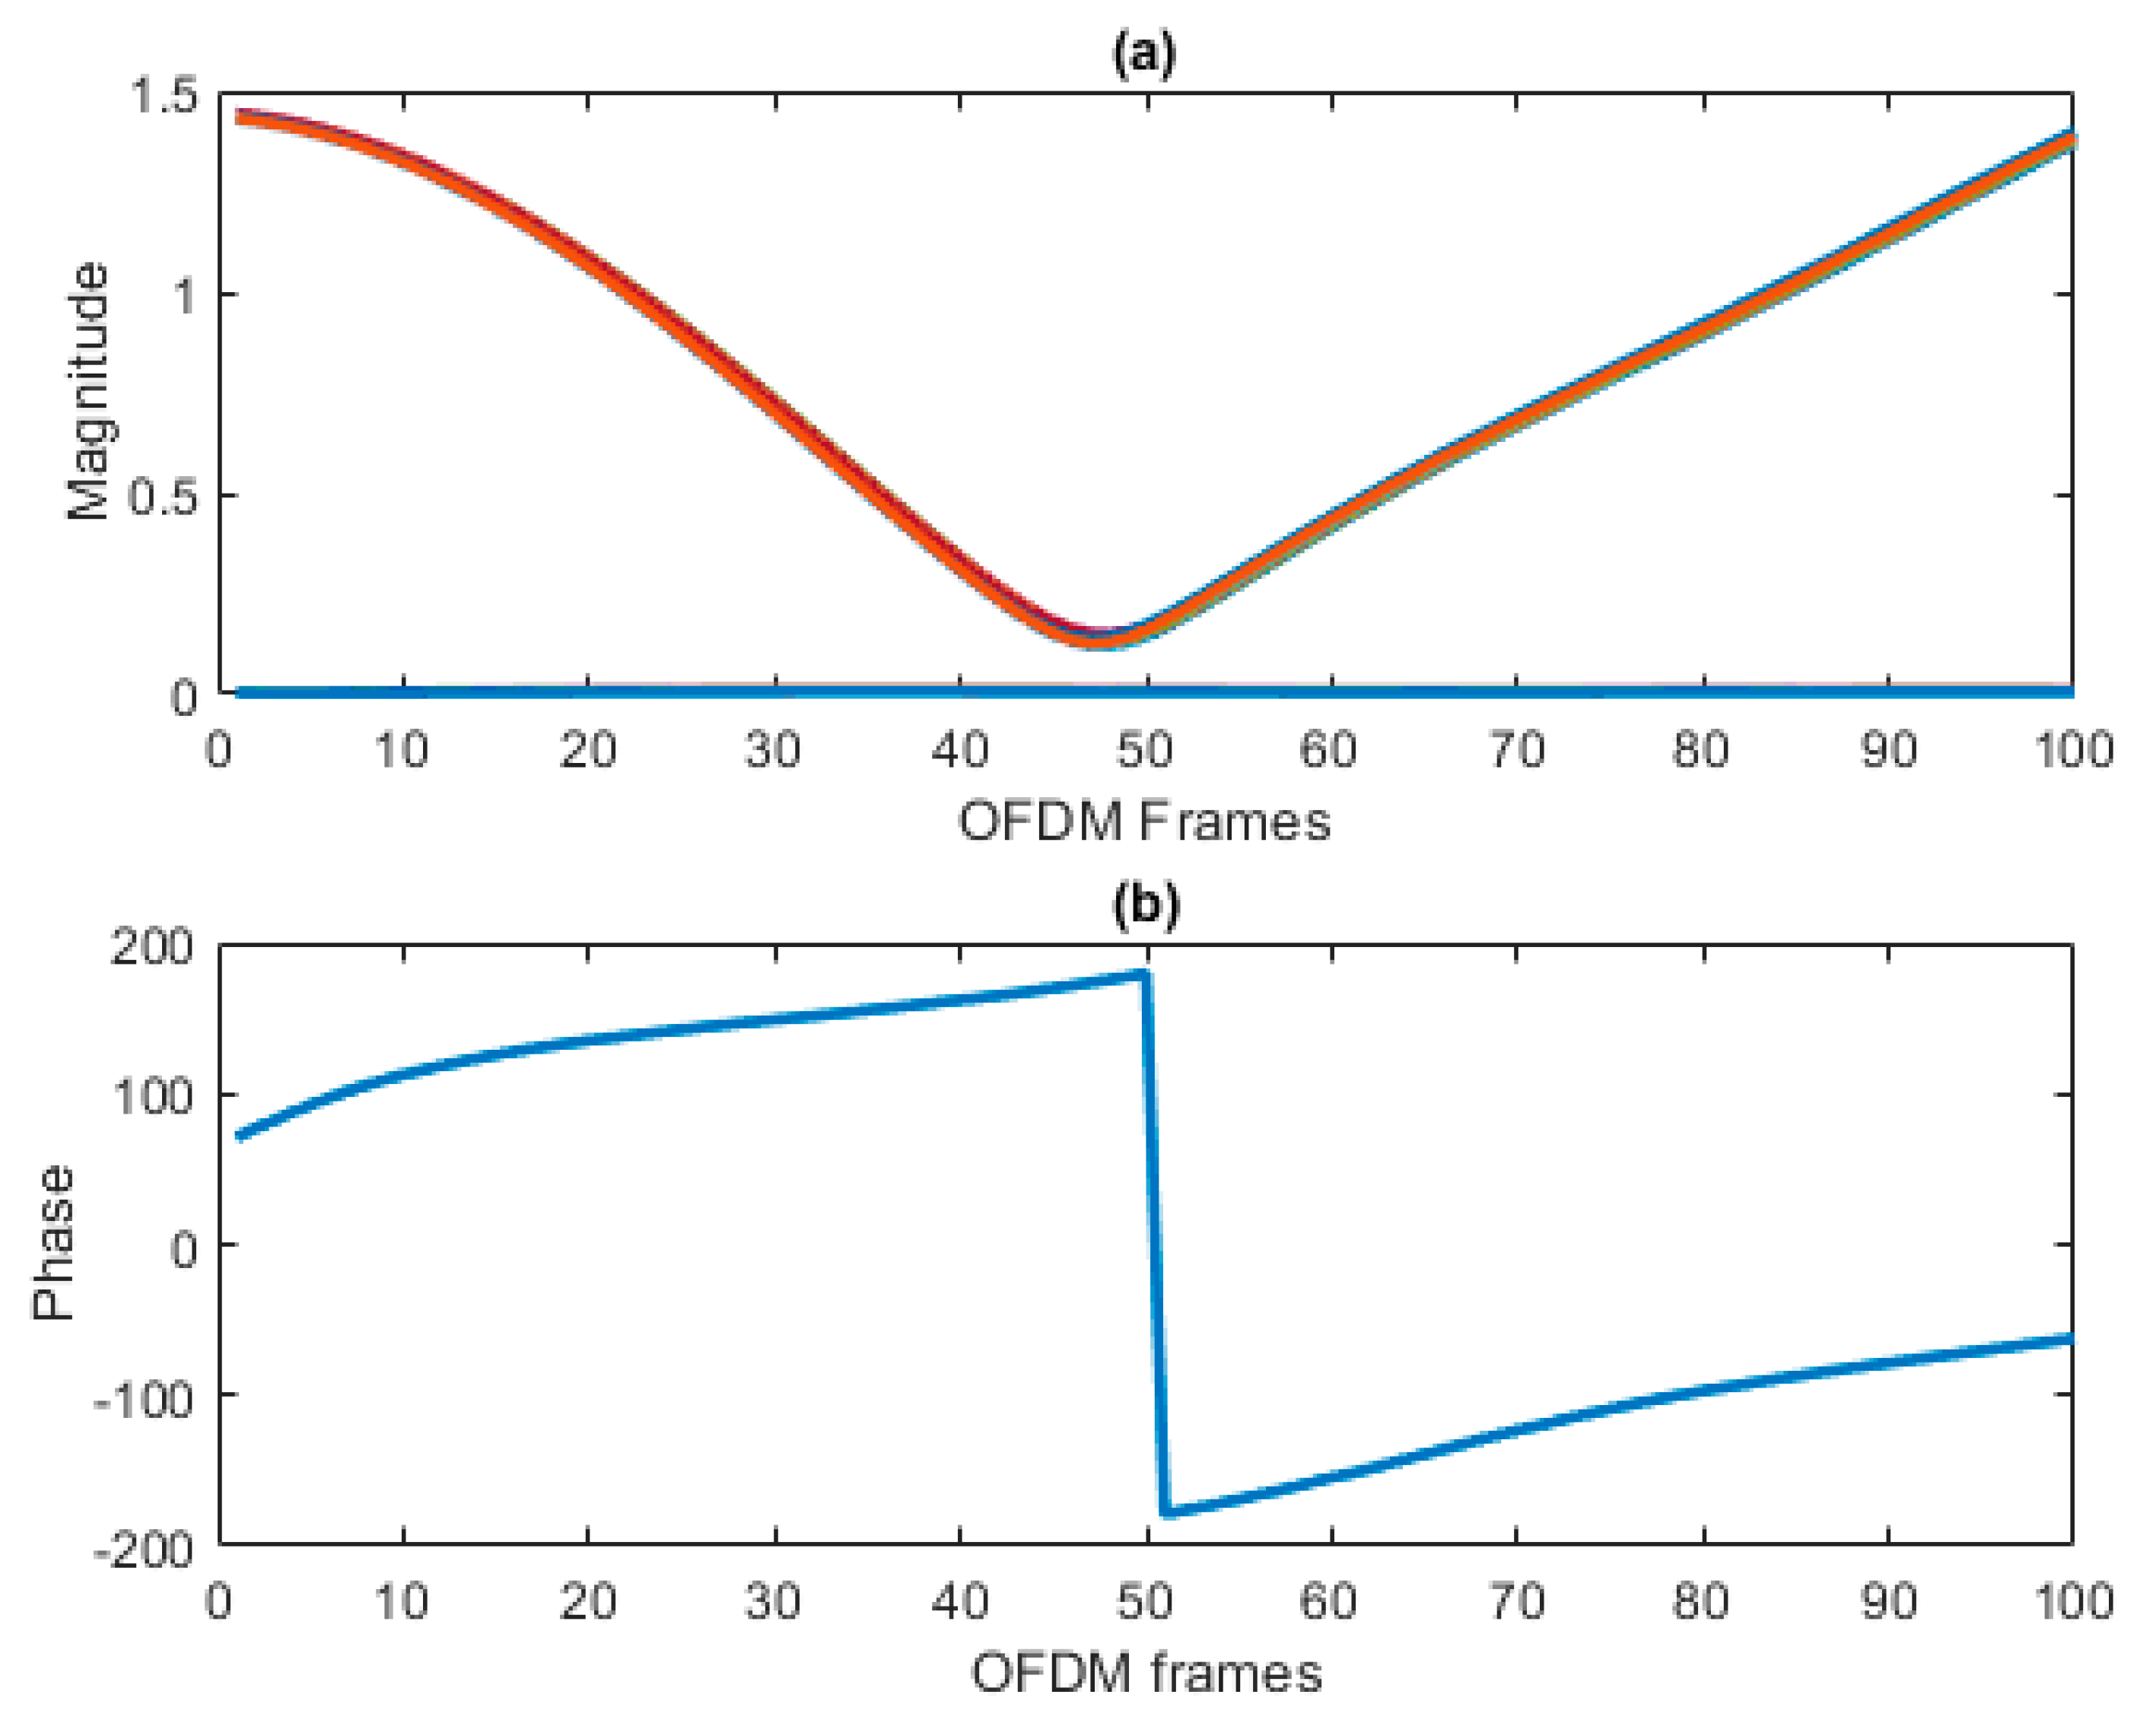
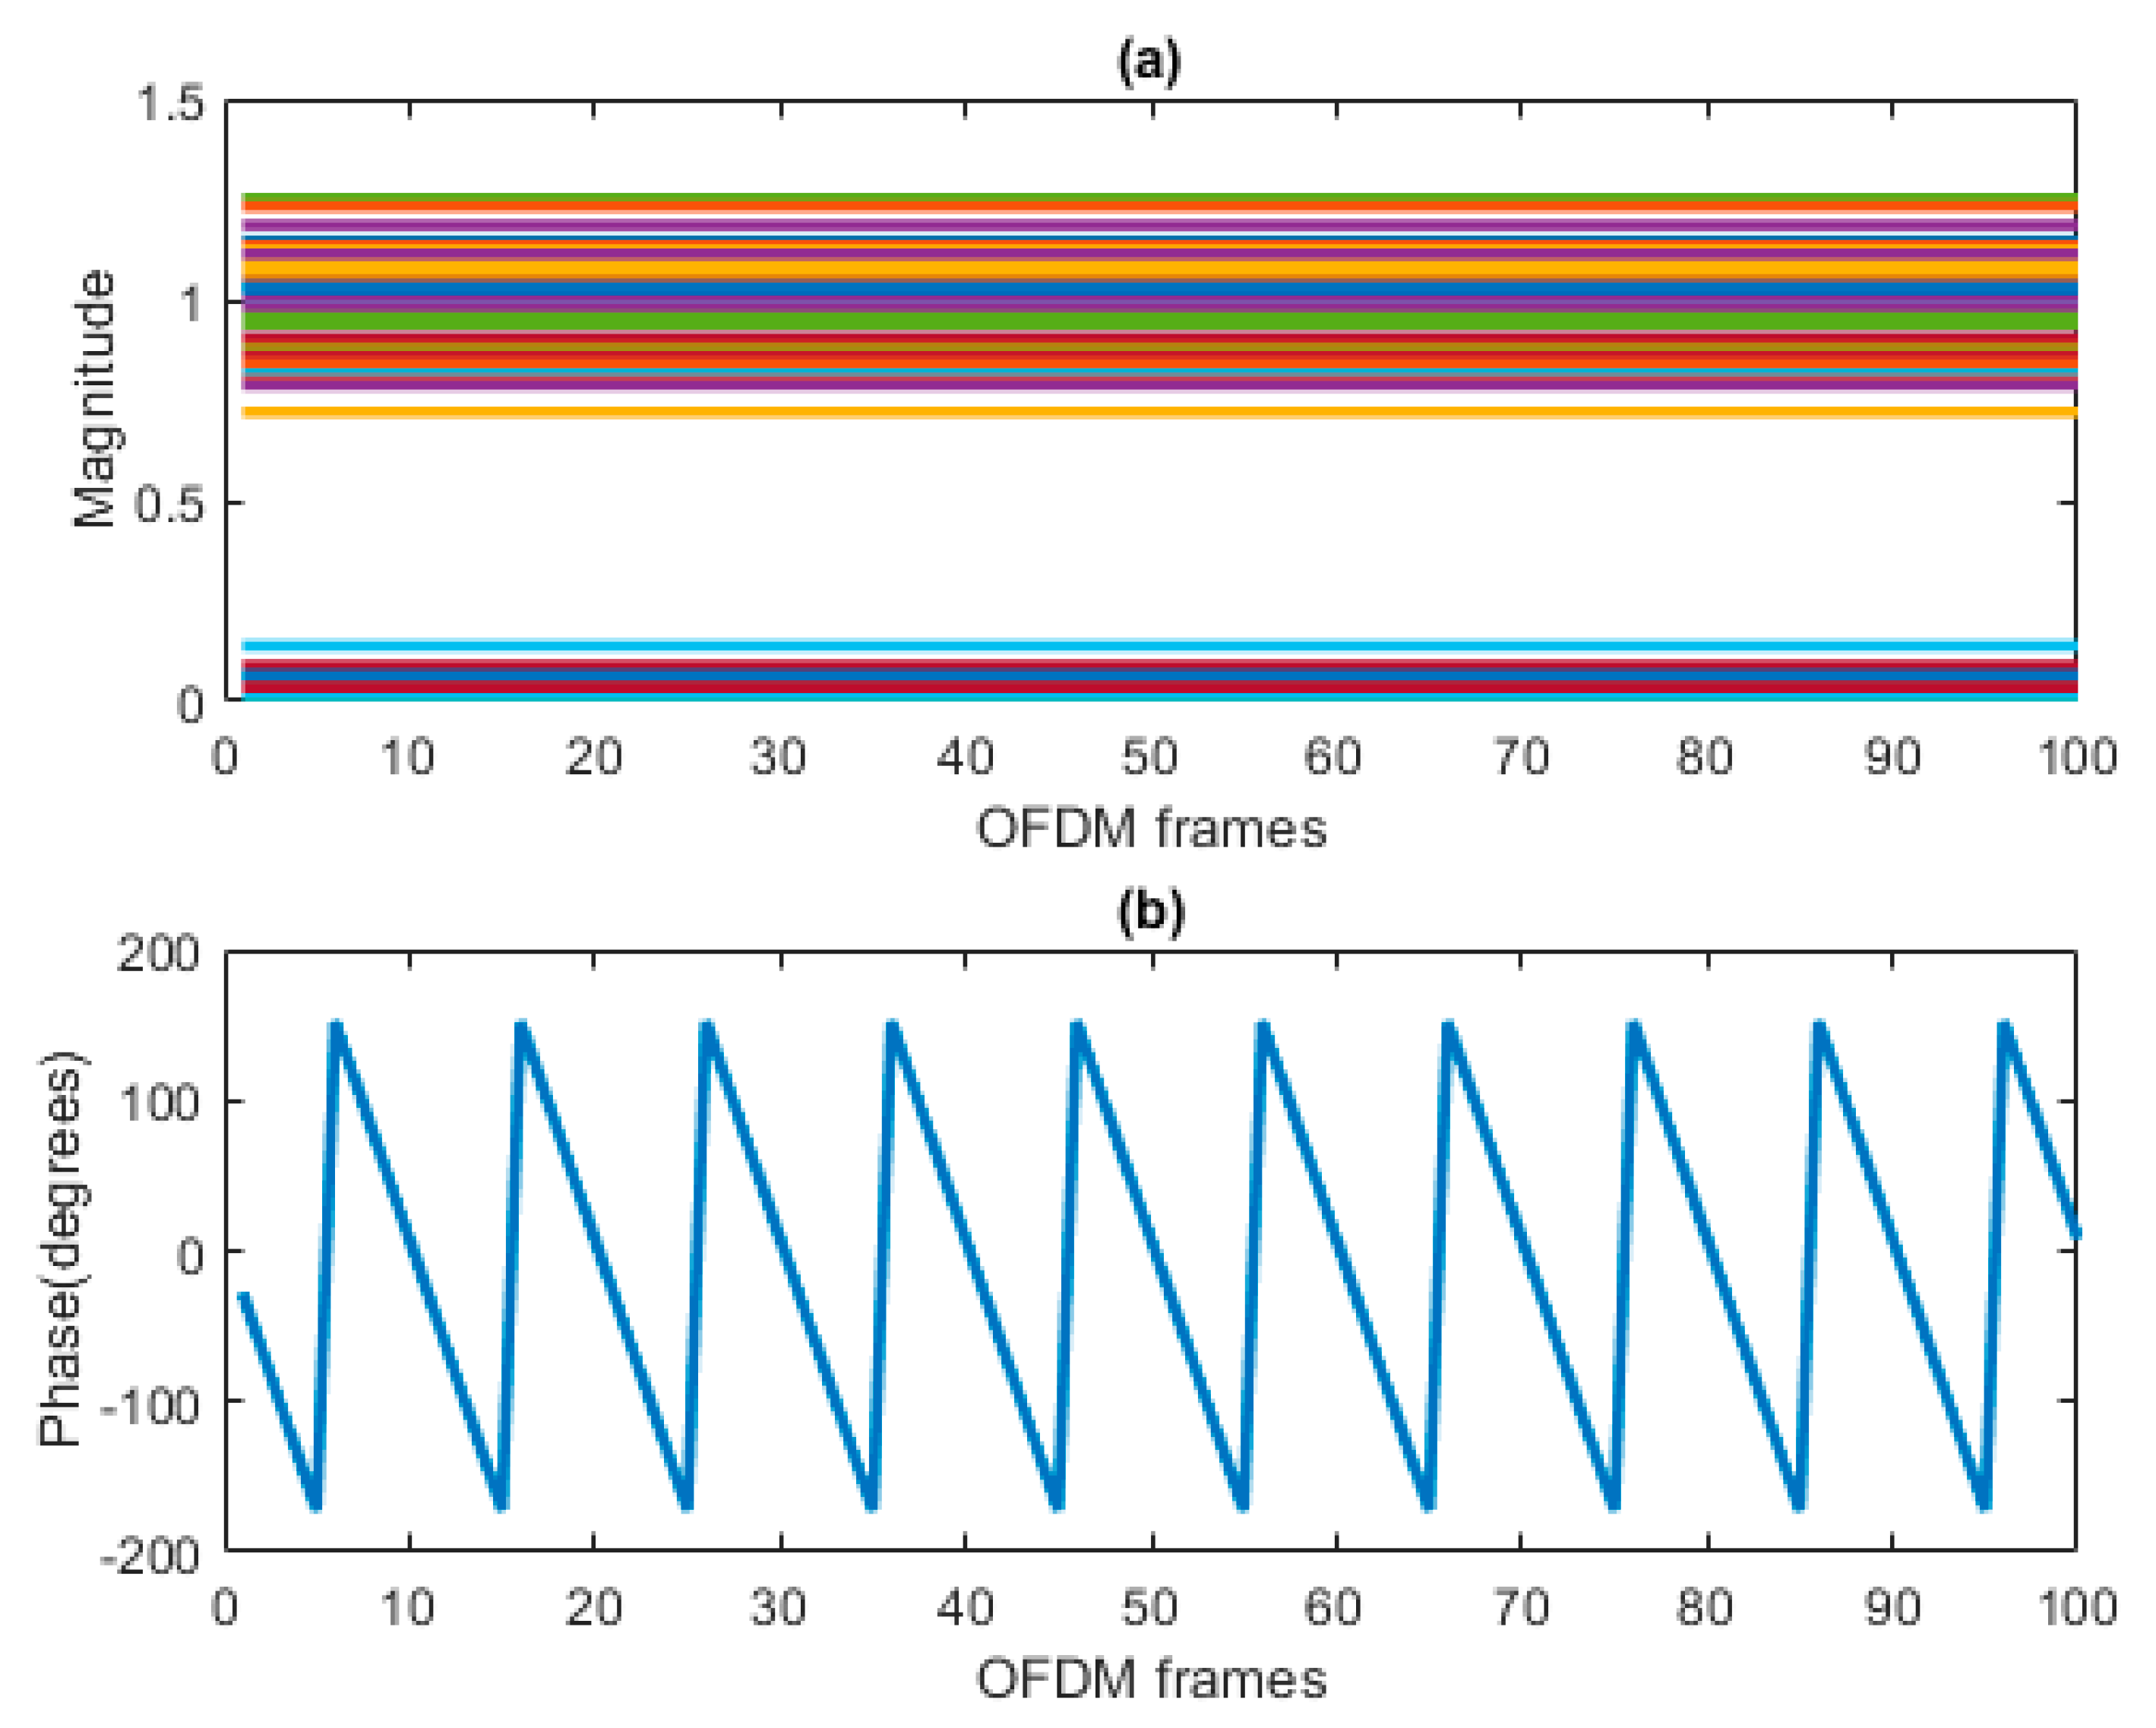
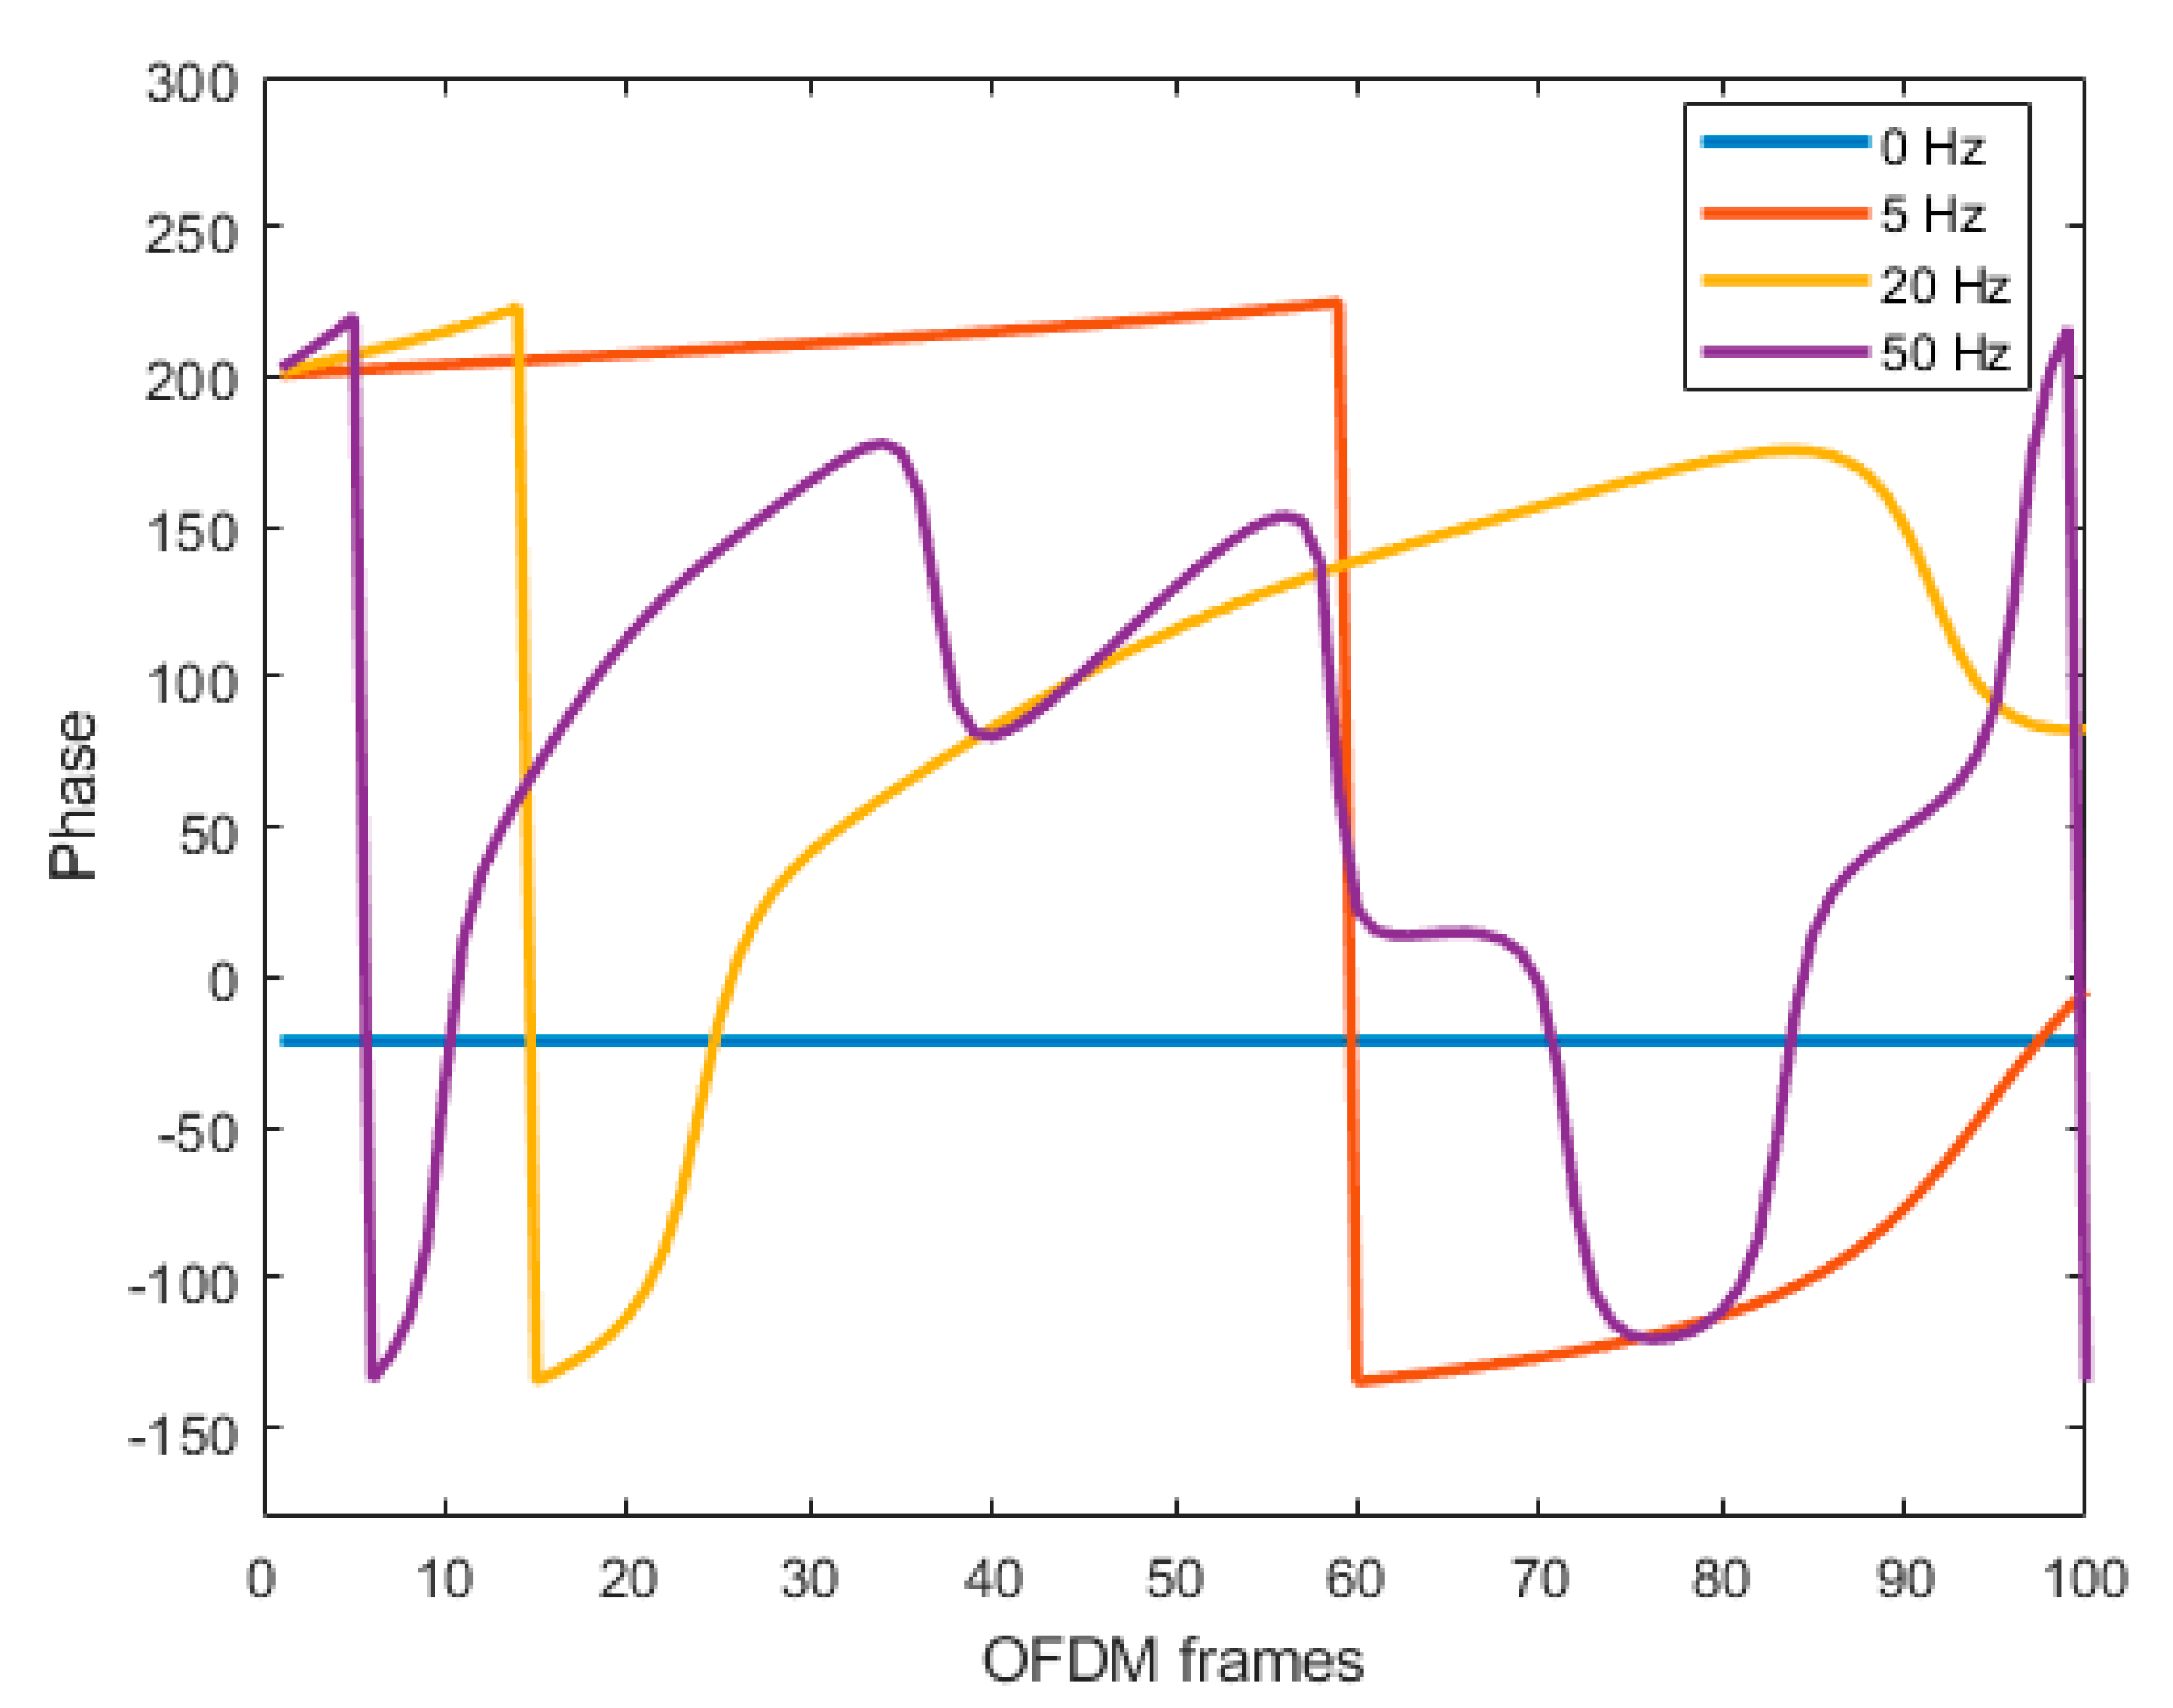
In Figure 5, the magnitude and phase response for the ideal channel are presented to analyze the CFR for channel characteristics. The result shown in (a) signify magnitude response for the ideal channel is unified for all received OFDM frames. The magnitude response shows whether or not the channel is affected by any channel characteristics. The ideal channel magnitude response is constant for all received OFDM frames. Similarly, the result shown in (b) signifies that the phase response for the ideal channel is zero for all received OFDM frames. The phase response shows if the channel is not affected by any channel characteristics and its response will be zero, which means the transmitter and receiver has no phase difference. In Figure 6, magnitude and phase responses for the AWGN channel are presented for analyzing the CFR for channel characteristics. The result shown in (a) signifies that the magnitude response for AWGN channel varies along with the unity magnitude for all received OFDM frames. The magnitude shows if the channel is affected by noise and its magnitude response also changes for all received OFDM frames. Similarly, the result shown in (b) signifies that the phase response for AWGN channel varies very fast above and below zero degrees for all received OFDM frames. The phase response shows if the channel is affected by noise and its phase response is varies, which means the transmitter and receiver has a different phase. In Figure 7, magnitude and phase response for fading channel in the presence of a Doppler shift of 10 Hz is presented to analyze the CFR for channel characteristics. The result shown in (a) signifies that the magnitude response due to the presence of Doppler shift varies significantly for all the data subcarriers and received OFDM frames, but DC and null subcarriers reflects no change in magnitude response in all the OFDM frames. Similarly, the result shown in (b) signifies that the phase response for the fading channel varies significantly to observe the change. The phase response shows if the Doppler shift is present in the channel results when there are significant phase changes. In Figure 8, magnitude and phase responses for the time-frequency dispersive channel are presented to analyze the CFR for channel characteristics. The result shown in (a) signifies that the magnitude response remains constant in all the OFDM frames but the magnitude variation occurs among all the subcarriers. Similarly, the result shown in (b) signifies phase response with consistent variations in all the OFDM frames due to the time-frequency offset. The phase response shows if the time-frequency offset is present in the channel results in the event of a significant phase change present in the CFR. In Figure 9, the magnitude response of four different Doppler shifts in the Rayleigh fading channel is presented to analyze the CFR for channel characteristics. The result shows that magnitude response variation is constant over all OFDM frames when a 0 Hz Doppler shift is present in the fading channel. The variations increase in magnitude response from slower to faster when the Doppler shift increases. A Doppler shift of 50 Hz magnitude variation is very fast compared to 5 Hz and 20 Hz. In Figure 10, phase response for four different Doppler shifts in the Rayleigh fading channel is observed. The result shows that phase response variation is constant over all OFDM frames when a 0 Hz Doppler shift is present in the fading channel. The variations increase in phase response from slower to faster when the Doppler shift increases. A Doppler shift of 50 Hz phase variation is very fast as compared to 5 Hz and 20 Hz. The results conclude that if the Doppler shift is present in the channel, then the phase response changes accordingly.

4.2. Experimental Results

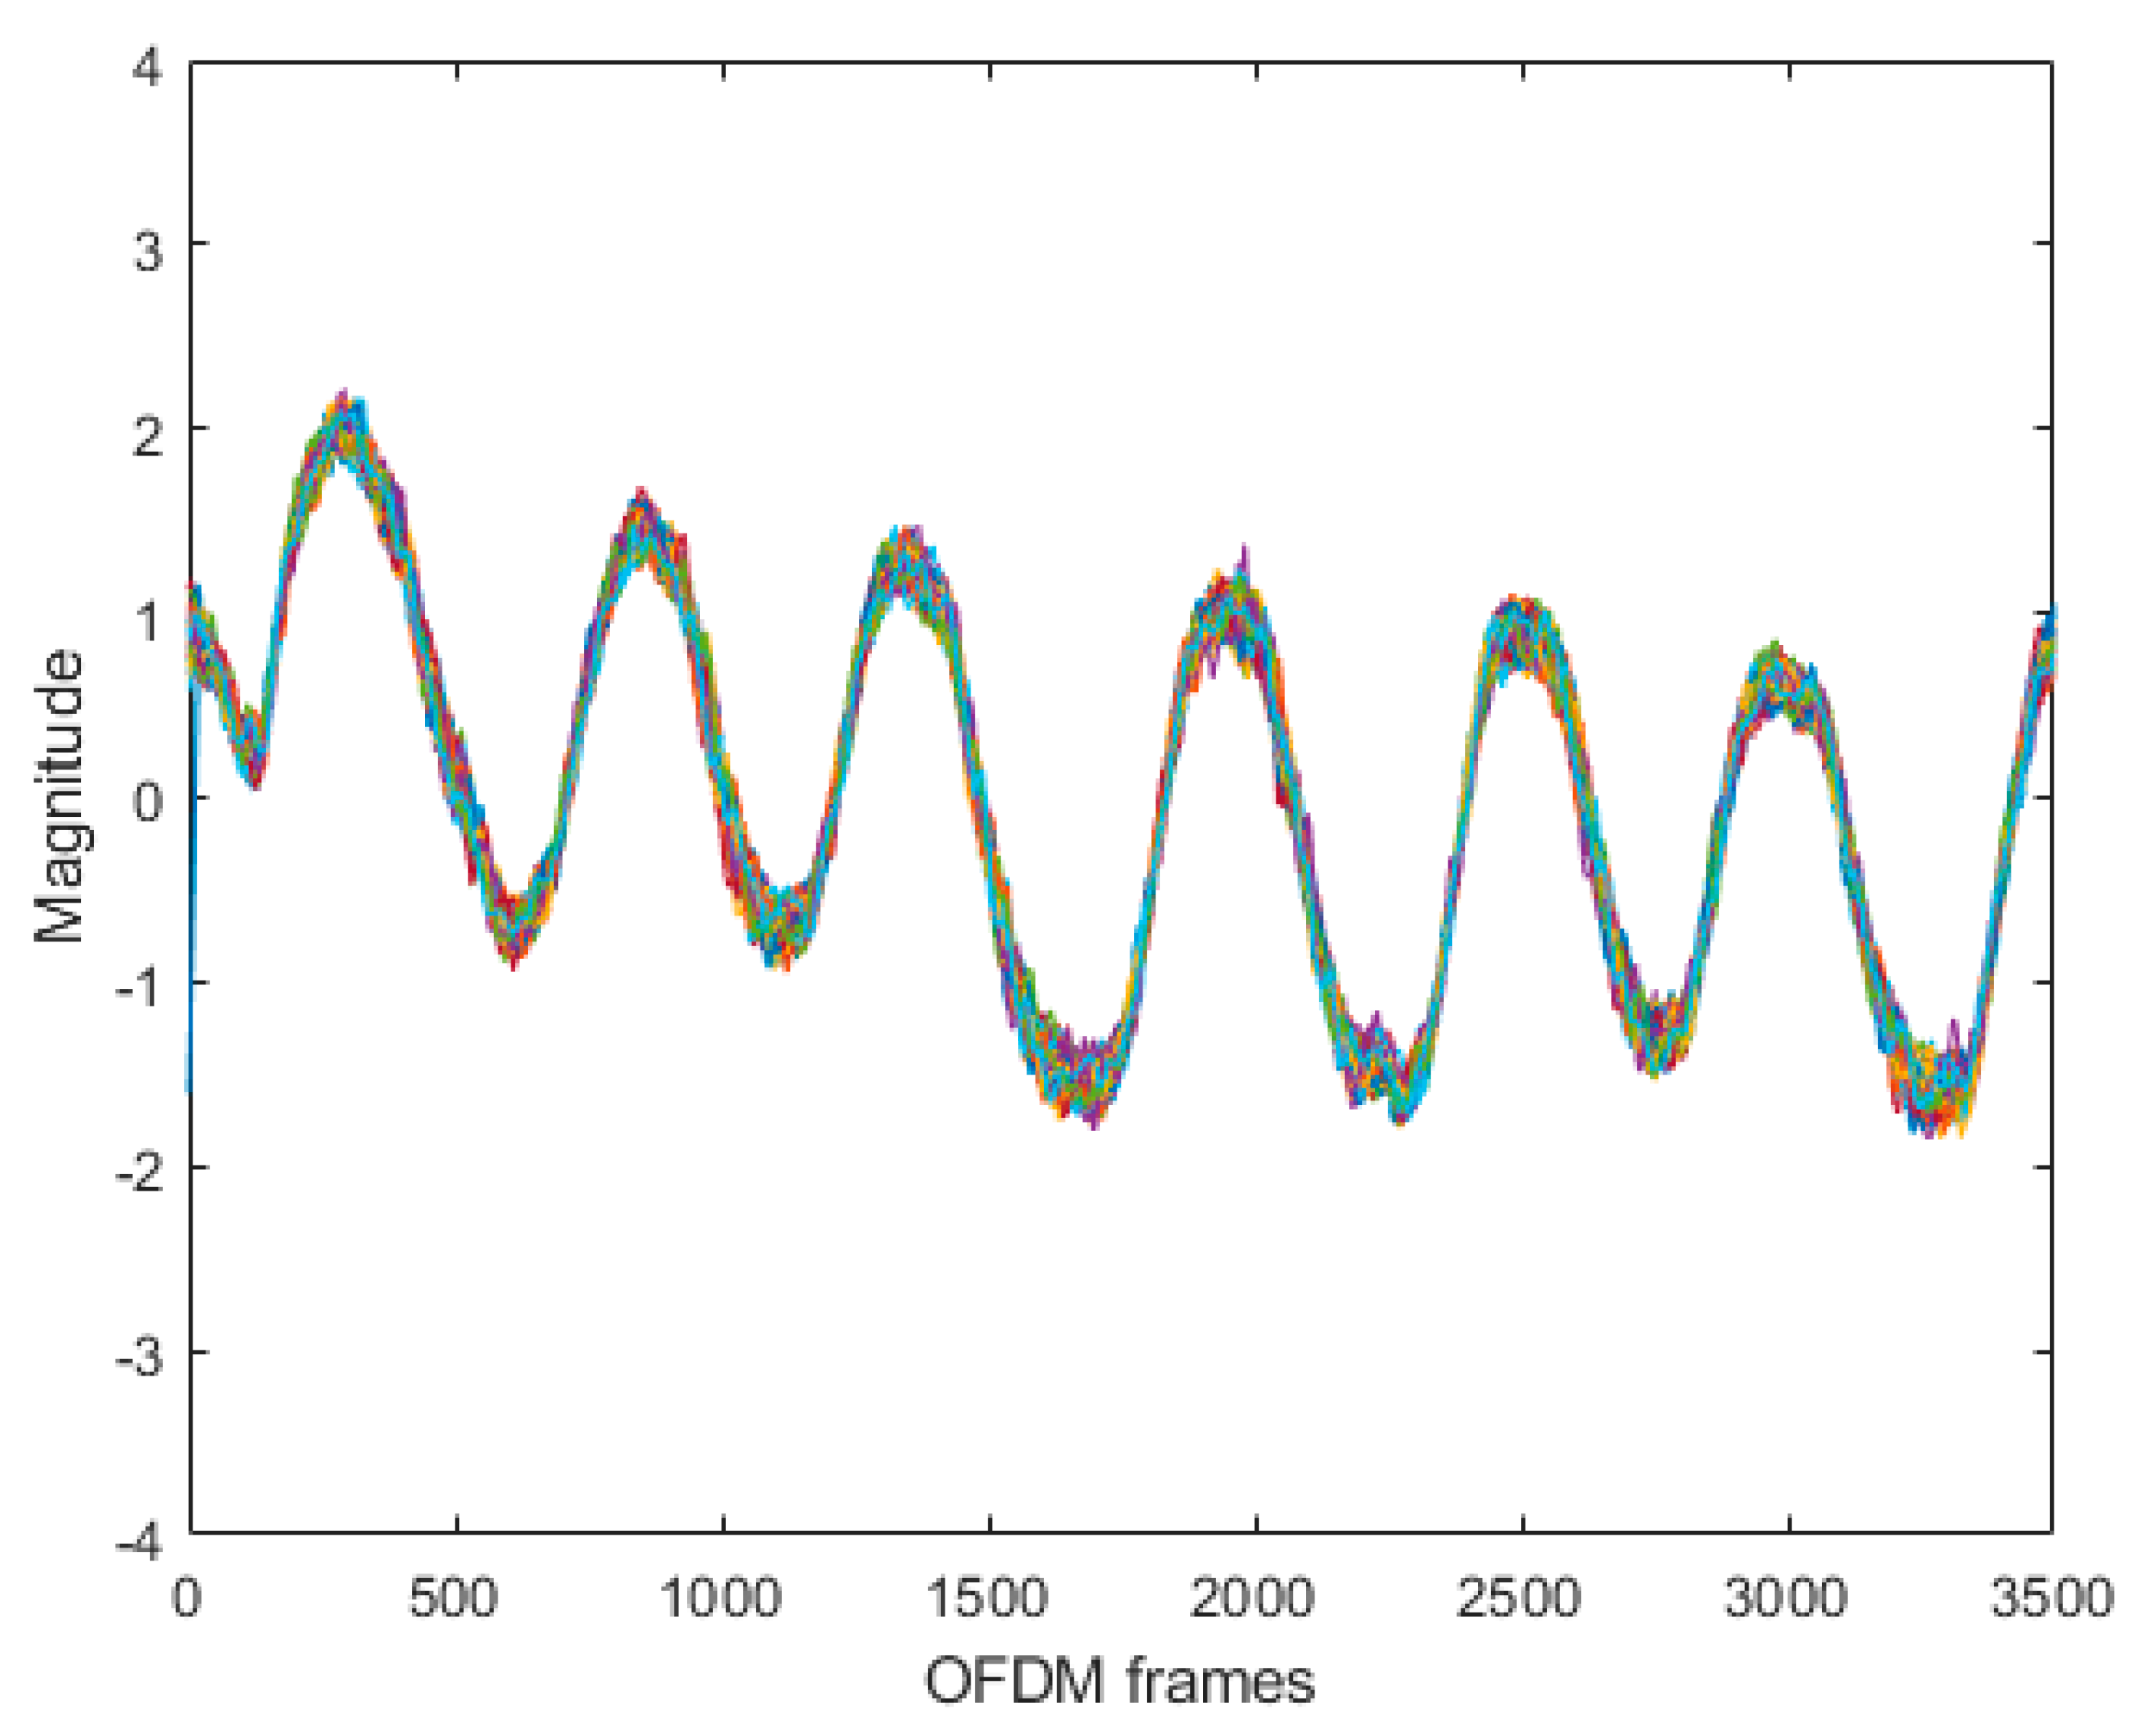
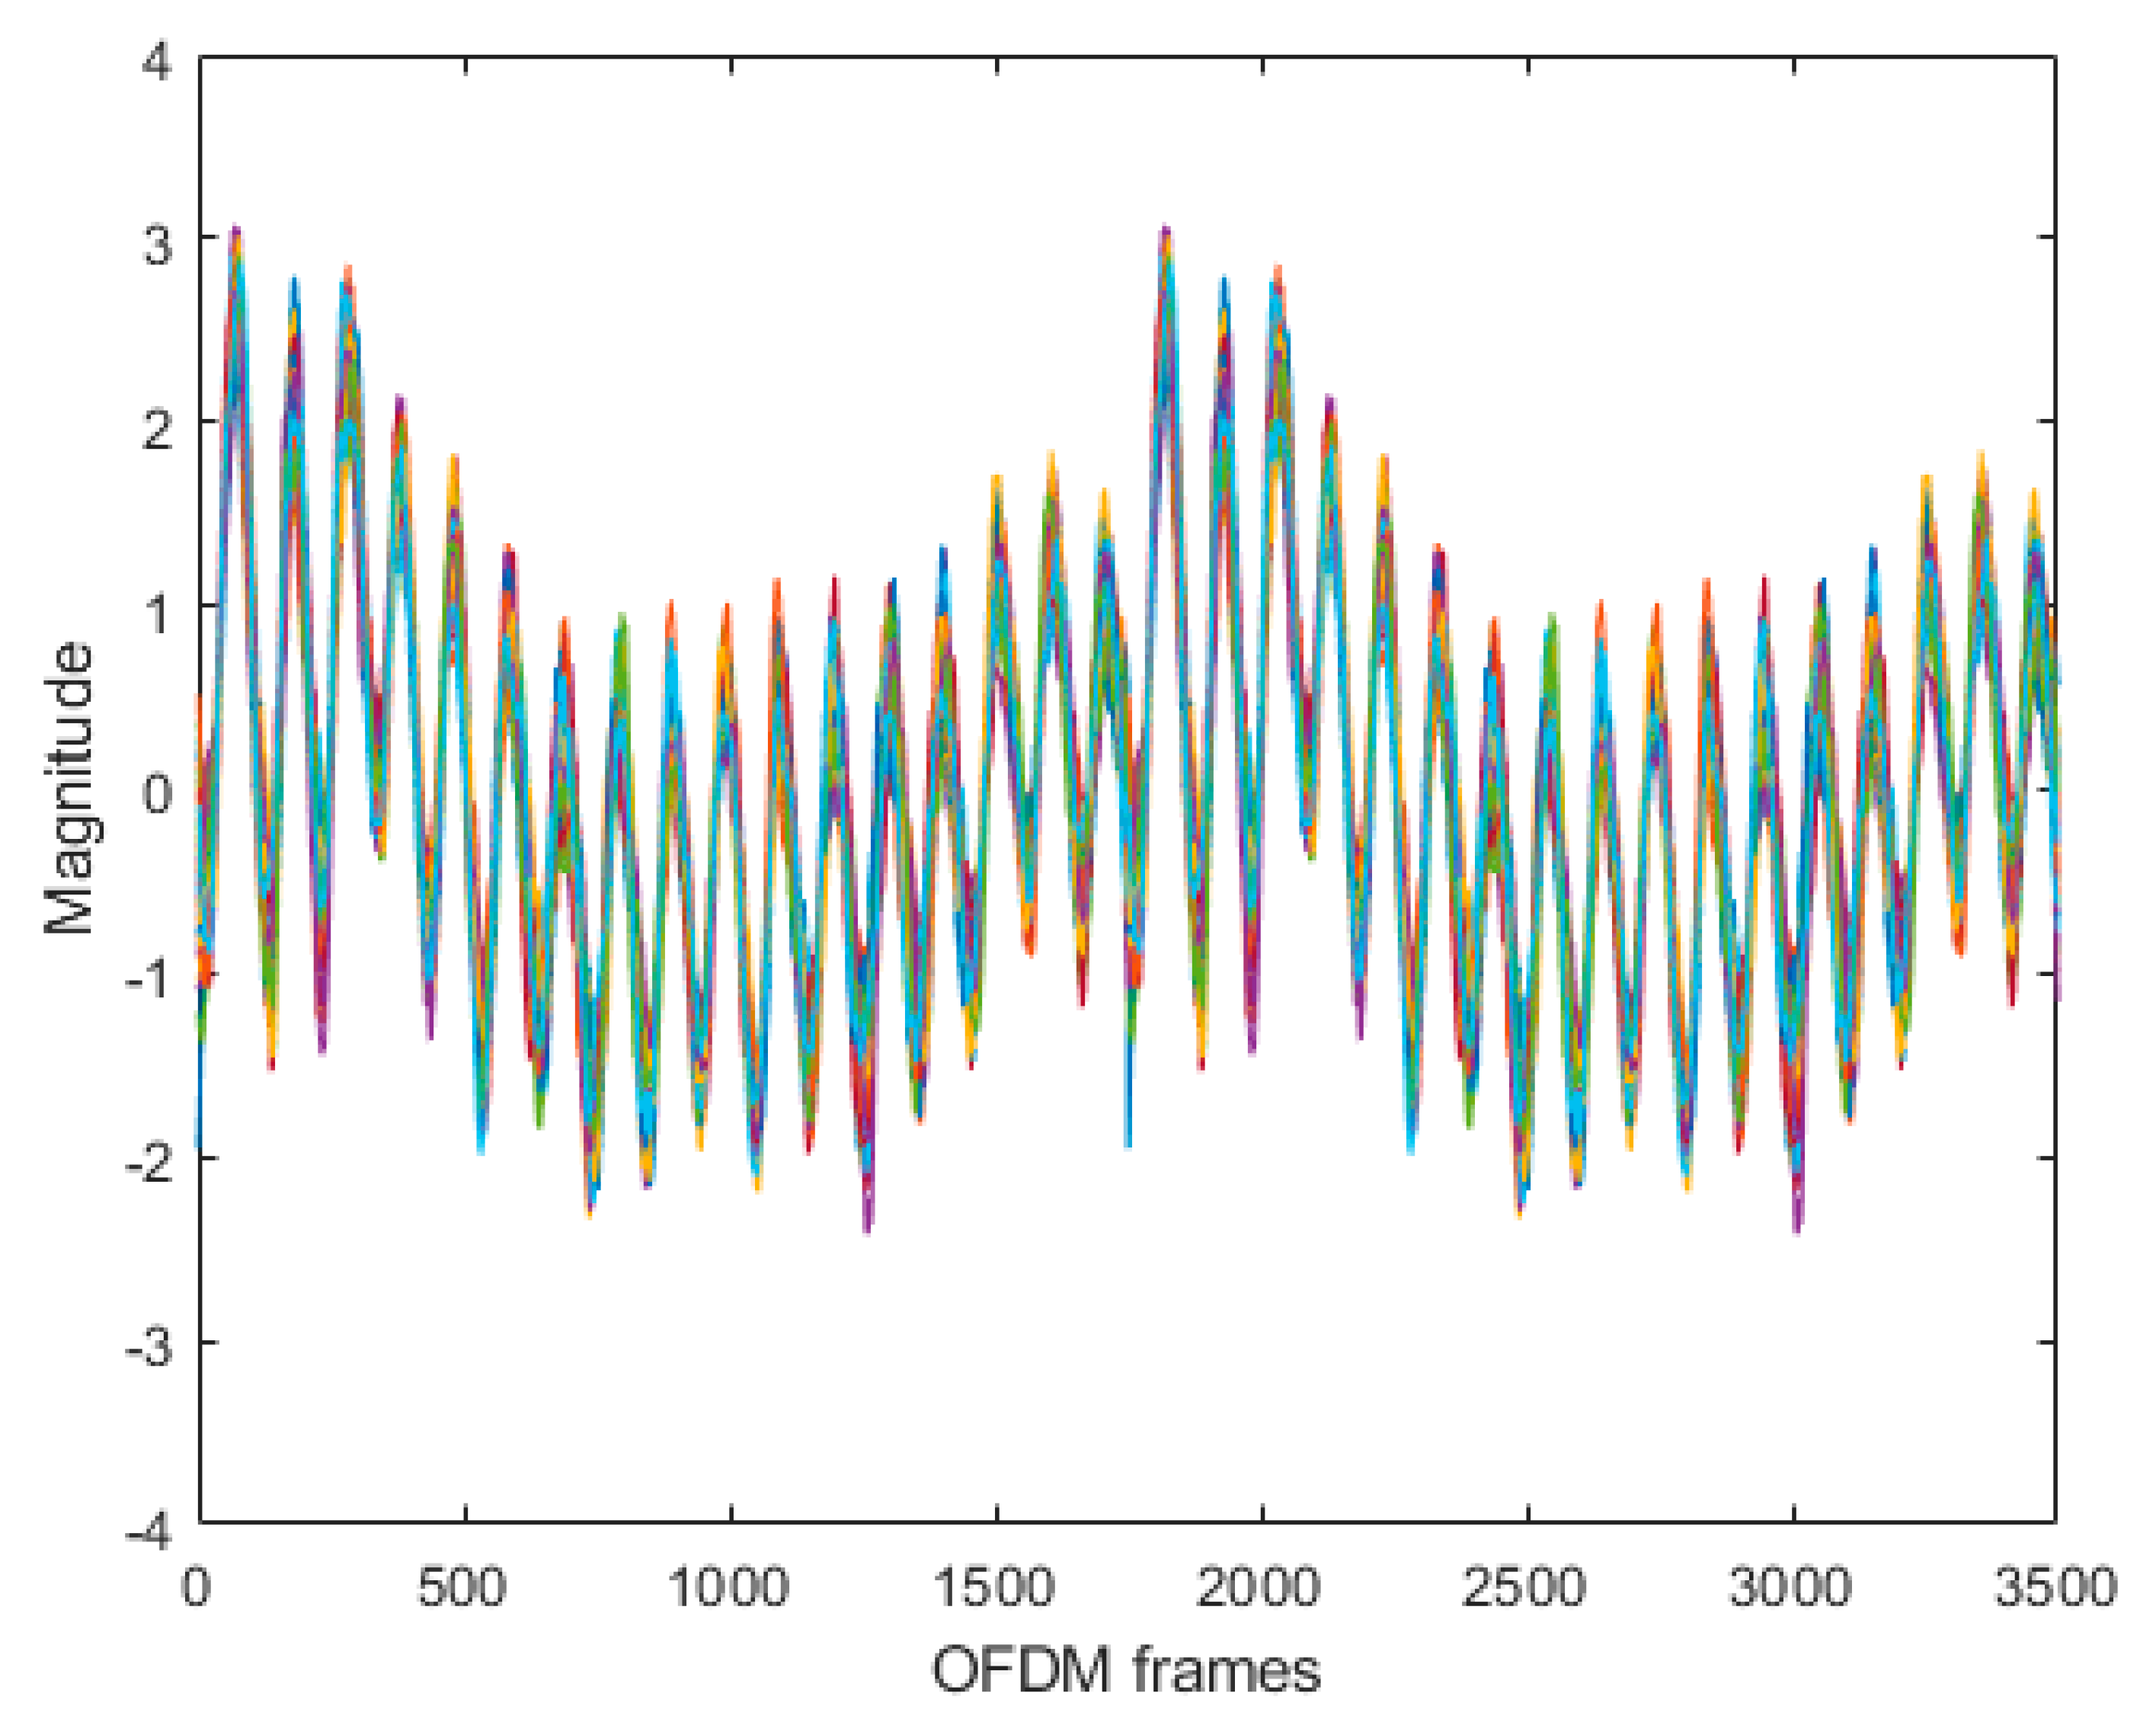
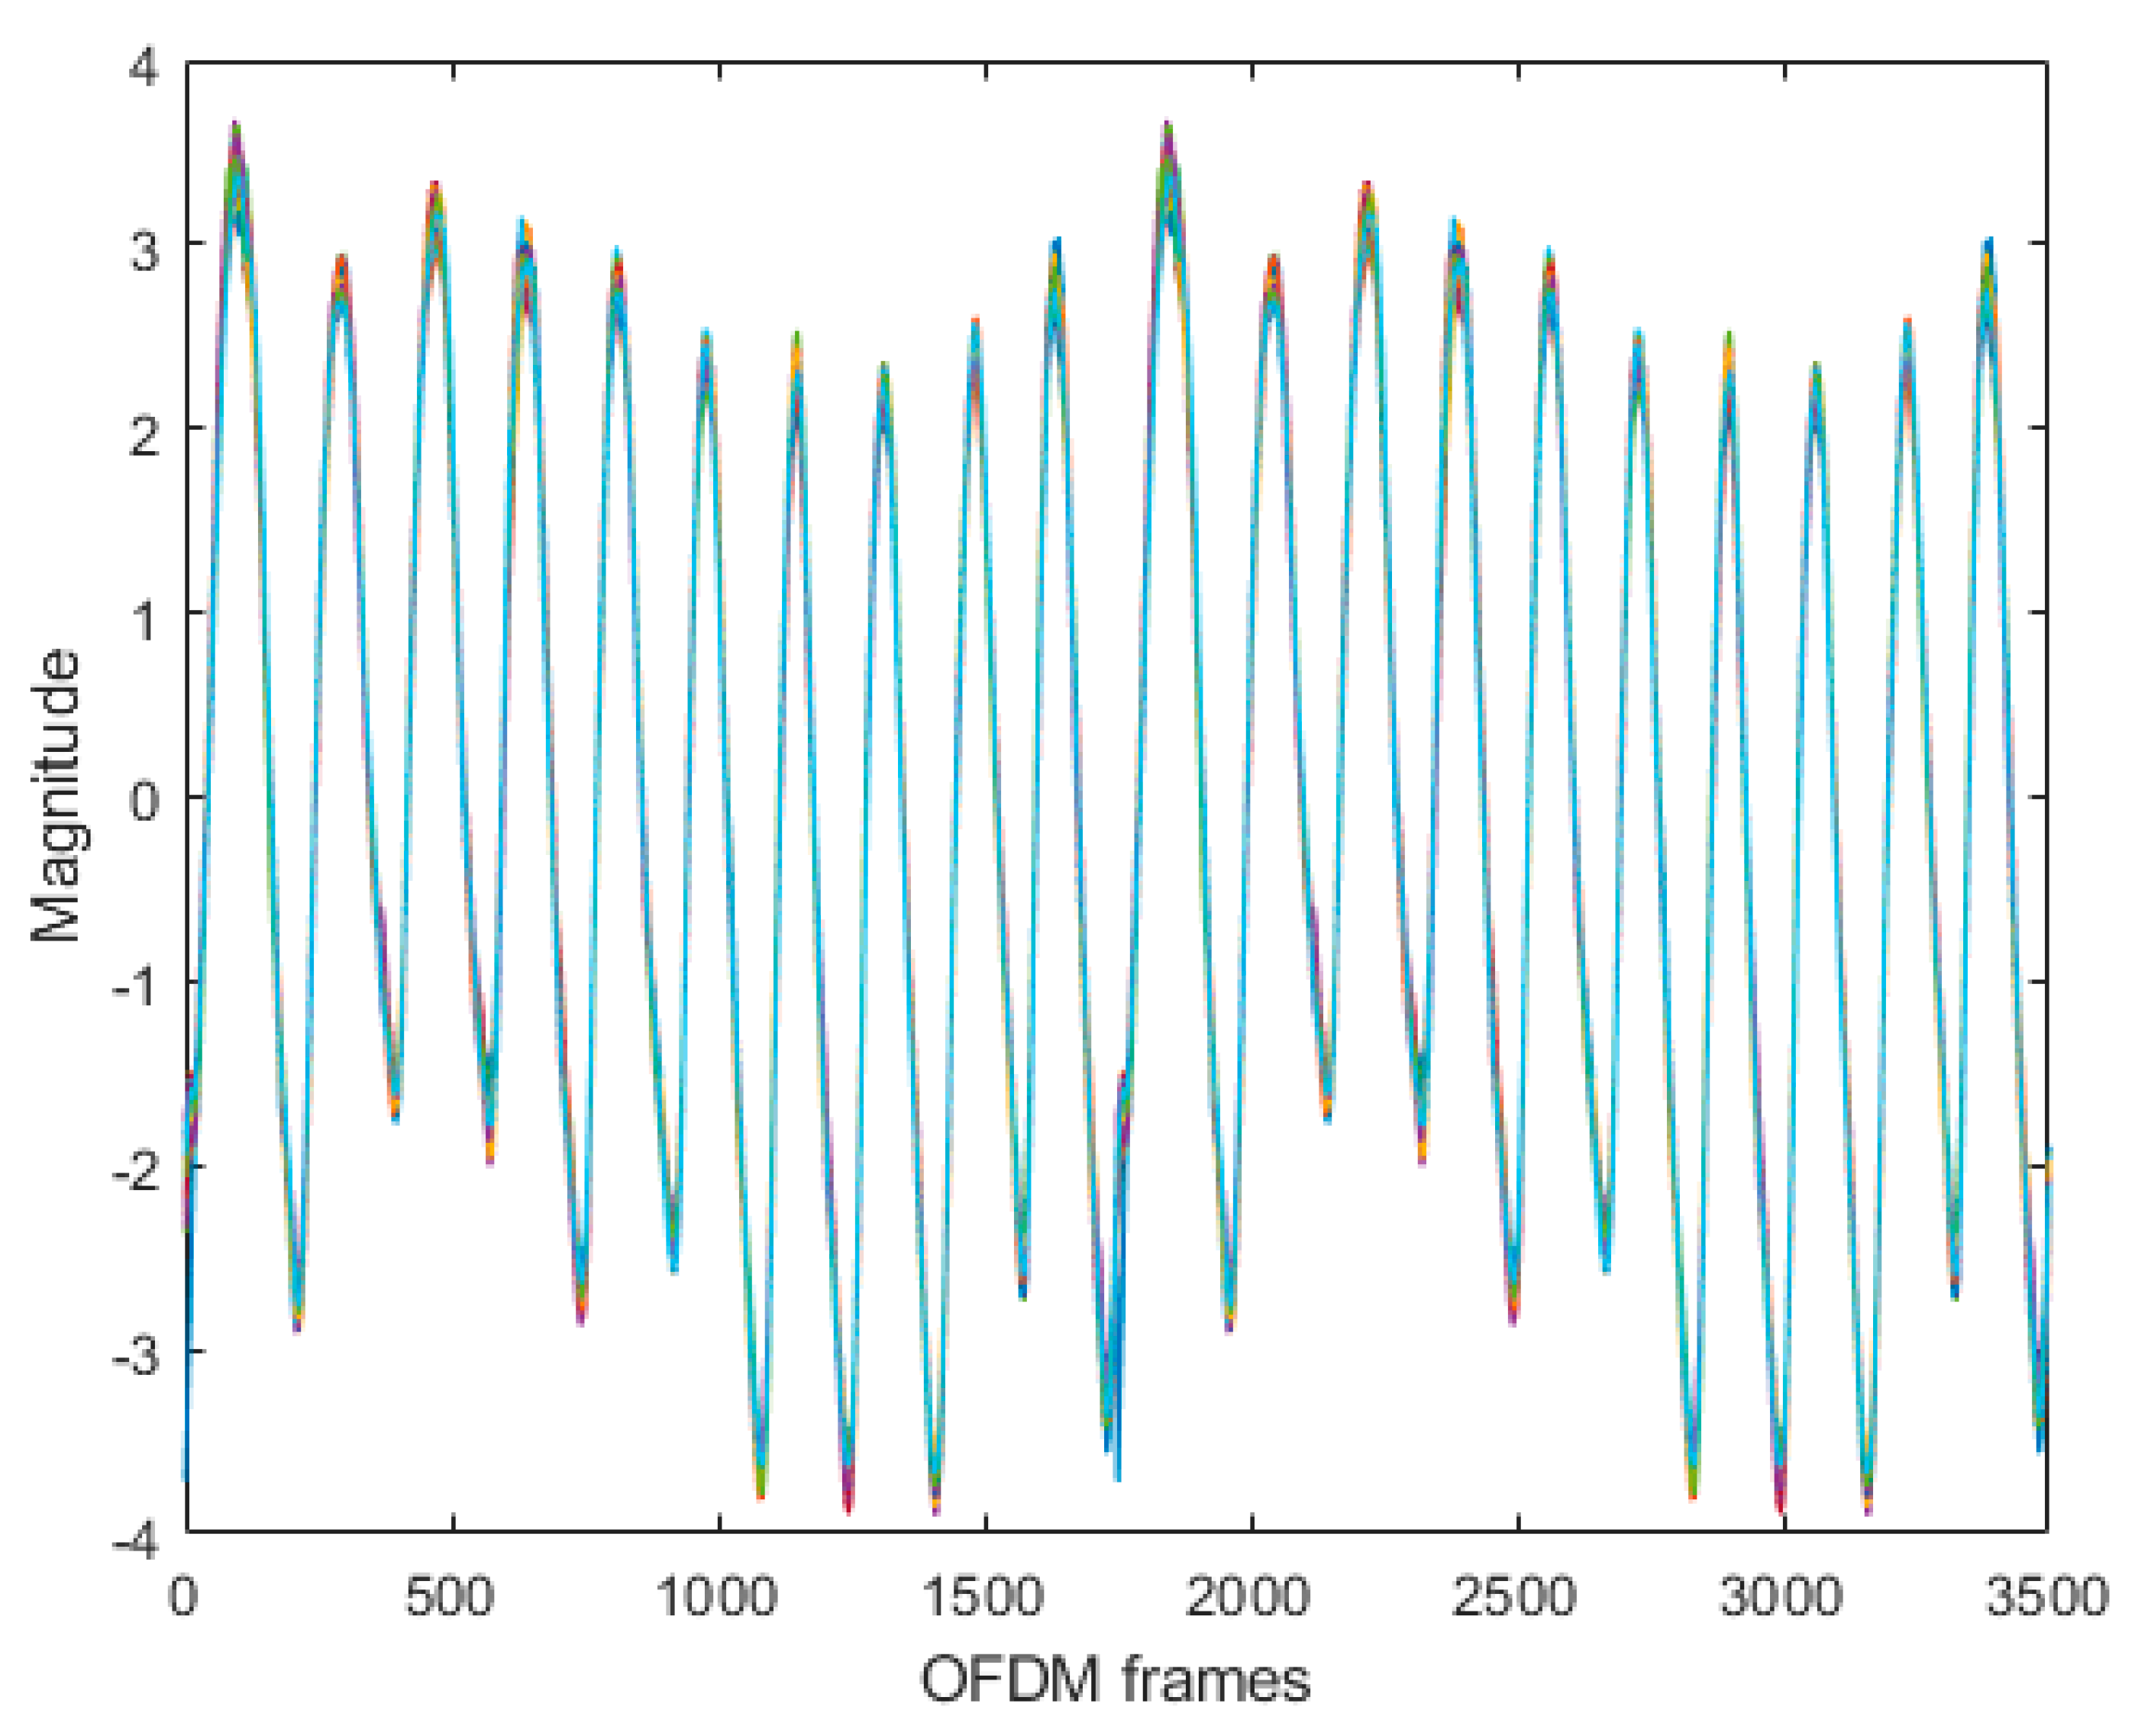
The experimental results are achieved from the four different breathing patterns experiments. The CFR in terms of the magnitude response of WCSI is used to analyze the pattern. In Figure 11, the normal breath magnitude response is presented. The result shows that magnitude response presents almost 14 normal peaks over 3500 OFDM frames. In Figure 12, the slow breathing magnitude response is presented. The result shows that the magnitude response presents 6 peaks over 3500 OFDM frames. In Figure 13, the fast-breath magnitude response is presented. The result shows that the magnitude response presents 34 peaks over 3500 OFDM frames. In Figure 14, the deep breath magnitude response is presented. The result shows that the magnitude response presents 19 peaks with a high magnitude over 3500 OFDM frames.

4.3. Classification Results

The classification is applied by using three popular machine learning algorithms: K-nearest neighbor (KNN), support vector machine (SVM), and decision tree (DT). The results are presented by the confusion matrix and the performance of each algorithm is expressed in terms of accuracy, prediction speed, and training time. The confusion matrix presents observations from the actual and predicted class and mismatch for breathing experiment data are presented in Table 6. The performance analysis of algorithms for breathing experiments data are presented in Table 7.

5. Discussion

The developed SDR technology-based platform design is validated by simulations of simulated wireless channels. Analyzing the different simulated channels is useful because they provide a better understanding of various factors for the desired information from the wireless channel. The ideal channel CFR is useful because any change in the above or below unity magnitude response and zero phase response presents the variation in CSI. The ideal CFR is also valuable for calibration, initial testing, and validation of the system design. Analyzing the AWGN CFR is useful because any change in channel characteristics, magnitude, and phase response shows the variation in CSI. The AWGN CFR is valuable for understanding the noise effect on the CFR. Analyzing the fading CFR in the presence of a Doppler shift is useful because it corresponds to the motion in CSI. The fading channel CFR is also valuable because this test and validation shows that the system design is capable for detecting human motions that are present in the wireless channel. Analyzing the time-frequency dispersive CFR in the presence of time-frequency offset is useful because it provides information about transmitter and receiver frequency mismatch and time delay. The time-frequency CFR is also valuable because this test and validation shows that the system design requires synchronization to remove time and frequency offsets. Analyzing the fading channel CFR in presence of different a Doppler shift is useful because it corresponds to the variations of motions present in CSI. The fading channel CFR in the presence of different Doppler shifts is also valuable because this test and validation show that the system design is capable of detecting different human motions present in the channel. The results from four different breathing patterns conclude that CFR, in terms of magnitude, can be distinguished from normal and abnormal breathing patterns. Normal and abnormal breathing is classified by using various machine learning algorithms. The KNN is the best among all algorithms with a maximum accuracy of 99.3%, maximum prediction speed of 460,000 obs/s, and possesses a minimum training time of 3.431 s. The results achieved from the developed SDR platform show that this platform is capable of measuring breathing during the COVID-19 and non-COVID-19 scenarios and is further used for connected health applications.

6. Conclusions

This research work reveals that wireless communication technologies are not only used for voice, text, videos, and multimedia applications but also links devices for connected health applications. The advantage of the double-edged sword made it a promising solution to meet the challenges of today’s world. In this research, the design of the SDR technology-based platform is validated through simulated wireless channels. The simulated results gave a better understanding of wireless channel characteristics for measuring CFR. The SDR technology-based developed platform intelligently senses human body movements in order to diagnose breathing abnormalities in a non-contact manner. The four different breathing patterns are classified by using three machine learning algorithms. The KNN is the best among all three algorithms, with a maximum classification accuracy of 99.3%. The experiment results reveal that the developed platform is reliable, portable, scalable, flexible, and has multifunction capabilities. The developed platform is a viable solution for COVID-19 and non-COVID-19 scenarios. It is also very useful in detecting early diagnosis of COVID-19 symptoms, such as shortness of breath and dry cough. Although the conducted research work faithfully classifies the breathing pattern for the diagnosis of breathing illness, the limitation of this research is that it cannot be applied to health issues that are not related to body motion, such as temperature, diabetics, etc. This research can be further used for the early diagnosis and monitoring of breast cancer, sleep disorder, gait, and many other diseases under the scope of human body motion.

Author Contributions

Conceptualization, M.B.K.; methodology, M.B.K.; software, M.B.K. and M.R.; validation, M.B.K. and M.R.; formal analysis, M.B.K., M.R. and A.M.; investigation, M.B.K., M.R. and X.Y.; resources, X.Y.; data curation, A.M.; writing—original draft preparation, M.B.K. and M.R.; writing—review and editing, A.M., R.A.S. and X.Y.; visualization, A.M. and R.A.S.; supervision, X.Y.; project administration, X.Y.; funding acquisition, X.Y. All authors have read and agreed to the published version of the manuscript.

Funding

This research was funded by the Fundamental Research Funds for the Central Universities, grant number JB180205.

Conflicts of Interest

The authors declare no conflict of interest.

References

  1. Wu, Y.C.; Chen, C.S.; Chan, Y.J. The outbreak of COVID-19: An overview. J. Chin. Med. Assoc. 2020, 83, 217. [Google Scholar] [CrossRef]
  2. Khan, M.B.; Zhang, Z.; Li, L.; Zhao, W.; Hababi, M.A.; Yang, X.; Abbasi, Q.H. A Systematic Review of Non-Contact Sensing for Developing a Platform to Contain COVID-19. Micromachines 2020, 11, 912. [Google Scholar] [CrossRef]
  3. 2019-nCoV Situation Report 51. World Health Organization. Available online: https://www.who.int/emergencies/diseases/novel-coronavirus-2019/situationreports/.2020 (accessed on 3 April 2020).
  4. Khanam, F.T.; Chahl, L.A.; Chahl, J.S.; Al-Naji, A.; Perera, A.G.; Wang, D.; Lee, Y.H.; Ogunwa, T.T.; Teague, S.; Nguyen, T.X.; et al. Noncontact Sensing of Contagion. J. Imaging 2021, 7, 28. [Google Scholar] [CrossRef]
  5. Cretikos, M.A.; Bellomo, R.; Hillman, K.; Chen, J.; Finfer, S.; Flabouris, A. Respiratory rate: The neglected vital sign. Med. J. Aust. 2008, 188, 657–659. [Google Scholar] [CrossRef] [PubMed]
  6. Huang, C.; Wang, Y.; Li, X.; Ren, L.; Zhao, J.; Hu, Y.; Zhang, L.; Fan, G.; Xu, J.; Gu, X.; et al. Clinical features of patients infected with 2019 novel coronavirus in Wuhan, China. Lancet 2020, 395, 497–506. [Google Scholar] [CrossRef] [Green Version]
  7. Wu, Z.; McGoogan, J.M. Characteristics of and important lessons from the coronavirus disease 2019 (COVID-19) outbreak in China: Summary of a report of 72 314 cases from the Chinese Center for Disease Control and Prevention. JAMA 2020, 323, 1239–1242. [Google Scholar] [CrossRef]
  8. Abdelnasser, H.; Youssef, M.; Harras, K.A. Wigest: A Ubiquitous Wifi-Based Gesture Recognition System. In Proceedings of the 2015 IEEE Conference on Computer Communications, Hong Kong, China, 26 April–1 May 2015; pp. 1472–1480. [Google Scholar]
  9. Shah, S.A.; Fioranelli, F. RF sensing technologies for assisted daily living in healthcare: A comprehensive review. IEEE Aerosp. Electron. Syst. Mag. 2019, 34, 26–44. [Google Scholar] [CrossRef] [Green Version]
  10. Ali, K.; Liu, A.X.; Wang, W.; Shahzad, M. Keystroke Recognition Using Wifi Signals. In Proceedings of the 21st Annual International Conference on Mobile Computing and Networking, Paris, France, 7–11 September 2015; pp. 90–102. [Google Scholar]
  11. Wang, G.; Zou, Y.; Zhou, Z.; Wu, K.; Ni, L.M. We can hear you with Wi-Fi! IEEE Trans. Mob. Comput. 2016, 15, 2907–2920. [Google Scholar] [CrossRef]
  12. Wang, J.; Xiong, J.; Jiang, H.; Jamieson, K.; Chen, X.; Fang, D.; Wang, C. Low human-effort, device-free localization with fine-grained subcarrier information. IEEE Trans. Mob. Comput. 2018, 17, 2550–2563. [Google Scholar] [CrossRef]
  13. Purnomo, A.T.; Lin, D.B.; Adiprabowo, T.; Hendria, W.F. Non-Contact Monitoring and Classification of Breathing Pattern for the Supervision of People Infected by COVID-19. Sensors 2021, 21, 3172. [Google Scholar] [CrossRef]
  14. Lien, J.; Gillian, N.; Karagozler, M.E.; Amihood, P.; Schwesig, C.; Olson, E.; Raja, H.; Poupyrev, I. Soli: Ubiquitous gesture sensing with millimeter wave radar. ACM Trans. Graph. 2016, 35, 1–9. [Google Scholar] [CrossRef] [Green Version]
  15. Ertin, E.; Stohs, N.; Kumar, S.; Raij, A.; Al’Absi, M.; Shah, S. Autosense: Unobtrusively Wearable Sensor Suite for Inferring the Onset, Causality, and Consequences of Stress in the Field. In Proceedings of the 9th ACM Conference on Embedded Networked Sensor Systems, Seattle, WA, USA, 1–4 November 2011; pp. 274–287. [Google Scholar]
  16. Yatani, K.; Truong, K.N. Bodyscope: A Wearable Acoustic Sensor for Activity Recognition. In Proceedings of the 2012 ACM Conference on Ubiquitous Computing, Pittsburgh, PA, USA, 5–8 September 2012; pp. 341–350. [Google Scholar]
  17. Wang, W.; Liu, A.X.; Shahzad, M.; Ling, K.; Lu, S. Understanding and Modeling of Wifi Signal Based Human Activity Recognition. In Proceedings of the 21st Annual International Conference on Mobile Computing and Networking, Paris, France, 7–11 September 2015; pp. 65–76. [Google Scholar]
  18. Zilani, T.A.; Al-Turjman, F.; Khan, M.B.; Zhao, N.; Yang, X. Monitoring movements of ataxia patient by using UWB technology. Sensors 2020, 20, 931. [Google Scholar] [CrossRef] [Green Version]
  19. Kotaru, M.; Joshi, K.; Bharadia, D.; Katti, S. Spotfi: Decimeter Level Localization Using Wifi. In Proceedings of the 2015 ACM Conference on Special Interest Group on Data Communication, London, UK, 17–21 August 2015; pp. 269–282. [Google Scholar]
  20. Xie, Y.; Li, Z.; Li, M. Precise power delay profiling with commodity Wi-Fi. IEEE Trans. Mob. Comput. 2018, 18, 1342–1355. [Google Scholar] [CrossRef]
  21. Gu, Y.; Zhang, X.; Yan, H.; Liu, Z.; Ren, F. Wital: WiFi-based Real-time Vital Signs Monitoring during Sleep. TechRxiv 2021. [Google Scholar] [CrossRef]
  22. Ali, K.; Alloulah, M.; Kawsar, F.; Liu, A.X. On Goodness of WiFi based Monitoring of Vital Signs in the Wild. arXiv 2020, arXiv:2003.09386. [Google Scholar]
  23. Aziz Shah, S.; Ahmad, J.; Tahir, A.; Ahmed, F.; Russel, G.; Shah, S.Y.; Buchanan, W.; Abbasi, Q.H. Privacy-preserving non-wearable occupancy monitoring system exploiting Wi-Fi imaging for next-generation body centric communication. Micromachines 2020, 11, 379. [Google Scholar] [CrossRef] [Green Version]
  24. Shah, S.A.; Tahir, A.; Ahmad, J.; Zahid, A.; Pervaiz, H.; Shah, S.Y.; Ashleibta, A.M.; Hasanali, A.; Khattak, S.; Abbasi, Q.H. Sensor fusion for identification of freezing of gait episodes using Wi-Fi and radar imaging. IEEE Sens. J. 2020, 20, 14410–14422. [Google Scholar] [CrossRef]
  25. Liu, L.; Shah, S.A.; Zhao, G.; Yang, X. Respiration symptoms monitoring in body area networks. Appl. Sci. 2018, 8, 568. [Google Scholar] [CrossRef] [Green Version]
  26. Yang, X.; Shah, S.A.; Ren, A.; Zhao, N.; Zhang, Z.; Fan, D.; Zhao, J.; Wang, W.; Ur-Rehman, M. Freezing of gait detection considering leaky wave cable. IEEE Trans. Antennas Propag. 2018, 67, 554–561. [Google Scholar] [CrossRef]
  27. Lee, S.; Park, Y.D.; Suh, Y.J.; Jeon, S. Design and Implementation of Monitoring System for Breathing and Heart Rate Pattern Using Wifi Signals. In Proceedings of the 2018 15th IEEE Annual Consumer Communications & Networking Conference (CCNC), Las Vegas, NV, USA, 12–15 January 2018; pp. 1–7. [Google Scholar]
  28. Liu, J.; Chen, Y.; Wang, Y.; Chen, X.; Cheng, J.; Yang, J. Monitoring vital signs and postures during sleep using WiFi signals. IEEE Internet Things J. 2018, 5, 2071–2084. [Google Scholar] [CrossRef]
  29. Wang, Y.; Wu, K.; Ni, L.M. Wifall: Device-free fall detection by wireless networks. IEEE Trans. Mob. Comput. 2016, 16, 581–594. [Google Scholar] [CrossRef]
  30. AL-Khalidi, F.Q.; Saatchi, R.; Burke, D.; Elphick, H.; Tan, S. Respiration rate monitoring methods: A review. Pediatric Pulmonol. 2011, 46, 523–529. [Google Scholar] [CrossRef] [Green Version]
  31. Al-Momani, O.; Gharaibeh, K.M. Effect of wireless channels on detection and classification of asthma attacks in wireless remote health monitoring systems. Int. J. Telemed. Appl. 2014, 2014, 816369. [Google Scholar] [CrossRef] [Green Version]
  32. Haider, D.; Romain, O.; Le Kernec, J.; Shah, S.Y.; Farooq, M.M.; Qadus, Z. Monitoring body motions related to huntington disease by exploiting the 5G paradigm. In Proceedings of the 2019 UK/China Emerging Technologies (UCET), Glasgow, UK, 21–22 August 2019; pp. 1–4. [Google Scholar]
  33. Li, F.; Valero, M.; Shahriar, H.; Khan, R.A.; Ahamed, S.I. Wi-COVID: A COVID-19 symptom detection and patient monitoring framework using WiFi. Smart Health 2021, 19, 100147. [Google Scholar] [CrossRef]
  34. Khan, M.B.; Yang, X.; Ren, A.; Al-Hababi, M.A.; Zhao, N.; Guan, L.; Fan, D.; Shah, S.A. Design of software defined radios based platform for activity recognition. IEEE Access 2019, 7, 31083–31088. [Google Scholar] [CrossRef]
  35. Khan, M.B.; Dong, C.; Al-Hababi, M.A.; Yang, X. Design of a portable and multifunctional dependable wireless communication platform for smart health care. Ann. Telecommun. 2020. [Google Scholar] [CrossRef]
  36. Al-hababi, M.A.; Khan, M.B.; Al-Turjman, F.; Zhao, N.; Yang, X. Non-Contact Sensing Testbed for Post-Surgery Monitoring by Exploiting Artificial-Intelligence. Appl. Sci. 2020, 10, 4886. [Google Scholar] [CrossRef]
  37. Barua, A.; Zhang, Z.Y.; Al-Turjman, F.; Yang, X. Cognitive intelligence for monitoring fractured post-surgery ankle activity using channel information. IEEE Access 2020, 8, 112113–112129. [Google Scholar] [CrossRef]
  38. Sigg, S.; Scholz, M.; Shi, S.; Ji, Y.; Beigl, M. RF-sensing of activities from non-cooperative subjects in device-free recognition systems using ambient and local signals. IEEE Trans. Mob. Comput. 2013, 13, 907–920. [Google Scholar] [CrossRef]
  39. Taylor, W.; Shah, S.A.; Dashtipour, K.; Zahid, A.; Abbasi, Q.H.; Imran, M.A. An intelligent non-invasive real-time human activity recognition system for next-generation healthcare. Sensors 2020, 20, 2653. [Google Scholar] [CrossRef]
  40. Rehman, M.; Shah, R.A.; Khan, M.B.; Ali, N.A.; Alotaibi, A.A.; Althobaiti, T.; Ramzan, N.; Shaha, S.A.; Yang, X.; Alomainy, A.; et al. Contactless Small-Scale Movement Monitoring System Using Software Defined Radio for Early Diagnosis of COVID-19. IEEE Sens. J. 2021. [Google Scholar] [CrossRef]
  41. Edfors, O.; Sandell, M.; van de Beek, J.; Landström, D.; Sjöberg, F. An Introduction to Orthogonal Frequency-Division Multiplexing; Luleå Tekniska Universitet: Luleå, Sweden, 1997. [Google Scholar]
  42. Fan, D.; Ren, A.; Zhao, N.; Yang, X.; Zhang, Z.; Shah, S.A.; Hu, F.; Abbasi, Q.H. Breathing rhythm analysis in body centric networks. IEEE Access 2018, 6, 32507–32513. [Google Scholar] [CrossRef]
Figure 1. Design of intelligent SDR platform for connected health applications.
Electronics 10 01558 g001
Figure 2. Wireless channel environment for monitoring health.
Electronics 10 01558 g002
Figure 3. Structure of Van de Beek Algorithm [41].
Electronics 10 01558 g003
Figure 4. Experimental setup for breathing experiments in the lab environment.
Electronics 10 01558 g004
Figure 5. Ideal channel response (a) magnitude; (b) phase.
Electronics 10 01558 g005
Figure 6. AWGN channel response (a) magnitude; (b) phase.
Electronics 10 01558 g006
Figure 7. Fading channel response (a) magnitude; (b) phase.
Electronics 10 01558 g007
Figure 8. Dispersive channel response (a) magnitude; (b) phase.
Electronics 10 01558 g008
Figure 9. Doppler shift-based magnitude response.
Electronics 10 01558 g009
Figure 10. Doppler shift-based phase response.
Electronics 10 01558 g010
Figure 11. Magnitude response of normal breathing experiment.
Electronics 10 01558 g011
Figure 12. Magnitude response of slow breathing experiment.
Electronics 10 01558 g012
Figure 13. Magnitude response of fast breathing experiment.
Electronics 10 01558 g013
Figure 14. Magnitude response of deep breathing experiment.
Electronics 10 01558 g014
Table 1. Summary of existing connected health technologies drawbacks.
Sr.TechnologyDrawbacks
1Sensors-basedComfortability issues and source of spreading viruses
2Camera-basedPrivacy concern and limited coverage area
3Radar-basedLOS requirements and no occlusion between radar and patient
4UWB-basedOccupied wideband and enforce interference
5Wi-Fi-basedFlexibility and portability issues
Table 2. Hardware configurations for breathing experiments.
PlatformB210
Channel Mapping Tx1
Channel Mapping Rx1
Centre Frequency900 MHz
PPS SourceInternal
Clock SourceInternal
Master Clock Rate20 MHz
Transport data typeint16
Enable Burst modefalse
Interpolation Factor125
Decimation Factor125
Output data typeSame as transport data type
Transmitter serial number30 AD2 FE
Receiver serial number30 AD311
Transmitter Gain80
Receiver Gain70
Samples per frames1600
Table 3. Subjects’ participation in breathing experiments.
Sr.SubjectAge (Years)Height (cm)Weight (Kg)Body Structure
1Male3016870Ectomorph
2Male3218095Endomorph
3Male2816872Mesomorph
4Male2617476Mesomorph
5Male3517680Ectomorph
Table 4. Statistical features for the transformation of CFR data.
Sr. NoFeatures Expression
1Minimum value Y m i n = m i n ( x k )
2Maximum of value Y m a x = m a x ( x k )
3Mean Y m = 1 N i = 1 N x k
4Standard deviation Y S D = 1 N 1 i = 1 N ( x k Y m ) 2 2
5Variance Y V = i = 1 n ( x k Y m ) 2
6Root mean square Y R M S = 1 N i = 1 N x k 2 2
7Peak to peak value Y P P V = Y m a x Y m i n
8Kurtosis Y K = 1 N k = 1 N ( | x k | Y M V ) 4 Y R M S 4
9Skewness Y S = 1 N i = 1 N ( | x k | Y M V ) 3 Y R M S 3
10Peak factor Y P = max ( x k ) Y R M S   ( i = 1 , 2 , , N )
11Interquartile range Y I Q = Q 3 Q 1
12Waveform factor Y W = N Y R M S k = 1 N | x i |   ( i = 1 , 2 , , N )
13FFT Y F F T = n = N N x ( n ) e j 2 π k N n
14Minimum frequency value Y f m i n = M i n ( Y F F T )
15Maximum Frequency value Y f m a x = M a x ( Y F F T )
16Spectral Probability Y S P = F F T ( k ) 2 i = N N F F T ( k ) 2
17Signal Energy Y E = n = N N | p ( k ) | 2
18Spectrum Entropy Y S E = i = N N p ( k ) ln ( p ( k ) )
Table 5. Information on the conducted breathing experiments.
Experiments InformationQuantity
Number of subjects5
Number of activities4
Number of each activity perform5
Time for each activity30 s
Number of experiments100
Number of USRP devices2
Number of PCs2
Number of antennas2
Number of classification algorithms3
Observations14,600
Data Size2 MB
Predictors18
Response classes4
Cross-validation5-fold
Table 6. Confusion matrix of human breathing experiments data.
AlgorithmsActual/PredictedNormalSlowFastDeep
KNNNormal36064400
Slow32361800
Fast00363812
Deep00123638
SVMNormal359916350
Slow193606241
Fast404535532
Deep3303644
Decision TreeNormal3446180222
Slow1663454246
Fast174361118
Deep0433543
Table 7. Performance of algorithms for human breathing experiments data.
AlgorithmsAccuracy (%)Prediction Speed (Obs/s)Training Time (s)
KNN99.3%~460,0003.431
SVM98.7%~43,000 75.72
DT96.9%~460,000163.83
Publisher’s Note: MDPI stays neutral with regard to jurisdictional claims in published maps and institutional affiliations.