1. Introduction
Sleep is a fundamental part of human life, and its deprivation results in many sleep disorders, which imposes adverse effects on an individual’s health. Lack of sleep may even result in the development of dementia and Alzheimer’s disease [
1]. Failing to have proper sleep may disrupt blood sugar levels to a level that a person would fall diabetic. Inadequate sleep may cause blockage of our coronary arteries, leading to cardiovascular disease, stroke, and congestive heart failure [
1]. Improper sleep significantly contributes to various other psychiatric conditions such as anxiety, depression, and even suicidality. Inadequate sleep may result in weight gain for adults and children. Dieting without proper sleep is ineffective and will result in loss of lean body mass instead of fat. Improper sleep may deteriorate the quality of life and shorten an individual’s life span [
1].
Researchers believe that sleep has persisted along for years of evolution and therefore it must be having some significant benefits. However, recent studies show that sleep serves us a multitude of functions helping both our brains and bodies. Sleep helps our brain by improving our ability to learn, memorize, and take decisions. Sleep also helps us in re-calibrating our emotional brain circuits, as a result of which we can plan better our day-to-day activities and handle psychological challenges. When we sleep, our brain receives a neurochemical bath, which helps in conciliating sore memories and a virtual reality space where the brain fuses past and present experiences and knowledge. Sleep helps our body by restrengthening our immune system, preventing infections and helps to fight malignancy. Sleep helps in ameliorating body’s metabolic stage by maintaining the balance of insulin and disseminating glucose. It also helps in controlling our body weight by regulating our appetite. Proper sleep also helps in lowering blood pressure and maintaining better heart health, leading to a healthy cardiovascular system. Recent sleep studies conclude that sleep is the single most effective thing we can do to reset our brain and body health each day [
1].
The first sleep disorder considered in this study is insomnia. Insomnia is characterized by difficulty in falling and/or staying asleep. According to International classification of sleep disorders—third revision (ICSD-3), insomnia is mainly classified into two types (i) short-term insomnia disorder and (ii) chronic insomnia disorder [
2]. Short-term insomnia lasts for a few weeks however if the symptoms last for at least three nights per week for more than three months then it is treated as chronic insomnia disorder. Approximately, 10–30% of total population experiences symptoms of insomnia. If the patients with co-morbid conditions are also included this number could be around 50% based on the severity and type of the disorder [
3]. Narcolepsy is another sleep disorder considered under the scope of this study. ICSD-3 has categorized narcolepsy under the category of central disorders of hypersomnolence, which are characterized by excessive daytime sleepiness. Recent classification of sleep disorders in ICSD-3 has further subdivided narcolepsy into two categories namely narcolepsy type-1 and narcolepsy type-2. Narcolepsy with hypocretin deficiency along with cataplexy is termed as type-1 narcolepsy. If the cerebrospinal fluid hypocretin-1 levels do not meet the narcolepsy type-1 criteria and cataplexy is also absent, then the condition is termed as narcolepsy type-2 [
2].
Nocturnal frontal lobe epilepsy (NFLE) can be regarded as a sleep ailment of varied etiology [
4] and it occurs during nocturnal sleep in the form of epileptic seizures, the CAP database contains total of 40 patients with NFLE (
Table 1). A total of ten patients have disorder of periodic leg movement (PLM) in the CAP database. ICSD-3 has classified PLM under the category of sleep-related movement disorders. The PLM can be regarded as a sleep disorder concerning repetitive and regular flexing or jerking of legs for about 20–40 s during the sleep. To diagnose the condition as PLM, the frequency of limb movement must be greater than 15 and five in an hour for adults and children, respectively. The prevalence of PLM is higher than the prevalence of epilepsy [
5]. The CAP sleep database contains recordings of 22 patients suffering from REM behavior disorder (RBD). ICSD-3 has classified RBD under the category of parasomnia, which is designated by loss of normal muscular tension and other abnormal behavior such as enacting dreams during REM sleep. Commonly, elderly males within the age group of 40–70 are the most common patients of RBD [
6,
7]. The CAP sleep database contains four patients with difficulty breathing during sleep and are categorized into sleep-disordered breathing (SDB). Obstructive sleep apnea (OSA), snoring, central sleep apnea, and hypopnea are collectively classified as SDB [
8].
In clinical practice, a questionnaire-based conventional method is used under which the patient is kept in the surveillance of doctors for months of duration. Conventionally, the Pittsburgh sleep quality index (PSQI) is used to evaluate the quality of sleep [
9]. In PSQI, sleep quality is assessed using a self-report questionnaire over a one-month time interval, and questions are related to the psychometric properties of sleep quality. Generally, questionnaires include questions on sleep duration, daytime sleepiness, caffeine intake, snoring, breathing problems during sleep, body mass index, and blood pressure. Answers to these questions are very subjective and memory-based, and prone to human errors. The diagnostic procedure also includes keeping a sleep log or sleep diary for the past 15 or 30 days. The doctor decides the type of sleep disorder based on the patient’s answer to the sleep questionnaires and entries registered in the sleep log. Presently, polysomnography (PSG) is a conventional method to diagnose and treat sleep-related disorders. PSG methods use several electrodes and wired sensors to record various physiological events of a patient such as brain waves using EEG, heart rhythms using electrocardiogram (ECG) [
10], muscle movements using electromyogram (EMG), eye movements using electrooculogram (EOG), blood oxygen saturation (SpO2), and nasal airflow using thermistors. A medical practitioner observes the overnight PSG recording of a patient and performs the diagnosis of sleep disorders. Due to several sensors, electrodes, and complexity, the PSG procedure is costly, time-consuming, and inconvenient for patients and may be inapt to clinicians.
The EEG signals available in the CAP sleep database are labeled according to R & K criterion [
11] as widely used earlier for sleep stage scoring. In R & K criteria of sleep stage scoring, sleep is divided into six sleep stages: wake (W), S1, S2, S3, S4, and rapid eye movement (REM). In the CAP database, R & K guidelines are used to score EEG signals; however, to meet with the updated AASM guidelines on sleep scoring, we have grouped the stages S3 and S4 together to form the N3 sleep stage. According to AASM guidelines [
12], the sleep of an individual is divided into five sleep stages, namely wake (W), N1, N2, N3, and rapid eye movement (REM) [
13,
14]. The sleep stages N1 and N2 are collectively called light sleep, and the N3 sleep stage is also called deep sleep. All three N1, N2, and N3 together are called non-rapid eye movement (NREM) sleep. In NREM sleep, the eyes remain still, while in the REM sleep stage, the eyes move very rapidly. NREM sleep stage constitutes around 75–80%, while REM sleep constitutes the remaining 20–25% of the total sleep duration. Both REM and NREM jointly form one sleep cycle of approximately 90 min duration. Around 4–5 sleep cycles occurs per night in the case of an adult.
Often, PSG-based techniques are employed to detect primary sleep disorders. Sometimes brief questionnaires are also used to detect insomnia [
15] and RBD [
16]. In the existing literature, some studies conducted on the automated identification of sleep disorders are scant. Majority of the studies are focused on the detection of sleep stages [
13,
17,
18]. Stephansen et al. [
19] used neural networks to develop an automated sleep-scoring algorithm to diagnose narcolepsy. Espiritu et al. [
20] have used PSG data to identify sleep-related disorder events such as arousal and leg movements automatically. However, they have used only one subject to carry out their study. They have obtained the highest accuracy of 90.57%, 88.39%, and 89.79% for arousal detection, left leg movement, and right leg movement detection, respectively, using a decision tree classifier. David et al. [
21] have developed an automated system to identify SDB related events. They have used power spectral density (PSD) estimation for feature extraction and obtained an overall accuracy of 85%.
Recently, Sharma et al. [
22,
23] have used ECG and EEG signals separately to identify insomnia and obtained the best accuracy of 97.87%. A similar study using ECG signals and CAP sleep database, spectral features for automatic identification of healthy subjects, and three sleep disorders (insomnia, RBD, and SDB) are used. The overall accuracy of 86.27% is obtained [
24]. Shahin et al. [
25] have used Hjorth parameters and deep neural network approach for the automated identification of insomnia and obtained an overall accuracy of 92%. Mehrnoosh et al. [
26] have developed a method for detecting Alzheimer’s disease using Hjorth parameters and EEG signals. Our study has used a novel triplet half-band filter (THFB) based on Hjorth parameters features of EEG signals to identify six different sleep disorders jointly and simultaneously. The study not only helps in discriminating good sleepers from sleep-disordered patients but also identifies the type of sleep disorder the patient is suffering from. The main features of our study are as follows:
The proposed method is accurate and efficient as we have considered EEG signals for the automated identification of various sleep disorders. Additionally, we have tried to simplify the method using only two EEG channels. The EEG channels are combined to obtain better results.
To perform our study, we have used the publicly available CAP sleep database containing data from many sleep disorders. Hence, we have obtained the classification results of a maximum number of sleep disorders.
We have used Hjorth parameters that are considered prominent in analyzing EEG signals for feature extraction and are computationally less expensive than other non-linear features.
We have used a novel THFB for obtaining subbands of EEG signals. The THFB is computationally less expensive than the conventional biorthogonal wavelet filter banks.
We have used the individual sleep stages W, N1, N2, N3, REM as well as their combinations N1 + N2 (light sleep), N1 + N2 + N3 (NREM), and W + N1 + N2 + N3 + REM (all stages) for the classification of sleep disorders. Hence, we have implemented both sleep stage-dependent and sleep stage-independent classification schemes. Hence, our developed model can identify disorders based on sleep stages without segmentation of EEG into sleep stages.
The subsequent portion of the paper is framed as follows.
Section 2 portrays the material used for the study.
Section 3 details the methodology, including preprocessing, filter bank, wavelet decomposition, feature extraction, and classification involved in our research.
Section 4 delineates the results obtained for binary classification of a healthy and sleep-disordered patient as well as seven-class classification of sleep disorders.
Section 5 presents a discussion, and we concluded the paper in
Section 6.
2. Material Used
In the CAP sleep database, there is a total of 108 PSG recordings. The PSG signals have been recorded at the Sleep Disorders Centre of the Ospedale Maggiore of Parma, Italy. It contains multiple EEG montages, EOG (Electrooculogram) channels, one ECG (Electrocardiogram), submentalis muscle EMG (Electromyogram), two EMG channels, and respiration signals. The 10–20 international system has been used for capturing EEG recordings, and the following channels were recorded: C3/C4, F3/F4, O1/O2 referenced to A1/A2. Additional channels, namely F4-C4, F3-C3, Fp1-F3, P3-O1, C3-P3, C4-P4, Fp2-F4, and P4-O2, are also present. The EEG channels F4-C4, and C4-A1, which are sampled at 512 Hz frequency, have been employed in this study. The maximum number of PSG recordings possess these two channels. The CAP sleep database comprises healthy subjects and patients suffering from seven types of sleep disorders: NFLE, insomnia, narcolepsy, bruxism, PLM, RBD, and SDB. In this study, we have considered patients who contained EEG recordings sampled at 512 Hz sampling frequency. However, only one subject with a 512 Hz sampling frequency is available for bruxism, and the PSG recording for this patient seems ambiguous. Therefore, we have not considered bruxism disorder in this study. The average age of healthy, insomnia, narcolepsy, NFLE, PLM, RBD, and SDB subjects used in this study is 32, 59, 32, 30, 54, 70, and 78 years, respectively. The range in which the age of all subjects varies is 14–82 years, with an average age of 45 years. Around 58% of the subjects are male (45), and 41% are female (32) out of 77 subjects used in this study. It can be observed that the CAP sleep database mainly represents data of elderly subjects. Hence, our work can significantly help to detect sleep disorders in older subjects.
Table 1 shows the epochs corresponding to different sleep stages of healthy and different disordered subjects used in this study. The epochs of SDB patients are less and comparatively higher than others for NFLE and RBD patients.
3. Methodology
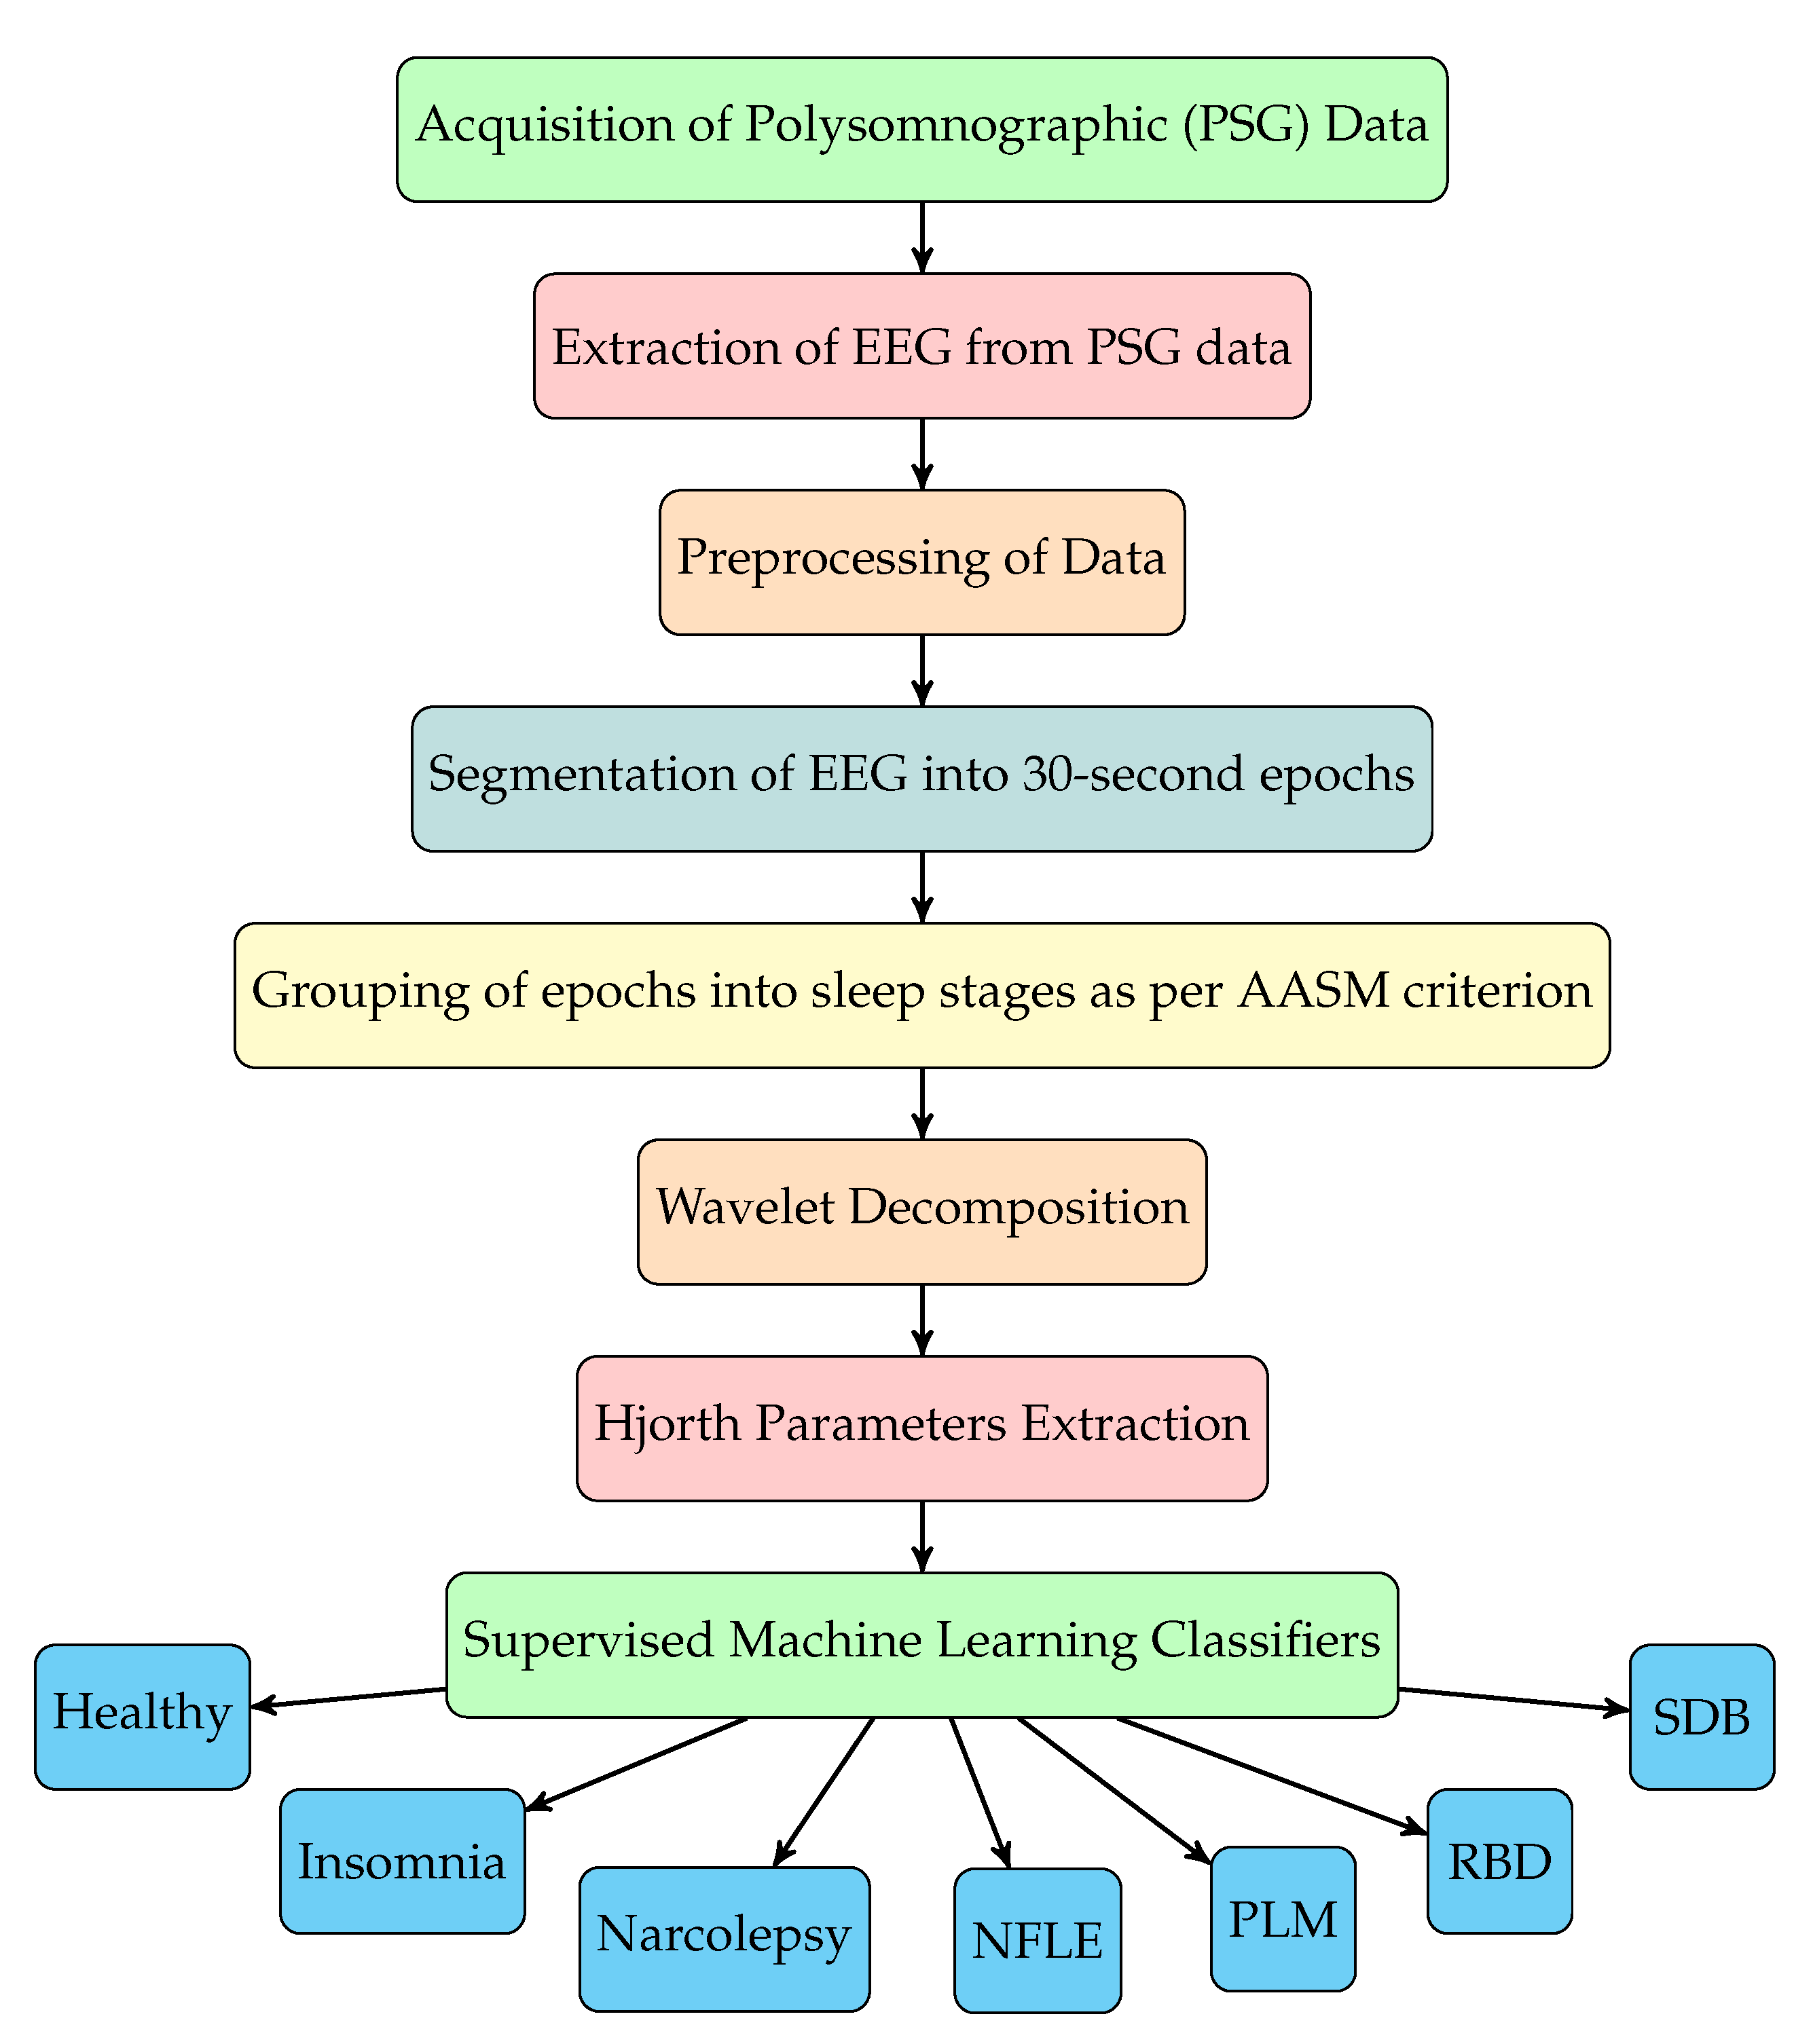
The sequence of steps involved for sleep disorder classification using our method are depicted in the flowchart shown in
Figure 1. The EEG signals are first filtered and then segmented into sleep stages according to annotations of sleep stages given in the database. The annotations are given in the form of each EEG epoch (30 s duration of EEG signal) labeled with a sleep stage. Epochs of EEG signals of disordered patients are grouped into different sleep stages and then combined with healthy EEG epochs. After preprocessing, we have used novel triplet half-band filter pair to perform wavelet decomposition of EEG signals. From seven level wavelet decomposition, eight subbands corresponding to each EEG epochs are obtained. Subsequently, we have extracted Hjorth parameters (activity, mobility and complexity) from each subband. These features are then fed to various supervised machine learning classifiers for the automated discrimination of healthy subjects and disordered patients, and the type of sleep disorder. The complete study with experimentation and model training was performed using MATLAB R2020a installed on a Windows Server 2019 equipped with Intel Xeon E5-2690 v3 CPU @2.6 GHz (6 cores), an Nvidia K80 GPU with 12 GB Graphics memory, and 56 GB RAM.
The sequence of steps involved for sleep disorder classification using our method are depicted in the flowchart shown in
Figure 1. The EEG signals are first filtered and then segmented into sleep stages according to annotations of sleep stages given in the database. The annotations are given in the form of each EEG epoch (30 s duration of EEG signal) labeled with a sleep stage. Epochs of EEG signals of disordered patients are grouped into different sleep stages and then combined with healthy EEG epochs. After preprocessing, we have used novel triplet half-band filter pair to perform wavelet decomposition of EEG signals. From seven level wavelet decomposition, eight subbands corresponding to each EEG epochs are obtained. Subsequently, we have extracted Hjorth parameters (activity, mobility and complexity) from each subband. These features are then fed to various supervised machine learning classifiers for the automated discrimination of healthy subjects and disordered patients, and the type of sleep disorder.
3.1. Preprocessing
We have removed data of an initial 3-min. duration from all the recordings for performing wavelet analysis. Filtering of EEG signals was performed to eliminate noise and keep only the required information, and normalization of EEG signals was carried out to obtain identical amplitude levels. We segmented EEG signals into 30-s epochs. Each epoch of EEG signal comprised of 15,360 samples sampled at 512 Hz. These epochs are then labeled with sleep stages.
Filtering for Noise removal: Conventionally, EEG signal is divided into various band of frequencies namely delta(
), theta(
), alpha(
), beta(
) and gamma(
) with frequency range of 0–4 Hz, 4–8 Hz, 8–13 Hz, 13–30 Hz and above 30 Hz, respectively. To retain the useful information and for removal of noise [
27,
28], as per AASM criterion [
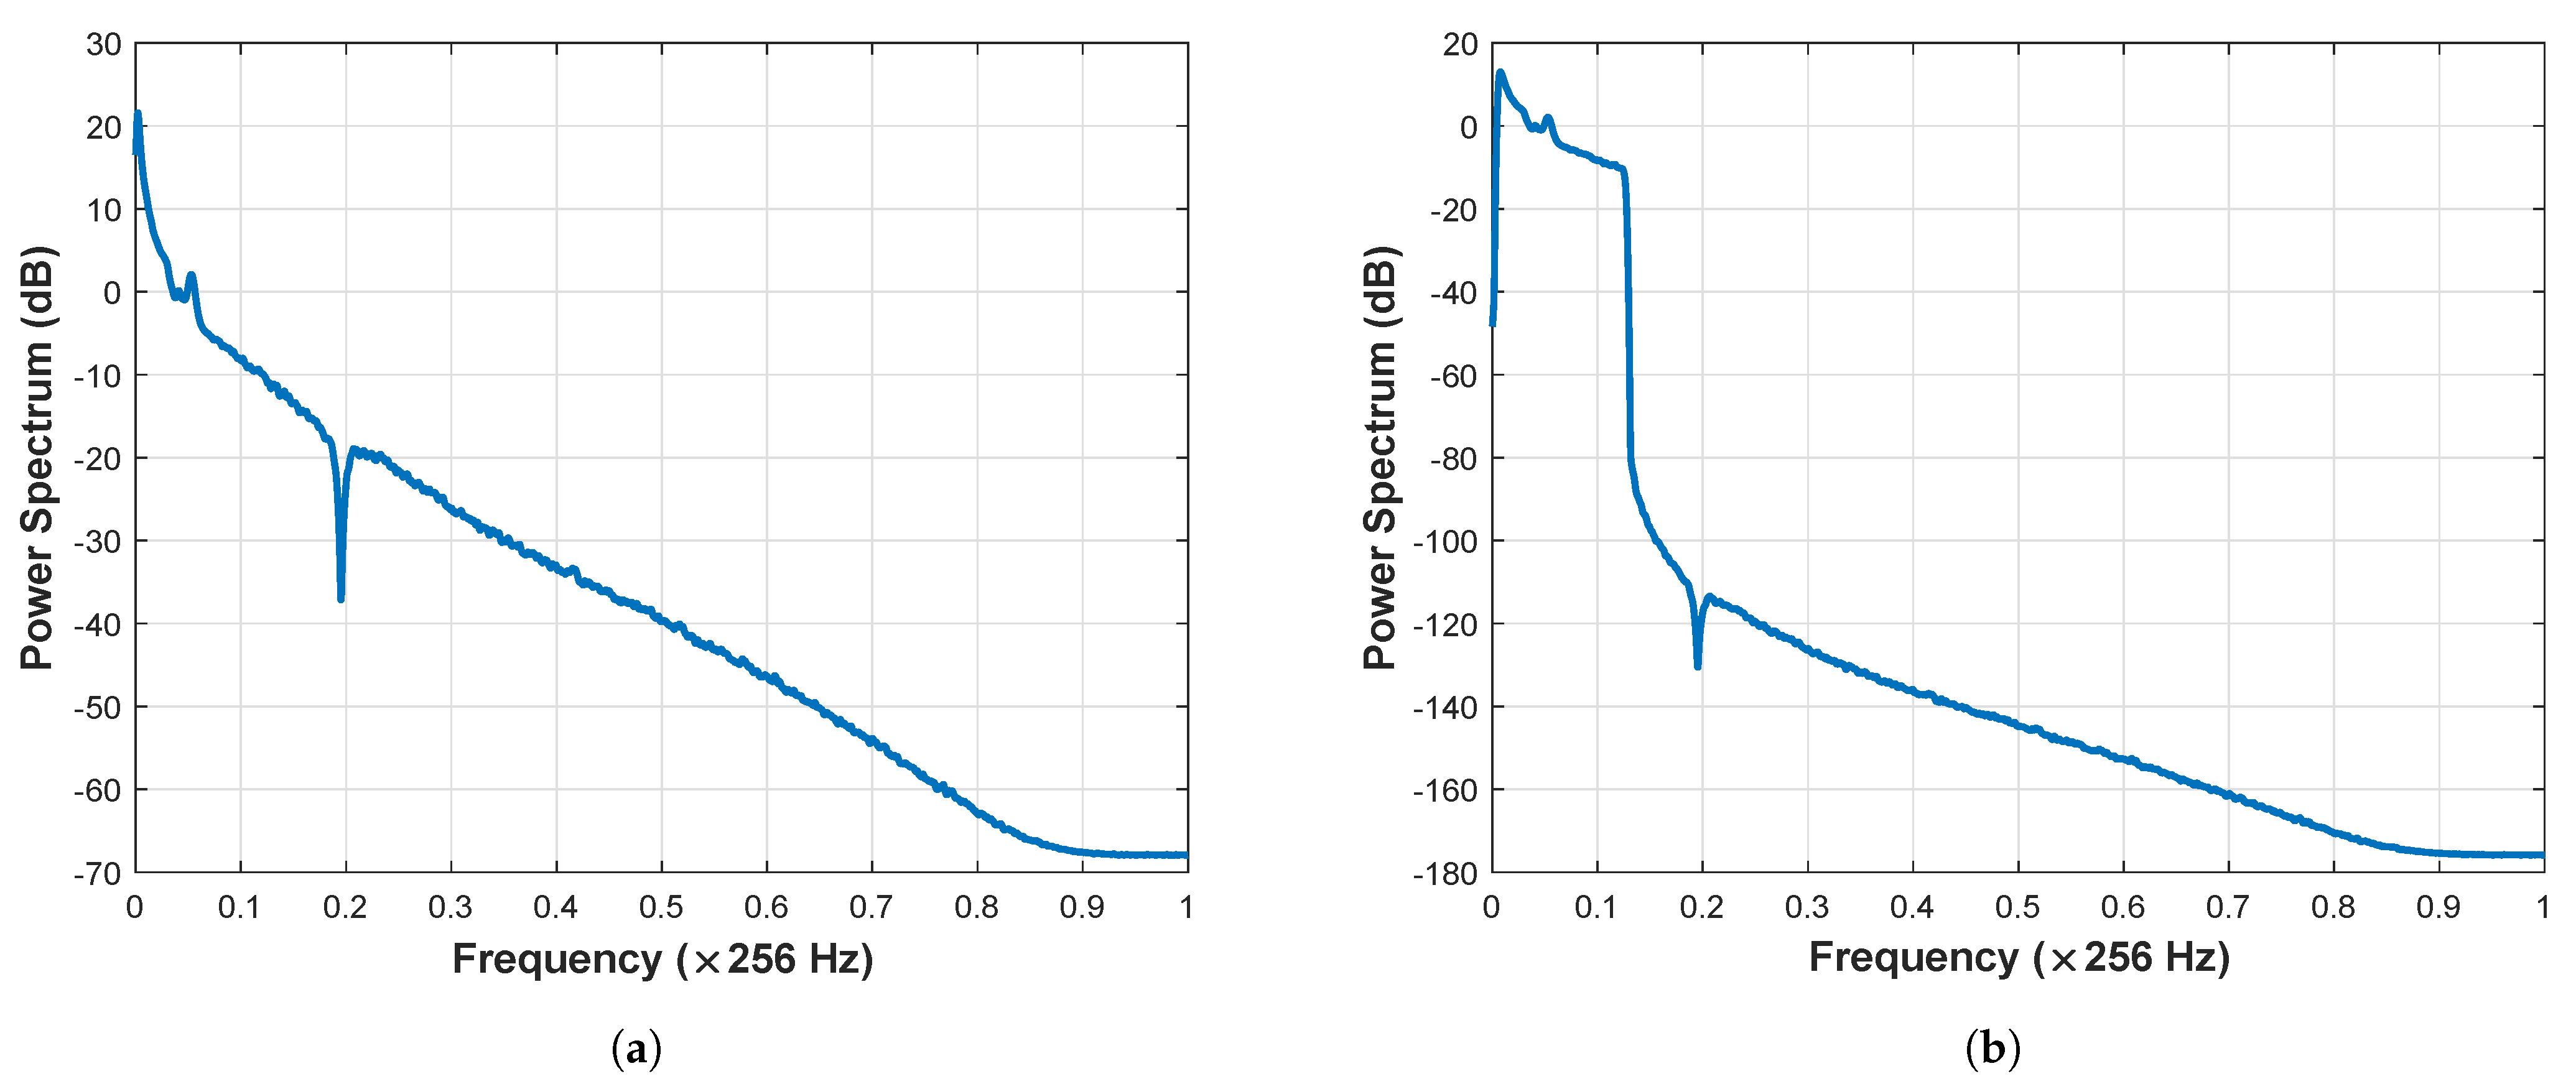
12], we have band-pass filtered the EEG signal using a finite impulse response (FIR) filter with Kaiser window. Only frequencies above 1 Hz and below 35 Hz were retained in our study.
Figure 2a,b displays the power spectrum of raw and filtered EEG signal, respectively. The filtered EEG signals are then standardized to make them centered at zero with a standard deviation of 1. This is done to take care of the differences in recording equipment and to make the data easily trainable.
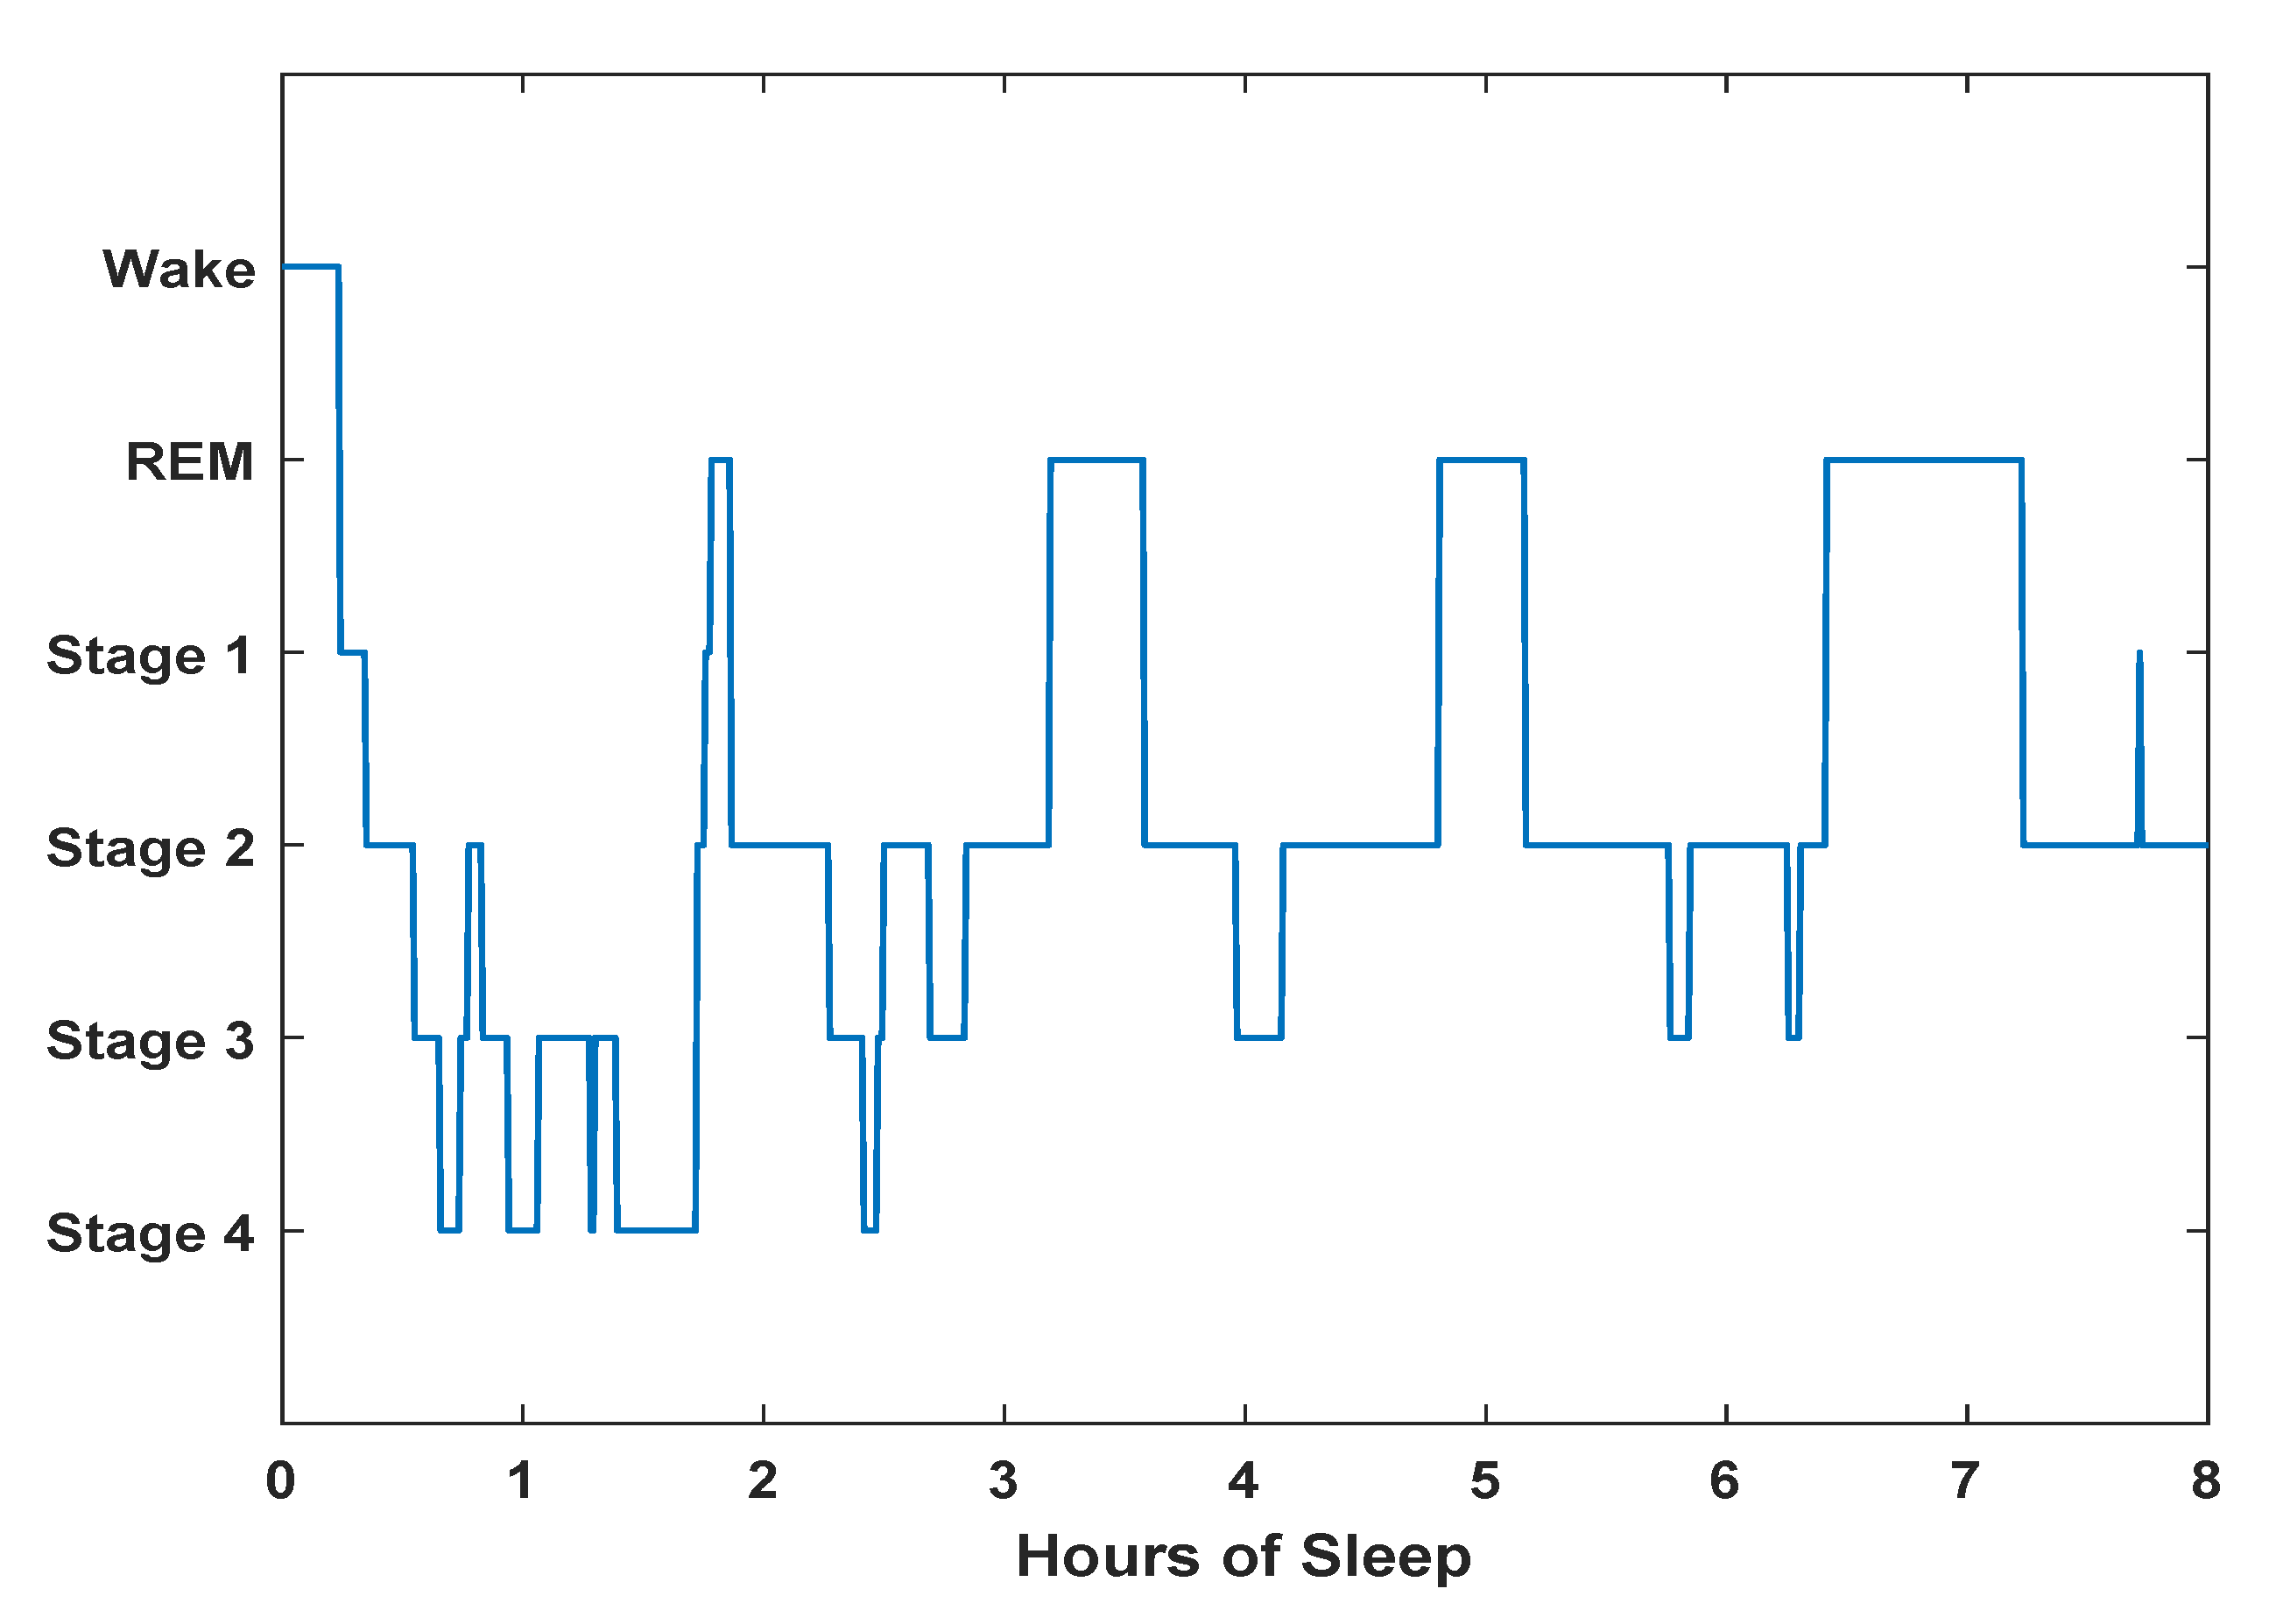
Segregation of sleep stages from EEG signals: In our study, we have divided EEG signal from each subject according to sleep stages. The CAP sleep database contains annotation files along with the signal recordings. The annotation files contained labels corresponding to 30s epochs of EEG signals as per the R&K rules [
11] and the sleep stage scoring is done by six trained sleep experts. We have removed data of initial 3 min duration from all the recordings. We have generated the hypnogram for each subject and
Figure 3 shows one such hypnogram of a healthy subject. The hypnogram is a graph that depicts sleep stages as a function of sleep time in hours. It is an easy way to represent the brain wave activity using EEG signals. We grouped the 30s epochs into five sleep stages with the help of annotations in the hypnogram.
Table 1 shows number of epochs pertaining to each sleep stage for all the subjects used in study.
3.2. Triplet Half-Band Filterbank and Wavelet Decomposition
EEG signals are non-stationary in nature and hence traditional time domain and frequency domain techniques based on Fourier transform cannot analyze them. Contrary to this, the wavelet-based techniques are considered to be an excellent choice for the analysis of non-stationary signals. This encouraged us to use a wavelet-based technique for the analysis of EEG signals [
29,
30,
31]. Hence, in this work we have used a new class of biorthogonal filterbanks [
32,
33,
34,
35,
36,
37,
38] named triplet half-band filterbank (THFB) with the parametric Bernstein Polynomial developed by Tay et al. [
39].
Tay et al. [
39] have designed a novel class of filter bank which has structural perfect reconstruction (PR) and regularity property [
40,
41]. This filter bank is designed using three simple half-band filters. These filters can be designed easily and have certain desirable properties [
42]. This filterbank designed with the help of three half-band filters is known as triplet half-band filterbank, which overcomes the limitations of the halfbank pair filterbank [
43]. In this study, we have used THFB in which regularity and sharpness of filters can be controlled using parametric Bernstein polynomial. The filterbank has been designed using least square approach. The filters are designed with the objective of minimizing passband and stopband errors. The optimization problem is a constrain optimization problem subjected to PR and regularity conditions [
29]. The optimization problem has been solved iteratively to obtain optimal parameters of Bernstein polynomial.
Earlier Phoong et al. [
43] have developed a class of biorthogonal filter bank called half-band filterbank (HPFB) with certain special features namely structural PR and regularity. However, HPFB had some limitations, such as the restriction in frequency response because of the analysis low-pass filter being a half-band filter, in which the magnitude responses of the analysis and synthesis low-pass filters at
needs to be
and 1.0, respectively. However, for THFB, the frequency response at
can be set to any desired value. The advantage of using THFB and Parametric Bernstein Polynomial is that one can impose conditions of PR and regularity structurally and the design is more flexible than the corresponding HPFB. Therefore, in this study we have used THFB to obtain the subbands of EEG signals.
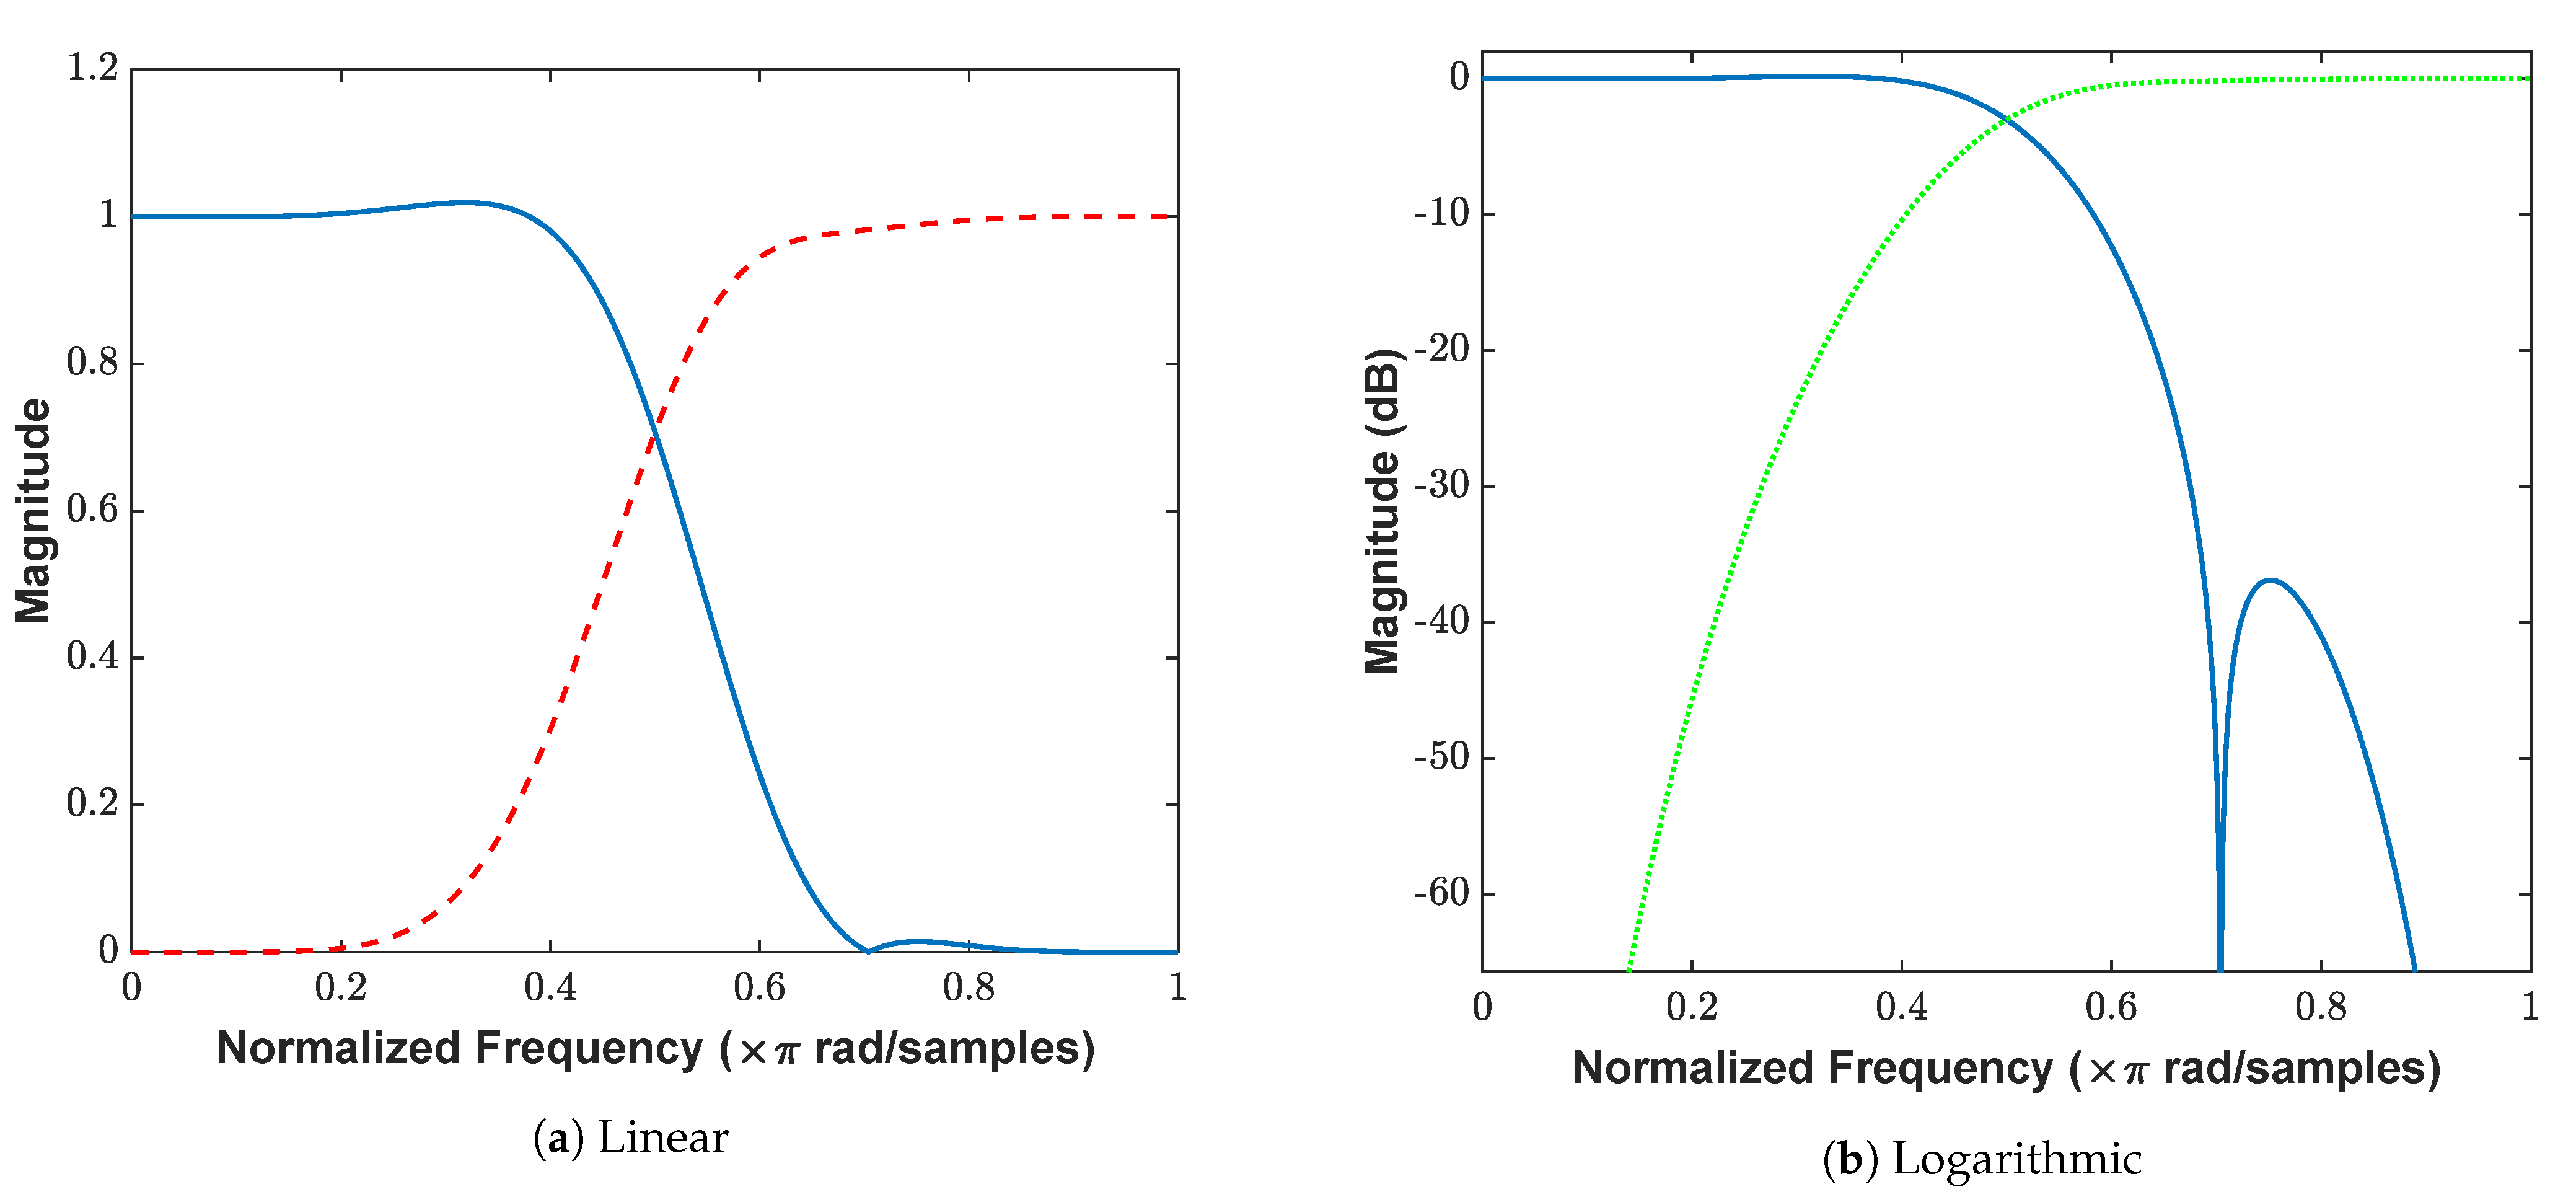
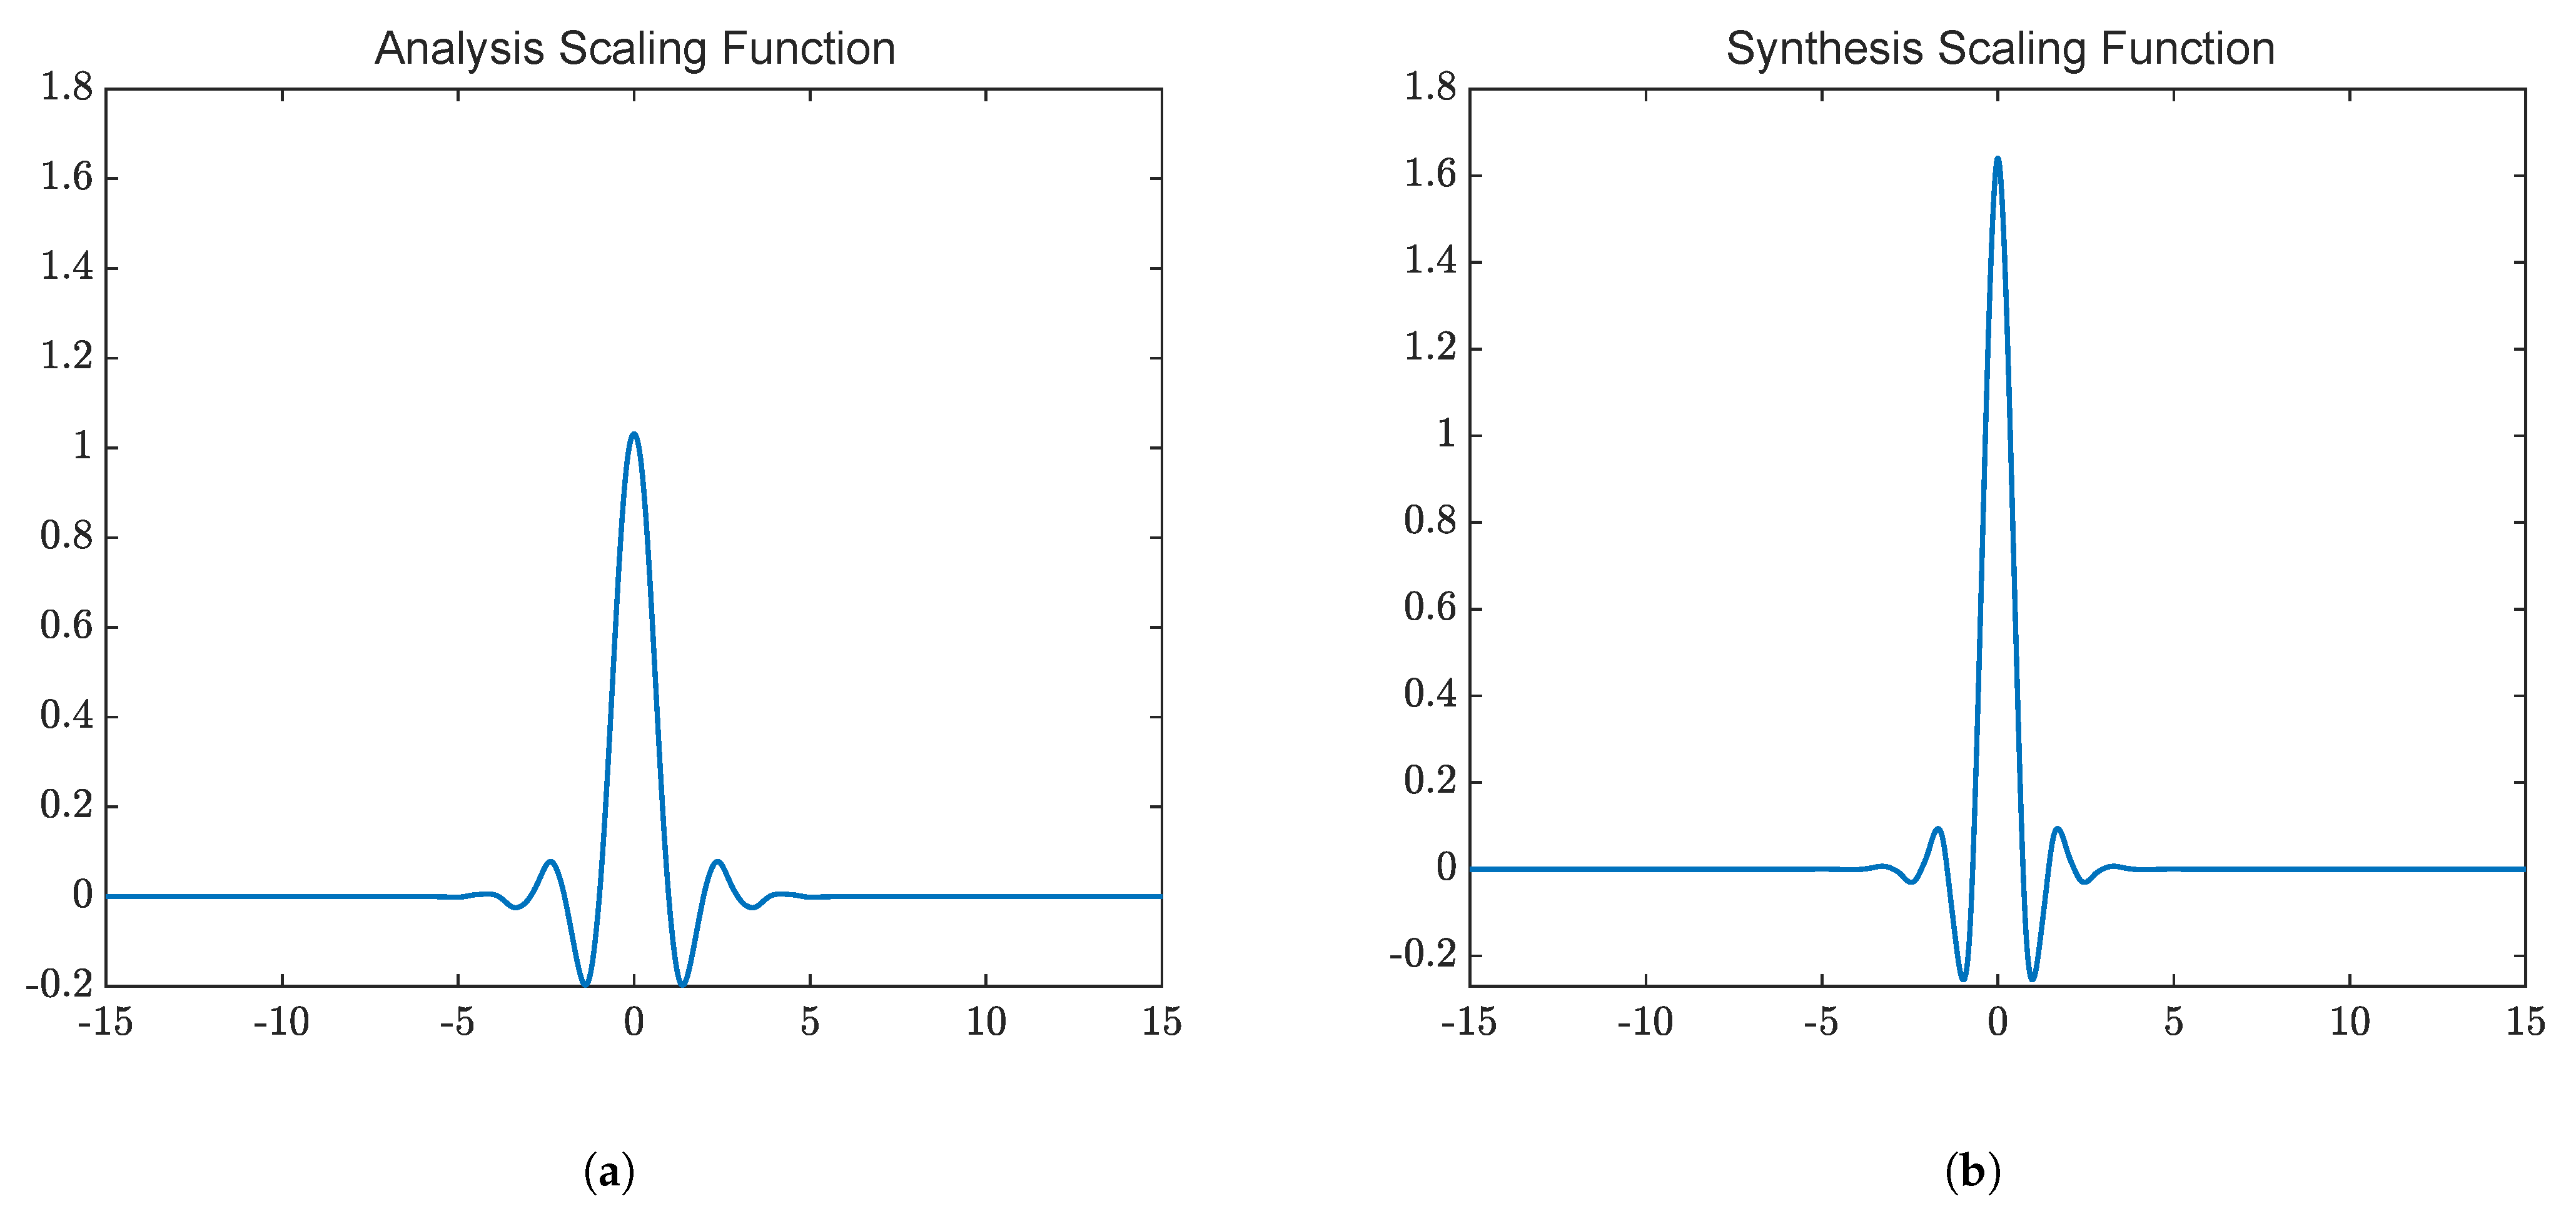
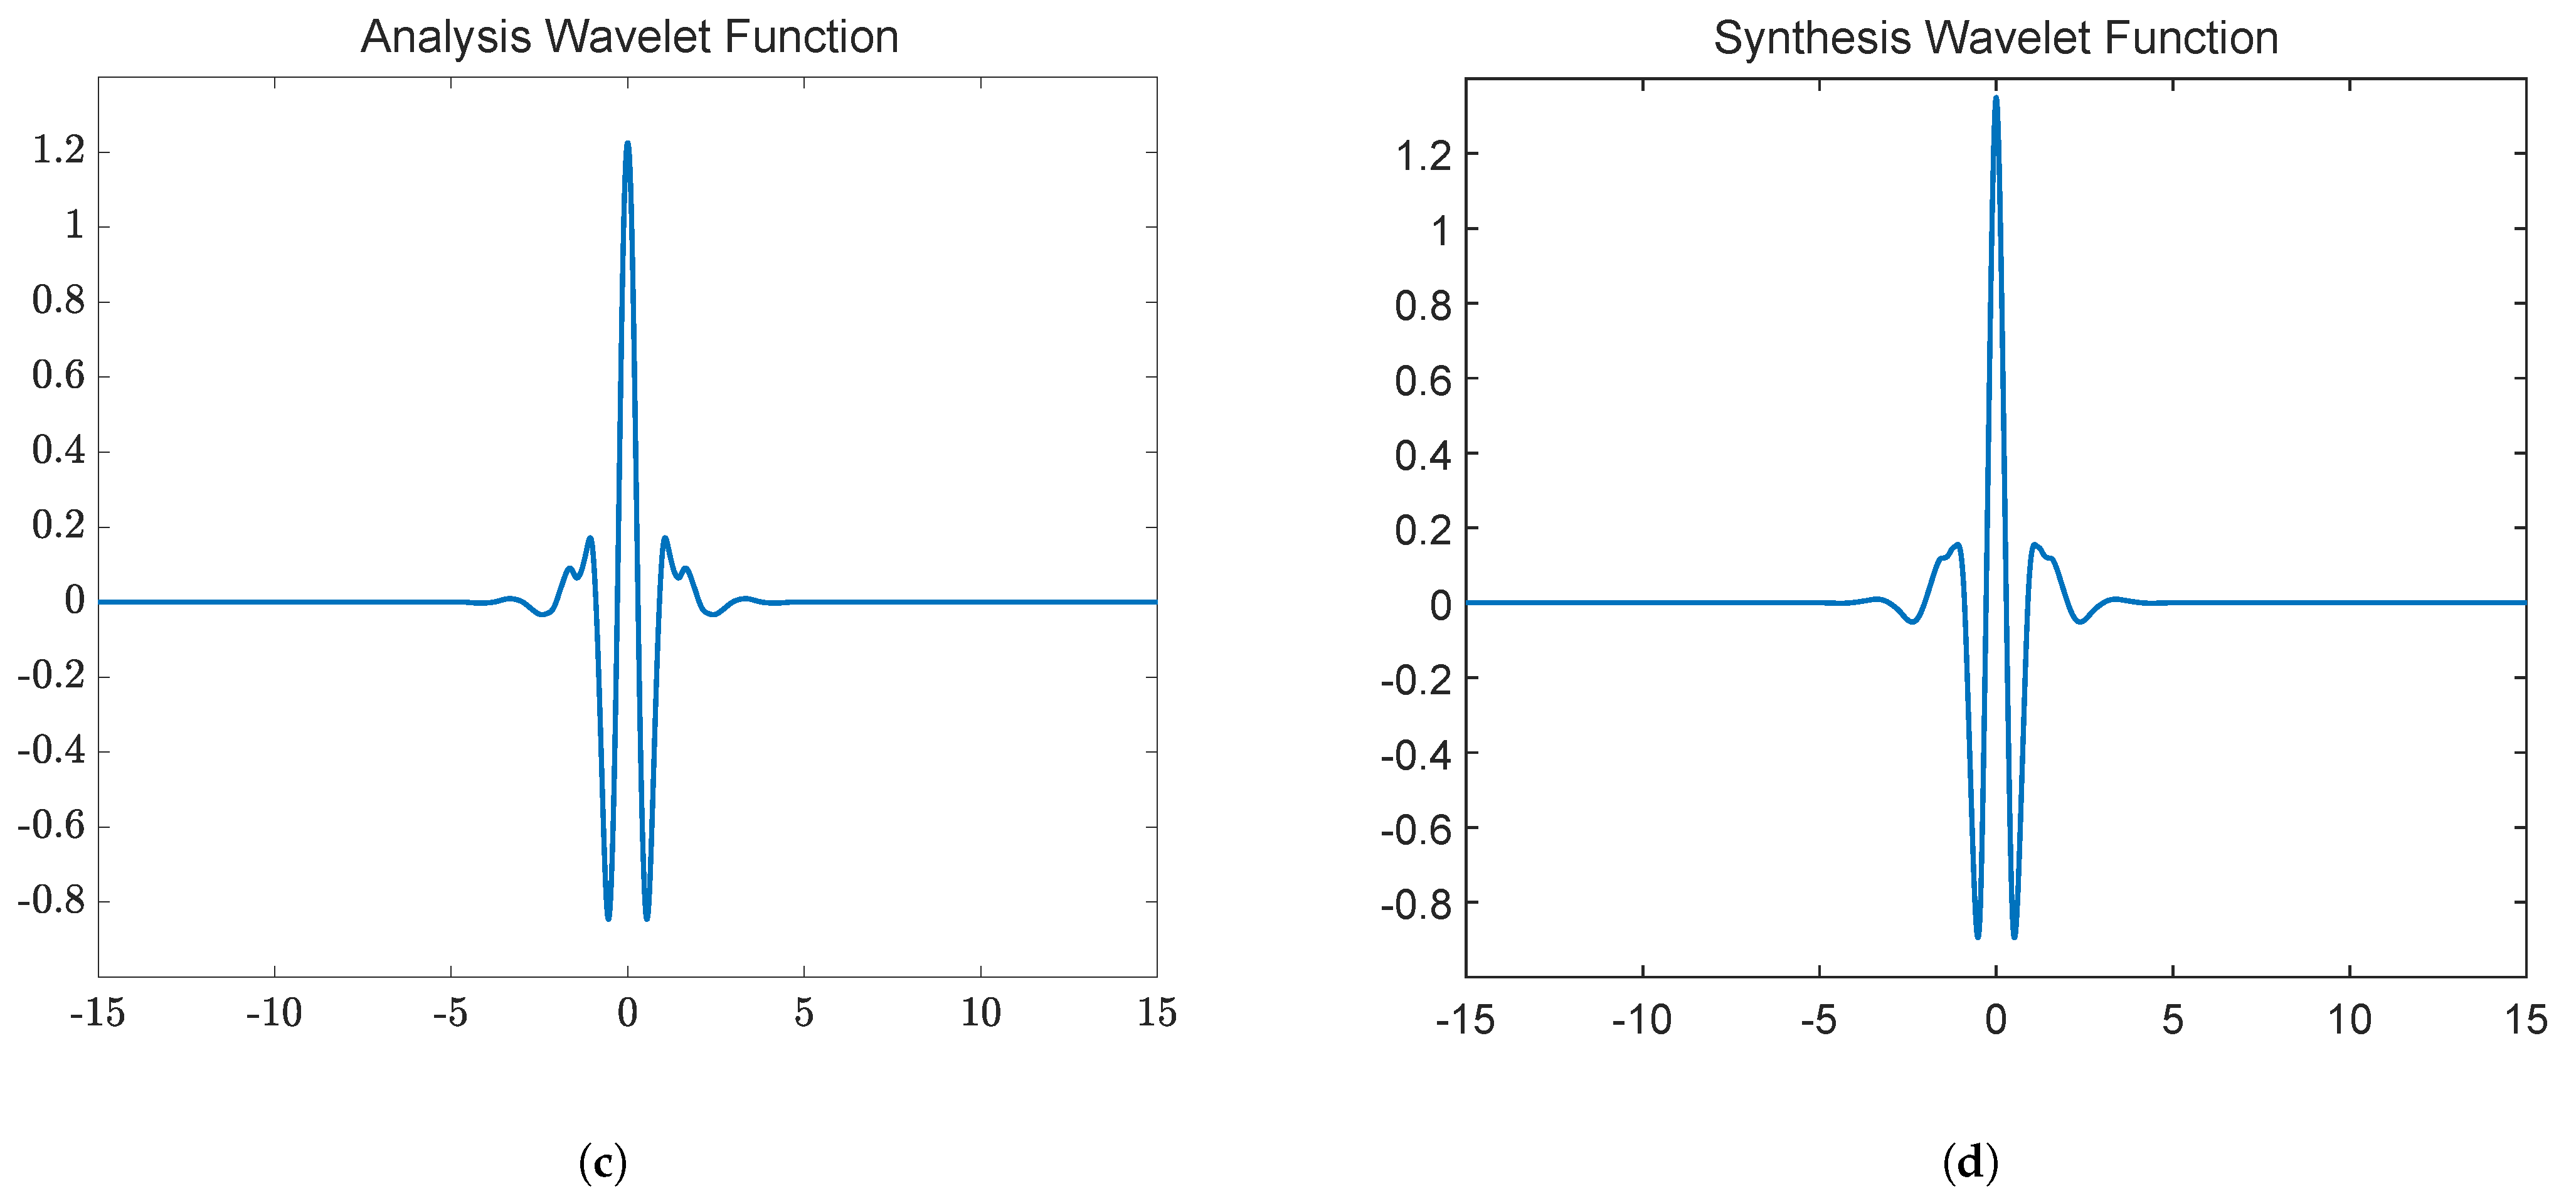
In this study, we have used analysis and synthesis filters of orders 28 and 38, respectively. The order of regularity chosen for both filters is fixed.
Figure 4 shows frequency responses of the filters. We have used cascade algorithm to generate scaling and wavelet functions (
Figure 5).
The wavelet decomposition is performed using above-mentioned THFB filterbank. We chose seven decomposition levels as the maximum frequency component present in the EEG signal is 256 Hz. We have obtained total eight subbands, one for approximation coefficients and seven for detail coefficients. Then, time-domain Hjorth parameters are computed from these eight subbands.
3.3. Feature Extraction: Hjorth Parameters
In the proposed study, we have used Hjorth parameters features representing time-domain specifications of EEG signals and are widely used in EEG signal processing applications. The three parameters, namely activity, mobility, and complexity derived by Hjorth, are used for the analysis of EEG signals. These parameters jointly describe the patterns of EEG signals concerning magnitude, time-frequency scale, and complexity [
44]. The Hjorth parameters are defined as follows:
Mathematically, Hjorth activity is the squared standard deviation (energy) of a time series. It represents the mean signal energy. For a signal
, the activity can be defined as given in Equation (
1).
The Hjorth mobility provides an estimate of mean frequency of the signal. It is proportional to the standard deviation of power spectrum of the signal. For a signal
, it is defined as the square root of the ratio of variance of the first derivative of the signal to the variance of signal, as shown in Equation (
2).
The Hjorth complexity compares the shape of the signal with respect to a pure sinusoidal signal and represents the deviation in frequency. The value of complexity ranges between 0 and 1, where 0 represents minimum similarity and 1 represents maximum similarity with pure sine wave. It gives good estimate of bandwidth of the signal. For any signal
, it is defined as the ratio of the mobility of the first derivative of the signal to the mobility of signal and is given by Equation (
3).
3.4. Classification and Validation
Three Hjorth parameters are extracted from all eight subbands to obtain 24 time-domain features using single-channel EEG signals. We have used Statistics and Machine Learning Toolboxes available in MATLAB R2020a for developing the model. All features are trained using multiple supervised machine learning classifiers [
45,
46] namely ensemble bagged trees (EBT), ensemble boosted trees (EBooT), support vector machines (SVM), and K-nearest neighbor (KNN) using ten-fold cross-validation (CV) to avoid overfitting problem. We have used the trial-and-error approach for selecting an optimal algorithm as a priori it cannot be predicted, which algorithms will perform well for the given database, and found the classifier with the best classification performance. Having searched the best classifier out of all the classifiers available in the toolbox, we tuned the hyperparameters of the selected classifier to enhance its performance further. Among all classifiers used, we observed through our extensive simulations that EBT and EBooT performed the best and yielded maximum classification performance for most of the classification task. It is also in line with the theory that ensemble techniques would better predict the individual member. In the ensemble technique, a bunch of weak learners is combined to form a strong-learner, resulting in the overall increase of the model’s performance. Many decision trees classifier are involved in achieving a higher performance than the single decision tree classifier. Pivotal advantage of employing ensembles is to have improved average classification performance over any other contributory individual member of the ensemble. As we have used a large number of epochs and the data are imbalanced, ensemble methods are highly reliable and capable of generating a robust model by effectively reducing the problem of overfitting.
Ensemble Bagged Trees: In the bagging algorithm, multiple subsets of training data are selected on a random basis with replacement, and then each subset is employed for training a decision tree. Overall performance is obtained from the average of all the predictions made using different decision trees. The central aim of using the bagging algorithm is to minimize the variance of the decision tree classifiers. The bagging algorithm handles higher-dimensional data very well and significantly reduces the overfitting of the model [
47,
48].
We noticed the variation in the misclassification error rate with respect to the number of splits and the maximum number of trees. The number of splits is changed iteratively from 1 to with a step size of 100, and the number of trees is varied from 20 to 200. In this work, m denotes a total number of epochs (m = 18,710 for N3 dataset in seven-class classification). We obtained the optimum number of learners equal to 30, the number of splits equal to (i.e., 18,709), and the learning rate equal to 1.
Ensemble Boosted Trees: In this technique, random samples of the training data are used to train simple decision trees, and then errors are analyzed. Weights of the misclassified inputs are increased to increase the chances of obtaining previously misclassified input that is correctly classified in the next iteration. Boosting algorithm aims to improve the accuracy by increasing the misclassification cost with every iteration, and thus it converts weak learners to perform as better models [
47,
48].
K-Nearest Neighbor (KNN): It is one of the most straightforward supervised machine learning algorithm which can be used for classification and regression [
49]. In this algorithm, we need to select the value of K (generally, 5). Then we calculate the Euclidean distance between K neighbors, take the K-nearest neighbors according to the calculated Euclidean distance. The data point under consideration belongs to the category which contains the maximum number of nearest neighbors.
Support Vector Machines (SVM): It is a robust supervised learning algorithm, which can be employed for binary and multi-class classification or regression. These are widely used in speech and image recognition, natural language processing, and computer vision [
50,
51]. The SVM works on the principle of maximizing the margin between two classes. To maximize the separation gap among the two groups in the data, an optimal hyperplane as a decision surface is created that optimally separates the data into two distinct classes.
In this work, we have performed automated identification of six sleep disorders using C4-A1 and F4-C4 EEG channels. We used EEG recordings of six healthy subjects and 74 patients with above-mentioned sleep disorders. A total of 78,853 epochs (30 sec duration each) were used in this study. A detailed summary of individual epoch count is shown in
Table 1. In this study, six binary classification tasks are considered to discriminate healthy and sleep disorder subjects. Furthermore, we have considered seven-class classification problem to identify the type of sleep disorders.
5. Discussion
In the literature majority of studies are focused on automated identification of sleep stages. In this paper, we proposed a novel approach to automatically identify six sleep disorders using two EEG channels (C4-A1 and F4-C4 ). We have obtained the classification results using individual EEG channels as well as their combination. It can be observed that the classification results improved when combination of both EEG channels are used. Our proposed model not only classify the healthy and sleep-disordered subjects but also identified the type of sleep disorder. We observed that in many case N3 sleep stage can classify better than others.
Espiritu et. al. [
20] have developed a method using EEG signals for automatic identification of obstructive sleep apnea (OSA) [
52,
53] and restless leg syndrome (RLS). They have used two types of disorders (arousal and leg movement events) to discriminate between OSA and RLS. For classification purposes, they used a decision tree classifier and achieved a maximum accuracy of 85.02%. Another study proposed by David et al. [
21] focused on identifying only SDB patients. To achieve this task, they have used EEG signals and power spectral density (PSD) estimation and principal component analysis (PCA). They have performed the classification using support vector machines (SVM) classifier and obtained an accuracy of 85%.
Table 12 shows the summary of comparison of our study with other existing studies on sleep disorder identification. Widasari et al. [
24] have performed a study on the classification of healthy subjects and three sleep disorders (insomnia, RBD, and SDB) using the CAP sleep database. Their study mainly focused on classifying these disorders using ECG signals and spectral features based on sleep quality parameters. They have used ensemble bagged trees classifier and obtained an accuracy of 86.27%. Although their method obtained significant accuracy, they have performed only four-class classification between healthy subjects and mentioned three disorders. Their study has used 51 subjects, while in our study, we have used 78 subjects comprising six sleep disorders using EEG signals with 512 Hz sampling frequency. It can be observed from the comparison table that we have achieved the highest accuracy for the seven-class sleep disorder classification.
To compare our study with the work done by Widasari et al. [
24], we have also performed four-class classification for the identification of healthy, insomnia, RDB, and SDB subjects. We have obtained maximum classification accuracy of 96.5% with the EBT classifier.
The main features and advantages of our method are as follows:
To the best of our belief, the proposed study is the first study ever undertaken to detect six sleep disorders simultaneously and jointly.
The method used only three Hjorth parameters, which require less computational time, so feature extraction is fast.
The model has yielded high classification performance due to the employment of optimal THFB wavelet-based Hjorth features. The high performance indicates promising discriminating abilities of the optimal wavelet-based features. These highly discriminatory features can be employed in the automated identification of sleep stages, mental disorders such as depression, schizophrenia, Parkinson’s disease, Alzheimer, Dementia, etc.
We have used EEG signals for sleep disorder identification which are proven to be the standard for brain-related studies. Additionally, our developed method is simple, accurate, and can be implemented in real-time applications.
It can be concluded from our results that it is possible to classify sleep disorders using EEG signals alone with high classification performance.
Considering the non-stationary nature of EEG signals, we employed a wavelet-based technique that employs a triplet half-band biorthogonal wavelet filter bank to analyze EEG signals.
We have used a publicly available CAP sleep database so that the work can be reproduced, and other interested researchers may use the data and compare their results with us. Additionally, the database contains PSG recordings of 108 subjects, including six different sleep-disordered patients as well as healthy subjects of 906 hrs of duration.
It can be noted that the PSG recording can be captured only in sophisticated sleep labs and needs trained clinicians for the acquisition of various physiological signals. Hence, creating a private database that includes such many subjects and a wide variety of different sleep disorders is highly time-consuming, complex, vulnerable to errors, challenging, and costly task. Additionally, no research group has used this data to identify sleep disorders using EEG signals to date. Hence, we used the public CAP database. Since the proposed study has attained promising results with EEG signals, a private database can be created in the future, and the developed model can be tested using it. It is worth noting that the method is novel as this is the first study that employs the optimal THFB wavelet-based features for the detection of sleep disorder. In the literature, no study has employed THFB wavelets for any physiological signals. Thus, this study also indicates that THFB-based features work well in disease detection for EEG signals. In the future, the performance of THFB-based features can be explored for the detection of mental disorders such as Depression, Schizophrenia, Parkinson’s and Alzheimer’s disease, sleep arousal, and sleep apnea.
In the future, we can explore convolutional neural network (CNN) [
54] and long short-term memory network (LSTM) though it is not guaranteed that they will definitely surpass the performance of the model as it requires a larger number of data in each class to develop the model. However, using deep learning (DL) techniques is advantageous because it does not require feature extraction, feature selection and classification, etc. Hence, we suggest the use of these DL techniques as future work using huge, diverse databases.
The limitations of our proposed method are given below:
Although EEG signals are considered suitable for brain-related studies, they can still cause discomfort to patients due to multiple electrodes on the scalp.
The CAP sleep database contains only one SDB patient with a sampling frequency of 512 Hz. As a result, the recall rate obtained for SDB patients in seven-class classification is less while the recall rate for NFLE patients is high because of the large number of NFLE epochs (Please see
Table 1).
The data are imbalanced concerning the number of subjects corresponding to each sleep disorder. Due to this, for identifying the type of sleep disorder, the model becomes biased towards NFLE and RBD patients as more subjects are involved in these disorders in our study.
In our study, the EEG epochs are imbalanced with respect to sleep stages. However, we have used ensemble bagging and boosting algorithms to minimize the inaccurate results and overfitting of the model.
The identification performance of SDB patients among all six sleep disorders considered in this study against healthy subjects (seven-class classification) is not adequate using only C4-A1 (unipolar) channel. However, using only F4-C4 (bipolar) channel, the performance is significantly improved.
The developed model needs to be trained and tested on real-time data for clinical application.
Modern advancements in technology have led to several laboratory-based tests for diagnosing and treating sleep disorders. These lab-based tests include PSG, sleep latency test, actigraphy, maintenance of wakefulness test and ambulatory EEG [
55]. Among these techniques, PSG is the most widely used lab-based technique. PSG includes a night-long simultaneous recording of multiple signals and an accurate method for identifying sleep disorders. However, these PSG-based methods use manual scoring by trained physicians and involve multiple wired electrodes on the patient’s body, which is uncomfortable to the patient. These lab-based techniques require patients to spend one or more nights at designated sleep laboratories. Again, due to the limited availability of sleep laboratories and high cost, patients suffering from sleep disorders do not prefer these techniques, and hence many remain undiagnosed. Furthermore, one or two night’s sleep recordings do not represent the exact sleep condition of the patient. Therefore, there is a need for a device that can record and monitor the sleep recordings over a longer period to assess longitudinal variations with minimum discomfort and cost. Thus, we proposed a possible non-invasive, in-home, and cost-effective candidate to identify multiple sleep disorders using only two EEG channels.
Our proposed method used only two EEG channels and can be integrated into a portable device or cloud-based health monitoring system. The patients need not have to be in sleep laboratories surrounded by so many uncomfortable electrodes.
6. Conclusions
This study aims to develop an automated identification of various sleep disorders using EEG signals. A novel optimal triplet half-band filter bank (THFB) is used to obtain the subbands of EEG signals. The Hjorth parameters extracted from subbands are employed as discriminating features. Our developed model can identify disorders based on both sleep stage-dependent and independent classification schemes. The highest classification performance to discriminate between healthy and disordered subjects and to identify the type of sleep disorders is achieved using the N3 (deep sleep) stage. The highest accuracy of classification between healthy subjects against insomnia, narcolepsy, NFLE, PLM, RBD, and SDB subjects is 99.2%, 98.2%, 96.2%, 98.3%, 98.8%, and 98.8%, respectively. In addition, for the identification of the type of sleep disorders, we have achieved the best accuracy of 91.3% using the N3 sleep stage. The experimental results show that the ensemble bagged and boosted trees classifier can effectively classify sleep disorders with high accuracy, precision, recall, and F1-Score. The developed approach for sleep disorder identification is simple, accurate, computationally less expensive, and easy to implement in home-based systems, cloud-based sleep monitoring devices, and hospitals. A private database can be created in the future, and the developed model can be tested on it. We intend to explore various deep learning techniques such as CNN and LSTM to automate sleep disorders using a vast database.


