Article

Viewing Direction Based LSB Data Hiding in 360° Videos †

by
Dang Ninh Tran
,
Hans-Jürgen Zepernick
* and
Thi My Chinh Chu
Blekinge Institute of Technology, SE-371 79 Karlskrona, Sweden
*
Author to whom correspondence should be addressed.
This paper is an extended version of our paper published in International Conference on Signal Processing and Communication Systems, Adelaide, Australia, 14–16 December 2020.
Electronics 2021, 10(13), 1527; https://doi.org/10.3390/electronics10131527
Submission received: 31 May 2021 / Revised: 14 June 2021 / Accepted: 17 June 2021 / Published: 24 June 2021

Abstract

:
In this paper, we propose a viewing direction based least significant bit (LSB) data hiding method for 360° videos. The distributions of viewing direction frequency for latitude and longitude are used to control the amount of secret data to be hidden at the latitude, longitude, or both latitude and longitude of 360° videos. Normalized Gaussian mixture models mimicking the viewing behavior of humans are formulated to define data hiding weight functions for latitude, longitude, and both latitude and longitude. On this basis, analytical expressions for the capacity offered by the proposed method to hide secret data in 360° cover videos are derived. Numerical results for the capacity using different numbers of bit planes and popular 360° video resolutions for data hiding are provided. The fidelity of the proposed method is assessed in terms of the peak signal-to-noise ratio (PSNR), weighted-to-spherically uniform PSNR (WS-PSNR), and non-content-based perceptual PSNR (NCP-PSNR). The experimental results illustrate that NCP-PSNR returns the highest fidelity because it gives lower weights to the impact of LSB data hiding on fidelity outside the front regions near the equator. The visual quality of the proposed method as perceived by humans is assessed using the structural similarity (SSIM) index and the non-content-based perceptual SSIM (NCP-SSIM) index. The experimental results show that both SSIM-based metrics are able to account for the spatial perceptual information of different scenes while the PSNR-based fidelity metrics cannot exploit this information. Furthermore, NCP-SSIM reflects much better the impact of the proposed method on visual quality with respect to viewing directions compared to SSIM.

1. Introduction

Immersive digital media such as virtual reality (VR) and augmented reality (AR) together with head-mounted displays (HMDs) have seen rapid development in recent years. In particular, 360° videos offering 360° × 180° viewing directions with respect to longitude and latitude are reported in [1] to account for the majority of VR content. The related so-called weak-interaction VR services offered over wired and wireless networks comprise of IMAX theater, 360° video streaming, and VR live broadcasting [2]. Apart from stringent network latency constraints such as keeping motion-to-photon latency below 20 ms, networked VR services require substantial bandwidth that may range from 50 Mbps for 360° videos of 4K resolution to above 1 Gbps for 360° videos of 24K resolution. An increased portfolio of digital media including digital twins, extended reality, and holopresence are foreseen to shape sixth generation (6G) mobile communication systems [3].
The large resolutions of 360° videos are essential for providing immersive experiences but may also be used as a resource for concealing large amounts of secret information. Steganography provides covert communication between two parties such that the exchange of information cannot be observed by an attacker, i.e., a secret object is hidden in a cover object to constitute a stego-object. In particular, hiding secret information in digital audio, images, and videos exploits the fact that the human auditory system and human visual system are rather insensitive to small changes in digital media. Surveys on the state-of-the-art steganography techniques for these conventional digital media can be found in [4,5,6,7]. To keep computational load associated with data hiding in digital media low, especially for networked services, least significant bit (LSB) data hiding methods may be used. In the spatial domain, for example, LSB data hiding methods replace the LSB or b rightmost bits of a word or pixel of depth B of the cover object by the secret data. A comprehensive survey on LSB data hiding methods for digital images and videos can be found in [8] providing a classification of hiding data in the spatial, transform, and quantum domain of digital images, and the raw and compressed domain of digital videos. As for new digital media such as high-definition images and 360° videos, some LSB data hiding methods are reported in [8]. However, steganography for new digital media is much less developed compared to conventional digital media because the different types of immersive digital media themselves are subject to further development.

1.1. Related Work

Regarding new digital media related to visual stimuli such as 360° videos, additional characteristics related to how humans view scenes on HMDs may be exploited at the different stages of a processing chain in a communication context. In particular, the observation that users statistically focus more on the equator region and the center of the front regions of the shown content compared to the poles has been used for assessing source encoding schemes, and for developing subjective and objective video quality assessment (VQA) methods.
In [9], a framework for evaluating 360° video encoding schemes is presented in which viewport-based head motion trajectories are extracted. This allows comparing original and encoded videos on the viewport and to examine different sphere-to-plane mappings. The work also accounts for the fact that users typically give more attention to the equator region compared to the poles when viewing natural scenes. In particular, average statistics on the relative frequency of pixel accesses versus latitude are provided that were obtained from head motion trajectories over 10 users which viewed 10 different natural 360° video scenes of 10 s duration each. The participants that took part in this subjective experiment were told to stand and then were allowed to freely turn around while watching the natural scenes on an HMD. However, in ITU-T P.919 [10], describing subjective assessment methods for evaluating the quality of short 360° videos, it is recommended that the participants should be seated on a swivel chair, to be able to freely rotate and explore the 360° videos. It is also recommended in [10] to engage at least 28 participants to support a statistically meaningful analysis of the data obtained in such subjective experiments.
The work reported in [11] proposes subjective and objective methods to assess visual quality loss of 360° videos due to source encoding artifacts. A subjective VQA method is presented which takes the typical directions of how users view 360° videos into account. This method reports on the results obtained from a subjective experiment suggesting that viewing directions are typically distributed in the center of the front regions near the equator but might also fall into other regions depending on the video content. In particular, in line with [10], 40 participants took part in this subjective experiment watching 48 360° videos on an HMD while sitting on a swivel chair. The selected 360° videos span over a wide range of resolutions from 3K ( 2880 × 1440 pixels) to 8K ( 7680 × 3840 pixels). These videos were used to obtain head movement data for modeling the viewing direction characteristics of humans in relation to latitude and longitude. It was found that the longitude and latitude of the viewing directions are almost independent which allows modeling the viewing direction frequency as a product of Gaussian mixture models (GMM) of latitude and longitude. In addition, two objective VQA methods are proposed to assess the quality of source encoded 360° videos. One method resorts on the proposed GMMs and imposes a weighting on the distortion of pixels subject to their distance to the center of the front region. The other method predicts viewing directions depending on the video content and then allocates weights to the distortions of each pixel based on the predicted viewing direction. The development of these VQAs is also based on a subjective experiment with another panel of 48 participants that rated the quality of 12 reference 360° videos with resolution of 4K ( 4096 × 2048 ) and related 36 processed 360° videos. The experimental results presented in this paper validate the effectiveness of the proposed viewing direction based subjective and objective VQA methods.
In [12], spherical LSB data hiding in 360° videos with equirectangular projection has been proposed. Although viewers typically put more attention to the areas around the equator compared to the poles, the amount of data to be hidden in the selected regions around the poles is kept constant but is not adjusted when moving from the poles to the equator of the 360° video. A fixed number of lines around the poles has been selected instead with each line hiding the same amount of secret data irrespective of the distance to the poles. A performance assessment has been conducted using fidelity metrics to study the impact of the warping effect induced by the equirectangular projection between the sphere and the plane. The numerical results show that the fidelity of the 360° stego-video with respect to the 360° cover video using simple LSB data hiding can be kept high when secret data are hidden around the poles. The fidelity decreases when shifting the LSB data hiding from either of the poles toward the equator.
In view of the findings reported in [12], the approach proposed in [13], first performs LSB data hiding in a fixed number of lines around the pole regions of the 360° cover video to reduce the impact of the equirectangular projection on the fidelity of the 360° stego-video. As for the region around the equator, the insensitiveness of the human visual system (HVS) to sharp intensity changes in edge regions has been exploited to hide secret data in edges. An edge detector together with morphological operations has been used to increase data hiding capacity. The numerical results illustrate the trade-offs between capacity and fidelity which can be controlled by the number of lines in the pole regions, size of the structuring element in the mid-region, and number of bit planes used in the different regions.
In [14], an LSB data hiding method for 360° videos is proposed that takes the statistics from a subjective experiment on the relative frequency of pixel accesses with respect to the latitude, as reported in [9] (see discussion above), into account for controlling the amount of data to be hidden in different regions of 360° videos. Because the LSB data hiding is controlled by the weights associated with each latitude, the entire field of view is addressed using the visual attention-based LSB data hiding method. In other words, the morphological operations for the equator region used in [13] are not required which simplifies the LSB data hiding procedure. A performance assessment of this LSB data hiding approach has been conducted in terms of capacity and fidelity.

1.2. Motivation and Contributions

Motivated by all of the above, in this paper, a viewing direction based LSB data hiding method for 360° videos is proposed and its performance is assessed. In particular, the distribution of viewing direction frequency in both latitude and longitude proposed in [11] are used to define data hiding weight functions for controlling the amount of data to be hidden in different regions of 360° videos. The proposed LSB data hiding method therefore accounts for the finding that humans view the front region near the equator much more often than other regions of 360° videos, i.e., the north and south poles, and the west and east regions away from the front region. In addition, the performance of viewing direction based LSB data hiding is assessed not only using fidelity metrics but also in terms of visual quality metrics that take characteristics of the HVS into account. Main contributions of this paper are summarized as follows:
  • A viewing direction based LSB data hiding method for 360° videos is proposed and pseudo code to assist the implementation of the method is provided.
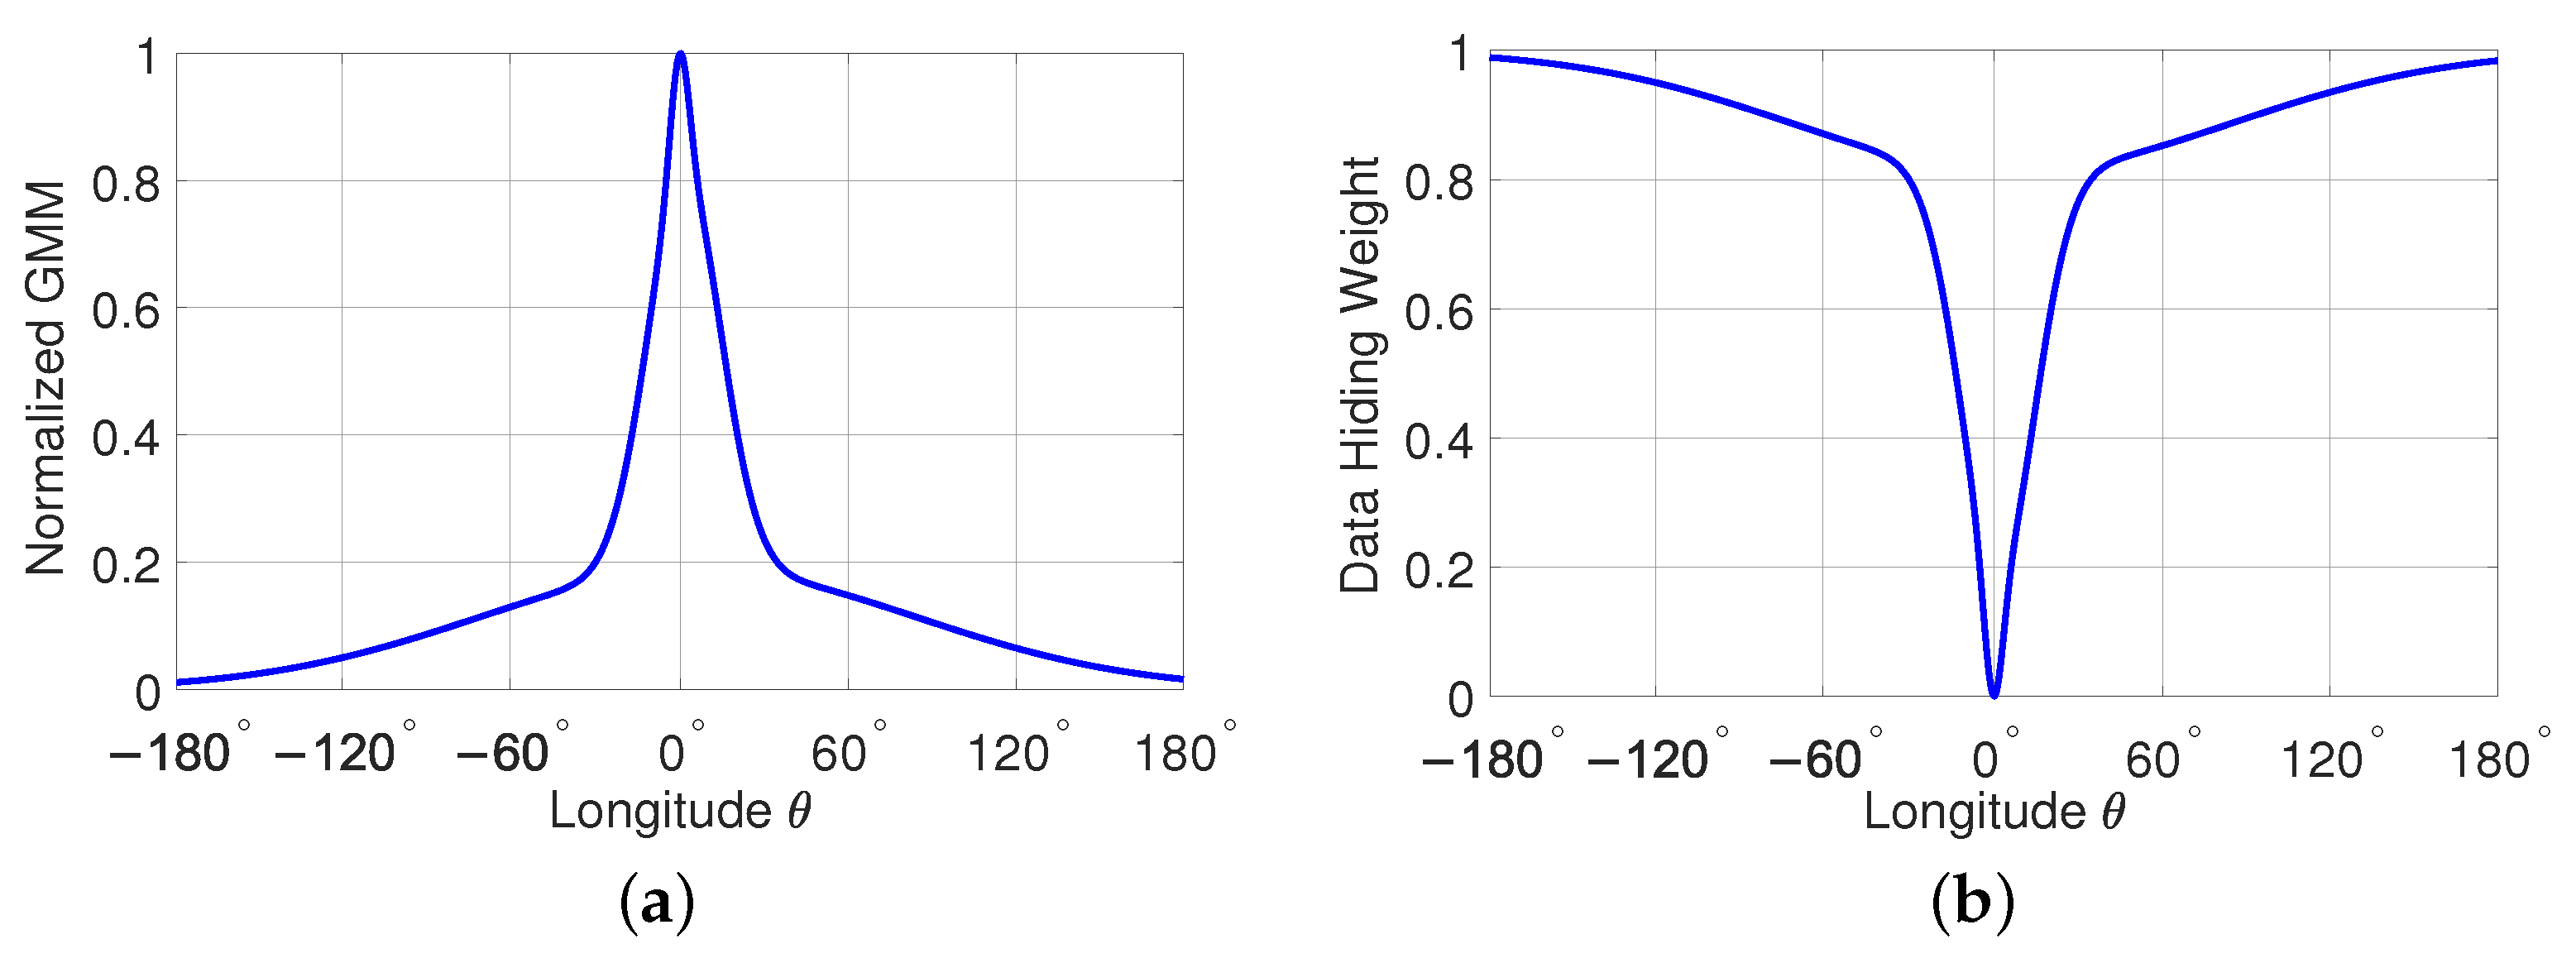
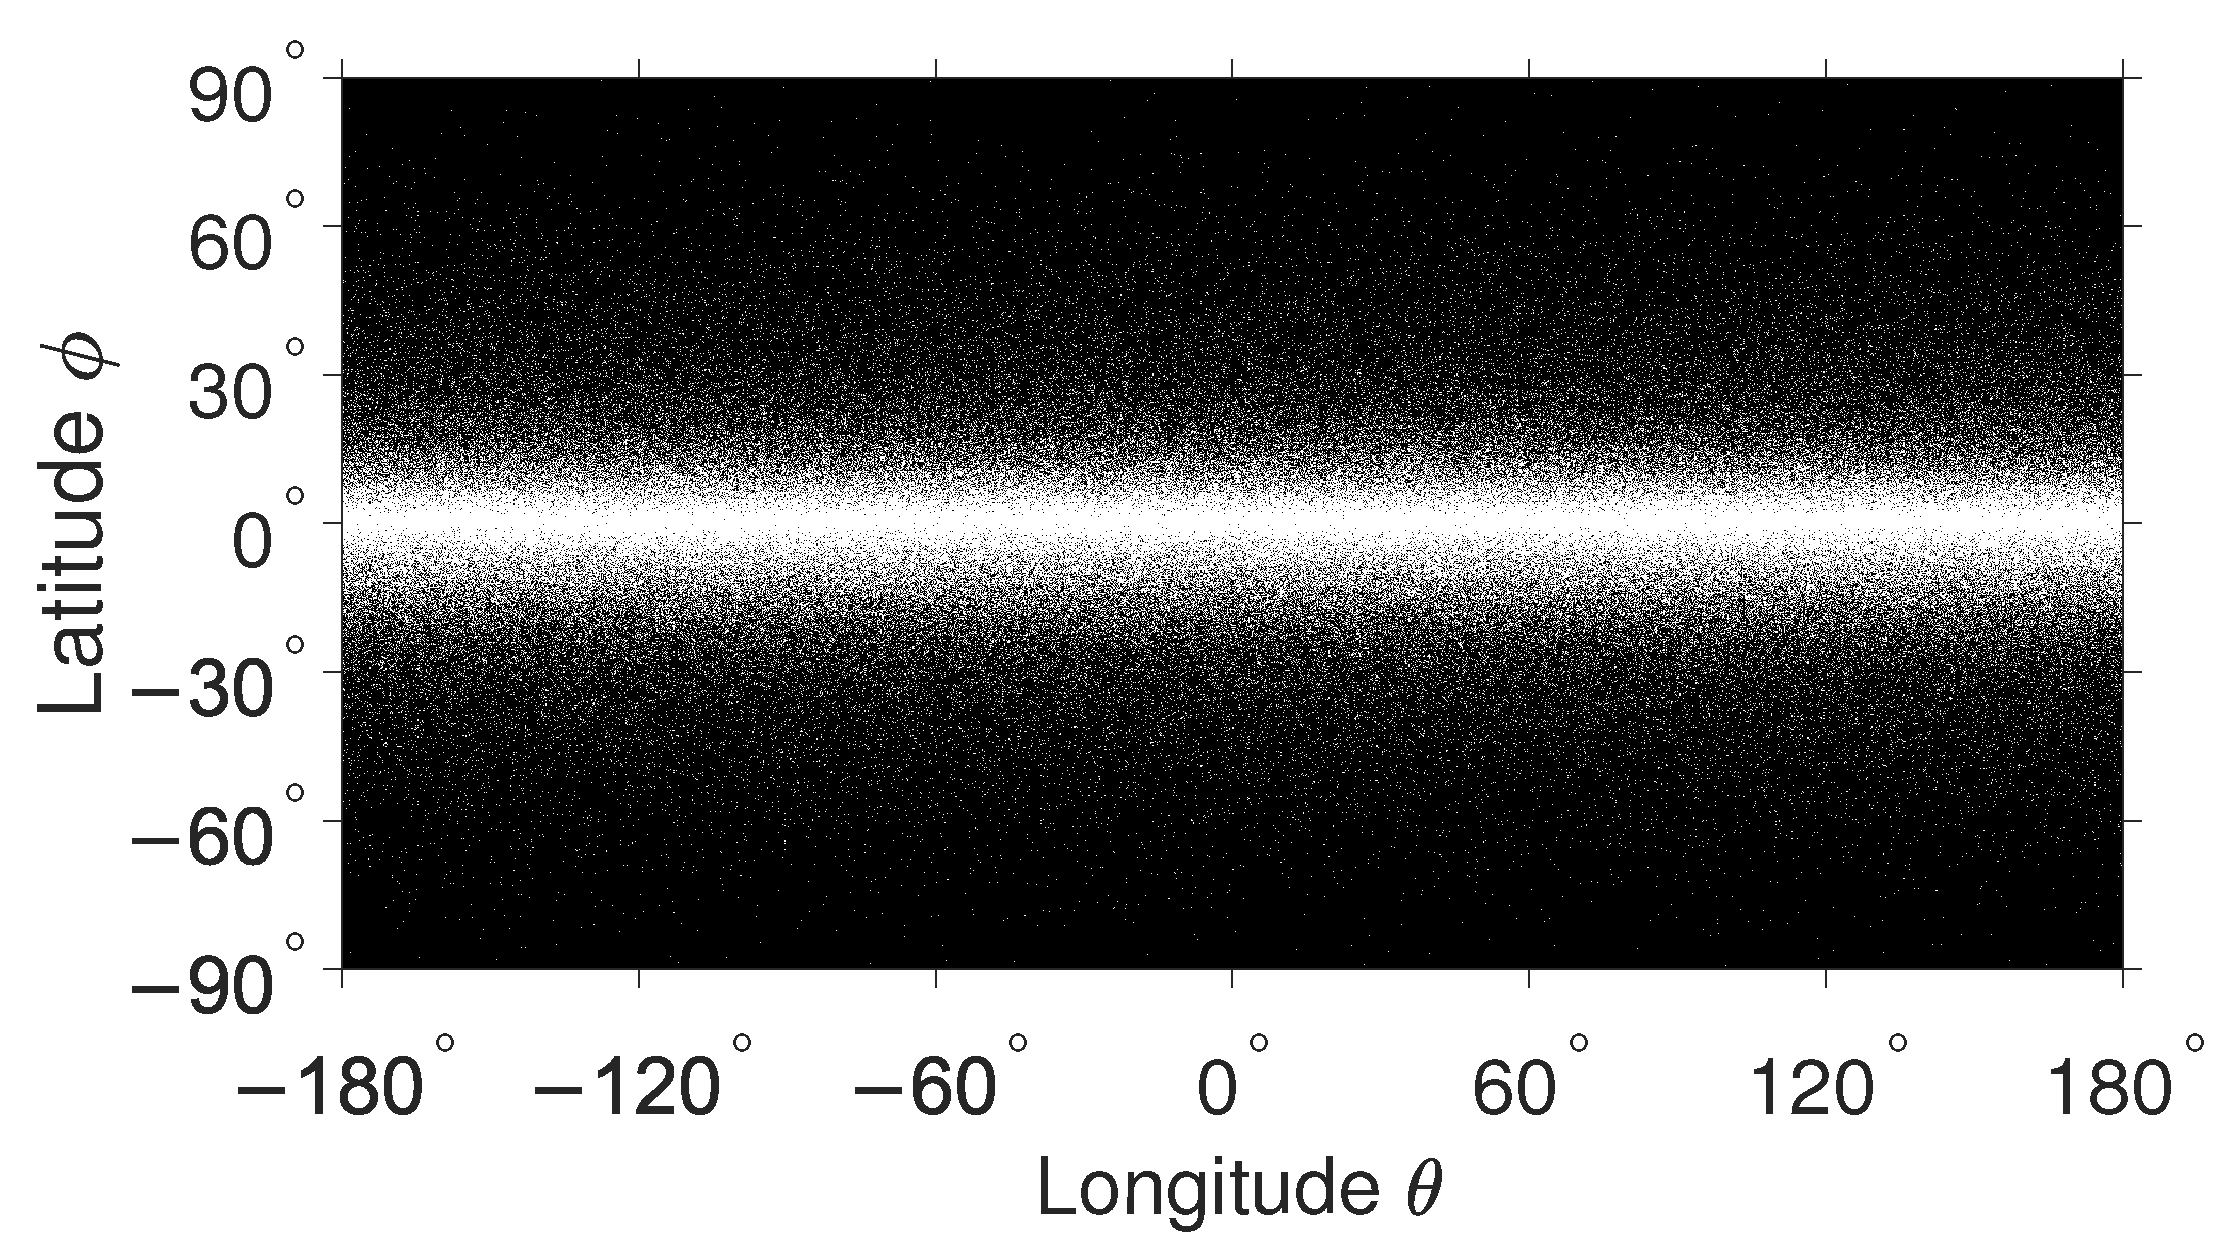
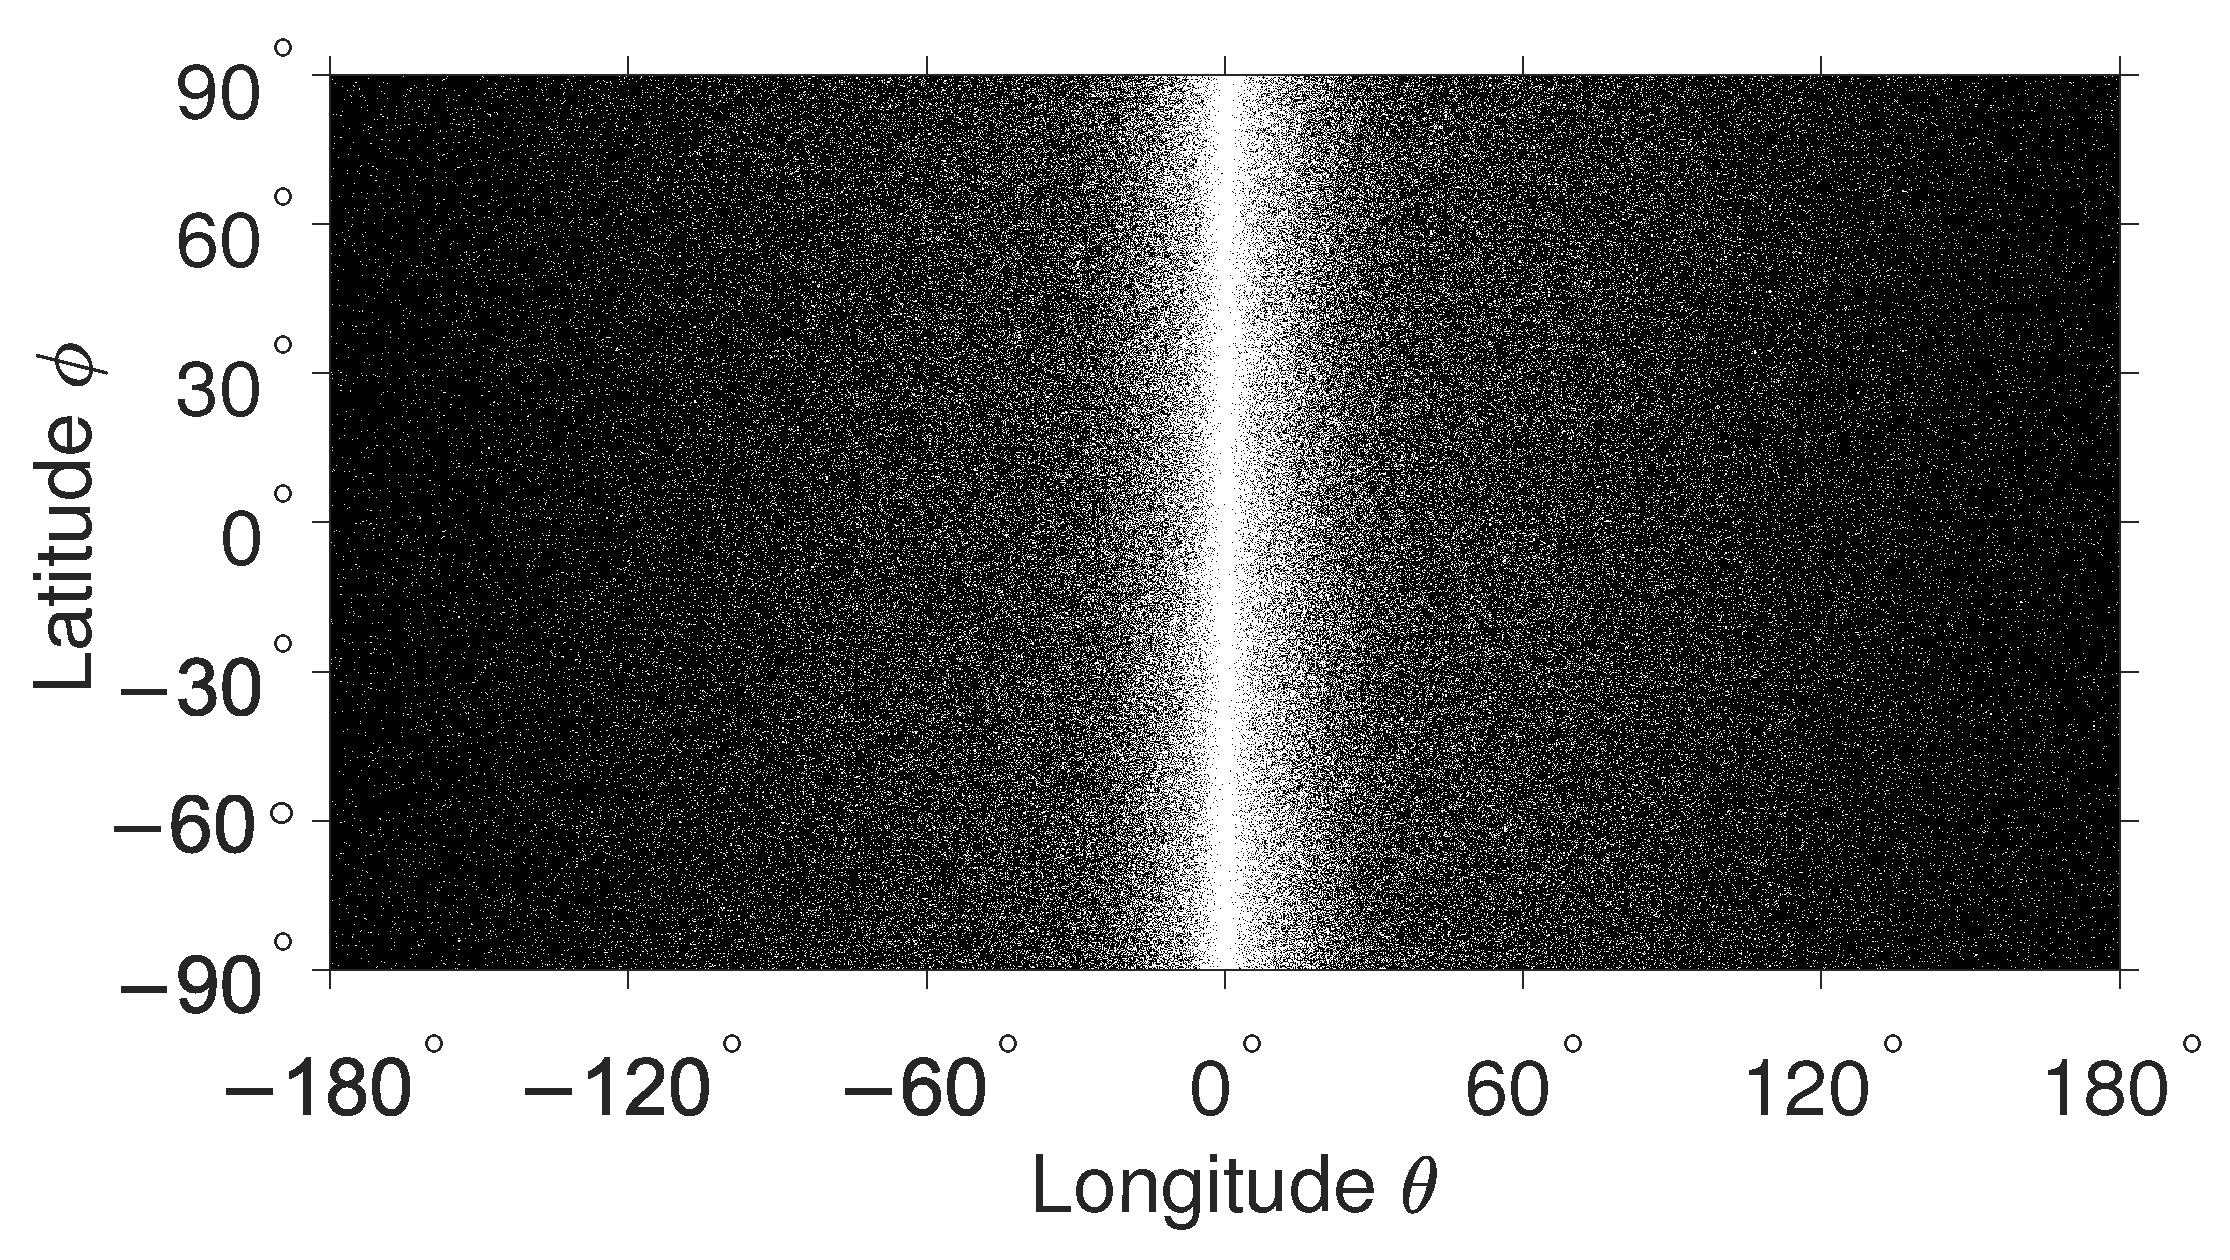
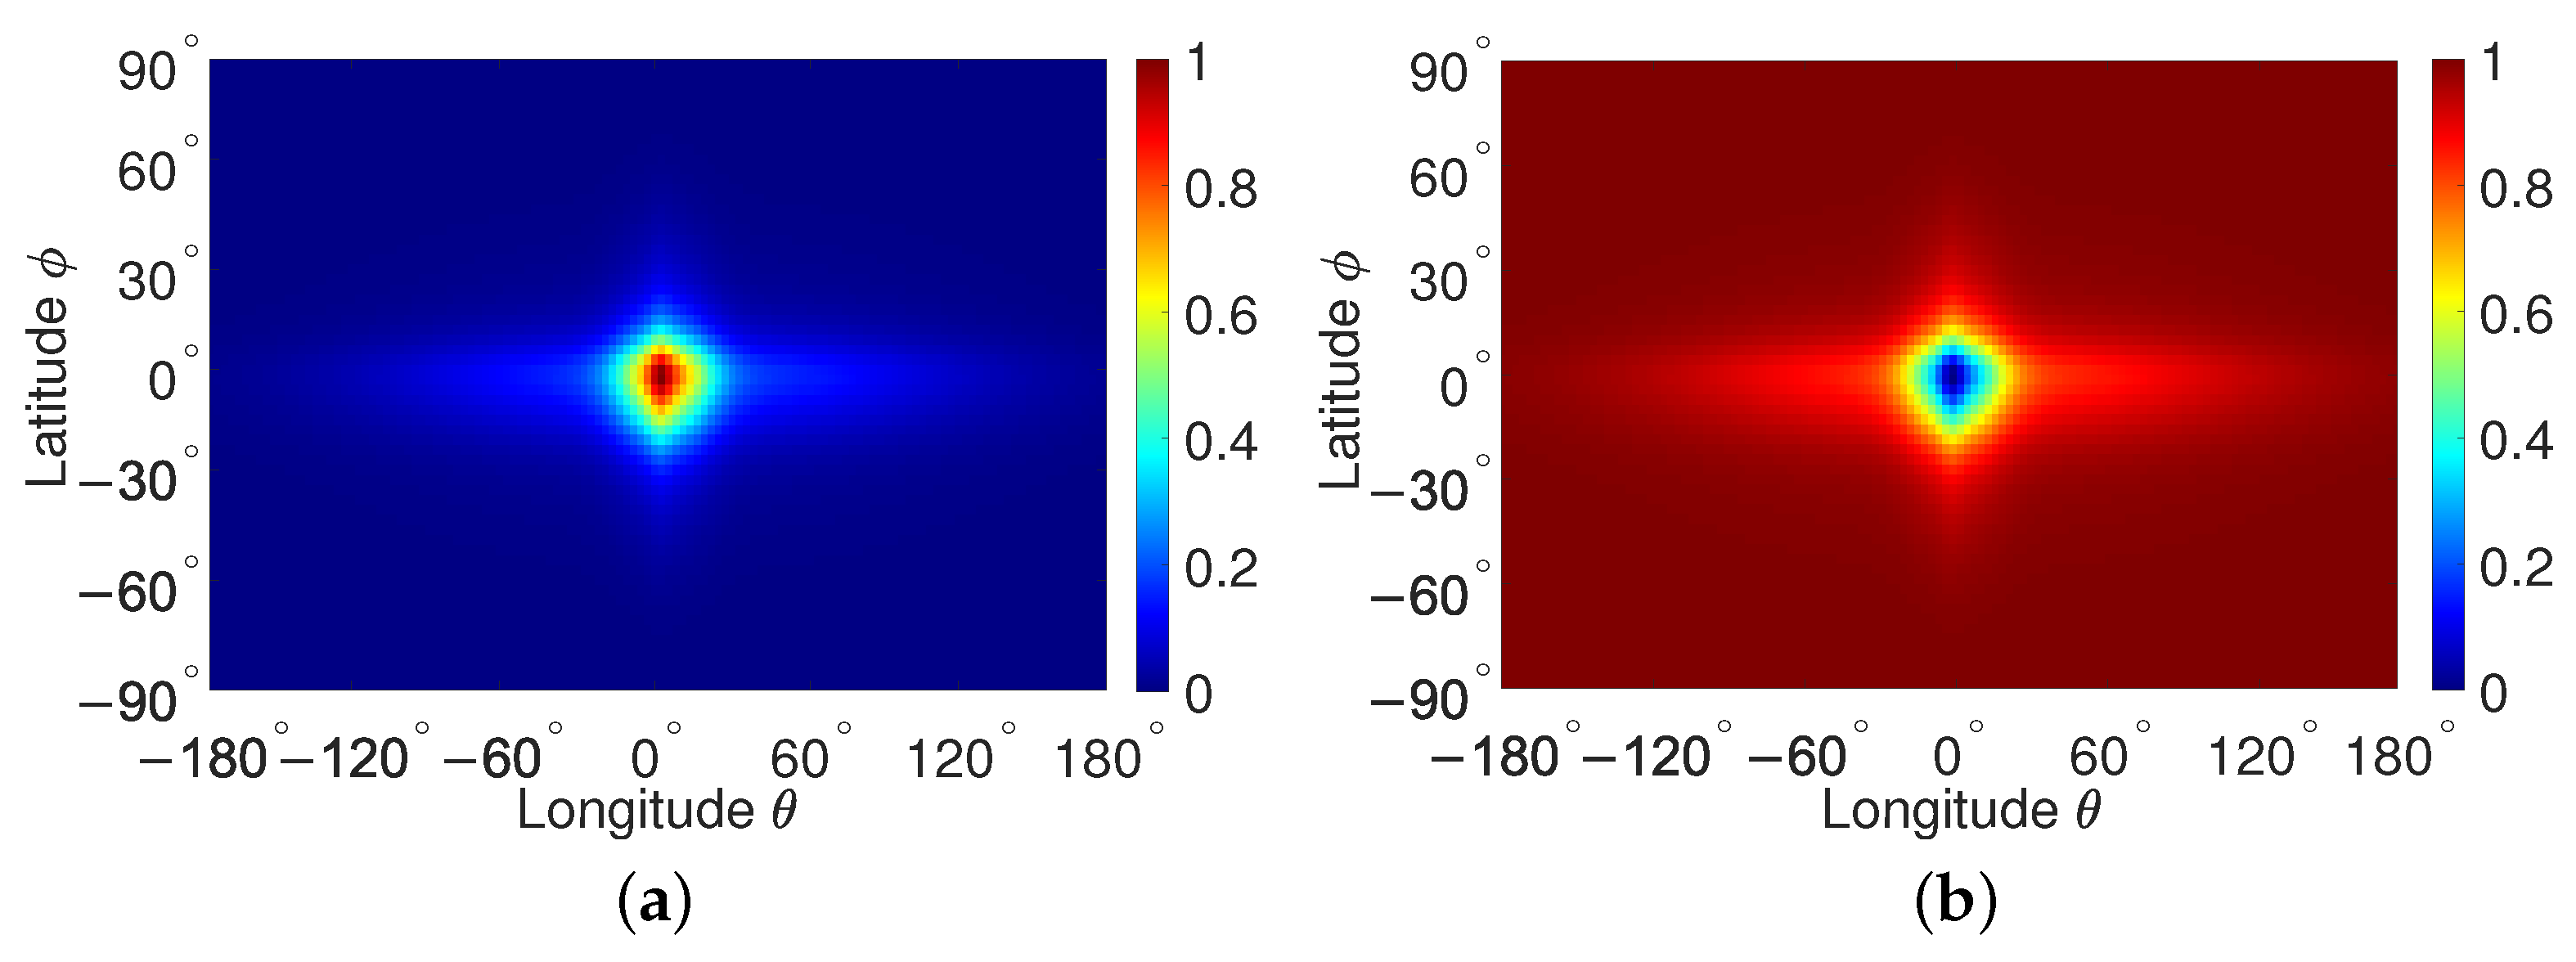
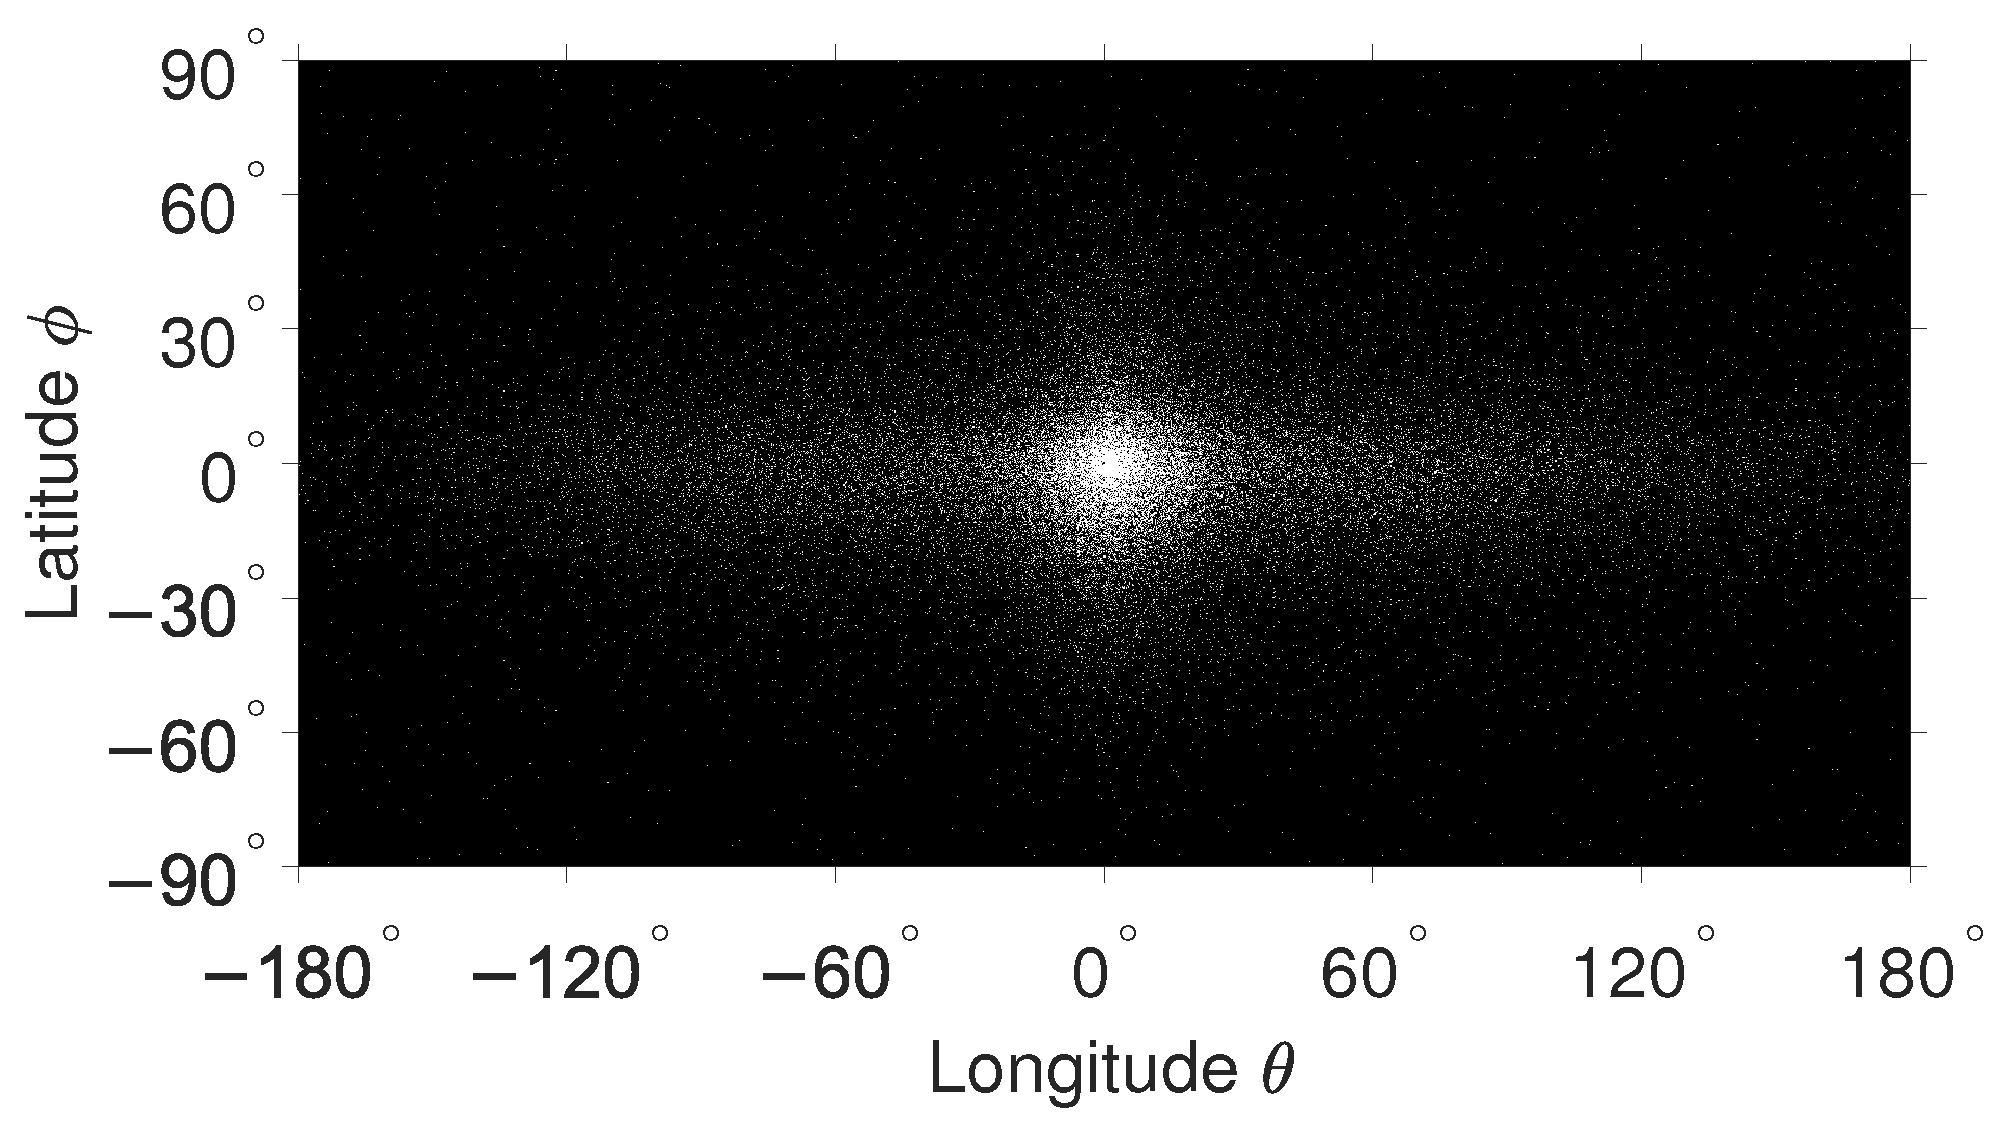
  • Normalized relative viewing direction frequencies with respect to latitude, longitude, and both latitude and longitude are derived using the respective GMMs.
  • Viewing direction based data hiding weight functions with respect to latitude, longitude, and both latitude and longitude are defined.
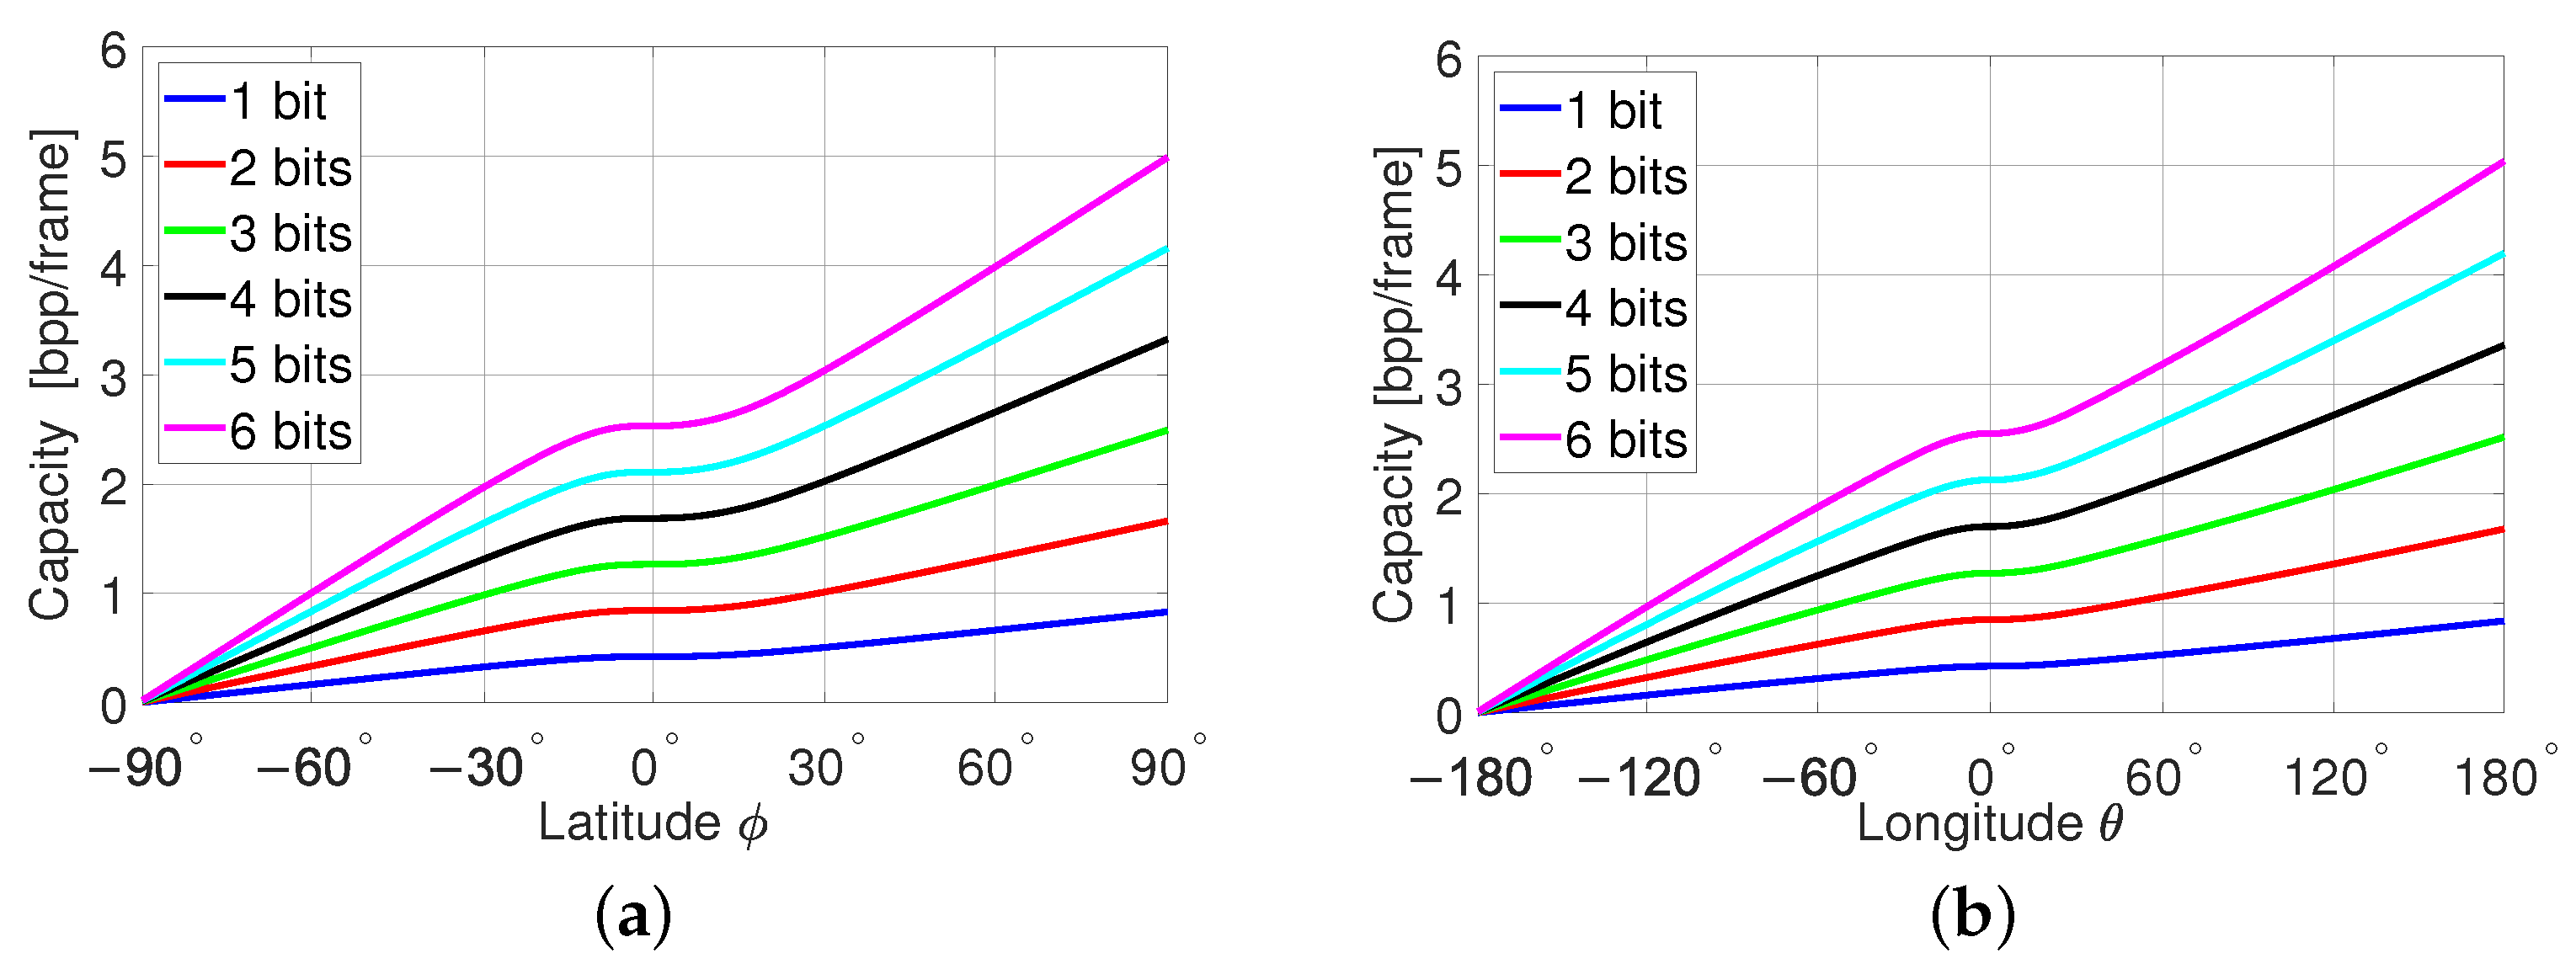
  • Analytical expressions for the capacities offered by viewing direction based LSB data hiding in the latitude, longitude, and both latitude and longitude are derived. Numerical results for these capacities are also provided.
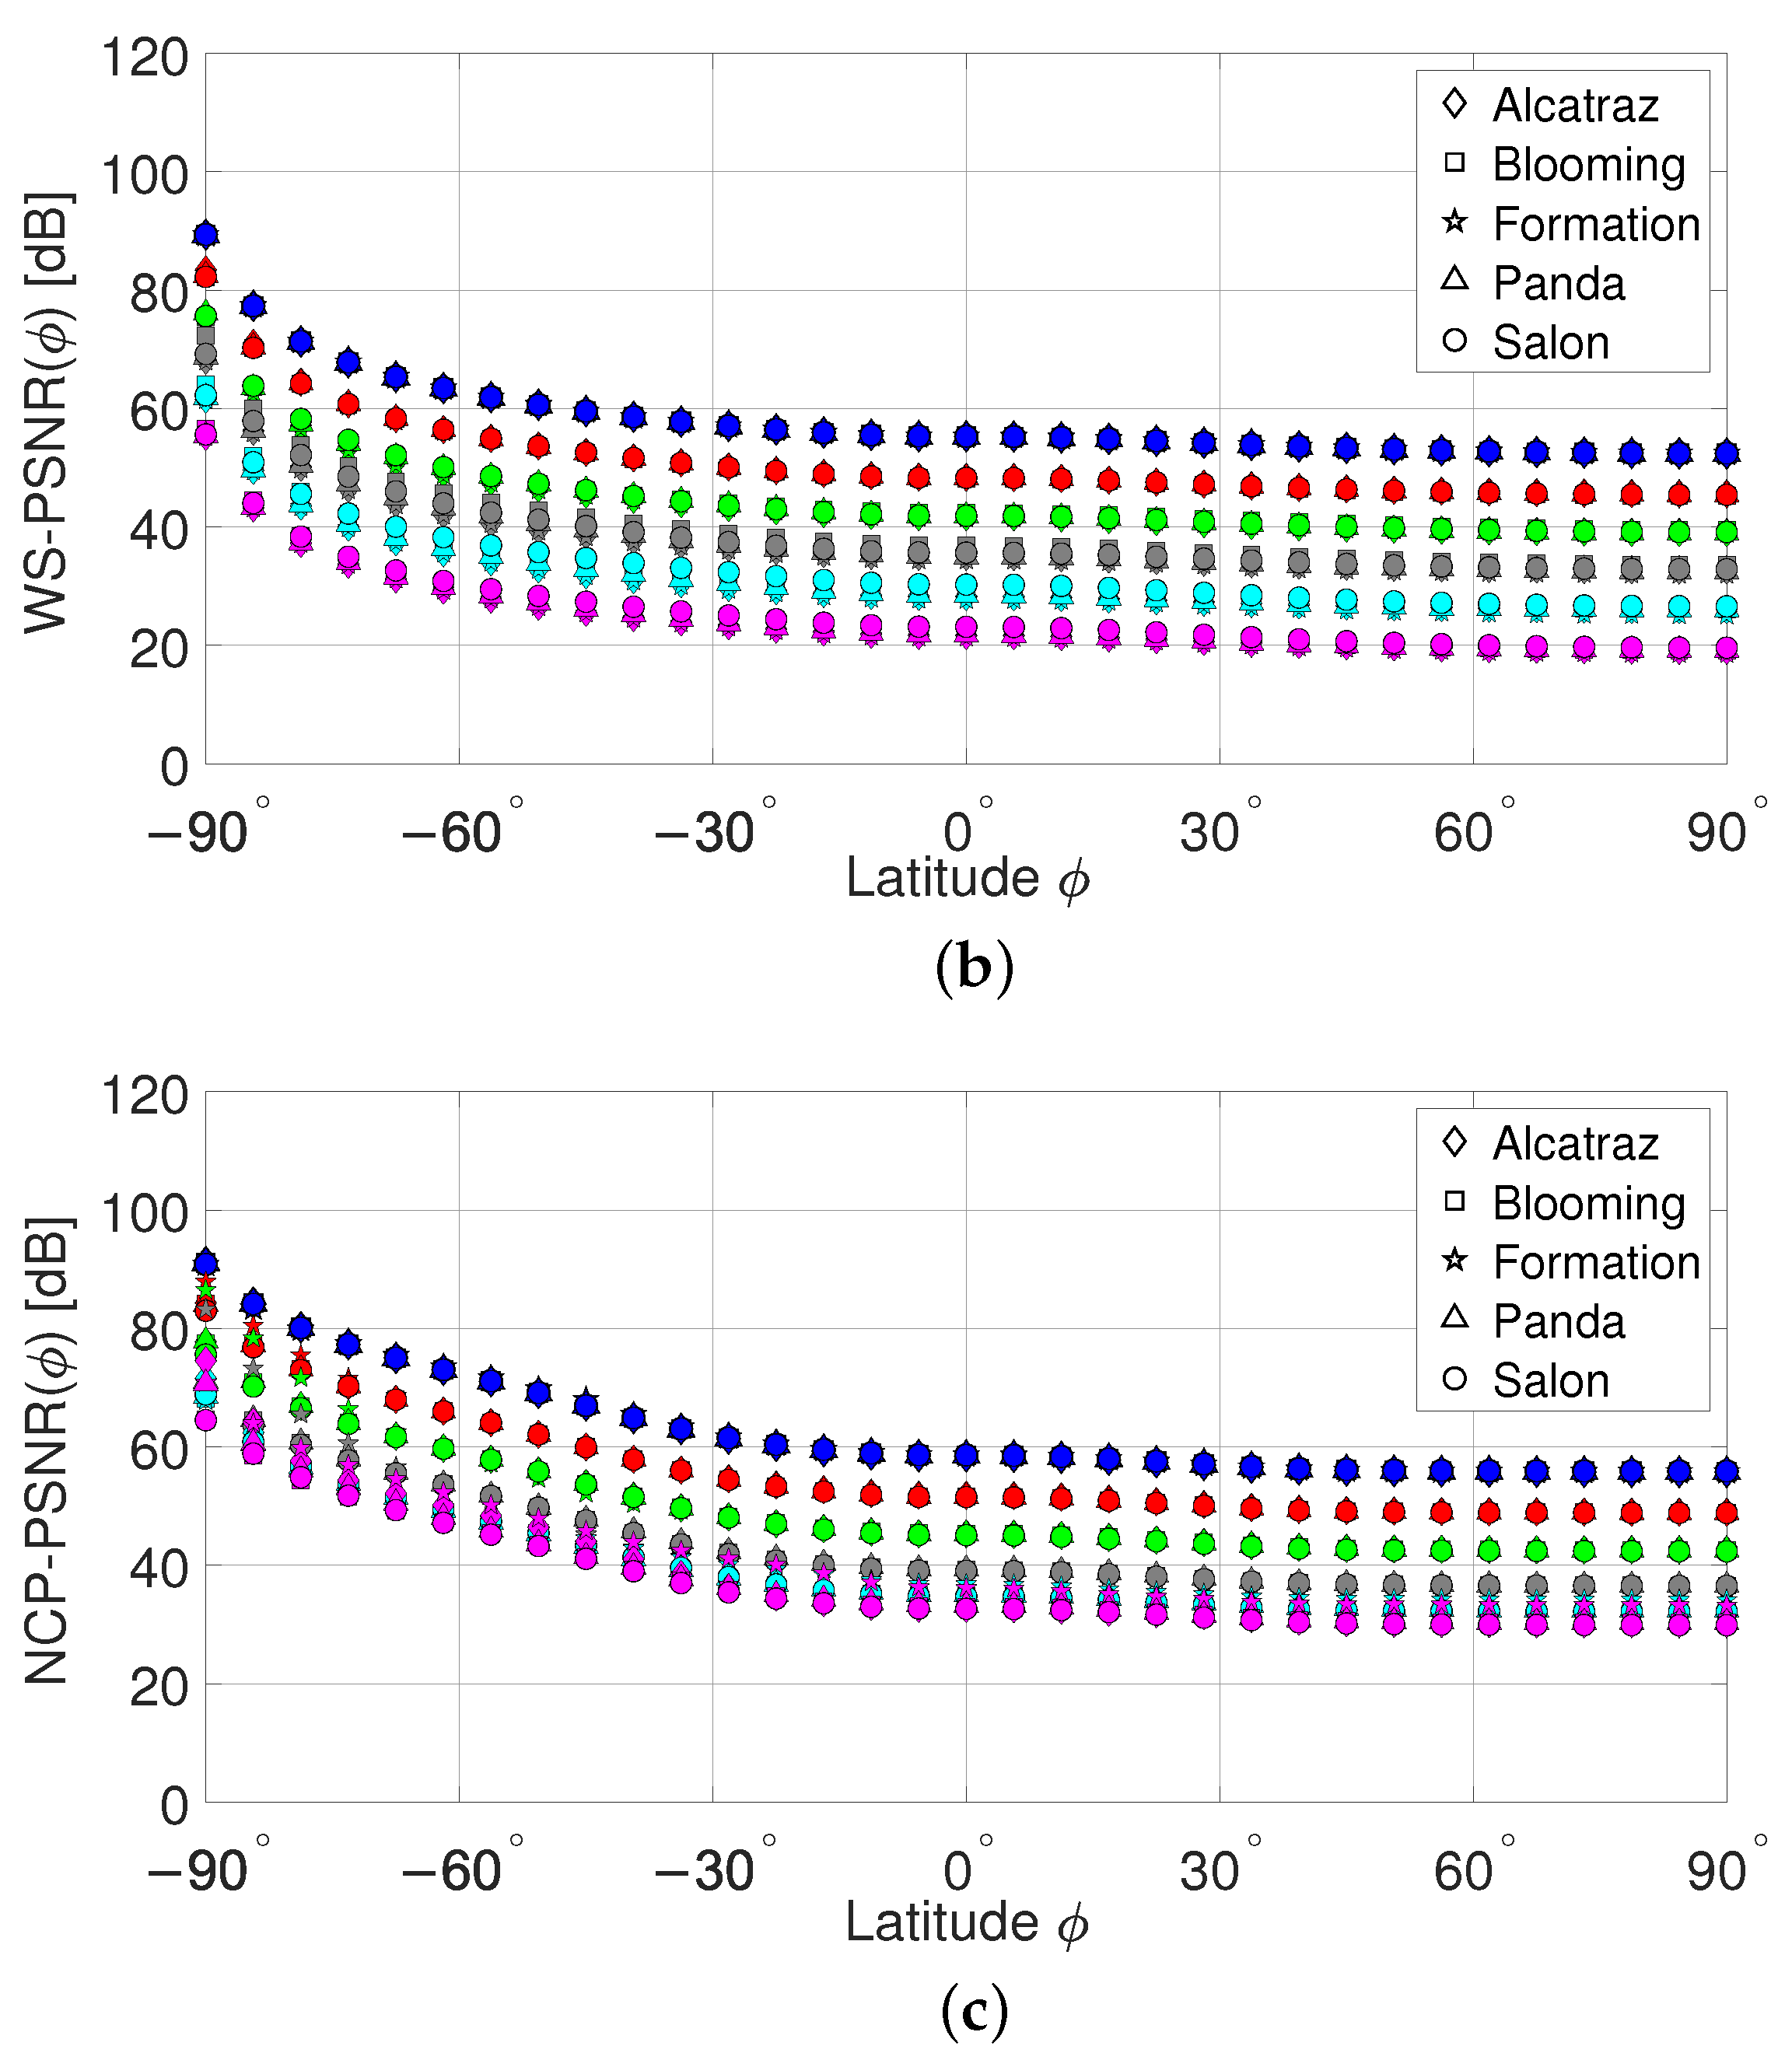
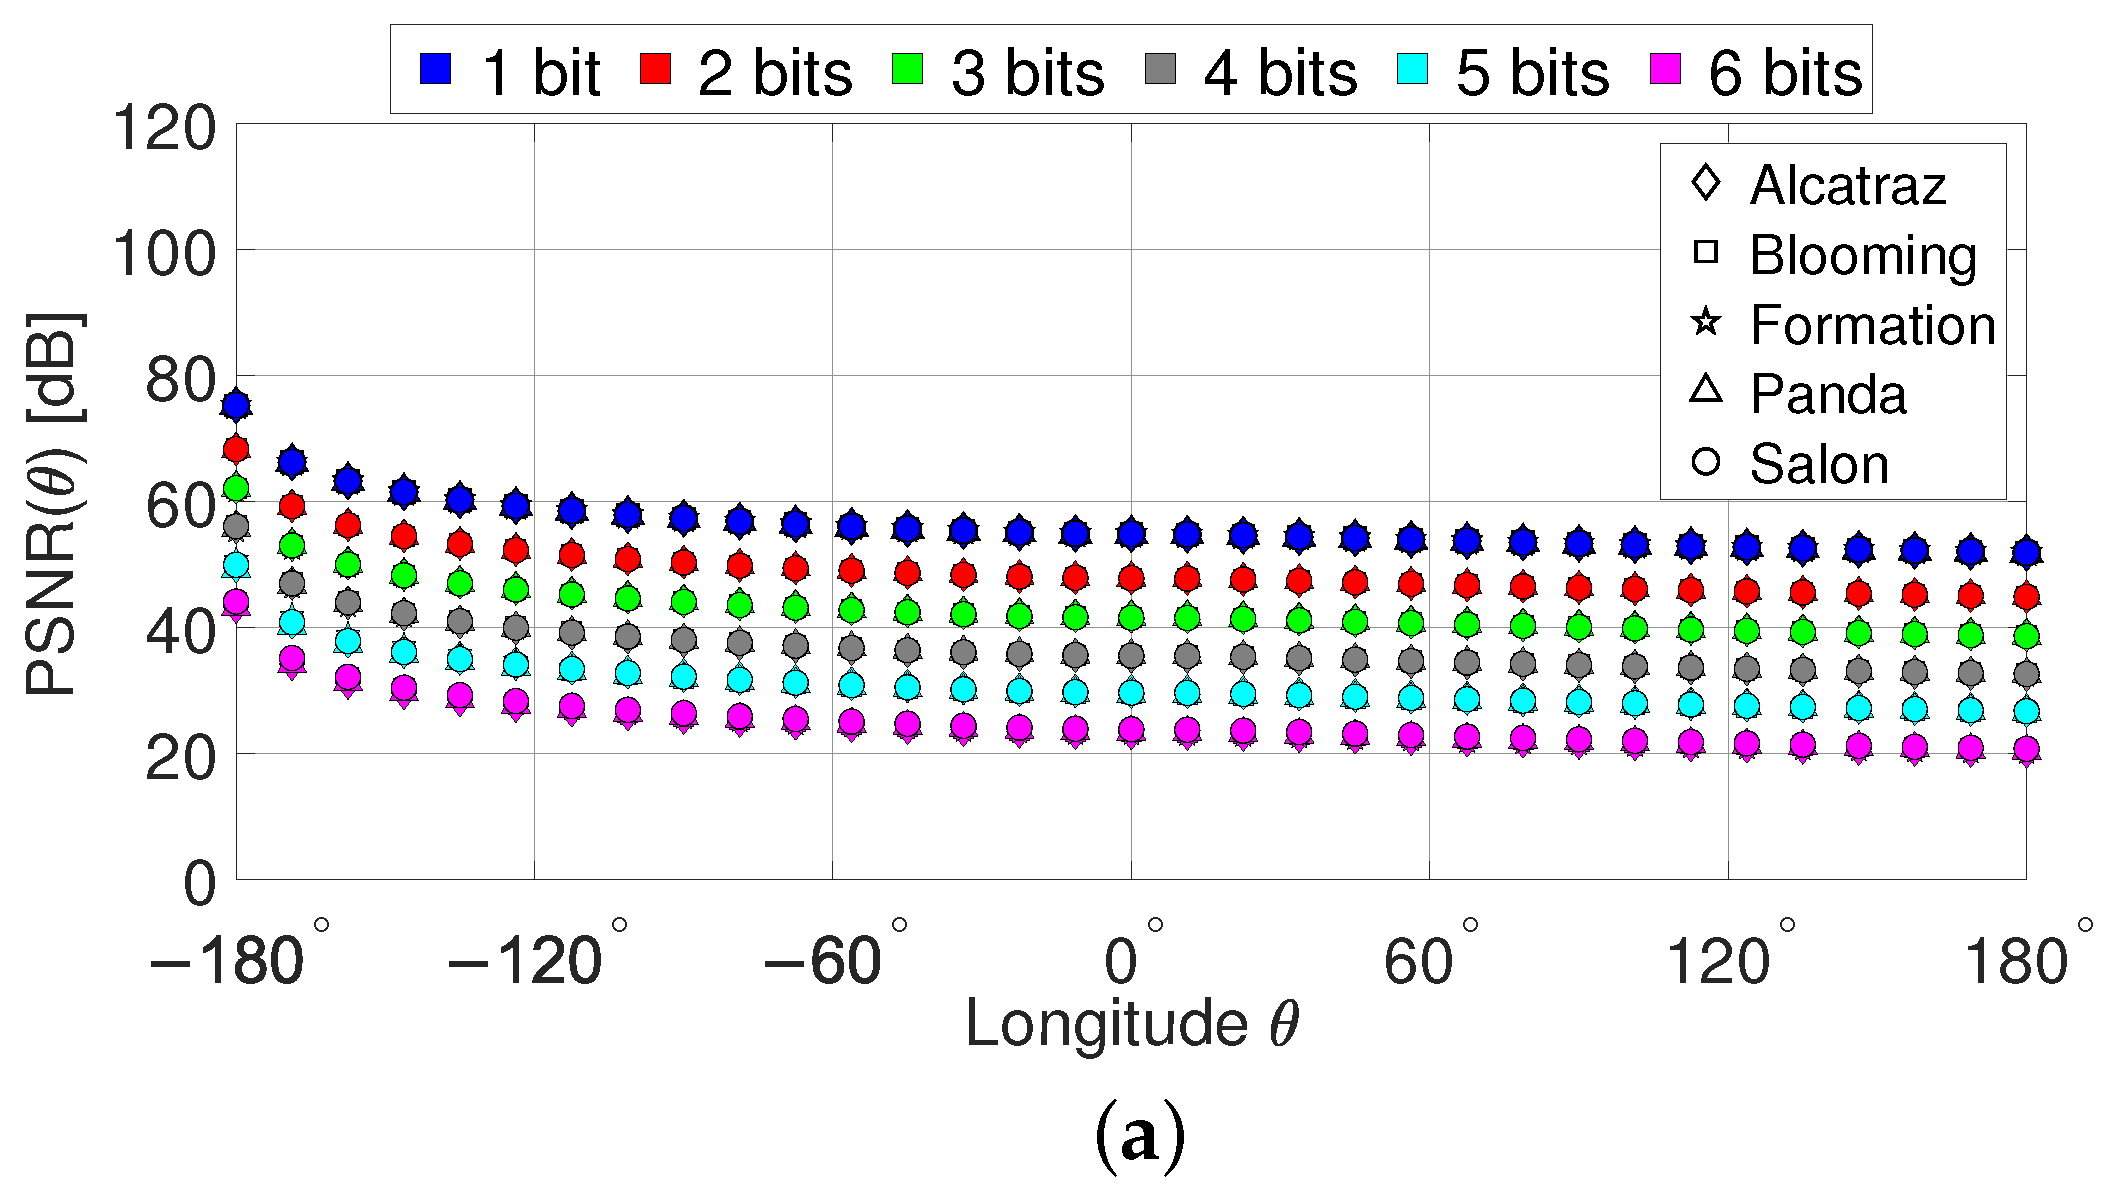
  • The fidelity of viewing direction based LSB data hiding is assessed in terms of the peak-signal-to-noise (PSNR) ratio, weighted-to-spherical-uniform PSNR (WS-PSNR), and non-content-based perceptual PSNR (NCP-PSNR).
  • The visual quality of viewing direction based LSB data hiding is assessed in terms of the structural similarity (SSIM) index and non-content-based perceptual SSIM (NCP-SSIM) index.
The remainder of this paper is organized as follows. Section 2 proposes the viewing direction based LSB data hiding method that accounts for the distributions of viewing directions in latitude and longitude when watching 360° videos on HMDs. The cover videos used for viewing direction based LSB data hiding and examples of stego-videos are presented in Section 3. In Section 4, the normalized GMMs for viewing direction based LSB data hiding and the respective data hiding weight functions regarding latitude, longitude, and both latitude and longitude are derived. The data hiding capacity, also referred to as capacity for brevity, offered by the proposed viewing direction based LSB data hiding method is derived in Section 5. The fidelity of the proposed method is assessed and related experimental results are discussed in Section 6 using cumulative versions of PSNR, WS-PSNR, and NCP-PSNR. The visual quality assessment of the proposed method is conducted in Section 7 in terms of SSIM and NCP-SSIM. A summary of the work, together with findings and conclusions, are given in Section 8.

2. Viewing Direction Based LSB Data Hiding

In this section, we first illustrate the equirectangular projection (ERP) that is used in this work for mapping the sphere to the plane. Then, the YV12 color encoding model is described which is applied to the ERP formatted frames of 360° videos. On this basis, the viewing direction based LSB data hiding approach is described and pseudo code for generating a 360° stego-video is provided to assist with the implementation of this approach.

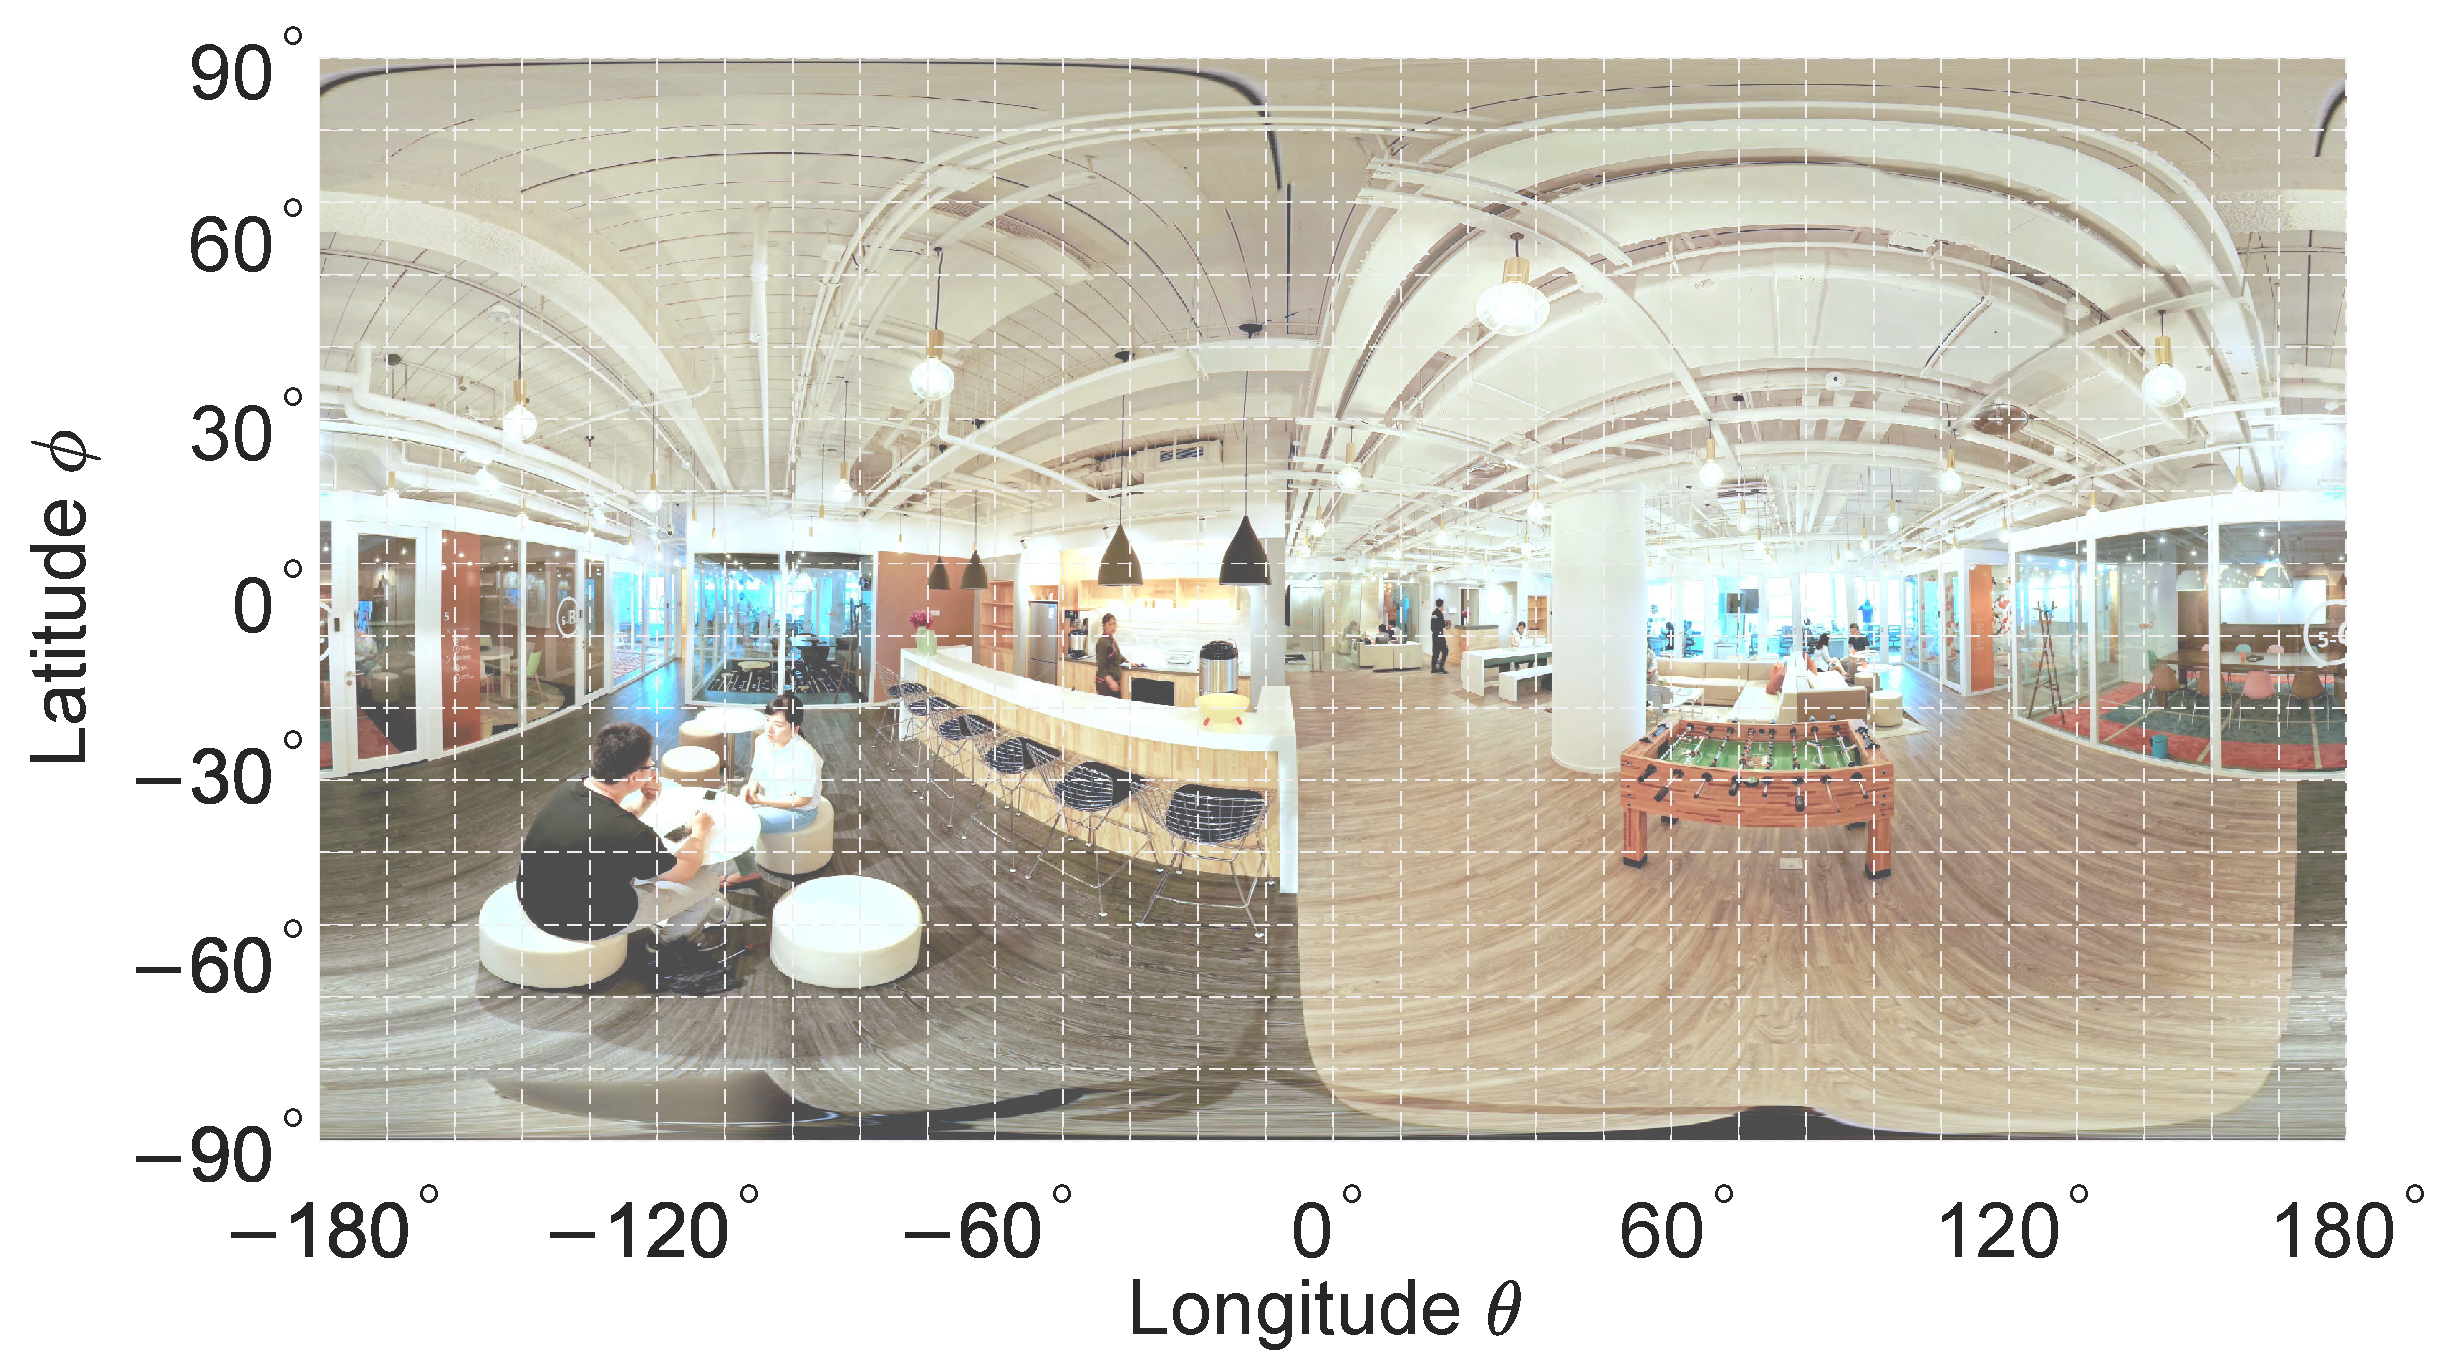
2.1. Equirectangular Projection

The ERP is a cylindrical equidistant projection in which the vertical coordinate is the latitude ϕ of the sphere and the horizontal coordinate is the longitude θ of the sphere. The ERP format is also called rectangular projection, plane chart, plate carrée, or unprojected because of its original use for map creation. It is a projection format that is widely used for transforming the spherical coordinates of 360° videos into a plane. Figure 1 shows a sample 360° video frame illustrating that the ERP format causes distortions of areas and local shapes in the plane when moving vertically from the equator to the poles. In particular, areas close to the poles become horizontally stretched in the plane. The north and south poles on the sphere are located at the top and the bottom edge of the plane, respectively, and are stretched across the entire frame width.

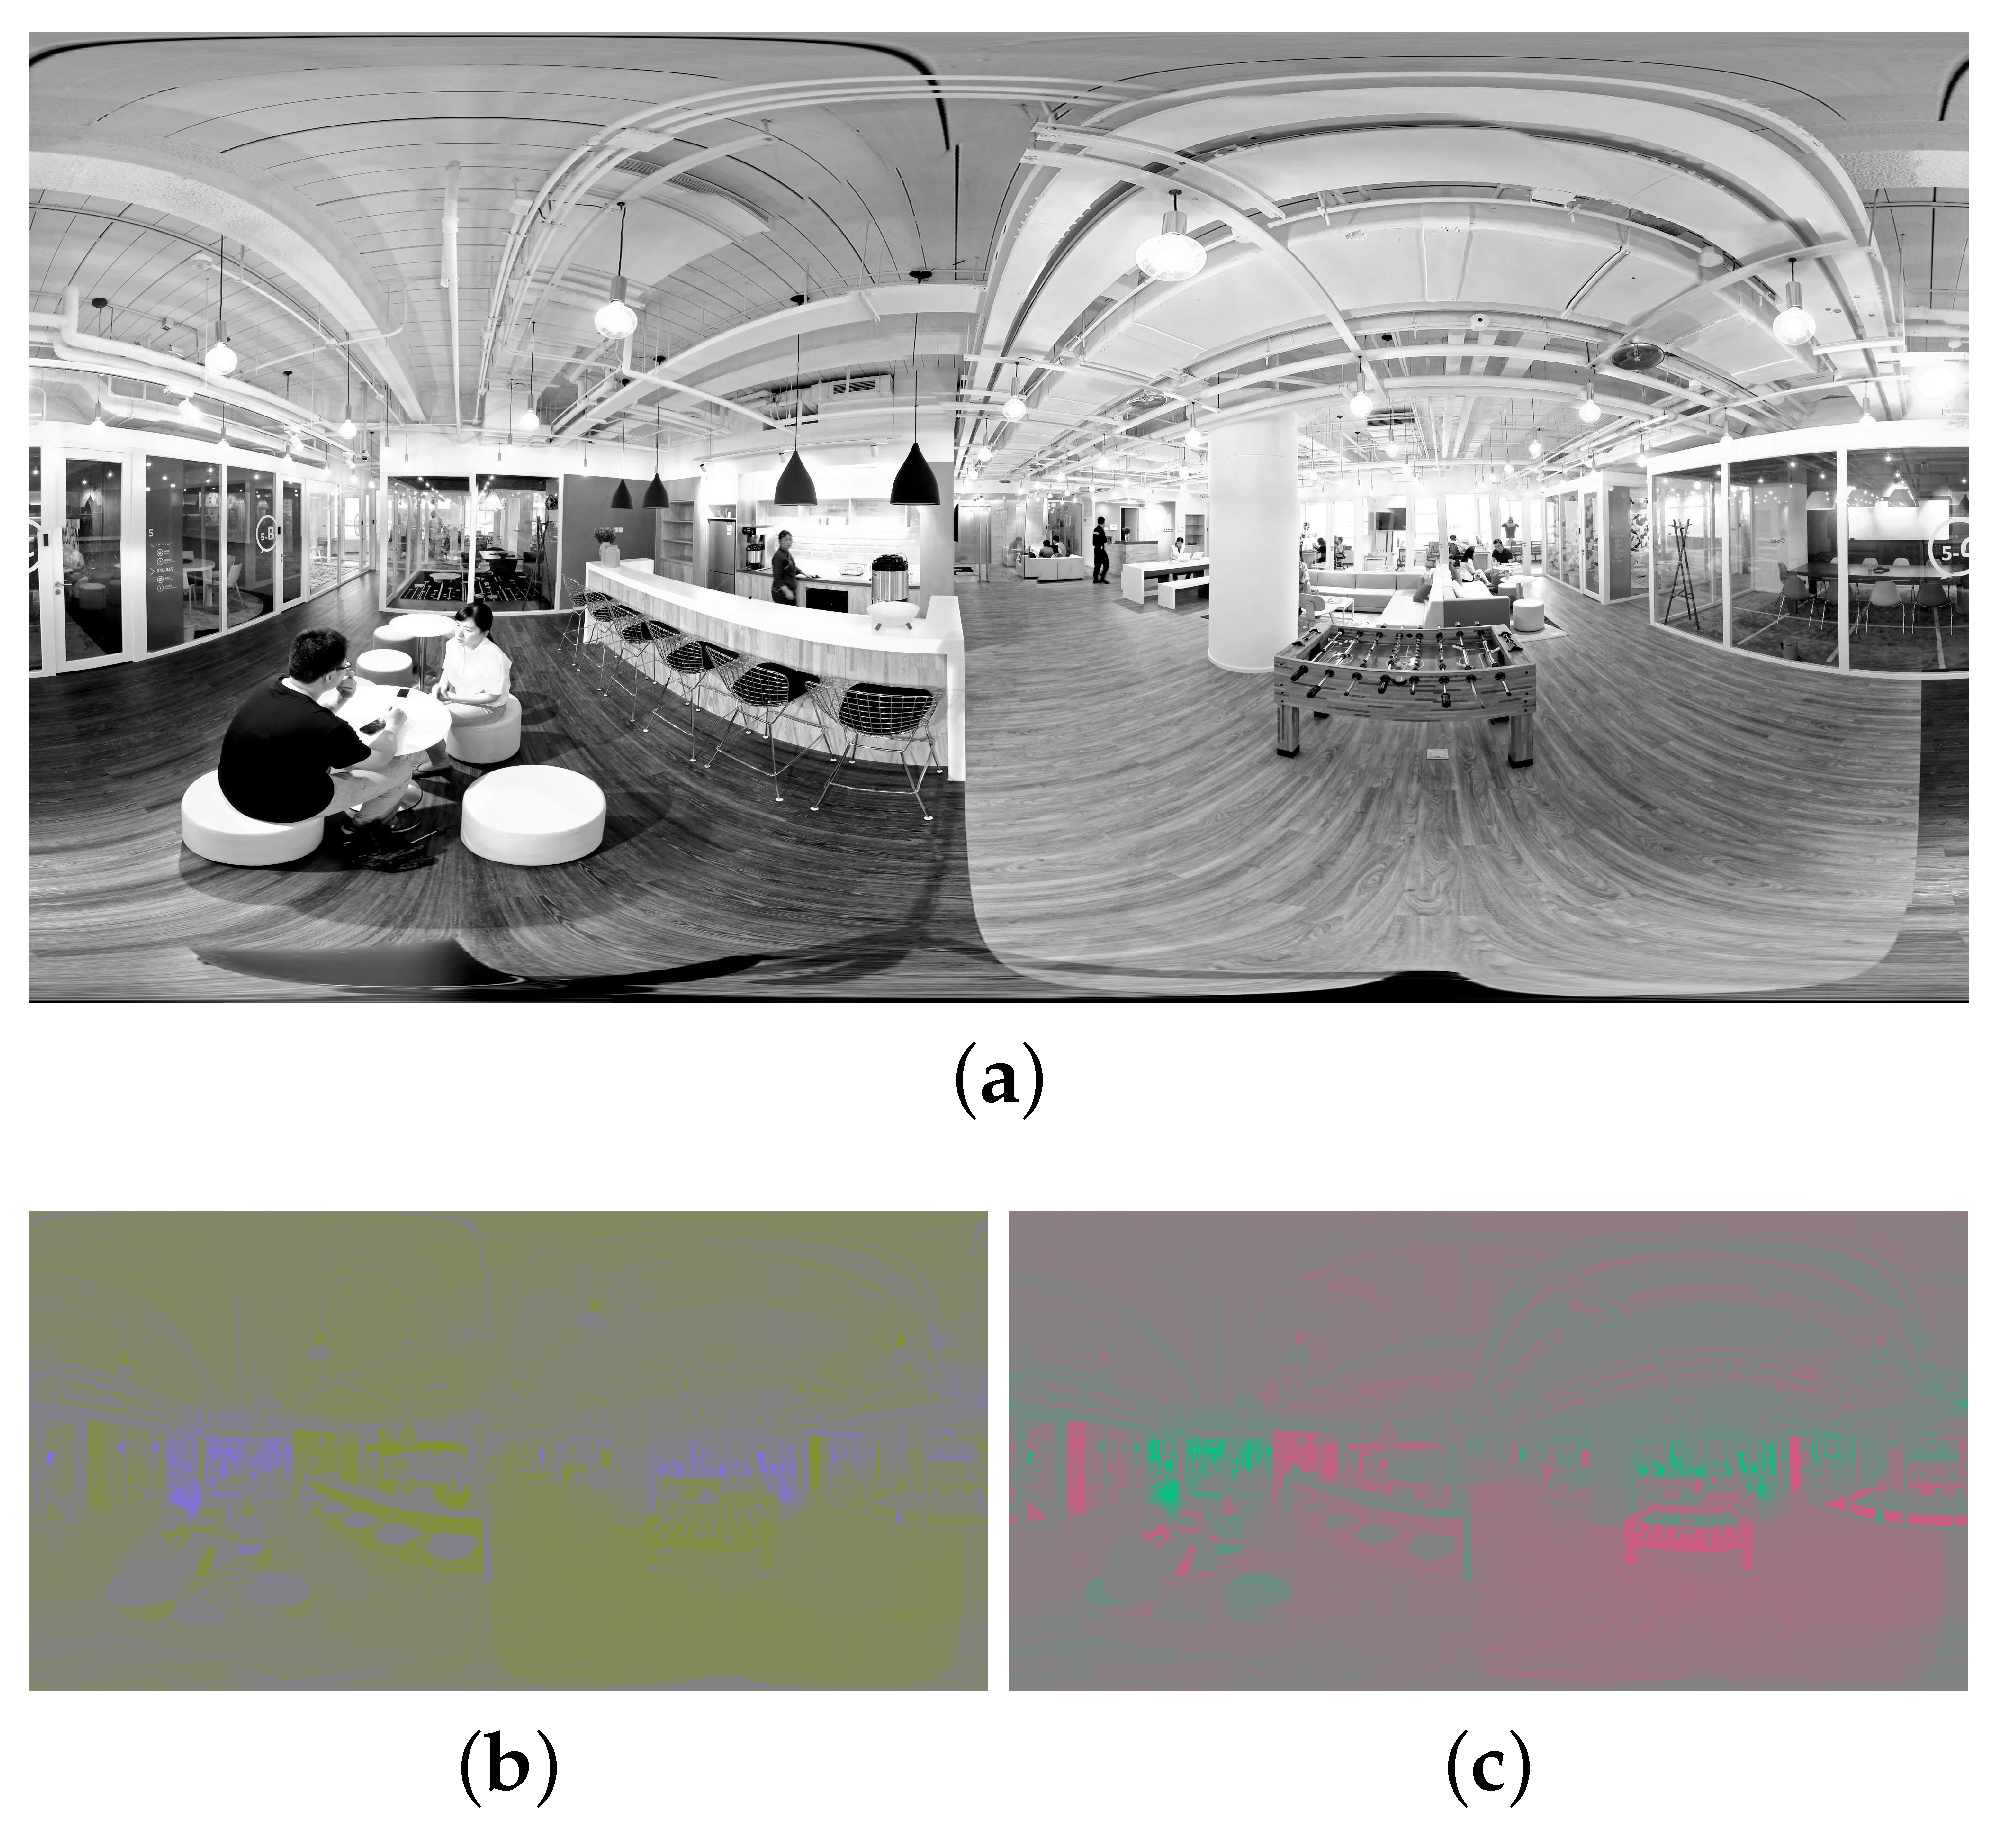
2.2. YUV Color Encoding

YUV color encoding is widely used to reduce the amount of data associated with the red, green, and blue (RGB) color model. Here, Y denotes the luminance component, and U and V stand for the chrominance components Cr and Cb, respectively. The YUV model takes advantage of the HVS relying strongly on the accuracy of the brightness information contained in the luminance component for discerning spatial detail while spatial sensitivity to color is rather low. This mechanism allows for lossy subsampling of the chrominance components of a color stimulus which reduces file size without considerable impact on perceptual quality. A subsampling scheme is defined by the pixel width J, the number a of chrominance samples in the first row of J pixels, the number b of changes of chrominance samples between first and second row of J pixels, and is denoted accordingly as J:a:b. In this paper, we use the YV12 format which is a specific version of the YUV420 format but with the U and V plane switched. It comprises of an 8 bit Y plane of resolution N × M (width × height) followed by 8 bit 2 × 2 subsampled N / 2 × M / 2 V and U planes [15]. The YV12 format can be processed with the same algorithm as the YUV4:2:0p format (see Figure 2) with chroma (color difference signal) being horizontally and vertically subsampled by a factor of 2.

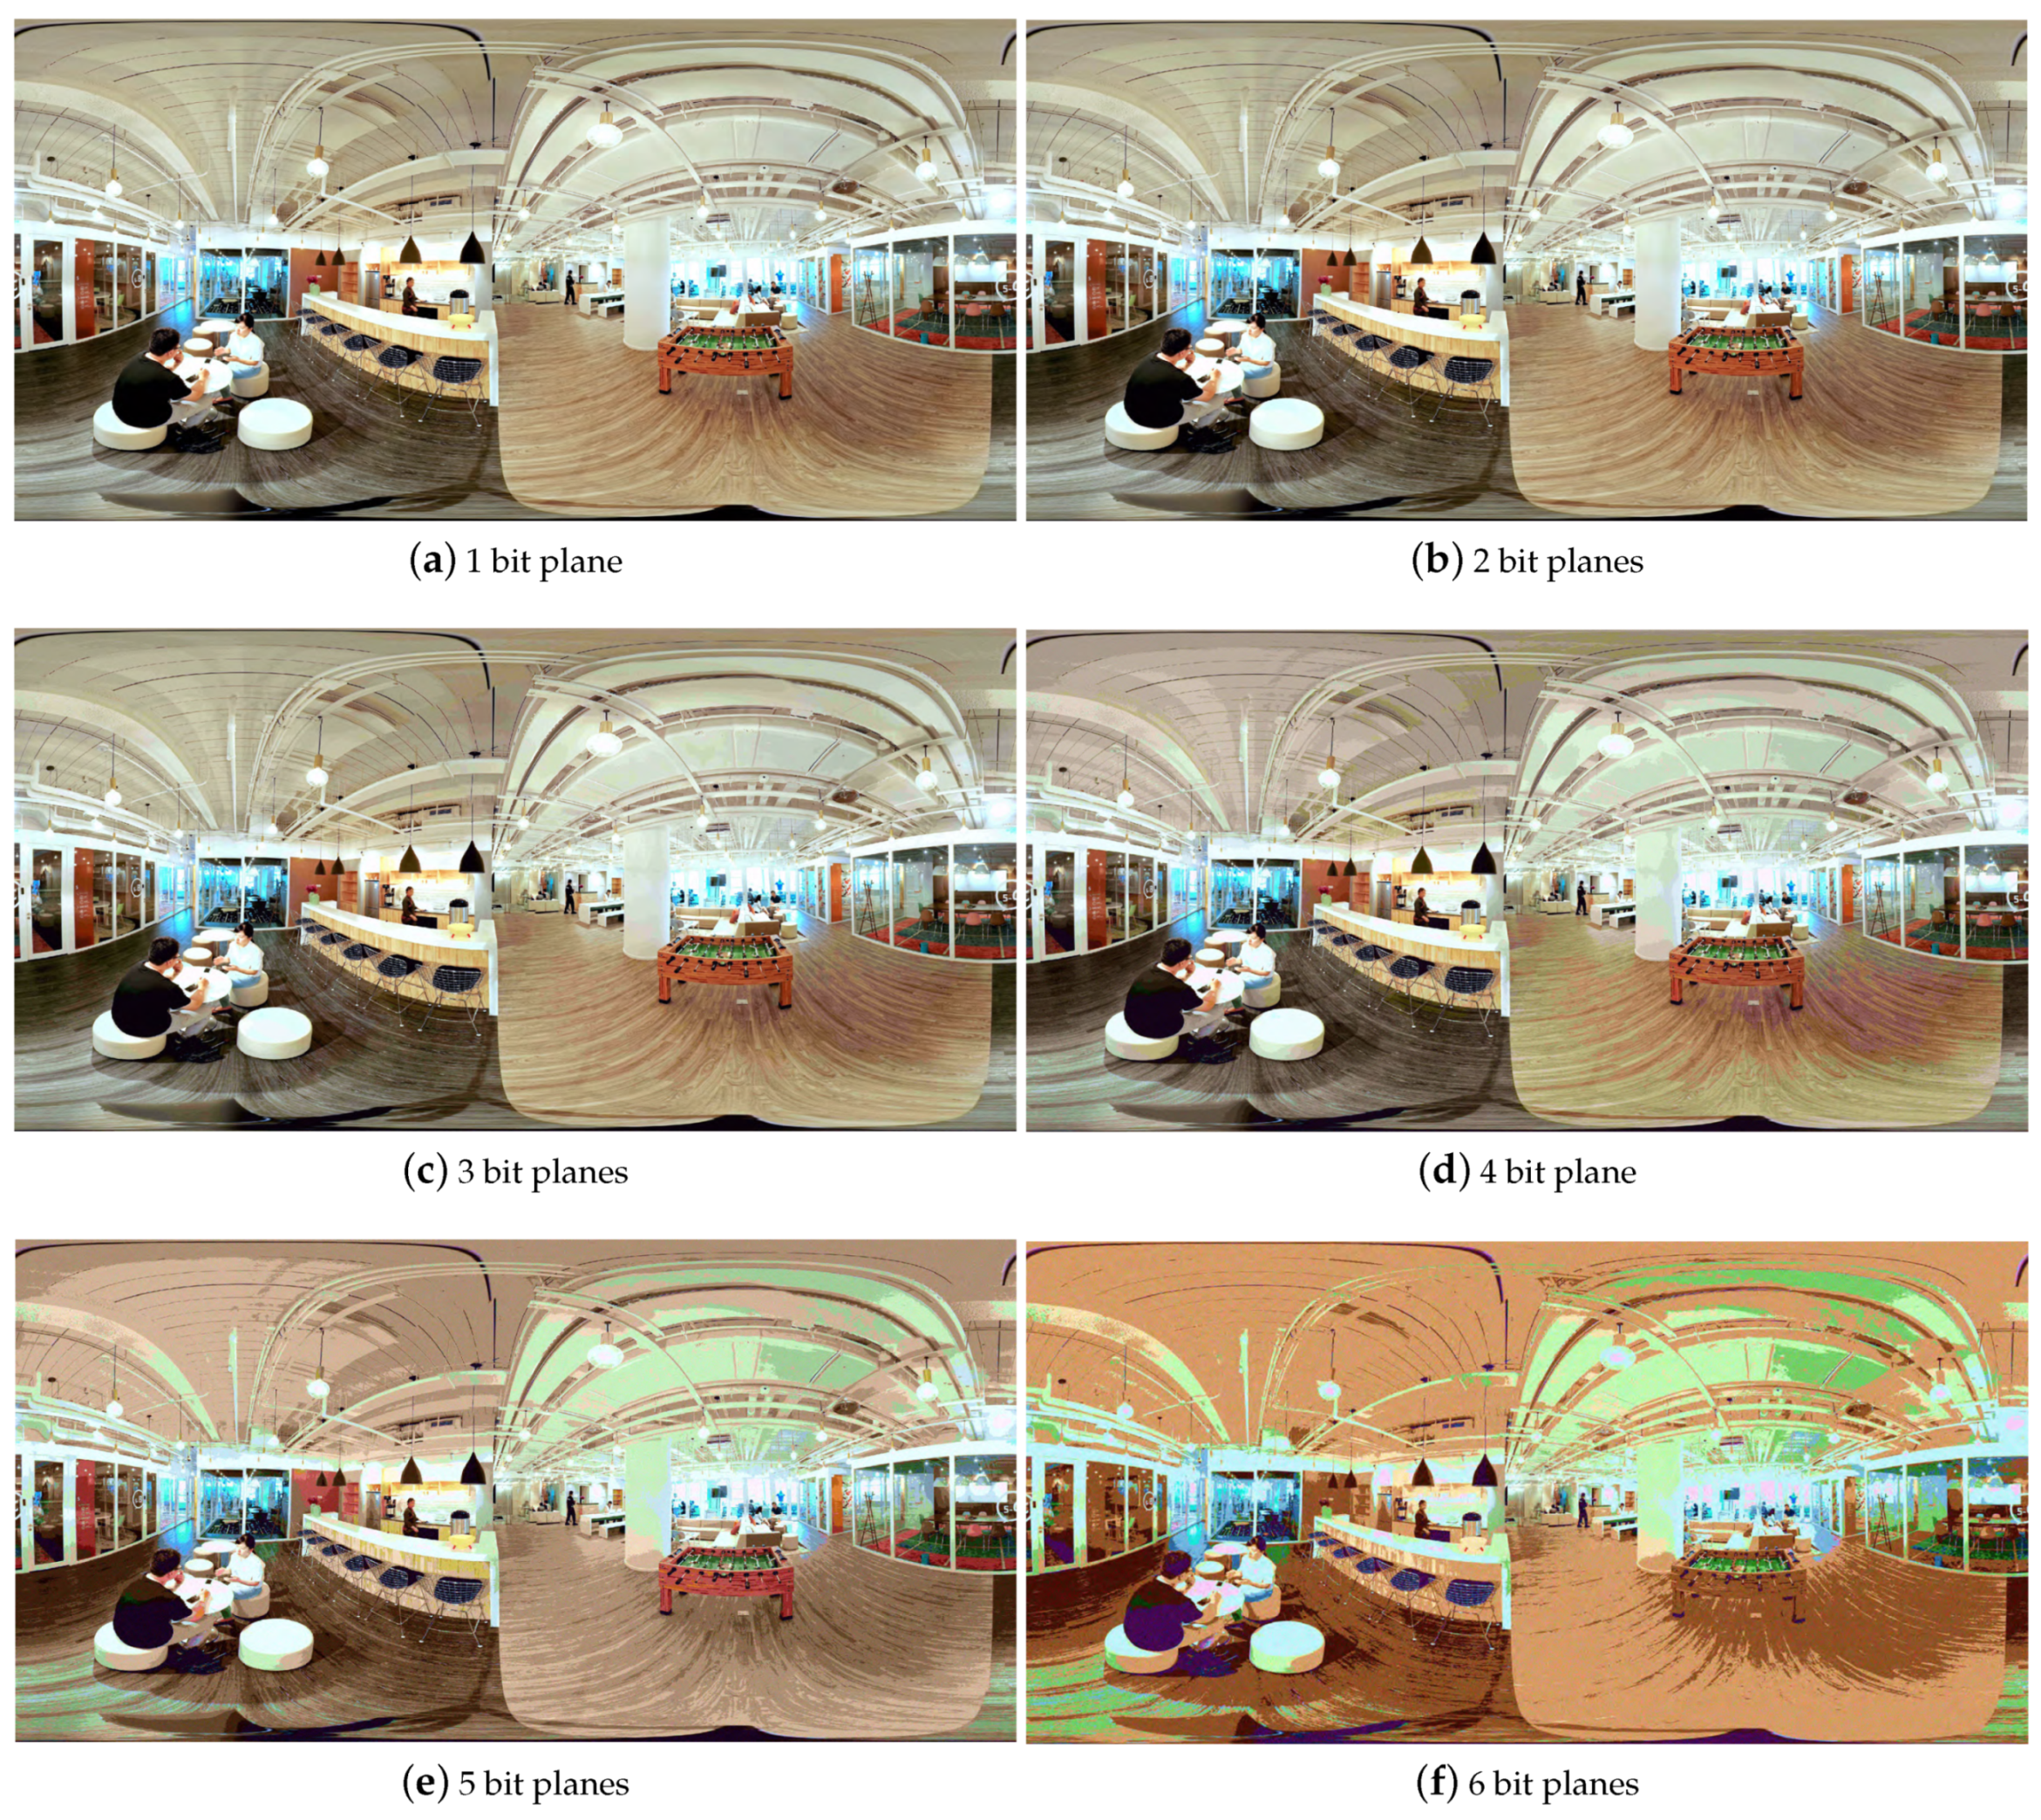
2.3. LSB Data Hiding Approach
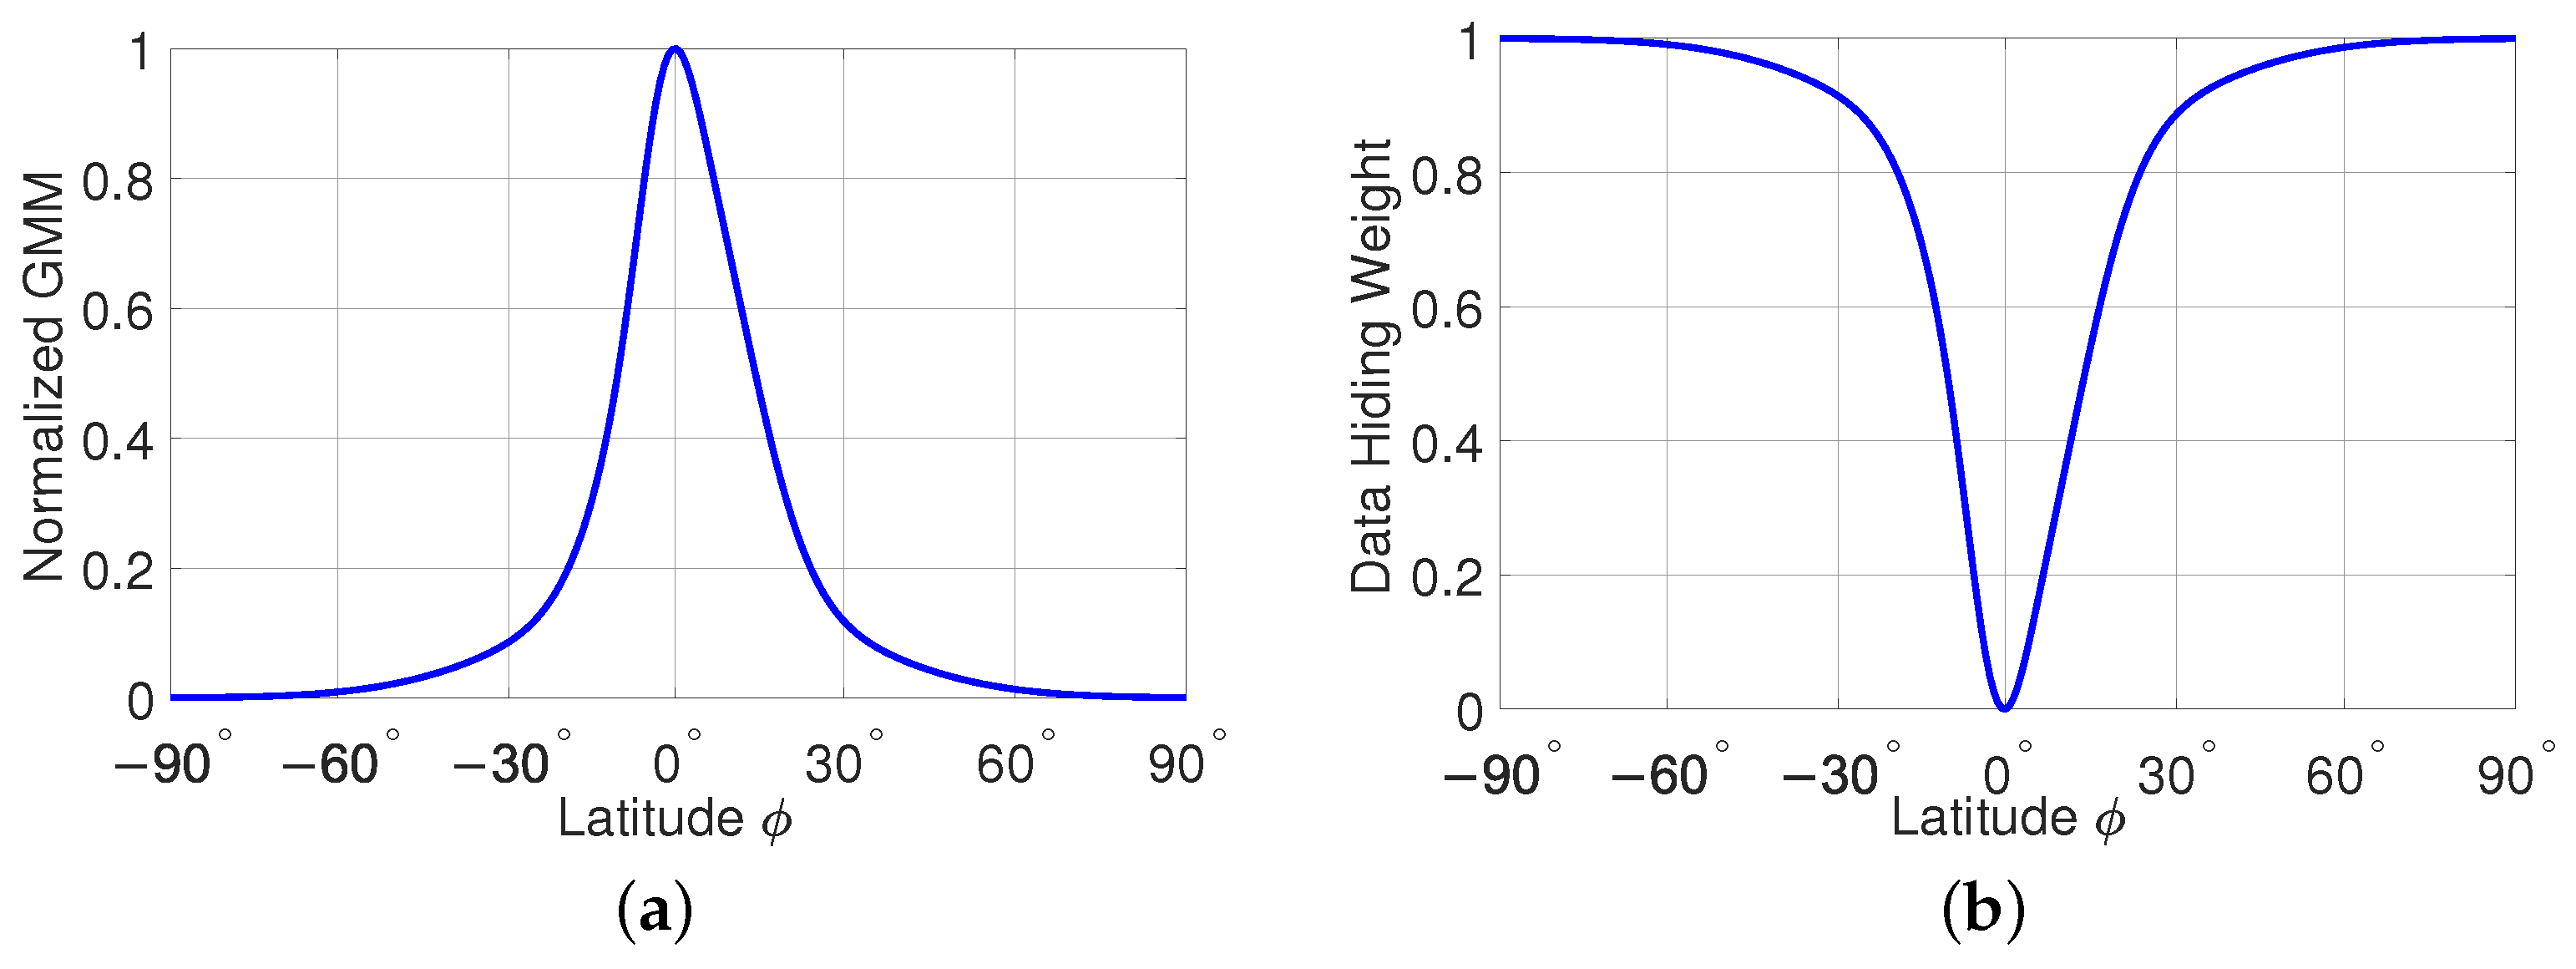
The term least significant bit refers to a bit that has the lowest order in a multiple-bit binary number. Regarding data hiding in digital visual media, the terms “significant” and “insignificant” also refer to the ability of a bit at a given bit plane b of a word or pixel of bit depth B to be changed with or without perceptual impact on the fidelity or quality of the digital stego-object. A modification of the LSBs of a sequence of words of a cover object by replacing them with the secret data has little effect on the quality of the generated stego-object. LSB data hiding may therefore also be extended to engage higher bit planes ranging from the LSB to the b-th rightmost LSB. The increase in data hiding capacity gained by engaging higher bit planes is to be traded off by a decrease in quality of the stego-object.
To alleviate the impact that data hiding in higher bit planes has on the quality of stego-videos, the spherical viewing direction characteristics of how humans watch 360° videos on HMDs can be explored. In particular, based on the analysis of an extensive subjective experiment, the work reported in [11] revealed that the latitude and longitude of viewing directions in this context are almost uncorrelated. This characteristic can be used to independently control the level of data hiding in the latitude and longitude depending on the viewing direction frequency along these coordinates. It has also be shown that the front region near the equator is much more frequently viewed compared to other regions. As such, the viewing direction frequency with respect to the latitude and longitude can be used to weight the amount of secret data to be hidden in different regions accordingly. In other words, regions that receive little attention can carry larger amounts of secret data compared to regions that are looked more frequently at. The analysis in [11] further indicated a high consistency in the viewed regions of the 360° videos across the participants. In view of these findings, we propose viewing direction based LSB data hiding that takes the viewing direction frequency along the latitude ϕ and longitude θ into account through suitable data hiding weight functions:
w1(ϕ):
Weight function accounting only for the viewing direction frequency along the latitude.
w2(θ):
Weight function accounting only for the viewing direction frequency along the longitude.
w3(ϕ, θ):
Weight function accounting for the viewing direction frequency along both the latitude and longitude.
Figure 3 summarizes the basic components of the processing chain of the proposed viewing direction based LSB data hiding for 360° videos. First, the 360° cover video is read, which is typically given in ERP format and using a prominent color encoding scheme such as the YUV format. Second, the frames of the 360° cover video are structured into smaller segments with respect to either the latitude, longitude, or both the longitude and latitude. Third, the data hiding weight function w 1 ( ϕ ) , w 2 ( θ ) , or  w 3 ( ϕ , θ ) , is selected depending on whether LSB data hiding is to be performed in the latitude, longitude, or both the longitude and latitude, respectively. Then, the data hiding parameters are set, i.e., the latitude ϕ and/or longitude θ up to which the secret data should be hidden and the number of bit planes to be used for data hiding. Subsequently, the secret data are read and hidden in the segments of the frames of the 360° cover video resulting in the frames of a 360° stego-video. For this purpose, the selected data hiding weight function is used to quantify the portion of each segment that can be used for data hiding depending on the latitude and/or longitude. Finally, the sequence of frames containing the secret data are put together to generate the 360° stego-video.

2.4. Pseudo Code of Viewing Direction Based LSB Data Hiding

The pseudo code of the proposed viewing direction based LSB data hiding method for 360° videos is given as Algorithm 1. Accordingly, the equirectangularly projected frames of the 360° cover video are read and are then YUV color encoded giving the respective resolutions of the Y, U, and V components. Each of these three components is then split into smaller segments, e.g., using a 1° step size. This splitting is performed according to the selected viewing direction based LSB data hiding strategy, i.e., vertically, horizontally, or both vertically and horizontally with respect to latitude, longitude, or both latitude and longitude. Subsequently, the data hiding weight function and the values of the latitude ϕ and/or longitude θ are selected up to which secret data should be hidden in each 360° cover video frame. Without loss of generality, data hiding is performed here from the south pole to the north pole and from the west to the east accounting for the data hiding weight function of the selected data hiding strategy. Once the number b of bit planes to be used for LSB data hiding has been selected, the number of secret data that can be hidden in a 360° cover video frame is calculated. On this basis, the secret data are then read as bitstream and the number of frames needed to hide the given amount of bits is calculated. Finally, LSB or b-rightmost LSB substitution is performed randomly in the segments selected in Step 5. A suitable pseudo-random number generator may be used to distribute the respective portions of the secret data randomly over the locations of each segment. For example, linear feedback shift registers or their software equivalents have widely been used as pseudo-random number generators for stream ciphers. In this case, in order to recover the secret data, the receiver would need to know the feedback taps of the register. This information is given by the coefficients of the feedback polynomial which can be stored at the receiver along with an agreed upon seed. The output of Algorithm 1 is a 360° stego-video.
Algorithm 1 Viewing Direction Based LSB Data Hiding in 360° Videos
1:
read equirectangular frames of the selected 360° cover video.
2:
perform YUV color encoding to obtain:
(1) Y frames of resolution N × M .
(2) U and V frames both of resolution N / 2 × M / 2 .
3:
split each Y, U, and V frame into smaller segments depending on the data hiding strategy:
(S1) Viewing direction based data hiding regarding latitude: split the frames vertically into smaller segments, e.g., 1° step size from −90° to 90° giving 181 segments.
(S2) Viewing direction based data hiding regarding longitude: split the frames horizontally into smaller segments, e.g., 1° step size from −180° to 180° giving 361 segments.
(S3) Viewing direction based data hiding regarding both latitude and longitude: split the frames both vertically and horizontally into smaller segments, e.g., 1° step size from −90° to 90° and −180° to 180° giving 65341 segments.
4:
select the data hiding weight function depending on the data hiding strategy:
(S1) Weight function for latitude: w 1 ( ϕ )
(S2) Weight function for longitude: w 2 ( θ )
(S3) Weight function for latitude and longitude: w 3 ( ϕ , θ )
5:
select the latitude ϕ and/or longitude θ up to which secret data should be hidden in the 360° cover video frames.
6:
select the number of bit planes b to be used for data hiding.
7:
calculate the amount of secret data that can be hidden in each segment of a 360° cover video frame for the selected data hiding strategy and selected latitude ϕ and/or longitude θ in Step 5 accounting for the respective data hiding weight function given in Step 4.
8:
read the secret data as bitstream of length L t o t .
9:
calculate the number of frames of the 360° cover video that is needed to hide the secret data of length L t o t .
10:
perform the LSB or b-rightmost LSB substitution randomly in the selected segments of the Y, U, and V frames of the 360° cover video.
11:
generate the 360° stego-video.

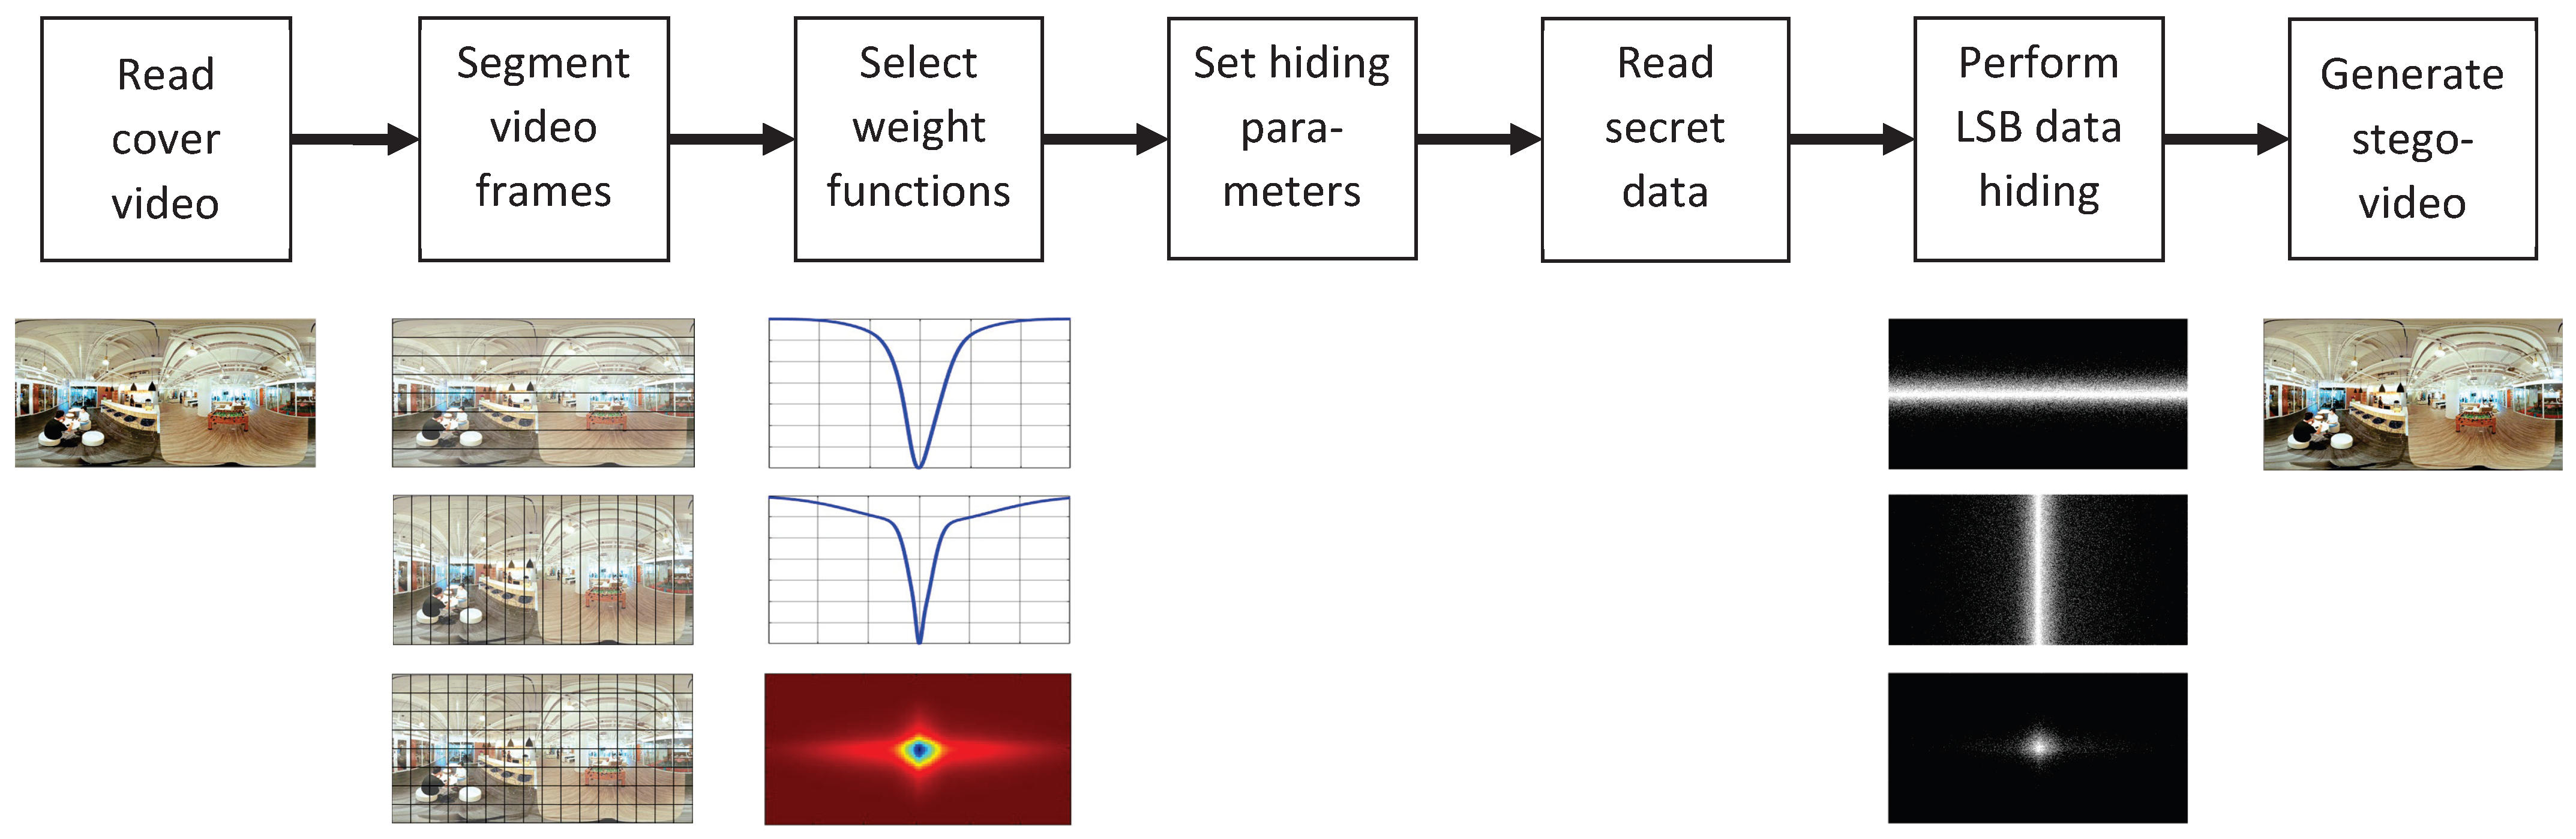
3. Cover Videos and Stego-Videos

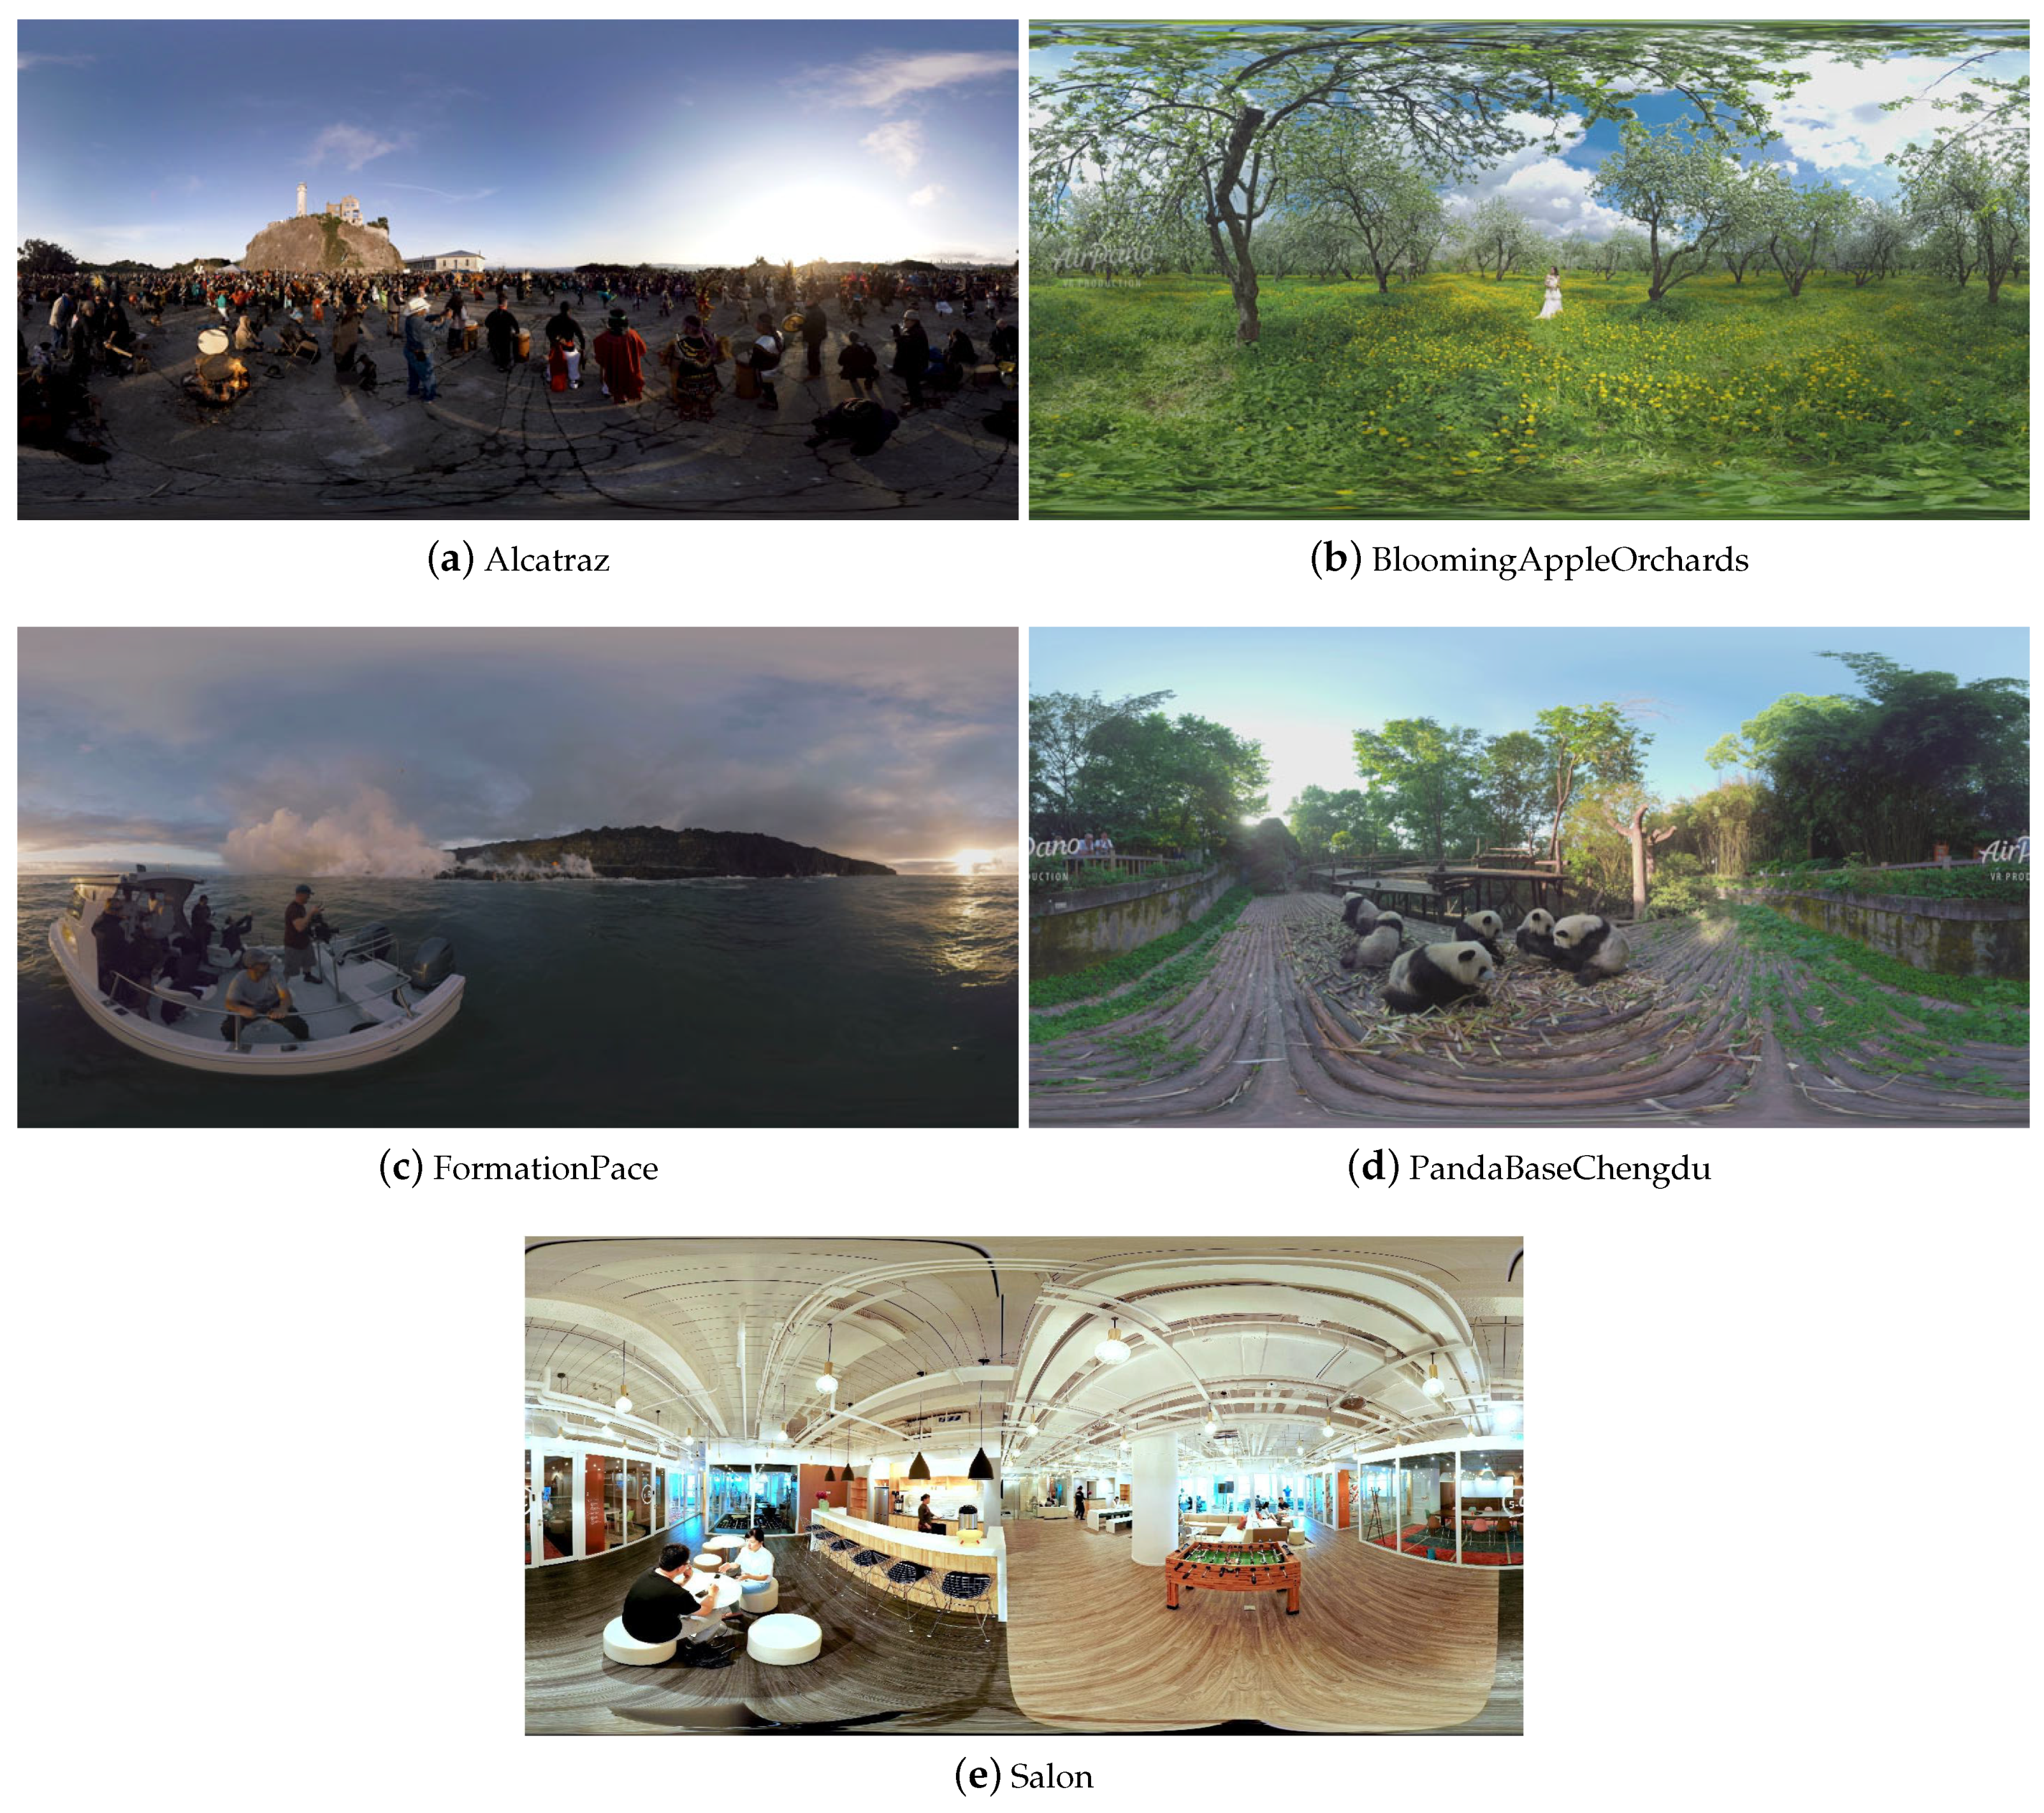
3.1. Cover Videos Used for Viewing Direction Based LSB Data Hiding

Five 360° video scenes were selected from the VQA-ODV database [16,17] to serve as 360° cover videos. Figure 4 shows sample frames of the 360° cover videos: “Alcatraz”, “BloomingAppleOrchards” (Blooming), “FormationPace” (Formation), “PandaBaseChengdu” (Panda), and “Salon”. The selected scenes span over a wide range of spatial perceptual information (SI) and temporal perceptual information (TI) as shown in Figure 5. SI measures the amount of spatial detail in a video, e.g., high contrast edges, fine detail, and textures. SI is higher for more spatially complex scenes. TI measures the amount of temporal change in a video sequence and is typically higher for high motion sequences. The 360° cover videos have a resolution of 4096 × 2048 pixels, a duration of 10 s, and a frame rate of 30 frames per second (fps). This provides a total of 300 frames for each 360° cover video that can be used for viewing direction based LSB data hiding.

3.2. Examples of Stego-Videos

The secret data to be hidden in the 360° cover video were selected as random binary bitstream that is produced to match the length related to the targeted capacity. In practical applications, the secret data can be any form of digital media such as digital audio, image, video, multimedia, or immersive media files.
Figure 6 shows sample 360° stego-video frames of scene “Salon” that were generated using Algorithm 1. In this example, latitude and longitude were used for viewing direction based LSB data hiding for the different cases of LSB substitution from b = 1 to b = 6 bit planes. These examples illustrate that imperceptible to little impairments on the visual quality of the 360° stego-video frames are induced by the viewing direction based LSB data hiding for the cases when b = 1 to 3 bit planes are used. The impact of data hiding on visual quality becomes increasingly visible when engaging b = 4 and more bit planes for data hiding. Apart of impairments on structural information, color changes become more pronounced when more bit planes are used.
Figure 7 presents TI versus SI of the 360° stego-videos. In particular, results are shown for the case that the entire frames of the 360° stego-videos are used for data hiding in b = 1 to b = 6 bit planes. It can be observed that the results for the 360° stego-videos are slightly scattered around the values for the 360° cover videos (black markers) for data hiding in b = 1 to b = 3 bit planes. Both TI and SI increase significantly for data hiding using b = 4 to b = 6 bit planes.

4. Models for Viewing Direction Based LSB Data Hiding

In [11], it was shown that the distribution of viewing directions of how users watch 360° videos on an HMD can be formulated as a GMM. The GMM has been derived from viewing direction data obtained from a subjective experiment with 40 participants. All participants watched 48 360° videos generated from 5 different video scenes (contents) of resolution between 2800 × 1440 pixels and 7680 × 3840 pixels, and duration from 20 s to 60 s duration. The participants were seated on a swivel chair in order to support free scene exploration of the 360° videos which were shown on an HTC Vive HMD. As such, this experimental design is in line with Recommendation ITU-T P.919 [10] in terms of seating arrangements and the required number of participants. The recorded Euler angles, i.e., inclination and azimuth angles, were used to calculate the viewing directions of each participant in terms of longitude and latitude. The analysis of the obtained viewing directions revealed that longitude and latitude of subjects’ viewing are almost uncorrelated. This finding has led to the formulation of GMMs for longitude and latitude, and a GMM considering both longitude and latitude.

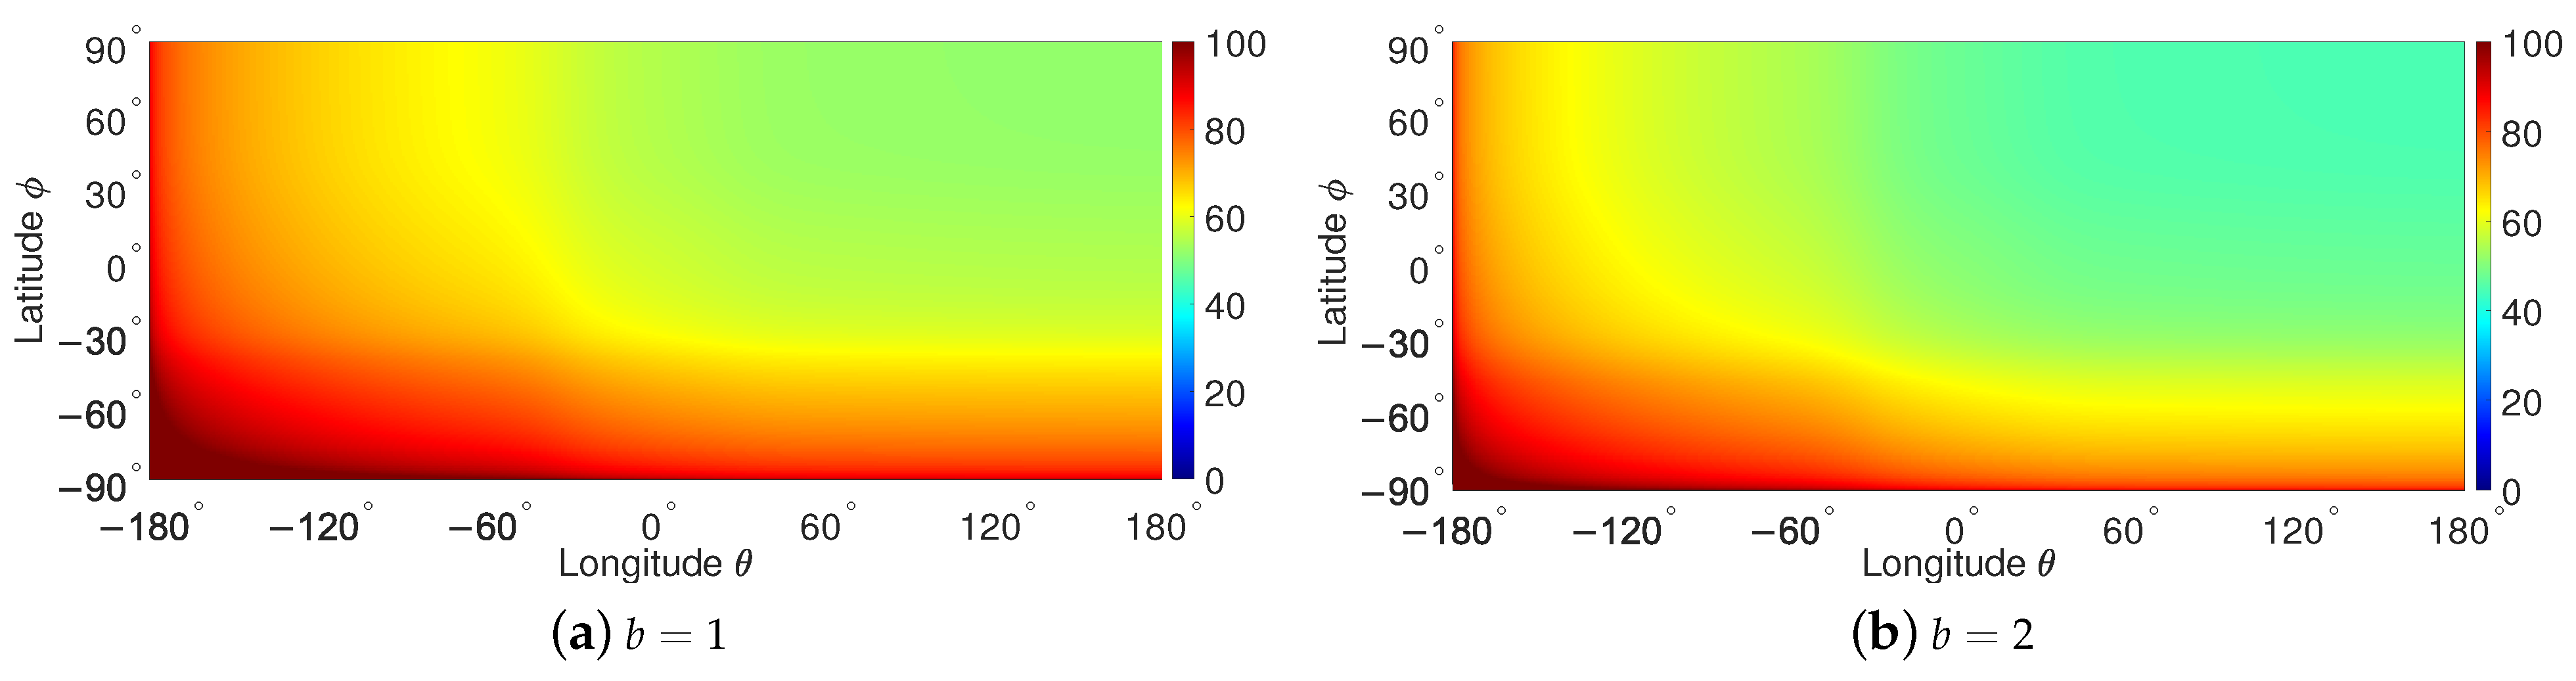
4.1. Normalized Relative Viewing Direction Frequency and Data Hiding Weight Functions

Normalized versions of the relative viewing direction frequencies represented by the GMMs in [11] are provided and used in the following to formulate the weights for data hiding in latitude, longitude, and both latitude and longitude.

4.1.1. GMM for the Latitude

The GMM for the latitude viewing direction ϕ [ 90 , 90 ] can be expressed as a sum of three Gaussian components (see Equation (12) [11]):
f ( ϕ ) = k = 1 3 a k exp ϕ b k c k 2
A normalized GMM with respect to the maximum relative latitude viewing direction frequency can be obtained from the GMM in (1) as
f ^ ( ϕ ) = f ( ϕ ) max 90 ϕ 90 f ( ϕ ) = k = 1 3 a ^ k exp ϕ b k c k 2
where the normalized peak height a ^ k of the kth component of f ^ ( ϕ ) is given by
a ^ k = a k max 90 ϕ 90 f ( ϕ ) ; k = 1 , 2 , 3
The values of the peak height a ^ k , center position b k , and standard deviation c k of the components of the normalized GMM f ^ ( ϕ ) are provided in Table 1.
The expression f ^ ( ϕ ) in (2) can readily be applied to specify a viewing direction based data hiding weight function w 1 ( ϕ ) as follows. As users tend to give higher attention to the area near the equator compared to the poles, modification of the structure of a scene due to data hiding should be kept small near the equator while increasing amounts of data may be hidden in the viewing regions closer to the poles. The data hiding weight function w 1 ( ϕ ) with respect to latitude may therefore be formulated as complement of the normalized relative viewing direction frequency f ^ ( ϕ ) , i.e.,
w 1 ( ϕ ) = 1 f ^ ( ϕ )
Figure 8 shows the progression of the normalized GMM f ^ ( ϕ ) versus latitude ϕ and related viewing direction based data hiding weight function w 1 ( ϕ ) .
An example of a binary map of pixels to be used for data hiding in a frame of a 360° cover video is shown in Figure 9. Black pixels indicate positions where data hiding is performed while white pixels are kept free from data hiding. The amount of pixels used for data hiding at each latitude ϕ is determined by the data hiding weight function w 1 ( ϕ ) and placed randomly across the entire longitude range for a given latitude ϕ . As such, the progression of w 1 ( ϕ ) in Figure 8 can be observed in the binary map in Figure 9 when moving from the south pole over the equator to the north pole and vice versa.

4.1.2. GMM for the Longitude

Similar to the latitude, a GMM for the longitude viewing direction θ [ 180 , 180 ] can be formulated as (see Equation (12) [11]):
g ( θ ) = l = 1 3 a l exp θ b l c l 2
The related normalized GMM with respect to the maximum relative longitude viewing direction frequency is obtained from (5) as
g ^ ( θ ) = g ( θ ) max 180 θ 180 g ( θ ) = l = 1 3 a ^ l exp θ b l c l 2
where the normalized peak height a ^ l of the lth component of g ^ ( θ ) is given by
a ^ l = a l max 180 θ 180 g ( θ ) ; l = 1 , 2 , 3
The values of the peak height a ^ l , center position b l , and standard deviation c l of the components of the normalized GMM g ^ ( θ ) are provided in Table 2.
Accordingly, the data hiding weight function w 2 ( θ ) with respect to the longitude can be written as
w 2 ( θ ) = 1 g ^ ( θ )
Figure 10 shows the normalized GMM g ^ ( θ ) and the viewing direction based data hiding weight function w 2 ( θ ) for the longitude θ .
Figure 11 shows an example of a binary map of random data hiding positions along the longitude. With this data hiding strategy, the function w 2 ( θ ) specifies the data hiding weight for a given longitude θ . The respective data hiding weight is then applied for random data hiding across the entire latitude range for a fixed longitude θ .

4.1.3. GMM for Latitude and Longitude

The normalized GMM accounting for both the latitude viewing direction and the longitude viewing direction can be obtained from (2) and (6) as follows:
u ^ ( ϕ , θ ) = f ( ϕ ) · g ( θ ) max 90 ϕ 90 , 180 θ 180 [ f ( ϕ ) · g ( θ ) ] = f ( ϕ ) max 90 ϕ 90 f ( ϕ ) · g ( θ ) max 180 θ 180 g ( θ ) = f ^ ( ϕ ) · g ^ ( θ )
where the maximum of the product of two independent functions in the denominator of (9) has been expressed as the product of the maximum of the two individual functions. This formulation is applicable because the latitude and the longitude in the underlying bivariate Gaussian distributions are uncorrelated. This property allows writing the GMM accounting for both latitude and longitude into a product of the GMM for latitude and GMM for longitude. Furthermore, the involved Gaussian distributions in latitude and longitude are positive and have only a single maximum.
In view of (9), the data hiding weight function w 3 ( ϕ , θ ) regarding latitude viewing direction and longitude viewing direction is given by
w 3 ( ϕ , θ ) = 1 u ^ ( ϕ , θ )
Figure 12 shows the heatmap of the normalized relative viewing direction frequency (9) and the data hiding weight function (10). Here, the heatmap adjusts the colormap relating to the minimum data value (zero) and maximum data value (one) in the matrix map to the lowest color (blue) and highest color (red), respectively. As the normalized relative viewing direction given by (9) is focused on the front center region near the equator, the data hiding weight is small in this region (blue) and becomes larger outside this region (shift towards red).
The binary map of random data hiding positions along the latitude and longitude is shown in Figure 13 illustrating that a large area can be used for data hiding.

5. Capacity

An important metric used for evaluating the performance of data hiding methods is the data hiding capacity or capacity which refers to the number of secret bits that can be embedded in a cover object. For digital videos, capacity can be defined as the average number of secret bits concealed in each video frame which is measured in bits per pixel per frame (bpp/frame). In the context of the considered application of 360 cover videos with viewing direction based LSB data hiding, the cumulative capacity in bpp/frame with respect to increasing latitude, longitude, and a combination of latitude and longitude for a color or luminance component and a given number of bit planes b can be obtained by integrating (4), (8), (10), over the respective angles, i.e.,
C 1 ( ϕ , b ) = b 180 90 ϕ w 1 ( x ) d x
C 2 ( θ , b ) = b 360 180 θ w 2 ( y ) d y
C 3 ( ϕ , θ , b ) = b 180 · 360 90 ϕ 180 θ w 3 ( x , y ) d x d y
with latitude ϕ [ 90 , 90 ] and longitude θ [ 180 , 180 ] .

5.1. Capacity for Data Hiding in the Latitude

The capacity for the case that viewing direction based data hiding is performed in the latitude ϕ [ 90 , 90 ] can be formulated with (2), (4), and (11) as
C 1 ( ϕ , b ) = b 180 90 ϕ d x 90 ϕ k = 1 3 a ^ k exp x b k c k 2 d x
Applying the method of integration by substitution for the second integral in (14) with u = ( x b k ) / c k , d x = c k d u , u 1 = ( 90 b k ) / c k , and u 2 = ( ϕ b k ) / c k , we obtain
C 1 ( ϕ , b ) = b 180 ( ϕ + 90 ) k = 1 3 a ^ k c k u 1 u 2 exp u 2 d u = b 180 ( ϕ + 90 ) k = 1 3 a ^ k c k u 1 0 exp ( u 2 ) d u + 0 u 2 exp ( u 2 ) d u = b 180 ( ϕ + 90 ) π 2 k = 1 3 a ^ k c k erf ϕ b k c k erf 90 b k c k
where a ^ k , b k , and c k are given in Table 1, and erf ( · ) denotes the error function Equation (7.1.1) [19]
erf ( ϕ ) = 2 π 0 ϕ exp t 2 d t

5.2. Capacity for Data Hiding in the Longitude

Similar as for the latitude, the method of integration by substitution can be applied to derive an expression for the capacity for the case that viewing direction based data hiding is performed in the longitude θ [ 180 , 180 ] . Using (6), (8), and (12), following the same steps as in the derivation of (15), an expression for the capacity is obtained as
C 2 ( θ , b ) = b 360 ( θ + 180 ) π 2 l = 1 3 a ^ l c l erf θ b l c l erf 180 b l c l
where the parameters a ^ l , b l , and c l of the GMM for the longitude are provided in Table 2.

5.3. Capacity for Data Hiding in Latitude and Longitude

The capacity for the case that data hiding is performed in both the latitude and longitude can be derived using (9), (10), and (13) as follows:
C 3 ( ϕ , θ , b ) = b 180 · 360 90 ϕ d x 180 θ d y 90 ϕ f ^ ( x ) d x 180 θ g ^ ( y ) d y = b 180 · 360 ( ϕ + 90 ) ( θ + 180 ) π 4 k = 1 3 a ^ k c k erf ϕ b k c k erf 90 b k c k × l = 1 3 a ^ l c l erf θ b l c l erf 180 b l c l

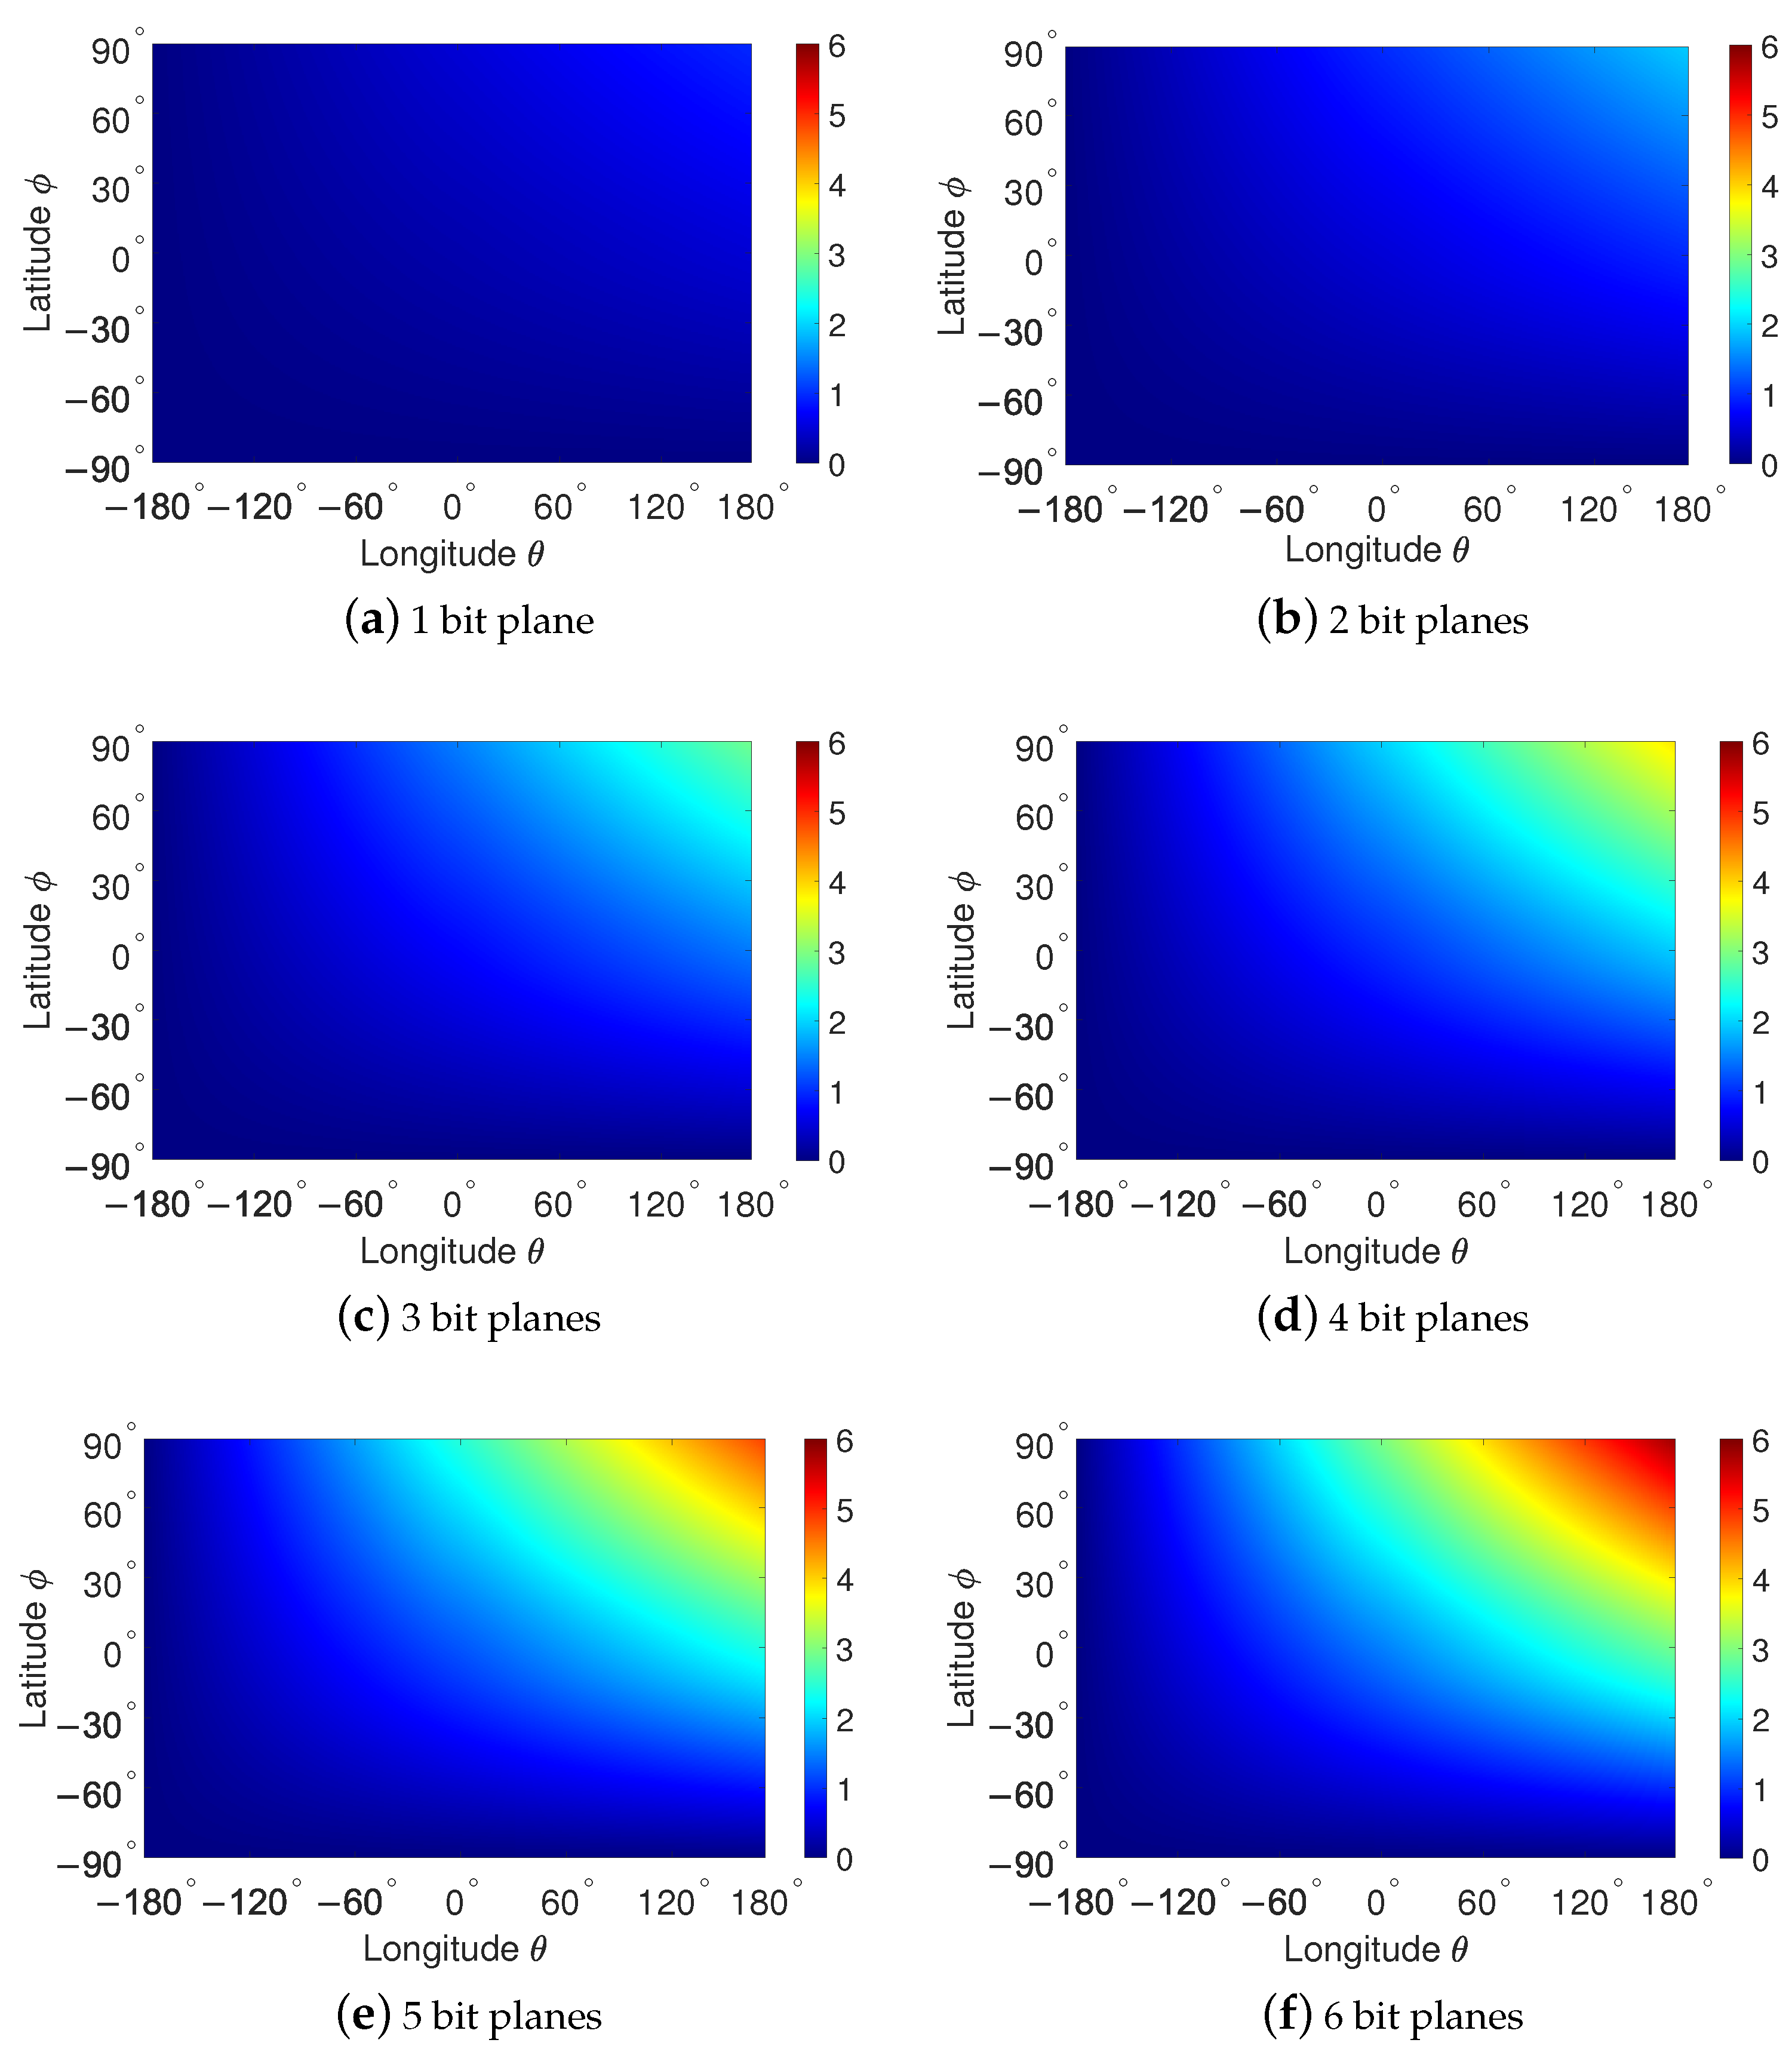
5.4. Numerical Results for Capacity

Figure 14 shows the progression of the capacity C 1 ( ϕ , b ) and C 2 ( θ , b ) of viewing direction based LSB data hiding in 360 cover videos as a function of latitude ϕ and longitude θ , respectively, and different number of bit planes b = 1 , 2 , , 6 bits. It can be observed that significant capacity is cumulated for the latitude progressing from the south pole ( ϕ = 90 ) to around 6 and from around 6 to the north pole ( ϕ = 90 ) while the equator region contributes little capacity for data hiding (see Figure 14a). Similarly, significant capacity is cumulated for the longitude progression from the west ( θ = 180 ) to around 6 and from around 6 to the east ( θ = 180 ) while the center region does not contribute much to the capacity (see Figure 14b).
Figure 15 provides heatmaps for the capacity C 3 ( ϕ , θ , b ) as a function of both latitude ϕ and longitude θ subject to different numbers of bit planes b = 1 , 2 , , 6 bits. The lowest color (blue) and highest color (red) of the colormap correspond to 0 and 6 bpp per frame. The viewing direction based data hiding accounting for both latitude and longitude starts at the south pole ( ϕ = 90 ) and the west ( θ = 180 ) and ends at the north pole ( ϕ = 90 ) and the east ( θ = 180 ). The heatmaps illustrate that data hiding in 1 bit plane and 2 bit planes offers relatively low capacity compared to the cases where more bit planes are used. In case of 6 bit planes, a capacity approaching 6 bpp per frame can be achieved when the entire 360° cover video frame is used for data hiding.
The total capacity in number of secret bits per frame that can be hidden in a color or luminance component per frame is obtained by multiplying (15), (17), and (18) with the resolution N × M of a given 360° video as
C 1 = C 1 ( ϕ = 90 , b ) · ( N × M )
C 2 = C 2 ( θ = 180 , b ) · ( N × M )
C 3 = C 3 ( ϕ = 90 , θ = 180 , b ) · ( N × M )
where N and M, respectively, are the width and height of a frame in terms of pixels. Table 3 shows examples of the total capacity per frame that is provided by popular 360° video resolutions. Depending on the number of bit planes used for viewing direction based data hiding and the selected resolution, total capacity ranges from 1.74 to 172.04 Mbits per frame. As data hiding degrades the visual quality of the 360° video frames, the wide range of total capacities allows for trading off capacity versus quality such that sufficient data can be hidden per frame while keeping visual quality at a satisfactory level.
Furthermore, the capacity for different video color encoding formats can be obtained as a multiple of the capacity of color or luminance component given in (19), (20), and (21). Specifically, for a color encoded format using digital gamma-corrected RGB components, the capacity is obtained as
C R G B = 3 × C , C { C 1 , C 2 , C 3 }
while the capacity for the YV12 format is given by
C Y V 12 = 1.5 × C C { C 1 , C 2 , C 3 }

6. Fidelity Assessment of Viewing Direction Based LSB Data Hiding

Video fidelity refers to the ability to distinguish between two videos, i.e., an original video and the corresponding processed video which may contain visible distortions. The higher the fidelity, the lower are the distortions that were induced by the processing to the original video. In the context of this work, the processing relates to the viewing direction based LSB data hiding in 360° cover videos while the fidelity assessment is performed on the generated 360° stego-videos.

6.1. Fidelity Metrics

In this section, we present the PSNR-based metrics that were used to assess the fidelity of the proposed viewing direction based LSB data hiding. In particular, the well-known PSNR and WS-PSNR are briefly described while the detailed derivation of the cumulative PSNR and cumulative WS-PSNR can be found in Appendix A. Furthermore, a more comprehensive description of the NCP-PSNR is provided here because of its direct relationship to the proposed viewing direction based LSB data hiding. Cumulative versions of these metrics are used in this work to assess the fidelity of 360° stego-videos regarding data hiding with increasing latitude, longitude, or both latitude and longitude.

6.1.1. Peak-Signal-to-Noise Ratio

The PSNR is a fidelity metric that measures pixel-by-pixel closeness between an original video and the processed video. It disregards structural artifacts such as blocking, ringing, and intensity masking. The higher the PSNR, the lower the distortions in the processed video. Although PSNR may not always correlate well with subjective quality as perceived by humans [20,21], it is often used for comparison purposes because of its low computational complexity and ease of implementation. In this section, the PSNR is cumulated as a function of latitude, longitude, and both latitude and longitude, i.e., PSNR( ϕ ), PSNR( θ ), and PSNR( ϕ , θ ), respectively. This formulation allows assessing the cumulated effect of viewing direction based LSB data hiding on fidelity when performed up to given coordinates of the 360° stego-video frames. A detailed derivation of the cumulative PSNRs is provided in Appendix A.1.

6.1.2. Weighted-to-Spherical-Uniform PSNR

Regarding networked multimedia applications, it is desirable to use source encoding formats for 360° videos that are readily available for conventional videos. For this purpose, the samples on the spherical surface need to be mapped onto the plane. Because the relationship between the pixels in these two spaces is non-linear, fidelity assessment of algorithms in 360° video processing chains needs to be spherically performed such that distortions are measured correctly. The WS-PSNR was proposed in [22] which accounts for the warping effect caused by the mapping between the plane and the sphere. WS-PSNR first measures the distortions of samples in the plane and then weights these distortions with respect to the projection area of the corresponding surface on the sphere. Hereinafter, the ERP illustrated in Section 2.1 and the related weighting of the induced distortions is used in the calculation of the WS-PSNR. Similar as for PSNR, cumulative WS-PSNRs, i.e., WS-PSNR( ϕ ), WS-PSNR( θ ), and WS-PSNR( ϕ , θ ), are derived as is shown in Appendix A.2.

6.1.3. Non-Content-Based Perceptual PSNR

The NCP-PSNR, that has recently been proposed in [11], is an objective visual quality metric for 360° videos that takes into account the viewing direction according to the possibility of attracting human attention. The analysis of the viewing direction data in terms of Euler angles, which were recorded in an extensive subjective experiment, leads to an GMM u ( ϕ , θ ) for the viewing direction distribution in latitude ϕ and longitude θ . Given a 360° video of resolution N × M with ERP, the probability of a pixel with coordinates ( s , t ) being in the viewing direction during a given frame is obtained according to [11] as
v ( s , t ) = u 180 t 1 M 1 1 2 , 360 s 1 N 1 1 2
where pixel coordinates are within the intervals 1 s N and 1 t M . Then, a normalized non-content-based weight map is obtained as
w ^ ( s , t ) = w ( s , t ) s , t w ( s , t )
It should be mentioned that the non-content-based weight map w ( s , t ) in (25) is defined in [11] using (24) as
w ( s , t ) = max s , t V s , t v ( s , t )
where V s , t denotes the collection of the viewing directions of all viewports that include the pixel ( s , t ) .
Using (25) to weight the mean square error between the intensities I ( s , t ) and J ( s , t ) at pixel ( s , t ) of an original and processed 360° video frame, the NCP-PSNR can be calculated as follows [11]:
NCP PSNR = 10 log MAX 2 s , t I ( s , t ) J ( s , t ) 2 · w ^ ( s , t )
where MAX denotes the maximum pixel intensity for the given bit depth.
As with PSNR and WS-PSNR, cumulative versions of NCP-PSNR, i.e., NCP-PSNR( ϕ ), NCP-PSNR( θ ), and NCP-PSNR( ϕ , θ ), can be straightforwardly defined to assess the fidelity of viewing direction based LSB data hiding.

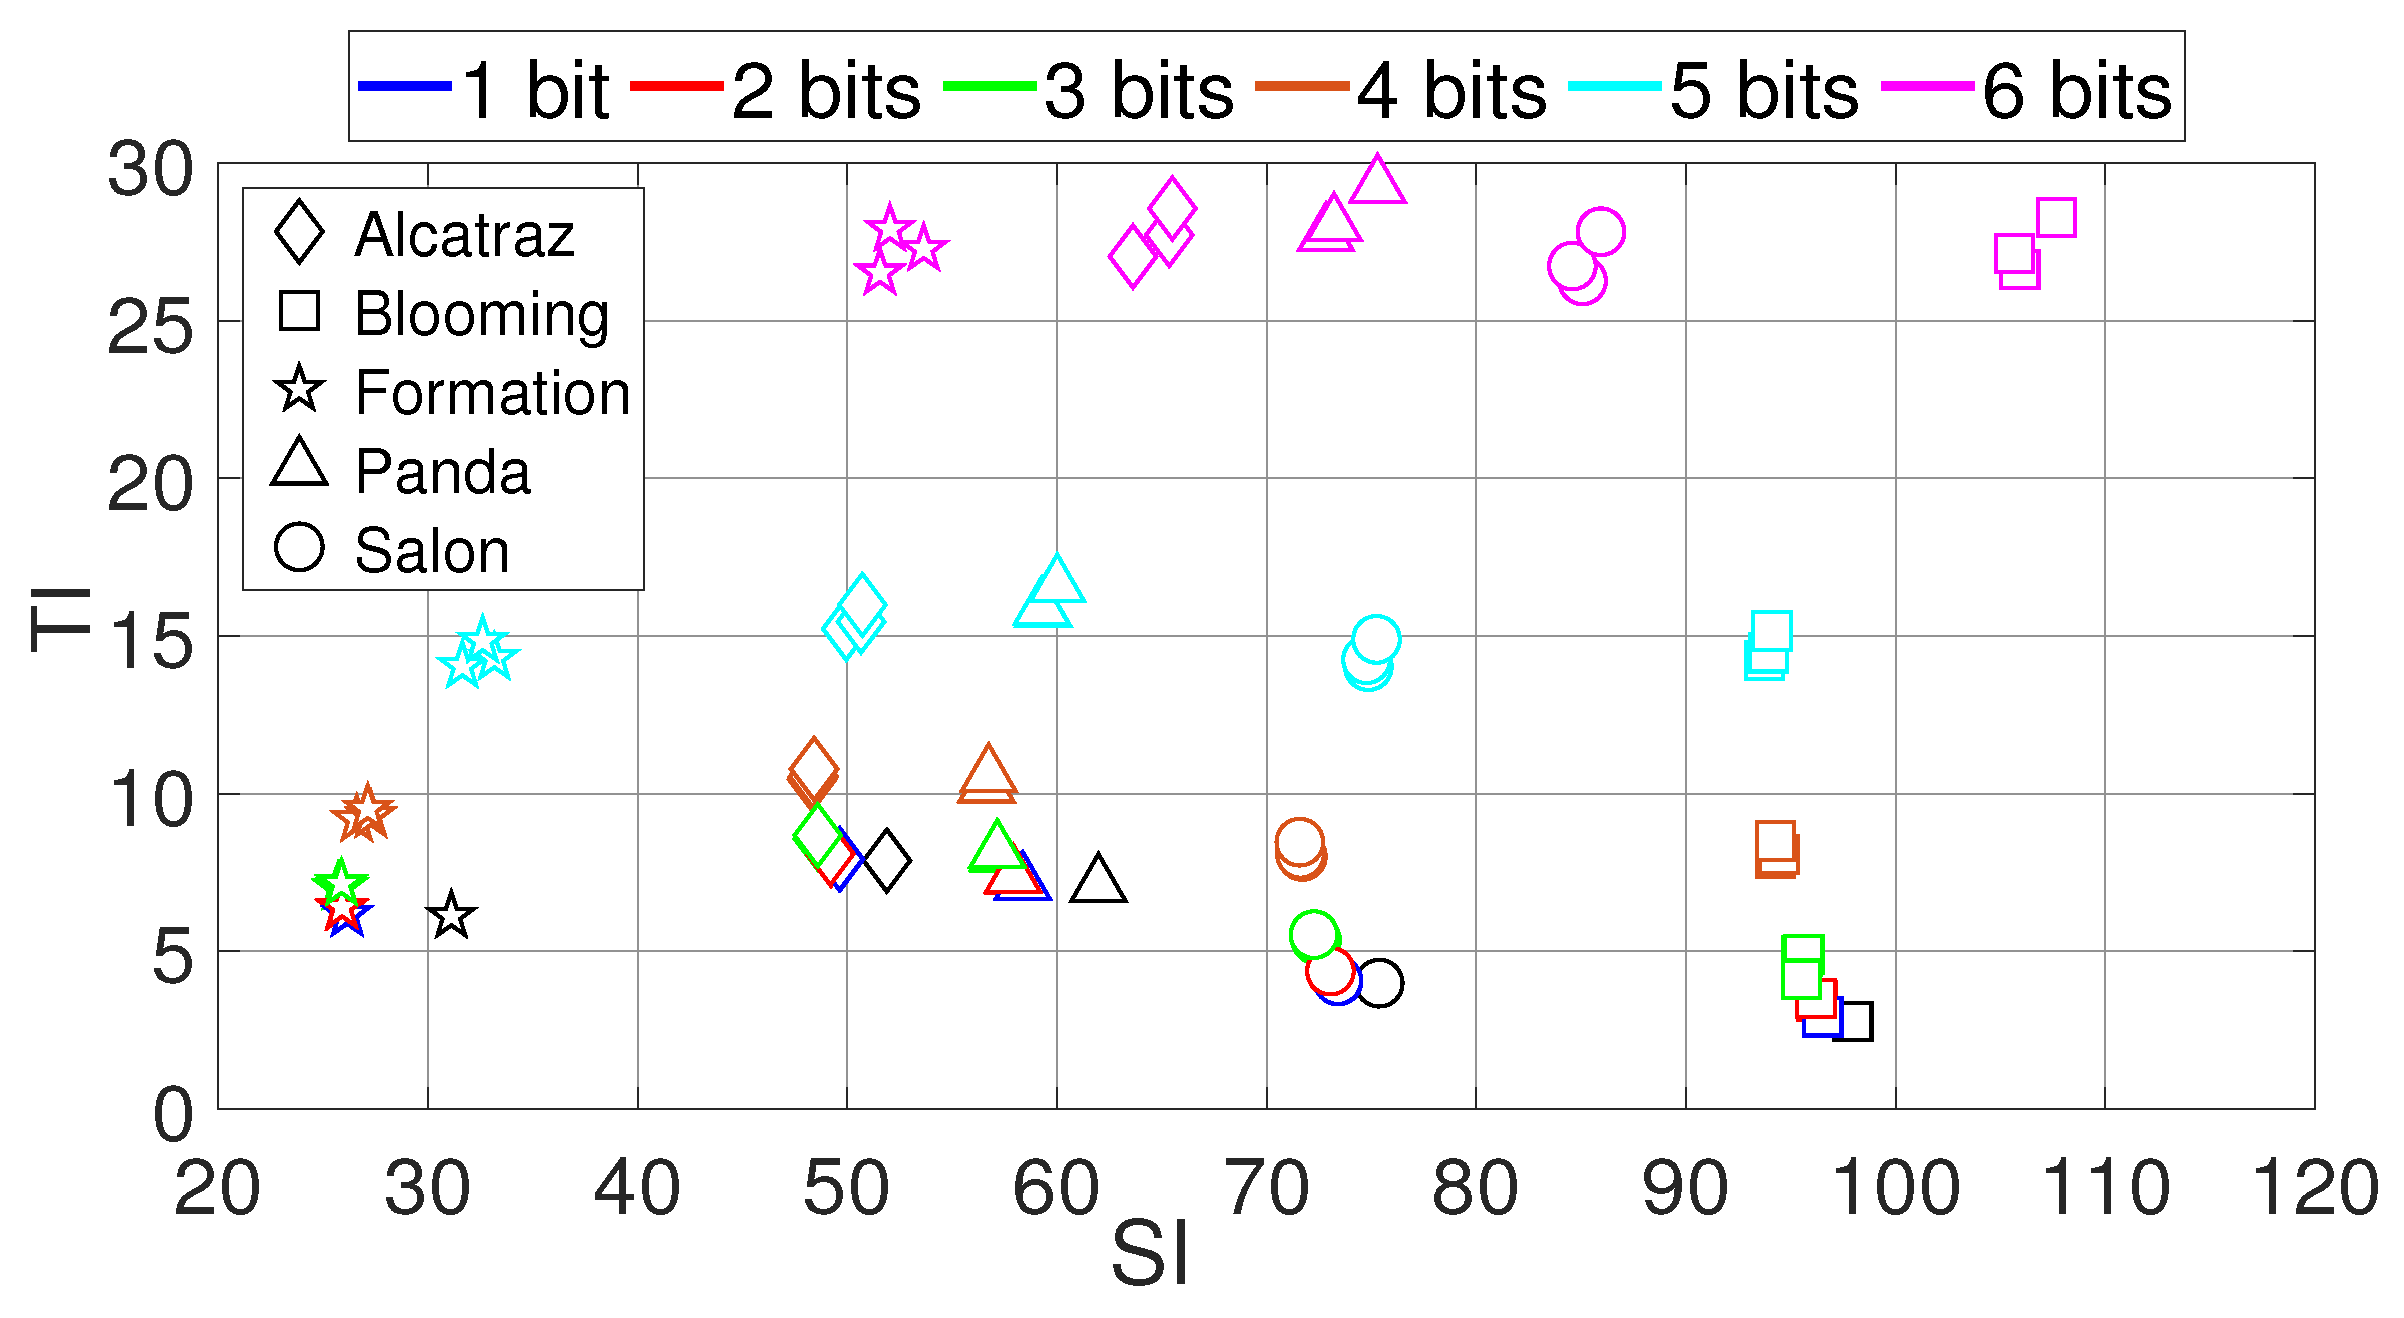
6.2. Experimental Results for Fidelity

In this section, we provide the experimental results obtained for the fidelity of the viewing direction based LSB data hiding applied to the 360° cover videos specified in Section 3.1. A wide range of data hiding scenarios with respect to varying latitude and/or longitude, and number of bit planes is examined.

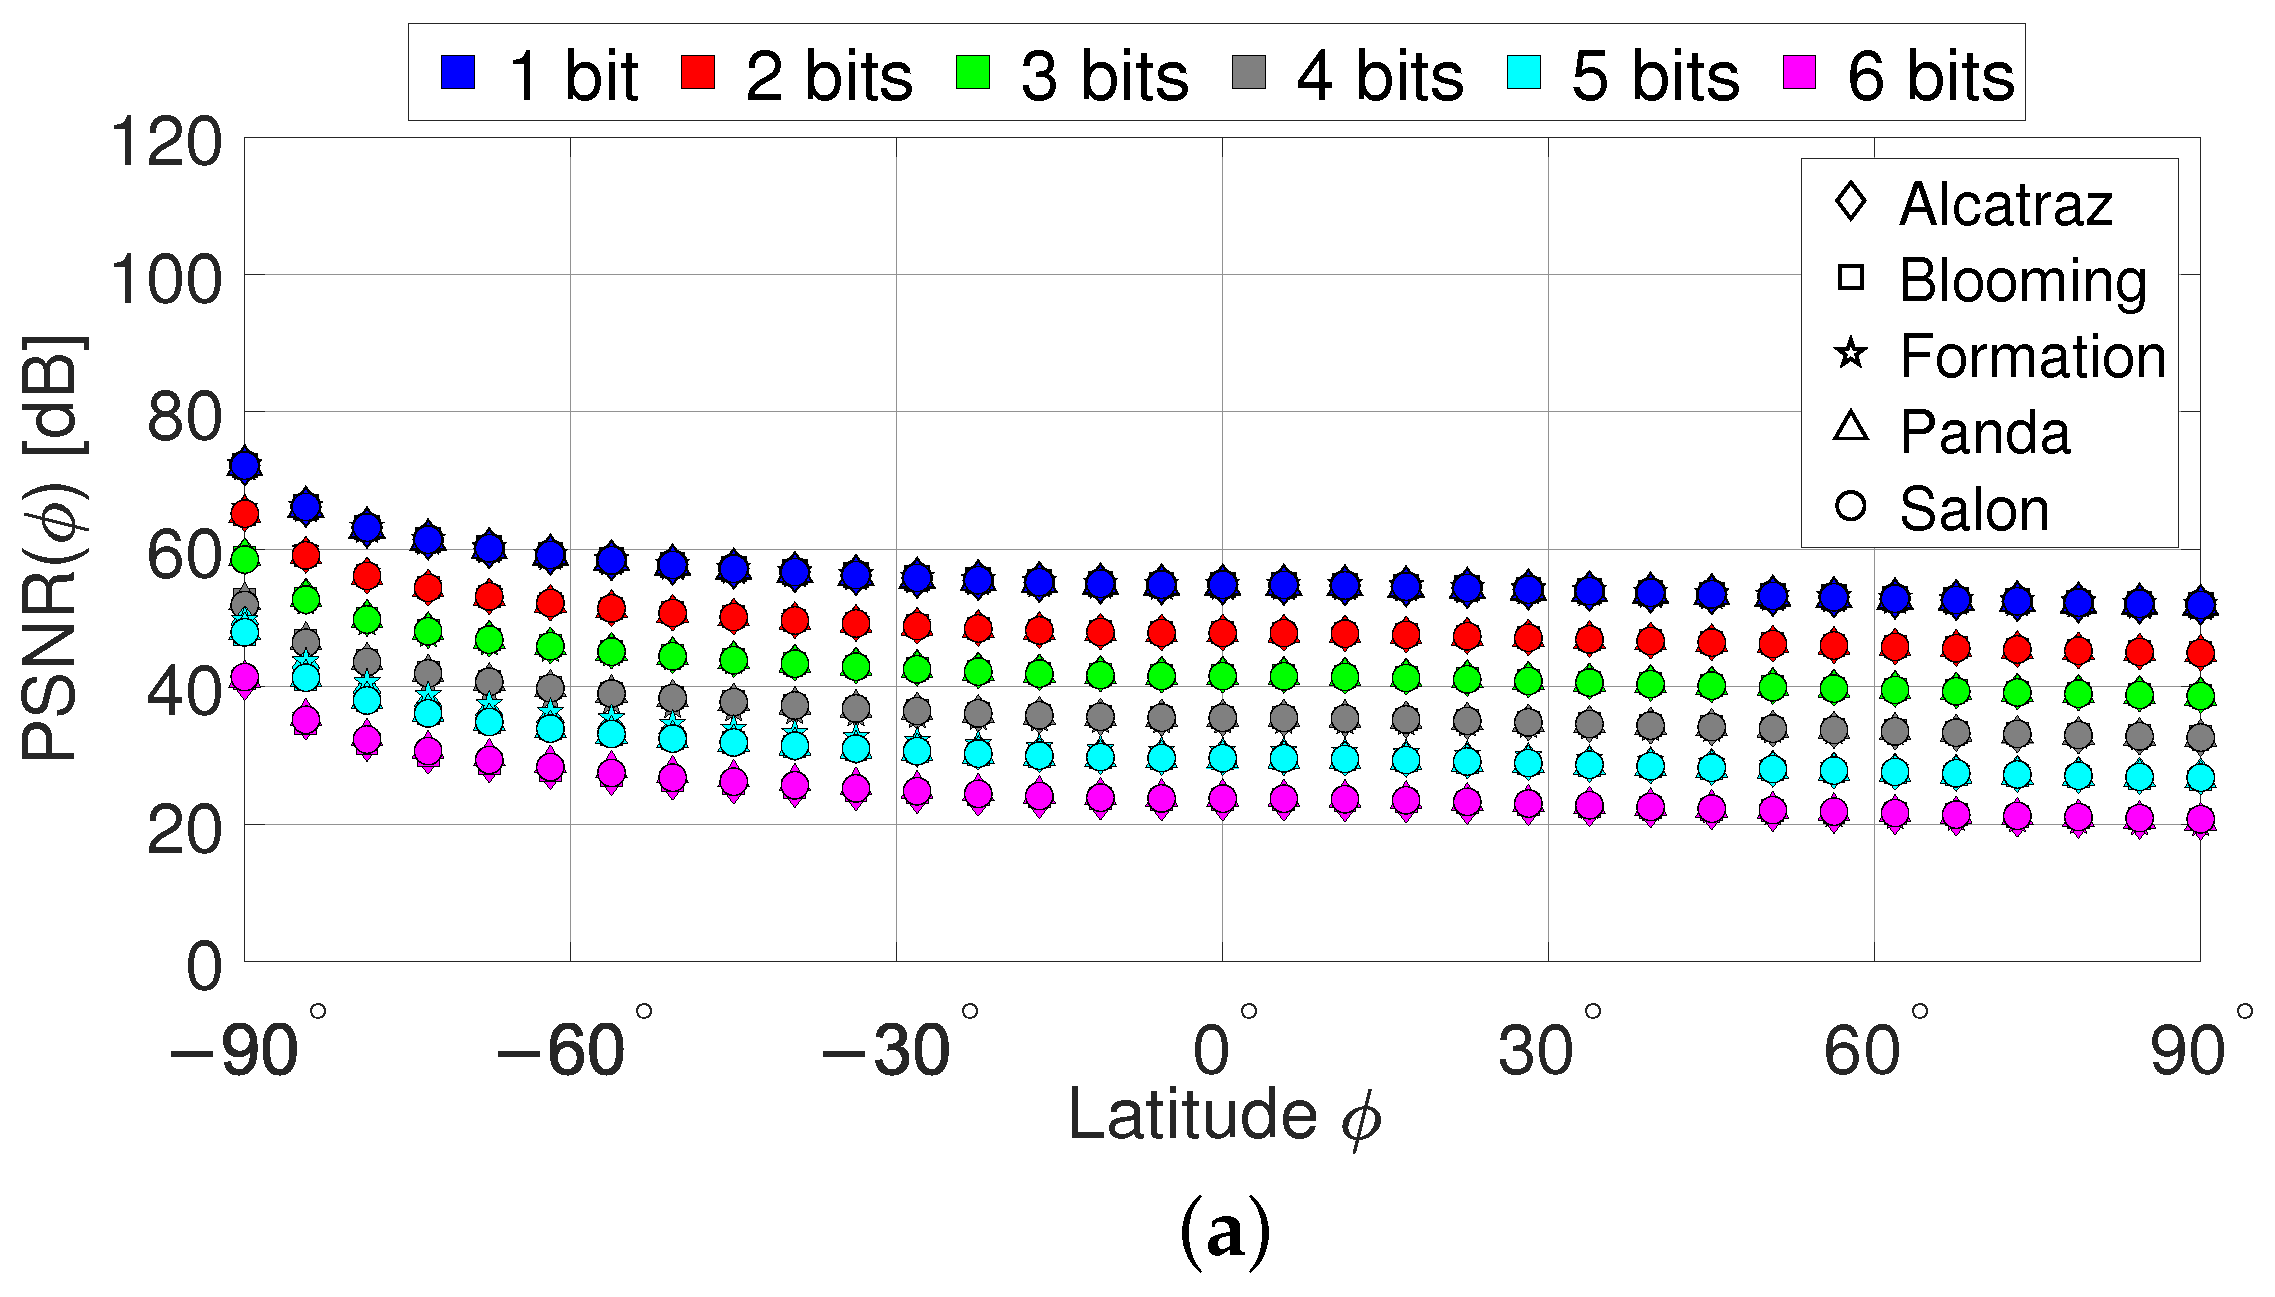
6.2.1. Data Hiding in the Latitude

Figure 16a–c show the PSNR ( ϕ ) , WS-PSNR ( ϕ ) , and NCP-PSNR ( ϕ ) , respectively, obtained for the 360° stego-videos with data hiding in the latitude ϕ . The number of bit planes used for LSB data hiding is varied from b = 1 bit to b = 6 bits. It can be observed that the fidelity in terms of all three metrics becomes more severe when b > 3 bits are used for LSB data hiding and is significant for b = 6 bits. Furthermore, the fidelity first decreases steeply commencing at the south pole but becomes less steep during the progression to the north pole. This behavior is caused by the logarithm taken on the respective mean square errors in the definition of the considered PSNR-based metrics (see Appendix A). Because the considered fidelity metrics are based on pixel-by-pixel comparisons between the corresponding frames of the 360° cover and stego-videos, the results generally do not depend on the content of the videos. However, minor differences of the fidelity between the five different scenes are observed when higher bit planes are used for data hiding due to the random secret data substitution. As for the ranking of the fidelity metrics, PSNR( ϕ ) suggests the lowest fidelity, followed by WS-PSNR( ϕ ), and NCP-PSNR( ϕ ). In other words, PSNR ( ϕ ) provides a more pessimistic assessment of the fidelity of the 360° stego-videos. On the other hand, WS-PSNR ( ϕ ) accounts for the warping effect caused by the ERP from the sphere to the plane. As a result of the spherical weighting, the impact of LSB data hiding in the pole regions is reduced. In contrast to PSNR ( ϕ ) and WS-PSNR ( ϕ ) , which perform simple pixel-by-pixel comparisons and spherical weighting of the warping effect caused by the ERP, respectively, NCP-PSNR ( ϕ ) takes into account the viewing direction characteristics of how humans watch 360° videos on HMDs. Given that the viewing direction based LSB data hiding follows the same rationale by hiding more secret data in the pole regions compared to the equator region, NCP-PSNR ( ϕ ) not only suggests the highest fidelity among the considered fidelity metrics but also captures the amount of impairments perceived by humans. Accordingly, NCP-PSNR ( ϕ ) stays almost constant at the equator region because the viewing direction based LSB data hiding gives little weight for hiding secret data in this region.

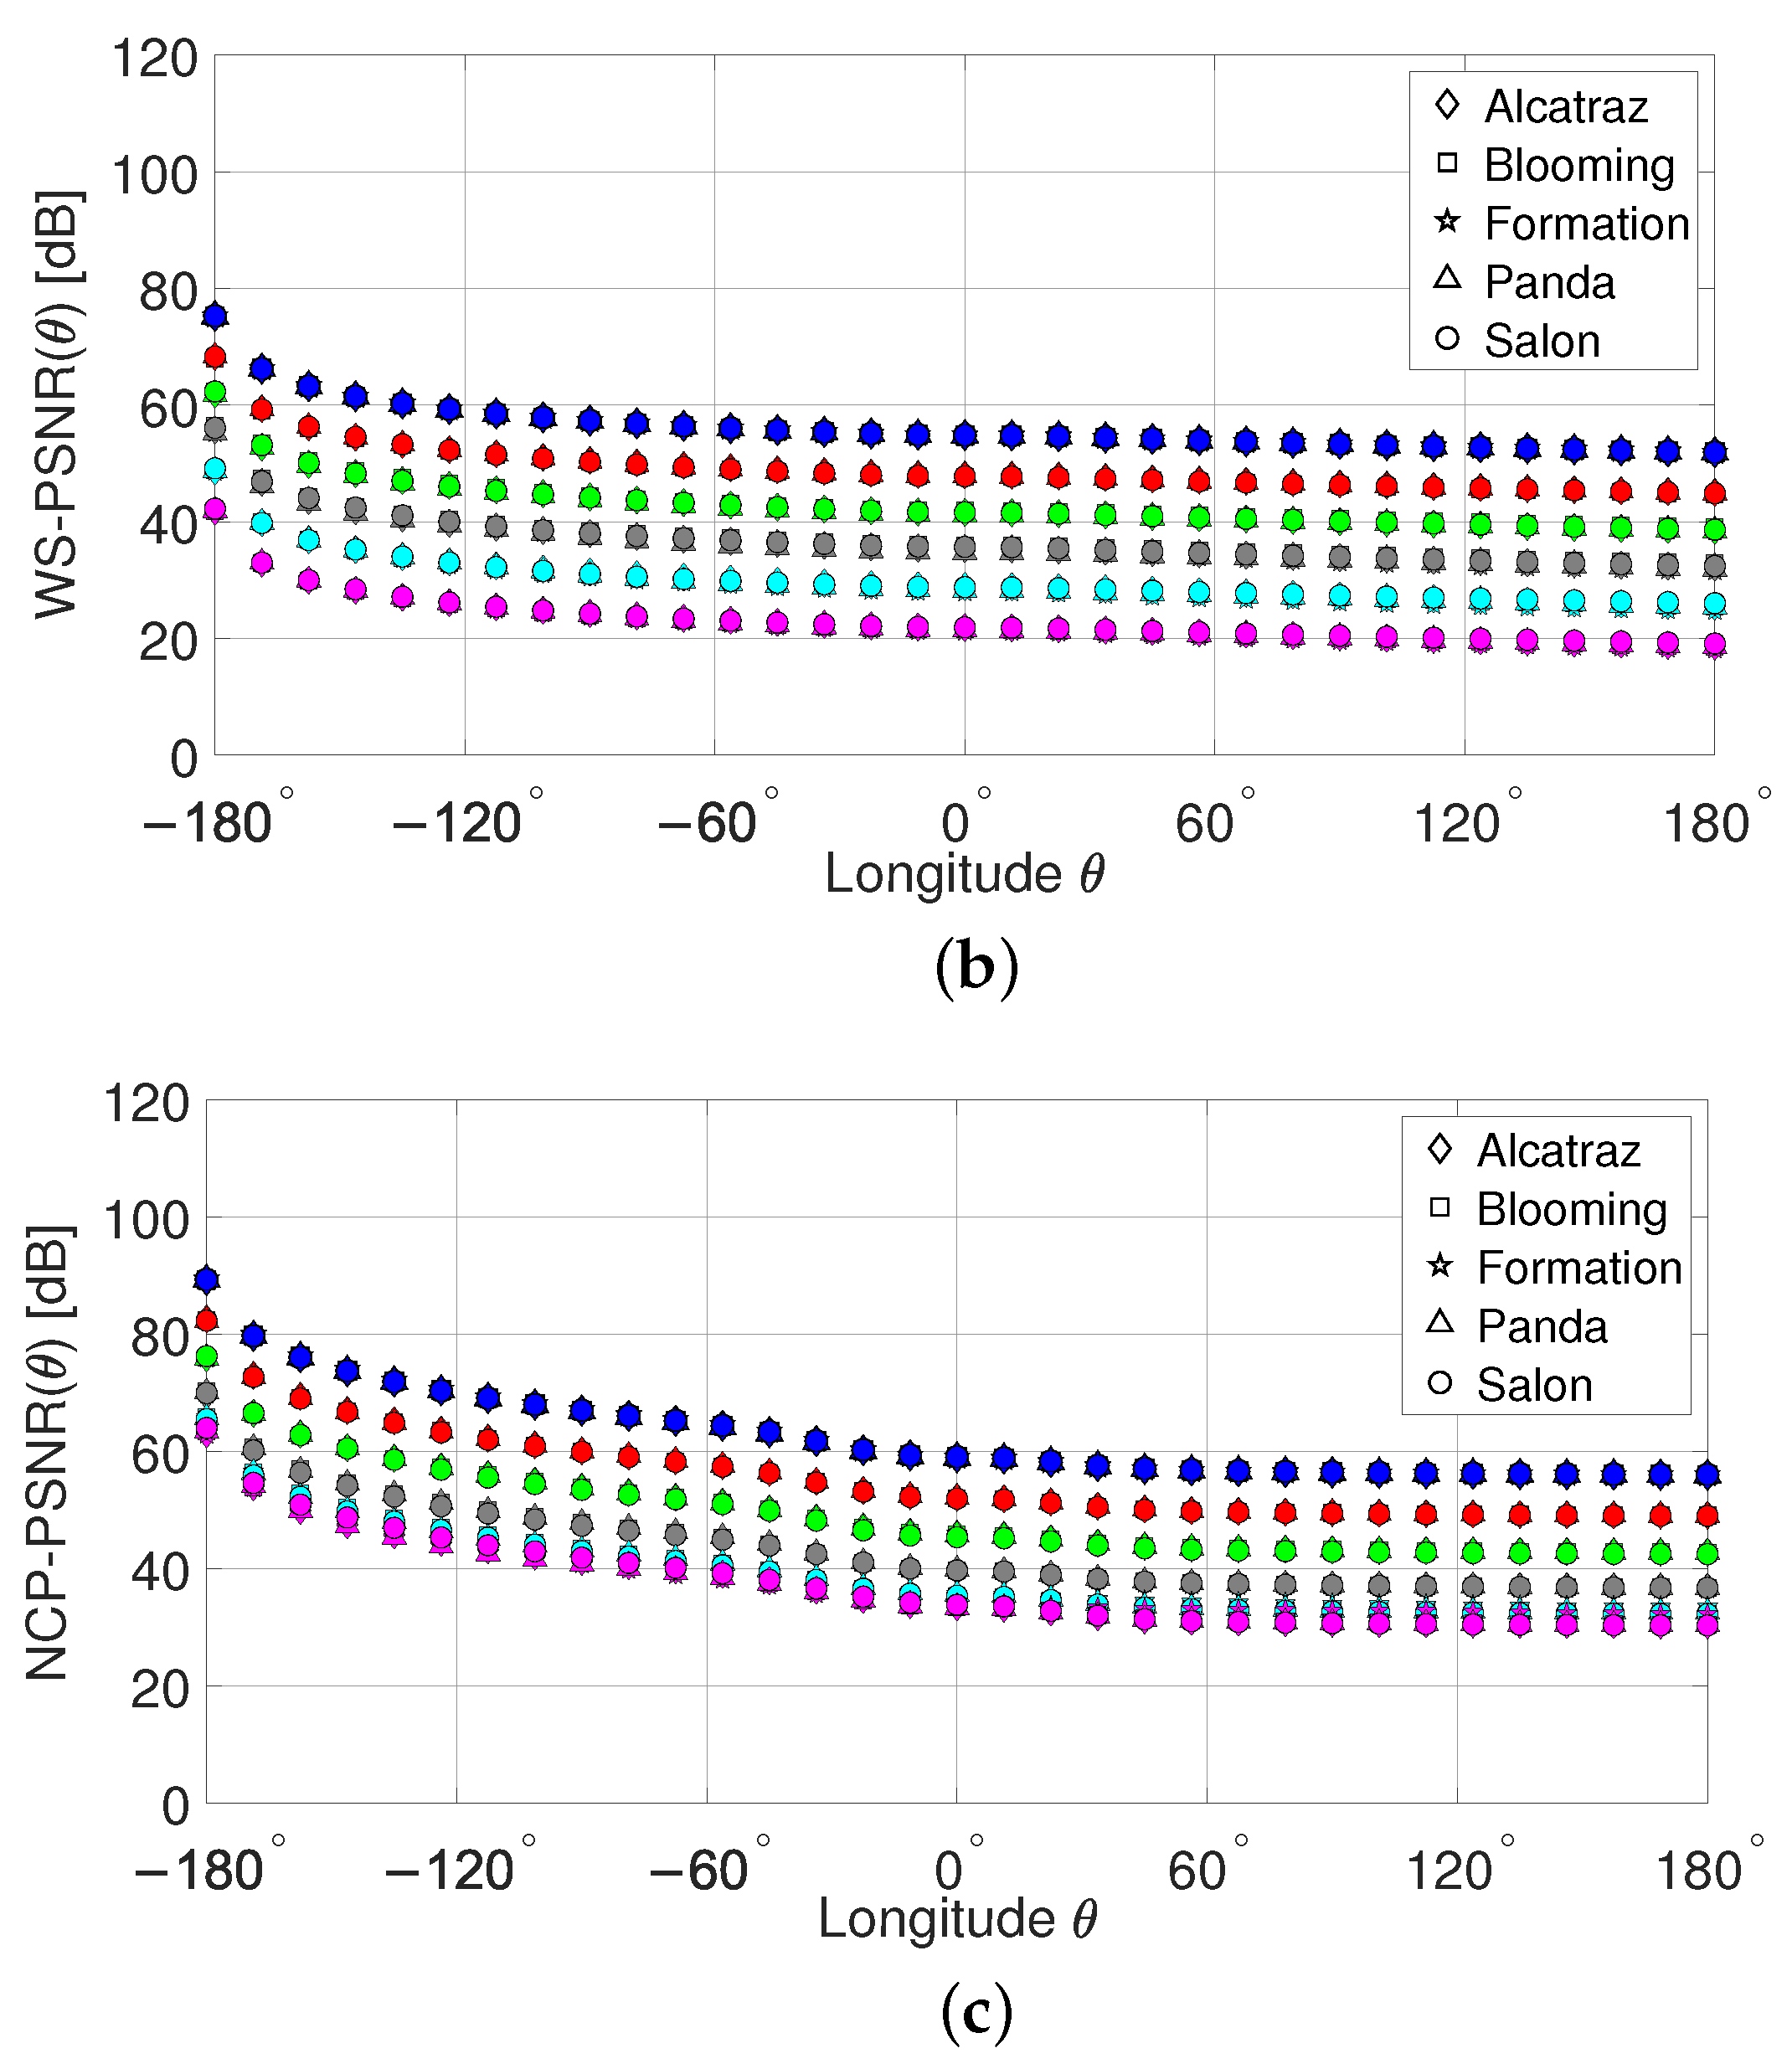
6.2.2. Data Hiding in the Longitude

Figure 17a–c show the PSNR ( θ ) , WS-PSNR ( θ ) , and NCP-PSNR ( θ ) , respectively, obtained for the 360° stego-videos with data hiding in the longitude θ . In contrast to data hiding in the latitude, the values obtained for the PSNR ( θ ) and WS-PSNR ( θ ) as functions of longitude θ are of similar magnitude. This behavior is caused by the weights w ( s , t ) e r p in (A12) which are used to account for the ERP in the calculation of WS-PSNR ( θ ) . In particular, these weights vary according to a cosine in latitude but are independent of the longitude. On the other hand, the data hiding weights w 2 ( θ ) in (8) vary with longitude but are independent of latitude. As a result, WS-PSNR ( θ ) gives similar results as PSNR ( θ ) for data hiding in the longitude and is higher than WS-PSNR ( ϕ ) in the latitude. Regarding NCP-PSNR ( θ ) in Figure 17c, this metric produces the highest fidelity values as it accounts for the distributions of the viewing directions in both latitude and longitude.

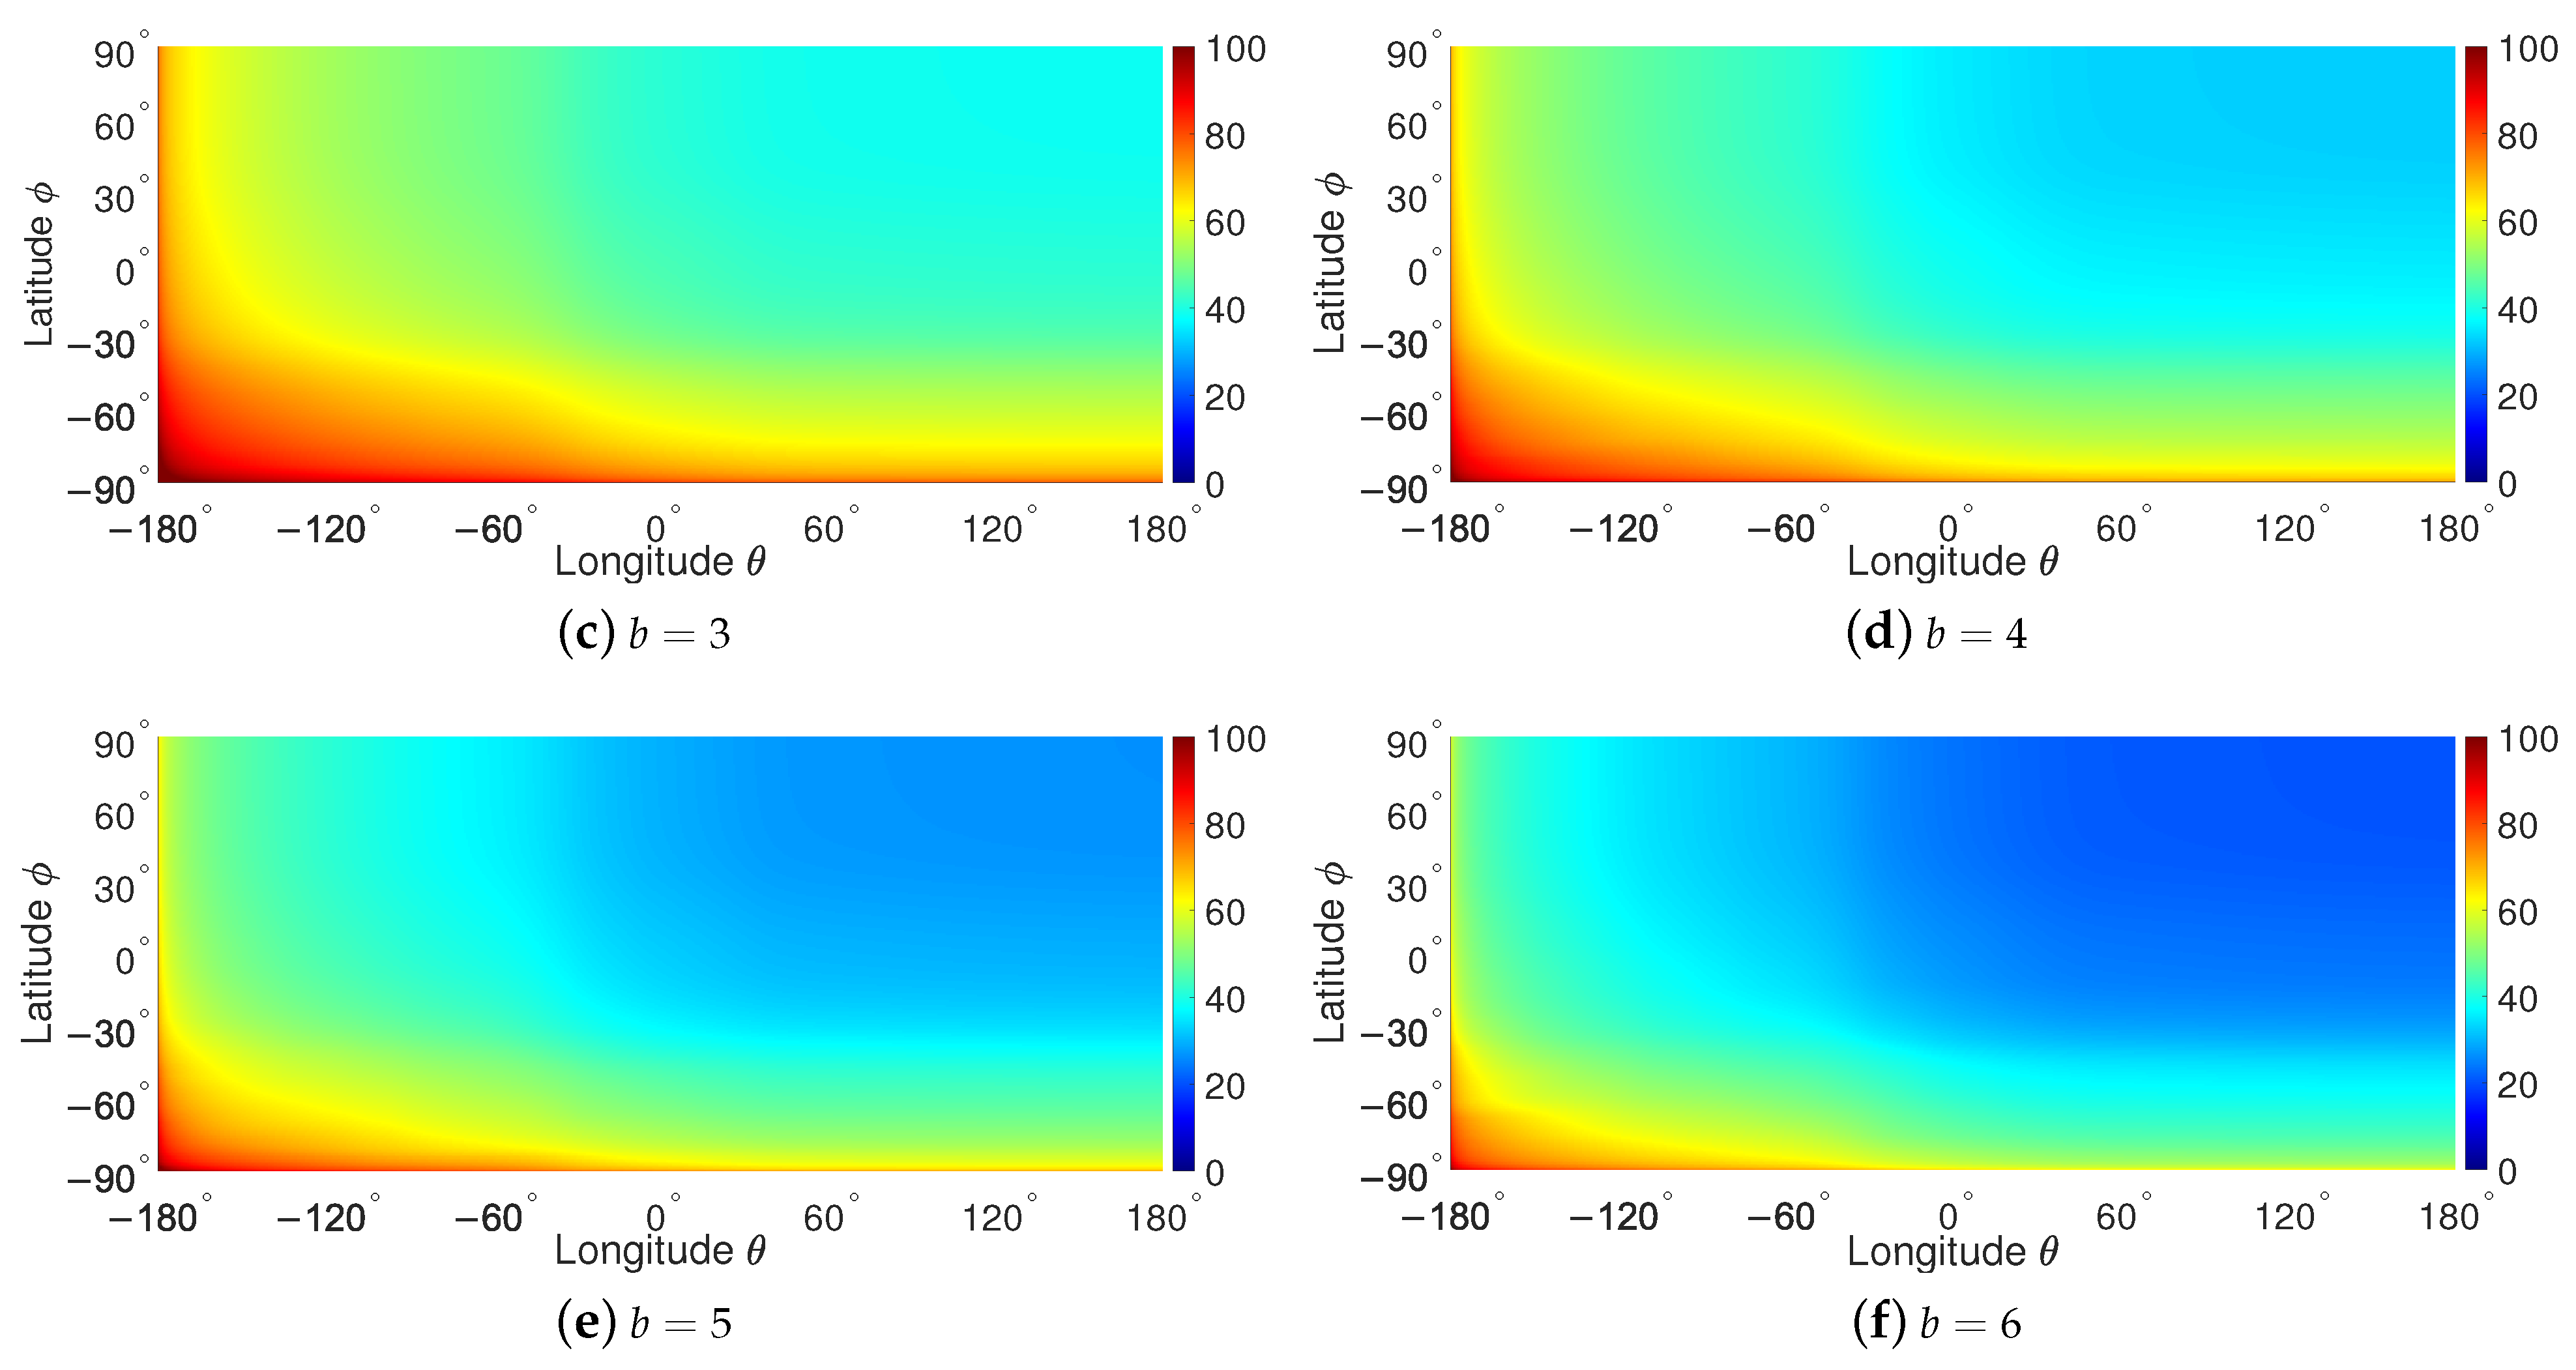
6.2.3. Data Hiding in the Latitude and Longitude

In view of the discussions in Section 6.2.1 and Section 6.2.2, we focus on NCP-PSNR( ϕ , θ ) for the assessment of the fidelity of viewing direction based LSB data hiding in both latitude and longitude. Figure 18a–f show the heatmaps obtained for NCP-PSNR( ϕ , θ ) with the number of bit planes ranging from b = 1 bit to b = 6 bits. According to Algorithm 1, the latitude increases from 90 to 90 and the longitude increases from 180 to 180 both with a step size of 1 . This gives a total of 65,341 data points for the NCP-PSNR( ϕ , θ ) heatmaps. The lowest color (blue) and highest color (red) of the colormap correspond to 0 dB and 100 dB, respectively. As can be seen from the plots, fidelity in terms of NCP-PSNR( ϕ , θ ) can be kept high ranging from 100 dB to around 50 dB as long as data hiding uses not more than b = 3 bit planes. The fidelity decreases much steeper for increasing latitude and longitude in case that b = 4 to b = 6 bit planes are used. The overall progression of NCP-PSNR( ϕ , θ ) of decreasing with latitude and longitude is opposite to that of the capacity shown in Figure 15 which increases with latitude and longitude. In other words, an increase in capacity is obtained at the expense of fidelity.

7. Visual Quality Assessment of Viewing Direction Based LSB Data Hiding

In contrast to fidelity metrics, visual quality metrics aim to emulate the integral mechanisms of the HVS in order to achieve high correlation with visual perception of quality. The mechanisms of the HVS include color processing, multi-channel decomposition with respect to different ranges of spatial frequencies and orientations, contrast, masking, visual attention, and other processing [23]. Given that the proposed LSB data hiding approach is performed in the spatial domain, visual video quality assessment is based hereinafter on structural properties of the video frames. This common approach is motivated by the HVS being highly evolved to the extraction of structural information.

7.1. Visual Quality Metrics

In this section, we describe the SSIM-based perceptual quality metrics that are used to assess the visual quality of the proposed viewing direction based LSB data hiding. In particular, fundamentals of the widely used SSIM and the non-content-based perceptual SSIM (NCP-SSIM) are described. The performance of both metrics in predicting visual quality as perceived by humans has been verified in [11] through extensive subjective experiments. While SSIM has been targeting conventional videos, NCP-SSIM specifically takes into account human characteristics related to spherical viewing directions of 360° videos with the support of HMDs. Similar to the PSNR-based metrics (see Appendix A), cumulative versions of the SSIM-based metrics can be straightforwardly derived and are used in the sequel to assess the visual quality of the 360° stego-videos for the three strategies of LSB data hiding with increasing latitude, longitude, and both latitude and longitude.

7.1.1. Structural Similarity Index

The SSIM index proposed in [24] assesses the perceptual quality of images and videos. It accounts for the fact that the HVS evolved to efficiently extract structural information from a visual scene rather than performing pixel-by-pixel comparisons. In particular, SSIM predicts the degradation in structural information by incorporating a combination of intensity and contrast measures. In the context of the considered 360° videos, a high SSIM index is obtained if a 360° cover video frame and the associated 360° stego-video frame have similar structural information. Given two 360° video frames I and J both of resolution N × M , the SSIM index is defined as [24]
SSIM ( I , J ) = ( 2 μ I μ J + D 1 ) ( 2 σ I J + D 2 ) ( μ I 2 + μ J 2 + D 1 ) ( σ I 2 + σ J 2 + D 2 )
where μ I , μ J and σ I , σ J are the mean intensities and contrasts, respectively, of the 360° video frames I and J. Furthermore, σ I J denotes the covariance between I and J. Instabilities in SSIM comparisons are dealt with by the constants D 1 and D 2 . A common practice in the application of SSIM to videos is to calculate the average SSIM over all frames of a video. The experimental results presented in Section 7.2 were obtained with the SSIM build-in function of MATLAB.

7.1.2. Non-Content-Based Perceptual Structural Similarity Index

The concepts of non-content-based perceptual video quality assessment used with NCP-PSNR can be easily extended to quality metrics. In [11], the NCP-SSIM index has been obtained as
NCP SSIM = s , t m SSIM ( s , t ) · w ^ ( s , t )
where m SSIM ( s , t ) denotes the SSIM map with local SSIM value for pixel ( s , t ) [24], and w ^ ( s , t ) is the normalized non-content-based weight map given in (25). In [11], it was shown that the NCP-SSIM outperforms other metrics regarding visual quality prediction which comes at the expense of higher computational load.

7.2. Experimental Results for Visual Quality

In this section, we provide the experimental results obtained for the visual quality of viewing direction based LSB data hiding in the 360° cover videos specified in Section 3.1.

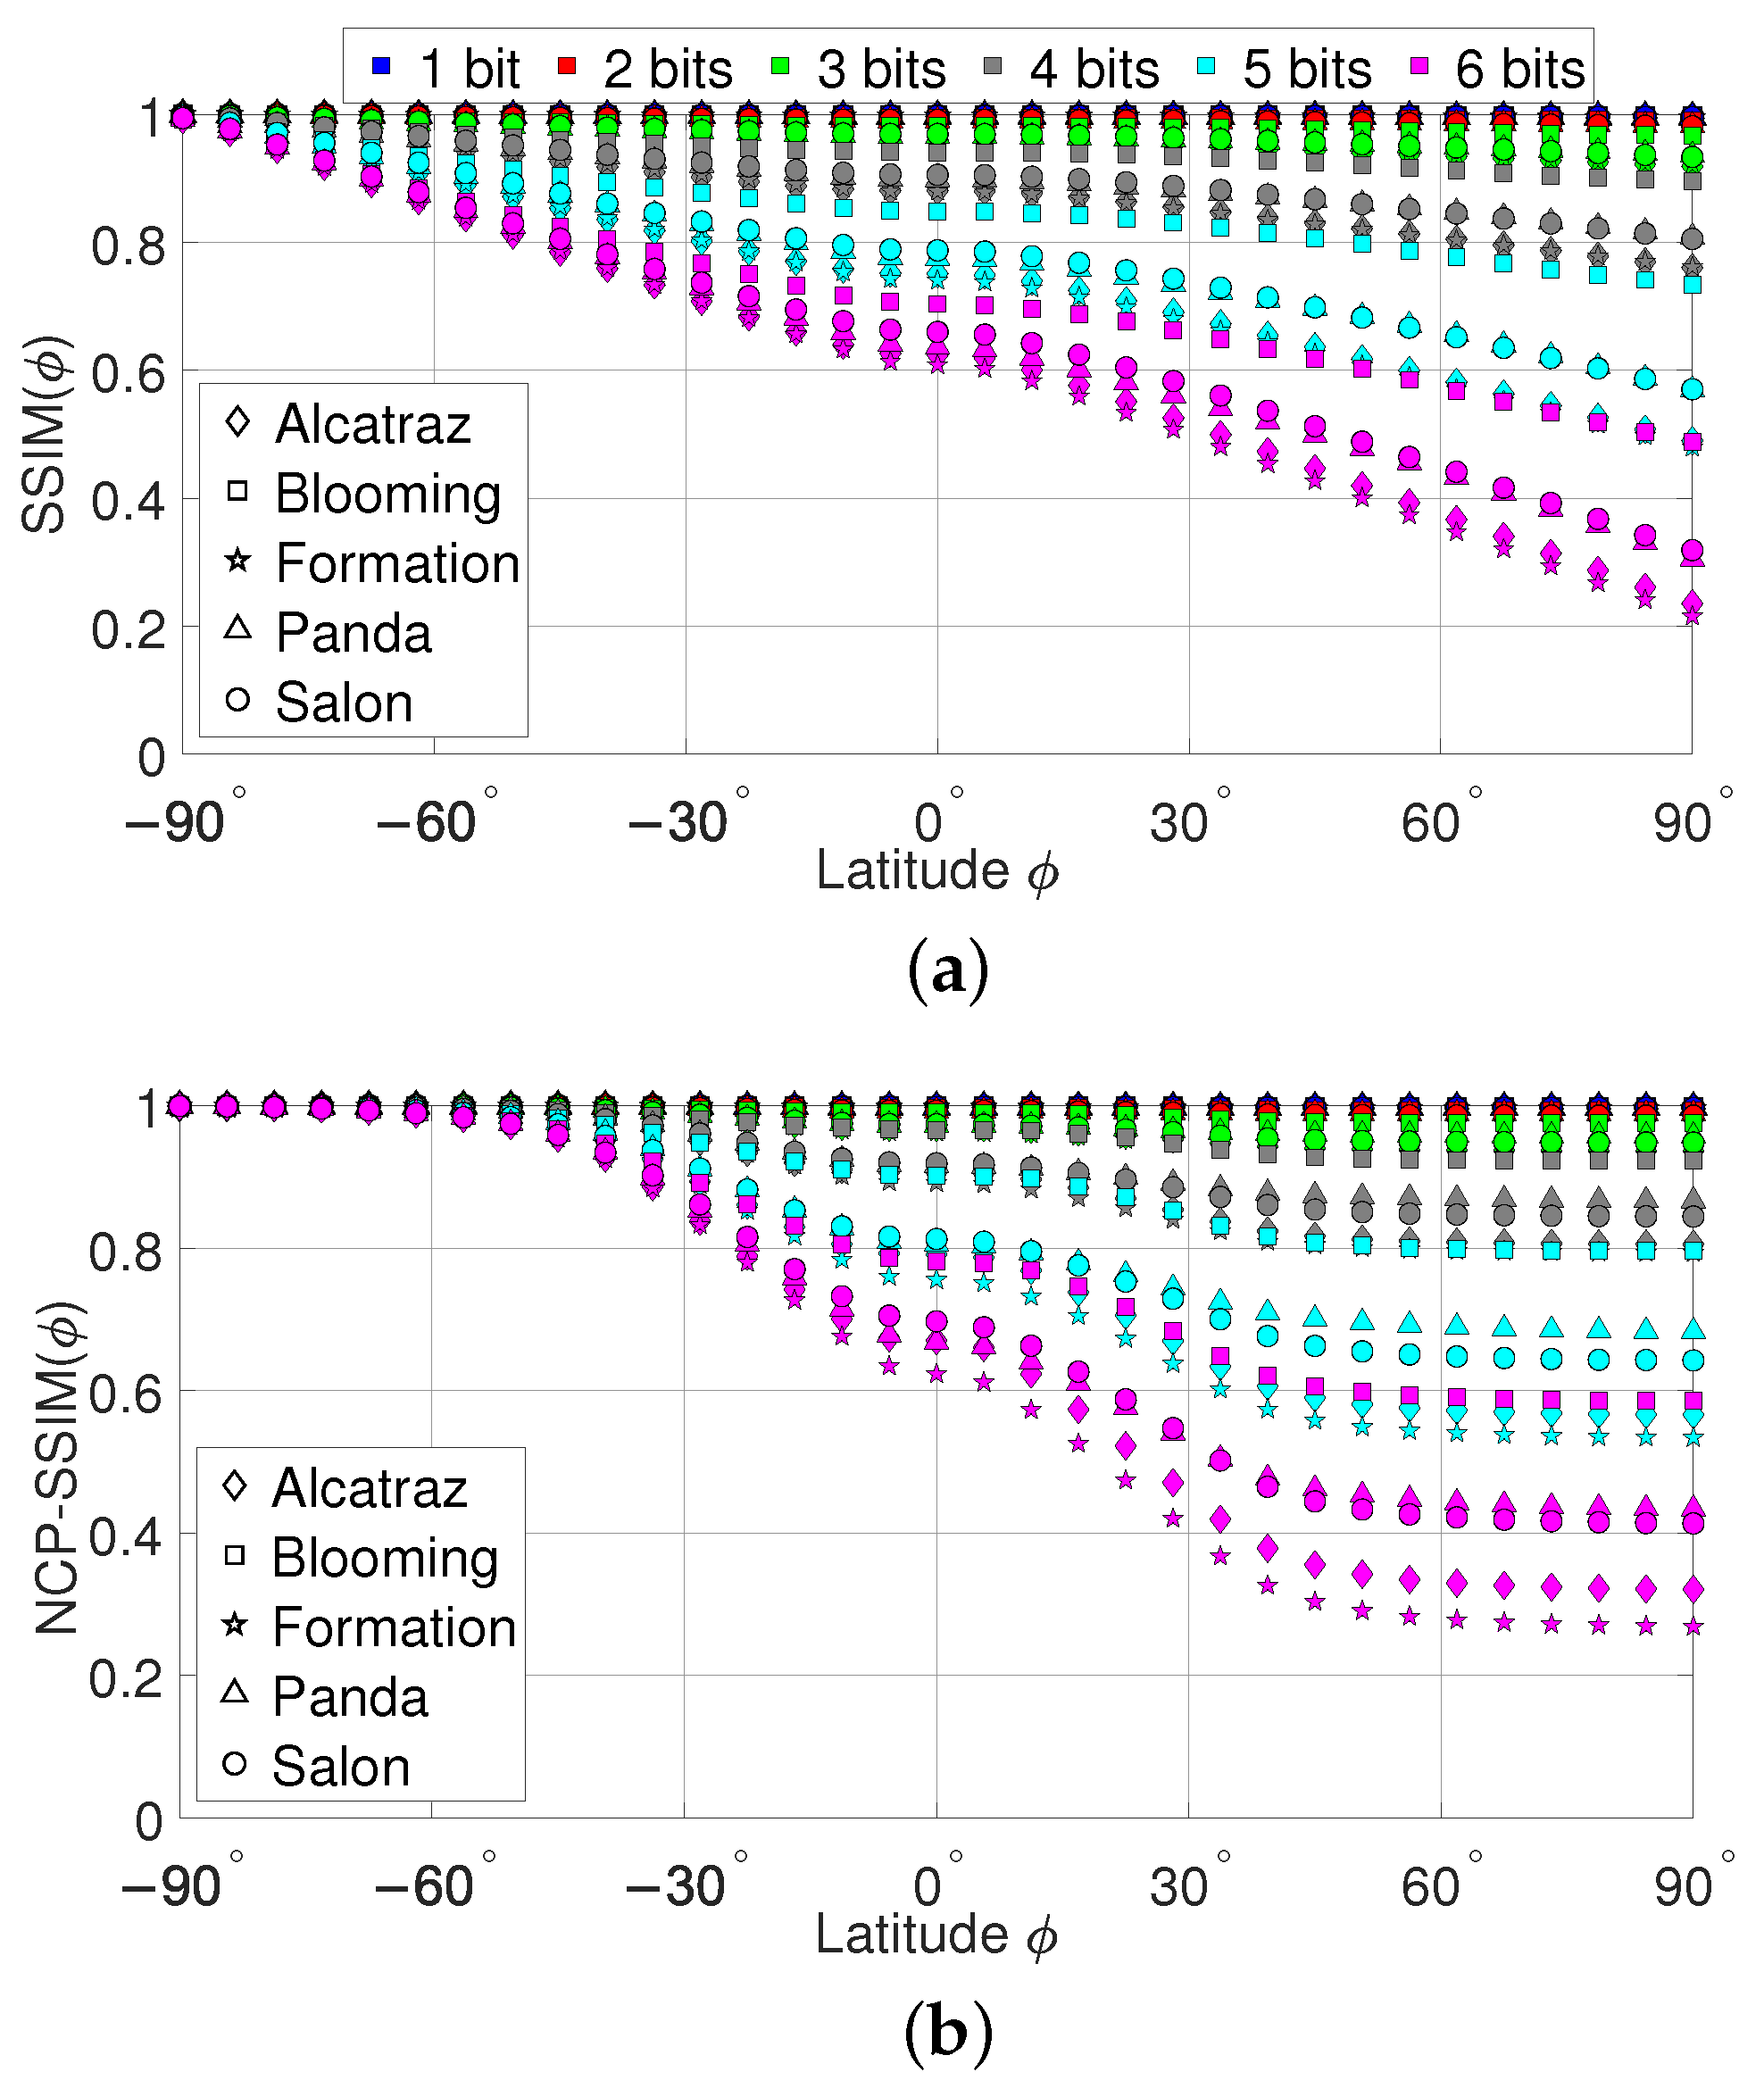
7.2.1. Data Hiding in the Latitude

Figure 19a,b show results for the cumulative SSIM-based metrics, i.e., SSIM ( ϕ ) and NCP-SSIM ( ϕ ) , respectively, obtained for the 360° stego-videos with data hiding in the latitude ϕ . Both metrics reveal a plateau of almost constant visual quality around the equator region which becomes more feasible with the increase of the number of bit planes used for LSB data hiding. In the case of SSIM ( ϕ ) , the progression of approaching and departing the equator region with increased latitude is almost linear. On the other hand, NCP-SSIM ( ϕ ) accounts much better for the viewing direction based LSB data hiding. Specifically, the visual quality in the region around the south pole for latitudes from −90° to around −60° is assessed as high and does not further decrease in the region around the north pole for latitudes from 60° to around 90°. The fact that NCP-SSIM ( ϕ ) shows three different visual quality plateaus clearly demonstrates the benefit of the proposed approach of hiding more secret data in the pole regions where viewing frequency is low and less secret data in the equator region where viewing frequency is high. Furthermore, for the cases that higher bit planes are used for LSB data hiding, visual quality tends to increasingly fan out with increased number of bit planes subject to the particular 360° video scene. This characteristic can be clearly observed, e.g., for NCP-SSIM ( ϕ ) results related to b = 6 bit planes. The results support the conjecture that LSB data hiding may cause higher degradation to the visual quality of scenes with low spatial perceptual information (see SI in Figure 5 for scene “Formation”) compared to scenes with high spatial perceptual information (see SI in Figure 5 for scene “Blooming”). In other words, LSB data hiding in scenes with relatively low spatial complexity has a larger impact on the structural similarity compared to scenes with high spatial complexity. While the considered SSIM-based visual quality metrics seem to be able to account for the spatial complexity of different scenes, the PSNR-based fidelity metrics cannot exploit this information.

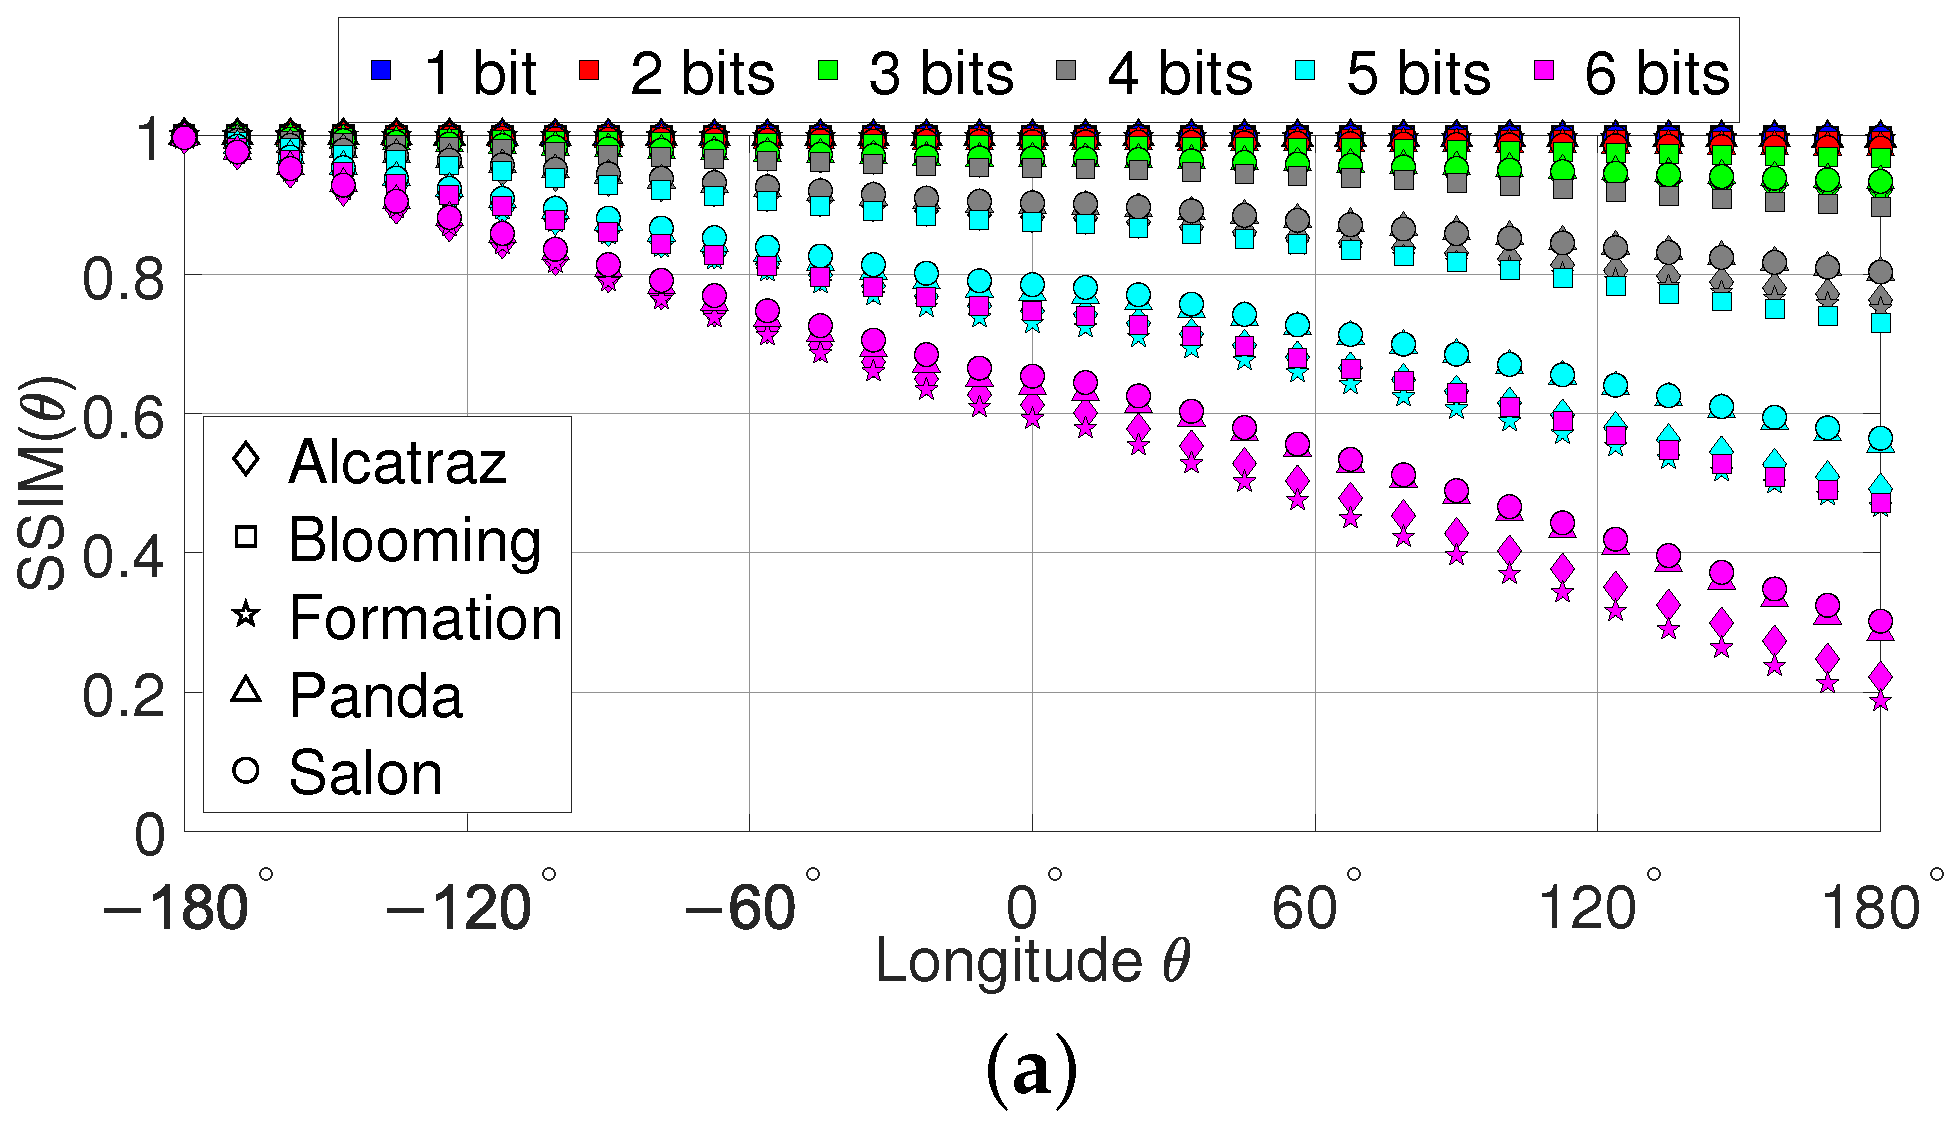
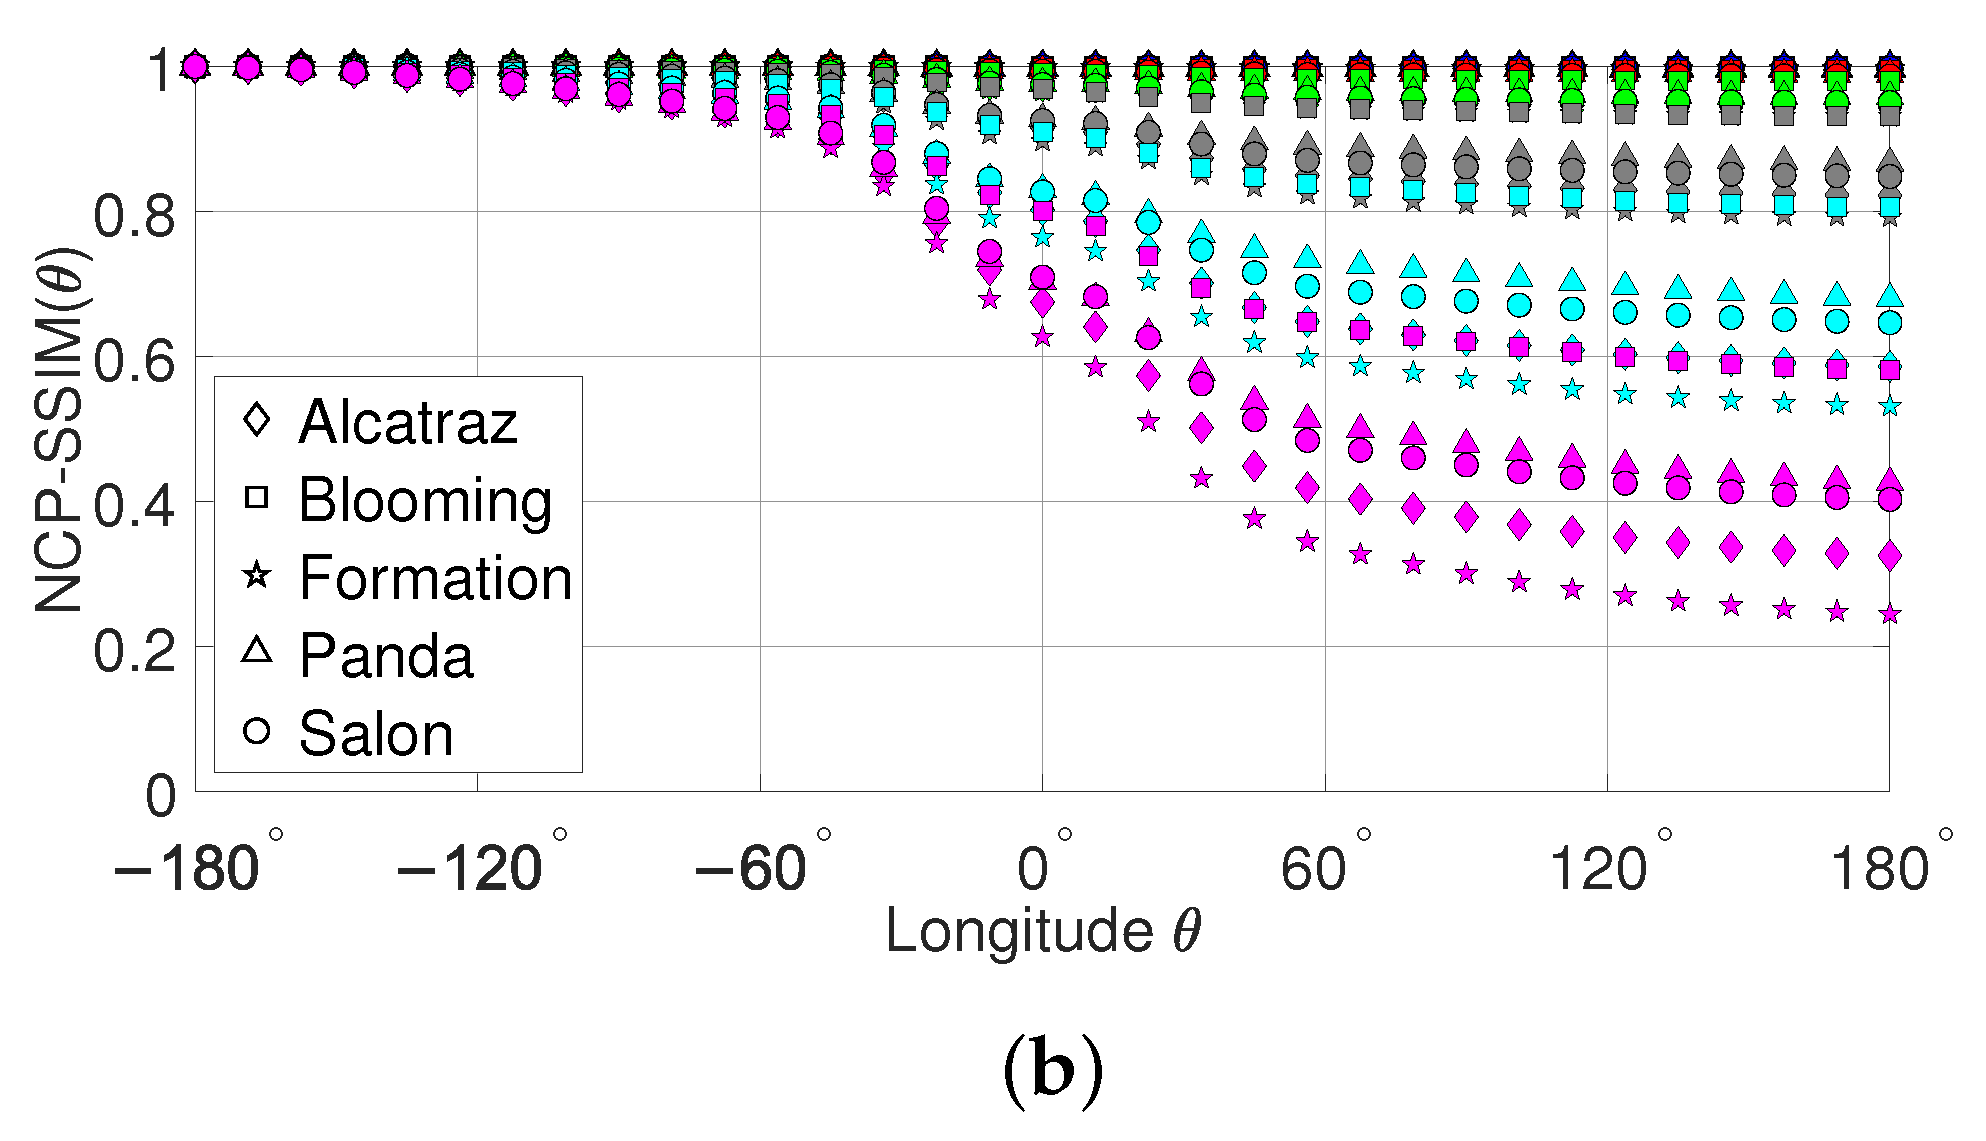
7.2.2. Data Hiding in the Longitude

Figure 20a,b present the results for SSIM( θ ) and NCP-SSIM( θ ) that were obtained for viewing direction based LSB data hiding in the longitude θ . In contrast to the latitude, which spans over a range of 180°, the longitude spans over a double as wide range of 360°. As a consequence, the plateau of constant visual quality around the equator region appears rather narrow. Regarding SSIM( θ ), the reduction of visual quality due to increasing the data hiding up to longitude θ progresses almost linearly. This behavior becomes more feasible when increasing the number of bit planes for data hiding. On the other hand, similar to data hiding in the latitude, NCP-SSIM( θ ) reflects much better the viewing direction based LSB data hiding. Steep reductions in visual quality are measured in the front region near the equator which according to [11] is much more frequently watched by humans. LSB data hiding in this region has therefore a strong impact on visual quality compared to the pole regions which is assessed accordingly by NCP-SSIM( θ ). Furthermore, visual quality tends to increasingly fan out with increased number of bit planes subject to the spatial perceptual information of the particular 360° video scene.

7.2.3. Data Hiding in the Latitude and Longitude

Finally, Figure 21a–f illustrate the visual quality of the proposed viewing direction based LSB data hiding in terms of NCP-SSIM( ϕ , θ ). NCP-SSIM is focused on here because it outperforms SSIM in the sense that it better incorporates the distribution of the viewing direction in longitude (see discussion in Section 7.2.2). The heatmaps indicate that the visual quality in terms of NCP-SSIM( ϕ , θ ) is still kept high even when b = 4 bit planes are used for LSB data hiding. For the cases that b = 5 and b = 6 bit planes are used for data hiding, the visual quality increasingly degrades with the increase of the latitudes used for data hiding from ϕ = 0 to 90 and longitudes from θ = 0 to 180 .

8. Summary and Conclusions

In this paper, we have proposed and assessed the performance of a viewing direction based LSB data hiding method for 360° videos. Specifically, the human behavior of focusing more on the front area of the equator region compared to other regions when viewing 360° videos on HMDs has been taken into account. Based on the normalized GMMs capturing the distributions of viewing direction frequencies for latitude, longitude, and both latitude and longitude, viewing direction based data hiding weight functions have been defined and used to control the amount of secret data to be hidden at the respective spherical coordinates. Analytical expressions for the capacity of the proposed method have been derived. These expressions were used to assess the impact of the number of bit planes and 360° video resolution on capacity. A performance assessment of the proposed viewing direction based LSB data hiding method has been conducted in terms of fidelity and visual quality. The fidelity of the proposed data hiding method has been assessed using PSNR, WS-PSNR, and NCP-PSNR and the visual quality has been evaluated using SSIM and NCP-SSIM. Experimental results have been provided examining the fidelity and visual quality for a wide range of scenarios. Main findings of this work can be summarized as follows:
  • Depending on the number of bit planes used for viewing direction based LSB data hiding and the selected resolution, the total capacity may range from 1.74 to 172.04 Mbits per 360° cover video frame.
  • As data hiding degrades the visual quality of the 360° stego-video frames, the wide range of total capacities allows for trading off capacity versus quality such that sufficient data can be hidden in each video frame while keeping visual quality at a satisfactory level.
  • The fidelity assessment shows that NCP-PSNR gives the highest fidelity compared to PSNR and WS-PSNR because it gives lower weights to the impact of LSB data hiding on fidelity outside the front regions near the equator.
  • The visual quality assessment reveals that both SSIM-based metrics are able to account for the spatial perceptual information of different scenes while the PSNR-based fidelity metrics cannot exploit this information.
  • Furthermore, NCP-SSIM reflects much better the impact of the proposed viewing direction based LSB data hiding method on visual quality with respect to viewing directions compared to SSIM.
  • Overall, NCP-SSIM turned out to be the most effective and realistic metric among the considered metrics when it comes to assessing the visual quality of the proposed viewing direction based LSB data hiding method. It is able to accommodate the distribution of viewing direction frequencies and spatial perceptual information into the visual quality assessment.
  • It is recalled that NCP-SSIM was developed in [11] based on extensive subjective experiments and is consistent with recommendation [10] in terms of seating arrangements and number of participants. As such, NCP-SSIM is indeed very well applicable to the assessment of the viewing direction based LSB data hiding method proposed in this paper.
In view of the results presented in this paper, promising directions for future work include the following:
  • Given that an HMD provides the users only with a limited viewport rather than the entire sphere at a given time, more advanced visual attention models beyond viewing direction distributions and adaptive LSB data hiding with respect to the viewport dynamics may be considered.
  • On this basis, content based fidelity and visual quality metrics may be developed that are able to predict the impact of LSB data hiding methods or other data hiding methods on the fidelity as well as the visual quality as perceived by humans.
  • Other types of projection techniques than the ERP can be used such as cube map projection, octahedron projection, and segmented sphere projection. The distributions of intensity pixels on the sphere are projected differently to the plane by these techniques. This may lead to different hiding positions and different impact on the visual quality of the obtained 360° videos.

Author Contributions

Conceptualization, D.N.T., H.-J.Z., and T.M.C.C.; methodology, D.N.T.; software, D.N.T.; formal analysis, D.N.T., H.-J.Z., and T.M.C.C.; investigation, D.N.T.; data curation, D.N.T.; writing—original draft preparation, D.N.T.; writing—review and editing, D.N.T., H.-J.Z., and T.M.C.C.; visualization, D.N.T. and T.M.C.C.; supervision, H.-J.Z. and T.M.C.C.; project administration, H.-J.Z.; funding acquisition, H.-J.Z. All authors have read and agreed to the published version of the manuscript.

Funding

This work was supported in part by The Knowledge Foundation, Sweden, through the ViaTecH project (Contract 20170056). Dang Ninh Tran was supported by a VIED scholarship awarded by the Vietnamese Government.

Conflicts of Interest

The authors declare no conflict of interest.

Abbreviations

The following abbreviations are used in this manuscript:
6GSixth generation
ARAugmented reality
ERPEquirectangular projection
GMMGaussian mixture model
HMDHead-mounted display
LSBLeast significant bit
MSEMean square error
NCP-PSNRNon-content-based perceptual PSNR
NCP-SSIMNon-content-based perceptual SSIM
PSNRPeak signal-to-noise ratio
RGBRed, green, blue
SSIMStructural similarity
VQAVideo quality assessment
VRVirtual reality
WMSEWeighted mean square error
WS-PSNRWeighted-to-spherical-uniform PSNR

Appendix A. Peak Signal-to-Noise Ratio Based Metrics

Appendix A.1. Peak Signal-to-Noise Ratio

Consider a 360° video frame of width N and height M, and let I ( s , t , k ) and J ( s , t , k ) denote the pixel values of the luminance signal of the k-th original frame and associated k-th processed frame at position ( s , t ) . The PSNR is a fidelity metric that quantifies the effect of the processing on the fidelity of an image, video frame, or video and is most easily defined through the mean square error (MSE). In particular, the MSE of the k-th pair of original and processed frame is defined as
MSE ( k ) = 1 N M s = 0 N 1 t = 0 M 1 | I ( s , t , k ) J ( s , t , k ) | 2
The PSNR of the k-th pair of frames is defined with (A1) as
PSNR ( k ) = 10 log MAX 2 MSE ( k )
where MAX = 2 B 1 denotes the maximum pixel value for a given bit depth B. Furthermore, let the 360° video comprise of a total of K frames. The average MSE and average PSNR, respectively, of an entire video may then be defined as
MSE = 1 K k = 0 K 1 MSE ( k )
PSNR = 10 log MAX 2 MSE
The MSE and PSNR given in (A3) and (A4), respectively, may be expressed as functions of latitude ϕ , longitude θ , or both latitude and longitude. In this way, the effect of LSB data hiding at the respective coordinates of the frames on the fidelity of a 360° cover video can be assessed. Without loss of generality, let LSB data hiding be performed from the south pole ( ϕ = 90 ) to the north pole ( ϕ = 90 ), and from west ( θ = 180 ) to east ( θ = 180 ). The cumulative PSNRs accounting for the accumulated errors with respect to increasing coordinates can then be formulated as
PSNR ( ϕ ) = 10 log MAX 2 C MSE ( ϕ )
PSNR ( θ ) = 10 log MAX 2 C MSE ( θ )
PSNR ( ϕ , θ ) = 10 log MAX 2 C MSE ( ϕ , θ )
where the cumulative MSEs are defined, using (A3) as a function of coordinates, as
C MSE ( ϕ ) = x = 90 ϕ MSE ( x )
C MSE ( θ ) = y = 180 θ MSE ( y )
C MSE ( ϕ , θ ) = x = 90 ϕ y = 180 θ MSE ( x , y )

Appendix A.2. Weighted-to-Spherically Uniform PSNR

The WS-PSNR [22,25] accounts for the non-linear relationship and warping effect caused by the mapping between plane and sphere. It measures the distortions of samples in the plane and weights these distortions with the projection area of the related surface on the sphere. In particular, the weighted mean square error (WMSE) of the k-th pair of original and processed frame of a 360° video can be formulated using the definition given in [22] as
WMSE ( k ) = s = 0 N 1 t = 0 M 1 I ( s , t , k ) J ( s , t , k ) 2 w ( s , t ) i = 0 N 1 j = 0 M 1 w ( s , t )
where the weights for the equirectangular projection used in this paper are given as
w ( s , t ) e r p = cos ( t + 0.5 M / 2 ) π M   and   M = N 2
Given (A11), the WS-PSNR is defined as
WS PSNR ( k ) = 10 log MAX 2 WMSE ( k )
Similar as for the average MSE and average PSNR in (A3) and (A4), respectively, the WMSE and WS-PSNR of a 360° video comprising of a total of K frames is defined as
WMSE = 1 K k = 0 K 1 WMSE ( k )
WS PSNR = 10 log MAX 2 WMSE
The cumulative WS-PSNR with respect to the spherical coordinates can be defined as
WS PSNR ( ϕ ) = 10 log MAX 2 C WMSE ( ϕ )
WS PSNR ( θ ) = 10 log MAX 2 C WMSE ( θ )
WS PSNR ( ϕ , θ ) = 10 log MAX 2 C WMSE ( ϕ , θ )
where the cumulative WMSEs are defined, using (A14) as a function of coordinates, as
C WMSE ( ϕ ) = x = 90 ϕ WMSE ( x )
C WMSE ( θ ) = y = 180 θ WMSE ( y )
C WMSE ( ϕ , θ ) = x = 90 ϕ y = 180 θ WMSE ( x , y )

References

  1. Huawei iLab. VR Big Data Report; Huawei Technologies Co., Ltd.: Shenzhen, China, 2017. [Google Scholar]
  2. Huawei iLab. Cloud VR Network Solution White Paper; Huawei Technologies Co., Ltd.: Shenzhen, China, 2018. [Google Scholar]
  3. Yrjölä, S.; Ahokangas, P.; Matinmikko-Blue, M. (Eds.) White Paper on Business of 6G. (6G Research Visions, No. 3); University of Oulu: Oulu, Finland, 2020. [Google Scholar]
  4. Djebbar, F.; Ayad, B.; Meraim, K.A.; Hamam, H. Comparative Study of Digital Audio Steganography Techniques. EURASIP J. Audio Speech Music Process. 2012, 2012, 1–16. [Google Scholar] [CrossRef] [Green Version]
  5. Cheddad, A.; Condell, J.; Curran, K.; Kevitt, P.M. Digital Image Steganography: Survey and Analysis of Current Methods. Signal Process. 2010, 90, 727–752. [Google Scholar] [CrossRef] [Green Version]
  6. Kadhim, I.J.; Premaratne, P.; Vial, P.J.; Halloran, B. Comprehensive Survey of Image Steganography: Techniques, Evaluations, and Trends in Future Research. Neurocomputing 2019, 335, 299–326. [Google Scholar] [CrossRef]
  7. Liu, Y.; Liu, S.; Wang, Y.; Zhao, H.; Liu, S. Video Steganography: A Review. Neurocomputing 2019, 335, 238–250. [Google Scholar] [CrossRef]
  8. Tran, D.N. On LSB Data Hiding in New Digital Media; Licentiate Dissertation, Blekinge Institute of Technology: Karlskrona, Sweden, 2020. [Google Scholar]
  9. Yu, M.; Laksman, H.; Girod, B. Framework to Evaluate Omnidirectional Video Coding Schemes. In Proceedings of the International Symposium on Mixed and Augmented Reality, Fukuoka, Japan, 29 September–3 October 2015; pp. 31–36. [Google Scholar]
  10. Recommendation ITU-T P.919. Subjective Test Methodologies for 360 Degree Video on HMD; International Telecommunication Union—Telecommunication Standardization Sector: Geneva, Switzerland, 2020. [Google Scholar]
  11. Xu, M.; Li, C.; Chen, Z.; Wang, Z.; Guan, Z. Assessing Visual Quality of Omnidirectional Videos. IEEE Trans. Ciruits Syst. Video Technol. 2019, 29, 3516–3530. [Google Scholar] [CrossRef] [Green Version]
  12. Tran, D.N.; Zepernick, H.J. Spherical Light-Weight Data Hiding in 360-Degree Videos With Equirectangular Projection. In Proceedings of the 2019 International Conference on Advanced Technologies for Communications (ATC), Hanoi, Vietnam, 17–19 October 2019; pp. 56–62. [Google Scholar]
  13. Tran, D.N.; Zepernick, H.J. Spherical LSB Data Hiding in 360° Videos Using Morphological Operations. In Proceedings of the 2019 13th International Conference on Signal Processing and Communication Systems (ICSPCS), Gold Coast, Australia, 16–18 December 2019; pp. 573–582. [Google Scholar]
  14. Tran, D.N.; Zepernick, H.J.; Chu, T.M.C. Visual Attention Based LSB Data Hiding in 360° Videos. In Proceedings of the 2020 14th International Conference on Signal Processing and Communication Systems (ICSPCS), Adelaide, Australia, 14–16 December 2020; pp. 1–8. [Google Scholar]
  15. Bjarne. YUV Pixel Formats. Available online: https://www.fourcc.org/yuv.php (accessed on 8 May 2021).
  16. Beihang University, School of Electronic and Information Engineering, Beijing, China. VQA-ODV. Available online: https://github.com/Archer-Tatsu/VQA-ODV (accessed on 1 June 2020).
  17. Li, C.; Xu, M.; Wang, Z. Bridge the Gap Between VQA and Human Behavior on Omnidirectional Video: A Large-Scale Dataset and a Deep Learning Model. In Proceedings of the ACM International Conference on Multimedia, Seoul, Korea, 15 October 2018; pp. 932–940. [Google Scholar]
  18. Recommendation ITU-T P.910. Subjective Video Quality Assessment Methods for Multimedia Applications; International Telecommunication Union—Telecommunication Standardization Sector: Geneva, Switzerland, 2008. [Google Scholar]
  19. Abramowitz, M.; Stegun, I.A. Handbook of Mathematical Functions with Formulas, Graphs, and Mathematical Tables, 10th ed.; Mathematics Series; National Bureau of Standards: Washington, DC, USA, 1972; Volume 55.
  20. Huynh-Tuh, Q.; Ghanbari, M. Scope of Validity of PSNR in Image/Video Quality Assessment. Electron. Lett. 2008, 44, 800–801. [Google Scholar] [CrossRef]
  21. Huynh-Tuh, Q.; Ghanbari, M. The Accuracy of PSNR in Predicting Video Quality for Different Video Scenes and Frame Rates. Telecommun. Syst. 2012, 49, 35–48. [Google Scholar] [CrossRef]
  22. Sun, Y.; Lu, A.; Yu, L. Weighted-to-Spherically-Uniform Quality Evaluation for Omnidirectional Video. IEEE Signal Process. Lett. 2017, 24, 1408–1412. [Google Scholar] [CrossRef]
  23. Wu, H.R.; Rao, K.R. Digital Video Image Quality and Perceptual Coding; CRC Press: Boca Raton, FL, USA, 2006. [Google Scholar]
  24. Wang, Z.; Bovik, A.C.; Sheikh, H.R.; Simoncelli, E.P. Image Quality Assessment From Error Visibility to Structural Similarity. IEEE Trans. Image Process. 2004, 13, 600–612. [Google Scholar] [CrossRef] [PubMed] [Green Version]
  25. Samsung, Republic of Korea. 360tools: Projection and Quality Evaluation Tools for VR Video Compression Exploration Experiments. Available online: https://github.com/Samsung/360tools (accessed on 23 May 2019).
Figure 1. Example of an equirectangular projected 360 video frame with uniformly distributed samples of latitude and longitude.
Electronics 10 01527 g001
Figure 2. YUV4:2:0 color encoded equirectangularly projected frame of a 360 video: (a) Y component, (b) U component, (c) V component.
Electronics 10 01527 g002
Figure 3. Block diagram of the basic components of the proposed viewing direction based LSB data hiding for 360 videos.
Electronics 10 01527 g003
Figure 4. Sample frames of the five 360 cover videos in equirectangular projection [16,17].
Electronics 10 01527 g004
Figure 5. Temporal perceptual information versus spatial perceptual information for the five 360 cover videos calculated according to Recommendation ITU-T P.910 [18].
Electronics 10 01527 g005
Figure 6. Sample 360 stego-video frames of scene “Salon” with viewing direction based LSB data hiding in the latitude and longitude for different numbers of bit planes.
Electronics 10 01527 g006
Figure 7. TI versus SI for 360 stego-videos with data hiding in the entire frames with b = 1 , , 6 (black markers relate to the 360 cover videos).
Electronics 10 01527 g007
Figure 8. Normalized GMM for the latitude: (a) Normalized relative viewing direction frequency f ^ ( ϕ ) , (b) Data hiding weight function w 1 ( ϕ ) .
Electronics 10 01527 g008
Figure 9. Binary map of random data hiding positions along the latitude (Black: Pixel used for data hiding; White: Pixel not used for data hiding).
Electronics 10 01527 g009
Figure 10. Normalized GMM for the longitude: (a) Normalized relative viewing direction frequency g ^ ( θ ) , (b) Data hiding weight function w 2 ( θ ) .
Electronics 10 01527 g010
Figure 11. Binary map of random data hiding positions along the longitude (Black: Pixel used for data hiding; White: Pixel not used for data hiding).
Electronics 10 01527 g011
Figure 12. Normalized GMM for latitude and longitude: (a) Normalized relative viewing direction frequency u ^ ( ϕ , θ ) , (b) Data hiding weight function w 3 ( ϕ , θ ) .
Electronics 10 01527 g012
Figure 13. Binary map of random data hiding positions along the latitude and longitude (Black: Pixel used for data hiding; White: Pixel not used for data hiding).
Electronics 10 01527 g013
Figure 14. Capacity of viewing direction based data hiding: (a) Latitude ϕ , (b) Longitude θ .
Electronics 10 01527 g014
Figure 15. Capacity of viewing direction based data hiding in latitude and longitude.
Electronics 10 01527 g015
Figure 16. Fidelity of viewing direction based LSB data hiding in the latitude: (a) PSNR( ϕ ), (b) WS-PSNR( ϕ ), (c) NCP-PSNR( ϕ ).
Electronics 10 01527 g016aElectronics 10 01527 g016b
Figure 17. Fidelity of viewing direction based LSB data hiding in the longitude: (a) PSNR( θ ), (b) WS-PSNR( θ ), (c) NCP-PSNR( θ ).
Electronics 10 01527 g017aElectronics 10 01527 g017b
Figure 18. NCP-PSNR( ϕ , θ ) of viewing direction based LSB data hiding in the latitude and longitude of 360 cover video “Salon” for different number of bit planes.
Electronics 10 01527 g018aElectronics 10 01527 g018b
Figure 19. Visual quality of viewing direction based LSB data hiding in the latitude: (a) SSIM( ϕ ), (b) NCP-SSIM( ϕ ).
Electronics 10 01527 g019
Figure 20. Visual quality of viewing direction based LSB data hiding in the longitude: (a) SSIM( θ ), (b) NCP-SSIM( θ ).
Electronics 10 01527 g020aElectronics 10 01527 g020b
Figure 21. NCP-SSIM( ϕ , θ ) of viewing direction based LSB data hiding in the latitude and longitude of 360 cover video “Salon” for different number of bit planes.
Electronics 10 01527 g021
Table 1. Parameters of the normalized GMM f ^ ( ϕ ) for latitude ϕ .
k a ^ k b k c k
10.2272−2.37386.6437
20.63331.826014.8171
30.17271.461836.1311
Table 2. Parameters of the normalized GMM g ^ ( θ ) for longitude θ .
l a ^ l b l c l
10.1988−0.15494.6740
20.61981.514018.51
30.18716.3670110.5
Table 3. Total capacity C 1 , C 2 , and C 3 provided by popular 360 video resolutions.
b N × M C 1 ( 90 , b ) C 1 C 2 ( 180 , b ) C 2 C 3 ( 90 , 180 , b ) C 3
1 7680 × 3840 0.8307 24.49 0.8393 24.75 0.9723 28.67
1 6144 × 3072 0.8307 15.67 0.8393 15.84 0.9723 18.35
1 4096 × 2048 0.8307 6.96 0.8393 7.04 0.9723 8.15
1 3600 × 1800 0.8307 5.38 0.8393 5.43 0.9723 6.30
1 2048 × 1024 0.8307 1.74 0.8393 1.76 0.9723 2.03
3 7680 × 3840 2.4921 73.49 2.5179 74.25 2.9169 86.02
3 6144 × 3072 2.4921 47.03 2.5179 47.52 2.9169 55.05
3 4096 × 2048 2.4921 20.90 2.5179 21.12 2.9169 24.46
3 3600 × 1800 2.4921 16.14 2.5179 16.31 2.9169 18.90
3 2048 × 1024 2.4921 5.22 2.5179 5.28 2.9169 6.11
6 7680 × 3840 4.9843 146.99 5.0359 148.51 5.8338 172.04
6 6144 × 3072 4.9843 94.07 5.0359 95.04 5.8338 110.10
6 4096 × 2048 4.9843 41.81 5.0359 42.24 5.8338 48.93
6 3600 × 1800 4.9843 32.29 5.0359 32.63 5.8338 37.80
6 2048 × 1024 4.9843 10.45 5.0359 10.56 5.8338 12.23
Note: C1(90°, b), C2(180°, b), C3(90°, 180°, b) in bpp/frame; C1, C2, C3 in Mbits/frame.
Publisher’s Note: MDPI stays neutral with regard to jurisdictional claims in published maps and institutional affiliations.

