Article

Strong-Weak Feature Alignment for 3D Object Detection

1
College of Intelligence Science and Technology, National University of Defense Technology, Changsha 410073, China
2
Unmanned Systems Research Center, National Innovation Institute of Defense Technology, Beijing 100071, China
*
Author to whom correspondence should be addressed.
Electronics 2021, 10(10), 1205; https://doi.org/10.3390/electronics10101205
Submission received: 28 March 2021 / Revised: 10 May 2021 / Accepted: 13 May 2021 / Published: 18 May 2021
(This article belongs to the Section Electrical and Autonomous Vehicles)

Abstract

:
Object detection in 3D point clouds is still a challenging task in autonomous driving. Due to the inherent occlusion and density changes of the point cloud, the data distribution of the same object will change dramatically. Especially, the incomplete data with sparsity or occlusion can not represent the complete characteristics of the object. In this paper, we proposed a novel strong–weak feature alignment algorithm between complete and incomplete objects for 3D object detection, which explores the correlations within the data. It is an end-to-end adaptive network that does not require additional data and can be easily applied to other object detection networks. Through a complete object feature extractor, we achieve a robust feature representation of the object. It serves as a guarding feature to help the incomplete object feature generator to generate effective features. The strong–weak feature alignment algorithm reduces the gap between different states of the same object and enhances the ability to represent the incomplete object. The proposed adaptation framework is validated on the KITTI object benchmark and gets about 6% improvement in detection average precision on 3D moderate difficulty compared to the basic model. The results show that our adaptation method improves the detection performance of incomplete 3D objects.

1. Introduction

3D object detection [1,2,3] based on point cloud is an important part of the autonomous driving perception system. The LiDAR point cloud is accurate in describing the real world, which is an important guarantee for the safety of autonomous driving. Although a lot of progress has been made in image-based 2D object detection [4,5,6,7], 3D object detection is still a challenging problem due to the variance of point cloud distribution.
The 3D point clouds are usually generated by emitting and receiving the laser rays from the center of the LiDAR to the surrounding environment. However, the form of point cloud generation makes the distribution of the point cloud have different characteristics from the image. As the distance to the LiDAR increases, the density of the point cloud will decrease. And the laser ray model will cause distant objects to be occluded by nearby objects. These characteristics lead to insufficient data on the object, so 3D object detection performance is unstable. Recent 3D object detection method [8,9,10] try to handle this problem. Yi et al. [8] attempt to recover the complete 3D surface from the sparse point cloud to reduce the difference in the sampling pattern. However, it requires dense surface point clouds, but the registration of the point cloud is difficult. RANGE [9] utilizes the generative adversarial network (GAN) [11] to perform cross-range adaptation. But it focuses on the global consistency between near-range and far-range objects and ignores the 3D characteristics of objects. Du et al. [10] adapts object-wise feature from the perceptual domain to the conceptual domain. However, the association between the perceptual object and conceptual object is too strong to learn high-frequency information and the construction of perceptual scene is very complicated.
Existing 3D object detection methods usually detect all objects instead of processing incomplete object separately, which is the difficulty of 3D object detection. There are few studies on methods for incomplete 3D objects. Some works either have a very complex preprocessing and need to find the complete object corresponding to each object, or they are very rough and only consider the overall similarity between complete and incomplete objects. In this paper, we focus on solving the problem of incomplete object feature representation. The characteristics of the point cloud ensure that the scale of the object will remain the same in different locations. Thus we can use the shape and orientation angle to establish the association between complete and incomplete objects. Different from the image super-resolution method for data alignment on the raw data, our proposed method for object adaptation is performed on the intermediate layer of the network to minimize content loss. As shown in Figure 1, due to occlusion and sparseness, the features extracted from the incomplete object are difficult to fully represent the object, which leads to the failure of subsequent detection tasks. Our strong–weak feature alignment algorithm builds up a relationship between complete and incomplete objects via their shapes and orientation angles to improve the feature representation of the incomplete object.
We combine the strong and weak feature alignment for object adaptation. For the strong object feature alignment, we adopt L2 distance to measure the difference between a pair of complete and incomplete objects. While the object-wise matching might work well for the object adaptation, as mentioned in [12], the L2 distance will eliminate high-frequency information and produces results that are too smooth. And the position error caused by the resolution also affects the feature alignment. Motivated by these observations, we require the task-level alignment to indirectly achieve the object alignment. We encourage incomplete objects to achieve the same task through the classifier and box regressor from the complete object feature extractor. The weak feature alignment retains the information of the complete object in the network and indirectly performs object-wise alignment.
We evaluate our strong–weak feature alignment model on the KITTI benchmark [13]. Experimental results indicate that the proposed approach could obtain a remarkable improvement in incomplete object detection.
This paper is structured as follows: In Section 2, we review the related work. Section 3 shows the entire framework of our method and introduces the complete object feature extractor, the incomplete object feature generator, the strong feature alignment module, and the weak feature alignment module. In Section 4, the implementation details of our method are introduced. In Section 5, the qualitative and quantitative experiments on the KITTI benchmark are introduced. Section 6 shows the ablation study of our method, and then the conclusions are given in Section 7.

2. Related Work

2.1. 3D Object Detection

According to the representation of the LiDAR point cloud, the current 3D object detection method could be roughly divided into three categories: the method based on 3D voxel, the method based on 2D projection view, and the method based on the point-wise feature.
By discretizing the 3D space into voxels, the 3D convolutional neural network (CNN) is naturally applied to the voxel. Some early methods [14,15] utilize 3D CNN directly but are very inefficient. The Voxelnet [16] introduced the voxel feature encoding layer to learn unified feature representation and avoided the information loss introduced by the manual feature engineering. SECOND [17] uses sparse convolution [18] to reduce computational consumption and accelerate the process speed. Sparse convolution considers the sparsity of the point cloud and only performs the convolution at locations where points exist. Another method for reducing the computational consumption is to reduce the resolution of the voxel. Wang et al. [19] propose a cascaded network that subdivides the initial voxel into smaller voxels to increase the resolution.
To avoid time consumption caused by 3D convolution, some methods project the 3D point cloud to the 2D image view [20,21,22]. MV3D [20] generate the 3D proposals based on the bird’s eye view (BEV) and the multimodal information from BEV, front view, and image are merged through a fusion network. Yang et al. [23] achieves real-time 3D object detection by representing the 3D scene from BEV. [22] projects point cloud to pillars and learns pillar features through a point cloud encoding layer. All operations of [22] are 2D convolutions which enable a high speed point representation. Although 2D view-based methods improve the efficiency of processing 3D point clouds, some information might get lost after the projection.
Point-wise based methods directly extract features from the point cloud which aim to learn the representation of spatial geometry. Qi et al. [24] proposed a network named PointNet which uses pooling operations to deal with disordered points. They further proposed PointNet++ [25] to learn local features through the hierarchical network. F-PointNet [26] uses raw point cloud for 3D object detection. The proposals of the point cloud are generated by projecting the detection results of the image to the 3D frustum. Then the features of proposals are extracted by PointNet and used to estimate the 3D localization. STD [27] proposed a sparse-to-dense 3D object detector that uses raw point clouds to generate accurate proposals with spherical anchors. It achieves a high recall.

2.2. Domain Adaptation for Object Detection

The problem of minimizing the difference between the source domain and the target domain has been studied for the task of object detection. Most of the previous works have been done for the 2D image. Chen et al. [28] designs image-level and instance-level domain adaptation to reduce the domain discrepancy. A gradient reversal layer [29] is used to train the adversarial network. Strong–weak Distribution Alignment [30] focuses the adversarial alignment on the data that is globally similar and enhances the consistency of local structural information. There is relatively little research on domain adaptation of 3D point clouds. Rist et al. [31] proposed a cross-sensor domain adaptation method and demonstrated that dense 3D voxels can better model sensor invariance features. SqueezeSegv2 [32] proposes a new model that is more robust to dropout noise and builds a synthetic database from the simulation engine. In [8], a network is trained to perform the surface completion from the sparse point cloud and the recovered dense 3D surfaces are used as an intermediate representation for domain adaption. Wang et al. [9] propose a cross-range adaptation framework based on the adversarial global adaptation and the fine-grained local adaptation. Associate-3Ddet [10] bridges the gap between the perceptual domain and the conceptual domain for domain adaptation. Compared with these domain adaptation method, our strong–weak feature alignment algorithm uses existing data to enhance the incomplete object feature representation without complicated preprocessing or additional data. It is a completely end-to-end learning process that can be used in other 3D object detection networks.

3. Method

In this section, we describe the architecture of the proposed strong–weak feature alignment method.
The network architecture is illustrated in Figure 2. It consists of four components: a complete object feature extractor (COFE) to extract the source domain feature from high-quality 3D objects, an incomplete object feature generator (IOFG) to generate target domain feature from sparse and occluded 3D objects, a strong feature alignment module for domain adaptation of object features and a weak feature alignment module that indirectly minimize the difference between the source domain and the target domain by aligning the output of the classifier and box regressor.

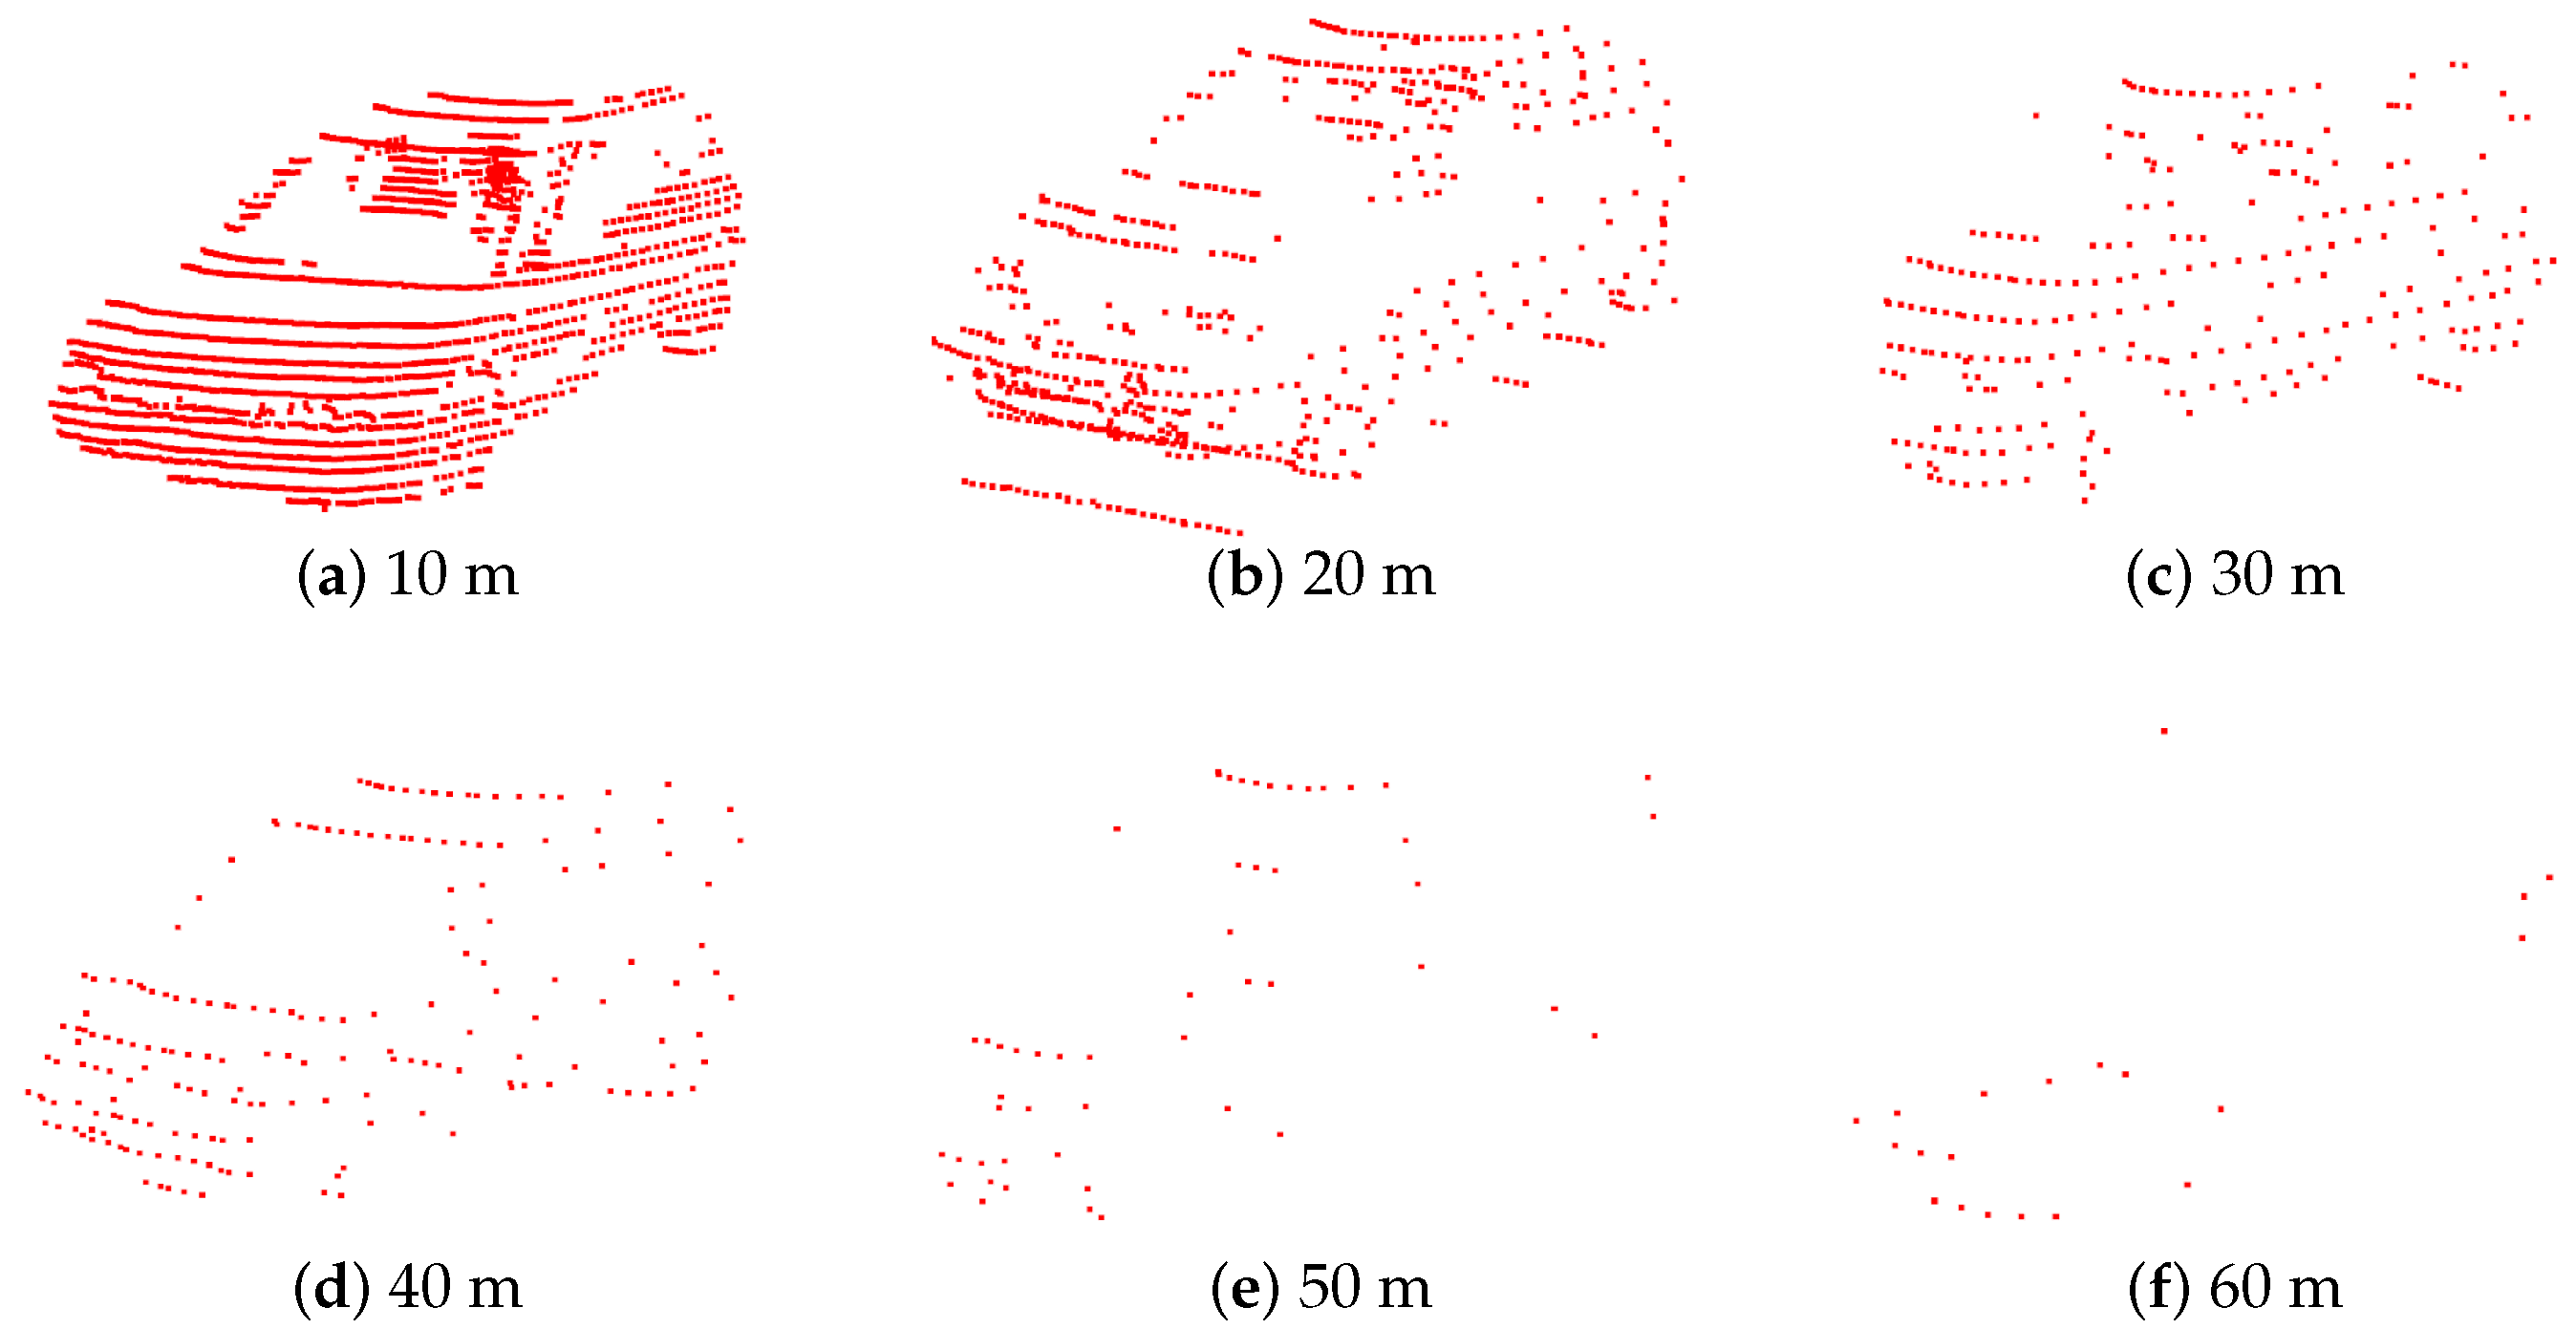
3.1. Complete Object Feature Extractor

Complete object feature extractor provides standard object feature from the complete object as the source domain feature. There are a lot of 3D object detection methods [16,17,19,22] that can be used as the basic network of our method. In this section, we choose one of them as the COFE. Following SCNET [19], we utilize an efficient subdivision encoder that obtains input features by subdividing and encoding the entire 3D space, and then uses a convolution neural network for feature extraction. This is an end-to-end network trained on the complete object models. The complete object models should contain a complete point cloud for each object. Although the 3D CAD model is a good choice, choosing dense objects in the existing dataset is a potential choice for better integration with the real scene. After the training of the COFE, the parameters of the network will be fixed to provide stable reference features for domain adaptation.
During the training phase, we use the same loss functions introduced in SCNET [19]. The loss of the COFE consists of two parts: the focal loss for classification, the regression loss for location and dimension. The loss of COFE is defined as:
L d e t = L c l s + β 1 L r e g
where β 1 is set to 2.0 according to SCNET.
For a single-stage detection network, there is a problem of foreground-background imbalance during training. We use the focal loss to handle the class imbalance problem following [33]. The classification loss is formulated as:
L c l s = α t ( 1 p t ) γ l o g ( p t )
where α and γ are the hyper-parameters of the focal loss. p t is the probability score of the classifier.
We utilize the fixed-size anchors to model the objects. x , y , z are the center coordinates, w , l , h are represent the width, length and height of objects, and θ is the yaw angle around Z-axis. The basic anchors are presented as { x a , y a , z a , w a , l a , h a , θ a } , and the ground-truth object is parameterized as { x g , y g , z g , w g , l g , h g , θ g } . In the regression task, we define the regression target as follows:
δ x = x g x a d a , δ y = y g y a d a , δ z = z g z a h a ,
δ w = l o g ( w g w a ) , δ l = l o g ( l g l a ) , δ h = l o g ( h g h a ) ,
δ θ = s i n ( θ g θ a )
where d a = ( l a ) 2 + ( w a ) 2 is the diagonal of the anchor bounding box.
Smooth-L1 loss is used to regress the 3D bounding boxes.
L r e g = δ b ( δ x , δ y , δ , z , δ w , δ l , δ h , δ θ ) S m o o t h L 1 ( δ b )

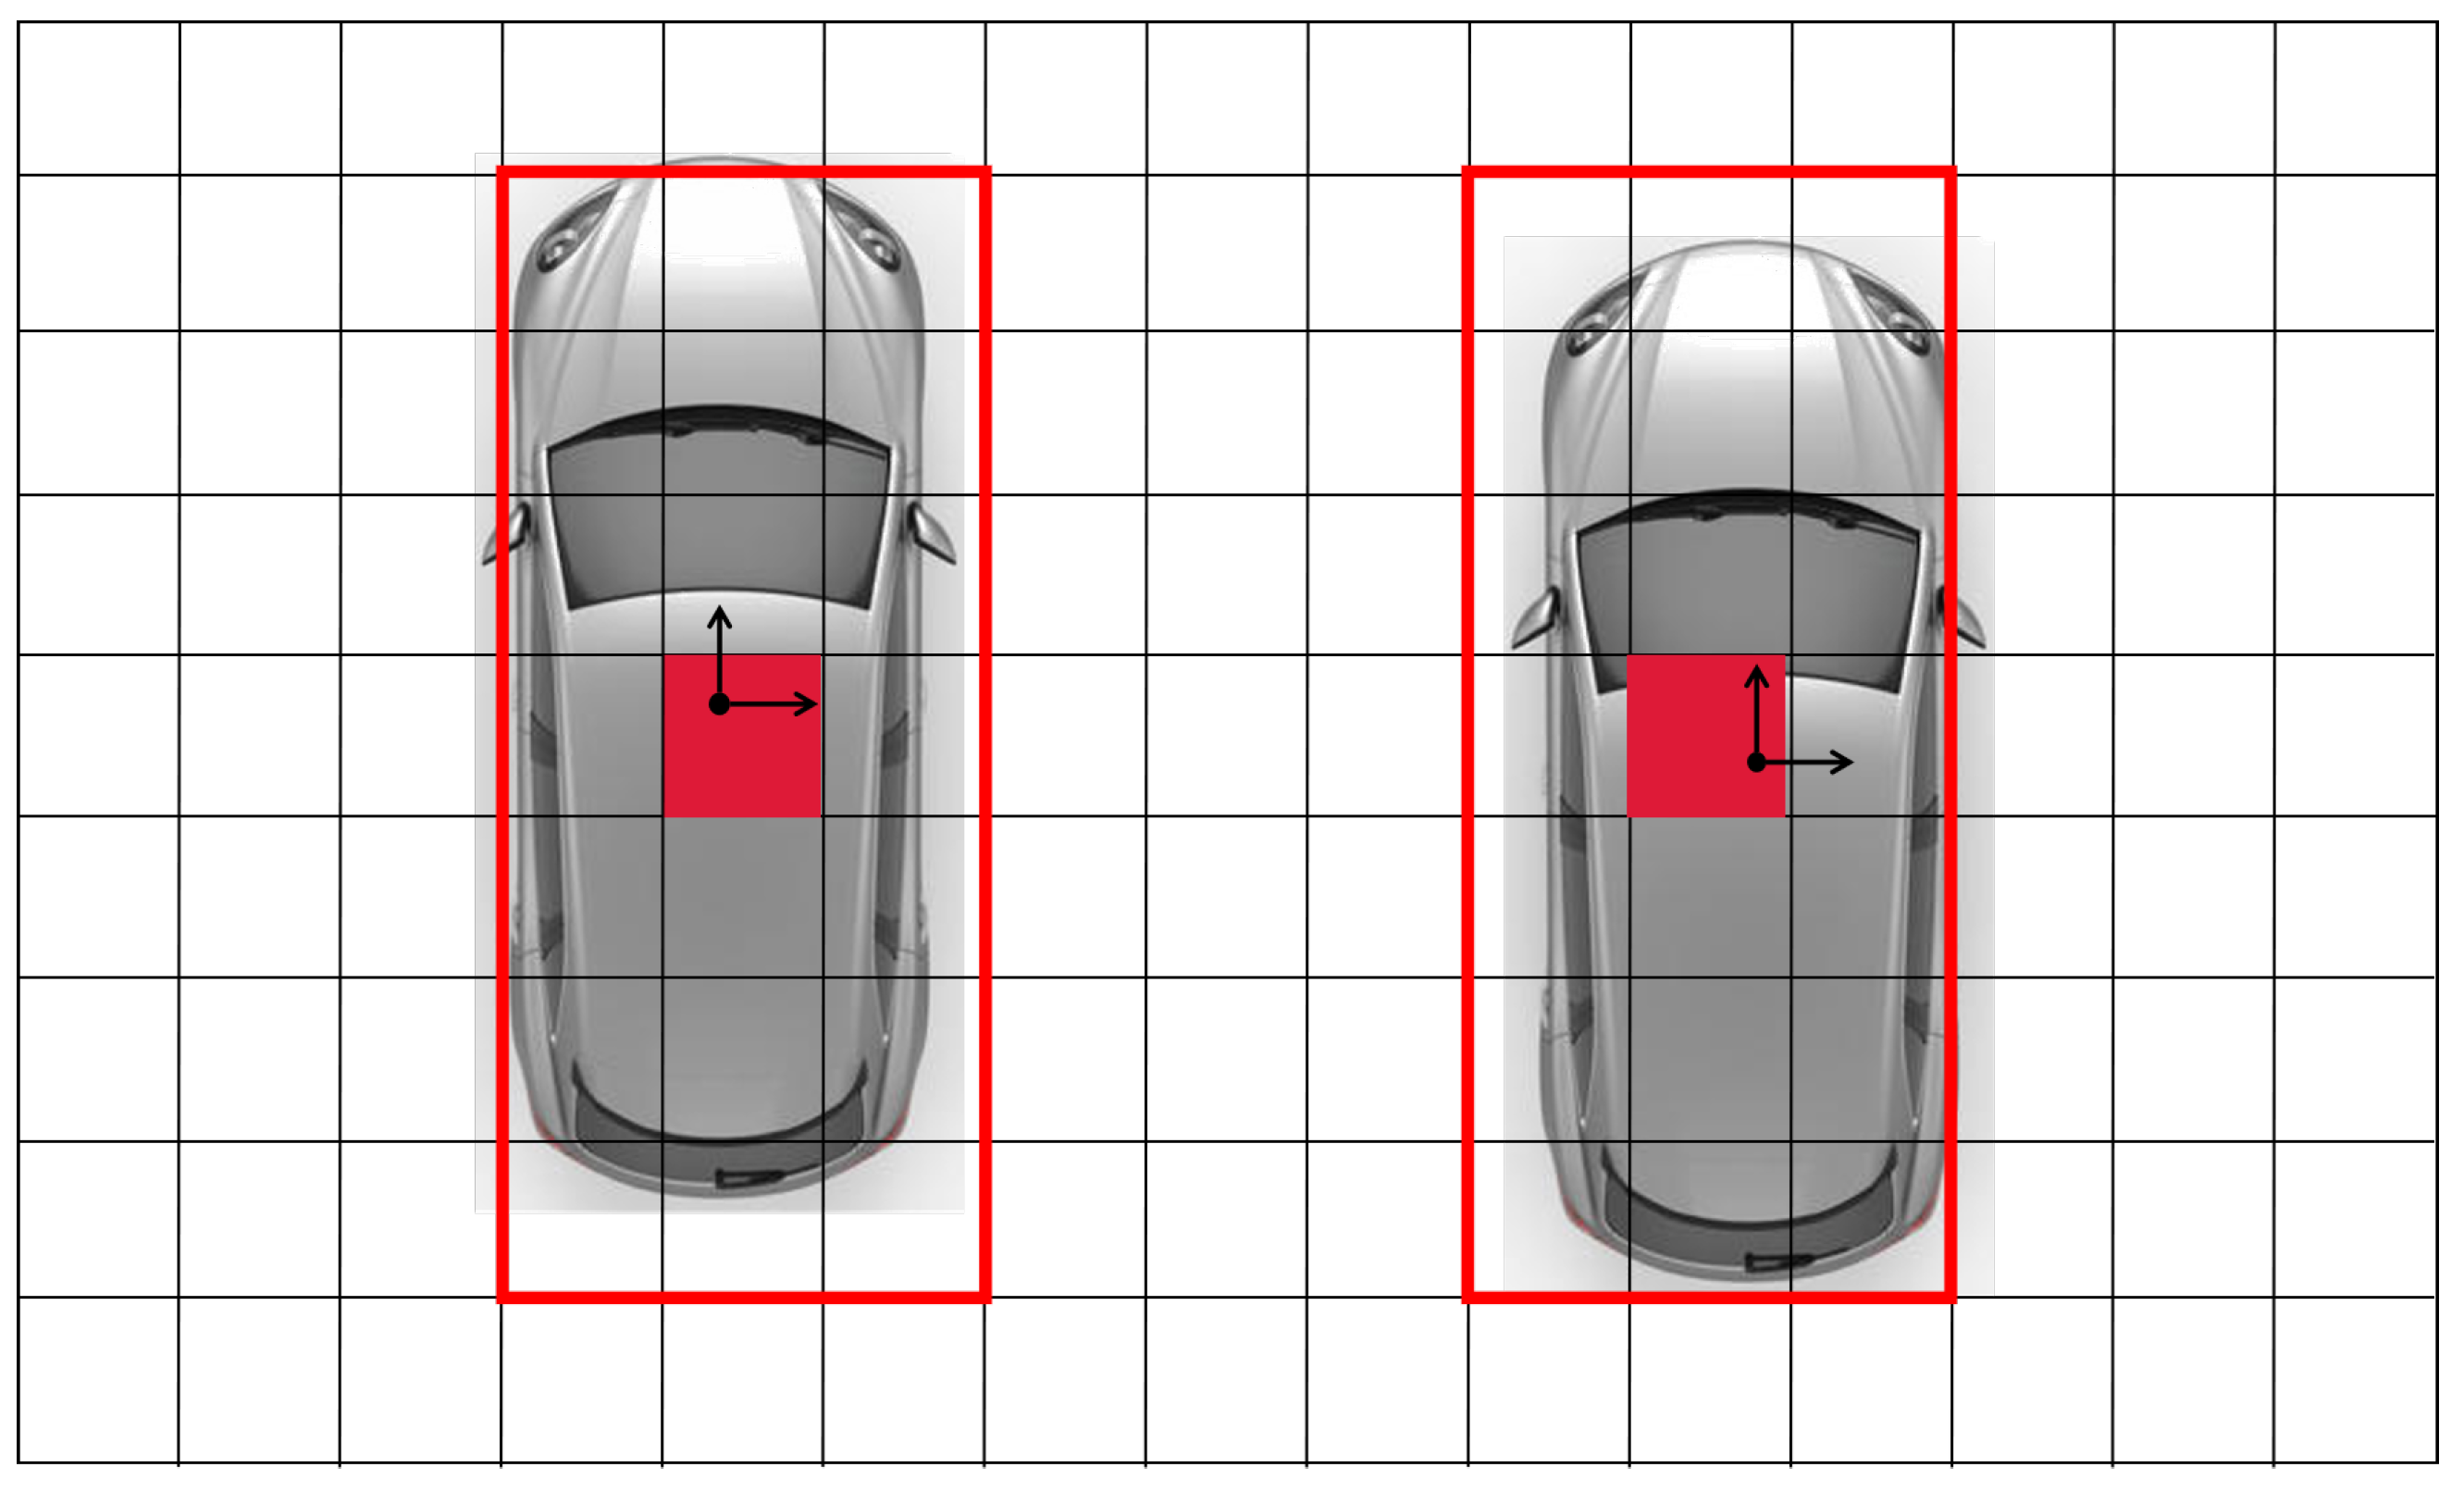
3.2. Incomplete Object Feature Generator

The incomplete object feature generator extracts the features of the distant and occluded objects. The feature generator takes the subdivided coding features of the point cloud as input. According to the guidance of the COFE, the generator tries to generate complete object representation from incomplete data. Because incomplete objects lack effective points, it is difficult for the generator to directly learn complete feature representations compared with COFE. Therefore, for the generator to generate ideal and complete feature representation from incomplete data, the network needs to capture more contextual information from the environment. Inspired by [8] that generates new structure for completion purpose with the dense upsampling operation and by [34] that considers both the importance of elements in different channels and the importance of elements in different locations in the same channel, this work uses an attention mechanism to adjust the weights of upsampling operations at different resolutions, as shown in Figure 3. In this way, each grid in the lower resolution will generate some grids in the higher resolution after the dense upsampling operation, and the attention mechanism will increase the representation power of the different resolutions.
The convolutional block attention module (CBAM) [34] consists of the channel attention and the spatial attention module. The input of the channel attention module is a feature map with H × W × C . Through the max-pooling and average-pooling operation, two descriptors of the channel with size 1 × 1 × C can be obtained. Both descriptors are fed into a shared multi-layer perception (MLP) to generate channel attention maps. Then the attention maps are merged with element-wise summation and a sigmoid function is used to output the channel weights. Different from the channel attention module, the spatial attention module utilizes the max-pooling and average-pooling operation along the channel axis to generate two spatial descriptors with size H × W × 1 . Then the two descriptors are concatenated and are fed into a convolutional layer to generate weights.

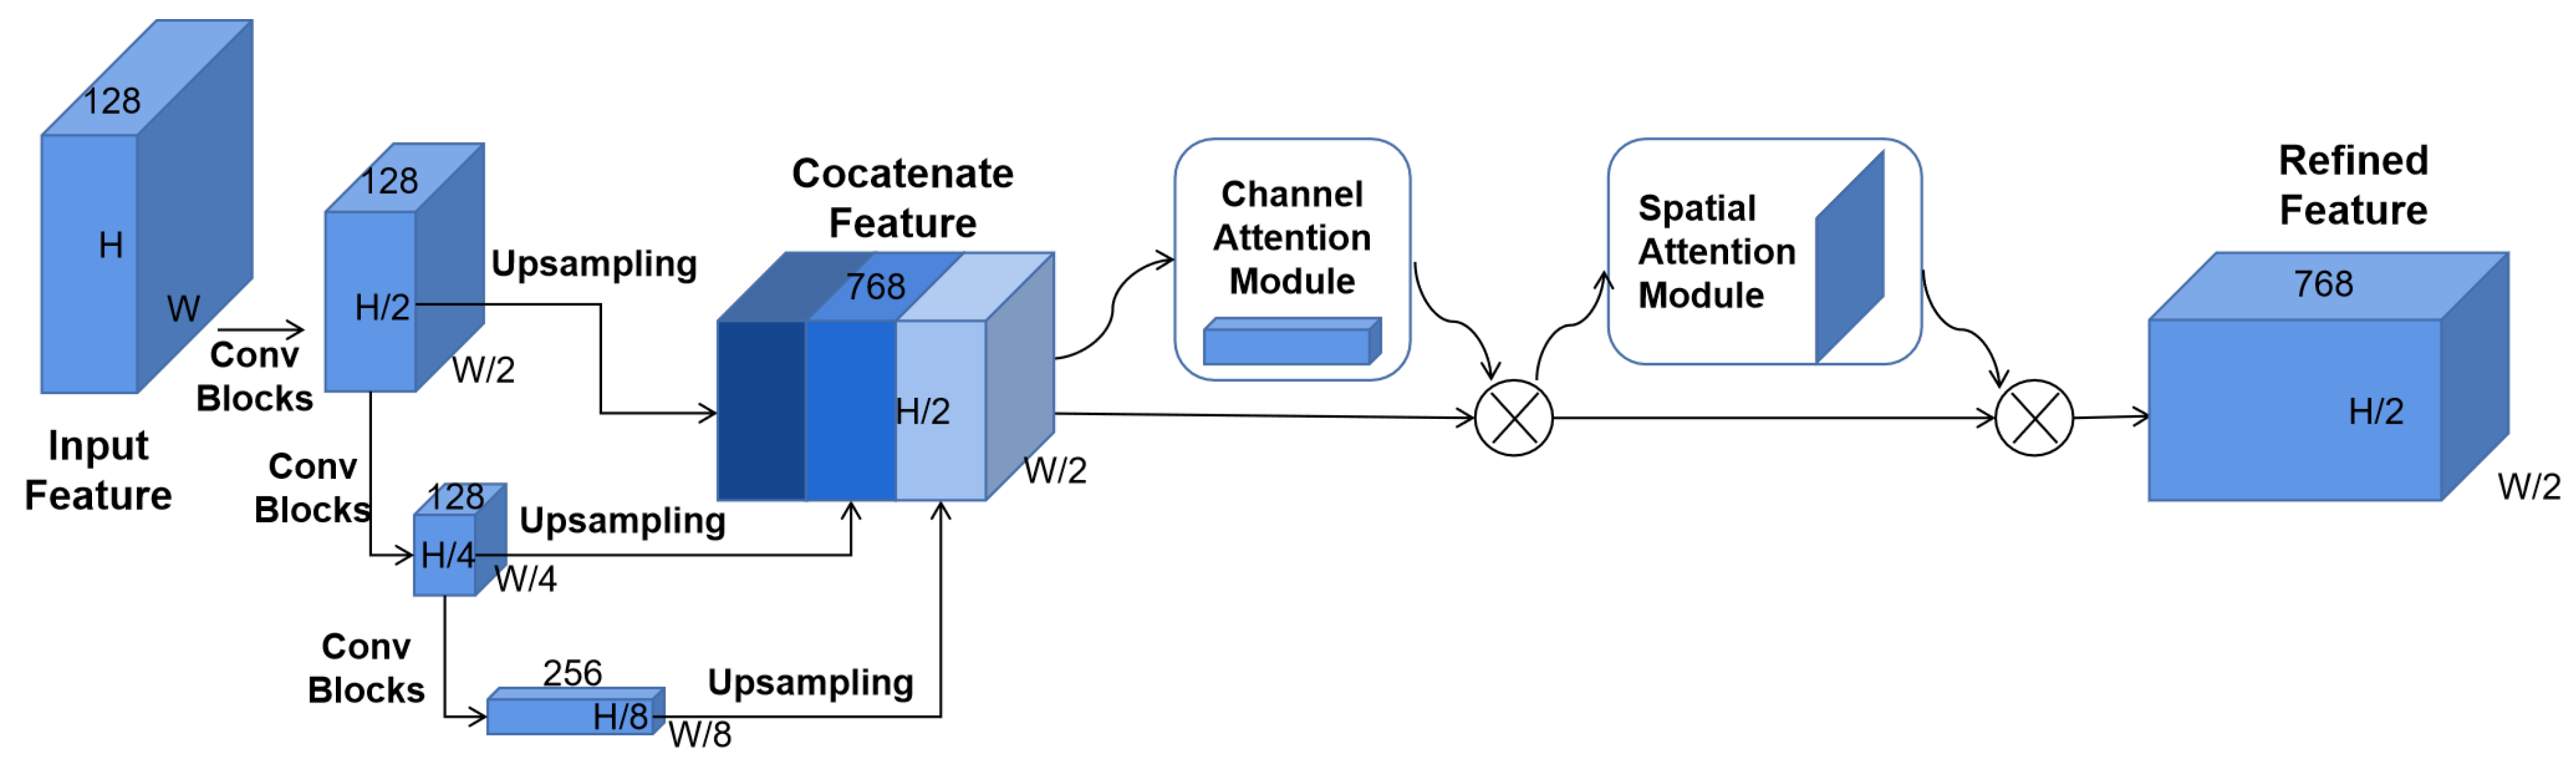
3.3. Strong Feature Alignment Module

The strong feature alignment module learns the mapping between the complete object feature and the incomplete object feature. The complete object features are extracted as the source domain features by the COFE module and the incomplete object features come from IOFG module as the target domain features. We have observed that an object in the point cloud has a consistent scale regardless of positions. In other words, the complete and incomplete objects have the same observation pattern but different point cloud densities. Thus we can obtain the complete-incomplete pairs through the similarity of the annotations of objects.
To align the source domain feature and target domain feature, we have established a complete sample database in the training phase. We extract the complete object features from the COFE module and save the features and annotations of objects at the same time. In theory, if the database is large enough, each incomplete object can find the corresponding complete object. The size of the database is set to 500 and the database is dynamically updated with new complete object features.
During the training phase, we use F t to represent the incomplete object feature generated in each mini-batch and the complete sample feature of the database as F s . The annotations of objects are represented as O, where O consists of the length l, width w, height h, orientation angle r y , and observation angle r o . Given an incomplete object with feature f t and its annotation o t , the similarity between complete and incomplete objects is measured as:
ω s t = o s · o t o s 2 o t 2
where s and t represent the source domain and target domain.
We choose the top K objects in the database with the highest similarity as candidates. The guiding feature is calculated as:
f ^ t = 1 K k = 1 K f s k
Given the incomplete object feature and its corresponding complete object feature, we minimize the L2 distance between them for domain adaptation. The strong feature alignment loss can be written as:
L s t r o n g = f t F t f t f ^ t 2

3.4. Weak Feature Alignment Module

Although the complete database helps to align the source domain data and the target domain data in an observation pattern, they are not spatially aligned. We choose the grid with the largest intersection over union (IOU) between the anchor bounding box and the ground truth bounding box as the basic grid of the object. As shown in Figure 4, each anchor has a center grid and a default bounding box. The two cars have the same size and observation angles, but their relative position to the anchor is different. The regression goals of the two objects of the same observation pattern are different. This spatial misalignment is caused by the resolution of the feature map. Meanwhile, the L 2 distance used in the strong feature alignment module is difficult to deal with the uncertainty inherent in recovering high-frequency details.
The weak feature alignment module uses part of the complete object feature extractor’s network to convert feature alignment to label alignment, as shown in Figure 2. Especially, the incomplete object feature generator shares the parameters of the classifier and the Box regressor from the COFE. The parameters are from the pre-trained COFE and thus are also fixed in the training phase of IOFG. The Weak feature alignment ensures that regardless of whether the object is complete or incomplete, the output should be the same for objects with the same label. The fixed network acts as a weak discriminator and requires the generator to generator to generate features consistent with the source domain. The weak loss is formulated as follows:
L w e a k = D x G ( x )
where D means the classifier and box regressor of COFE, and G represents the incomplete object feature generator.

3.5. Loss

In the training phase, the complete object feature extractor is first trained. The input of the COFE is the complete objects filtered from labeled data. There are two filter conditions: objects within near range to ensure that the objects are dense enough, and the objects without occlusion or truncation to ensure that the objects are complete. After training of COFE, the parameters are fixed to guide the IOFG. The far-range objects and corresponding scenes are fed into the IOFG. We denote the total loss of our IOFG as L g :
L G = L w e a k + β L s t r o n g
where β is a hyper-parameter to balance the strong and weak alignment loss.
After the training phase, the incomplete object feature generator can independently generate complete features without the COFE. In the inference phase, the COFE and the complete database can be removed.

4. Implementation

In this section, we introduce the implementation of the proposed strong–weak alignment network.

4.1. Dataset and Metrics

We evaluate our method on the KITTI-object benchmark [13]. The target category of detection is set as the car. The benchmark dataset contains 7481 training data and we follow a previous work [35] to split it into a training subset of 3712 frames and a validation subset of 3769 frames. There are three difficulty levels of samples according to the size, occlusion, and truncation of the object. The evaluation of the method for object detection is performed on the three levels.
We follow the KITTI evaluation protocols to evaluate our method in the BEV and 3D view. The average precision (AP) is reported to evaluate the performance. The IOU threshold is set to 0.7.

4.2. Implementation Details

We use the SCNET [19] as the basic network of the complete object feature extractor. We first perform subdivision encoding in each grid as the input feature and follow a backbone network to extract the complete object features. The incomplete network share similar structure of COFE but an extra convolutional block attention module which combines the spatial and channel attention. The input of CBMA is the concatenated feature map of three upsampling feature maps with different resolutions. Thus the CBAM helps to obtain more context information from different resolution feature maps. Especially, COFE and IOFG share the parameters of classifier and box regressor for weak feature alignment.
Since cars are the main participant in transportation and have a large number of samples in the dataset, we only report the results of cars for comparison. Following [17], we select the data within [ 3 , 1 ] × [ 40 , 40 ] × [ 0 , 70.4 ] meters along the Z, Y, and X axes. The resolution of the grid is set to 0.2 m.
All of the networks are trained with Stochastic Gradient Descent (SGD) optimizer. We use an exponential decay learning rate strategy. The initial learning rate is set to 0.0002 and the decay weight is 0.8 every 15 epochs. The batch size in the training phase is set to 3. The hyper-parameters of focal loss are set to α = 0.25 and γ = 2 . The trade-off parameter β between strong and weak feature alignment is set to 0.1. We set K = 5 to create the guiding features.

5. Experiments

The completeness of the data is mainly determined by the distance and occlusion. Distance will bring sparseness, so far-range objects are all incomplete. For a better validation of our method, we define the source domain as near-range complete objects without occlusion or truncation and the target domain as far-range objects. The range threshold is set to 35 m.
First, we train the COFE to get the detection results of complete objects, as shown in Table 1. It represents the upper bound of performance. The excellent performance shows that the COFE model can be used to guide the IOFG to generate enhanced features. The result also shows that the pre-trained complete object feature extraction model cannot be used directly on incomplete data, so it is necessary to perform object feature alignment.
As shown in Table 2, we evaluate our strong–weak feature domain alignment network on the 3D object detection and BEV object detection on the validation dataset. We have used SCNET as a baseline model to train the target domain data. For 3D object and BEV object detection, we have demonstrated that our method can improve the accuracy of incomplete object detection.
We further compare the impact of different feature alignments on performance. The improved feature generator with CBAM has limited performance improvement without feature alignment. We find that the weak feature alignment module provides more gain than strong feature alignment module. The fixed classifier and box regressor help the feature generator to generate more robust feature representations than the strong feature alignment. Especially, the improvement of 3D object detection shows our method with strong and weak feature alignment learns more expressive features.
We present several qualitative results in Figure 5. Figure 5 shows comparison results of baseline and our method on the validation dataset. We only show the results of far-range object detection. It is observed that occluded and distant objects can be well detected by our strong–weak feature alignment method. The posture prediction is more accurate and even the unlabeled objects can be effectively detected.

6. Ablation Study

6.1. Hyper-Parameter of Guiding Feature

We define the guiding feature as the feature average of the K most similar object to the incomplete object in the complete database. We select different K values for experiments to evaluate the effect of K for constructing the guiding feature. The smaller K indicates that the complete object and the incomplete object are more similar in the observation pattern. We set K as 1, 5, 10, and 20. The results under different settings are shown in Table 3. Due to the limited capacity of the dynamic database, when the value of K increases, some unmatched object features will participate in the construction of guarding features. In theory, smaller K will get better performance. The experiment shows a similar trend. It is observed that k = 5 gets the best result. However, if the K is too small, the performance will decrease. Since the object similarity measurement is based on the length, width, height, observation angle, and orientation angle, it is difficult to represent the sensitivity of the position. Specifically, the smaller K value is more sensitive to the position errors.

6.2. Different Strategies for Strong Object Feature Alignment

We compare the different strategies for strong object feature alignment. RANGE [9] proposed a fine-grained local adaptation network, which uses the weighted average object feature in the near range as the targeted feature of a far-range object. The same source of data helps to improve the consistency of the object features. In our method, the targeted feature are from the complete object database.
As is shown in Table 4, the weighted average object feature in the near range does improve the performance. However, this improvement is weaker than our complete object guidance method. With different 3D shapes or observation angles, the distributions of the objects are different. It is not a simple linear relationship between different observation patterns. Although RANGE can find the invariance of object features, it will bring redundant errors like higher K.

6.3. Improvement at Different Distances

We further present a comparison to validate the performance at the different distances. The distribution of objects still varies greatly with distance. Since our target domain is defined as the far-range objects, the sparsity caused by distance makes it difficult for the object to learn robust features. Therefore, it is necessary to evaluate the effectiveness of our method on distance.
As is revealed in Table 5, we have improved the performance of object detection in each distance interval, especially in the range of 35 to 50 m. But as the distance increases, the basic performance and improvement gradually weaken. As shown in Figure 6, the number of samples gradually decreases after 30 m. Insufficient training samples will cause performance degradation. And Figure 1 shows the distribution of object point clouds with similar observation angles and different distances. It is observed that the far-range object is covered by a small number of points, so it is hard to generate robust feature representation for object detection.

6.4. Performance of Different Basic Networks

Our strong–weak feature alignment method is a general model adaptive method that can be applied to various point cloud object detection network. The 3D object detection framework is composed of point cloud rasterization and object detection network. We compared the performance of the adaptive method on SCNET [19], MV3D [20] and PointPillars [22]. MV3D is a typical network that encodes point clouds manually. Pointpillars is chosen because it is a detection network based on BEV encoding. The three networks have similar coding methods and detection processes.
Table 6 respectively records the performance of the target domain with and without adaptive method. It can be seen that no matter which basic model, the proposed adaptive model can improve the detection performance on the target domain.

7. Conclusions

In this paper, we have proposed a novel method for 3D object detection based on strong and weak feature alignment. We construct a complete object feature extractor to provide standard feature representation for incomplete objects. And the incomplete object feature generator is encouraged to generate more robust features under the guidance of complete features. Our method makes full use of the existing data to construct the relationship between complete and incomplete objects, and enhances the feature representation ability of incomplete objects without additional information. Our method can be easily applied to other object detection networks. We evaluate our method on the KITTI dataset and demonstrate that the combination of strong and weak feature alignment can significantly improve the detection performance of incomplete objects.

Author Contributions

Conceptualization and methodology, Z.W.; validation, Z.W., L.W.; writing—original draft preparation, Z.W.; writing—review and editing, Z.W., L.W.; supervision, B.D.; funding acquisition, B.D. All authors have read and agreed to the published version of the manuscript.

Funding

This research was funded by the National Natural Science Foundation of China, grant number 61790565.

Conflicts of Interest

The authors declare no conflict of interest.

References

  1. Yu, T.; Meng, J.; Yuan, J. Multi-view harmonized bilinear network for 3d object recognition. In Proceedings of the IEEE Conference on Computer Vision and Pattern Recognition, Salt Lake City, UT, USA, 18–23 June 2018; pp. 186–194. [Google Scholar]
  2. Du, X.; Ang, M.H.; Karaman, S.; Rus, D. A general pipeline for 3d detection of vehicles. In Proceedings of the 2018 IEEE International Conference on Robotics and Automation (ICRA), Brisbane, QLD, Australia, 21–25 May 2018; pp. 3194–3200. [Google Scholar]
  3. Luo, W.; Yang, B.; Urtasun, R. Fast and furious: Real time end-to-end 3d detection, tracking and motion forecasting with a single convolutional net. In Proceedings of the 2018 IEEE International Conference on Robotics and Automation (ICRA), Brisbane, QLD, Australia, 21–25 May 2018; pp. 3569–3577. [Google Scholar]
  4. Wang, M.; Deng, W. Deep visual domain adaptation: A survey. Neurocomputing 2018, 312, 135–153. [Google Scholar] [CrossRef] [Green Version]
  5. Lin, T.Y.; Dollár, P.; Girshick, R.; He, K.; Hariharan, B.; Belongie, S. Feature pyramid networks for object detection. In Proceedings of the IEEE conference on computer vision and pattern recognition, Honolulu, HI, USA, 21–26 July 2017; pp. 2117–2125. [Google Scholar]
  6. Liu, W.; Anguelov, D.; Erhan, D.; Szegedy, C.; Reed, S.; Fu, C.Y.; Berg, A.C. Ssd: Single shot multibox detector. In European Conference on Computer Vision; Springer: Berlin/Heidelberg, Germany, 2016; pp. 21–37. [Google Scholar]
  7. Ren, S.; He, K.; Girshick, R.; Sun, J. Faster r-cnn: Towards real-time object detection with region proposal networks. arXiv 2015, arXiv:1506.01497. [Google Scholar] [CrossRef] [PubMed] [Green Version]
  8. Yi, L.; Gong, B.; Funkhouser, T. Complete & label: A domain adaptation approach to semantic segmentation of LiDAR point clouds. arXiv 2020, arXiv:2007.08488. [Google Scholar]
  9. Wang, Z.; Ding, S.; Li, Y.; Zhao, M.; Roychowdhury, S.; Wallin, A.; Sapiro, G.; Qiu, Q. Range Adaptation for 3D Object Detection in LiDAR. In Proceedings of the 2019 IEEE/CVF International Conference on Computer Vision Workshop (ICCVW), Seoul, Korea, 27–28 October 2019; pp. 2320–2328. [Google Scholar]
  10. Du, L.; Ye, X.; Tan, X.; Feng, J.; Xu, Z.; Ding, E.; Wen, S. Associate-3ddet: Perceptual-to-conceptual association for 3d point cloud object detection. In Proceedings of the IEEE/CVF Conference on Computer Vision and Pattern Recognition, Seattle, WA, USA, 13–19 June 2020; pp. 13329–13338. [Google Scholar]
  11. Goodfellow, I.J.; Pouget-Abadie, J.; Mirza, M.; Xu, B.; Warde-Farley, D.; Ozair, S.; Courville, A.; Bengio, Y. Generative adversarial networks. arXiv 2014, arXiv:1406.2661. [Google Scholar]
  12. Ledig, C.; Theis, L.; Huszár, F.; Caballero, J.; Cunningham, A.; Acosta, A.; Aitken, A.; Tejani, A.; Totz, J.; Wang, Z.; et al. Photo-realistic single image super-resolution using a generative adversarial network. In Proceedings of the IEEE Conference on Computer Vision and Pattern Recognition, Honolulu, HI, USA, 21–26 July 2017; pp. 4681–4690. [Google Scholar]
  13. Geiger, A.; Lenz, P.; Urtasun, R. Are we ready for autonomous driving? The KITTI vision benchmark suite. In Proceedings of the 2012 IEEE Conference on Computer Vision and Pattern Recognition, Providence, RI, USA, 16–21 June 2012; pp. 3354–3361. [Google Scholar]
  14. Engelcke, M.; Rao, D.; Wang, D.Z.; Tong, C.H.; Posner, I. Vote3deep: Fast object detection in 3d point clouds using efficient convolutional neural networks. In Proceedings of the 2017 IEEE International Conference on Robotics and Automation (ICRA), Singapore, 29 May–3 June 2017; pp. 1355–1361. [Google Scholar]
  15. Li, B. 3d fully convolutional network for vehicle detection in point cloud. In Proceedings of the 2017 IEEE/RSJ International Conference on Intelligent Robots and Systems (IROS), Vancouver, BC, Canada, 24–28 September 2017; pp. 1513–1518. [Google Scholar]
  16. Zhou, Y.; Tuzel, O. Voxelnet: End-to-end learning for point cloud based 3d object detection. In Proceedings of the IEEE Conference on Computer Vision and Pattern Recognition, Salt Lake City, UT, USA, 18–23 June 2018; pp. 4490–4499. [Google Scholar]
  17. Yan, Y.; Mao, Y.; Li, B. SECOND: Sparsely Embedded Convolutional Detection. Sensors 2018, 18, 3337. [Google Scholar] [CrossRef] [PubMed] [Green Version]
  18. Graham, B.; van der Maaten, L. Submanifold sparse convolutional networks. arXiv 2017, arXiv:1706.01307. [Google Scholar]
  19. Wang, Z.; Fu, H.; Wang, L.; Xiao, L.; Dai, B. SCNet: Subdivision coding network for object detection based on 3D point cloud. IEEE Access 2019, 7, 120449–120462. [Google Scholar] [CrossRef]
  20. Chen, X.; Ma, H.; Wan, J.; Li, B.; Xia, T. Multi-view 3D Object Detection Network for Autonomous Driving. In Proceedings of the 2017 IEEE Conference on Computer Vision and Pattern Recognition (CVPR), Honolulu, HI, USA, 21–26 July 2017; pp. 6526–6534. [Google Scholar]
  21. Ku, J.; Mozifian, M.; Lee, J.; Harakeh, A.; Waslander, S.L. Joint 3d proposal generation and object detection from view aggregation. In Proceedings of the 2018 IEEE/RSJ International Conference on Intelligent Robots and Systems (IROS), Madrid, Spain, 1–5 October 2018; pp. 1–8. [Google Scholar]
  22. Lang, A.H.; Vora, S.; Caesar, H.; Zhou, L.; Yang, J.; Beijbom, O. PointPillars: Fast Encoders for Object Detection From Point Clouds. In Proceedings of the 2019 IEEE/CVF Conference on Computer Vision and Pattern Recognition (CVPR), Long Beach, CA, USA, 15–20 June 2019; pp. 12689–12697. [Google Scholar]
  23. Yang, B.; Luo, W.; Urtasun, R. PIXOR: Real-Time 3D Object Detection From Point Clouds. In Proceedings of the IEEE Conference on Computer Vision and Pattern Recognition, Salt Lake City, UT, USA, 18–23 June 2018; pp. 7652–7660. [Google Scholar]
  24. Charles, R.Q.; Su, H.; Kaichun, M.; Guibas, L.J. PointNet: Deep Learning on Point Sets for 3D Classification and Segmentation. In Proceedings of the 2017 IEEE Conference on Computer Vision and Pattern Recognition (CVPR), Honolulu, HI, USA, 21–26 July 2017; pp. 77–85. [Google Scholar]
  25. Qi, C.R.; Yi, L.; Su, H.; Guibas, L.J. Pointnet++: Deep hierarchical feature learning on point sets in a metric space. arXiv 2017, arXiv:1706.02413. [Google Scholar]
  26. Qi, C.R.; Liu, W.; Wu, C.; Su, H.; Guibas, L.J. Frustum pointnets for 3d object detection from rgb-d data. In Proceedings of the IEEE Conference on Computer Vision and Pattern Recognition, Salt Lake City, UT, USA, 18–23 June 2018; pp. 918–927. [Google Scholar]
  27. Yang, Z.; Sun, Y.; Liu, S.; Shen, X.; Jia, J. Std: Sparse-to-dense 3d object detector for point cloud. In Proceedings of the IEEE/CVF International Conference on Computer Vision, Seoul, Korea, 27 October–2 November 2019; pp. 1951–1960. [Google Scholar]
  28. Chen, Y.; Li, W.; Sakaridis, C.; Dai, D.; Van Gool, L. Domain adaptive faster r-cnn for object detection in the wild. In Proceedings of the IEEE conference on computer vision and pattern recognition, Salt Lake City, UT, USA, 18–23 June 2018; pp. 3339–3348. [Google Scholar]
  29. Ganin, Y.; Lempitsky, V. Unsupervised domain adaptation by backpropagation. In Proceedings of the International Conference on Machine Learning, PMLR, Lille, France, 7–9 July 2015; pp. 1180–1189. [Google Scholar]
  30. Saito, K.; Ushiku, Y.; Harada, T.; Saenko, K. Strong–weak distribution alignment for adaptive object detection. In Proceedings of the IEEE Conference on Computer Vision and Pattern Recognition, Long Beach, CA, USA, 15–20 June 2019; pp. 6956–6965. [Google Scholar]
  31. Rist, C.B.; Enzweiler, M.; Gavrila, D.M. Cross-sensor deep domain adaptation for LiDAR detection and segmentation. In Proceedings of the 2019 IEEE Intelligent Vehicles Symposium (IV), Paris, France, 9–12 June 2019; pp. 1535–1542. [Google Scholar]
  32. Wu, B.; Zhou, X.; Zhao, S.; Yue, X.; Keutzer, K. Squeezesegv2: Improved model structure and unsupervised domain adaptation for road-object segmentation from a lidar point cloud. In Proceedings of the 2019 International Conference on Robotics and Automation (ICRA), Montreal, QC, Canada, 20–24 May 2019; pp. 4376–4382. [Google Scholar]
  33. Lin, T.Y.; Goyal, P.; Girshick, R.; He, K.; Dollár, P. Focal loss for dense object detection. IEEE Trans. Pattern Anal. Mach. Intell. 2017, 42, 318–327. [Google Scholar] [CrossRef] [PubMed] [Green Version]
  34. Woo, S.; Park, J.; Lee, J.Y.; Kweon, I.S. Cbam: Convolutional block attention module. In Proceedings of the Proceedings of the European conference on computer vision (ECCV), Munich, Germany, 8–14 September 2018; pp. 3–19. [Google Scholar]
  35. Chen, X.; Kundu, K.; Zhu, Y.; Berneshawi, A.G.; Ma, H.; Fidler, S.; Urtasun, R. 3d object proposals for accurate object class detection. In Proceedings of the Advances in Neural Information Processing Systems, Montreal, QC, Canada, 7–12 December 2015; pp. 424–432. [Google Scholar]
Figure 1. The distribution of object point clouds with different distance. As the distance increases, the point cloud distribution becomes sparse. (af) respectively present the point cloud distribution of the car from 10 m to 60 m.
Electronics 10 01205 g001
Figure 2. An overview of our strong–weak feature alignment network. We train a complete object feature extractor to get the complete feature representation, and the incomplete object feature generator is encouraged to generate more robust features by aligning with complete features. We perform adaptation from two aspects: the strong feature alignment and the weak feature alignment. Both are trained to align the object-wise features. The strong feature alignment directly minimizes object feature differences and the weak feature alignment indirectly align object feature with classifier and regressor.
Electronics 10 01205 g002
Figure 3. The architecture of incomplete object feature generator. The feature maps are generated by the convolution operations. The feature maps of different resolutions are up-sampled to the same size and then concatenated. A channel attention module and a spatial attention module are added to enhance the generator’s ability to capture more context information from feature maps of different resolutions.
Electronics 10 01205 g003
Figure 4. Position errors caused by the resolution. The objects with the same observation patterns have different regression targets ( δ x , δ y ) corresponding to the anchors.
Electronics 10 01205 g004
Figure 5. The qualitative results on the KITTI validation. For better visualization, we only present the results of far-range object detection. The green bounding box is the annotations. The yellow bounding box represents the results of the baseline, and the red bounding box represents the results of our method. The first row shows the results of our method. The second row shows the results of baseline method, and the third row shows the RGB images. (a) shows that our method can detect unlabeled objects, and (b) shows that our method can predict more accurate directions. (c,d) show that our method improves the recall rate compared with the baseline method.
Electronics 10 01205 g005
Figure 6. Histograms for the distance of cars.
Electronics 10 01205 g006
Table 1. The object detection performance on different training datasets and validation datasets.
TrainingValidationAP-BEVAP-3D
EasyModerateHardEasyModerateHard
CompleteComplete89.9989.9689.0487.6887.2379.08
CompleteIncomplete048.7348.01029.4129.34
IncompleteIncomplete1.1462.9560.291.0140.4037.06
Table 2. The object detection performance of our method. S denotes the strong feature alignment and W denotes the weak feature alignment.
MethodsAP-BEVAP-3D
EasyModerateHardEasyModerateHard
Baseline1.1462.9560.291.0140.4037.06
IOFG1.8263.3061.141.5240.4138.74
IOFG (S)9.0963.3161.699.0945.3340.65
IOFG (W)9.0963.4461.729.0945.9041.21
IOFG (S + W)9.0964.3462.669.0946.4642.06
Table 3. Performance for Different hyper-parameters of guiding feature.
MethodsAP-BEVAP-3D
EasyModerateHardEasyModerateHard
K = 19.0963.5761.429.0944.3539.67
K = 59.0964.3462.669.0946.4642.06
K = 109.0962.7561.179.0945.6740.93
K = 209.0963.1261.429.0943.8739.73
Table 4. The comparison of different feature alignment method at object-wise level.
MethodsAP-BEVAP-3D
EasyModerateHardEasyModerateHard
Baseline1.1462.9560.291.0140.4037.06
RANGE [9]9.0963.5161.979.0944.5639.75
Ours9.0964.3462.669.0946.4642.06
Table 5. Performance improvement at different distances on A P 3 d .
MethodsBaselineOurs
EasyModerateHardEasyModerateHard
35–40 m0.3748.5745.139.0956.8151.12
40–45 m0.0039.1533.600.0040.5738.48
45–50 m0.0021.9321.100.0032.0227.84
50–55 m0.0016.1113.860.0016.4514.89
Table 6. Performance of different basic networks.
MethodsAP-BEVAP-3D
EasyModerateHardEasyModerateHard
SCNET (w/o)1.1462.9560.291.0140.4037.06
SCNET (w)9.0964.3462.669.0946.4642.06
MV3D (w/o)9.0958.9356.769.0935.6634.04
MV3D (w)9.0962.2160.149.0941.8040.41
PointPillars (w/o)4.5561.2059.250.0039.0837.75
pointPillars (w)9.0963.8262.439.0945.9641.14
Publisher’s Note: MDPI stays neutral with regard to jurisdictional claims in published maps and institutional affiliations.

