Article

Integration of Impacts on Water, Air, Land, and Cost towards Sustainable Petroleum Oil Production in Alberta, Canada

University of Alberta, 116 St & 85 Ave, Edmonton, AB T6G 2R3, Canada
Resources 2020, 9(6), 62; https://doi.org/10.3390/resources9060062
Submission received: 4 May 2020 / Revised: 26 May 2020 / Accepted: 27 May 2020 / Published: 28 May 2020

Abstract

:
This paper intends to develop quantitative indicators for comparative sustainability assessment of petroleum oil pathways in the province of Alberta, Canada. Eighteen pathways of oil production were developed in this study, and the sustainability indicators were assigned for each pathway to cover greenhouse gas (GHG) emissions, water demand, and land use in addition to the cost of supply. The developed sustainability indicators were aligned per functional unit and covered the full life cycle of petroleum oil production. The developed GHG emissions, cost of supply, and land use indicators are found in the range 17.50–226.20 kg of CO2 eq./bbl, 12.28–53.53 USD/bbl, and 0.06–0.178 m2/bbl, respectively. Four scenarios were comparatively conducted and assessed against the business-as-usual scenario within the period horizon 2009–2030. The cost-effective scenario was optimized with the objective function to minimize the cost of supply based on the constraints derived from the business-as-usual scenario. Sustainable scenarios were conducted with the lowest possible impacts on natural resources, GHG emissions, and the cost of supply accompanied by specific assumptions for petroleum oil production from different pathways in Alberta. The average annual savings on water demand and land area were found to be 67 and 30%, respectively, due to the shifting of upgrader feedstock from surface mining to the in-situ steam-assisted gravity drainage (SAGD) pathway. The corresponding increases due to this shifting in upgrader feedstock were found to be 40 and 3% in GHG emissions and cost of supply, respectively.

1. Introduction

The production of petroleum oil in the province of Alberta, Canada, relies on both conventional and unconventional resources. Alberta is a hub of petroleum oil production that has income benefits to the province and is constrained by considerable environmental challenges. The expectation for oil sands production in Alberta is that it will account for 75% of the total Canadian crude oil production by the end of 2035; 95% of the conventional oil produced during 2018 in Western Canada was from Alberta and Saskatchewan provinces [1]. Alberta produced 2.9 million bbl/day from oil sands resources in 2018, and the contribution in the total revenues in the same year was 1.13 billion Canadian dollars (CAD) and 3.18 billion CAD from conventional oil and oil sands, respectively [2]. Concern is profound among the public, policymakers, and researchers regarding the environmental and economic impacts of petroleum oil extraction and processing in Alberta. Environmental impacts from petroleum oil production in Alberta on air are represented mainly by greenhouse gas (GHG) emissions [3,4,5,6,7], on water posed by qualitative and quantitative amounts of water use [8,9,10,11], and on land use described by the occupation and disturbance [12].
Alberta needs to integrate pillars of environmental, economic, and social impacts of petroleum oil production for more sustainable extraction and utilization of natural resources. Climate, land, energy, and water (CLEW) were integrated in previous studies for a holistic assessment approach towards sustainability [13,14]. Sustainability indicators and life cycle assessment (LCA) could be appropriate tools to evaluate the comparative environmental impacts of different petroleum oil production pathways. Sustainability indicators can harmonize the environmental impacts through standard metrics per functional unit of oil production, and LCA can handle all the inputs to petroleum oil production with the concept of cradle-to-grave covering the different unit operations. Different technologies used for petroleum oil production over the complete life cycle have different impacts on natural resources, GHG emissions, and the cost of supply. For example, oil sands can be extracted through surface mining or in-situ recovery [15], and each technology has different environmental impacts and costs of supply due to the variation in the techniques, energy intensity, and equipment used.
There is a gap in the earlier studies conducted for sustainable production of petroleum oil represented by the lack of simultaneous integration of impacts on water, air, land, and cost of supply. Jordaan [16] highlighted the gap in the implications of oil sands activities on water and land, and one of the challenges is to quantify these impacts. Pembina Institute [15] quantified the impacts of oil sands on water, air, and land without integration with the cost of supply, and the in-situ pathways were presented with one set of indicators, although involving different technologies and unit operations. The novelty of this paper is not only that it develops multidisciplinary sustainability indicators for the comparative assessment of different pathways but has been extended further to give an exact amount of petroleum oil production from each pathway. The optimum zone is satisfied and determined by the constraints of natural resources, GHG emissions, and the cost of supply to face a specific level of demand.
The key objectives of this paper are to:
  • Develop sustainability indicators for petroleum oil production in Alberta to facilitate comparative assessment between the different pathways.
  • Identify the pathways for the most cost-effective scenario as a benchmark for comparison with the business-as-usual and other sustainable scenarios.
  • Determine the most sustainable scenarios under different conditions of petroleum oil production in Alberta and to satisfy the lowest impacts on natural resources, GHG emissions, and cost of supply, and;
  • Investigate the effects of changing feedstock pathways to upgraders and refineries in Alberta on the sustainability of these unit operations.

2. Methods

Petroleum oil production in Alberta is structured in this paper into eighteen pathways based on the earlier developed indicators for water demand, covering water consumption and water withdrawals coefficients [17,18]. Pathways are selected based on the unit operations of unconventional and conventional oil production in Alberta. The extraction of oil sands as unconventional resources in Alberta is through surface mining and in-situ recovery. In-situ recovery is done through the three pathways of steam-assisted gravity drainage (SAGD), cyclic steam stimulation (CSS), and primary recovery. Upgrading of oil sands and refining are added to the unit operations determining the eighteen pathways in this study. This earlier frame of pathways is in line with the newly added indicators to integrate water, air, land, and cost of supply (COS) for better sustainability decisions. The sustainability indicators were gathered from the literature and developed per barrel (bbl) of oil produced after harmonizing for each pathway. Water demand indicators are composed of water consumption, and water withdrawals expressed in cubic meters per barrel (m3/bbl), while a quantitative indicator of impacts on air is expressed as the amount of equivalent CO2 emitted per functional unit (kg of CO2 eq./bbl). The area of land indicator is presented per barrel of oil produced (m2/bbl), and the cost of supply (USD/bbl) is added in this paper as a useful economic indicator for the sustainability assessment.
The business-as-usual scenario was developed based on the existing and forecasted petroleum oil production in Alberta to cover the period 2009–2030. An optimization model used for the sustainability of power generation in Alberta was modified in this paper to address the pathways of petroleum oil production in the same province. Further details of the optimization model are presented in an earlier study conducted by the author [19].
Four scenarios were run in the current research through the optimization model to evaluate the impact of different unit operations on the natural resources used (water and land), GHG emissions, and COS. The cost-effective scenario was conducted with the main focus on the COS to optimize the business-as-usual scenario. Three sustainable scenarios were conducted based on the use of minimum natural resources and the lowest possible GHG emissions in Alberta with three different assumptions for the combination of petroleum oil production pathways. The sensitivity analysis conducted to investigate the impacts on the natural resources, GHG emissions, and COS in Alberta was based on the assumption that the extraction recovery of the feedstocks to upgraders and refineries was shifted from the surface mining pathway to the in-situ-SAGD pathway. This assumption is in line with the fact that more than 80% of the bitumen reserves in Alberta are recoverable by in-situ operations [12].

3. Input Data and Assumptions

3.1. Sustainability Indicators

The sustainability indicators were developed to cover the complete life cycle of extraction, upgrading, and refining unit operations, as shown in Table 1. The GHG emissions indicators for petroleum oil production in Alberta were based on a previous report and compared the GHG emissions from oil sands and European oil supply pathways [20]. The developed GHG emissions indicators were verified from the literature [21,22,23].
Land use indicators were adapted from a study which compared GHG emissions related to direct land use from conventional oil and oil sands production in California and Alberta, respectively [24].
The cost of supply was derived from the literature covering the unit operations of petroleum oil production pathways in Alberta [25,26,27,28,29]. All costs were updated to the USD value of 2014. The cost of supply shown in Table 1 includes operating cost and capital cost for each unit operation at the plant gate.

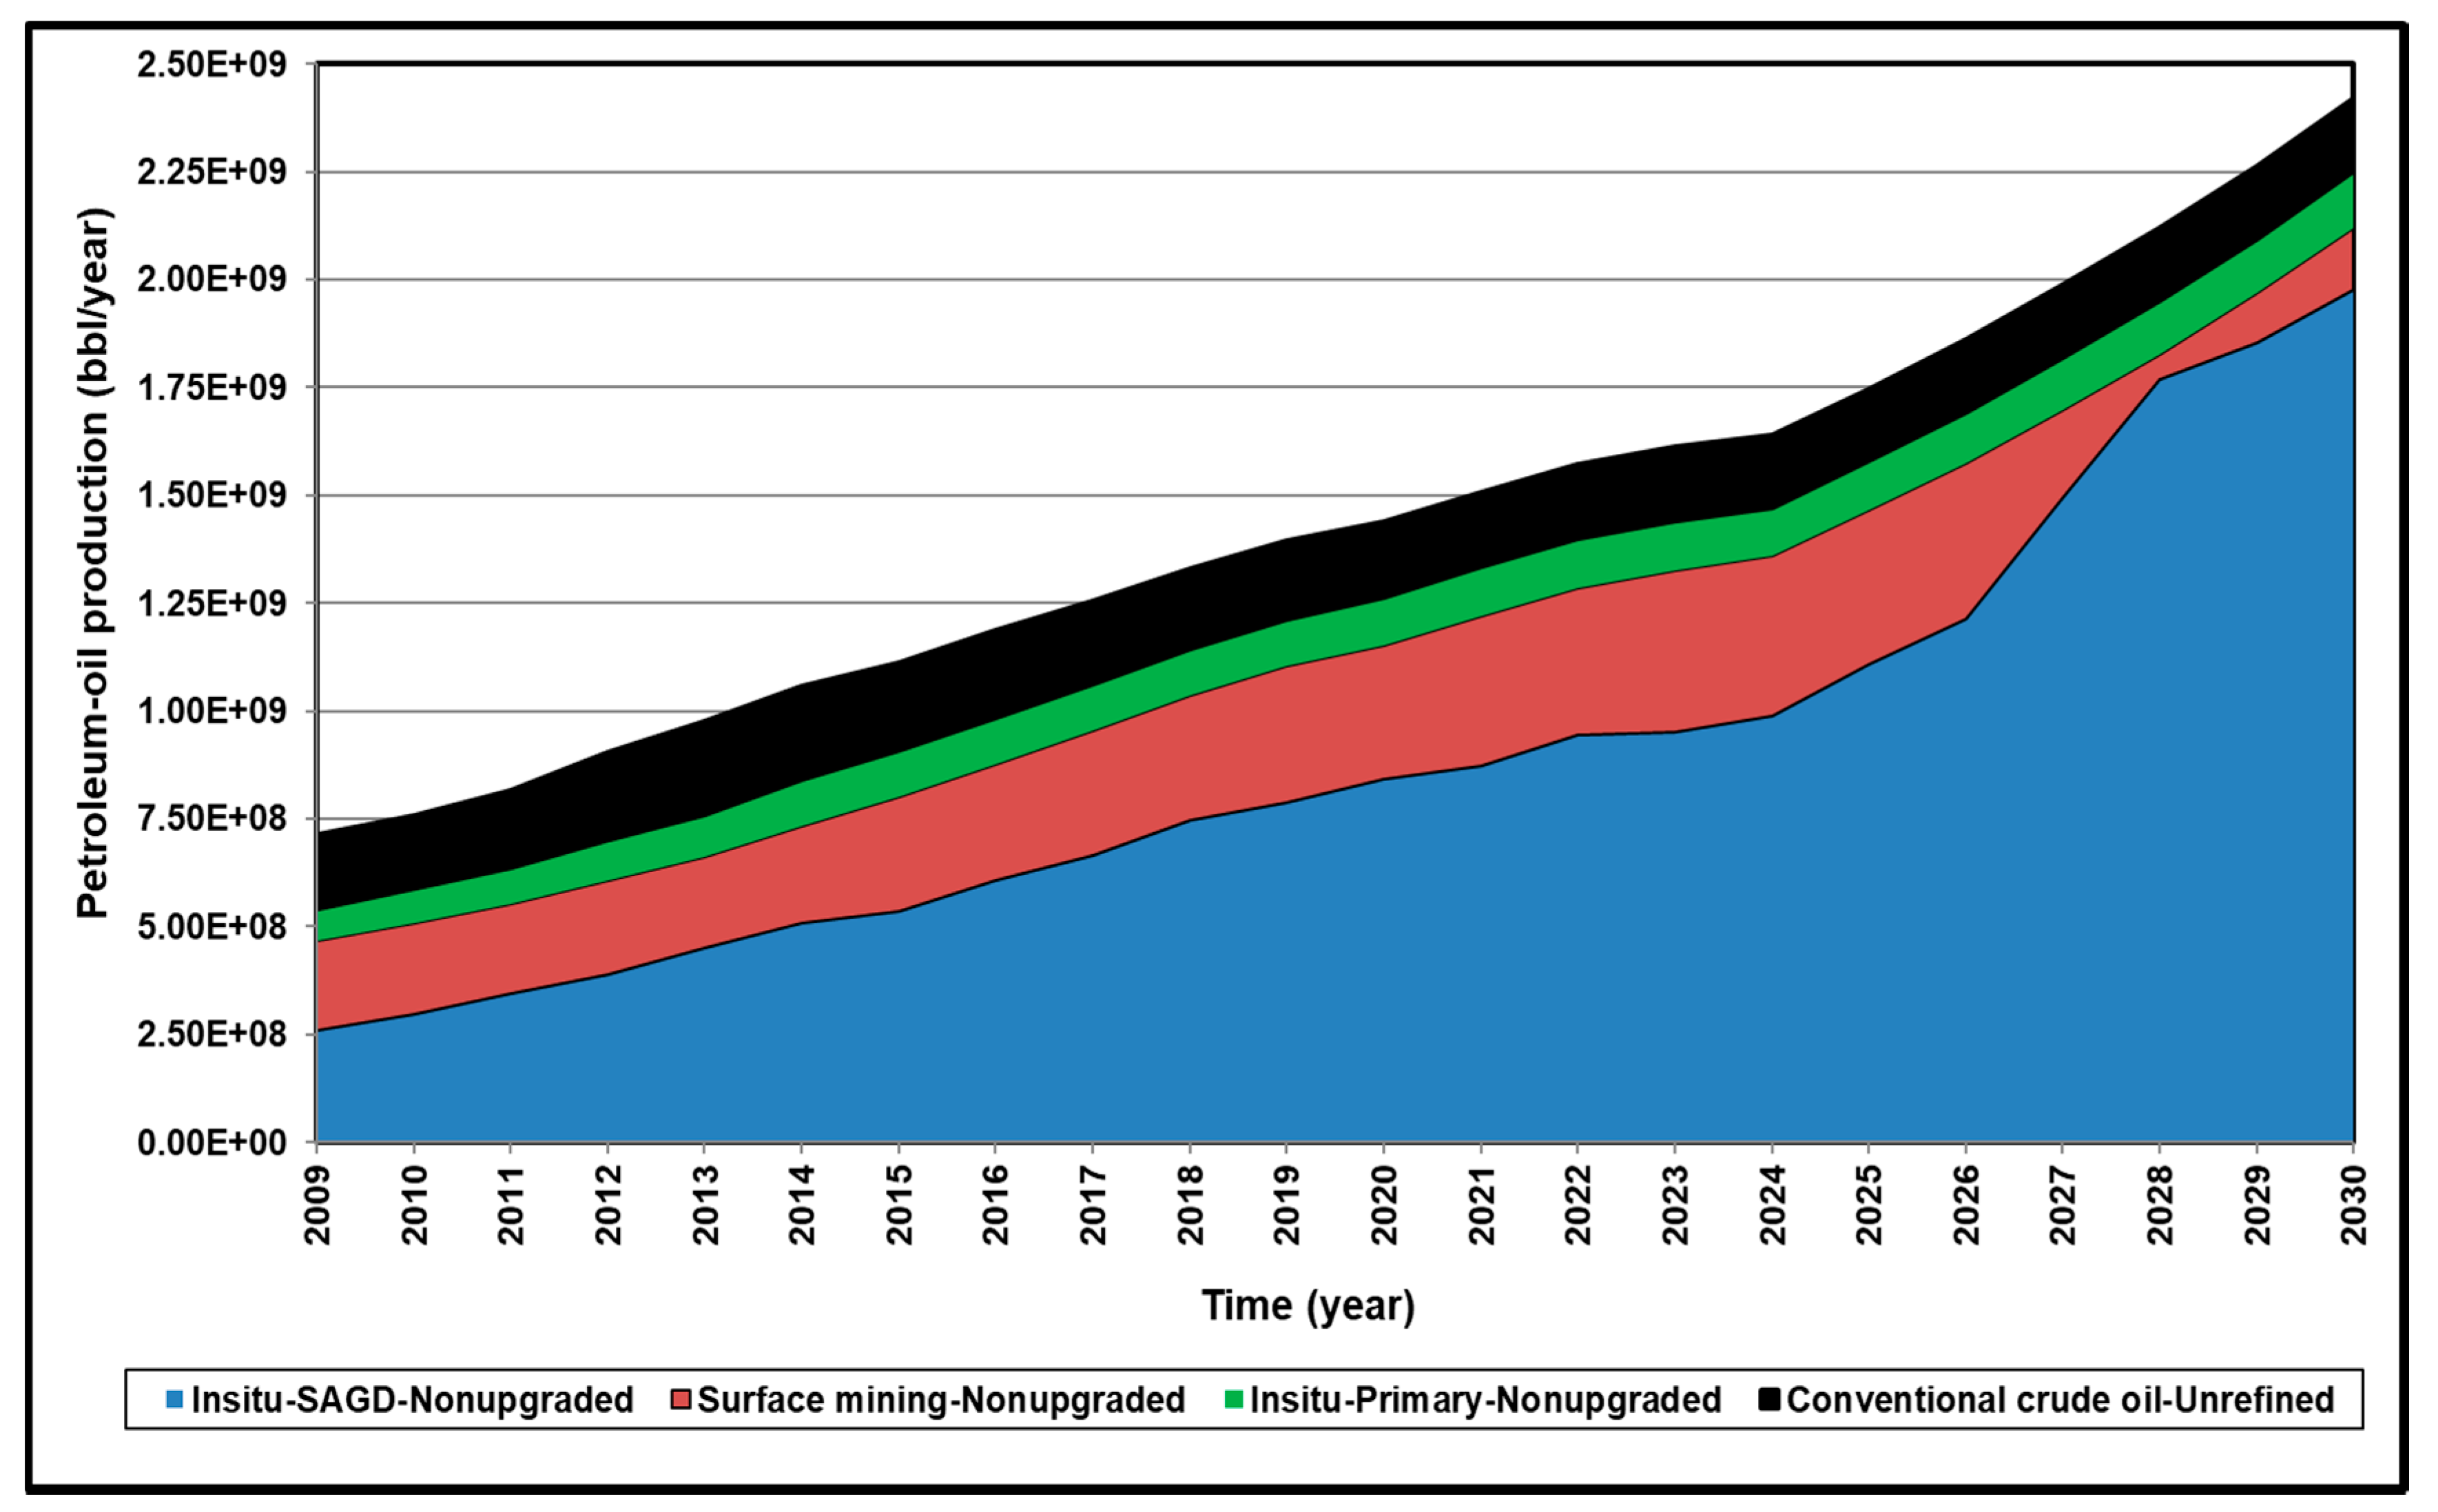
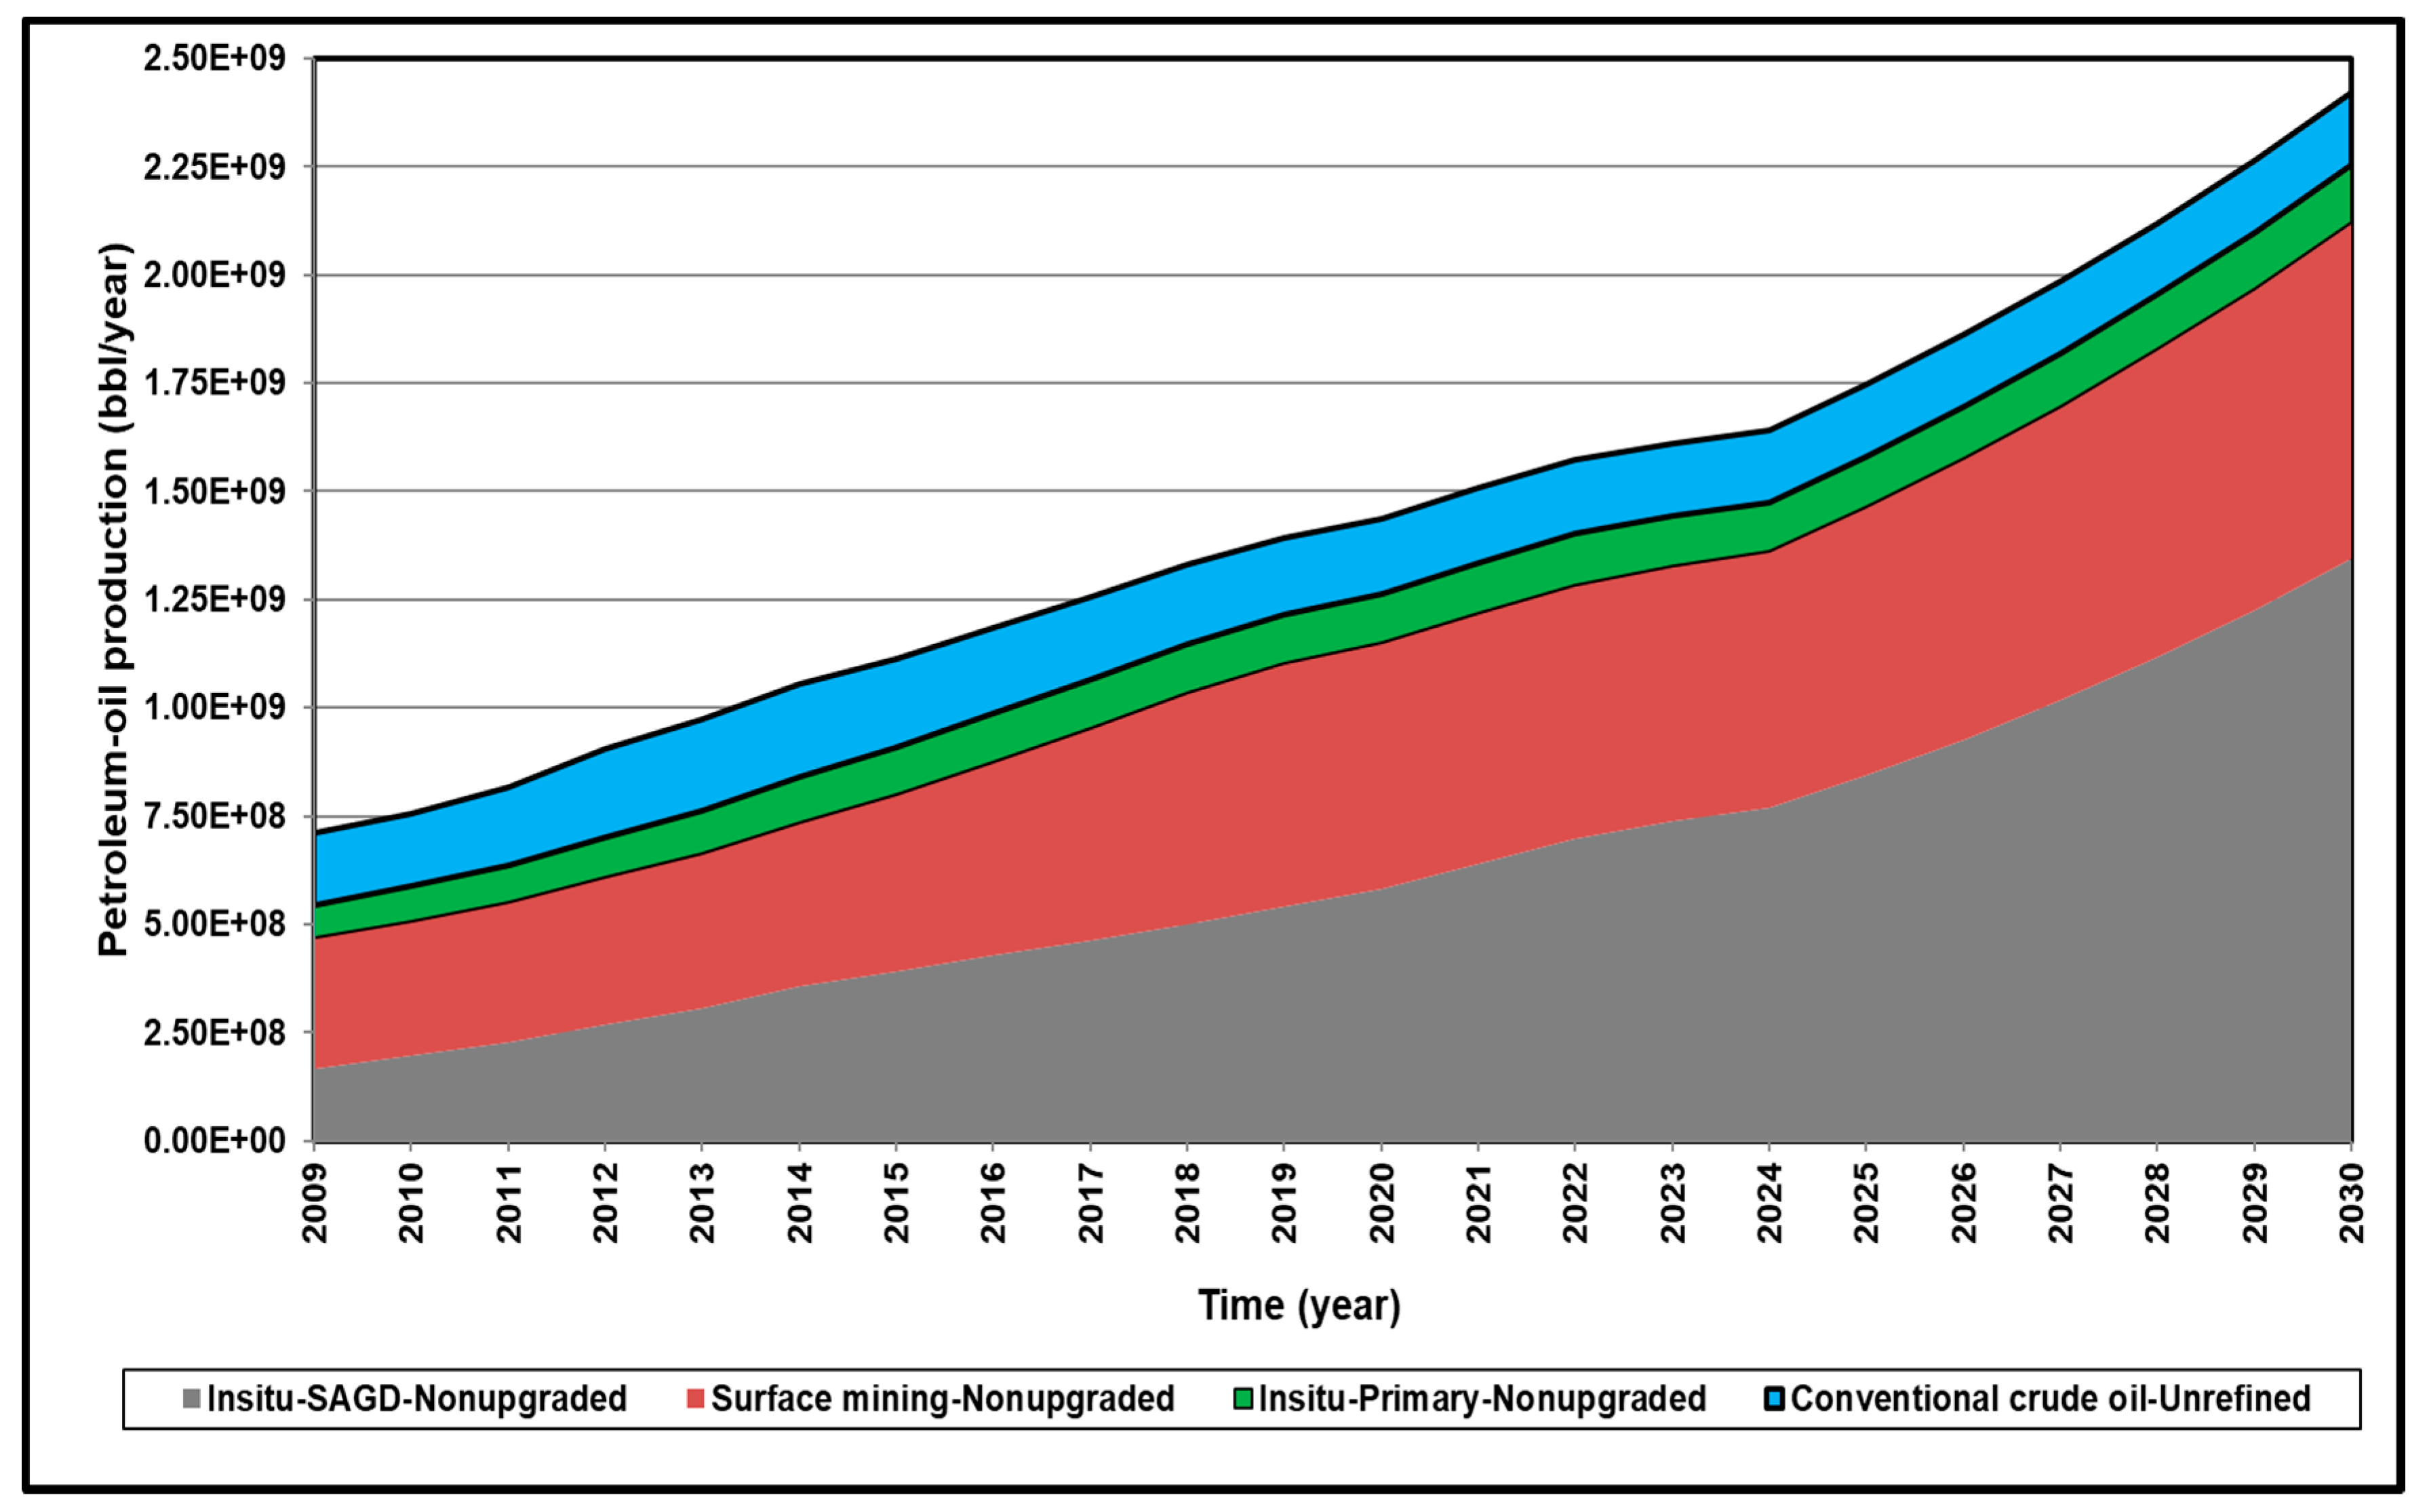
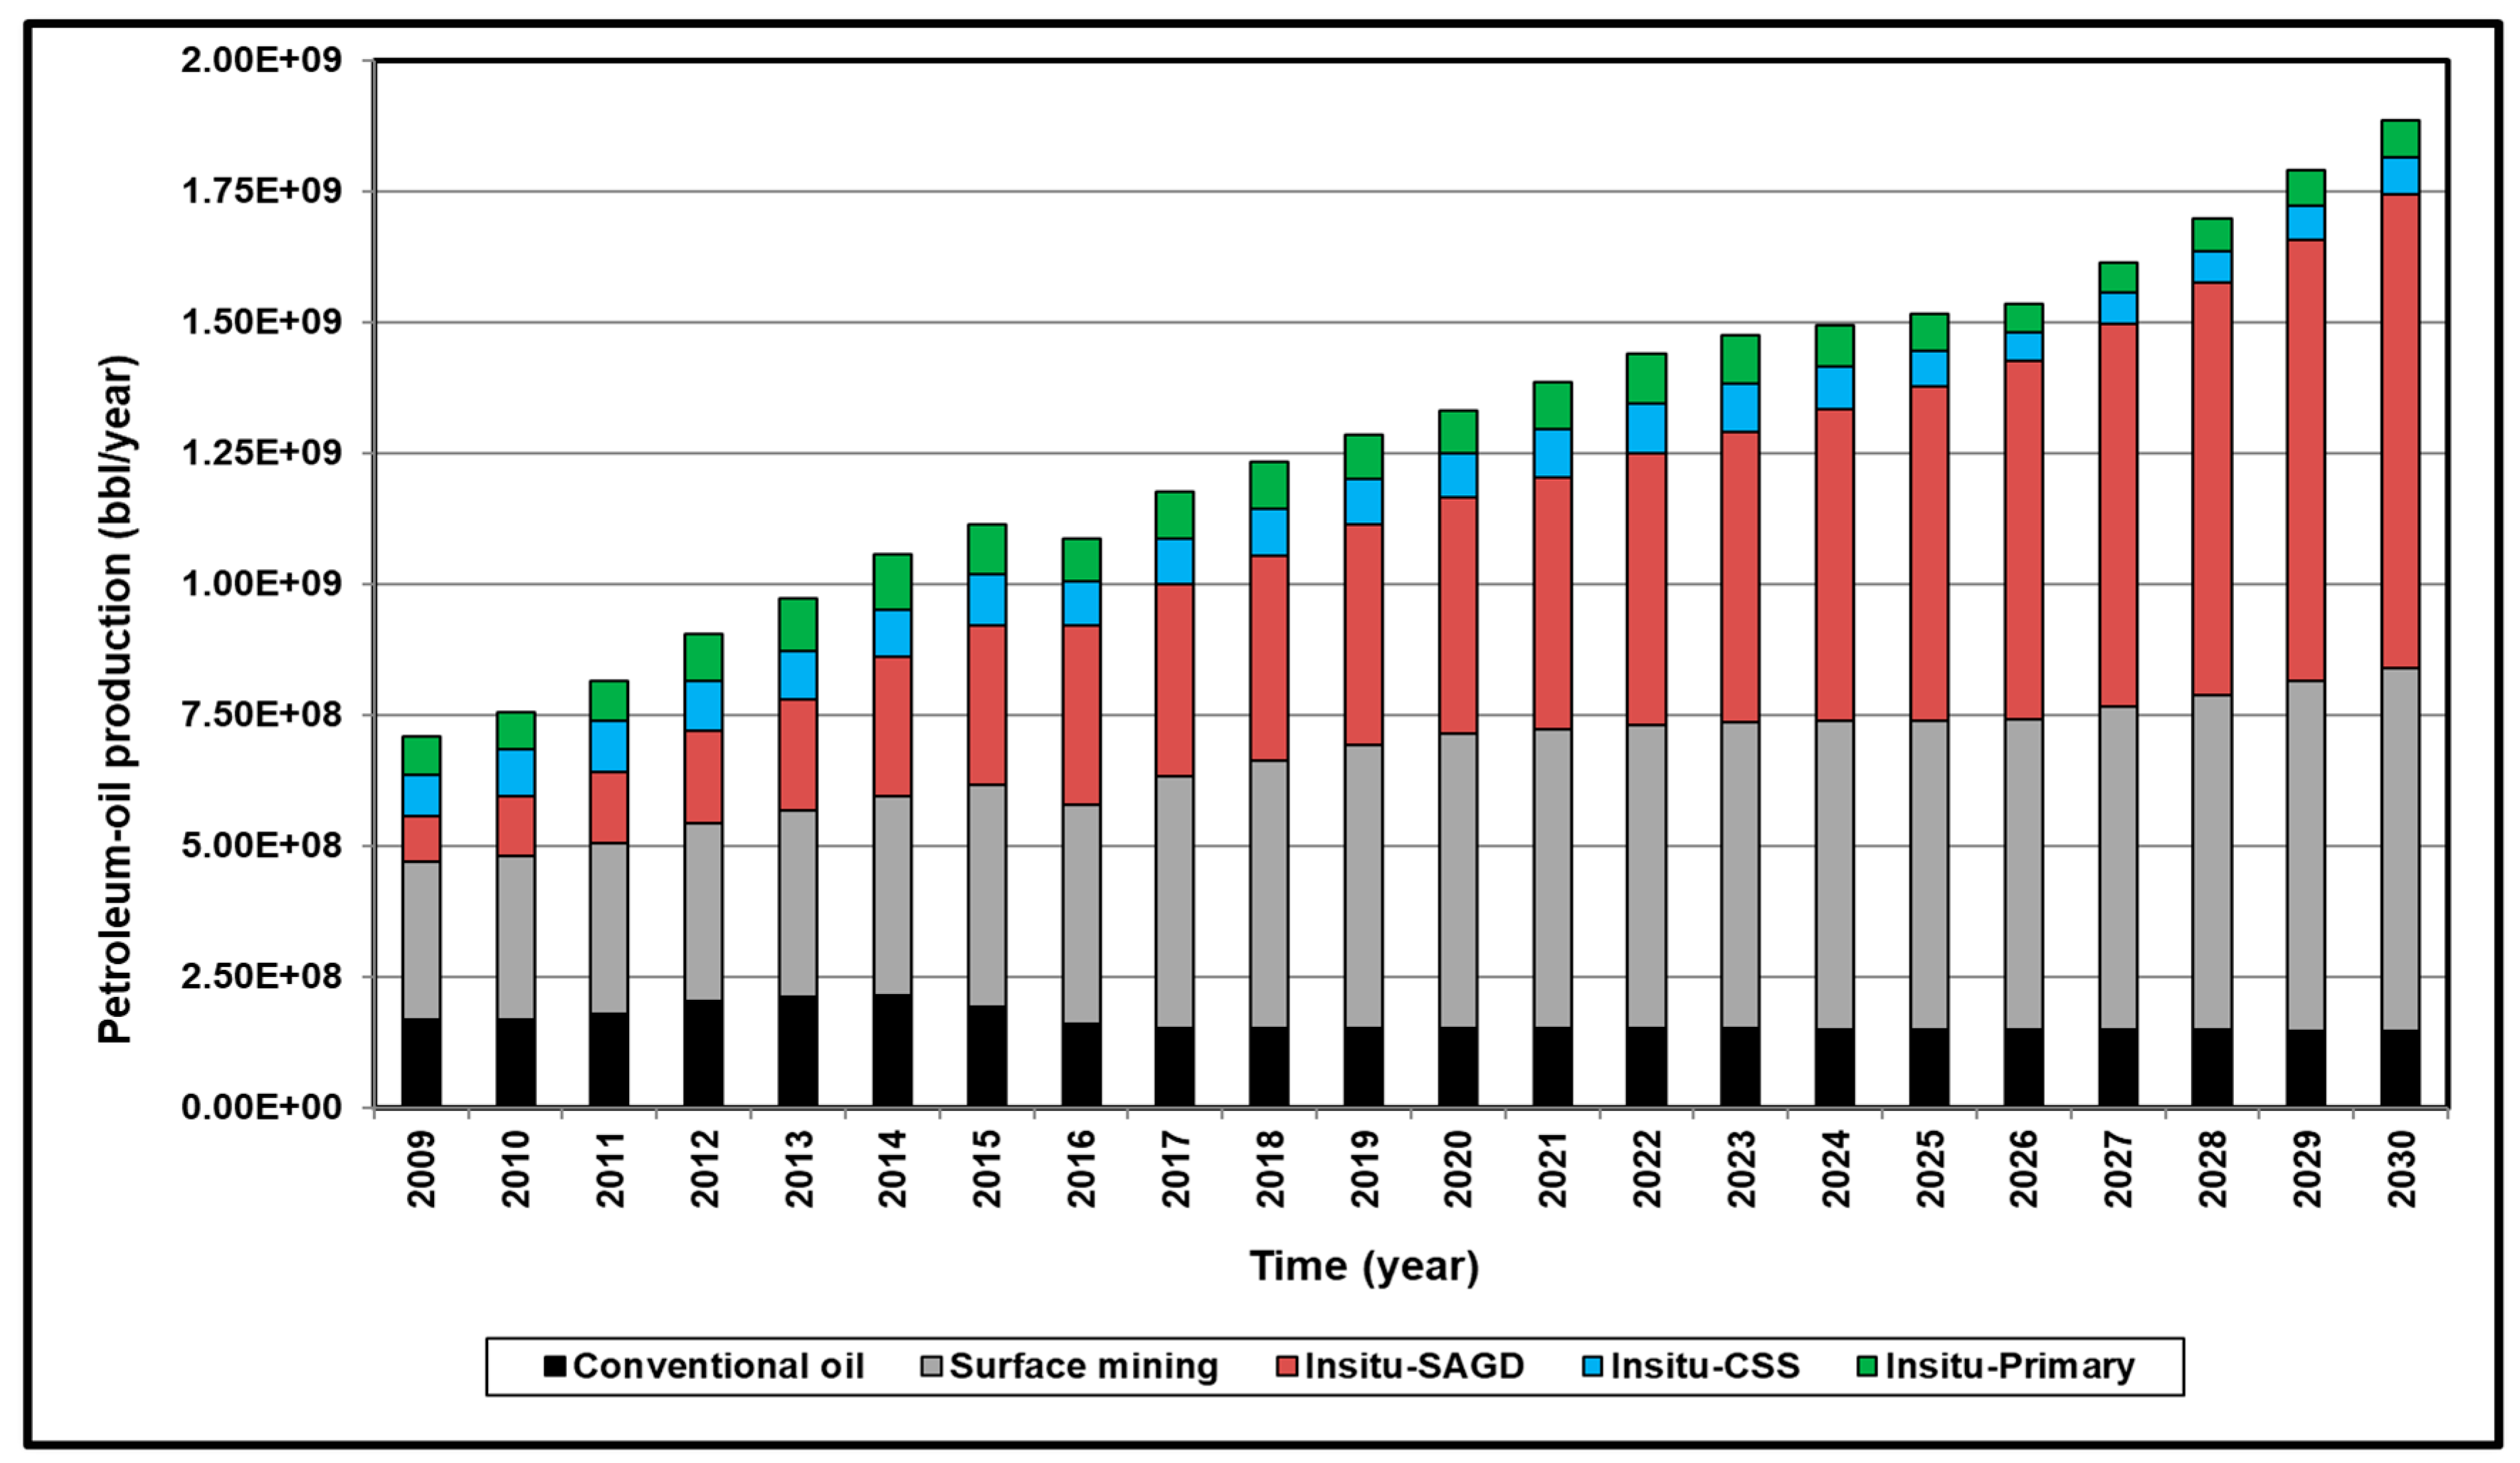
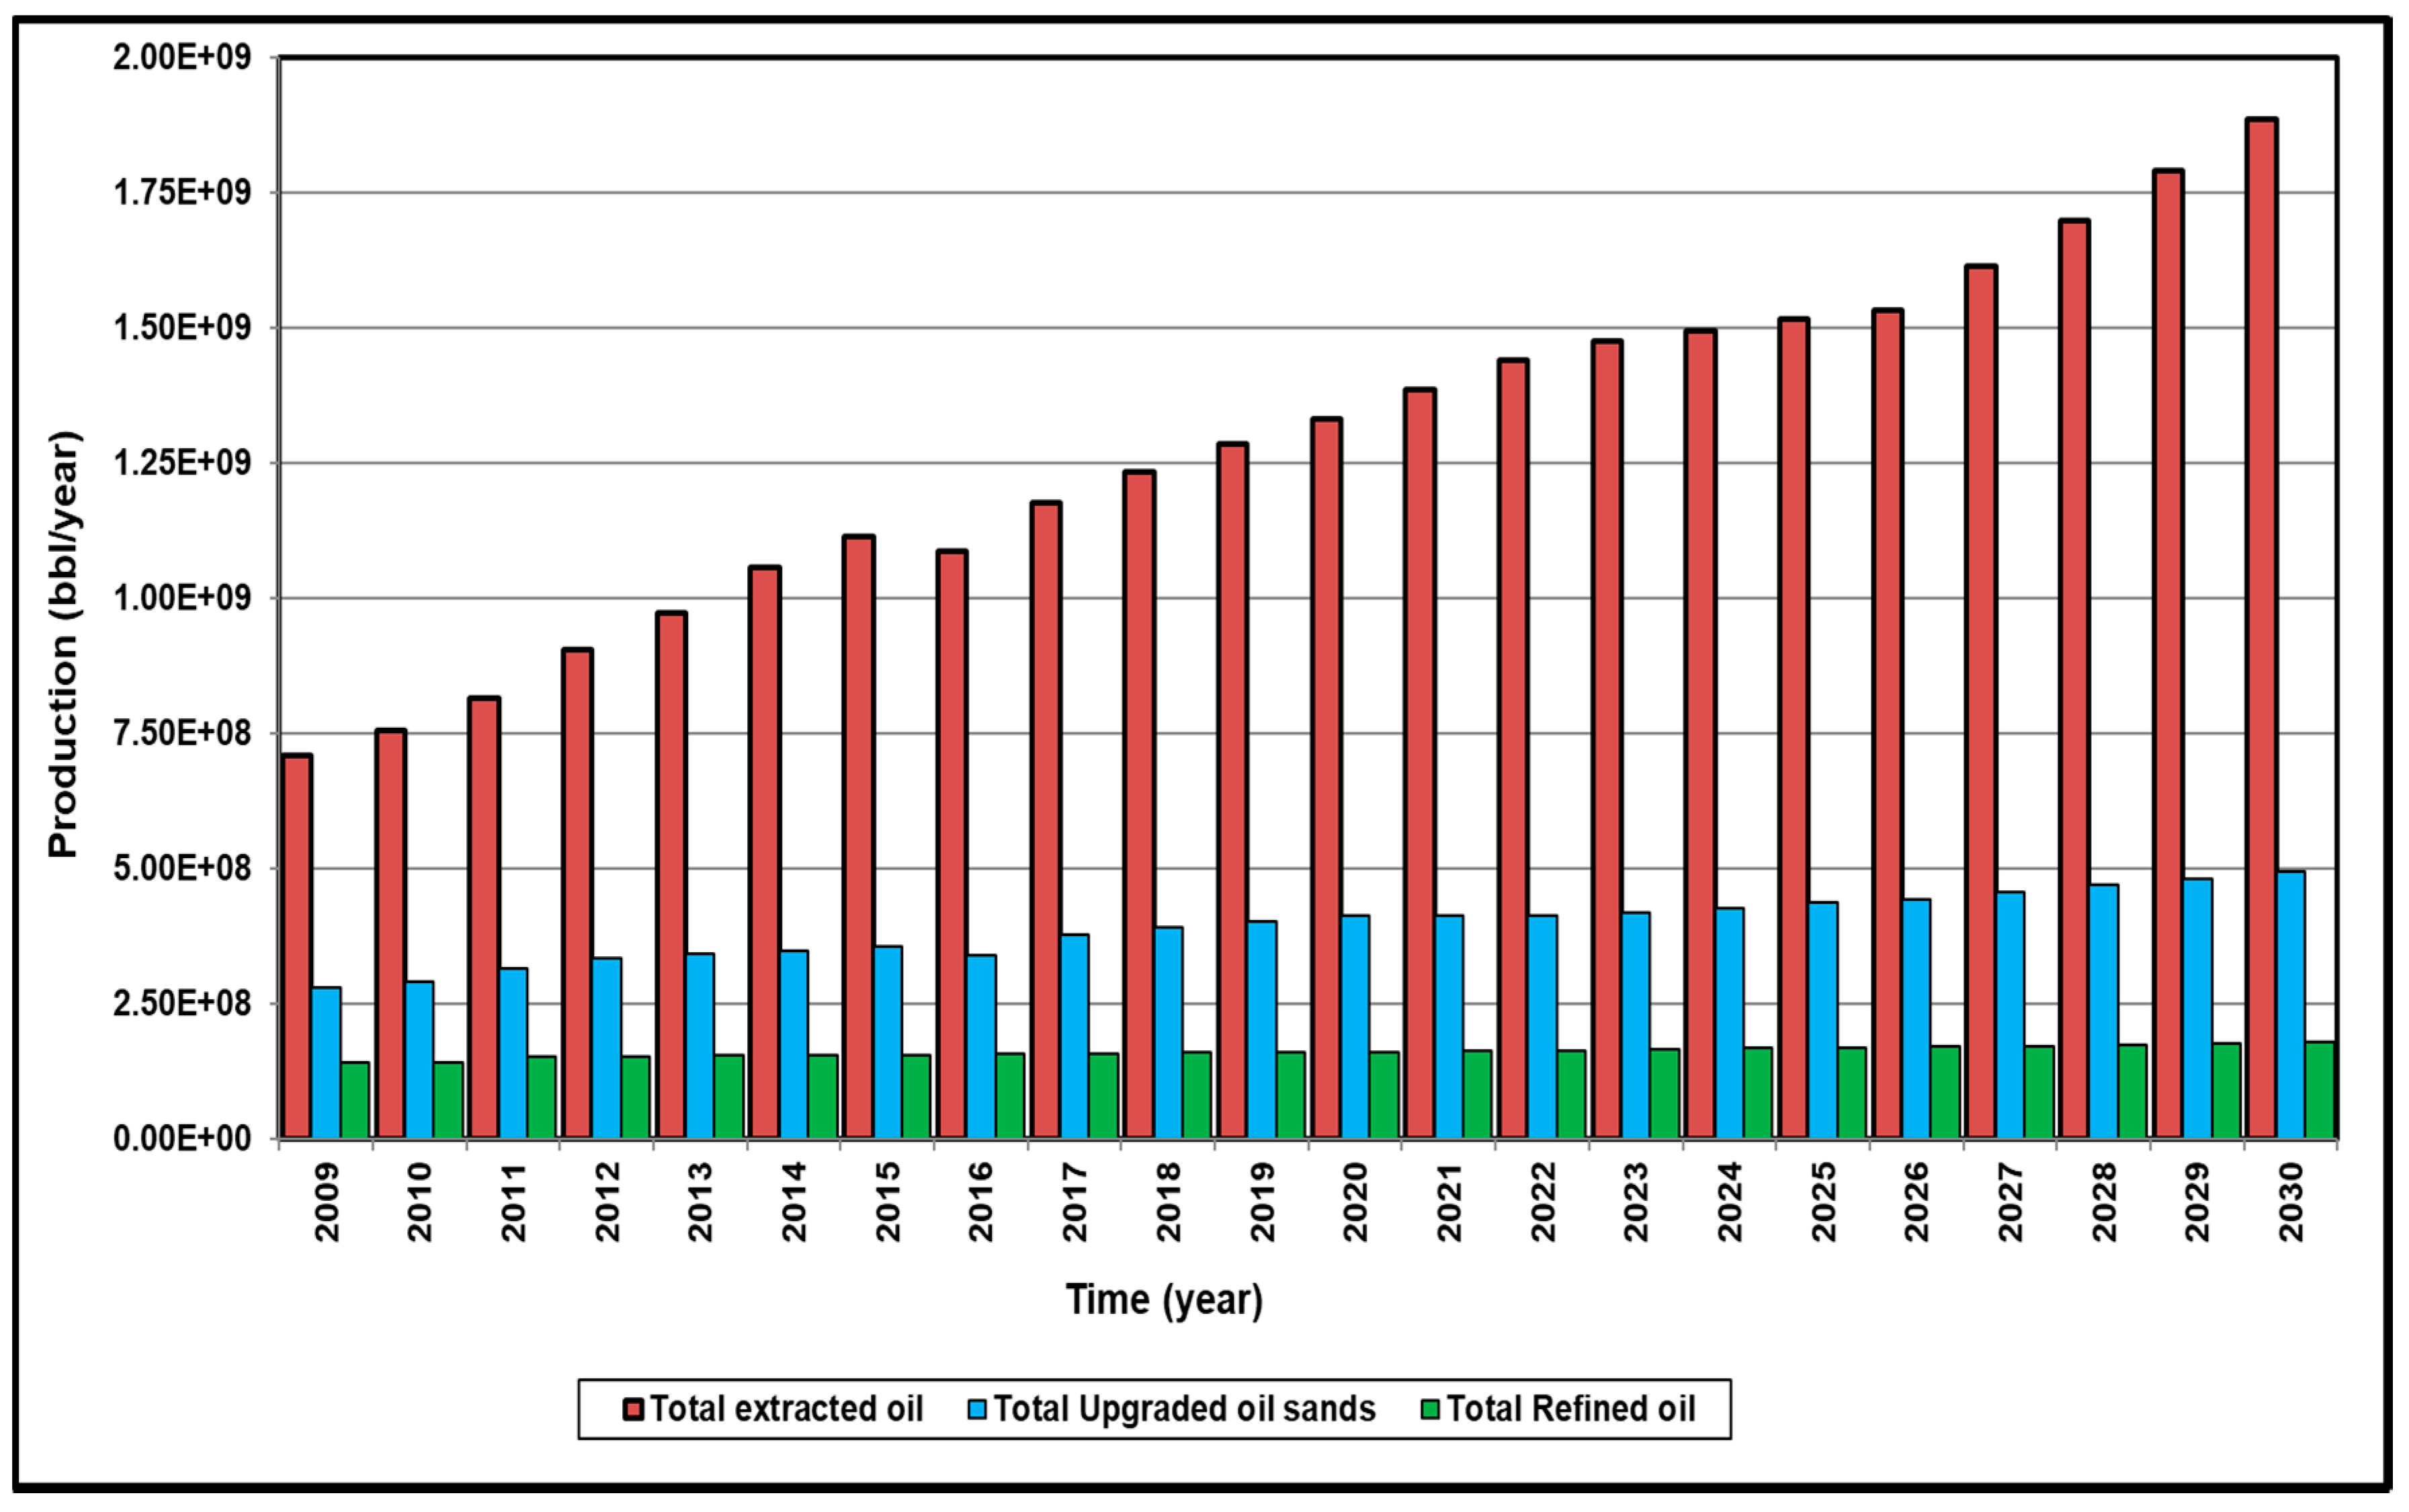
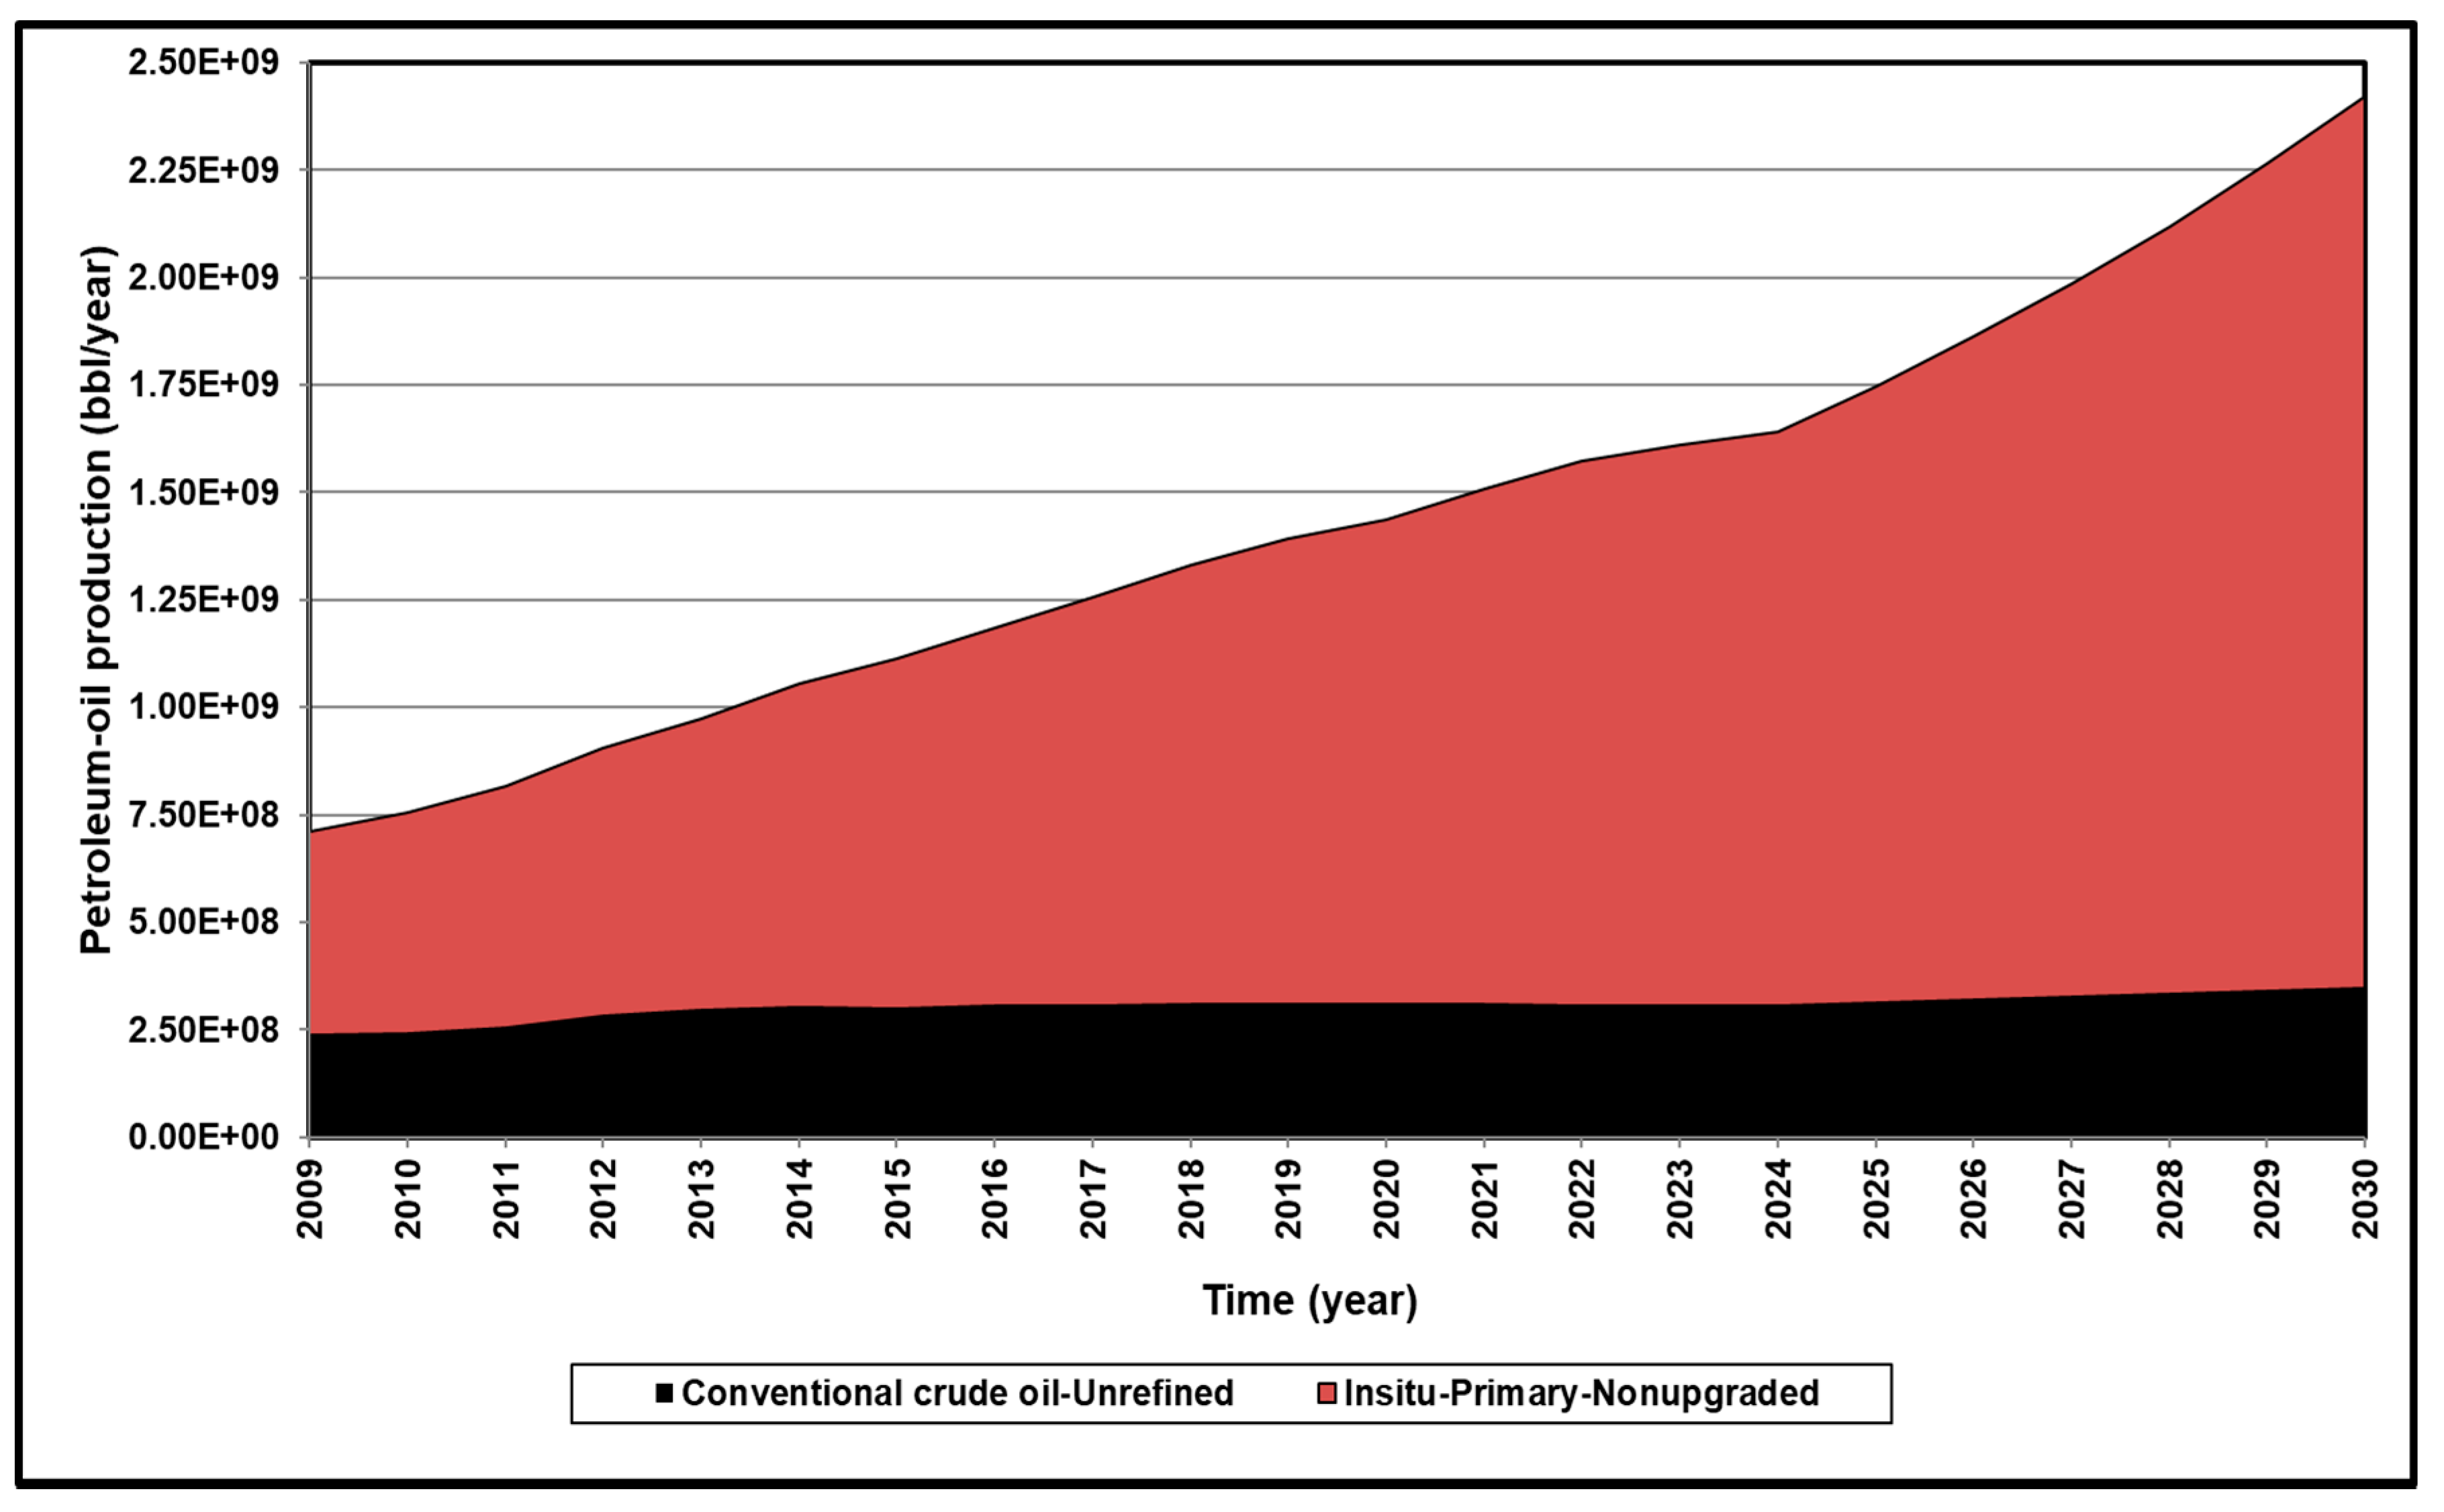
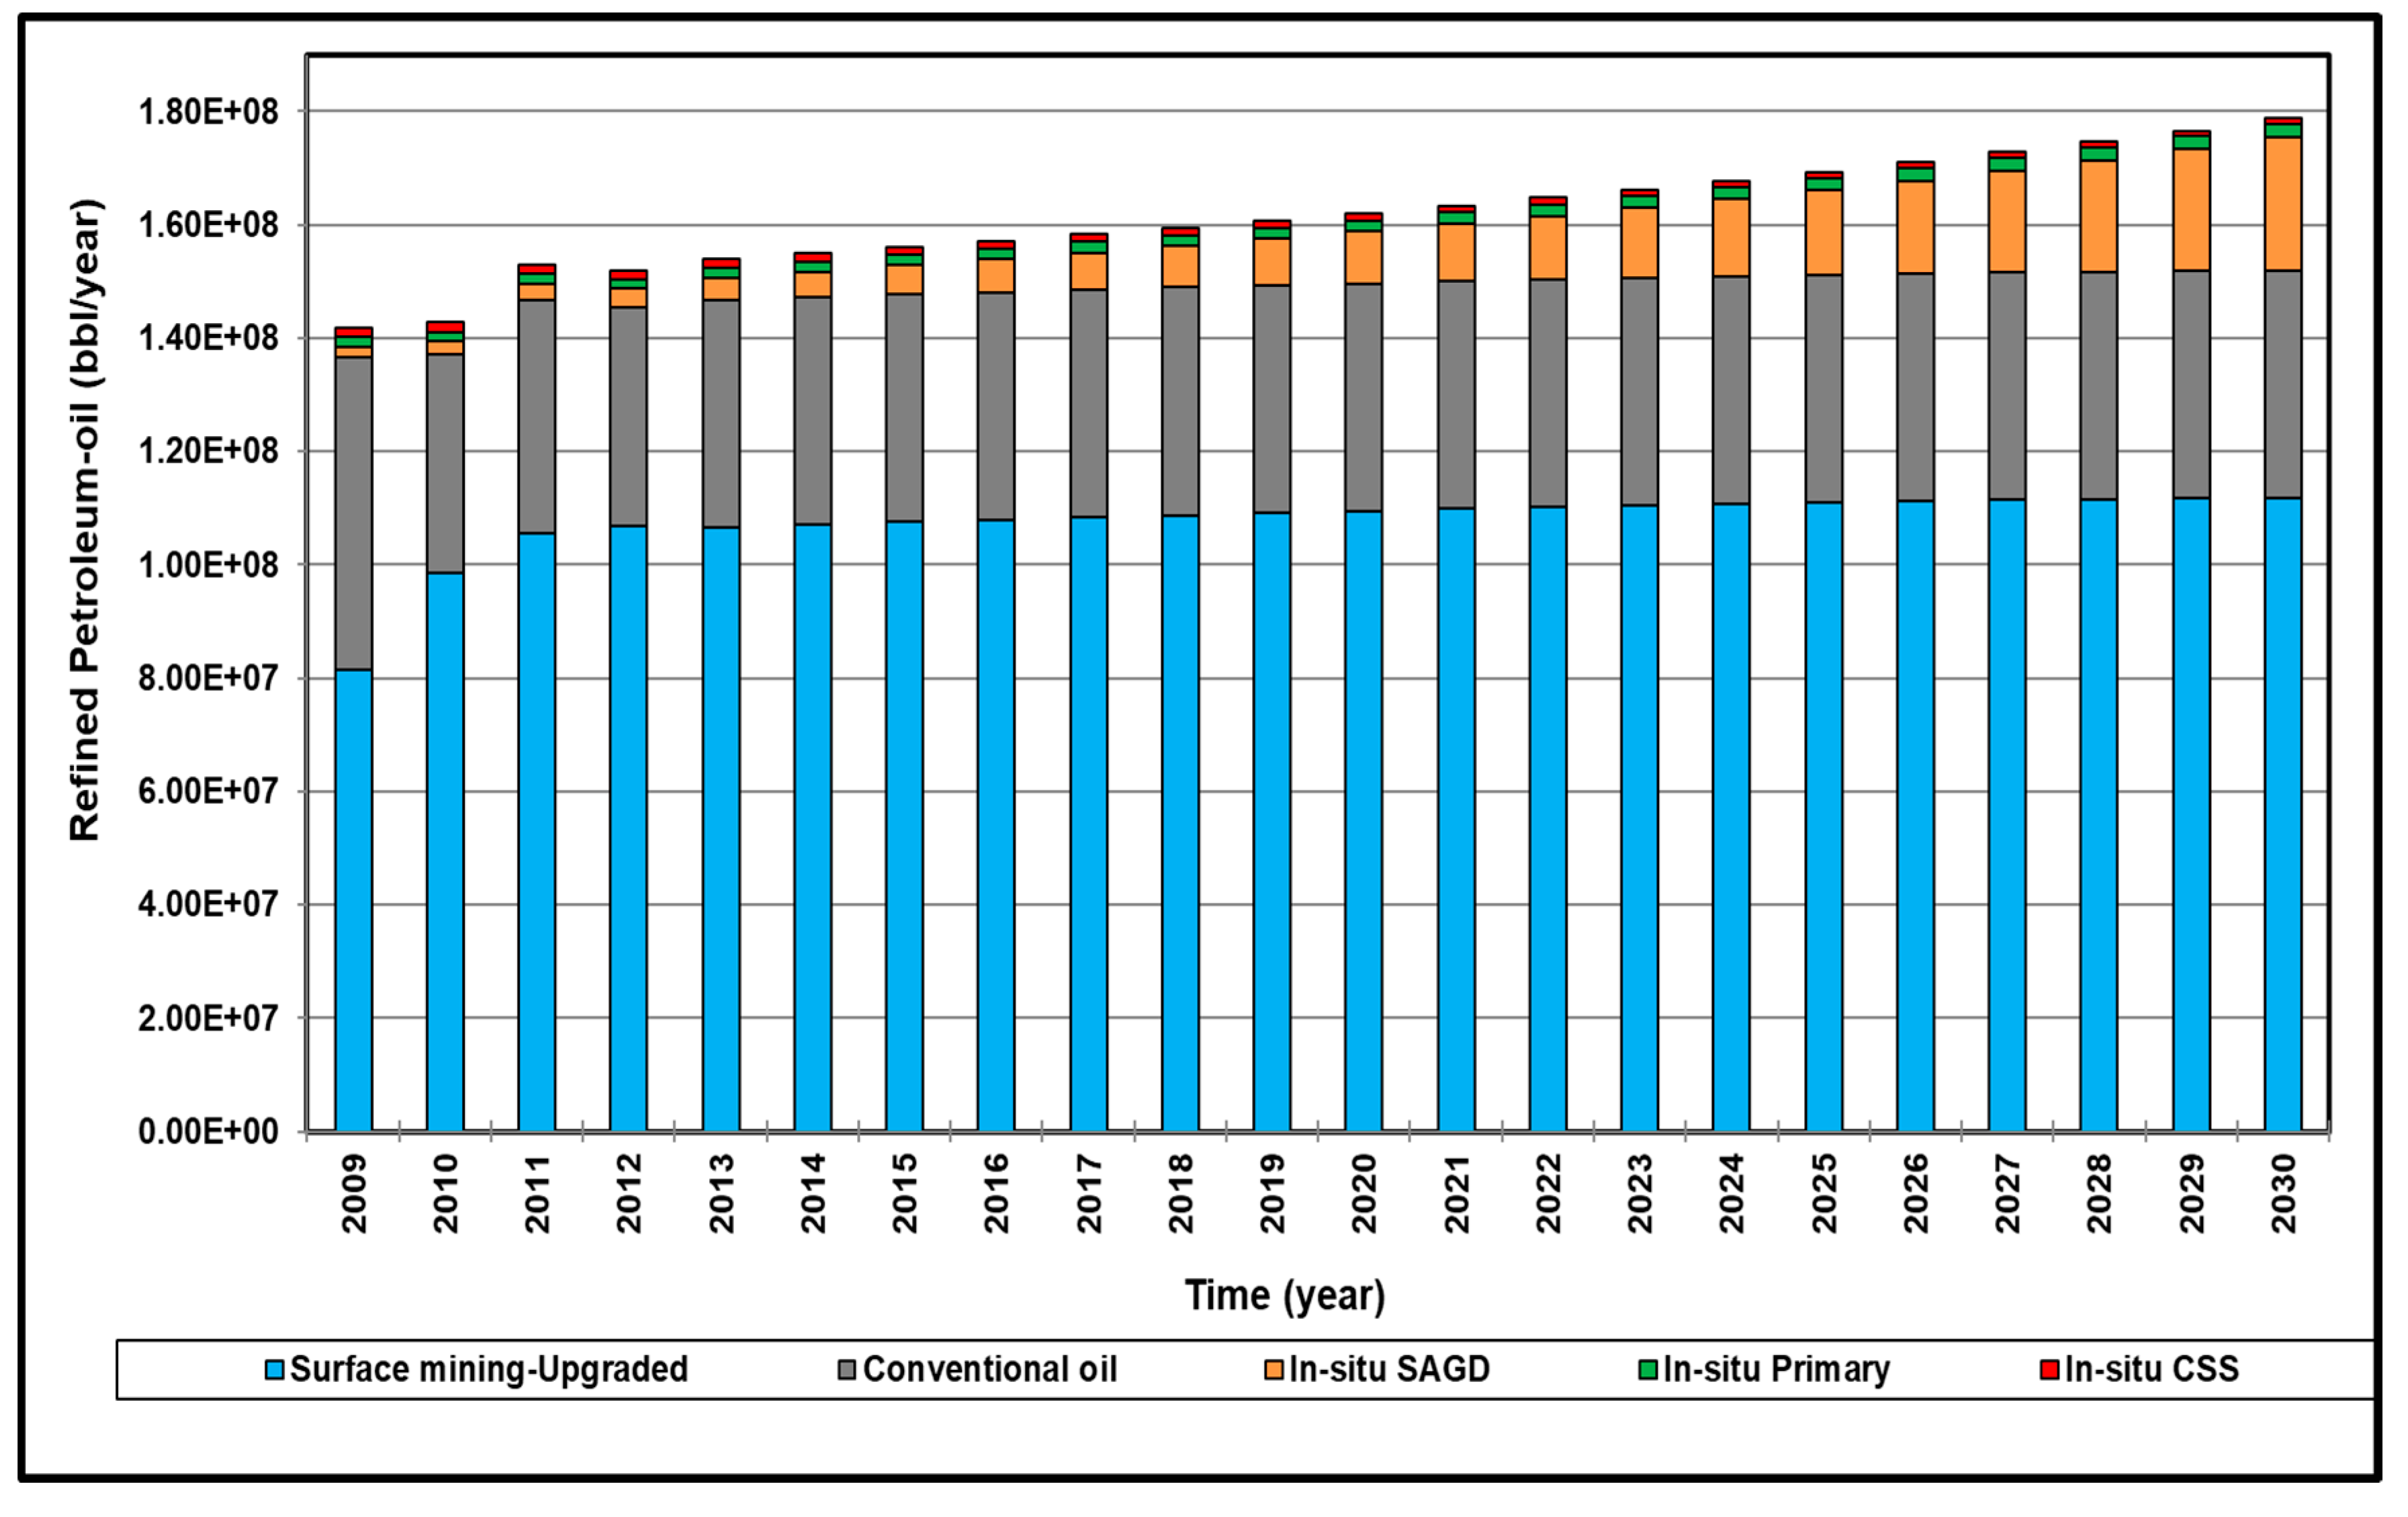
3.2. Oil Production in Alberta

The historical, current, and some of the forecasted oil production figures in Alberta were derived from an earlier study conducted by the author to forecast water demand for the energy sector in Alberta [30]. The developed oil production in Alberta was verified from the yearly report conducted by the Alberta Energy Regulator [31].
The complete oil production profile for each pathway in Alberta is shown in Figure 1 for extraction, and Figure 2 presents upgrading and refining.
The average annual growth rate of petroleum oil extraction in Alberta is 4.8% and projected to reach 5.2 million barrels per day in 2030. The contribution of conventional oil production to this total will be 8% by 2030; surface mining will contribute 37% and in-situ operation 55%. Extraction through in-situ SAGD is expected to increase at an average annual growth rate of 12%, while in-situ CSS decreases at a rate of 0.4%, and in-situ primary decreases at a rate of 0.2%. The expected growth rate over the entire studied period is 2.8% and 1% for upgrading and refining unit operations, respectively.

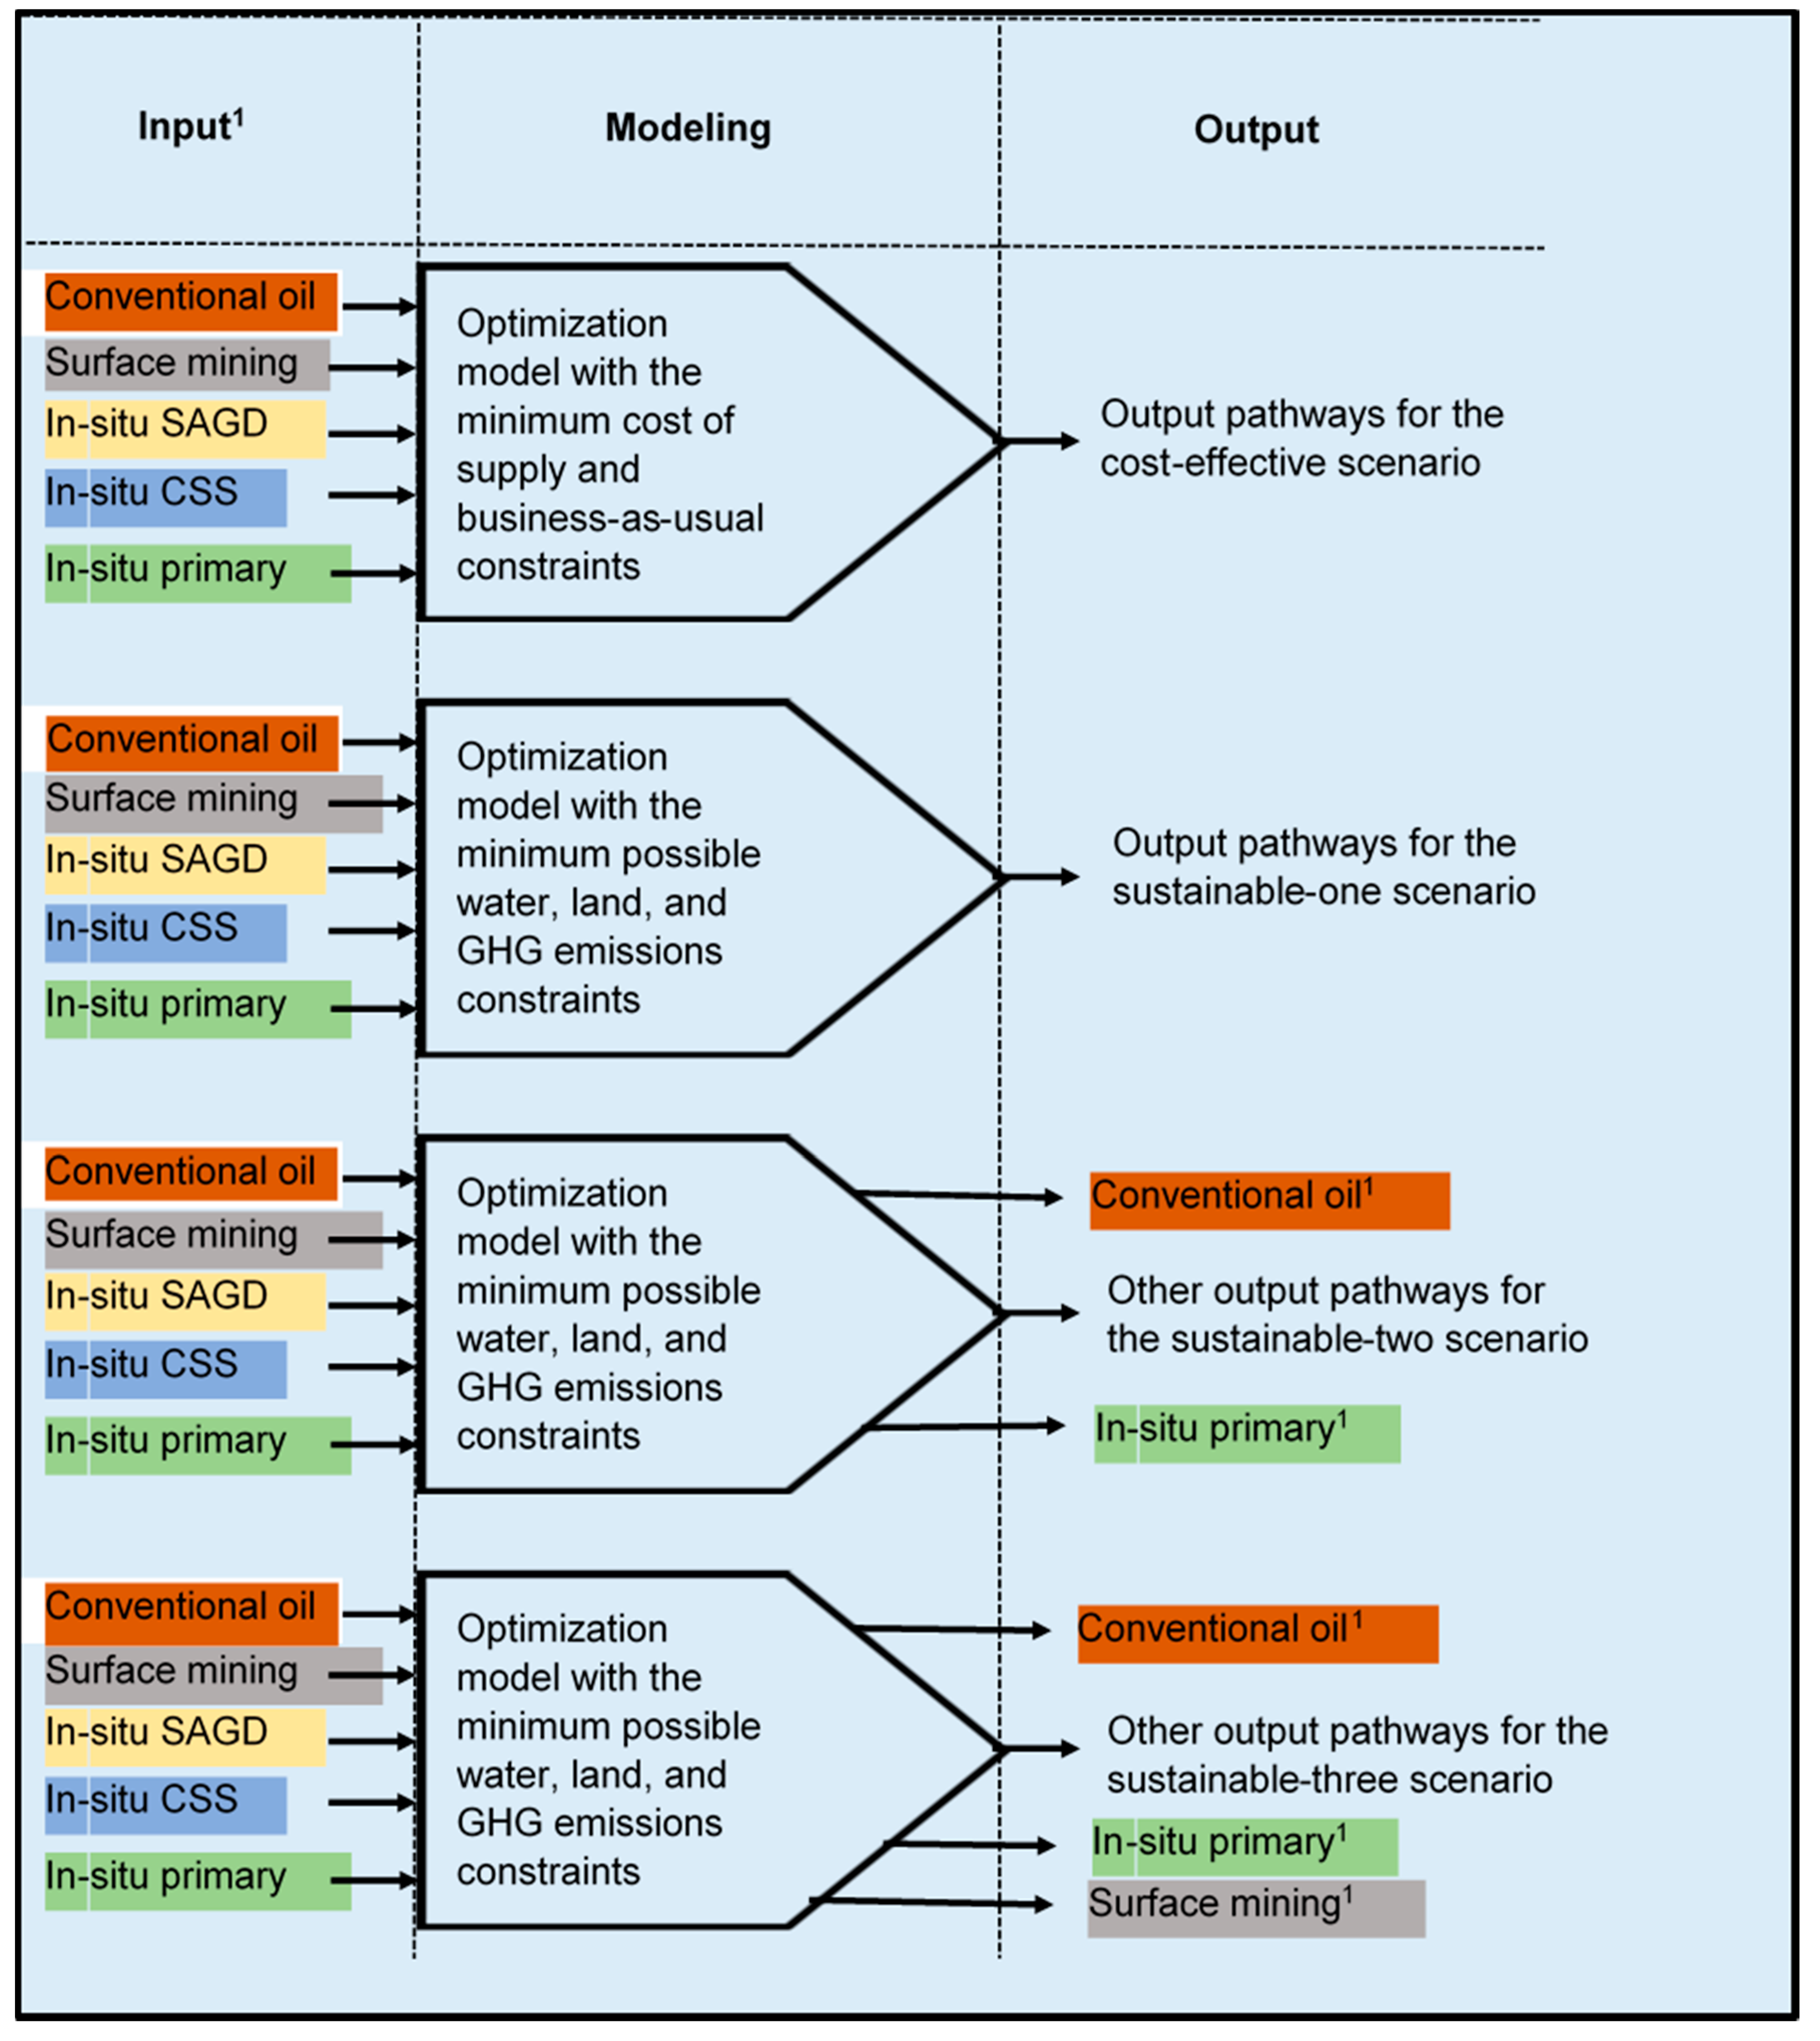
3.3. Description of the Scenarios

The input data for the scenarios were based on the total yearly oil production for the business-as-usual scenario and the developed sustainability indicators for Alberta pathways.
Water demand, GHG emissions, and land area based on the business-as-usual scenario, as shown in Figure 3, were used as constraints for the optimization model and to obtain the output for the cost-effective scenario. Figure 4 shows the details of the four conducted scenarios. Sustainable scenarios (sustainable-one, sustainable-two, and sustainable-three) were conducted based on the minimum natural resources to be used and the least GHG emissions in Alberta with different assumptions for the combination of petroleum oil production pathways. The input for the sustainable scenarios was trialed through the model in such a way as to represent the minimum possible constraints of water, land, and GHG emissions with the associated assumption for the yearly petroleum oil production. The sustainable-one scenario was conducted based on the minimum possible constraints with the assumption that petroleum oil production in Alberta would be kept the same as in the business-as-usual scenario. The sustainable-two scenario was conducted based on the same minimum possible constraints with the assumption that the share in the total petroleum oil production in Alberta from in-situ-primary and conventional oil pathways would be kept the same as in the business-as-usual scenario. The sustainable-three scenario was conducted based on the same conditions as the sustainable-two scenario with the assumption that the share of production from surface mining would be kept the same as in the business-as-usual scenario.

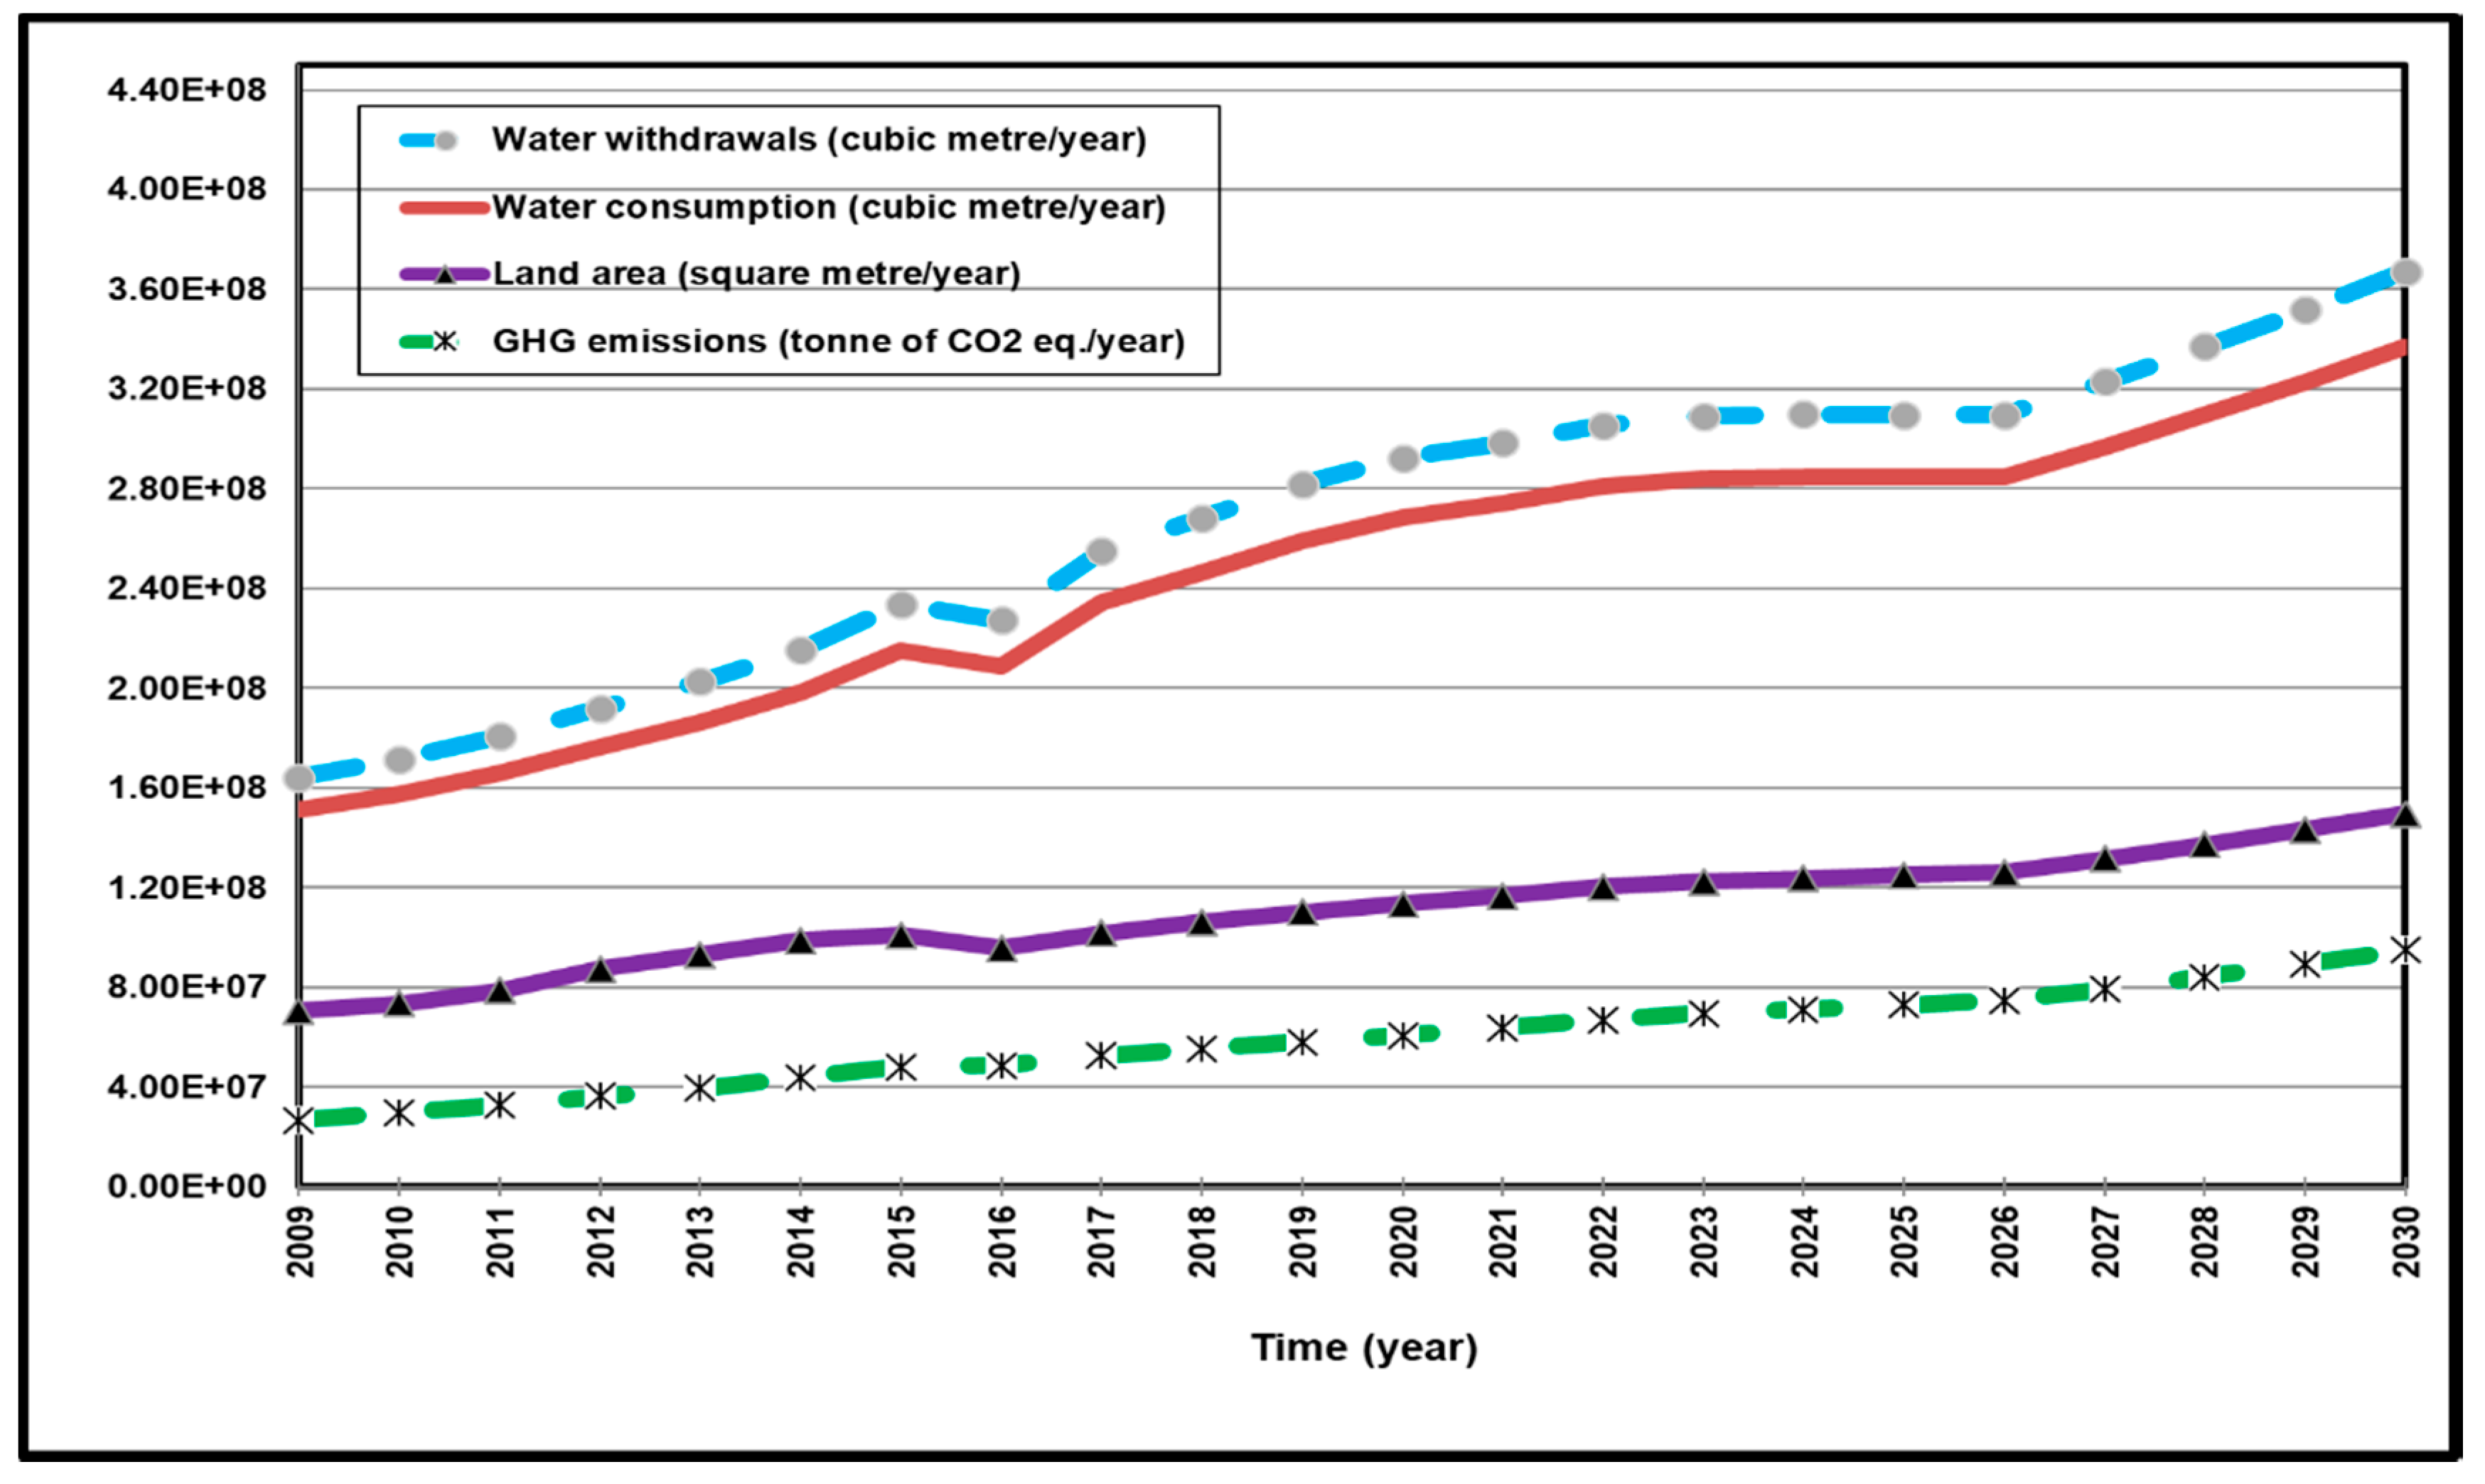
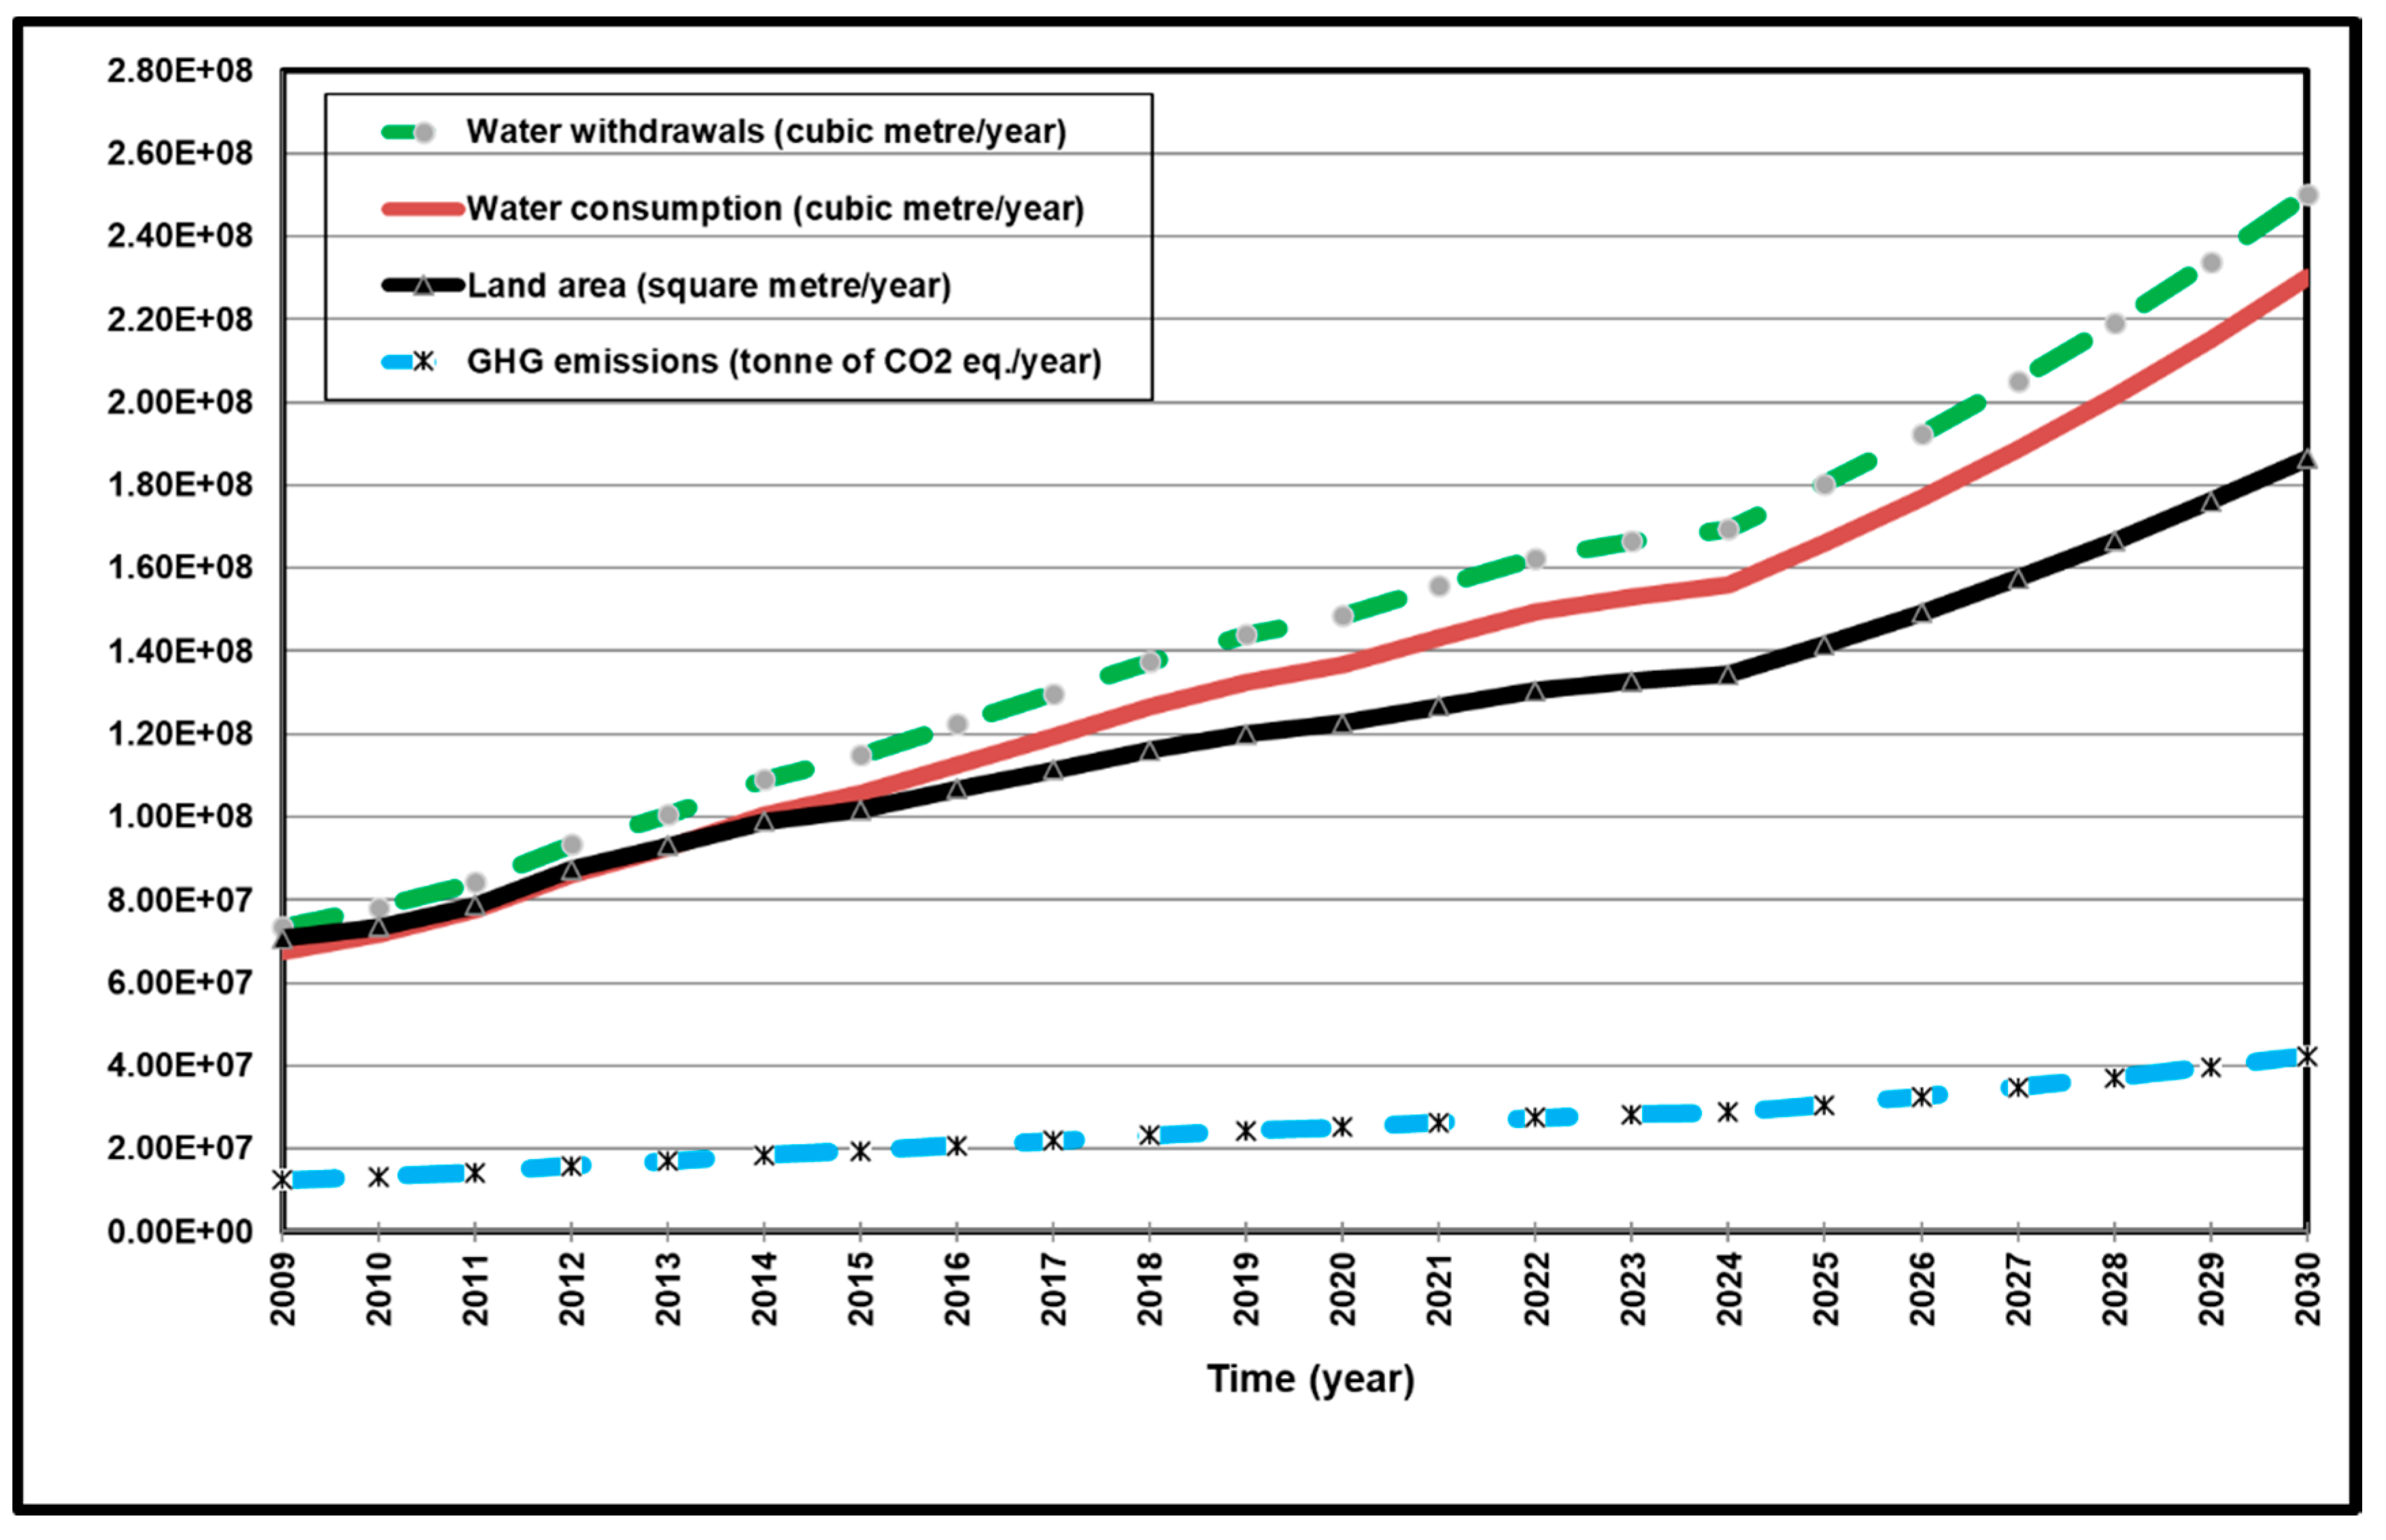
4. Results and Discussion

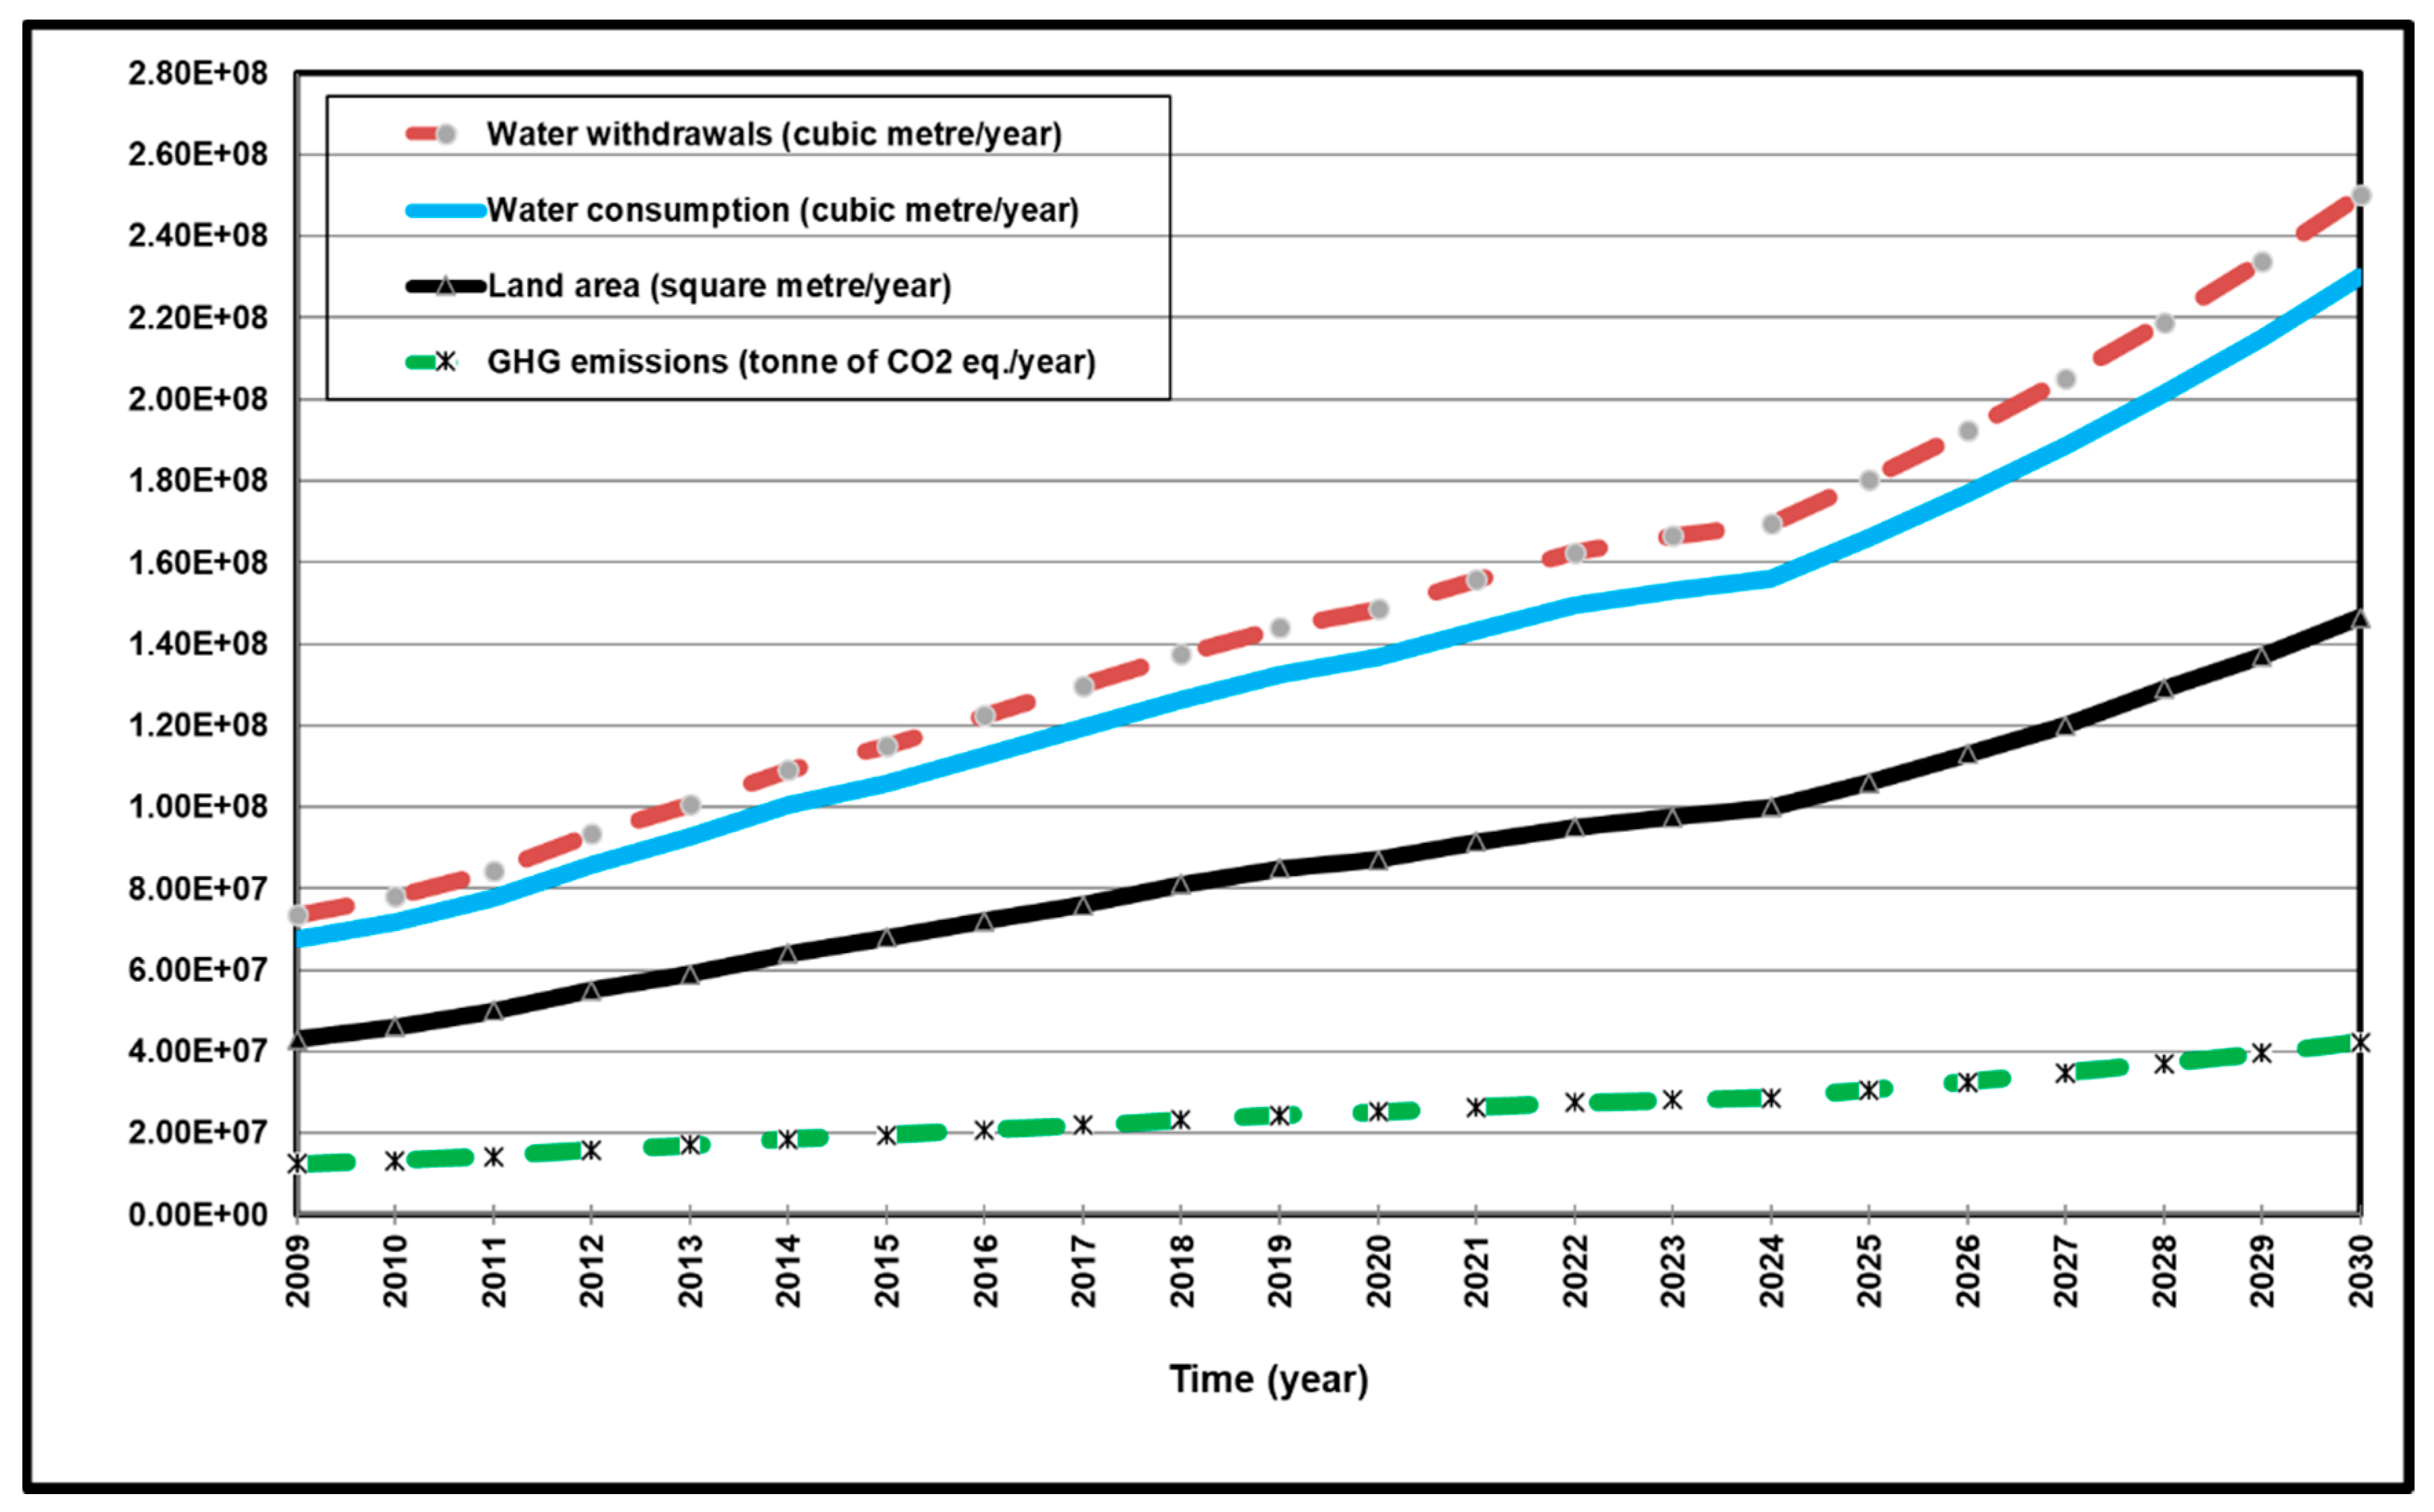
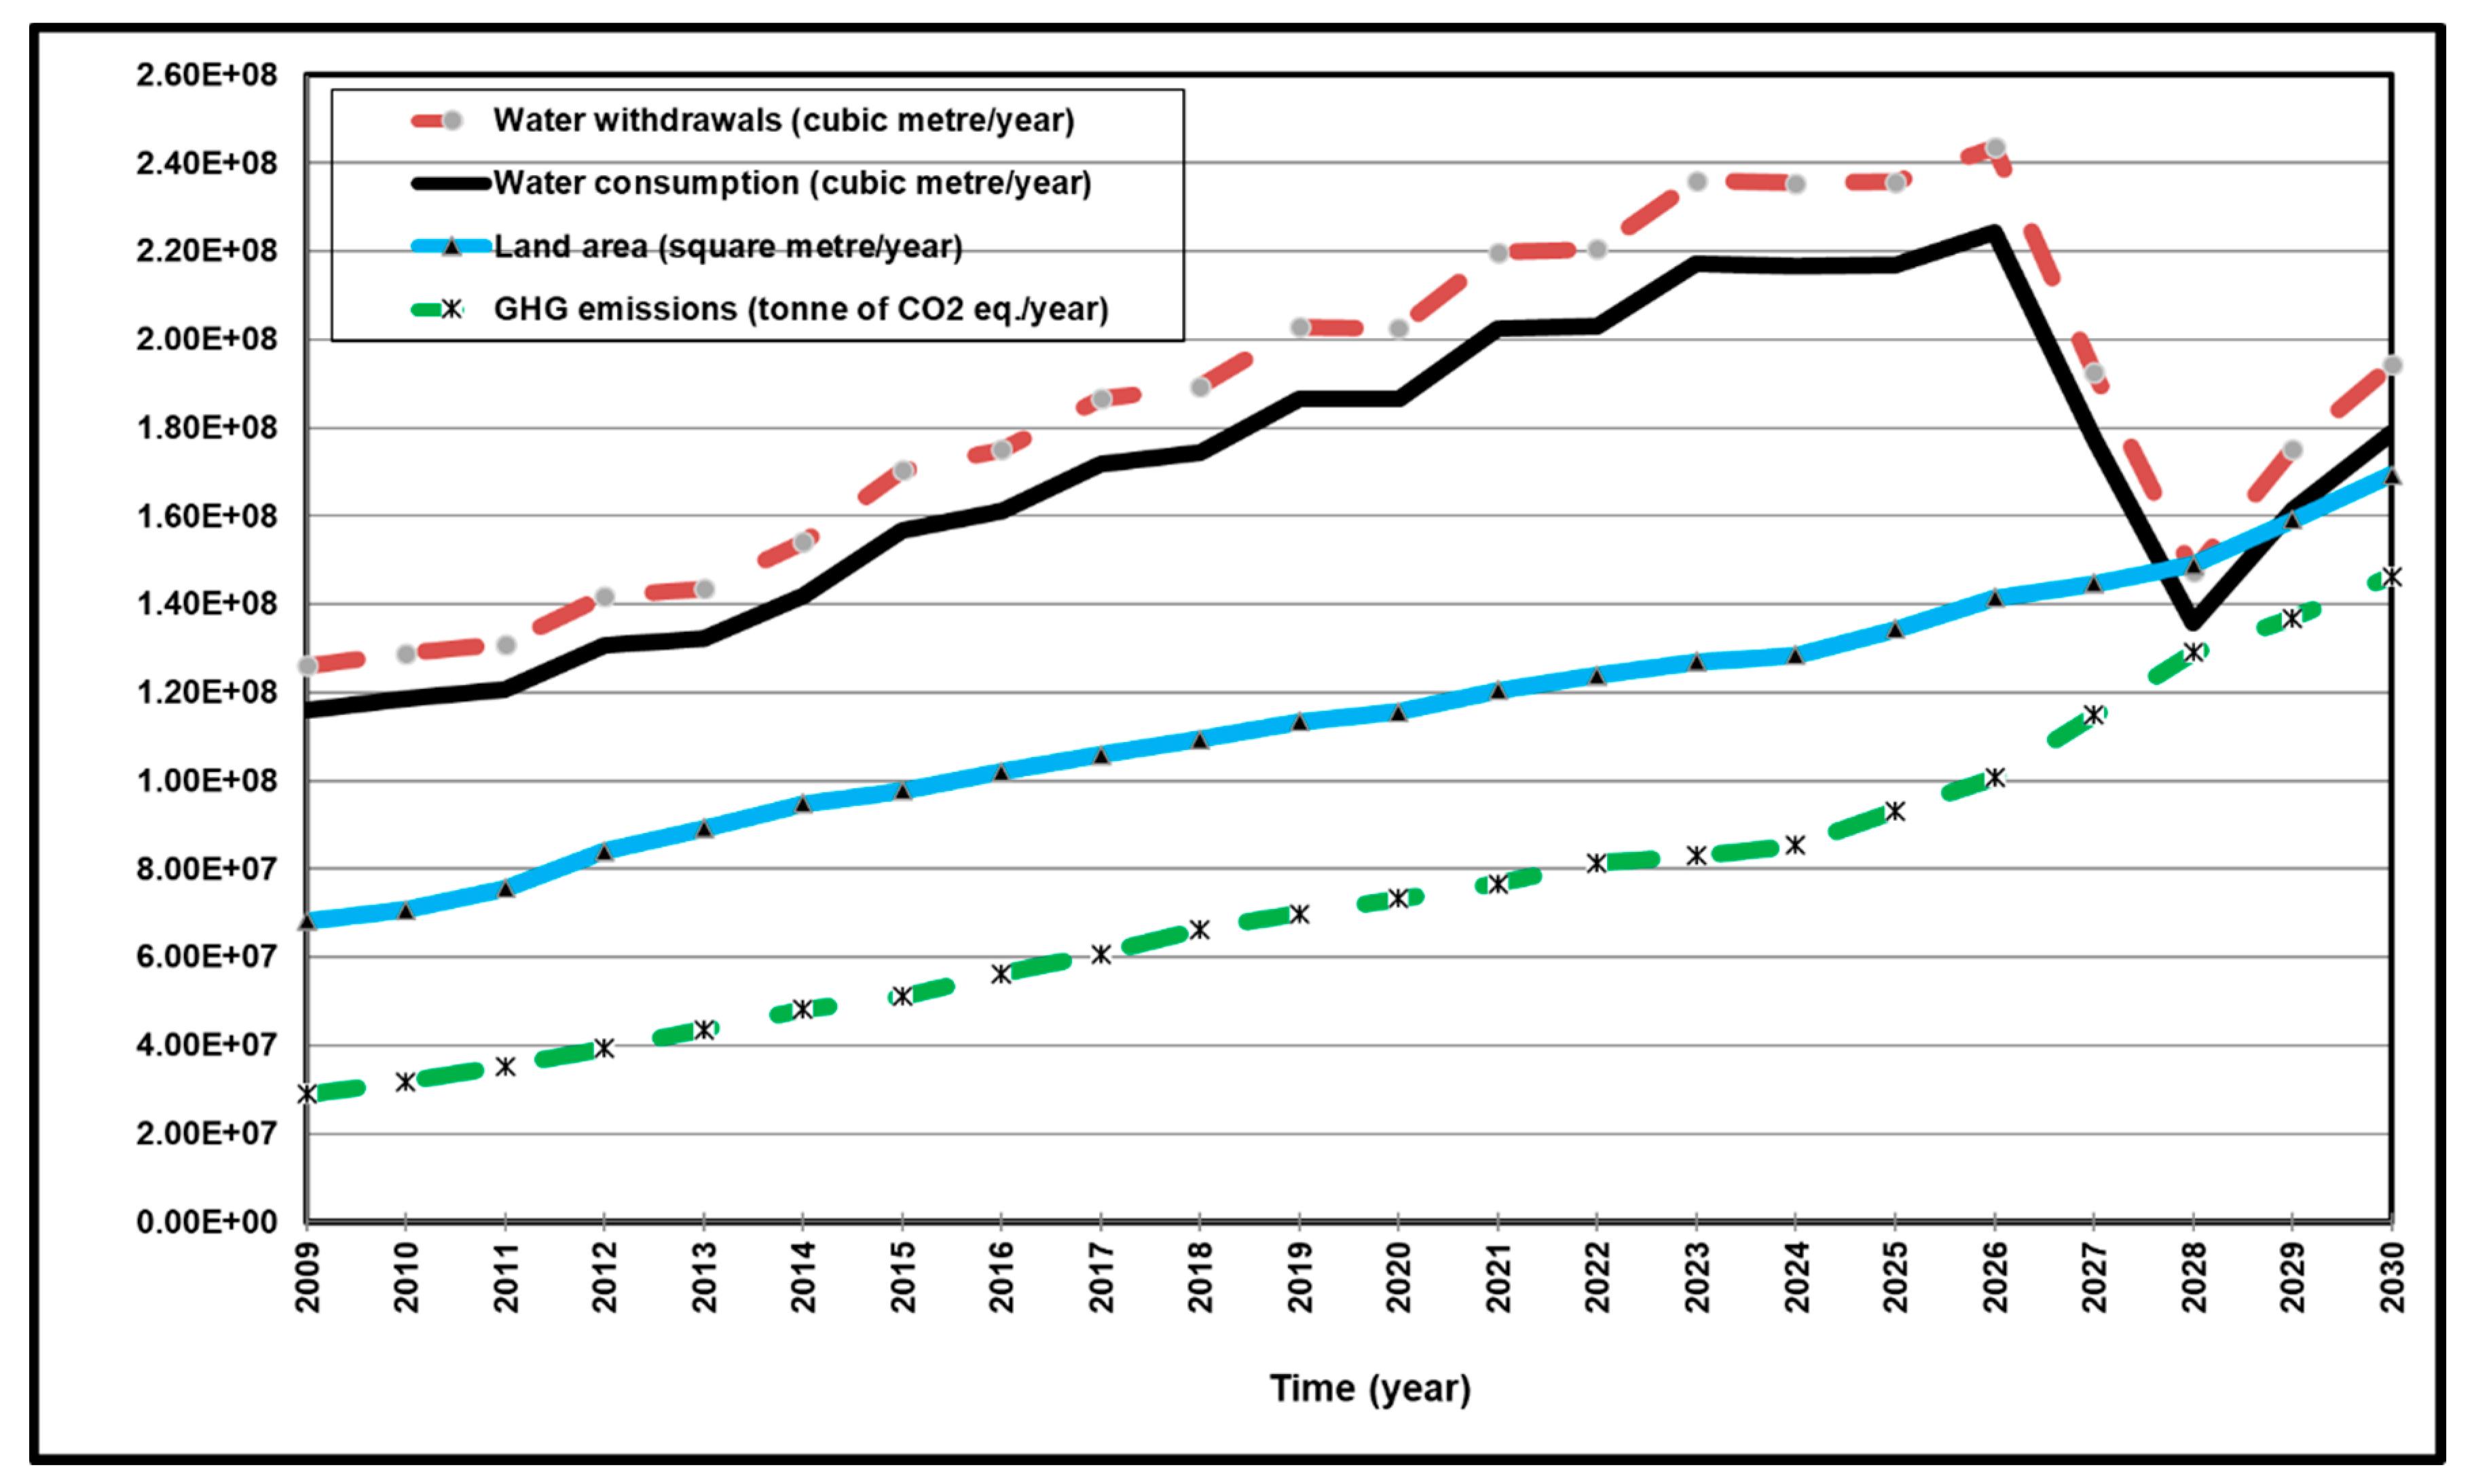
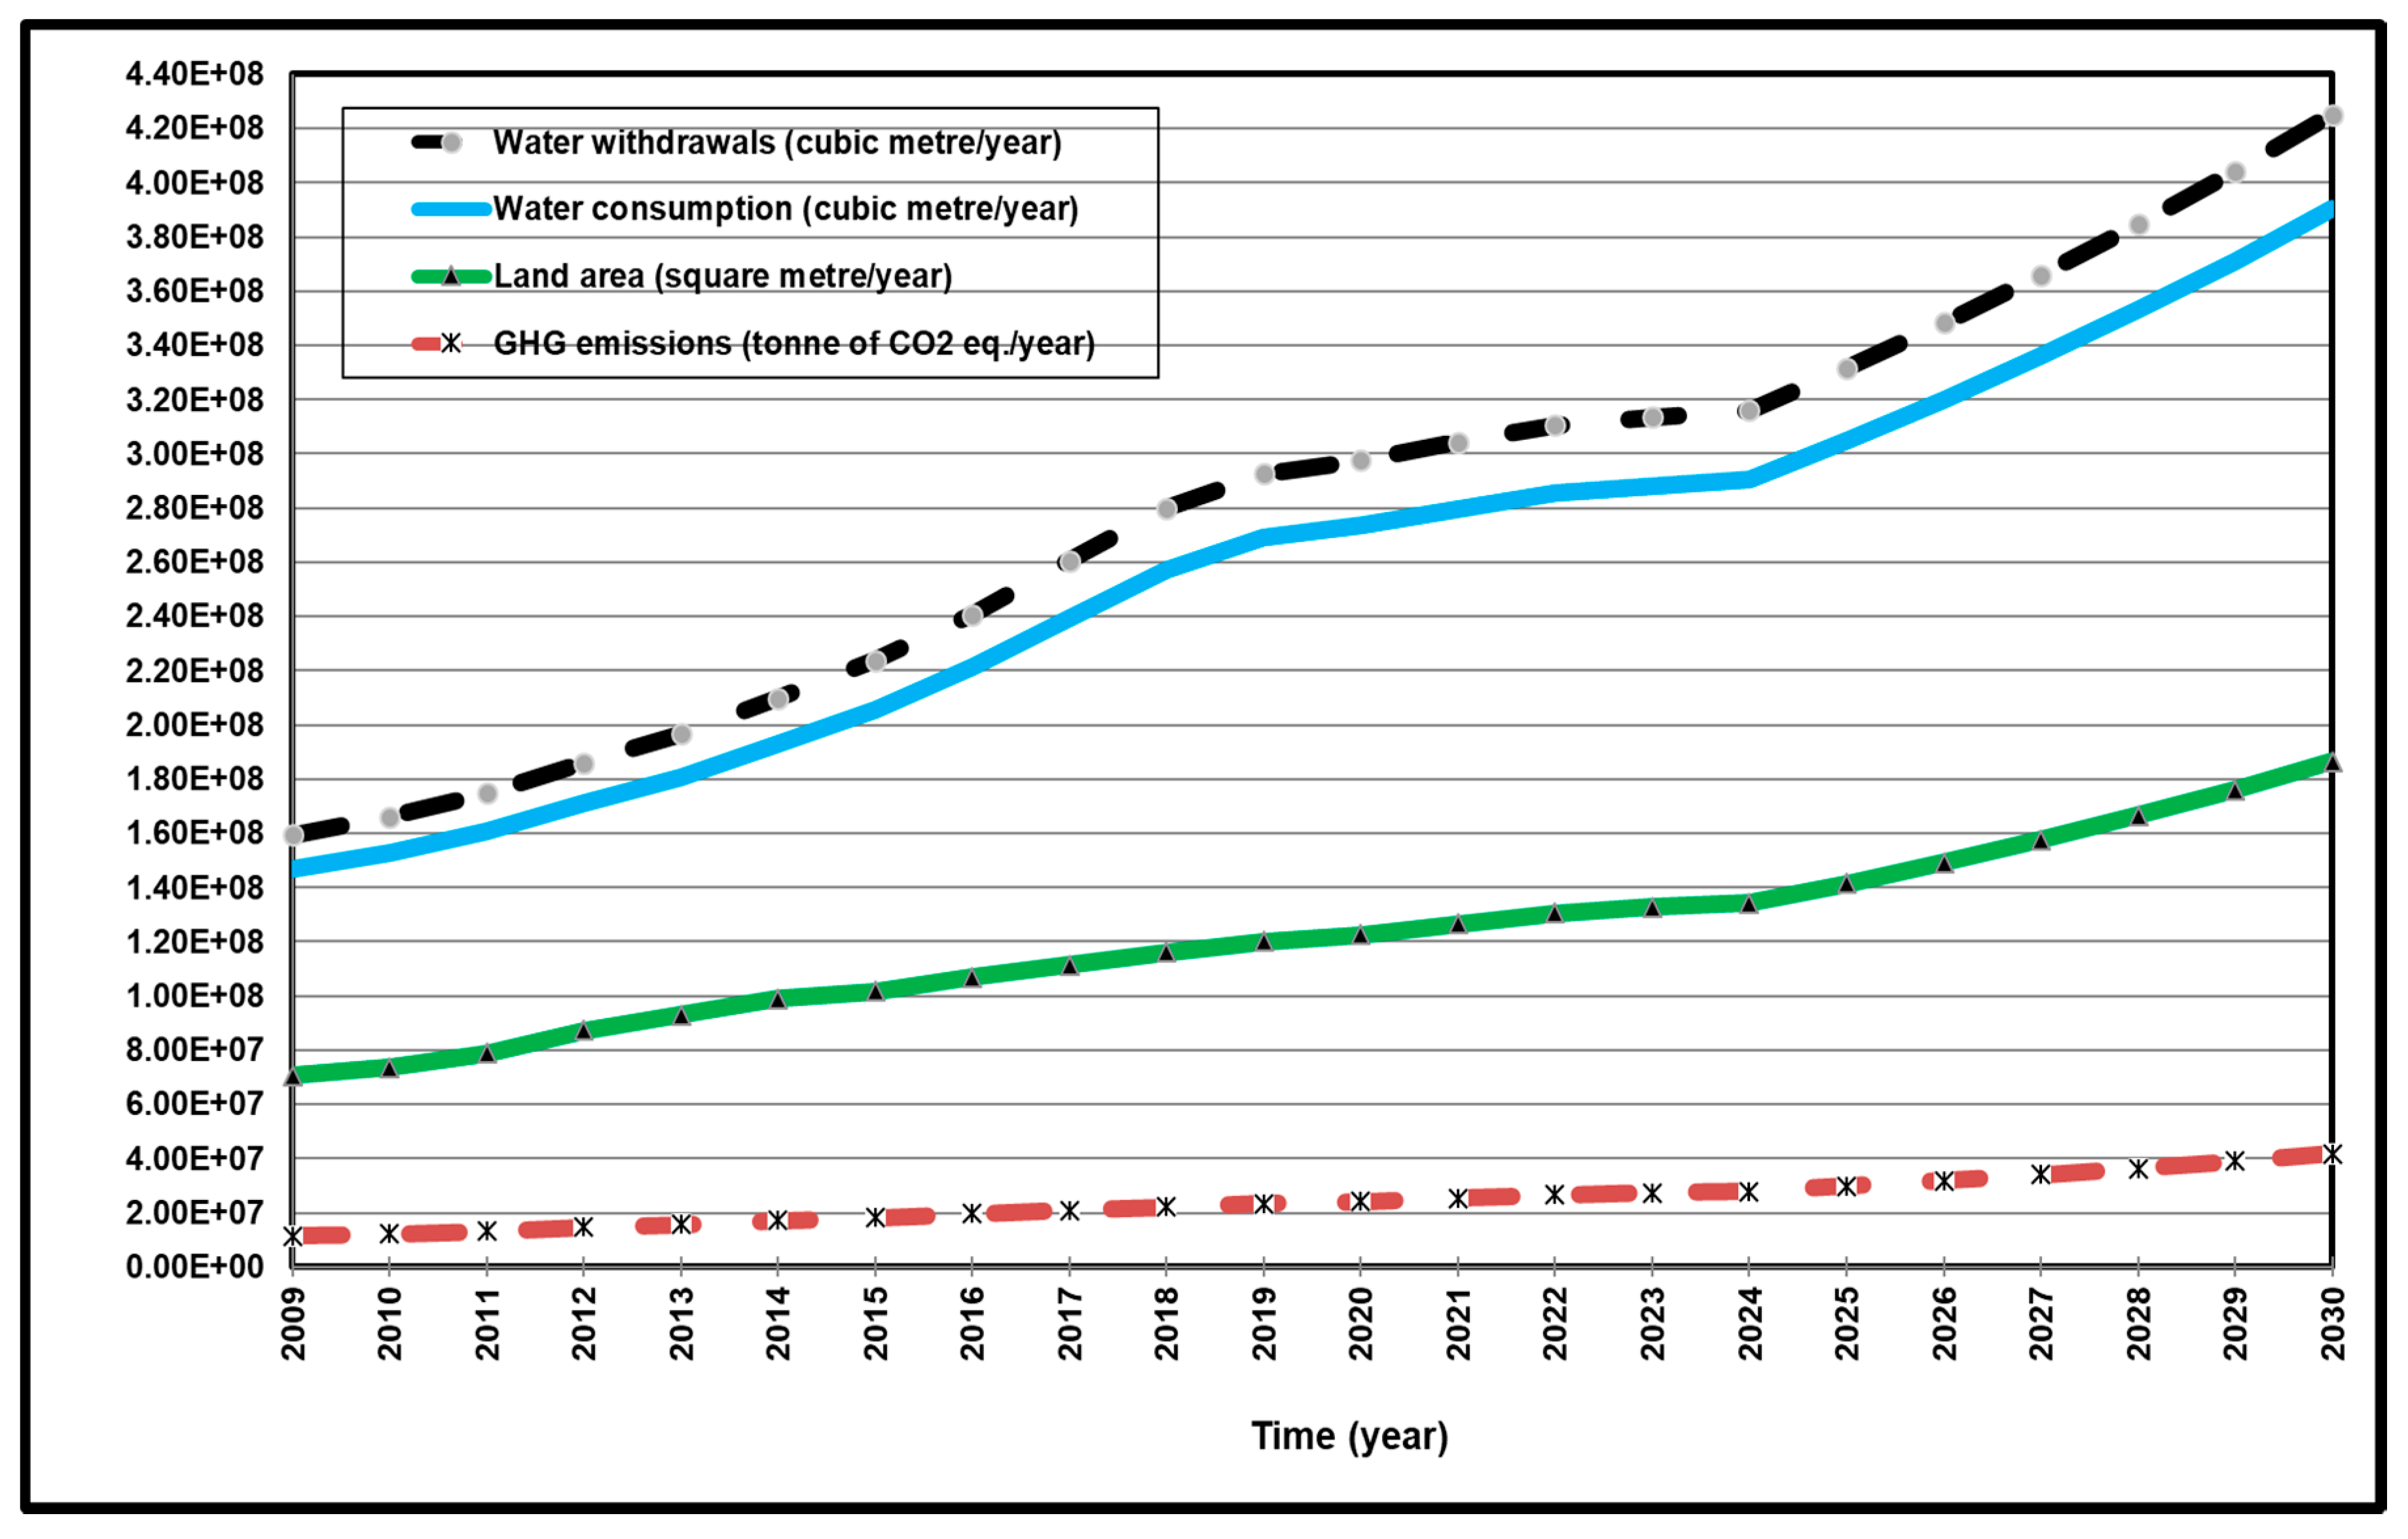
4.1. Development of the Sustainability Indicators

Table 2 shows the developed sustainability indicators for eighteen pathways of petroleum oil production in Alberta. Different unit operations with different petroleum-oil recoveries have broad impacts on sustainability indicators. For example, energy intensity and equipment used for each technology has a direct impact on the GHG emissions and other sustainability indicators.
The resultant range of COS and GHG emissions indicators are 12.28–53.53 USD/bbl and 17.50–226.20 kg of CO2 eq./bbl, respectively. The lower bounds for both indicators are achieved through the extraction of crude oil through conventional recovery without refining (Pathway no. 2 in Table 2), and the upper limits for both indicators are through the in-situ recovery of bitumen with CSS technology after upgrading and refining (Pathway no. 15). The extraction of bitumen through in-situ CSS recovery produces 20% more GHG emissions than the corresponding GHG emissions through in-situ SAGD (83 compared to 69 kg of CO2 eq./bbl). Upgrading and refining of bitumen extracted by in-situ CSS added 173% of the GHG emissions from extraction unit operations (83 compared to 143.2 kg of CO2 eq./bbl). The average GHG emissions for the upgraded oil sands were evaluated by Cai et al. [21] in the range of 32.94–147.42 kg of CO2 eq./bbl, which is in the reasonable range of this study. The GHG emissions indicator of upgraded, refined, and surface-mined oil sands in Alberta (Pathway no. 18) is estimated at 176.2 kg of CO2 eq., and the corresponding estimation from a review conducted by Brandt [22] is in the range of 125.74–271.41 kg of CO2 eq./bbl. The unrefined conventional oil in Alberta (Pathway no. 2) has a closer GHG emissions indicator (17.50 kg of CO2 eq./bbl) to the lowest end of a range (22.64–137.05 kg of CO2 eq./bbl) estimated for five different conventional crude oils in North America [23]. The wide range in the estimates of the GHG emissions for crude oil is mainly due to the variations in the unit operations, energy used, and the extracted oil properties.
Non-upgraded in-situ SAGD (Pathway no. 1) had the lowest impacts on water demand (0.3 bbl/bbl for water consumption and 0.33 bbl/bbl for water withdrawals) and land use (0.06 m2/bbl), while upgraded and refined bitumen recovered through surface mining (Pathway no. 18) had the most negative impact on water demand (4.18 bbl/bbl for water consumption and 5.15 bbl/bbl for water withdrawals). Non-upgraded in-situ primary (Pathway no. 3) shared with Pathway no. 2 in having the indictors of the lowest GHG emissions and water demand, besides having the lowest land use indicator along with Pathway no. 1 and Pathway no. 4.

4.2. Cost-Effective Scenario

The optimized, cost-effective scenario based on the business-as-usual scenario showed that the extraction of petroleum oil has to be carried out by conventional and in-situ primary pathways (Pathway no. 2 and Pathway no. 3). Figure 5 shows the profile of oil production from each of the two pathways for the cost-effective scenario. Pathway no. 2 had the lowest COS and the lowest GHG emissions indicator among the eighteen studied pathways and was constrained by high land use and moderate water demand indicators. Pathway no. 3 had the second-lowest COS, lowest GHG emissions, and the lowest land use indicator. The model selected the conventional recovery (Pathway no. 2) and in-situ primary (Pathway no. 3) pathways in the optimum zone of the cost-effective scenario with the coverage range of 14%–34% and 66%–86%, respectively. The average cost of supply (COSAV) based on the entire period 2009–2030 for the cost-effective scenario is 14.51 USD/bbl, which is 14% less than the COSAV of the business-as-usual scenario (16.82 USD/bbl) based on the same period, excluding upgrading and refining costs. Figure 6 shows the resultant annual amounts of water and GHG emissions and the land use for petroleum oil production in Alberta from the running of the cost-effective scenario.

4.3. Sustainable Scenarios

The sustainable-one scenario showed that more than 99% of the petroleum-oil demand in Alberta has to be met by in-situ primary (Pathway no. 3). The condition to keep the land use constraint as minimal as possible for the sustainable-one scenario shifted most of the portion produced by Pathway no. 2 in the cost-effective scenario to Pathway no. 3. The COSAV of the sustainable-one scenario is 15.17 USD/bbl and 10% less than the COSAV of the business-as-usual scenario. Figure 7 shows the natural resources used and the resultant GHG emissions from running of sustainable-one scenario.
The profile of optimum oil production for the sustainable-two scenario is detailed in Figure 8. The in-situ SAGD (Pathway no. 1) and surface mining (Pathway no. 14) pathways merged into the optimum zone of the sustainable-two scenario, in addition to the two pathways (Pathway no. 2 and Pathway no. 3) from the business as usual scenario. In-situ SAGD (Pathway no. 1), surface mining (Pathway no. 14), conventional crude oil (Pathway no. 2), and in-situ primary (Pathway no. 3) pathways contribute to the total production on average 58, 20, 14, and 8%, respectively. The production trend for surface mining (Pathway no. 14) affected the water demand trend (see the drop in the profile of surface mining from Figure 8 and the associated drop in water demand from Figure 9 after the year 2026) due to the higher water demand indicators for this pathway compared to the other pathways involved in the optimum zone of the sustainable-two scenario. The COSAV of the sustainable-two scenario is 16.87 USD/bbl, which is slightly higher (by 0.3%) than the COSAV of the business-as-usual scenario.
The profile of petroleum oil production in Alberta for the sustainable-three scenario, as shown in Figure 10, is similar to the profile of the business-as-usual scenario except that all products from in-situ CSS (Pathway no. 4) are shifted to the in-situ SAGD (Pathway no. 1). The petroleum oil production in Alberta for sustainable-three scenario shows that in-situ SAGD (Pathway no. 1) produces a range of 24%–56% of the total production, surface mining (Pathway no. 14) produces 32%–42%, conventional oil (Pathway no. 2) produces 7%–24%, and in-situ primary (Pathway no. 3) produces 5%–11%. Figure 11 shows the impacts of scenario three on natural resources and GHG emissions. The COSAV of the sustainable-three scenario is 16.71 USD/bbl, which is slightly lower (by 0.7%) than the corresponding COSAV of the business-as-usual scenario.

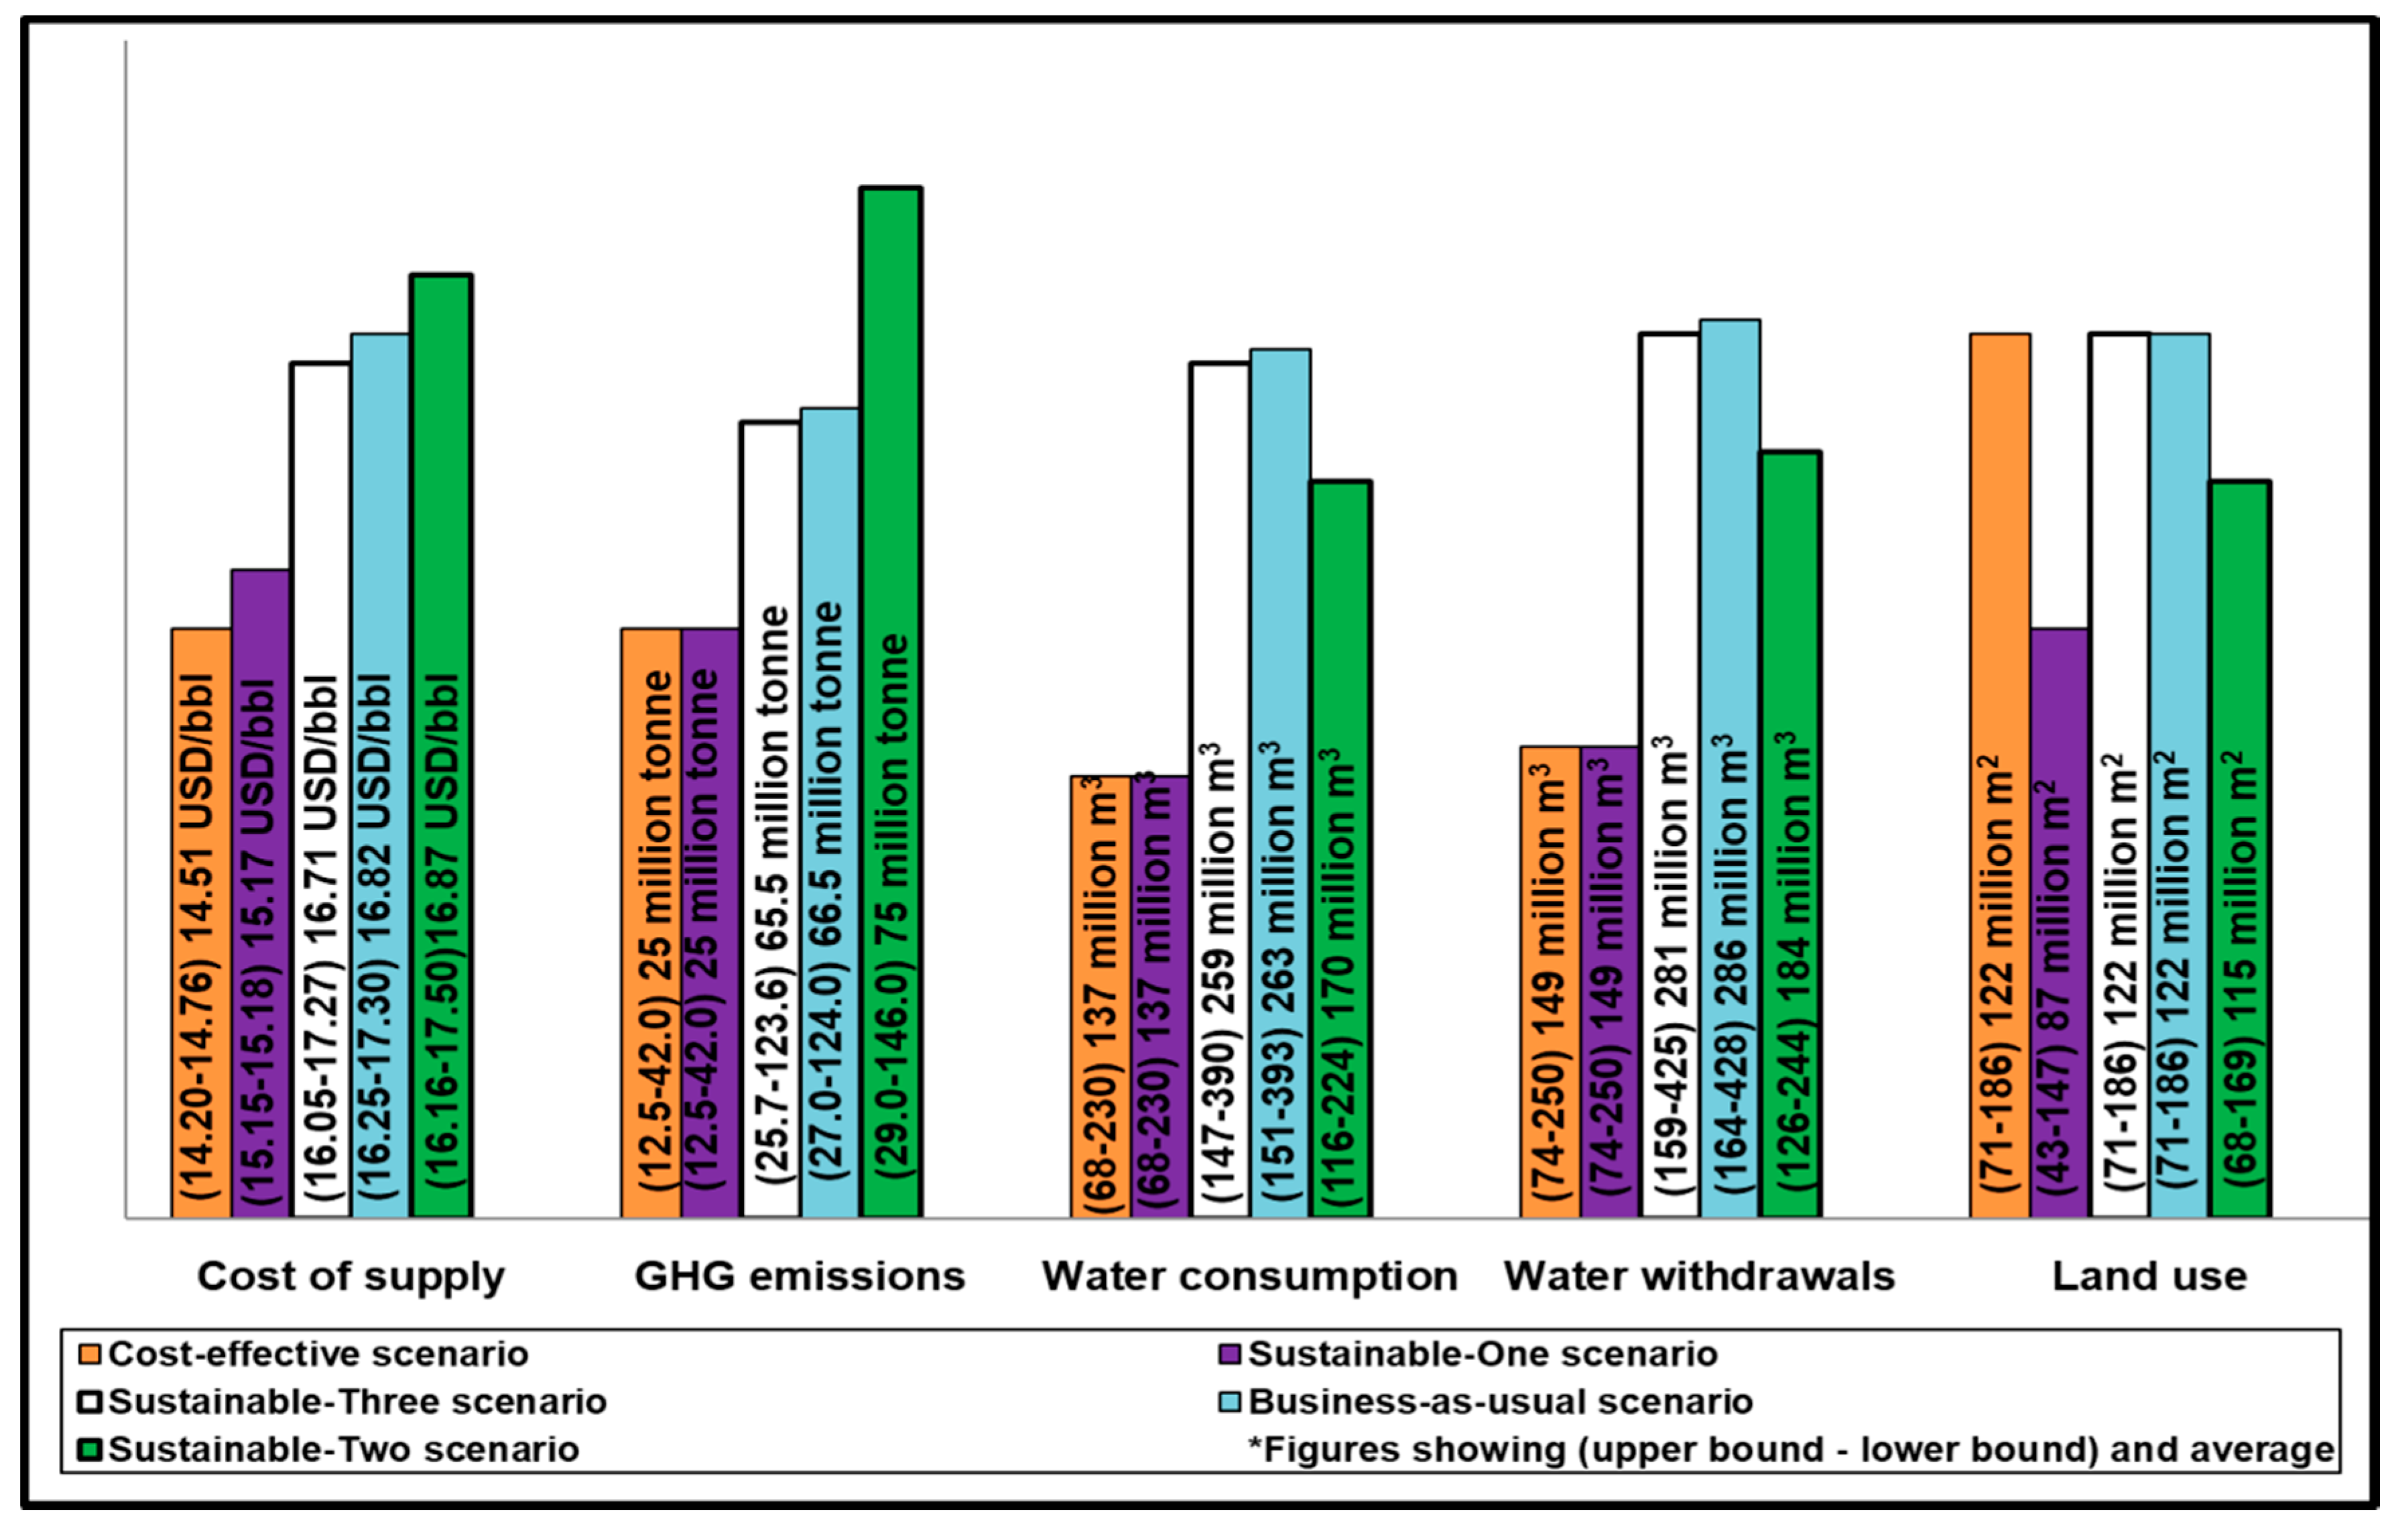
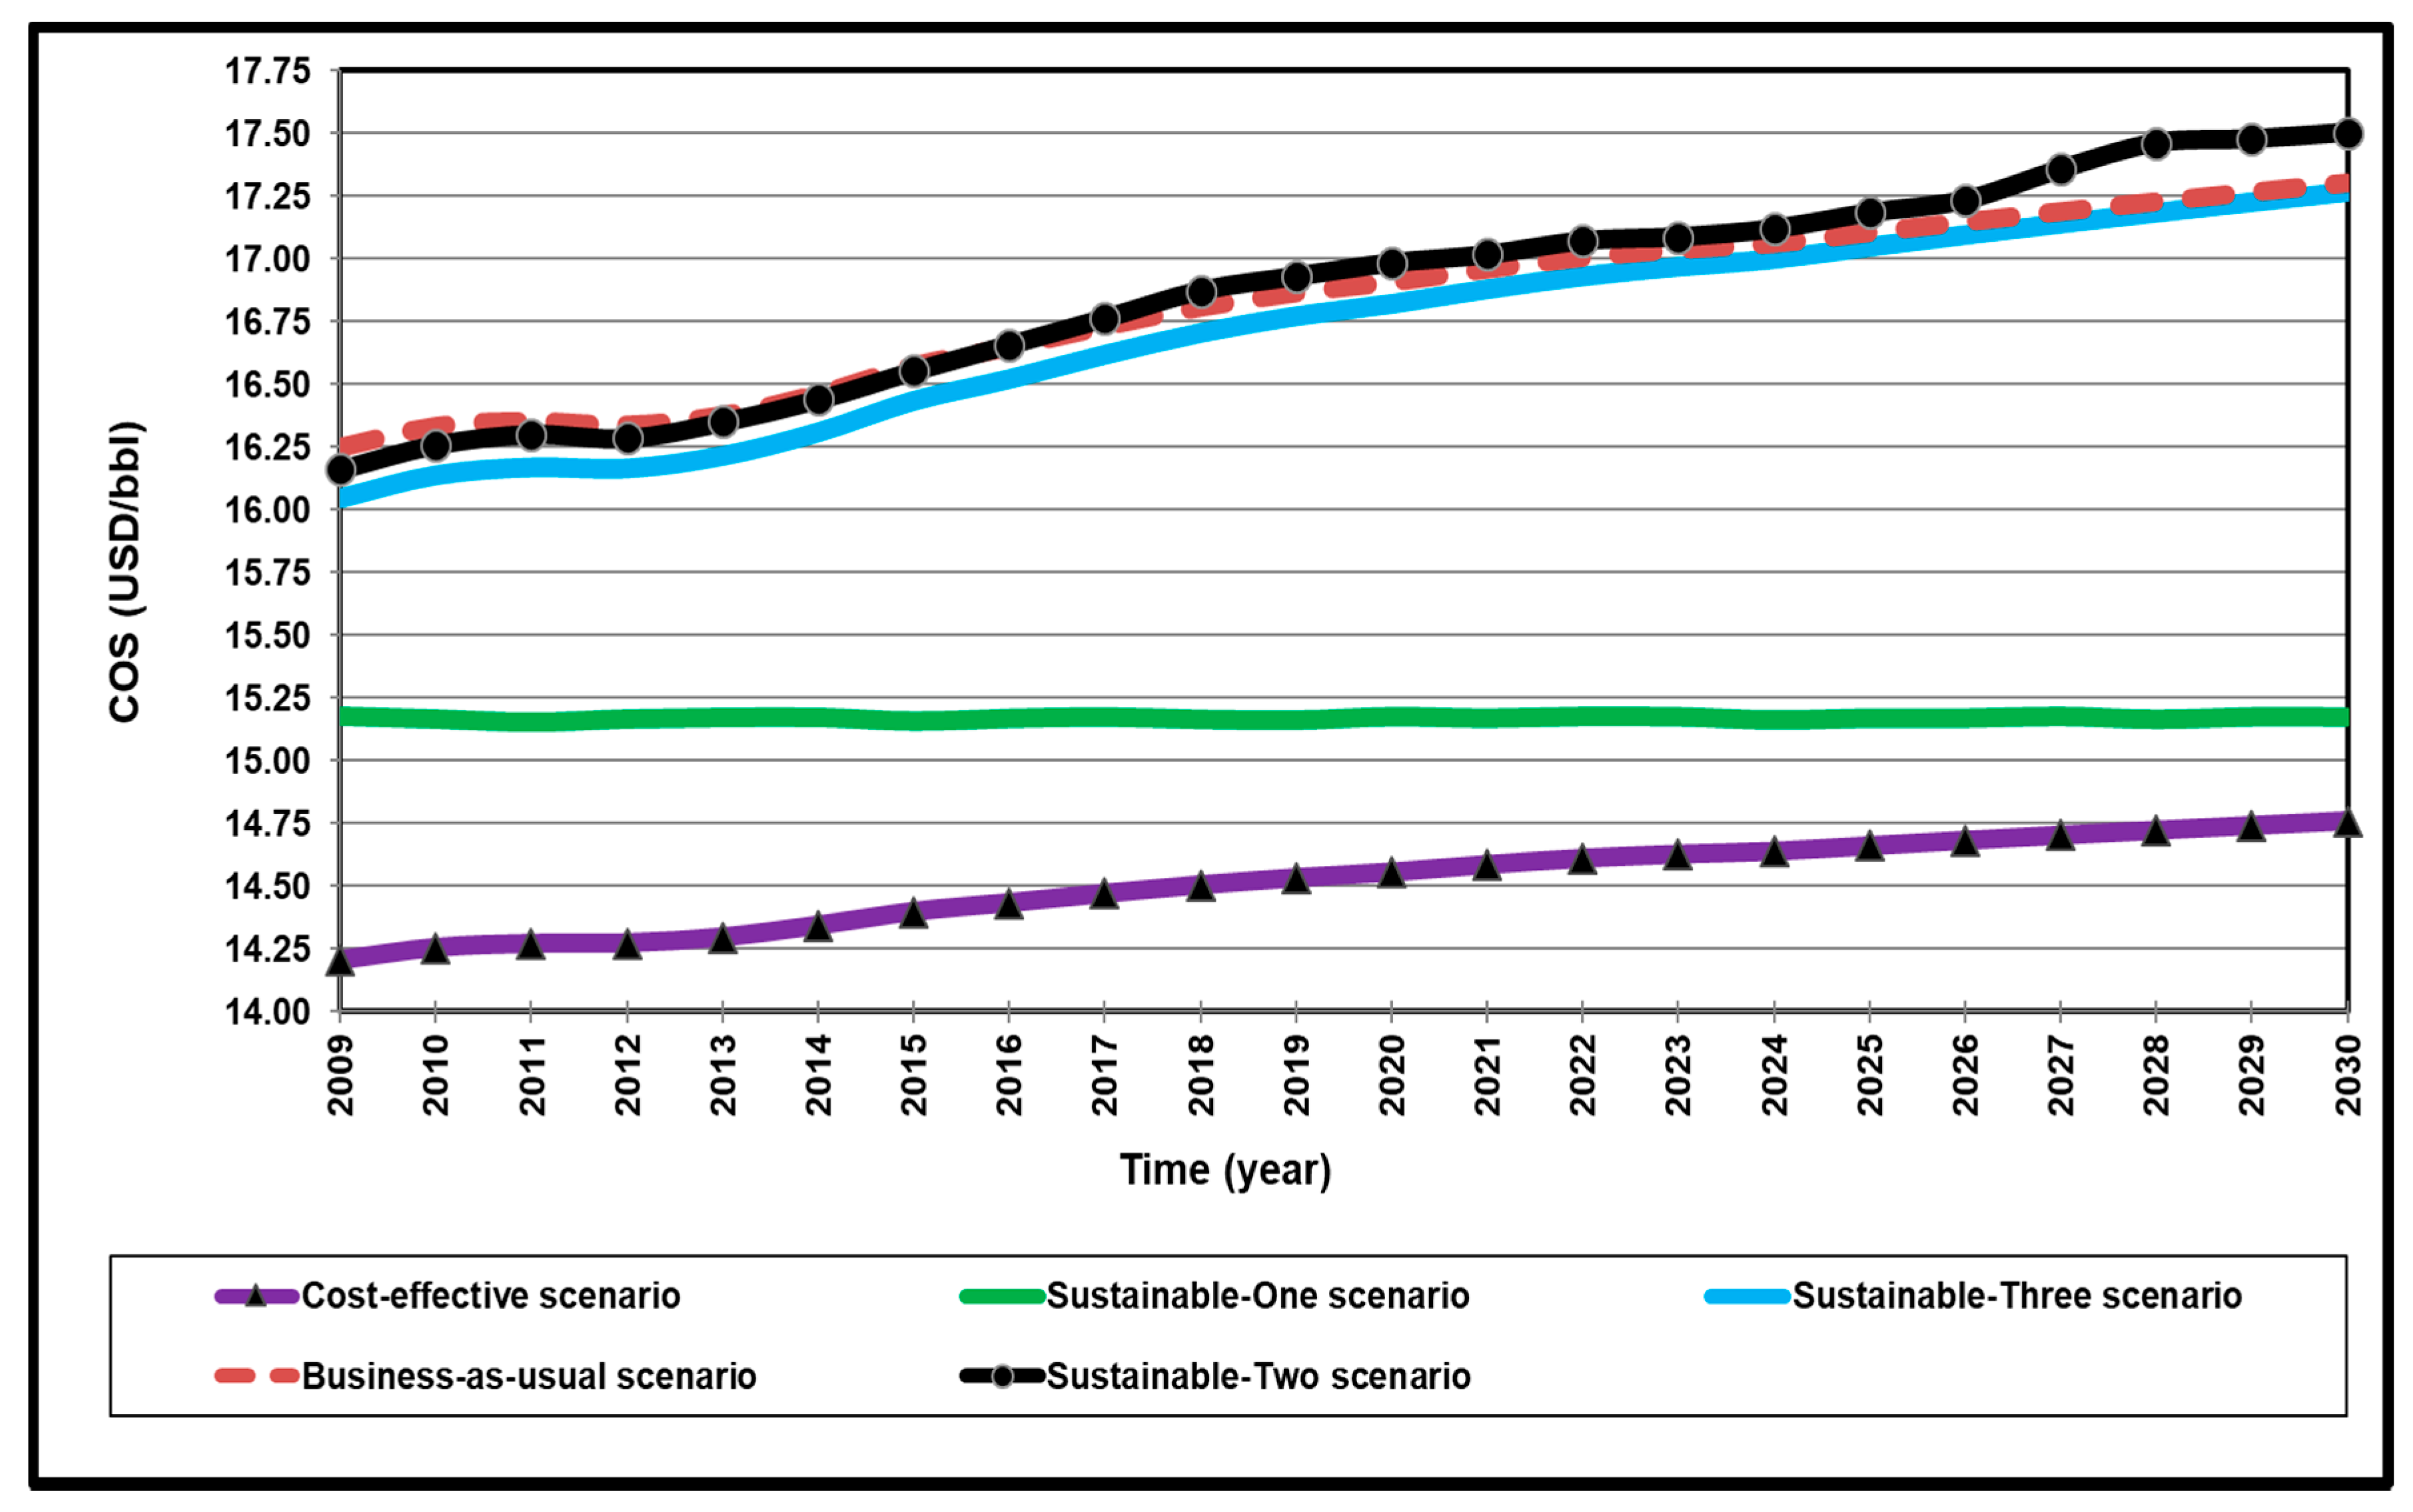
4.4. Comparative Assessment of the Scenarios

Figure 12 shows the trend of COS of the conducted scenarios. Sustainable-two scenario (its profile is shown in Figure 8) has the highest COS trend compared to the other studied scenarios due to the high contribution of in-situ-SAGD (Pathway no. 1) in the total production to keep the water demand and land at the minimum possible. In-situ-SAGD (Pathway no. 1) has the highest COS of all pathways involved in the sustainable-two scenario and played a significant role in increasing the resulted COS. The share of in-situ-SAGD (Pathway no. 1) in the total oil production after running the sustainable-three scenario (24%–56%) is lower than the corresponding percentage in the case of the sustainable-two scenario (36%–83%) which led to the reduced COS trend. Sustainable-one and cost-effective scenarios used the same two pathways (Pathway no. 2 and Pathway no. 3) to cover the oil demand in Alberta with different percentages of share in total production. The share of production from conventional crude (Pathway no. 2) in the total has been reduced to less than 1% in the sustainable-one scenario to satisfy the minimum land use constraint. The share from Pathway no. 2 in the cost-effective scenario was higher (14%–34%) to reduce the resultant COS. Consequently, the land area was less for sustainable-one with a higher COS trend compared to the cost-effective scenario. The cost-effective scenario was run with the objective function for COS to be minimized, and the resultant COS trend outperforms compared to all of the studied scenarios.
Figure 13 shows the lower bound, upper bound, and average values of annual water demand, GHG emissions, and land use as well as the COSAV for the studied scenarios based on the entire period 2009–2030. Cost-effective and sustainable-one scenarios have equal lowest impacts on GHG emissions and water demand (consumption and withdrawals). Cost-effective scenario outperforms with the lowest cost of supply (COS), and sustainable-one scenario outperforms with the smallest land use. Cost-effective and sustainable-one scenarios have low reliability because petroleum oil production in Alberta cannot depend only on the low reserves of conventional oil (Pathway no. 2) and in-situ primary (Pathway no. 3).
The sustainable-two scenario has the most negative impacts on the COS and GHG emissions with moderate effects on water demand and land use. The sustainable-three scenario has a mild effect on COS and GHG emissions with a negative impact on water demand. The sustainable-three scenario has the same maximum land area required for petroleum oil production in Alberta as cost-effective and business-as-usual scenarios.

5. Sensitivity analysis

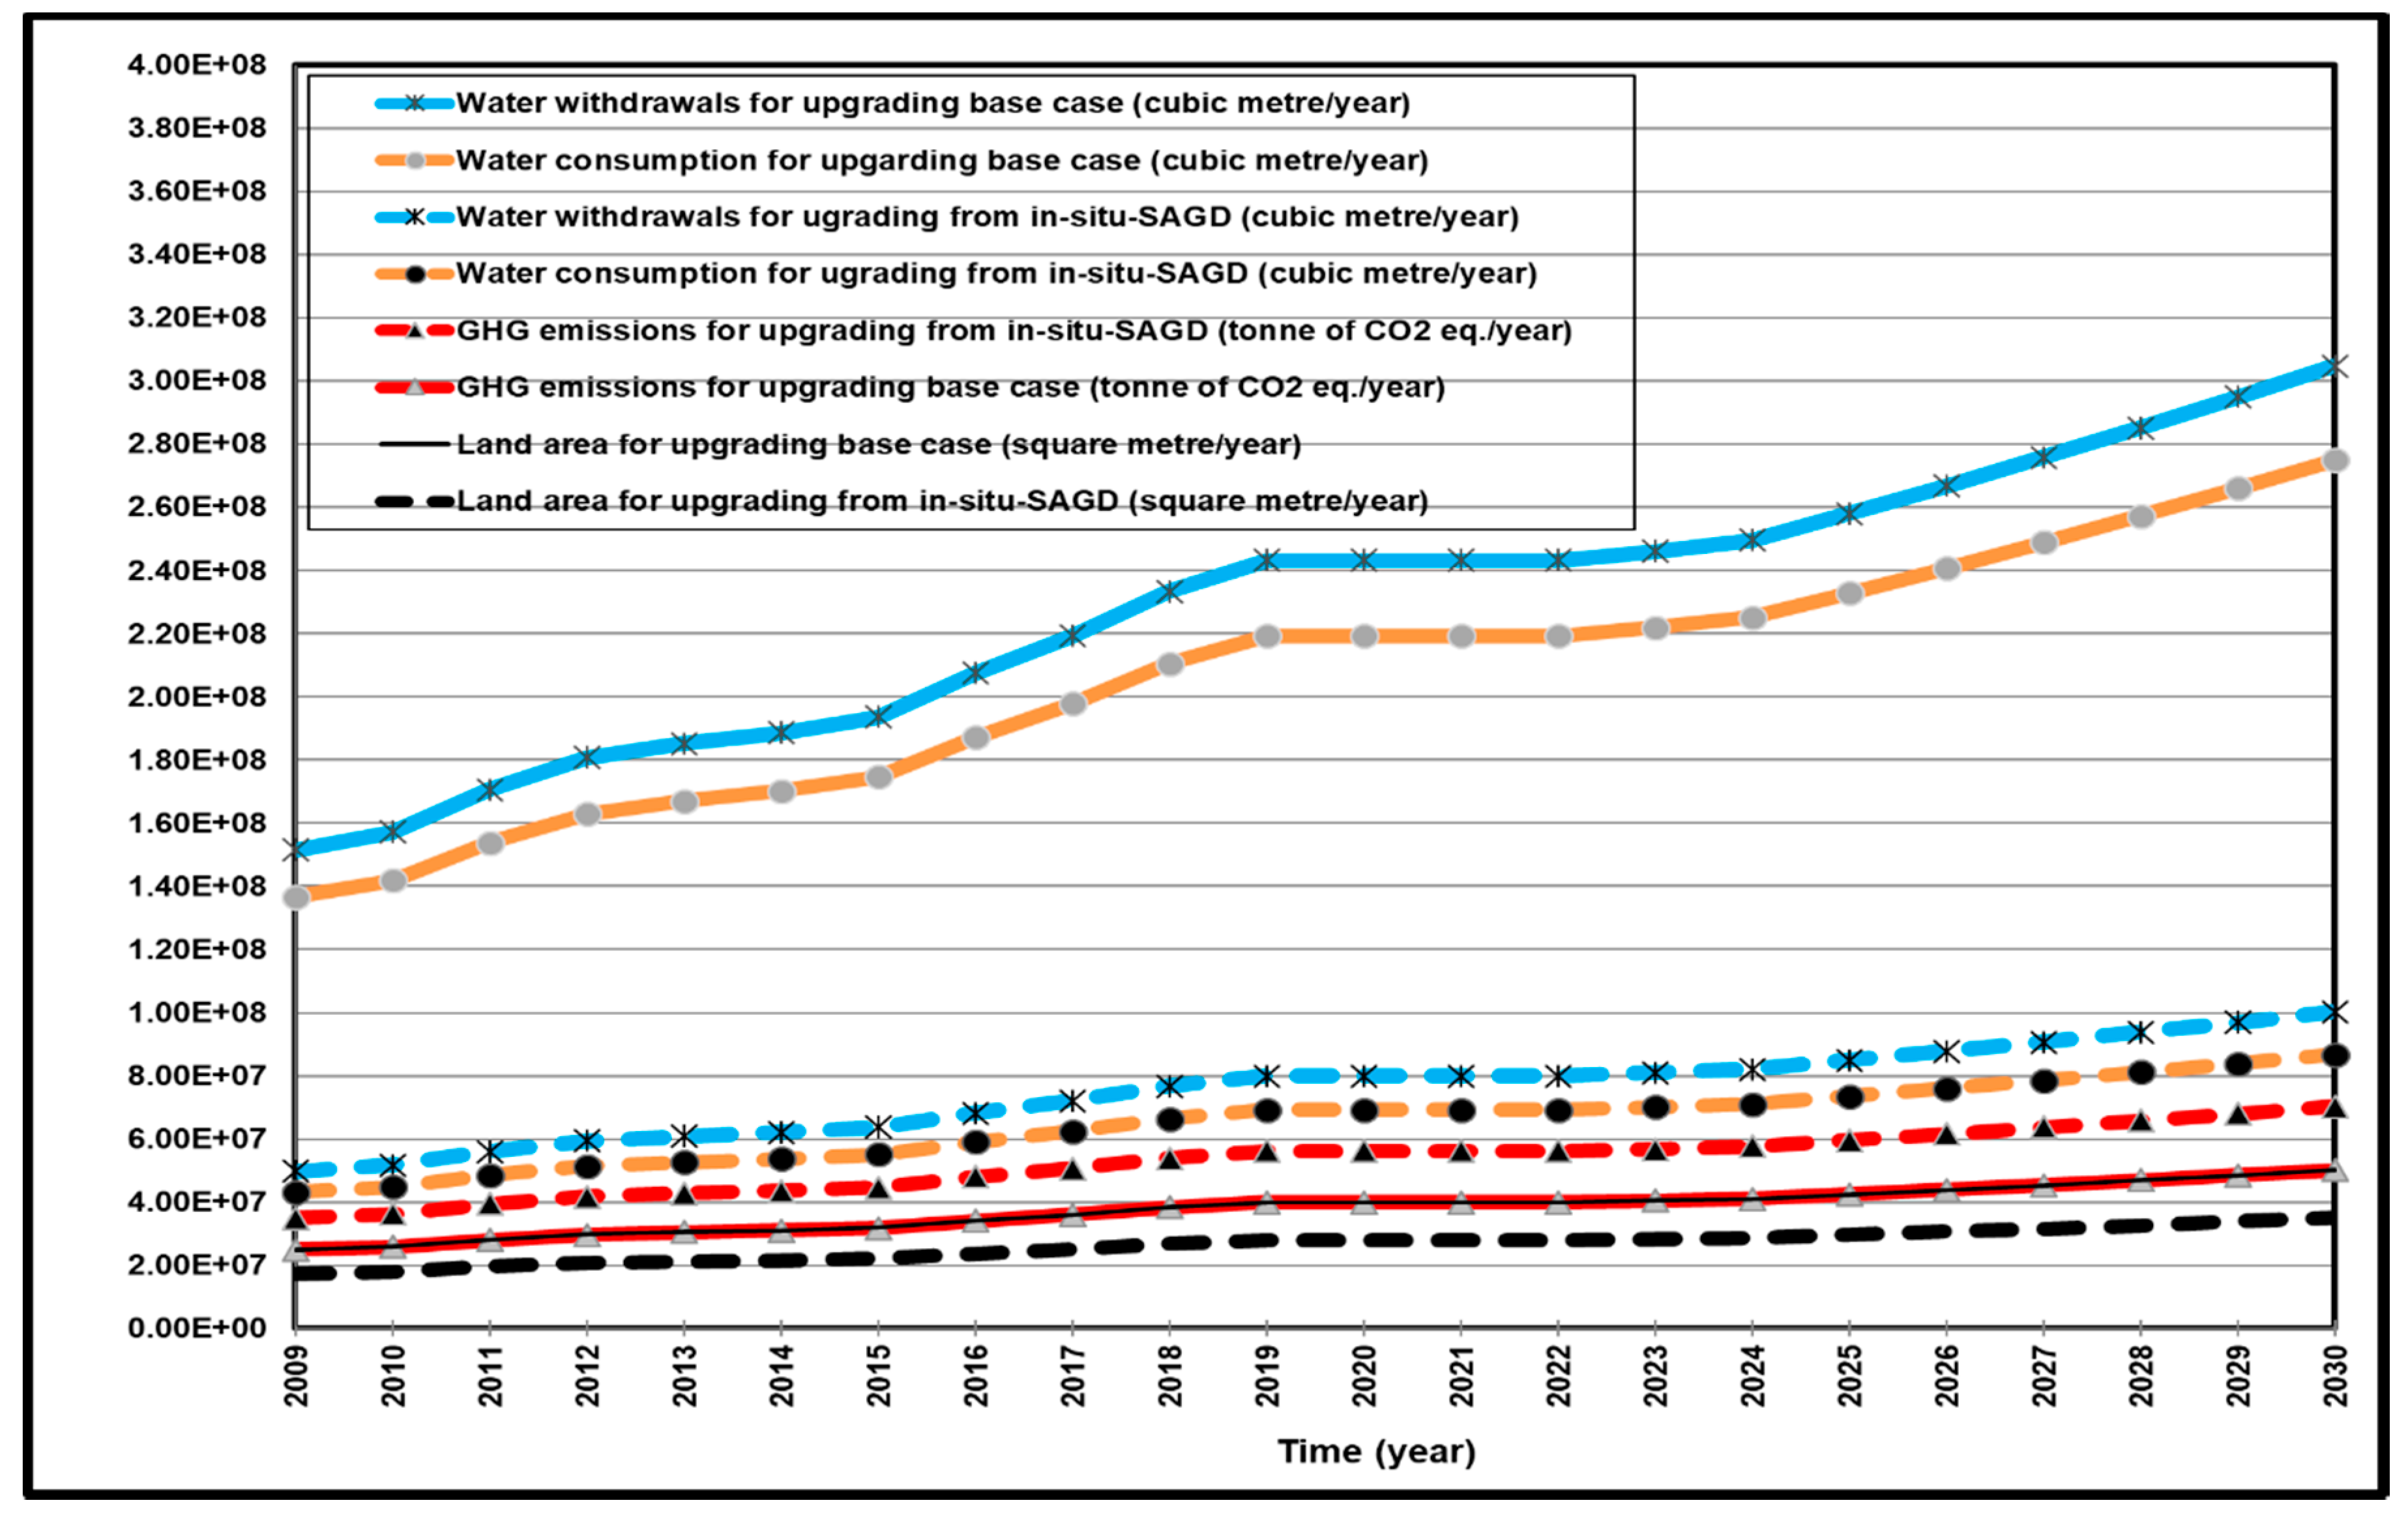
5.1. Effects of In-situ SAGD Pathway on Upgrading

The feedstock of oil sands to the upgraders in Alberta is shifted from surface mining to the in-situ SAGD recovery to study the resultant effects on the sustainability of this unit operation. The amount of upgraded oil sands and the difference in sustainability indicators (see Table 2) between surface mining (Pathway no. 16) and in-situ SAGD (Pathway no. 5) pathways play a significant role in determining the level of natural resources used and GHG emissions in this case. To cover the difference in COS between Pathway no. 5, and Pathway no. 16, an extra cost of 0.91 USD/bbl has to be incurred in this case. Figure 14 shows the impacts of shifting the upgrader feedstock in Alberta from surface mining to in-situ SAGD. Water and land would be saved in the case of in-situ-SAGD, and GHG emissions would always be higher than in the base case. Due to this feedstock shift and on an average basis, 68, 67, and 30% of water consumption, water withdrawals, and land area, respectively, would be saved. Against these savings in water and land use for oil sands upgrading, annual GHG emissions and COS would be increased on average by 40 and 3%, respectively.

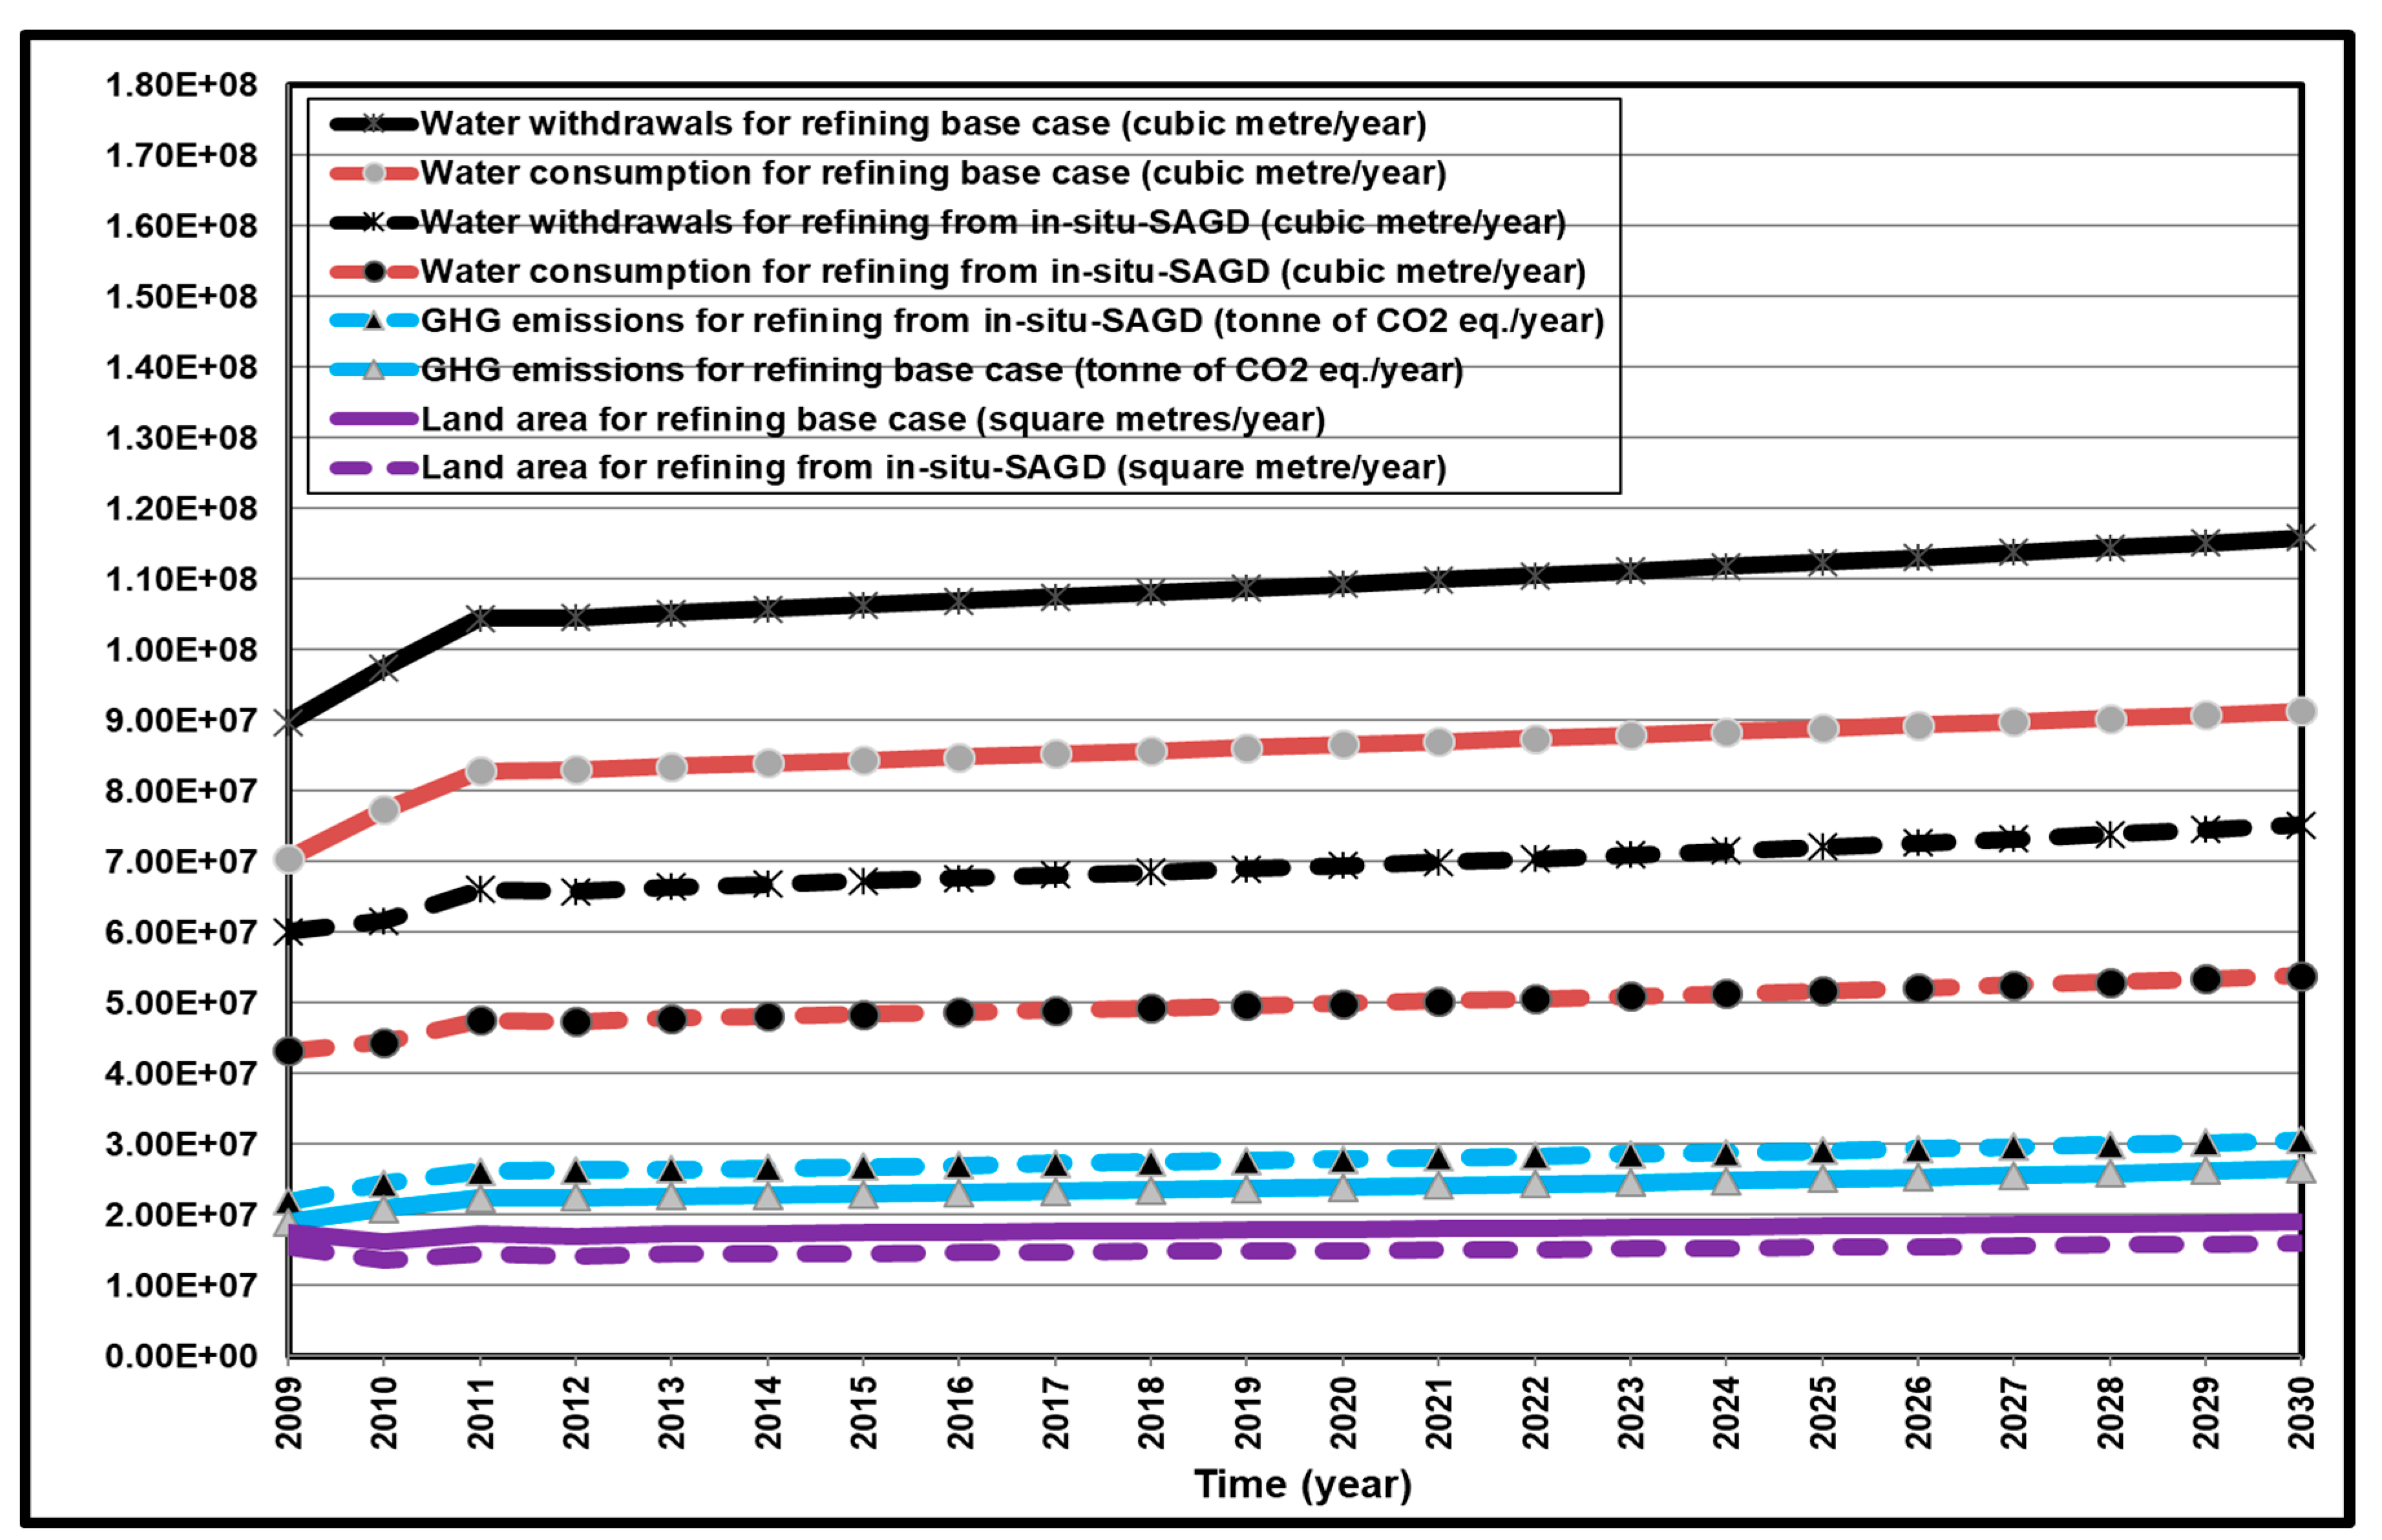
5.2. Effects of In-Situ SAGD Pathway on Refining

The feedstock to the refineries in Alberta comprised mainly of upgraded surface mining (Pathway no. 18) with a range of 57%–70% of the total input, and conventional oil (Pathway no. 9) with a range of 19%–39%. Some non-upgraded oil sands from in-situ recovery pathways are used as feedstock to the refineries in Alberta, as detailed in Figure 15, and considered for the base case in this study. This base case is kept with the same total amount of refined petroleum oil, and feedstock from surface mining (Pathway no. 18) is totally replaced by the upgraded in-situ SAGD (Pathway no. 12) to study the effects on the sustainability pillars. The average cost of supply (COSAV) is increased by 1% (from 44.19 USD/bbl to 44.81 USD/bbl), and the average GHG emission is 17% higher (increasing from 24.8 Mt of CO2 eq./year to 28.9 Mt of CO2 eq./year). Water demand and land use are reduced by 43% for water consumption, 37% for water withdrawals, and 17% for land area. Figure 16 shows the details of the impacts on water, land, and GHG emissions due to the shift in refining feedstock.

6. Conclusions

The extraction and processing of petroleum oil have different impacts on sustainability indicators. Non-upgraded oil sands recovered through in-situ SAGD (Pathway no. 1) has the lowest impacts on water demand and land use indicators compared to the eighteen developed pathways in this study, while its GHG emissions and cost of supply (COS) are in the fourth-lowest place compared to the all associated indicators. Recovery of crude oil through the conventional method has the lowest impact on GHG emissions and cost of supply (COS), and upgraded refined oil sands recovered through in-situ-CSS is at the other negative impact end of GHG emissions and COS. In-situ recovery of oil sands outperforms on the land use indicator (0.06 m2/bbl), and refined conventional crude oil has the greatest land use indicator of 0.178 m2/bbl.
Although the cost-effective scenario and sustainable-one scenario achieved the lowest impacts on GHG emissions and water demand, both are associated with low reliability due to their primary dependence on limited oil resources in Alberta. Sustainable-two scenario achieved moderate performance on water demand and land use with the most negative impacts on COS and GHG emissions. In contrast, sustainable-three had a modest effect on COS and GHG emissions with adverse effects on water demand and land use.
Shifting upgrader feedstock in Alberta from surface mining to in-situ-SAGD would save water and land accompanied by an average increase of 40 and 3% in GHG emissions and COS, respectively. Water and land would be saved from the same replacement in refining unit operations, and the corresponding increase in GHG emissions and COS would be 17 and 1%, respectively.

Funding

This research received no external funding.

Conflicts of Interest

The author declares that he has no known competing for financial interests or personal relationships that could have appeared to influence the work reported in this paper.

Nomenclature

bblbarrel equal to 42 U.S liquid gallon
bbl/bblbarrel of water per barrel of oil
bbl/daybarrel per day
CADCanadian Dollar
CLEWclimate, land, energy, and water
CO2carbon dioxide
COScost of supply for oil at the production facility gate
COSAVaverage cost of supply for oil at the production facility gate based on the period 2009–2030
CSScyclic steam stimulation
GHGgreenhouse gas
kg of CO2 eq./bblkilogram of carbon dioxide equivalent per barrel
LCAlife cycle assessment
Mt of CO2 eq./yearmegatonne of carbon dioxide equivalent per year
m2/bblsquare metre of land area per barrel of oil
SAGDsteam-assisted gravity drainage
SCOsynthetic crude oil
USDthe United States Dollar

References

  1. Canadian Association of Petroleum Producers (CAPP). 2019 Crude Oil Forecast, Markets and Transportation. Available online: https://www.capp.ca/wp-content/uploads/2019/11/338843.pdf (accessed on 25 May 2020).
  2. Alberta Energy. Energy: Annual Report 2018–2019. Available online: https://open.alberta.ca/dataset/cbd7147b-d304-4e3e-af28-78970c71232c/resource/29d5328f-c689-472a-b69e-9ffe0a3b77ba/download/energy-annual-report-2018-2019-web.pdf (accessed on 25 May 2020).
  3. Middleton, R.S.; Brandt, A.R. Using infrastructure optimization to reduce greenhouse gas emissions from oil sands extraction and processing. Environ. Sci. Technol. 2013, 47, 1735–1744. [Google Scholar] [CrossRef] [PubMed]
  4. Charpentier, A.D.; Bergerson, J.B.; MacLean, H.L. Understanding the Canadian oil sands industry’s greenhouse gas emissions. Environ. Res. Lett. 2009, 4, 014005. [Google Scholar] [CrossRef]
  5. Nimana, B.; Canter, C.; Kumar, A. Life cycle assessment of greenhouse gas emissions from Canada’s oil sands-derived transportation fuels. Energy 2015, 88, 544–554. [Google Scholar] [CrossRef]
  6. Bergerson, J.A.; Kofoworola, O.; Charpentier, A.D.; Sleep, S.; MacLean, H.L. Life cycle greenhouse gas emissions of current Oil Sands Technologies: Surface mining and in situ applications. Environ. Sci. Technol. 2012, 46, 7865–7874. [Google Scholar] [CrossRef] [PubMed]
  7. Nimana, B.; Canter, C.; Kumar, A. Energy consumption and greenhouse gas emissions in the recovery and extraction of crude bitumen from Canada’s oil sands. Appl. Energy 2015, 143, 189–199. [Google Scholar]
  8. Lunn, S. Water use in Canada’s oil-sands industry: The facts. SPE Econ. Manag. 2013, 5, 17–27. [Google Scholar] [CrossRef]
  9. Zubot, W.; MacKinnon, M.D.; Chelme-Ayala, P.; Smith, D.W.; Gamal El-Din, M. Petroleum coke adsorption as a water management option for oil sands process-affected water. Sci. Total Environ. 2012, 427, 364–372. [Google Scholar]
  10. Kim, Y.J.; Hipel, K.W.; Bowman, C.W. Water security problems in Canada’s oil sands. Can. Water Resour. J. 2013, 38, 61–72. [Google Scholar] [CrossRef] [Green Version]
  11. Small, C.C.; Cho, S.; Hashisho, Z.; Ulrich, A.C. Emissions from oil sands tailings ponds: Review of tailings pond parameters and emission estimates. J. Pet. Sci. Eng. 2015, 127, 490–501. [Google Scholar]
  12. Jordaan, S.M.; Keith, D.W.; Stelfox, B. Quantifying land use of oil sands production: A life cycle perspective. Environ. Res. Lett. 2009, 4, 024004. [Google Scholar]
  13. Welsch, M.; Hermann, S.; Howells, M.; Rogner, H.H.; Young, C.; Ramma, I.; Bazilian, M.; Fischer, G.; Alfstad, T.; Gielen, D.; et al. Adding value with CLEWS—Modelling the energy system and its interdependencies for Mauritius. Appl. Energy 2014, 113, 1434–1445. [Google Scholar] [CrossRef]
  14. Hermann, S.; Welsch, M.; Segerstrom, R.E.; Howells, M.I.; Young, C.; Alfstad, T.; Rogner, H.H.; Steduto, P. Climate, land, energy and water (CLEW) interlinkages in Burkina Faso: An analysis of agricultural intensification and bioenergy production. Nat. Resour. Forum 2012, 36, 245–262. [Google Scholar] [CrossRef]
  15. Pembina Institute. Mining vs in Situ. Fact Sheet. Available online: http://pubs.pembina.org/reports/mining-vs-in-situ.pdf (accessed on 25 May 2020).
  16. Jordaan, S.M. Land and water impacts of oil sands production in Alberta. Environ. Sci. Technol. 2012, 46, 3611–3617. [Google Scholar] [CrossRef] [PubMed]
  17. Ali, B.; Kumar, A. Development of life cycle water footprints for oil sands-based transportation fuel production. Energy 2017, 131, 41–49. [Google Scholar] [CrossRef]
  18. Ali, B.; Kumar, A. Life cycle water demand coefficients for crude oil production from five North American locations. Water Res. 2017, 123, 290–300. [Google Scholar]
  19. Ali, B. A methodology for the sustainability of power generation through integration of impacts on water, air, land, and cost. Resour. Conserv. Recycl. 2020, 158, 104830. [Google Scholar] [CrossRef]
  20. Burkhard, J.; Forrest, J.; Gross, S. Oil Sands, Greenhouse Gases, and European Oil Supply: Getting the Numbers Right. Available online: http://a1024.g.akamai.net/f/1024/13859/1d/ihsgroup.download.akamai.com/13859/ihs/cera/Oil-Sands-Greenhouse-Gases-and-European-Oil-Supply.pdf (accessed on 25 May 2020).
  21. Cai, H.; Brandt, A.R.; Yeh, S.; Englander, J.G.; Han, J.; Elgowainy, A.; Wang, M.Q. Well-to-wheels greenhouse gas emissions of Canadian oil sands products: Implications for U.S. petroleum fuels. Environ. Sci. Technol. 2015, 49, 8219–8227. [Google Scholar]
  22. Brandt, A.R. Variability and uncertainty in life cycle assessment models for greenhouse gas emissions from Canadian oil sands production. Environ. Sci. Technol. 2012, 46, 1253–1261. [Google Scholar] [CrossRef]
  23. Rahman, M.M.; Canter, C.; Kumar, A. Greenhouse gas emissions from recovery of various North American conventional crudes. Energy 2014, 74, 607–617. [Google Scholar]
  24. Yeh, S.; Jordaan, S.M.; Brandt, A.R.; Turetsky, M.R.; Spatari, S.; Keith, D.W. Land use greenhouse gas emissions from conventional oil production and oil sands. Environ. Sci. Technol. 2010, 44, 8766–8772. [Google Scholar] [CrossRef]
  25. National Energy Board (NEB). Canada’s Oil Sands: Opportunities and Challenges to 2015: An Update. Available online: https://pdf4pro.com/view/canada-s-oil-sands-neb-one-gc-ca-3afda4.html (accessed on 25 May 2020).
  26. Alberta Energy Regulator (AER). Alberta’s Energy Reserves 2014 and Supply/Demand Outlook 2015-2024. ST98-2015. Available online: http://www.aer.ca/documents/sts/ST98/ST98-2015.pdf (accessed on 25 May 2020).
  27. Cenovus Energy. Delivering Value in a Volatile Market. Available online: http://www.cenovus.com/invest/docs/corporate-update.pdf (accessed on 13 May 2016).
  28. Sturgeon Refinery. Available online: https://nwrsturgeonrefinery.com/news/north-west-sturgeon-refinery-costs-leveling-at-8-5-billion/ (accessed on 25 May 2020).
  29. Leach, A. Why Building a Massive Oil Sands Refinery would be a Bad Idea; Macleans: Toronto, ON, Canada, 8 October 2014; Available online: http://www.macleans.ca/economy/economicanalysis/why-building-a-massive-oil-sands-refinery-would-be-a-bad-idea/ (accessed on 25 May 2020).
  30. Ali, B. Forecasting model for water-energy nexus in Alberta, Canada. Water-Energy Nexus 2018, 1, 104–115. [Google Scholar]
  31. Alberta Energy Regulator (AER). Alberta Energy Outlook. Available online: http://www1.aer.ca/st98/2019/data/executive-summary/ST98-2019-Executive-Summary-May-2019.pdf (accessed on 25 May 2020).
Figure 1. Petroleum oil extraction pathways in Alberta.
Resources 09 00062 g001
Figure 2. Oil sands upgrading and oil refining pathways in Alberta.
Resources 09 00062 g002
Figure 3. Input constraints for the cost-effective scenario based on the business-as-usual scenario.
Resources 09 00062 g003
Figure 4. Description of the conducted scenarios. 1 Pathways are based on the business-as-usual scenario.
Resources 09 00062 g004
Figure 5. Profiles for petroleum oil production in Alberta for the cost-effective scenario.
Resources 09 00062 g005
Figure 6. Impacts of the cost-effective scenario on water, land, and GHG emissions in Alberta.
Resources 09 00062 g006
Figure 7. Impacts of the sustainable-one scenario on water, land, and GHG emissions in Alberta.
Resources 09 00062 g007
Figure 8. Profiles for petroleum oil production in Alberta for the sustainable-two scenario.
Resources 09 00062 g008
Figure 9. Impacts of the sustainable-two scenario on water, land, and GHG emissions in Alberta.
Resources 09 00062 g009
Figure 10. Profiles for petroleum oil production in Alberta for the sustainable-three scenario.
Resources 09 00062 g010
Figure 11. Impacts of the sustainable-three scenario on water, land, and GHG emissions in Alberta.
Resources 09 00062 g011
Figure 12. Trend of cost of supply for the petroleum-oil extraction scenarios in Alberta.
Resources 09 00062 g012
Figure 13. Comparative impacts of scenarios on natural resources, GHG emissions, and cost of supply in Alberta.
Resources 09 00062 g013
Figure 14. Impacts of shifting upgrading feedstock from surface mining to in-situ SAGD in Alberta.
Resources 09 00062 g014
Figure 15. Profiles of the base case for the pathways of feedstock to refining in Alberta.
Resources 09 00062 g015
Figure 16. Impacts of shifting refining feedstock from surface mining to in-situ SAGD in Alberta.
Resources 09 00062 g016
Table 1. Input data for greenhouse gas (GHG) emissions, land use, and cost of supply (COS) 1 indicators.
TechnologyExtractionUpgradingRefining
GHG Emissions (kg of CO2 eq./bbl)Land Use (m2/bbl)Cost of Supply (USD/bbl)GHG Emissions (kg of CO2 eq./bbl) 2Land Use (m2/bbl)Cost of Supply (USD/bbl) 3GHG Emissions (kg of CO2 eq./bbl) 4Land Use (m2/bbl)5Cost of Supply (USD/bbl) 6
Oil sands-Surface mining 330.087 817.2 1156.10.00217.2187.10.00216.39
Oil sands-In-situ-SAGD690.060 9 18.12 1256.10.00217.2187.10.00216.39
Oil sands-In-situ-CSS 830.060 9 19.93 1356.10.00217.2187.10.00216.39
Oil sands-In-situ-Primary17.5 70.060 915.18 1456.10.00217.2153.1 70.00216.39
Conventional oil 17.5 70.176 1012.28 150.00.0000.0053.1 70.00216.39
1 All costs in this study were harmonized at the 2014 average exchange rate of 0.906 USD/CAD [26]. 2 Crude transport of 9.1 kg of CO2 eq./bbl was added to the upgrading unit operation [20]. 3 Based on the average value with a range of 16.30–18.12 USD/bbl [25]. 4 Refined product distribution of 2.1 kg of CO2 eq./bbl was added to the refining unit operation [20]. 5 Refining is assumed with the same land use indicator for upgrading, with the units converted from m2/m3 SCO as in [24] to m2/bbl. 6 The operating cost for the refining is taken as 7.70 USD/bbl based on the average from Cenovus costs in 2014 [27] with a range of 7.25–8.15 USD/bbl, and the capital cost is taken as 8.69 USD/bbl based on the average value for the refineries in Alberta [28,29]. 7 Average was considered for the Canadian heavy and light crudes [20]. 8 Based on the best estimate for surface mining, including upstream natural gas mining and upgrading [24]. 9 Based on the best estimate for in-situ, including upstream natural gas mining and upgrading [24]. 10 Based on the area disturbed and the associated oil produced in the historical impacts of supporting information Table S2 [24]. 11 Based on the average value with a range of 16.30–18.12 USD/bbl [25]. 12 Based on the average value with a range of 16.30–19.93 USD/bbl [25]. 13 Based on the average value with a range of 18.12–21.74 USD/bbl [25]. 14 Based on the average value for cold production from Wabasca, Seal, and cold heavy oil production with sand from Cold Lake with a range of 12.68–17.21 USD/bbl [25]. 15 Based on the weighted average value for 13 production locations in Alberta with a range of 6.00–20.27 USD/bbl [26].
Table 2. Sustainable indicators for petroleum oil production pathways in Alberta.
No.PathwayWater Consumption (bbl/bbl)Water Withdrawals (bbl/bbl)COS (USD/bbl)GHG Emissions (kg of CO2 eq./bbl)Land Use (m2/bbl)
1In-situ-SAGD-Non-upgraded0.300.3318.1269.00.060
2Conventional crude oil-Unrefined0.600.6512.2817.50.176
3In-situ-Primary-Non-upgraded0.600.6515.1817.50.060
4In-situ-CSS-Non-upgraded0.680.7419.9383.00.060
5In-situ-SAGD-Upgraded0.971.1235.33125.10.062
6In-situ-Primary-Upgraded1.271.4432.3973.60.062
7In-situ-CSS-Upgraded1.351.5337.15139.10.062
8In-situ-SAGD-Non-upgraded-Feedstock to refinery1.412.0734.51156.10.062
9Conventional crude oil-Refined1.702.4028.6770.60.178
10In-situ-Primary-Non-upgraded-Feedstock to refinery1.702.4031.5670.60.062
11In-situ-CSS-Non-upgraded-Feedstock to refinery1.792.4936.32170.10.062
12In-situ-SAGD-Upgraded-Refined2.082.8751.72212.20.064
13In-situ-Primary-Upgraded-Refined2.373.1948.78126.70.064
14Surface mining-Non-upgraded2.412.6217.21330.087
15In-situ-CSS-Upgraded-Refined2.453.2853.53226.20.064
16Surface mining-Upgraded3.083.4134.4389.10.089
17Surface mining-Non-upgraded-Feedstock to refinery3.514.3633.60120.10.089
18Surface mining-Upgraded-Refined4.185.1550.82176.20.091

