1. Introduction
Pig production has always been the key and traditional livestock industry in Vietnam. From 2017 to 2018, Vietnam ranked in the top 10 countries in the world in terms of pork production and consumption [
1,
2]. Pig production in Vietnam is mainly concentrated in the provinces of the Red River Delta, Midland and Northern Mountain, North Central and the Central, and Mekong River Delta with 29%, 19%, 19%, and 13% respectively. Dong Nai, Hanoi, Bac Giang are the provinces with the highest number of pigs in Vietnam, ranging from 1 to 2 million heads in 2017 [
3].
While, on average, the number of pigs per farm was 2000 [
4], in recent years, Vietnam livestock production has rapidly shifted from small-scale livestock production to large-scale concentrated farms. Currently, large-scale pig farms account for 35% of the total pig heads, contributing to 43% of the total production, and this trend is expected to increase in the future [
4].
As a consequence of this trend, poor manure management has become one of the major sources of agriculture GHG [
5]. Carbon dioxide (CO
2), methane (CH
4), and nitrous oxide (N
2O) are the three major GHG emissions from livestock into the atmosphere [
6,
7]. CH
4 and N
2O are 25 and 298 times more powerful GHGs than CO
2, respectively, if considered over a time span of 100 years [
8,
9]. Vietnam GHG inventory shows that GHG emissions from manure management account for 8.6 Mt CO
2e. It also shows that the sub-sector of pig manure management is one of the 32 major emission sources of the country. Moreover, pig production is the largest source of agricultural waste accounting for 24.96 million tons [
10]. These negative trends will continue if appropriate measures are not properly implemented.
The Vietnam Government has put in significant efforts to address this problem. One of the most important measures is a program to promote biogas development. Under this program, the government set a target to promote biogas from manure and reach 45% of the total manure discharge by 2020. The potential for biogas is huge with an annual discharge of about 85 million tons of livestock wastes. However, biogas production in Vietnam so far has been largely funded by non-governmental organizations and limited to small-scale production developed across the country with more than 1 million facilities. While medium and large-scale farms have started to build different types of biogas plants, currently only 0.3%, out of 17,000 farms across the country utilize waste to produce biogas [
11]. In practice, there is a huge gap between the actual situation regarding biogas plant implementation and the government target.
Until now, there is only a biogas production facility for electricity generation in the pig farm under a company in Binh Duong province. This facility has a total installed capacity of 17,000 m
3 (equal to 2 MW). Other facilities are designed only for the production of biogas to replace fuel oil for cooking or coal for distillation. Excess gas is burned away or discharged directly into the environment [
12].
Since 2010, the government has issued many policies to encourage investment in the field of renewable energy (RE) with the goal to increase the total renewable energy up to 4.5% of the country’s energy demand [
13]. The National Energy Development Strategy has implemented a development strategy for the energy sector, including coal, oil and gas, electricity, and renewable energy (RE) based on 2020 with a vision to 2050. Accordingly, the goal is to increase the share of RE, including biogas, to approximately 5% in 2020 and 11% in 2050 [
12]. In 2016, Vietnam’s Nationally determined contributions (NDCs) set a goal to reduce its greenhouse gas emissions by 8% by 2030 unconditionally and by 25% with international support [
14].
In order to support effectively the policy-making processes in Vietnam, it is necessary to research and assess properly the actual potential of bio-energy resources. Based on this assessment, the government can introduce mechanisms and policies to subsidize the purchase of output electricity produced from bio-energy. By proposing a viable method to find out the optimal potential and suitable location for biogas facilities, this study will contribute to the implementation of appropriate mechanisms and policies.
In order to increase biogas production and its effectiveness in Vietnam, it is important to identify optimal locations for biogas plants considering geographic and environmental feasibility, transportation distance, and socio-economic conditions. The Geographic Information System (GIS) is a powerful tool that can help us manage geographical data and spatial factors tool and hence help us identify the optimal locations for the sitting and installation of biogas plants.
There are many previous studies that have employed the GIS as a useful tool for decision making on resources management, suitability, and optimization analysis in many countries and regions [
15,
16,
17,
18,
19,
20]. Samira Zareei [
20] used information on population, land-use maps, and the GIS to develop a model for the evaluation of biogas production from livestock manure and rural household waste and identified the optimal locations for biogas plants in Iran. J. Höhn et al. [
21] applied the GIS methodology to analyze the spatial distribution and amount of potential biomass feedstock and to find the most suitable locations for biogas plants by the optimization of transportation distance in southern Finland. Sliz-Szkliniarz et al. [
18], for instance, determined the optimal sites for installing anaerobic digesters (AD) by applying the GIS model with the focus on animal manure and co-substrates in Poland. Perpiña et al. [
22] and Silva et al. [
23] conducted a multi-criteria assessment in GIS environments with the analytic hierarchies process (AHP) for identifying suitable sites for the construction of biomass plants. Hali Akinci et al. [
24] also used the GIS and AHP techniques for determining suitable lands for agriculture use in the Yusufeli district, Turkey. K. Laasasenaho [
25] identified potential bioenergy areas and optimized biomass transportation and plant size by using a combined approach with R software and tools in the GIS. Sedat Yalcinkaya Izmir [
26] found out potential plant sites based on a location-allocation analysis in the GIS to investigate the location, sizes, and transportation cost in Izmir, Turkey. The unit cost of electric energy and the existing feed-in tariff for biogas plants were compared. Mohamed Mahmoud Ali et al. [
27] applied the GIS to show the amount of waste, the potential of biogas, and the equivalent energy amount in African countries. This revealed that the revenues from the sale of biogas-generated electricity and digested slurry could pay for the initial investment for 6.5 years without subsidy. Valenti et al. [
28] applied the GIS in combination with a techno-economic assessment to determine the size and location of four biogas plants and evaluate that the system satisfied 27% of the total agricultural electricity demand with a discounted payback period of fewer than 6.5 years for the biogas power generation system. Kamalakanta Sahoo et al. [
29] developed a GIS-based model with multi-criteria analysis to study the availability of sustainable crop residues, identify suitable sites, and optimal sitting of biogas plants. Scarlat et al. [
15] used a spatial assessment of biogas potential of farm manure with a 1 km threshold in the Europe level. Mohamed [
30] assessed land suitability and capability by combining the GIS and remote sensing for agriculture in Chamarajanagar, India for better land-use options. Sorda et al. [
31] simulated spatially to evaluate potential diffusion of biogas technology based on the current financial scheme for electricity to make investment decisions coupled with GIS data. For studies regarding spatial optimization regarding GHG emissions, there is a study that used a GIS-based estimation of the fixed CO
2 in tree biomass in the Neyyar Wildlife Sanctuary in Western Ghats, India [
32]. Another study uses the GIS to model CO
2 emissions with the commute of pupils in the UK [
33]. The study on finding optimal location of biogas plants from animal manure to reduce travel costs for supply chains in North Dakota also is a good reference for spatial optimization regarding cost reduction [
33,
34].
Several approaches from these studies were used in this paper to facilitate implementing biogas plants with optimization of pig manure management to generate biogas power in Hanoi, Vietnam. However, to the best of our knowledge, no study has applied the GIS approach by taking into consideration both the statistical cluster analysis to allocate feedstock sources to potential plant options and mentioning the effectiveness of biogas production regarding the calculation of net GHG emissions.
This study aimed to simultaneously optimize potential biogas production and reduce GHG emissions from pig manure. With the help of the GIS, we not only identified the ideal locations of biogas plants but also determined the scale of such plants, taking into consideration GHG emissions reduction.
The specific objectives of this study are to (i) analyze the spatial distribution and amount of the potential biogas production from pig manure; (ii) identify suitable locations for biogas plants based on geographic and emission reduction feasibility and socio-economic criteria; (iii) evaluate potential benefits of introducing biogas production to satisfy the electricity demand and reduce GHG emissions.
The paper is organized as follows:
Section 1 provides the research background on pig production and manure, its environmental impacts, environment, and energy policies’ requirements, and the importance of GIS application.
Section 2 provides details of the study area.
Section 3 explains in detail the GIS tools, AHP analysis, and mathematic equations used in the methodology.
Section 4 delves into results and discussion of the proposed scenarios and
Section 5 highlights the conclusion while coupling the research outcomes with policy implications to promote the development of biogas utilization in Vietnam.
3. Materials and Methods
This study comprises the assessment of potential biogas production from pig manure. The study first applied a site suitability analysis to identify available locations for the sitting of biogas plants by (i) analyzing geographic criteria to restrict sensitive areas, (ii) considering socio-economic factors with the Analytic Hierarchy Process to identify suitable areas in line with those factors, (iii) intersecting the restriction map and the suitability map to obtain the final suitability map with available areas for sitting biogas plants. The study then estimated biogas production capacity for pig farms and carried out a cluster analysis to identify spatially statistically significant clusters with a high density of potential biogas production and minimization of distance among them by Spatial Analysis. After that, the study designed a baseline scenario and proposed three other scenarios based on farm scale within the selected clusters of farms in order to optimize the available input manure and the potential output capacity. From here, the location, number, scale, and capacity of biogas plants for each of the proposed scenarios were determined. Finally, the study calculated the net greenhouse gas emissions including methane, nitrous oxide (from manure decomposition), and avoided carbon dioxide (from electricity generation from biogas) for each scenario and compared them with the baseline scenario. The details of the research framework are summarized in
Figure 2. All the spatial analyses were performed using ArcGIS software version 10.6 (Environmental Systems Research Institute, New York, NY, USA). Livestock related data were collected from the Department of Livestock Production of the Vietnam Ministry of Agriculture and Rural Development and the Livestock Production Center of the Hanoi Department of Agriculture and Rural Development. Spatial data were collected from the Hanoi Urban Planning Institute of the Hanoi People Committee.
3.1. Suitability Analysis
Suitability analysis is used to determine the appropriateness of a given area for a particular use. Suitability analysis is usually done through an intersection of social, ecological, economic, physical, biological, or other criteria. The results are often displayed on a spatial distribution map that is used to highlight areas from high to low suitability. Suitability analysis uses Equation (1) [
36] as below:
where
Wi: Weights for Criteria i
Ci = Criteria for Selectivity analysis
i are roads, elevation and flood area
Rj: Restriction area
j are transportation networks including roads and railways; land use including residential houses, public buildings, bridges, water stations, pump stations, electric stations, bus stations; surface water including rivers, lakes, canals; protected areas including national parks and important places such as airports.
3.1.1. Restriction Analysis
Restricted areas are those areas we have to avoid during the development of biogas plants. In the spatial analysis, it is necessary to restrict some layers, which could interfere with the development of the biogas project. It is a very important requirement for every planning project. Restricted areas can be identified based on a modified version of Ma et al., 2015, as shown in Equation (2).
where
R: Restriction area
Rj: restriction criteria such as transportation networks including roads and railways; land use including residential houses, public buildings, bridges, water stations, pump stations, electric stations, bus stations; surface water including rivers, lakes, canals; protected areas including national parks and important places such as airports.
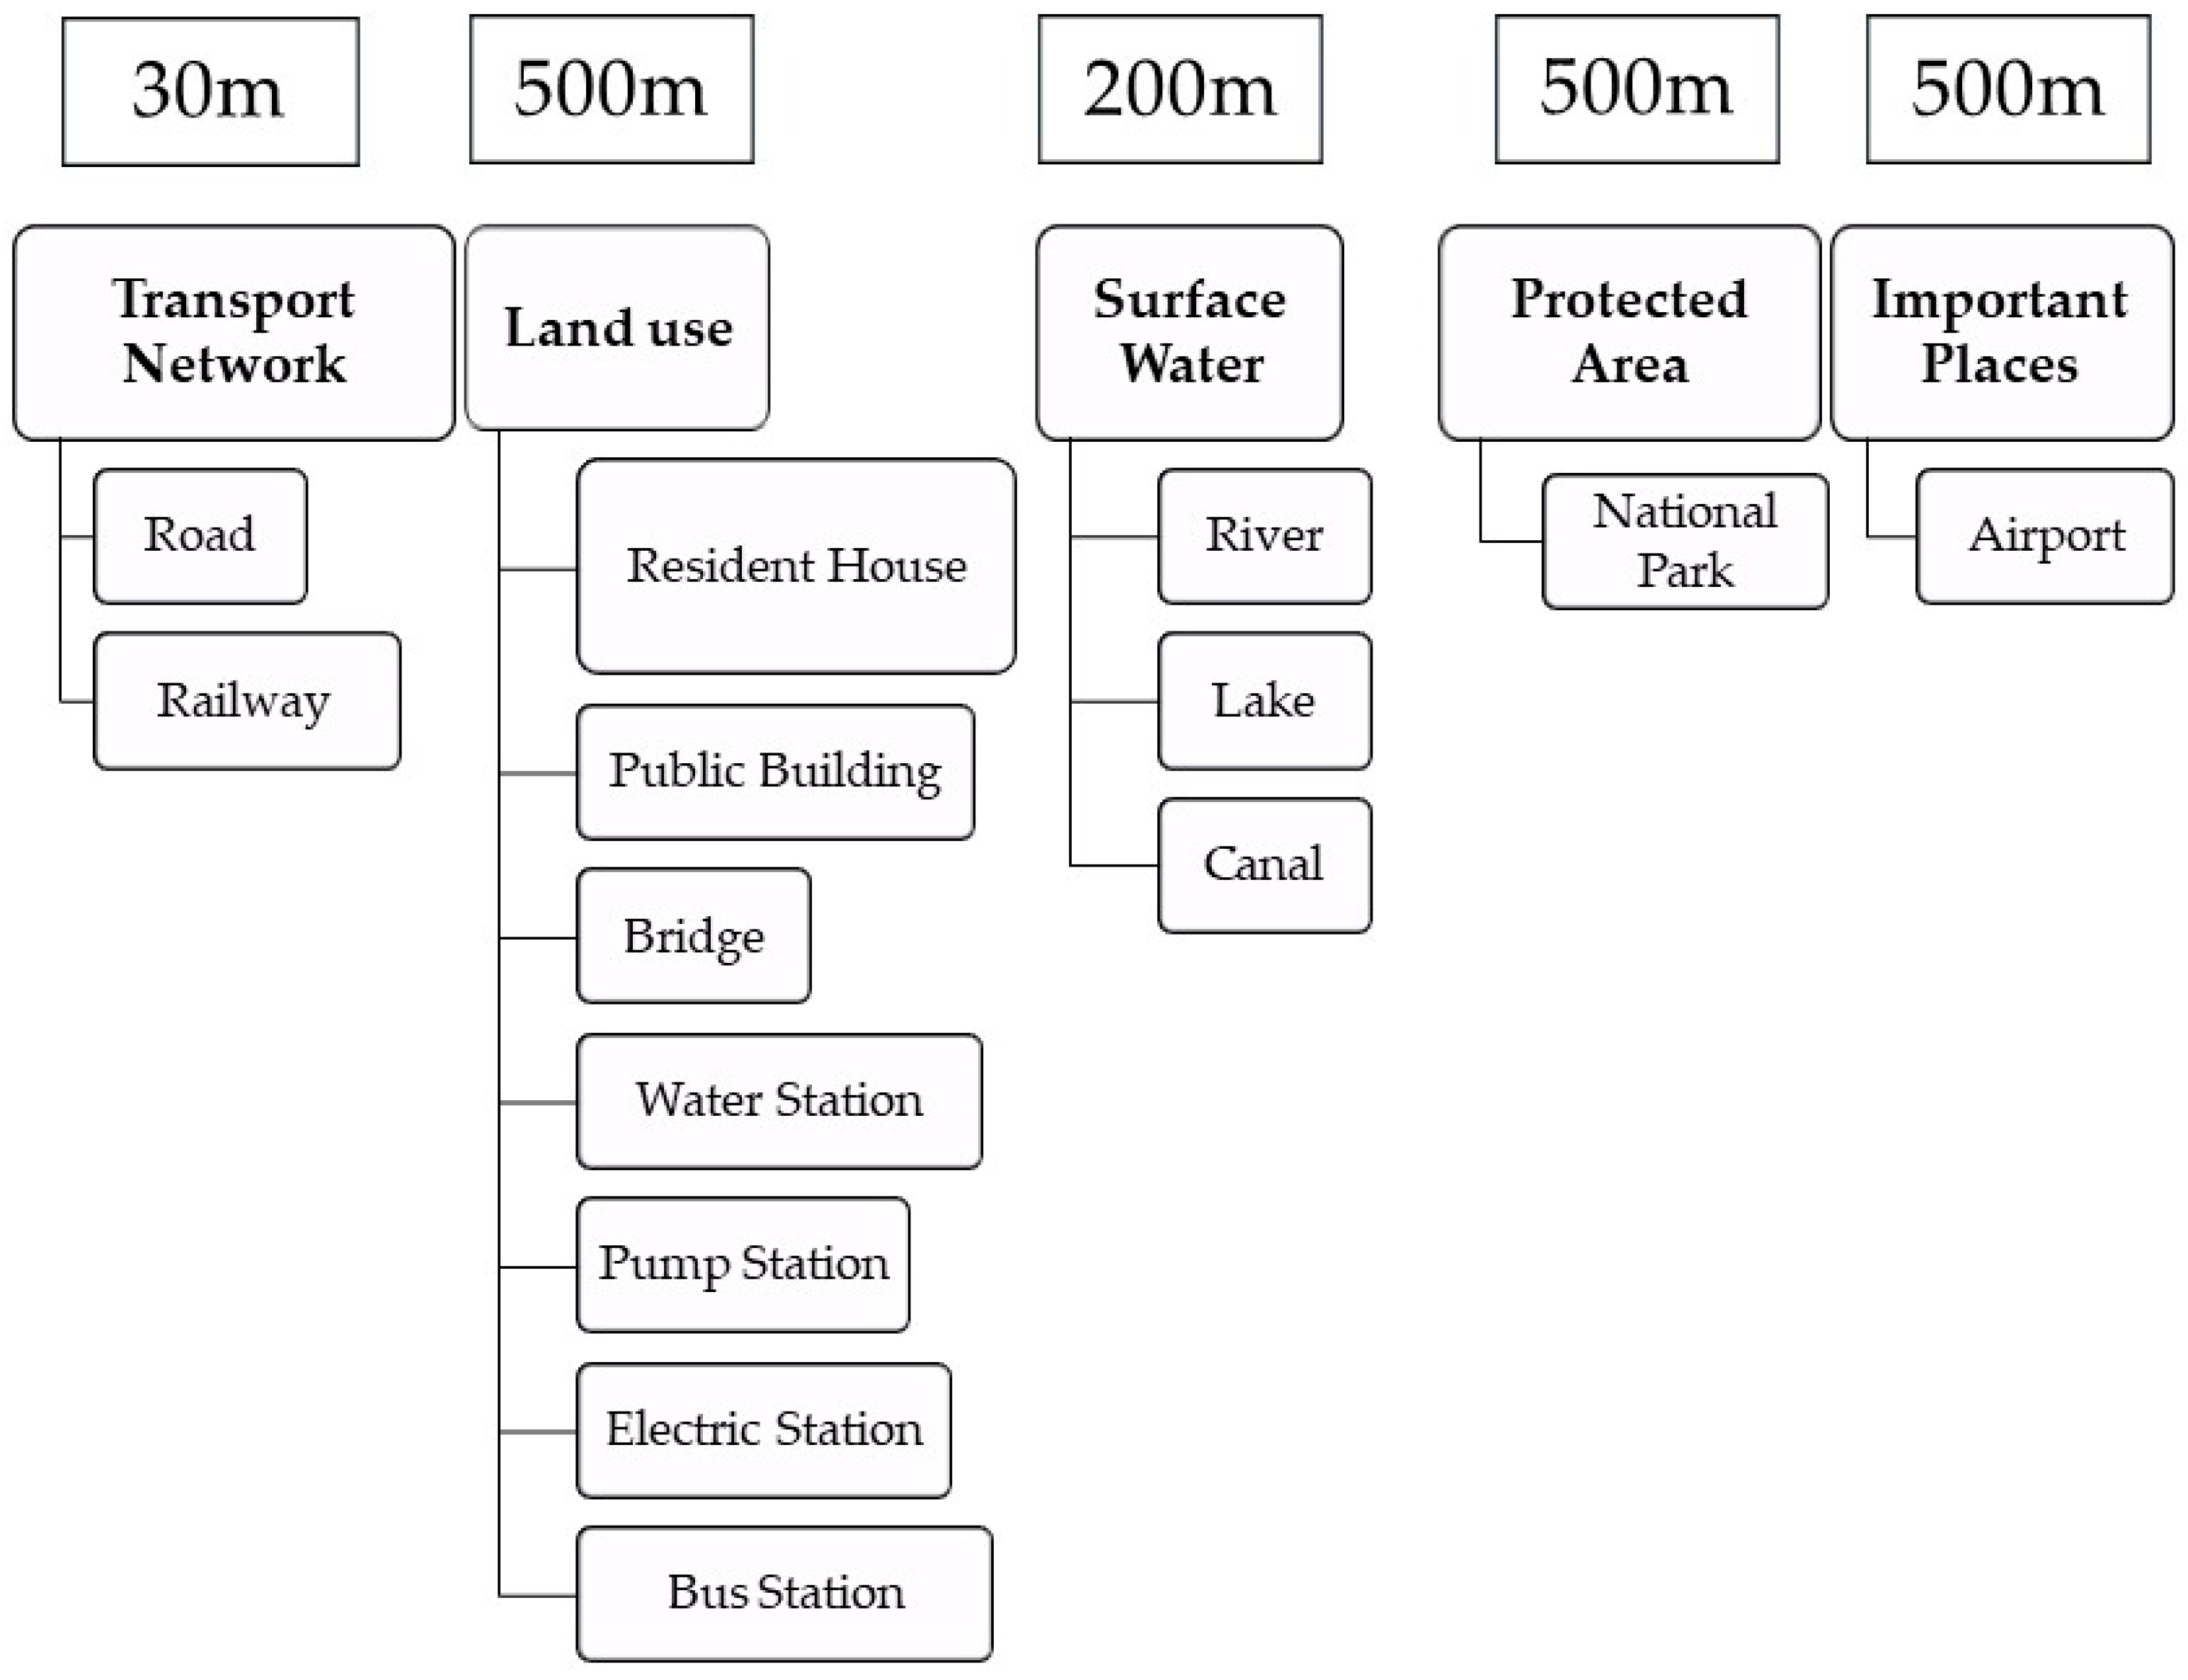
Restriction procedure includes some important steps: (i) identify restriction criteria; (ii) make buffers for the restricted areas; (iii) convert them to raster; (iv) combine all restriction factors to obtain the restriction map.
Figure 3 details the restriction criteria used in the study.
The buffer criteria for different restriction factors used in this research are based on the national standards of construction of buildings, commercial infrastructure, and secondary literature sources from previously published studies. Several secondary literature sources were referenced to find out the suitable distance for making buffers of all mentioned layers for restriction analysis as in
Table 1 [
20,
22,
37,
38,
39,
40].
The spatially referenced vector layers were processed using the tools from the Extract, Overlay, Proximity toolboxes in order to produce a map illustrating restricted areas for biogas development and to determine optimal zones.
After that, in order to convert any feature class (polyline, or point) to a raster, conversion tools in ARCTool box were used. The outputs are maps with one value for the restricted area and one value for the available area. Lastly, all detailed restriction maps were combined to obtain the overall restriction map by multiplying the final raster maps with the raster calculator in Spatial Analyst Tools.
3.1.2. Selectivity Analysis
Selectivity analysis is used to rank and score sites based on multiple weighted criteria. Selectivity analysis can be obtained based on Equation (3).
where
Wi: Weights for Criteria i
Ci = Criteria for Selectivity analysis
i are roads, elevation and flood areas
For this study, three criteria of the suitability of locations of biogas plants including elevation, road network distance, and flooding area distance are taken into consideration. As far as elevation is concerned, a lower elevation is the better option to optimize collection and transportation. It is ideal to sit the biogas plants in low lands and hilly high lands are not suitable since they cause difficulties for material collection, transportation, and grid networks. Road network distance is important for spatial resource distribution, optimization of service stations, and collection costs because the nearer pig farms are from road networks, the cheaper transportation costs will be. Value is reserved in the theme of “the closer the better” because it helps to narrow the transportation distance from collection points/farms to biogas plants and vice versa. In terms of flooding areas, preferences are given to non-flooding areas. Rivers are also essential factors to consider because the farther away from rivers and flooding areas, the better the biogas plant is, avoiding flooding risks affecting their production activities.
The weighted preferences are calculated based on the Analytical Hierarchy Process (AHP). The AHP introduced by Thomas Saaty [
41], is an effective tool for dealing with complex multiple criteria decision making. It provides measures of judgment consistency, gives priorities among criteria and alternatives, and simplifies preference ratings among decision criteria using pairwise comparisons.
The AHP is conducted in line with the selectivity analysis, aiding the decision-maker to set priorities and make the best decision by using a series of pairwise comparisons and then synthesizing the results.
There are several basic steps to apply the AHP [
42,
43]. Firstly, decompose the issues for making decisions into a hierarchy with consideration of a set of evaluation criteria and a set of alternative options. As part of the first step in the research, the goal is set to find the best location for sitting the biogas plant. After discussions with relative stakeholders and experts on biogas production, there are three criteria, including collection efficiency, safety, and cost minimization. Therefore, road network, elevation, and flooding areas are considered three alternatives for the selectivity model. These alternatives are factors associated directly with the feasibility of the construction, operation, monitoring, and maintenance of biogas plants (
Figure 4). Certain criteria are more significant than others and must be weighted.
Secondly, based on a combination of consultation with those experts and previous studies, we develop the weights for the criteria by making a pairwise comparisons matrix among alternatives for each criterion, normalizing the result matrix, calculating the average value of each row to get the corresponding rate, calculating the consistency ratio, and analyzing the consistency of judgments. The AHP mainly concerns the scaling issue and the numbers used in scaling and correctly prioritizing in the pairs [
41].
The priorities of the comparison (for each factor pair) in the second and third step are described in
Table 2 with the fundamental scale from 1 (equal value) to 9 (extremely different) where a higher number means the chosen factor is considered more important in a greater degree than other factor being compared with (
Table 2).
In this study, a 3 × 3 matrix was developed for three specific criteria including collection efficiency, safety, and cost minimization and three alternatives such as road networks, elevation, and flooding areas based on the discussions with relative stakeholders and consultations with experts on biogas production as well as previous studies. The pairwise preferences were then determined as matrices as in Equation (4).
where
A11 =
A22 =
A33 = 1;
A21 = 1/
A12;
A31 = 1/
A13;
A32 = 1/
A23Excel based matrices were set up to determine the relative importance of each criterion and alternatives with respect to each other. For example, in order to make a matrix for a criterion of collection efficiency, in the first line of the matrix, the importance of roads with respect to roads, elevation, and flooding areas was determined and the same rule was applied to the other two lines. The matrix for the criteria of safety and cost minimization was established in a similar way.
Aij is the value of row i and column j in the pairwise comparison matrix.
Then the column sum is
Aij which is calculated by Equation (5).
Normalization of the matrix is done by totaling the numbers in each column. Each entry in the column is divided by the column sum to yield its normalized score as in Equation (6).
The matrix is normalized by totaling the numbers in each column. Each entry in the column is divided by the column sum to yield its normalized score. The sum of each column is 1.
Then, we calculate the average value of each row as in Equation (7).
The consistency ratio is calculated in three steps as follows:
First, the consistency measure for one criterion is calculated as in Equation (8).
Then, we calculate the consistency index (CI) as in Equation (9).
where λ
max is the average value of consistency measure.
Finally, we calculate the consistency ratio as in Equation (10).
where
RI is Random Index
| n | 1 | 2 | 3 | 4 | 5 | 6 | 7 | 8 | 9 | 10 |
| RI | 0.00 | 0.00 | 0.58 | 0.9 | 1.12 | 1.24 | 1.32 | 1.41 | 1.46 | 1.49 |
with n = 3, RI = 0.58.
We calculate the consistency ratio and check its value to make sure that the original preference ratings were consistent (<0.1). A consistency rate of less than 10%, in general, is considered consistent and satisfactory [
43].
Finally, we calculate the weight for the criteria and the pairwise matrix. The weighted score or preferences of the criteria are obtained by multiplying the weight vector and the score matrix [
41] and choose the highest score judgments.
To sum up, for the selectivity analysis, once criteria were selected, weighted scores for criteria were obtained. Then, thanks to the Weighted Overlay tools in ARCTool box, the cells of input raster were multiplied by their corresponding weights for roads, elevation, and flooding areas in order to establish a suitability map. The final site score ranks from most to least suitable could be reviewed on a detailed map with the best, good, medium, not good, and worst locations. Those criteria were analyzed in Arcgis Spatial analyst tools, Euclidean distance and Surface Analysis, and Slope function. Each of the criteria maps was converted to a raster form. Then, they were reclassified on a scale from 1 to 5, using the Reclassify Tool in ArcMap, which refers to the best, good, medium, not good, and worst values for biogas plant construction. After that, the Weighted Overlay Tool was used to carry out the spatial overlay of the maps.
3.1.3. Final Suitability Analysis
A final suitability map is determined based on a combination of restriction and selectivity Analyses by using the Times function in Spatial Analysis tools.
3.2. Cluster Analysis
In cluster analysis, we first identify if there are any cluster patterns by using spatial statistic tools, analyzing patterns toolsets, and spatial autocorrelation functions. In this case, we measured spatial autocorrelation based on feature locations and attribute values using the Global Moran’s I statistic.
This tool evaluates whether the pattern expressed is clustered, dispersed, or random. When the z-score or p-value indicates statistical significance, a positive Moran’s I index value indicates a tendency toward clustering while a negative Moran’s I index value indicates a tendency toward dispersion. Secondly, we identify distances where features have a neighbor by using utility tool sets with the calculation of distance bands from the neighbor count. This will help us find the average distance where a neighbor will be found.
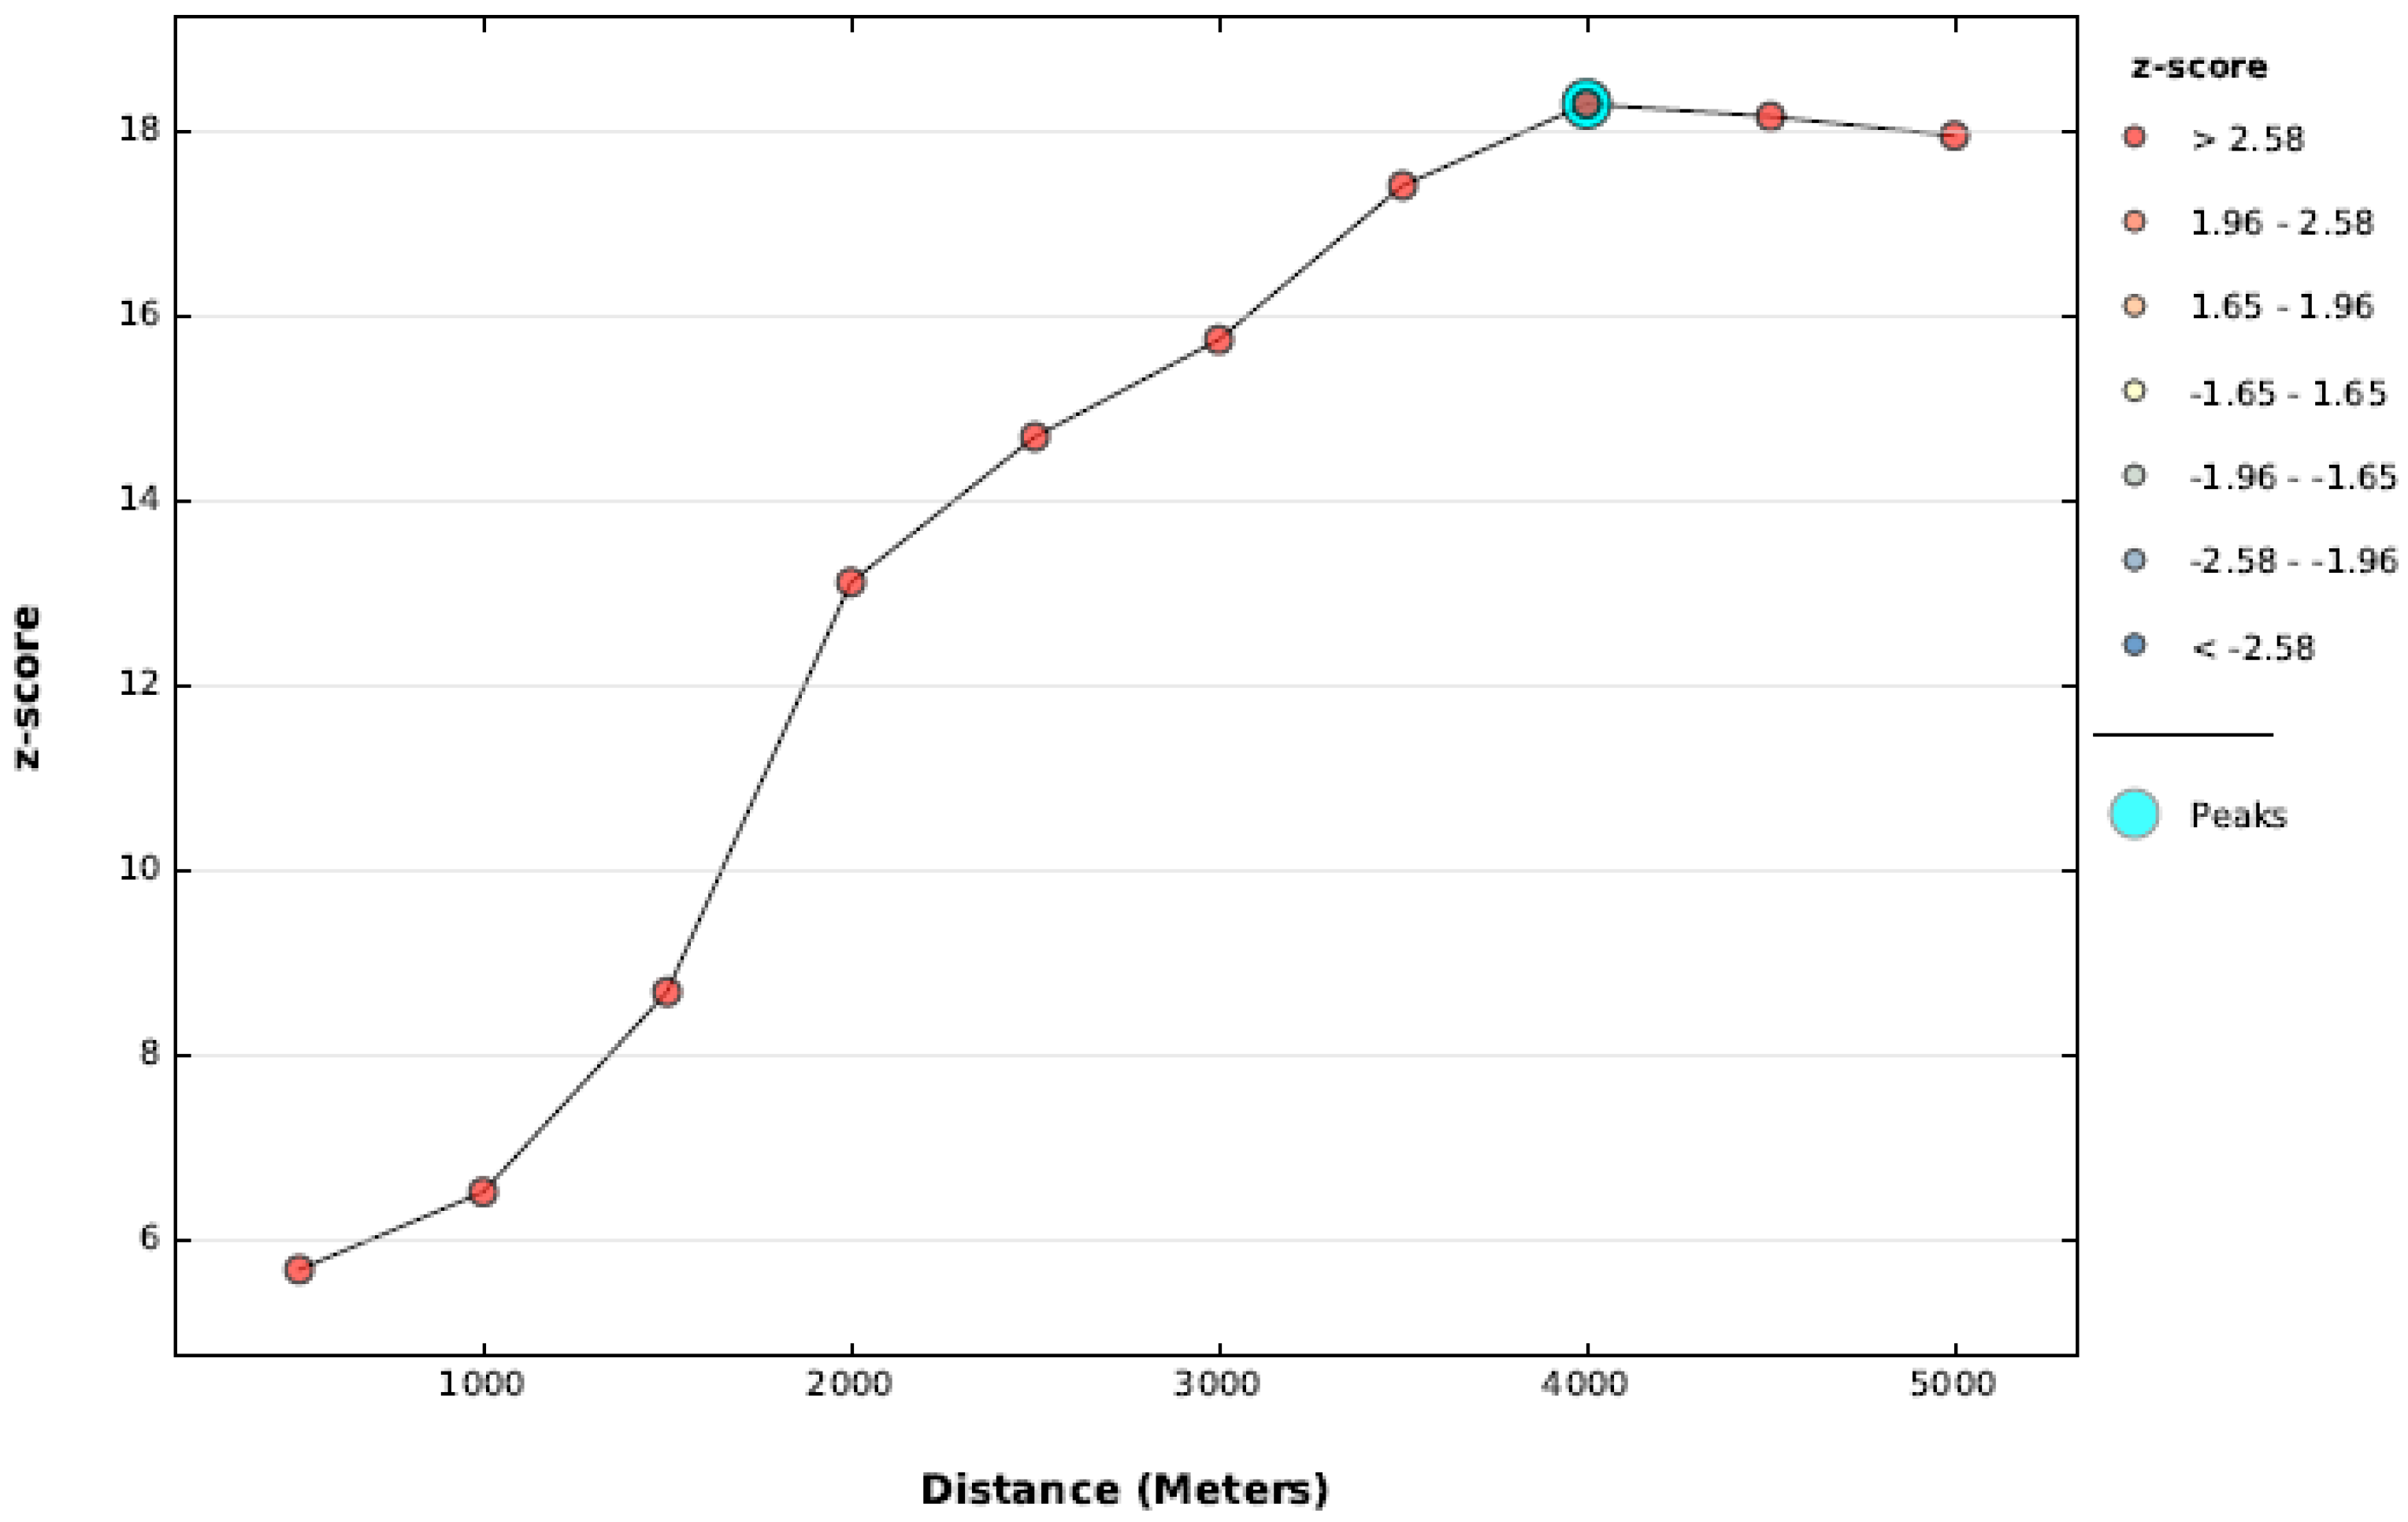
Thirdly, identify the scale of the maximized cluster by using the analyzing patterns toolset. This will answer the question “Is there any incremental spatial autocorrelation?” Peaks can be identified as the distance band or threshold for hot spot analysis in mapping clusters.
Lastly, Hot Spot Analysis in the Mapping Clusters toolset is used to perform cluster analysis to identify the locations of statistically significant hot spots and cold spots using the Getis-Ord Gi* statistic. It visualizes the cluster locations and extent (hot spots/cold spots). The Gi_Bin field identifies statistically significant hot and cold spots regardless of whether or not the FDR correction is applied. Features in the +/−3 bins reflect statistical significance with a 99% confidence level; features in the +/−2 bins reflect a 95% confidence level; features in the +/−1 bins reflect a 90% confidence level. In this study, only feature equal and more than +2 (95% confidence level) was selected for consideration.
When the cluster analysis was done, a map of spatially significant farm clusters with a high density of potential biogas production is made. In the next step, the final suitability map and cluster map are intersected to show suitable areas with the location of selected high density farms. Based on the calculated capacity of each farm for biogas generation within the same clusters in the intersected map, scenarios can be designed and proposed to identify the optimal location, number, and size of proper biogas plants.
3.3. Potential Biogas Capacity and Greenhouse Gas Emissions Calculation
Potential biogas capacity is calculated basing on the methane generation from collected pig manure at farms. The formula follows the Revised 1996 and 2006 IPCC Guidelines on National Greenhouse Gas Inventories [
44] (
Equations (S1)–(S3), Supplementary Materials S1).
Depending on the collection rate of pig manure, the potential methane is estimated differently. Then energy generated from available pig manure is calculated thanks to the heating value of natural gas and methane content. Finally, the capacity of biogas plants from available swine manure in the case study is estimated based on the productivity of an average biogas plant operation time in a year with the assumption that 90% of pig manure is collected for an anaerobic digester. The total capacity of strong spatial farms within the same cluster is estimated by summing up to become the recommended biogas plants.
Improper or the lack of appropriate management of large amounts of pig manure has caused serious adverse environmental impacts including GHG emissions especially methane and nitrous oxide. Within this research, among others, the focus will be on the potential reduction of GHG emissions (CH4 and N2O) compared to current pig farming practices including the mitigation of nationally produced electricity. The remaining 10% uncollected pig manure is a threat and may release CH4 and N2O into the atmosphere and the soil.
Nitrous oxide emissions from manure management are estimated by using IPCC default values with N-excretion/intake values and manure management system usage data (
Equation (S4), Supplementary Materials S1).
Avoided carbon dioxide emissions from electricity generation from biogas are also considered in the environmental benefits of this study because this electricity will replace conventional electricity production in Vietnam. Avoided carbon dioxide emissions from electricity generation from biogas by replacing conventional electricity production per year can be calculated based on average emission for electricity production from biogas plants (
Equation (S5), Supplementary Materials S1).
Finally, net GHG emissions from decomposing manure and replacing conventional electricity production per year are calculated with a combination of 10% of methane and nitrous oxide emissions from uncollected pig manure and avoided carbon dioxide emissions from electricity generation from biogas (
Equation (S6), Supplementary Materials S1).
4. Results and Discussion
4.1. Restriction Map
This study applied some conditions for restriction analysis, including road networks, railways, waterways, rivers, land use (forest, buildings, resident area, park, historical areas), airports, buildings, hotels with concrete requirements, that have been done to make a restriction map for biogas development in Hanoi. The detailed restriction maps with those necessary different layers are shown with examples in
Supplementary Materials S2.
Figure 5 is the overall restriction map, which combines the layer overlap to obtain a map with restricted and available areas.
From the map, we can see that the available areas are located in the North and West of Hanoi, where most rural areas with lower population density and public services and activities are located.
4.2. Weight for Selectivity Analysis’s Criteria Identified by the AHP Analysis
The AHP calculation process including the normalization of the matrix, calculation of average value and consistency index, and consistency ratio (CR) are followed based on Microsoft Excel. The CR values of judgments were less than 0.1, therefore the judgments of the pairwise comparison were consistent.
For the calculation process, there are four matrices set up based on the discussion with stakeholders and experts on biogas production. The first three matrices were used to compare among three alternatives including road, elevation, and flood area. The last matrix was set up to compare among criteria.
For the criteria of (i) collection efficiency, (ii) safety, (iii) cost minimization, a scale for sitting biogas plants for roads, elevation, flood areas, after solving the matrix, is listed under “Weights” in
Table 3. Similarly, weights for criteria are obtained with a set of collection efficiency, safety, flood areas. The weight of a criterion to compare with other criterion was calculated in the “Average” column of the second table for each criterion in
Supplementary Materials S3.
The overall priority scale is synthesized by multiplying as follows:
Therefore, the final priority of 0.64358 for road network proximity, followed by distance from flood area (0.207839) and elevation (0.148581) was determined. The detailed AHP analysis process is presented in
Supplementary Materials S3.
4.3. Suitability Map
After calculation thanks to Weighted Overlay tools in ARCTools box with the weights for three alternatives including roads, elevation and rivers are 64%, 15%, and 21%, respectively, the model builder for suitability analysis is illustrated in
Supplementary Materials S4.
The suitability map is modeled with five levels including the best, good, medium, not good, and the worst areas (
Figure 6).
It is clear that the available areas that are considered as best, good, and medium obtained from the final suitability map are located in the north, east, and west of Hanoi where the areas have an appropriate land slope and a suitable distance to connect to road networks and avoid flooding risks. The other unsuitable areas are in the western south of Hanoi.
4.4. Final Suitability Map
The Restriction Map and Suitability Map are combined into the final suitability map, eliminating all existing purposes using the area and considering important influencers on selecting locations for proper biogas plants such as elevation, roads, and rivers. Using the Times tools in ARCTools box to analyze, the combination can be seen in the Final Suitability Map (
Figure 7).
All the restricted zones and suitable zones are identified in the final suitability map. Suitable zones include the best, good, medium, not good, and the worst area. The best, good, and medium zones are considered suitable to use for building biogas plants whereas other zones are unsuitable. The final suitability map is used for integration with cluster analysis and scenario designs in this study.
4.5. Map of Optimal Locations of High-Density Pig Farms
The study applied Cluster Analysis using Arcgis 10.6 to identify the optimal location for sitting biogas plants in Hanoi.
The distance at which any farm had at least one neighbor was calculated using the utility function “Calculate the Distance Band from neighbor count”. The maximum distance was found at 4991.7 m. The study then applied the Incremental Spatial autocorrelation in the analyzing patterns function to identify what scale the cluster is maximized. As shown in
Figure 8, the peak was reached at 5 km.
Hot Spot Analysis (GETIS-ORD GI) was applied and gave results of a map with a high density of pig farms in Hanoi with a distance band of 5 km. As a result, there were 495 farms with a strong spatial correlation (
Figure 9).
By selecting a Gi_Bin value of more than 1 we obtained a map of optimal locations of high-density pig farms with 95% confidence. It was possible to reduce the number of potential farms from 495 to 96 farms with a strong spatial correlation. This step helped to identify the farms with the highest potential for installing biogas plants and feasibility on transportation cost.
4.6. Proposed Scenarios in the Study Area
After getting a map of optimal locations of high-density pig farms, an intersection of this map with the final suitable map was made. Based on the available number of pigs per farm, the potential biogas capacity of each farm was calculated based on the mathematic formulation in 3.3 with the assumption that 90% of pig manure is collected for an anaerobic digester. The results helped us estimate the total capacity of strong spatial farm clusters by summing up to become the recommended biogas plants.
According to [
45], biogas plants with a power capacity of 250 kW or more are still an attractive investment and economically viable. Therefore, biogas plants with a size below 250 kW capacity were not taken into consideration in this study. Farms in clusters with a strong spatial correlation identified as the results of Cluster Analysis and generating a power capacity of 250 kW or higher were selected for biogas plants. It was assumed that the biogas plants would be used for electricity generation purposes only.
The study designed a baseline scenario and three other scenarios based on the potential capacity of pig farms for energy production. Scenarios 1, 2, and 3 were proposed for large, medium, and small-sized farms with the number of pigs per farm being more than 1600 heads, from 650 to 1600 heads, and less than 650 heads, respectively.
4.6.1. Baseline Scenario
The baseline scenario is considered as a reference scenario of this research. It represents the current situation of all the selected pig farms after clustering analysis. It means all of the pig farms discharge their pig manure directly to the environment such as in pastures/ranges/paddocks daily and it is spread as fertilizers and in ponds, water channels surrounding the pig farms, sewer channels, anaerobic lagoons, etc. without any treatment and utilization for the generation of renewable energy from pig manure. Therefore, in this scenario, there is no biogas plant and all GHGs from pig manure mostly CH4 and N2O completely emits into the natural environment without any treatment. This scenario is the baseline which can be compared to determine the net GHG emissions with other scenarios.
4.6.2. Scenario 1
The first scenario is designed to promote large-scale farms to generate electricity for local demand. After applying the intersection analysis and capacity estimation, we found two possible clusters with potential biogas enough for installing biogas plants (
Figure 10) with a capacity of 1218–1350 kW per year, meeting 1.06% and 0.59% of the local electricity demand [
46] for the Son Tay and Thach That districts, respectively in 2025. Details of farming clusters in scenario 1 are presented in
Supplementary Materials S5. With the total number of pigs being 89,500 heads, the total power generation capacity in a year of scenario 1 is 2568 kW.
4.6.3. Scenario 2
The second scenario is designed to promote medium-scale farms. After intersection analysis and capacity calculation, three clusters were found. However, only two clusters with a capacity of more than 250 kW per year were considered, the other one with a capacity of less than 250 kW per year was taken out of the analysis. Therefore, for scenario 2, there are two potential biogas plants with capacities of 476 and 363 kW per year in the Son Tay and Thach That districts, respectively (
Figure 11). They can meet 0.416%, 0.159% of the electricity demand of those two districts in 2025. Details of farming clusters in scenario 2 are presented in
Supplementary Materials S6. With a pig number of 29,225 heads, the total power generation capacity in a year of scenario 2 is 839 kW.
4.6.4. Scenario 3
The third scenario is designed to promote small scale farms. After intersection analysis and capacity estimation for pig farms, a total of three clusters were obtained. Only one cluster with a capacity of 308 kW was considered. The other two more clusters were removed because the potential capacities were less than 250 kW. Therefore, for scenario 3, there is one possible biogas plant with a capacity of 308 kW in Son Tay (
Figure 12). It can meet 0.269% of the electricity demand of the Son Tay district in 2025. Detailed information on the farming clusters in scenario 3 is presented in
Supplementary Materials S7. With the pig number of 10,747 heads, the total power generation capacity in a year of scenario 3 is 308 kW.
In total, there are two possible biogas plants with a capacity of more than 1 MW and three with a capacity of more than 250 kW. From the results, it could be observed that there are possibilities to meet the electricity demand of the Son Tay and Thach That districts by 1.75% and 0.76%, respectively, for three scenarios in 2025. The possibilities for reducing GHG emissions are also calculated below.
4.7. GHG Emissions Comparision
The baseline scenario is designed with GHG emissions from the current farming situation and not using electricity from the national grid. The full 100% of CH
4 and N
2O emissions are estimated based on the equations in
Section 3.3. As a result, in the baseline scenario, the amount of CH
4 and N
2O emissions are 52,863; 14,108 tons of carbon dioxide equivalent (CO
2 eq)/year respectively. In total, the baseline scenario emits 66,971 tons of CO
2 eq/year.
For scenarios 1, 2, and 3, with the assumption that 90% of pig manure is collected for an anaerobic digester, it means that the remaining 10% of untreated manure releases GHG emissions (CH
4 and N
2O) to the atmosphere. Therefore, 10% of the CH
4 and N
2O emissions were calculated. Also, avoided CO
2 emission from electricity generation from biogas plants in scenarios was estimated. Based on the equations in
Section 3.3, the GHG calculation results are shown in
Table 4.
Scenario 1 has an amount of CH4 and N2O emissions of 3654; 975 tons of CO2 eq/year respectively. The amount of avoided CO2 emissions from electricity generation from biogas plants is −16,936 tons of CO2 eq/year. Therefore, the net GHG emissions of scenario 1 is −12,307 tons of CO2 eq/year.
Similarly, for scenarios 2 and 3, the net GHG emissions is −4021; −1478 tons of CO
2 eq/year, respectively. The details of the GHG calculation for scenarios 1, 2, and 3 can be referred to in
Supplementary Materials S5–S7.
The implementation of the proposed biogas plants in Hanoi could reduce GHG emissions and provide electricity to communities. This is important since it is forecasted that in the period of 2020 to 2024, there will be a serious shortage of electricity in Vietnam due to the fact that the power transmission infrastructure has not been completed as scheduled [
49].
This study is an important step in the policy recommendations supporting local decision-makers in Vietnam for the utilization of valuable bio-energy sources from pig manure, contributing to Nationally Determined Contribution (NDC) with the target to reduce greenhouse gas emissions [
50]. It also has significant implications in the development of strategies for biogas development and GHG emissions reduction from pig waste management for local communities in the area and the whole country.
Recently, Vietnam’s government has paid more attention to the environment and renewable energy issues. National efforts are also reflected in the government’s consideration of promoting biogas production for generating electricity as an important issue with a responsibility to greenhouse gas emissions reduction, efficient and sustainable use of natural resources. The National Energy Development Strategy defines the development strategy for the energy sector, including renewable energy up to 2020 with an outlook to 2050. Accordingly, the target of increasing the renewable energy rate is set at about 5% by 2020, and 11% by 2050. The seventh Power Development Plan (PDP 7) sets the targets for renewable electricity to increase from 4.5% in 2020 to 6.0% in 2030 by the total system of electricity generation and importation [
51]. Along with those targets, the government of Vietnam has issued a number of financial policies to incentivize the investment [
52]. Those are the initial policies making way for renewable resource promotion in Vietnam, however, there are still many challenges ahead to achieve its targets.
Experiences and lessons learned from other countries that were successful at promoting renewable energy including biogas production and electricity generation are valuable for Vietnam. In the EU, biogas has contributed to bio-energy production with a share that increased from 2.7% in 2005 to 7.8% in 2015 and has grown at its highest pace in the bio-energy sector in the last decade [
53]. The EU also accounted for 72.5% (58 GWh) of the global electricity generation from biogas in 2014. The success of the increase in renewable energy production is attributed to the more than 200 incentives put in place including the use of manure [
54]. China also introduced financial support and improvement of biogas service systems to boost the number of newly built biogas units in every province after 2003. Many solutions including providing direct investment and encouraging international cooperation were taken such as an international carbon trade system [
55]. Those experiences could provide guidelines for Vietnam in promoting biogas production and boost electricity generation.
5. Conclusions
This research applied suitability analysis and the AHP for the optimization of the spatial distribution and amount of the potential biogas production from pig manure by taking into consideration different variables, in order to identify suitable locations for biogas plants. The method developed in this research work is based on a combination of statistical and spatial methods. The approach was applied in Hanoi.
The study analyzed and identified the optimum number, location, and scale of biogas plants with their potential biogas production from pig manure in Hanoi. Based on cluster analysis, three scenarios of grouping different feedstock sources were proposed. The result shows that for scenario 1 with large-scale farms, there are two possible biogas plants with a capacity of 1218 and 1350 kW in the Son Tay and Thach That districts, respectively. For scenario 2 with medium-scale farms, there are two potential biogas plants with a capacity of 476 and 363 kW in the Son Tay and Thach That districts, respectively. For scenario 3 with small-scale farms, there is one possible biogas plant with a capacity of 308 kW in Son Tay. The results could help meet the electricity demand of Son Tay, Thach That district by 1.75% and 0.76%, respectively, for 2025 with utilization from approximately 8% of the total pig number in Hanoi.
The GHG emissions reduction from developing biogas plants is also meaningful. In detail, net GHG emissions of scenarios 1, 2, and 3 are −12,307; −4021; and −1478 tons of CO2 eq/year, respectively, while scenario 0 brings 66,971 tons CO2 eq/year of net GHG emissions. The GHG emissions gap between those scenarios is 84,777 tons of CO2 eq/year.
The results of the study highlight the importance of identifying not only the potential amount of biogas at nearby spatial clusters but also identifying the optimum locations, number, and scale of biogas plants that would be able to meet the electricity demand in Hanoi rural areas as well as contribute to GHG emissions reduction. This could be a viable alternative to meet future electricity demand in rural areas with renewable resources.
The added value of this research is to (i) highlight the importance of renewable energy resources in GHG emissions reduction and power generation and (ii) recommend optimal options for utilization of pig manure, which is currently poorly treated while promoting GHG emissions reduction. This research is carried out in a case study with recommendations for building five biogas plants for three options. This initiative could be used as a reference for similar initiatives across the country which will in turn reduce GHG emissions even further and promote energy production from a renewable resource.
In order to do that, in future works, the authors plan to assess the biogas potential at the country level to realize the government’s targets regarding renewable energy.


