Valuation of Soil Organic Carbon Stocks in the Contiguous United States Based on the Avoided Social Cost of Carbon Emissions
Abstract
1. Introduction
2. Materials and Methods
2.1. The Accounting Framework
2.2. Monetary Valuation Approach
3. Results
3.1. Value of SOC by Soil Order
3.2. Value of SOC by Soil Depth in the Contiguous U.S.
3.3. Value of SOC by Land Resource Regions (LRRs) in the Contiguous U.S.
3.4. Value of SOC by States and Regions in the Contiguous U.S.
4. Discussion
5. Conclusions
Author Contributions
Funding
Acknowledgments
Conflicts of Interest
References
- Keestra, S.D.; Bouma, J.; Wallinga, J.; Tittonell, P.; Smith, P.; Cerda, A.; Montanarella, L.; Quinton, J.N.; Pachepsky, Y.; Van der Putten, W.H.; et al. The significance of soils and soil science towards realization of the United Nations Sustainable Development Goals. Soil 2016, 2, 111–128. [Google Scholar] [CrossRef]
- Wood, S.L.; Jones, S.K.; Johnson, J.A.; Brauman, K.A.; Chaplin-Kramer, R.; Fremier, A.; Girvetz, E.; Gordon, L.J.; Kappel, C.V.; Mandle, L.; et al. Distilling the role of ecosystem services in the Sustainable Development Goals. Ecosyt. Serv. 2017, 29, 701–782. [Google Scholar] [CrossRef]
- Adhikari, K.; Hartemink, A.E. Linking soils to ecosystem services—A global review. Geoderma 2016, 262, 101–111. [Google Scholar] [CrossRef]
- Brady, N.C.; Weil, R.R. The Nature and Properties of Soils., 13th ed.; Pearson Education, Inc.: Upper Saddle River, NJ, USA, 2002. [Google Scholar]
- Feller, C.; Manlay, R.J.; Swift, M.J.; Bernoux, M. Functions, services and value of soil organic matter for human societies and the environment: a historical perspective. In Functions of Soils for Human Societies and the Environment, 2nd ed.; Frossard, E., Blum, W.E.H., Warkentin, B.P., Eds.; Geological Society of London: London, England, 2006; Volume 206, pp. 9–22. [Google Scholar] [CrossRef]
- Lehmann, J.; Kleber, M. The contentious nature of soil organic matter. Nature 2015, 528, 60–68. [Google Scholar] [CrossRef] [PubMed]
- Heaton, L.; Fullen, M.A.; Bhattacharyya, R. Critical analysis of the van Bemmelen conversion factor used to convert soil organic matter data to soil organic carbon data: Comparative analyses in a UK loamy sand soil. Espaço Aberto 2016, 6, 35–44. [Google Scholar]
- Jones, L.; Norton, L.; Austin, Z.; Browne, A.L.; Donovan, D.; Emmett, B.A.; Grabowski, Z.J.; Howard, D.C.; Jones, J.P.G.; Kenter, J.O.; et al. Stocks and flows of natural and human-derived capital in ecosystem services. Land Use Policy 2016, 52, 151–162. [Google Scholar] [CrossRef]
- Groshans, G.R.; Mikhailova, E.A.; Post, C.J.; Schlautman, M.A.; Zhang, L. Determining the value of soil inorganic carbon stocks in the contiguous United States based on the avoided social cost of carbon emissions. Resources 2019, 8, 119. [Google Scholar] [CrossRef]
- EPA. The Social Cost of Carbon. In EPA Fact Sheet; 2016. Available online: https://19january2017snapshot.epa. gov/climatechange/social-cost-carbon_.html (accessed on 15 March 2019).
- Guo, Y.; Amundson, R.; Gong, P.; Yu, Q. Quantity and spatial variability of soil carbon in the conterminous United States. Soil Sci. Soc. Am. J. 2006, 70, 590–600. [Google Scholar] [CrossRef]
- Robertson, G.P.; Grace, P.R. Greenhouse gas fluxes in tropical and temperate agriculture: The need for a full-cost accounting of global warming potentials. Environ. Dev. Sustain. 2004, 6, 51–63. [Google Scholar] [CrossRef]
- Guo, L.B.; Gifford, R.M. Soil carbon stocks and land use change: a meta analysis. Glob. Chang. Biol. 2002, 8, 345–360. [Google Scholar] [CrossRef]
- Climate Change and Land: an IPCC special report on climate change, desertification, land degradation, sustainable land management, food security, and greenhouse gas fluxes in terrestrial ecosystems; Chapter 4: Land Degradation. Available online: https://www.ipcc.ch/report/srccl/ (accessed on 15 August 2019).
- Baumhardt, R.L.; Stewart, B.A.; Sainju, U.M. North American Soil Degradation: Processes, Practices, and Mitigating Strategies. Sustainability 2015, 7, 2936–2960. [Google Scholar] [CrossRef]
- Sanderman, J.; Baldock, J.A. Accounting for soil carbon sequestration in national inventories: a soil scientist’s perspective. Environ. Res. Lett. 2010, 5. [Google Scholar] [CrossRef]
- NOAA (National Oceanic and Atmospheric Administration). National Centers for Environmental Information. 2016. Available online: www.ncei.noaa.gov (accessed on 15 May 2019).
- Gruber, N. Fluvial systems and coasts. In Toward CO2 Stabilization: Issues, Strategies, and Consequences; Field, C.B., Raupach, M.R., Eds.; Island Press: Washington, DC, USA, 2004; pp. 45–76. [Google Scholar]
- Raich, J.W.; Schlesinger, W.H. The global carbon dioxide in soil respiration and its relationship to vegetation and climate. Tellus B 1992, 44, 81–99. [Google Scholar] [CrossRef]
- Davidson, E.A.; Janssens, I.A. Temperature sensitivity of soil carbon decomposition and feedbacks to climate change. Nature 2006, 440, 165–173. [Google Scholar] [CrossRef] [PubMed]
- Ivanov, I.V.; Pesochina, L.S.; Semenov, V.M. Biological mineralization of organic matter in the modern virgin and plowed Chernozems, buried Chernozems, and fossil Chernozems. Eurasian Soil Sci. 2009, 42, 1109–1119. [Google Scholar] [CrossRef]
- Coyne, M.S.; Thompson, J.A. Fundamental Soil Science; Thomson Delmar Learning: New York, NY, USA, 2006. [Google Scholar]
- Alexander, P.; Paustian, K.; Smith, P.; Moran, D. The economics of soil C sequestration and agricultural emissions abatement. Soil 2015, 1, 331–339. [Google Scholar] [CrossRef]
- Ayuk, E.T. Social, economic and policy dimensions of soil organic matter management in sub-Sahara Africa: challenges and opportunities. Nutr. Cycl. Agroecosys. 2001, 61, 183–195. [Google Scholar] [CrossRef]


| Soil Organic Matter (SOM) | Soil Organic Carbon (SOC) |
|---|---|
| - Fresh residue, decomposing organic matter, stable organic matter (humus), and living organisms. or - “Continuum of organic material in all stages of transformation and decomposition or stabilization [6].” | - Carbon fraction of soil organic matter. |
| Conversion (using Van Bemmelen factor of 0.58 or 1.724): SOM (%) = SOC (%) × 1.724 or SOC (%) = SOM (%) × 0.58 [7] | |
| Pathways to increased soil carbon sequestration: Additions of organic matter (e.g., compost additions, etc.); land/agricultural management (e.g., no-till operations, land conservation, etc.); afforestation, etc. | |
| Biophysical Accounts (Science-Based) | Administrative Accounts (Boundary-Based) | Monetary Account(s) | Benefit(s) | Total Value |
|---|---|---|---|---|
| Soil extent: | Administrative extent: | Ecosystem good(s) and service(s): | Sector: | Types of value: |
| Separate constituent stock: Soil organic carbon (SOC) | ||||
| Environment: | Social cost of carbon (SC-CO2) and avoided emissions: | |||
| - Soil order - Soil depth | - Country - State - Region - Land Resource Region (LRR) | - Regulating (e.g., carbon sequestration) | - Carbon sequestration in soil organic matter (SOM) | - $42 per metric ton of CO2 (2007 U.S. dollars with an average discount rate of 3% [10]) |
| ---------------- Total Value -------------- | -------- Value per Area -------- | ||||||
|---|---|---|---|---|---|---|---|
| Soil Order | Total Area (km2) | Min. ($) | Mid. ($) | Max. ($) | Min. ($ m−2) | Mid. ($ m−2) | Max. ($ m−2) |
| Slight weathering | |||||||
| Entisols | 1,054,015 | 2.97 × 10¹¹ | 1.30 × 10¹² | 2.56 × 10¹² | 0.28 | 1.23 | 2.43 |
| Inceptisols | 787,254 | 3.08 × 10¹¹ | 1.08 × 10¹² | 2.11 × 10¹² | 0.43 | 1.37 | 2.68 |
| Histosols | 107,249 | 1.06 × 10¹² | 2.31 × 10¹² | 4.03 × 10¹² | 9.84 | 21.58 | 37.56 |
| Gelisols | - | - | - | - | - | - | - |
| Andisols | 68,666 | 5.04 × 10¹⁰ | 1.13 × 10¹¹ | 1.98 × 10¹¹ | 0.74 | 1.65 | 2.88 |
| Intermediate weathering | |||||||
| Aridisols | 809,423 | 1.45 × 10¹¹ | 5.02 × 10¹¹ | 9.52 × 10¹¹ | 0.18 | 0.62 | 1.17 |
| Vertisols | 132,433 | 1.10 × 10¹¹ | 2.99 × 10¹¹ | 5.19 × 10¹¹ | 0.83 | 2.26 | 3.93 |
| Alfisols | 1,274,102 | 4.56 × 10¹¹ | 1.48 × 10¹² | 2.77 × 10¹² | 0.35 | 1.16 | 2.17 |
| Mollisols | 2,020,694 | 1.82 × 10¹² | 4.21 × 10¹² | 7.10 × 10¹² | 0.91 | 2.08 | 3.51 |
| Strong weathering | |||||||
| Spodosols | 250,133 | 1.11 × 10¹¹ | 4.73 × 10¹¹ | 9.82 × 10¹¹ | 0.45 | 1.89 | 3.93 |
| Ultisols | 860,170 | 2.52 × 10¹¹ | 9.43 × 10¹¹ | 1.84 × 10¹² | 0.29 | 1.09 | 2.14 |
| Oxisols | - | - | - | - | - | - | - |
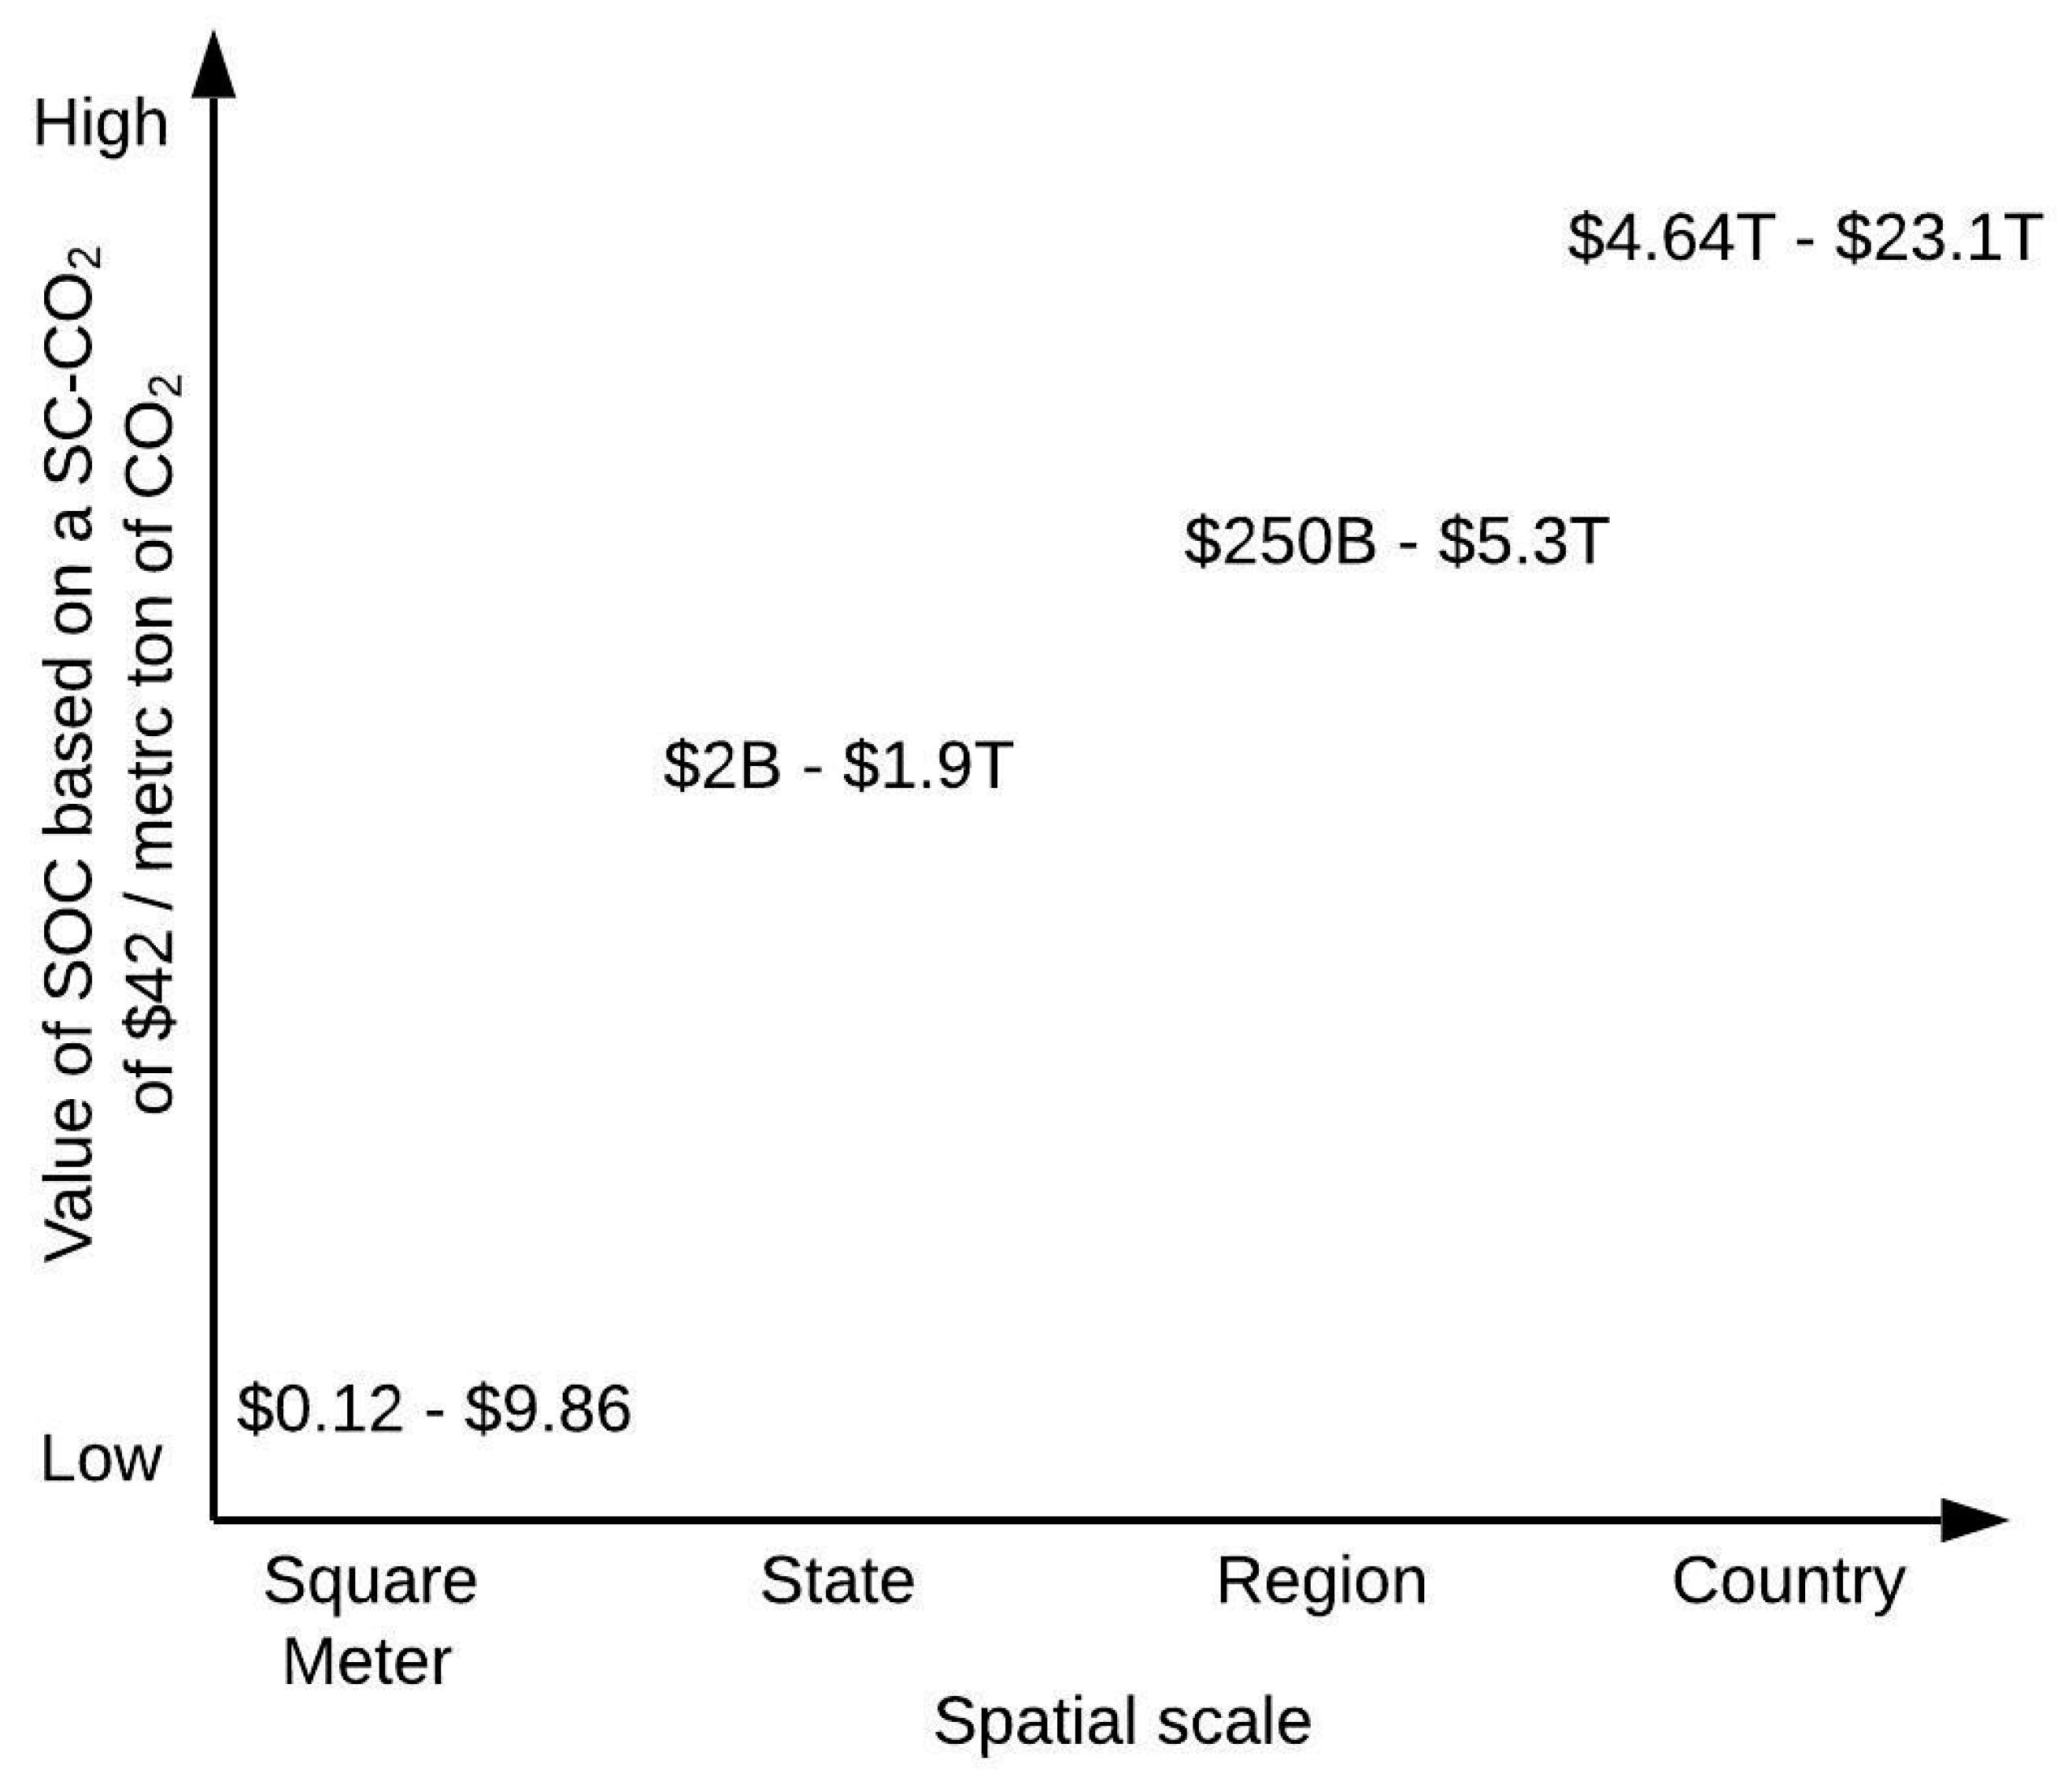
| Totals | 7,364,139 | 4.64 × 10¹² | 1.27 × 10¹³ | 2.31 × 10¹³ | |||
| Depth (cm) | -------------- Total Value -------------- | -------- Value per Area -------- | ||||
|---|---|---|---|---|---|---|
| Min. ($) | Mid. ($) | Max. ($) | Min. ($ m−2) | Mid. ($ m−2) | Max. ($ m−2) | |
| 0–20 | 1.79 × 10¹² | 3.67 × 10¹² | 6.04 × 10¹² | 0.24 | 0.50 | 0.82 |
| 20–100 | 2.13 × 10¹² | 6.18 × 10¹² | 1.14 × 10¹³ | 0.29 | 0.84 | 1.54 |
| 100–200 | 7.39 × 10¹¹ | 2.88 × 10¹² | 5.67 × 10¹² | 0.10 | 0.39 | 0.77 |
| Totals | 4.65 × 10¹² | 1.27 × 10¹³ | 2.31 × 10¹³ | |||
| LRRs | Area (km2) | ---------------- Total Value --------------- | ------- Value per Area ------ | ||||
|---|---|---|---|---|---|---|---|
| Min. ($) | Mid. ($) | Max. ($) | Min. ($ m−2) | Mid. ($ m−2) | Max. ($ m−2) | ||
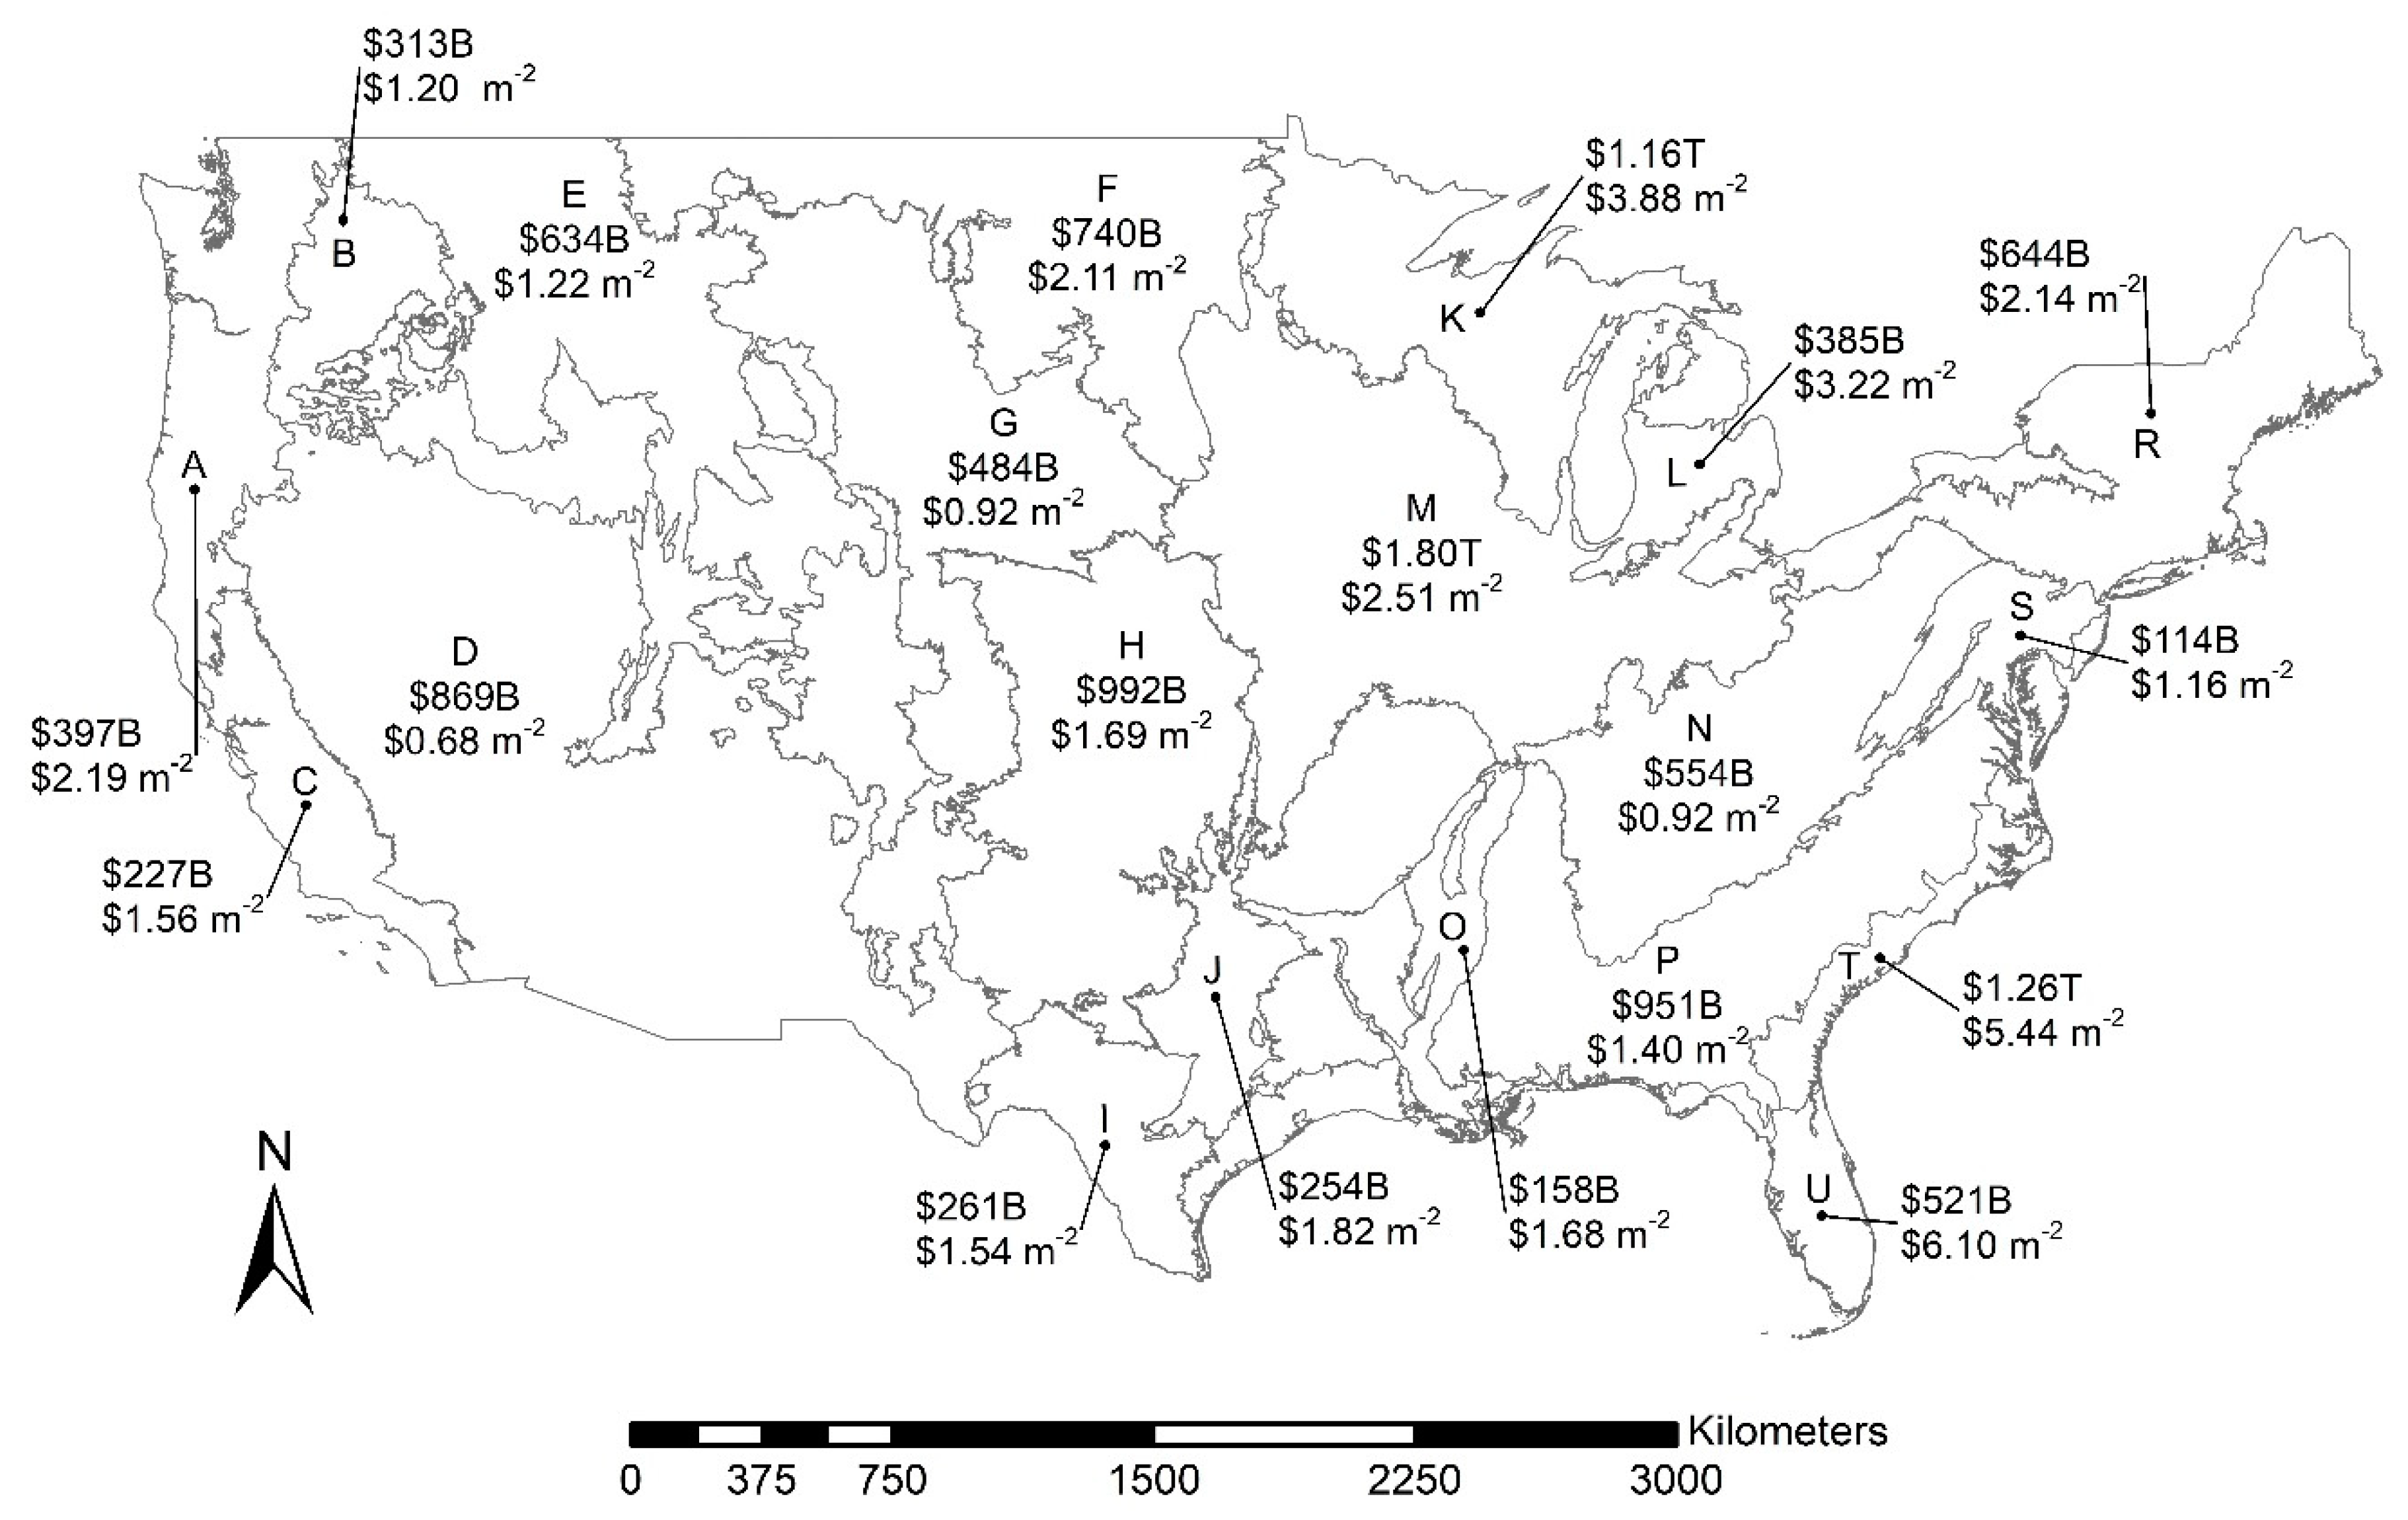
| A | 181,215 | 1.63 × 10¹¹ | 3.97 × 10¹¹ | 7.06 × 10¹¹ | 0.89 | 2.19 | 3.90 |
| B | 259,284 | 1.33 × 10¹¹ | 3.13 × 10¹¹ | 5.49 × 10¹¹ | 0.51 | 1.20 | 2.11 |
| C | 146,884 | 8.16 × 10¹⁰ | 2.27 × 10¹¹ | 3.89 × 10¹¹ | 0.55 | 1.56 | 2.65 |
| D | 1,268,922 | 2.42 × 10¹¹ | 8.69 × 10¹¹ | 1.67 × 10¹² | 0.18 | 0.68 | 1.31 |
| E | 521,994 | 2.25 × 10¹¹ | 6.34 × 10¹¹ | 1.20 × 10¹² | 0.43 | 1.22 | 2.29 |
| F | 351,842 | 2.53 × 10¹¹ | 7.40 × 10¹¹ | 1.35 × 10¹² | 0.72 | 2.11 | 3.83 |
| G | 521,442 | 1.65 × 10¹¹ | 4.84 × 10¹¹ | 8.59 × 10¹¹ | 0.32 | 0.92 | 1.65 |
| H | 583,820 | 3.57 × 10¹¹ | 9.92 × 10¹¹ | 1.73 × 10¹² | 0.62 | 1.69 | 2.96 |
| I | 169,689 | 9.49 × 10¹⁰ | 2.61 × 10¹¹ | 4.82 × 10¹¹ | 0.55 | 1.54 | 2.83 |
| J | 139,624 | 9.78 × 10¹⁰ | 2.54 × 10¹¹ | 4.42 × 10¹¹ | 0.69 | 1.82 | 3.16 |
| K | 300,269 | 4.83 × 10¹¹ | 1.16 × 10¹² | 2.09 × 10¹² | 1.60 | 3.88 | 6.95 |
| L | 119,997 | 1.72 × 10¹¹ | 3.85 × 10¹¹ | 6.57 × 10¹¹ | 1.43 | 3.22 | 5.48 |
| M | 717,615 | 9.29 × 10¹¹ | 1.80 × 10¹² | 2.82 × 10¹² | 1.29 | 2.51 | 3.93 |
| N | 603,434 | 1.44 × 10¹¹ | 5.54 × 10¹¹ | 1.14 × 10¹² | 0.23 | 0.92 | 1.89 |
| O | 94,652 | 4.14 × 10¹⁰ | 1.58 × 10¹¹ | 3.14 × 10¹¹ | 0.43 | 1.68 | 3.31 |
| P | 677,160 | 2.62 × 10¹¹ | 9.51 × 10¹¹ | 1.78 × 10¹² | 0.39 | 1.40 | 2.63 |
| R | 300,536 | 1.77 × 10¹¹ | 6.44 × 10¹¹ | 1.35 × 10¹² | 0.59 | 2.14 | 4.48 |
| S | 99,147 | 3.34 × 10¹⁰ | 1.14 × 10¹¹ | 2.38 × 10¹¹ | 0.34 | 1.16 | 2.40 |
| T | 231,303 | 4.12 × 10¹¹ | 1.26 × 10¹² | 2.39 × 10¹² | 1.79 | 5.44 | 10.32 |
| U | 85,410 | 1.79 × 10¹¹ | 5.21 × 10¹¹ | 9.48 × 10¹¹ | 2.09 | 6.10 | 11.10 |
| Totals | 7,374,239 | 4.65 × 10¹² | 1.27 × 10¹³ | 2.31 × 10¹³ | |||
| State (Region) | Area (km2) | ---------------------- Total Value ------------------- | ----------- Value per Area ---------- | ||||
|---|---|---|---|---|---|---|---|
| Min. ($) | Mid. ($) | Max. ($) | Min. ($ m−2) | Mid. ($ m−2) | Max. ($ m−2) | ||
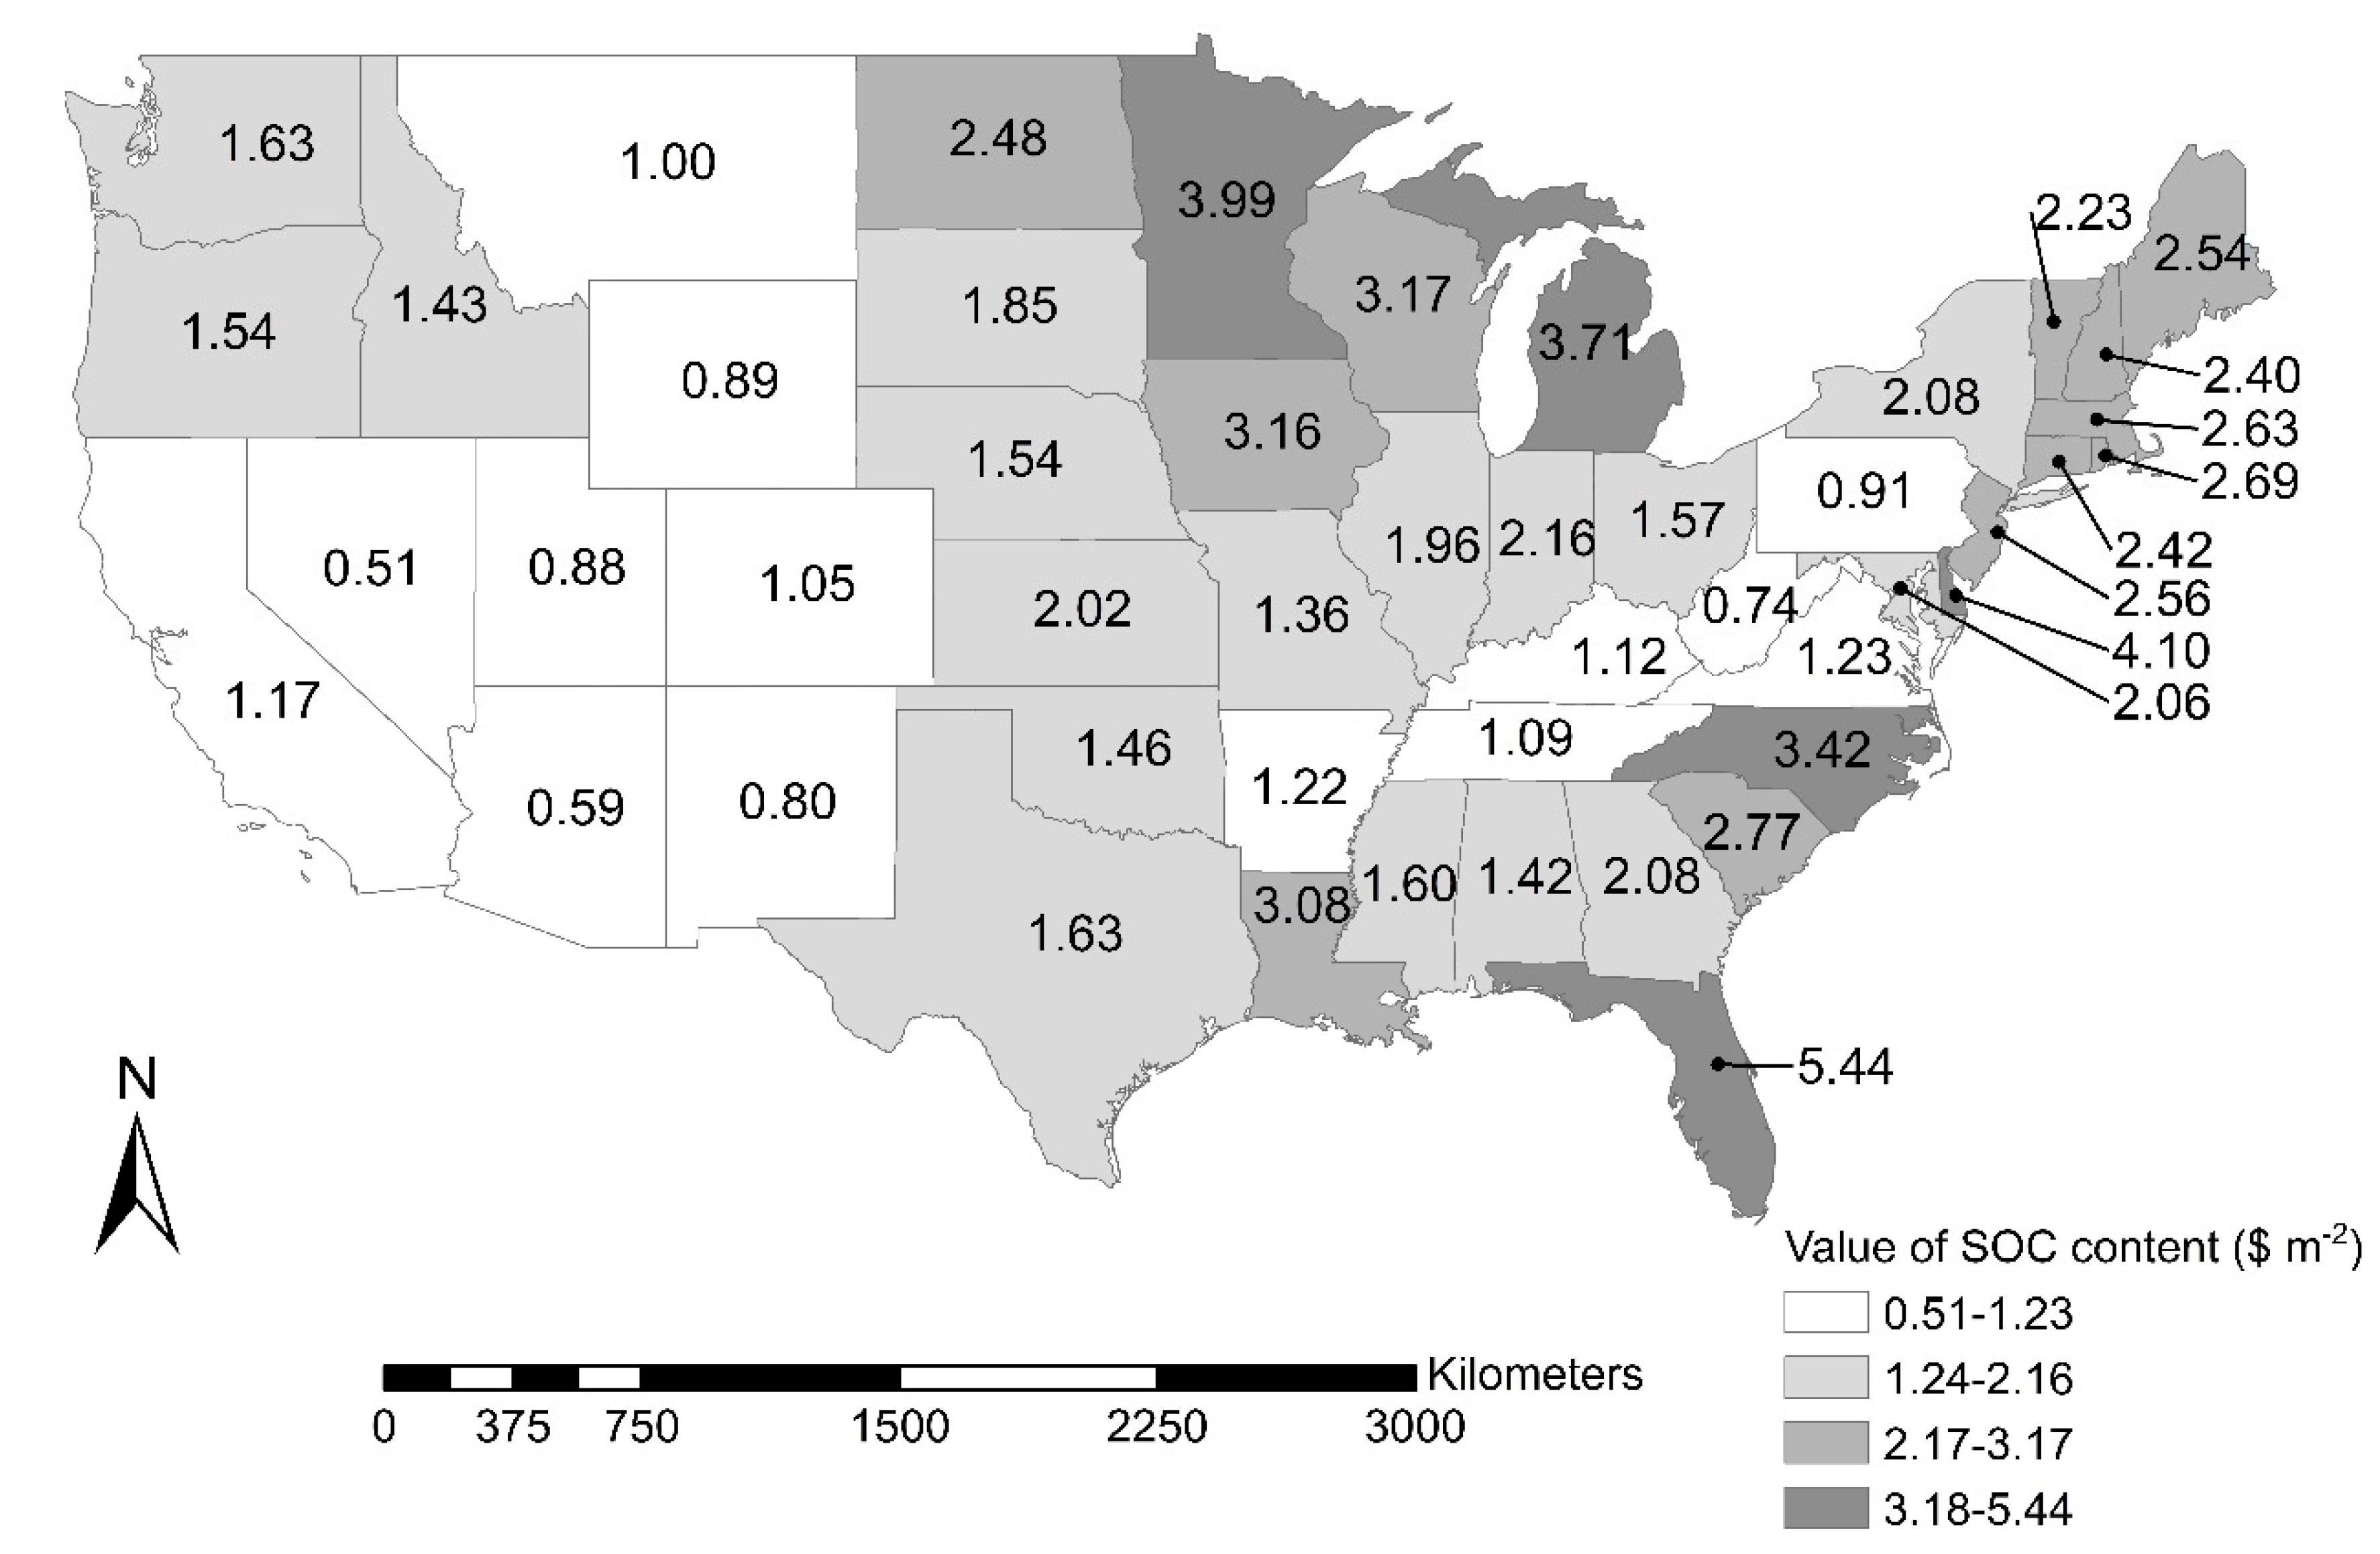
| Connecticut | 12,406 | 7.70 × 10⁹ | 3.00 × 10¹⁰ | 6.51 × 10¹⁰ | 0.63 | 2.42 | 5.25 |
| Delaware | 5043 | 4.31 × 10⁹ | 2.06 × 10¹⁰ | 4.47 × 10¹⁰ | 0.86 | 4.10 | 8.86 |
| Massachusetts | 18,918 | 1.16 × 10¹⁰ | 4.99 × 10¹⁰ | 1.07 × 10¹¹ | 0.62 | 2.63 | 5.67 |
| Maryland | 25,266 | 1.28 × 10¹⁰ | 5.21 × 10¹⁰ | 1.11 × 10¹¹ | 0.51 | 2.06 | 4.42 |
| Maine | 80,584 | 6.50 × 10¹⁰ | 2.05 × 10¹¹ | 4.12 × 10¹¹ | 0.80 | 2.54 | 5.11 |
| New Hampshire | 22,801 | 1.05 × 10¹⁰ | 5.50 × 10¹⁰ | 1.24 × 10¹¹ | 0.46 | 2.40 | 5.45 |
| New Jersey | 17,788 | 1.62 × 10¹⁰ | 4.54 × 10¹⁰ | 9.06 × 10¹⁰ | 0.91 | 2.56 | 5.08 |
| New York | 118,432 | 7.39 × 10¹⁰ | 2.46 × 10¹¹ | 4.98 × 10¹¹ | 0.63 | 2.08 | 4.20 |
| Pennsylvania | 115,291 | 2.59 × 10¹⁰ | 1.05 × 10¹¹ | 2.28 × 10¹¹ | 0.23 | 0.91 | 1.97 |
| Rhode Island | 2583 | 2.00 × 10⁹ | 6.93 × 10⁹ | 1.48 × 10¹⁰ | 0.79 | 2.70 | 5.71 |
| Vermont | 23,764 | 1.00 × 10¹⁰ | 5.30 × 10¹⁰ | 1.19 × 10¹¹ | 0.42 | 2.23 | 5.02 |
| West Virginia | 61,448 | 1.00 × 10¹⁰ | 4.56 × 10¹⁰ | 9.86 × 10¹⁰ | 0.17 | 0.74 | 1.60 |
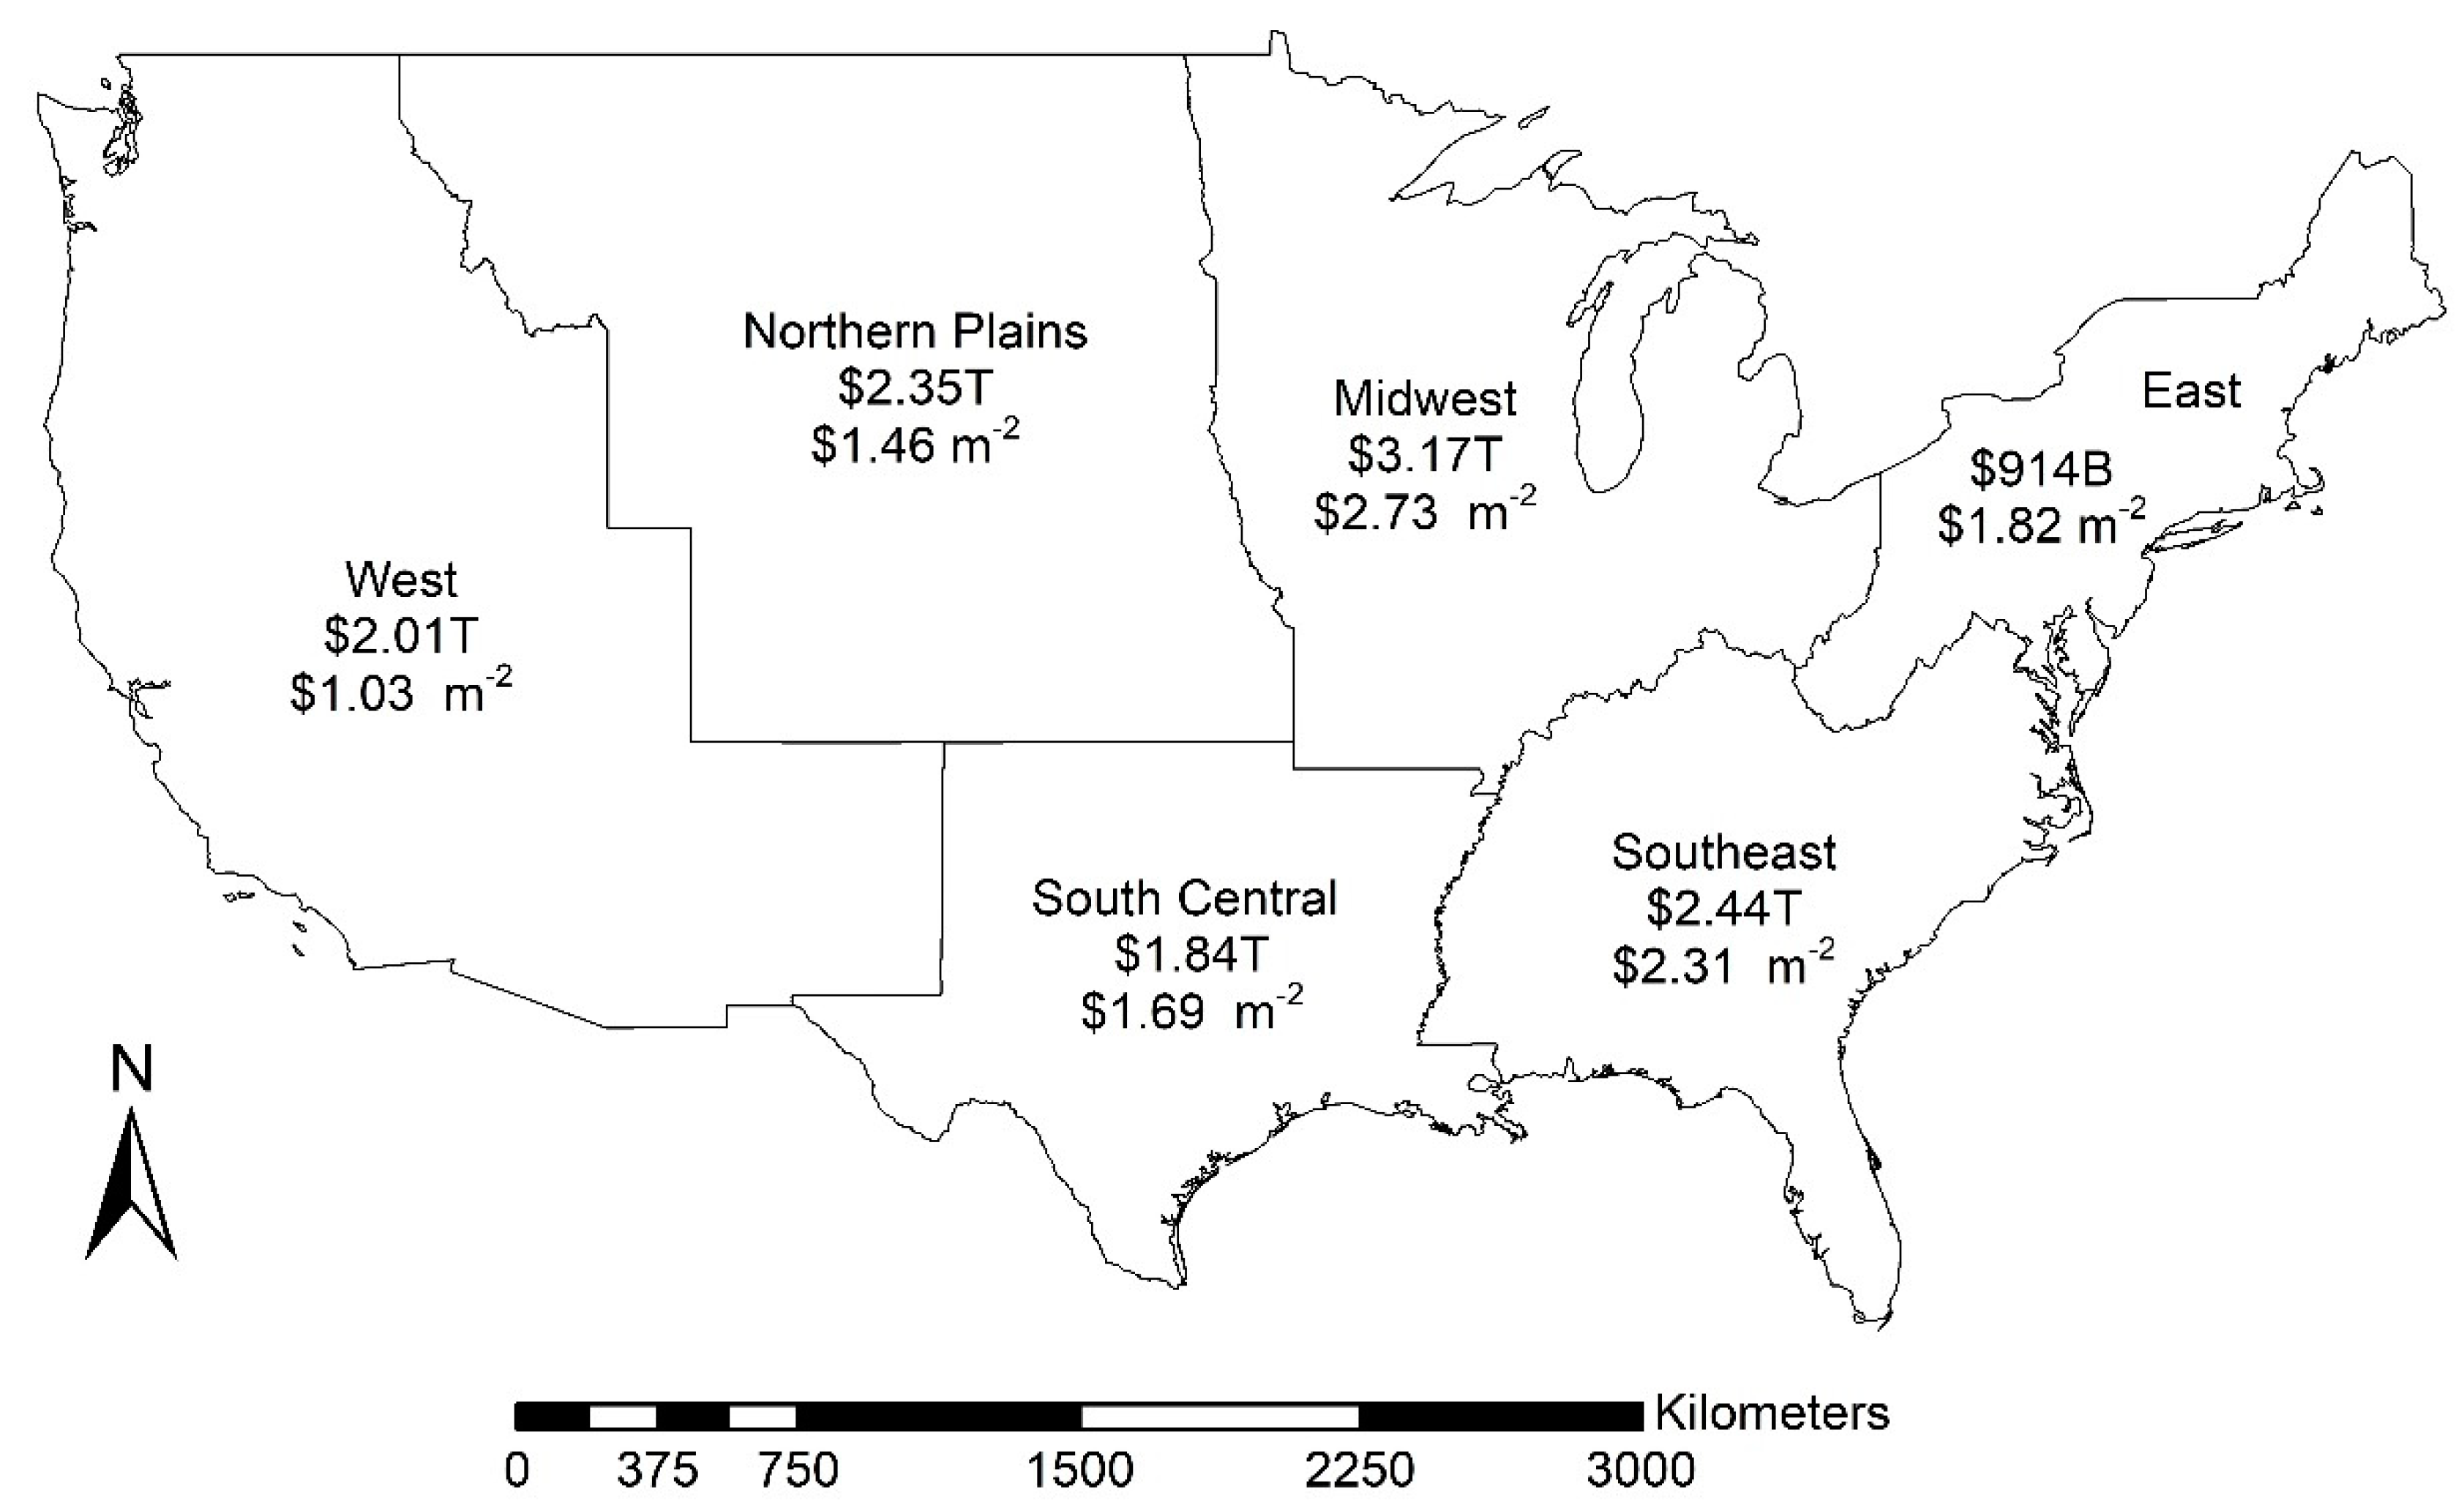
| (East) | 504,325 | 2.50 × 10¹¹ | 9.14 × 10¹¹ | 1.91 × 10¹² | 0.49 | 1.82 | 3.79 |
| Iowa | 143,801 | 2.95 × 10¹¹ | 4.53 × 10¹¹ | 6.29 × 10¹¹ | 2.05 | 3.16 | 4.37 |
| Illinois | 143,948 | 1.41 × 10¹¹ | 2.82 × 10¹¹ | 4.45 × 10¹¹ | 0.97 | 1.96 | 3.10 |
| Indiana | 93,584 | 8.22 × 10¹⁰ | 2.02 × 10¹¹ | 3.50 × 10¹¹ | 0.88 | 2.16 | 3.74 |
| Michigan | 147,532 | 2.55 × 10¹¹ | 5.48 × 10¹¹ | 9.21 × 10¹¹ | 1.72 | 3.71 | 6.24 |
| Minnesota | 209,223 | 3.57 × 10¹¹ | 8.34 × 10¹¹ | 1.47 × 10¹² | 1.71 | 3.99 | 7.01 |
| Missouri | 177,484 | 1.02 × 10¹¹ | 2.40 × 10¹¹ | 4.15 × 10¹¹ | 0.57 | 1.36 | 2.34 |
| Ohio | 105,442 | 5.22 × 10¹⁰ | 1.65 × 10¹¹ | 3.12 × 10¹¹ | 0.49 | 1.57 | 2.96 |
| Wisconsin | 140,542 | 1.93 × 10¹¹ | 4.45 × 10¹¹ | 7.82 × 10¹¹ | 1.37 | 3.17 | 5.56 |
| (Midwest) | 1,161,556 | 1.48 × 10¹² | 3.17 × 10¹² | 5.32 × 10¹² | 1.28 | 2.73 | 4.57 |
| Arkansas | 135,832 | 5.19 × 10¹⁰ | 1.66 × 10¹¹ | 3.13 × 10¹¹ | 0.39 | 1.22 | 2.31 |
| Louisiana | 109,273 | 6.87 × 10¹⁰ | 3.36 × 10¹¹ | 7.34 × 10¹¹ | 0.63 | 3.08 | 6.71 |
| Oklahoma | 176,647 | 8.92 × 10¹⁰ | 2.58 × 10¹¹ | 4.63 × 10¹¹ | 0.51 | 1.46 | 2.62 |
| Texas | 660,649 | 3.92 × 10¹¹ | 1.08 × 10¹² | 1.93 × 10¹² | 0.60 | 1.63 | 2.91 |
| (South Central) | 1,082,402 | 6.01 × 10¹¹ | 1.48 × 10¹² | 3.44 × 10¹² | 0.55 | 1.69 | 3.17 |
| Alabama | 130,948 | 5.17 × 10¹⁰ | 1.86 × 10¹¹ | 3.56 × 10¹¹ | 0.40 | 1.42 | 2.73 |
| Florida | 136,490 | 2.60 × 10¹¹ | 7.42 × 10¹¹ | 1.35 × 10¹² | 1.91 | 5.44 | 9.86 |
| Georgia | 149,285 | 1.01 × 10¹¹ | 3.10 × 10¹¹ | 5.67 × 10¹¹ | 0.68 | 2.08 | 3.80 |
| Kentucky | 101,847 | 2.99 × 10¹⁰ | 1.14 × 10¹¹ | 2.28 × 10¹¹ | 0.29 | 1.12 | 2.25 |
| Mississippi | 122,583 | 4.30 × 10¹⁰ | 1.97 × 10¹¹ | 3.81 × 10¹¹ | 0.35 | 1.60 | 3.11 |
| North Carolina | 125,522 | 1.61 × 10¹¹ | 4.30 × 10¹¹ | 7.77 × 10¹¹ | 1.28 | 3.42 | 6.19 |
| South Carolina | 78,489 | 6.36 × 10¹⁰ | 2.17 × 10¹¹ | 4.06 × 10¹¹ | 0.82 | 2.77 | 5.17 |
| Tennessee | 104,277 | 2.59 × 10¹⁰ | 1.14 × 10¹¹ | 2.29 × 10¹¹ | 0.25 | 1.09 | 2.19 |
| Virginia | 102,714 | 3.33 × 10¹⁰ | 1.27 × 10¹¹ | 2.50 × 10¹¹ | 0.32 | 1.23 | 2.43 |
| (Southeast) | 1,052,154 | 7.69 × 10¹¹ | 2.44 × 10¹² | 4.54 × 10¹² | 0.72 | 2.31 | 4.31 |
| Colorado | 253,888 | 9.72 × 10¹⁰ | 2.68 × 10¹¹ | 4.83 × 10¹¹ | 0.39 | 1.05 | 1.91 |
| Kansas | 212,325 | 1.72 × 10¹¹ | 4.28 × 10¹¹ | 7.17 × 10¹¹ | 0.82 | 2.02 | 3.37 |
| Montana | 350,837 | 1.35 × 10¹¹ | 3.52 × 10¹¹ | 6.42 × 10¹¹ | 0.39 | 1.00 | 1.83 |
| North Dakota | 178,589 | 1.42 × 10¹¹ | 4.42 × 10¹¹ | 8.19 × 10¹¹ | 0.80 | 2.48 | 4.59 |
| Nebraska | 198,419 | 1.23 × 10¹¹ | 3.06 × 10¹¹ | 5.11 × 10¹¹ | 0.62 | 1.54 | 2.57 |
| South Dakota | 191,914 | 1.27 × 10¹¹ | 3.53 × 10¹¹ | 6.23 × 10¹¹ | 0.66 | 1.85 | 3.25 |
| Wyoming | 229,275 | 5.99 × 10¹⁰ | 2.06 × 10¹¹ | 3.87 × 10¹¹ | 0.26 | 0.89 | 1.69 |
| (Northern Plains) | 1,615,247 | 8.56 × 10¹¹ | 2.35 × 10¹² | 4.18 × 10¹² | 0.52 | 1.46 | 2.59 |
| Arizona | 266,867 | 3.36 × 10¹⁰ | 1.54 × 10¹¹ | 3.05 × 10¹¹ | 0.12 | 0.59 | 1.14 |
| California | 353,973 | 1.37 × 10¹¹ | 4.13 × 10¹¹ | 7.46 × 10¹¹ | 0.39 | 1.17 | 2.11 |
| Idaho | 197,155 | 1.02 × 10¹¹ | 2.83 × 10¹¹ | 5.28 × 10¹¹ | 0.51 | 1.43 | 2.68 |
| New Mexico | 284,358 | 5.21 × 10¹⁰ | 2.30 × 10¹¹ | 4.46 × 10¹¹ | 0.18 | 0.80 | 1.57 |
| Nevada | 269,415 | 3.74 × 10¹⁰ | 1.37 × 10¹¹ | 2.72 × 10¹¹ | 0.14 | 0.51 | 1.00 |
| Oregon | 239,876 | 1.56 × 10¹¹ | 3.68 × 10¹¹ | 6.46 × 10¹¹ | 0.65 | 1.54 | 2.70 |
| Utah | 185,030 | 6.13 × 10¹⁰ | 1.61 × 10¹¹ | 2.88 × 10¹¹ | 0.34 | 0.88 | 1.56 |
| Washington | 161,881 | 1.12 × 10¹¹ | 2.63 × 10¹¹ | 4.64 × 10¹¹ | 0.69 | 1.63 | 2.86 |
| (West) | 1,958,556 | 6.92 × 10¹¹ | 2.01 × 10¹² | 3.70 × 10¹² | 0.35 | 1.03 | 1.89 |
| Totals | 7,374,238 | 4.64 × 10¹² | 1.27 × 10¹³ | 2.31 × 10¹³ | |||
| Ecosystem (Vegetation Type) | Mean Soil Profile C (Mg ha−1) | Topsoil Turnover Time (years) | Topsoil Soil Respiration (Mg ha−1) | Value of Topsoil Soil Respiration ($ ha−1) |
|---|---|---|---|---|
| Swamps and marshes | 723 | 520 | 2.0 | 84.0 |
| Tundra | 204 | 490 | 0.6 | 25.2 |
| Boreal forest | 206 | 91 | 3.2 | 134.4 |
| Temperate grassland | 189 | 61 | 4.4 | 184.8 |
| Tropical lowland forest | 287 | 38 | 10.9 | 457.8 |
| Desert scrub | 58 | 37 | 2.2 | 92.4 |
| Temperate forest | 134 | 29 | 6.6 | 277.2 |
| Cultivated soil | 79 | 21 | 5.4 | 226.8 |
| Tropical grassland | 42 | 10 | 6.3 | 264.6 |
© 2019 by the authors. Licensee MDPI, Basel, Switzerland. This article is an open access article distributed under the terms and conditions of the Creative Commons Attribution (CC BY) license (http://creativecommons.org/licenses/by/4.0/).
Share and Cite
Mikhailova, E.A.; Groshans, G.R.; Post, C.J.; Schlautman, M.A.; Post, G.C. Valuation of Soil Organic Carbon Stocks in the Contiguous United States Based on the Avoided Social Cost of Carbon Emissions. Resources 2019, 8, 153. https://doi.org/10.3390/resources8030153
Mikhailova EA, Groshans GR, Post CJ, Schlautman MA, Post GC. Valuation of Soil Organic Carbon Stocks in the Contiguous United States Based on the Avoided Social Cost of Carbon Emissions. Resources. 2019; 8(3):153. https://doi.org/10.3390/resources8030153
Chicago/Turabian StyleMikhailova, Elena A., Garth R. Groshans, Christopher J. Post, Mark A. Schlautman, and Gregory C. Post. 2019. "Valuation of Soil Organic Carbon Stocks in the Contiguous United States Based on the Avoided Social Cost of Carbon Emissions" Resources 8, no. 3: 153. https://doi.org/10.3390/resources8030153
APA StyleMikhailova, E. A., Groshans, G. R., Post, C. J., Schlautman, M. A., & Post, G. C. (2019). Valuation of Soil Organic Carbon Stocks in the Contiguous United States Based on the Avoided Social Cost of Carbon Emissions. Resources, 8(3), 153. https://doi.org/10.3390/resources8030153


