Article

The LCA Methodology for Ceramic Tiles Production by Addition of MSWI BA

1
CRITEVAT, Research Center of Engineering for the Protection and Enhancement of the Environment and the Territory, Sapienza University of Rome, 02100 Rieti, Italy
2
Department of Civil Engineering, La Sapienza University, 00184 Roma, Italy
3
Department of Theoretical and Applied Sciences, Insubria University, 21100 Varese, Italy
*
Author to whom correspondence should be addressed.
All the authors contributed equally to the present work.
Resources 2019, 8(2), 93; https://doi.org/10.3390/resources8020093
Submission received: 5 April 2019 / Revised: 6 May 2019 / Accepted: 7 May 2019 / Published: 11 May 2019

Abstract

:
Integrated waste management and sustainable use of natural resources are the basis of the Green Economy. In this context, the management of the Municipal Solid Waste Incineration Bottom Ashes (MSWI BA) is one of the current issues worldwide. This paper presents an application of the Life Cycle Assessment (LCA) procedure to the industrial production of ceramic tiles using bottom ashes in the mixture together with feldspathic sands and clays. The comparison between ashes and traditional mixture showed a similar mineralogical and rheological composition. In the reported procedure the MSWI BA, after storage, were treated to separate and recover metals. The residual ashes were added to the mixture and then they followed the traditional industrial production cycle. Samples of the different materials were taken during the experimental industrial activity and leaching tests were carried out to verify the environmental compatibility of MSWI BA use to produce ceramic tiles. The results of the LCA show large environmental and energy benefits related to the proposed reuse of BA. Metal recovery and lower use of clay in traditional mixture avoids emission of substances with a negative potential impact for environment. This study provides a sustainable alternative to the MSWI BA final disposal in landfill as MSWI BA are hazardous wastes that present complicated management and high disposal costs.

1. Introduction

In waste management, the measures used for waste recovery must be adopted with priority. The goal of disposal is to allocate material that cannot be reused in some other way. Therefore, a continuous search for innovative methods that allow the reuse of waste and not its disposal, is the task of an advanced society aiming towards sustainable development.
As reported by the Italian law (Legislative Decree n° 152/2006, art. 179), “Recycling” and “Recovery of the other types” must be preferred to “Landfill disposal”. Therefore, companies can include reuse and recovery of waste products in their production cycle, promoting the development of the Green Economy. Experimental industrial activity, i.e., the focus of this study, is in accordance with the Legislative Decree n° 152/2006 and is also in agreement with the Regional Smart Specialization Strategy. The Strategy proposes experimentation and commercialization of "bio-building" materials. The use of Municipal Solid Waste Incineration Bottom Ashes (MSWI BA) in the production of ceramic tiles is consistent with the previsions for their treatment from chapter 4.6.9 (“Bottom ash treatment using thermal systems”) of the European Commission document “Reference Document on the Best Available Techniques for waste incineration”. In Italy, Ministerial Decree 05/02/98 allows the recovery of bottom ashes from incineration in cement products (R5), however, there are no specific recommendations about the use of MSWI BA in the production of ceramic tiles. In this context, the authors drew up a procedural Protocol to achieve the technical compliance of floor tiles. In this Protocol, authorized by Regional Government Institution, there is a description of the tests to be carried out on materials involved in the reported study.
Under the framework of integrated waste management, the main goal is to use society’s waste in a sustainable way: Reuse of waste is an environmental and economic virtuous process. First, it reduces the amount of waste to be landfilled and second it allows the recycling of materials. The reuse of waste is also important for the economy because it is a way to relieve companies from difficulties by economic savings.
In this context, incineration represents a valid solution to avoid landfilling for different materials considered as solid wastes (i.e., Automotive Shredder Residual, ASR) [1,2,3,4,5] and, at the same time, it can be a source of energy. In Italy, according to the Superior Institute for Environmental Protection and Research, the active incinerators are 41 for a production of 1.4 million tons of Bottom Ashes [6]. Italy is the third nation in Europe with the highest number of incinerators, after France and Germany, which had respectively 128 and 80 active incinerators [6]. The European average of incinerated municipal solid waste is about 125 (kg/person*year), whereas in Italy it is approximately 90 (kg/person*year). Due to the considerable MSWI BA mass produced, different technological proposals are born for their recovery.
The recycling of MSWI BA could be transformed in an important resource, in fact this matter has been the argument of several scientific papers for more than 15 years [7,8,9,10]. In the literature there are reported different experiences showing the possibility to use MSWI BA as a component in concrete production [8,11], as an upgrading material in concrete aggregates production, or as part of the mixture for concrete products preparation [12]. There are also many examples of MSWI BA use in road construction [13,14].
Ceramic-based materials, which are manufactured at high temperatures into non-metallic and inorganic solid products (e.g., tiles, bricks, refractories), are used in several fields of engineering, due to their specific properties (i.e., good insulation and chemical resistance, high hardness, and high melting points). Ceramic-based products could be considered as ideal candidates for the incorporation of recycling materials, like MSWI BA, as a substitute of valuable and finite natural resources [15] exactly for the above-mentioned properties.
The present work deals with an experimental project in the south part of Latium Region, where an industrial plant was modified and adapted to produce ceramic tiles. The modified procedure is based on the addition of bottom ashes to the traditional mixture [16,17].
In the first part of the paper, a broad description of the experimental industrial process is reported. In the second part, the Life Cycle Assessment (LCA) procedure is used to evaluate the environmental impacts due to the production of ceramics materials using BA deriving from MSWI.
The LCA analysis aims to provide preliminary indications on the potentialities of the hypothesized MSWI BA recovery, evaluation of cumulative energy demand, and indicators of environmental impact.
The environmental benefit of a project, like the one presented, is not only connected to waste valorization, but it is also related to the consequent minor use of natural raw material and, obviously, to a more stable final disposal of these materials [18]. Using a given percentage (20–30%) of ashes to replace clay in the traditional mixture, it is possible to reduce exploitation of clay quarries. To use MSWI BA as replacement for clay it is necessary a treatment, allowing recovery of ferrous (Fe) and non-ferrous metals (NFe). The treatment allows for the preservation of the natural environment and to save energy. Specifically, the recovery of aluminum permits 95% of energy to be saved [19] compared to primary production and it also avoids extraction of primary non-renewable materials.

2. Case Study: Production Plant of Ceramic Tiles with Recovery of MSWI BA

The Bottom Ashes (BA) quantity utilized by the industrial plant to produce ceramic tiles can be estimated in around 32,000 tons per year. At the beginning, the material is stored for two months to allow the process of carbonation to occur. At the end of this period, treatments are applied to the stabilized ashes to remove metals. Fe metals are recovered using a magnetic separator and NFe metals are divided from the BA using an eddy current technology. Metals recovery is an important step, because the absence of this treatment can affect the BA use. In particular, the presence of iron can cause discoloration, while the presence of aluminum can induce the generation of hydrogen leading to swelling and a decrease in the mechanical properties of the structure [20]. After recovery of metals, residual BA are mixed with clay and then cooked to obtain ceramic tiles. In each production step samples were taken and then they were submitted to leaching and ecotoxicological tests to ensure compliance of environmental rules.

MSWI BA Composition

In order to determine the composition of BA, laboratory tests were carried out on a sample of the ashes collected after the removal of ferrous metals (Figure 1).
As shown in Table 1, the experimental result is comparable to the MSWI BA composition reported in many literature studies [15,21,22]. One of the most abundant elements in the ashes is silicon, which comes from glass and ceramic materials contained in the waste. The BA composition can present variations due to different waste management of countries. However, the majority elements found in BA composition are the same in all countries (Table 2).
The main mineralogical phases that are generally found in the MSWI BA are: Anhydrite, Calcite, Ettringite, Portlandite, Quartz, Feldspars, Dolomite, Galenite, and Magnetite. The mineralogical and rheological compatibility between the ashes and the traditional mixture can be affirmed by comparing their composition.
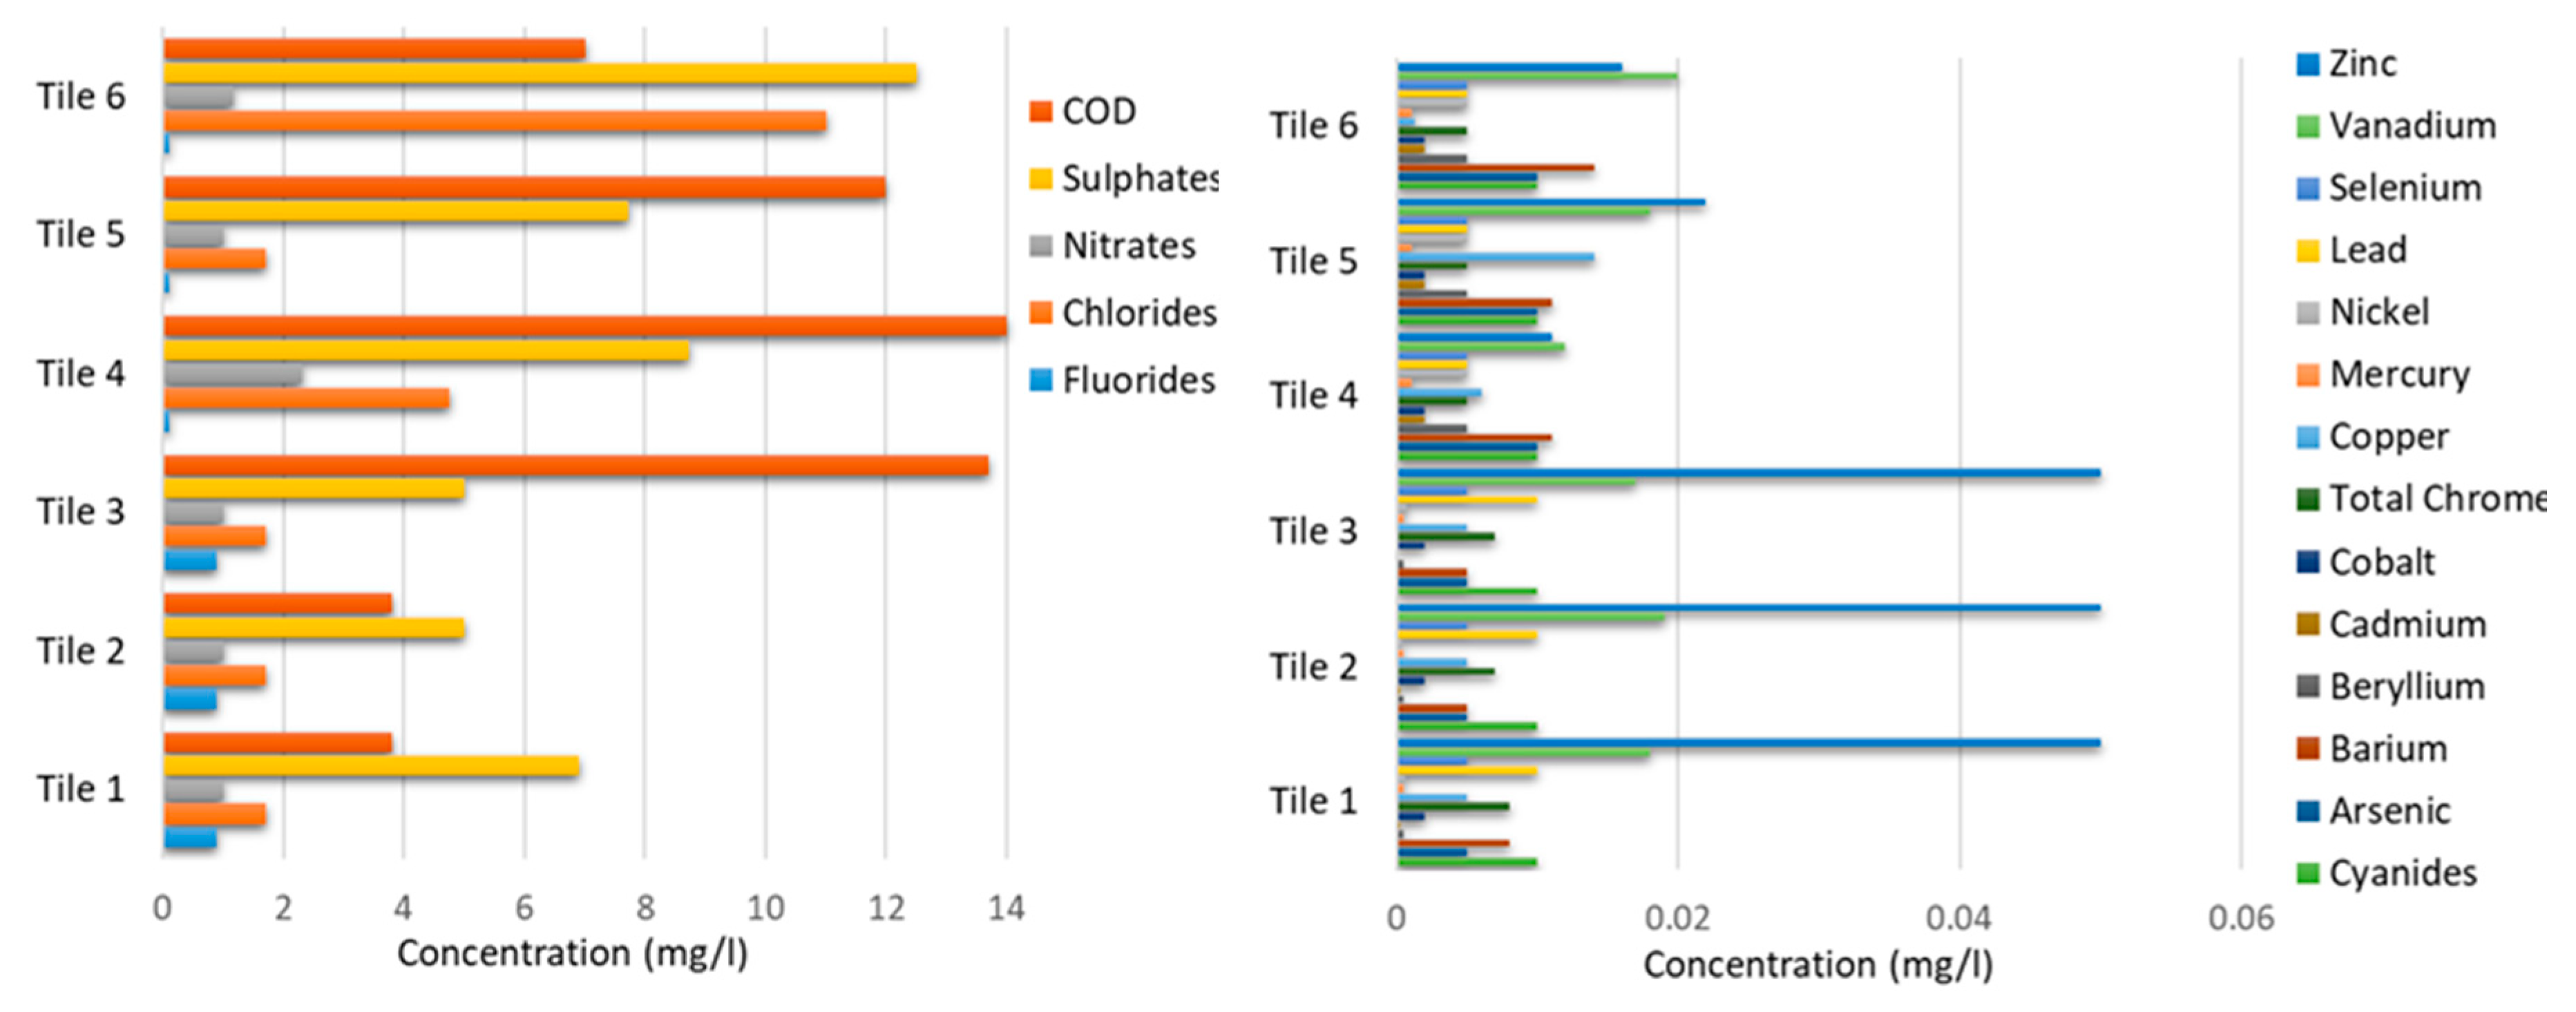
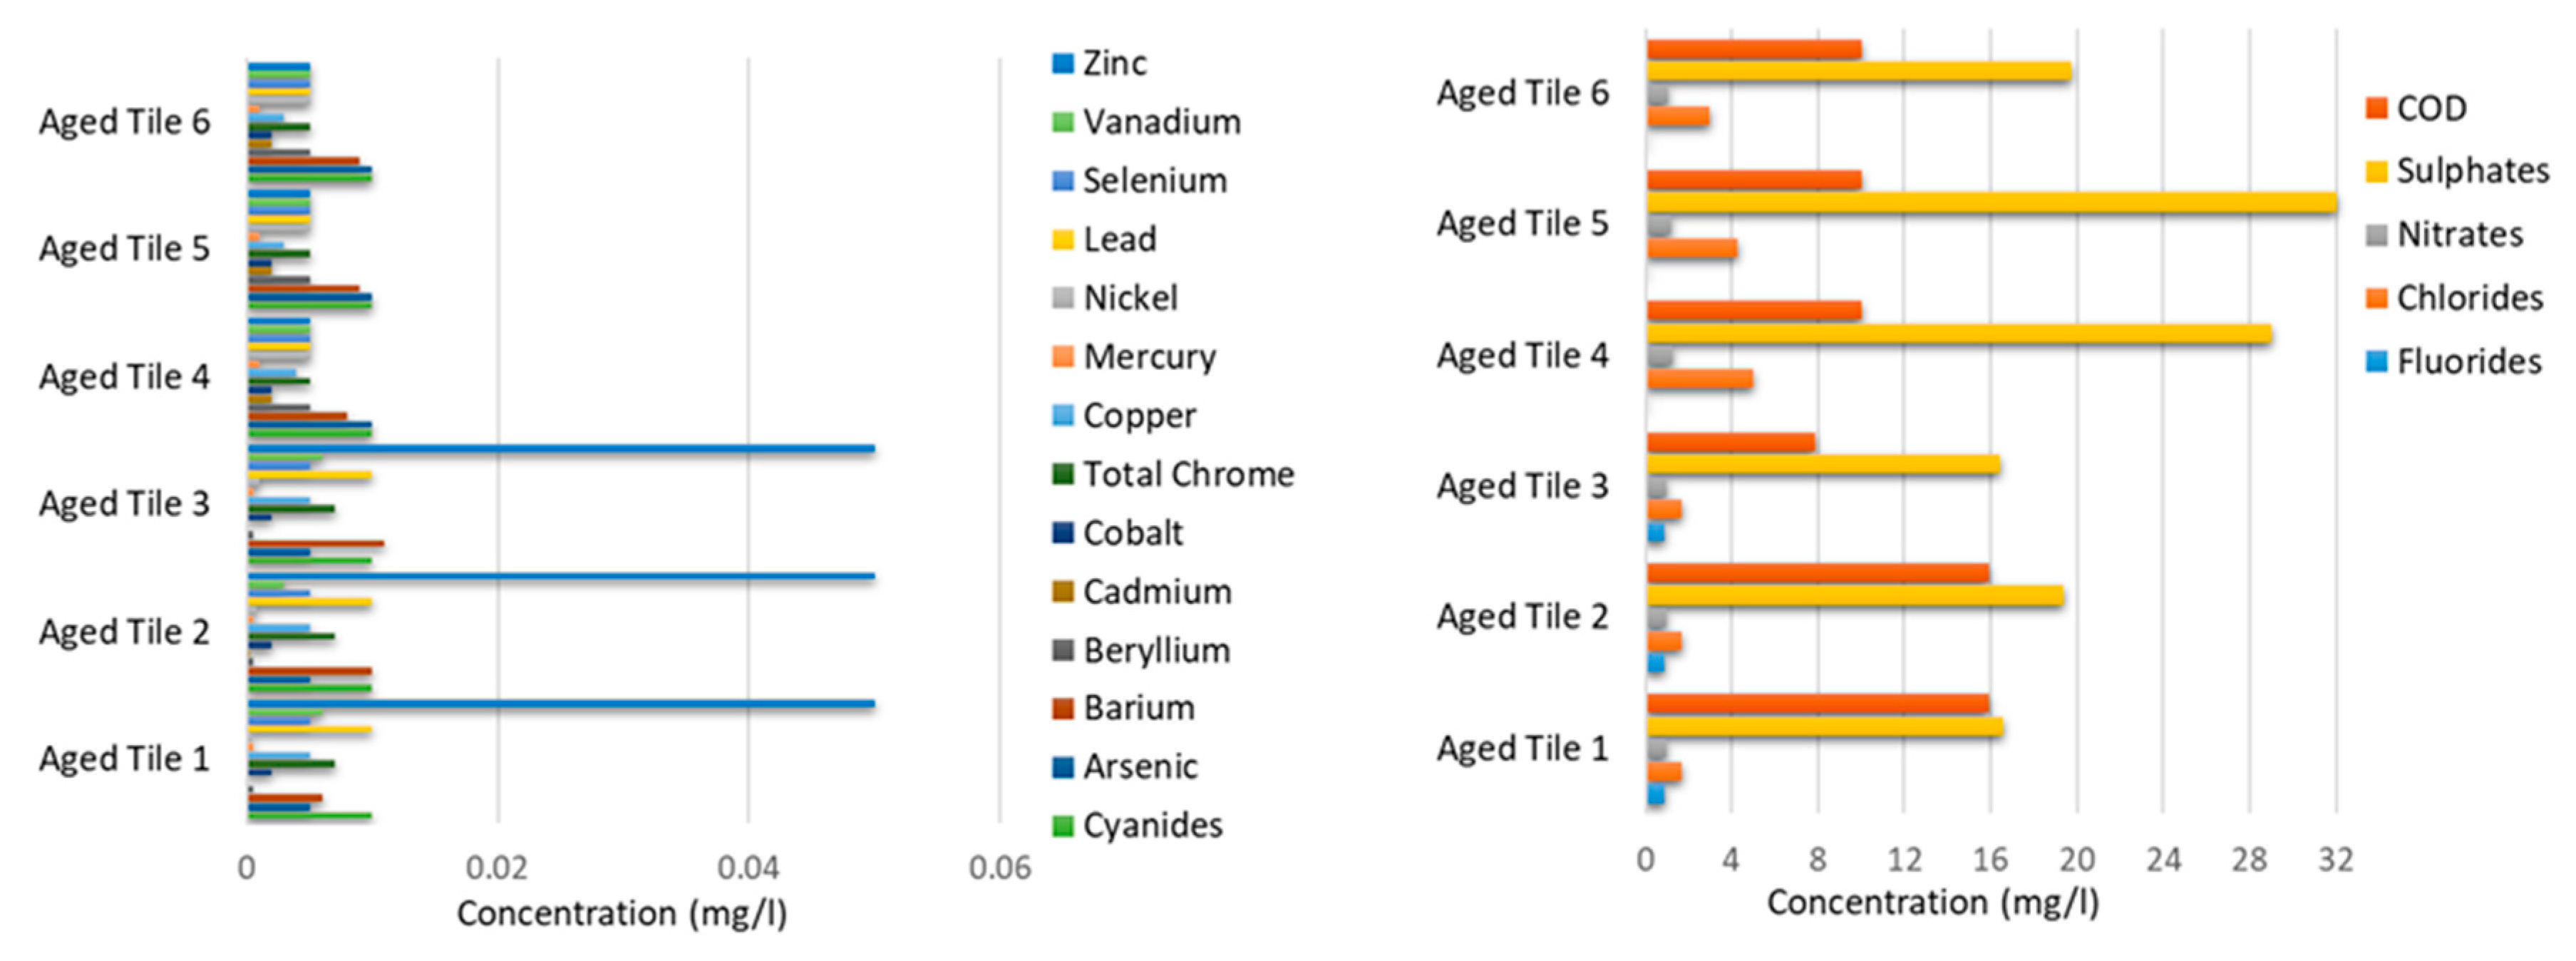
Leaching tests were performed on the collected samples using the standard procedures reported in UNI 10802 and in UNI EN 12457-2 (Compliance Test for Leaching of granular waste materials). Figure 2 and the Figure 3 show the measured concentrations of the substances before and after the duration tests i.e., freeze-thaw cycles (respectively “Tiles” and “Aged Tiles”).
In Figure 3 it can be noted that the concentrations of all the analytes, except for sulphates, decrease after the aging process of the durability tests.
The obtained results from the leaching tests on the tiles show the suitability of the MSWI BA to be reused to produce ceramic tiles.

3. LCA Procedure

LCA is a procedure to evaluate the environmental burdens associated with a product, a process, or an activity by quantifying used energy and materials and wastes released to the environment. LCA is also applied to assess the impact of used and released energy and materials, and to evaluate opportunities to enhance the environment. The assessment includes the entire life cycle of the product, process, or activity and thus it encompasses extraction and processing of raw materials, manufacturing, transport, distribution, use, reuse, maintenance, recycling, and final disposal [23]. ISO 14040 sets out the principles and frameworks for life cycle assessment described in different literatures [24,25,26] and it includes: definition of the LCA goal and scope, the Life Cycle Inventory (LCI) analysis phase, the Life Cycle Impact Assessment (LCIA) phase, the life cycle interpretation phase, a critical review of the LCA, limitations of the LCA, the relationship between the LCA phases, conditions for use of the chosen values, and optional elements [27,28].

3.1. Goal and Scope Definition

The goal of the applied LCA procedure is to evaluate the environmental impacts (avoided and produced) due to reuse of inert materials from bottom ashes, in the production of ceramics tiles.
The LCA procedure was performed for two scenarios (1 and 2) and their results were compared. To evaluate the LCA steps, the environmental indicators were calculated based on a time of 100 years, thus to avoid uncertainties due to eventual considerations regarding long exposure time.
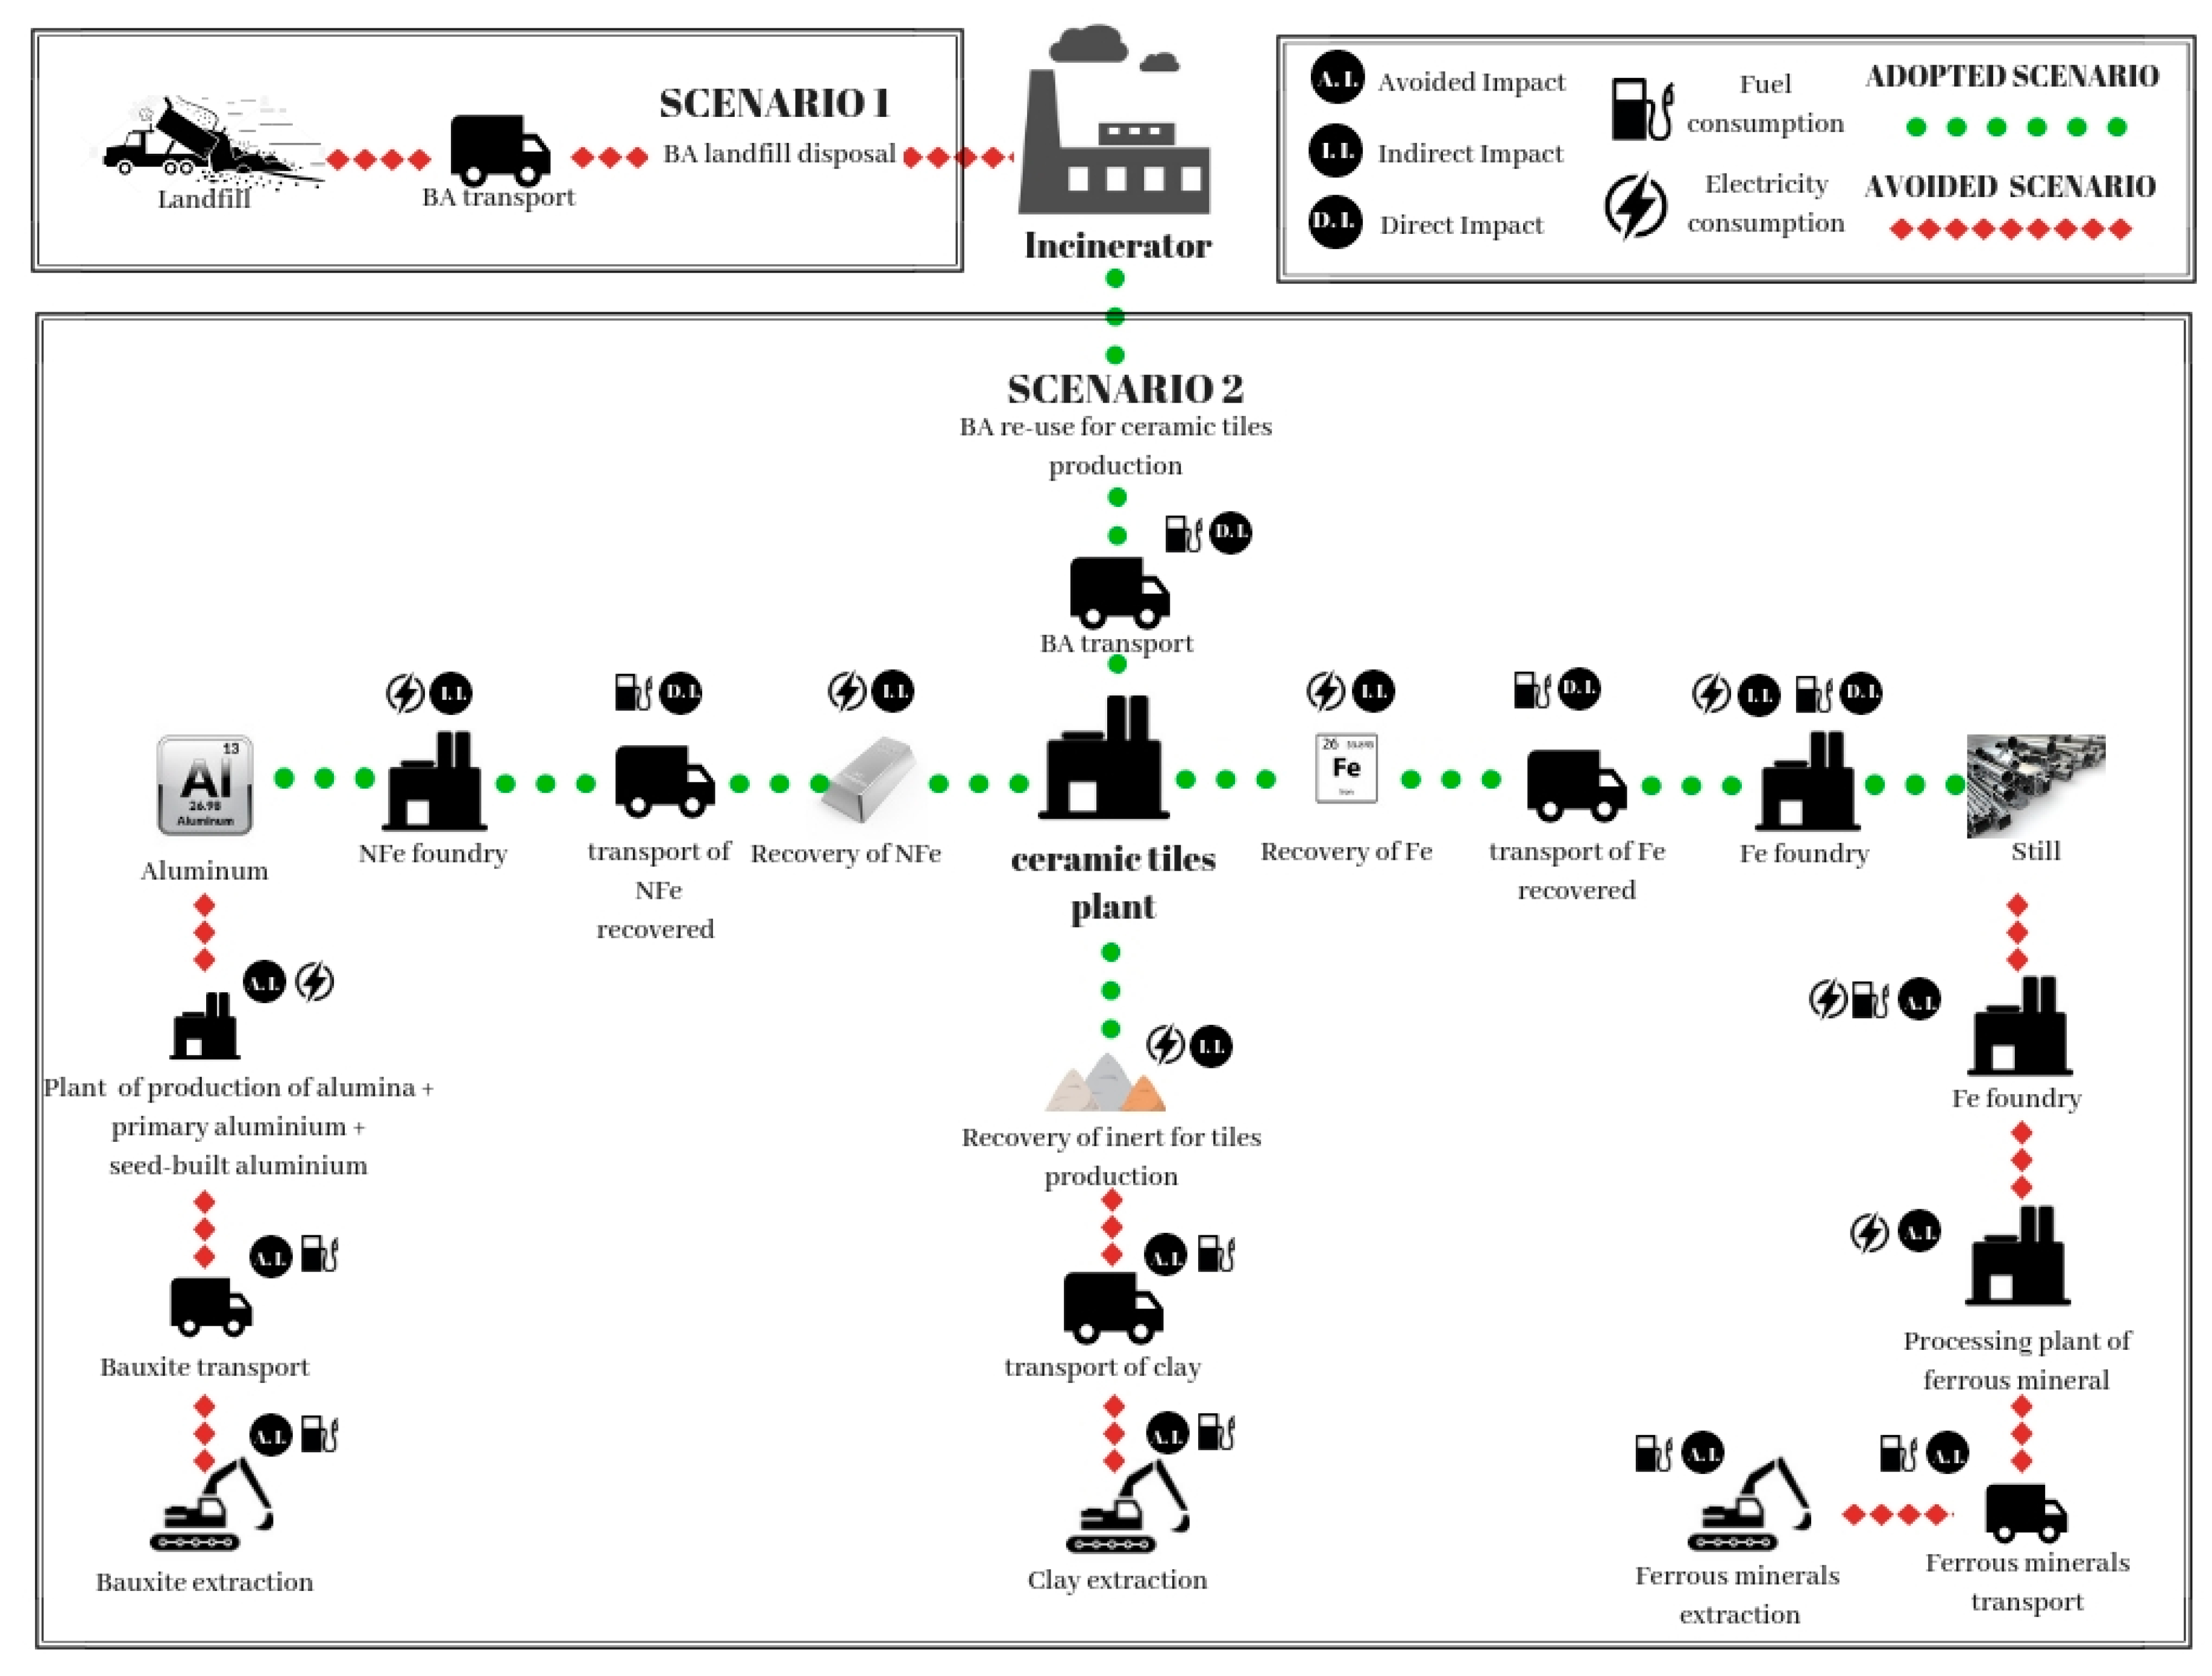
Scenario 1 describes the hypothesis of BA disposal in landfill (Figure 4). It is assumed to transport BA to the closest landfill site for special and hazardous waste whose distance from the incinerator is 32 km. In this scenario the impacts caused by transport emission and by leachate were regarded. To evaluate the composition of leachate we used the results of the previously described test (Figure 1) and the data directly available from the industrial plant considered.
Scenario 2 describes the processes to recover materials from BA and the subsequent activities of their recycling (Figure 4). It is assumed that recycled NFe and Fe are respectively reused for secondary production of aluminum and steel, avoiding manufacture of the same quantity of primary materials. The LCA was applied considering the impacts produced by BA transport from incinerator to the industrial plant and by the activities to recover Fe and NFe (Figure 4). The avoided impacts caused by BA disposal in landfill and by the activities related to the primary production of metals and of inertial materials were also regarded (Figure 4).
Specifically, recovery of NFe avoids primary extraction of 4 kg of bauxite for each kg of aluminum [29] and recovery of Fe avoids primary extraction of 1.37 kg of magnetite for each kg of iron scraps [30]. In this study extraction of primary minerals was assumed to be carried out in the closest quarry to the industrial plant. The quarries for bauxite and magnetite extraction are located respectively 262 and 3000 km from the ceramic tiles plant. Moreover, while the secondary production of aluminum involves energy saving, for secondary iron it is assumed that Fe scraps are ready to be sent to foundry involving the same energy spending of primary production. The treatment of Fe minerals consists of different milling processes [31] that present similarities with the treatment of BA. For the metal’s recovery, it was considered that the oxidation of them during the incineration [32] and the quantitation of impurities during the re-melting of scrap can cause both lower recycling returns between the primary product and the secondary product [33]. Thus, a foundry performance of 90% is assumed. The recycled inert material is reused as a substitution for the clay at a quantity of 30% in the mixture to obtain ceramic tiles, thus it was assumed to represent the missed extraction of clay for the same quantity. The quarry for clay extraction is located at 1660 km from the production plant.

3.2. Modeling Framework and Life Cycle Inventory

The software used for the LCA application was derived from the implementation of the Solid Wastes Flows Optimization program for the integrated management of Municipal Solid Waste according to the LCA method, developed by “La Sapienza” University of Rome. The software provides air, soil, water emissions (related to fuel and energy consumption) and environmental impact indicators. Additional data refer to activities due to treatment of BA with material recovery. The data used in this paper are a combination of literature and experimental values (Table 3). The comparison between them and the values range proposed in literature shows the suitability of the used data in our LCA application (Table 4).
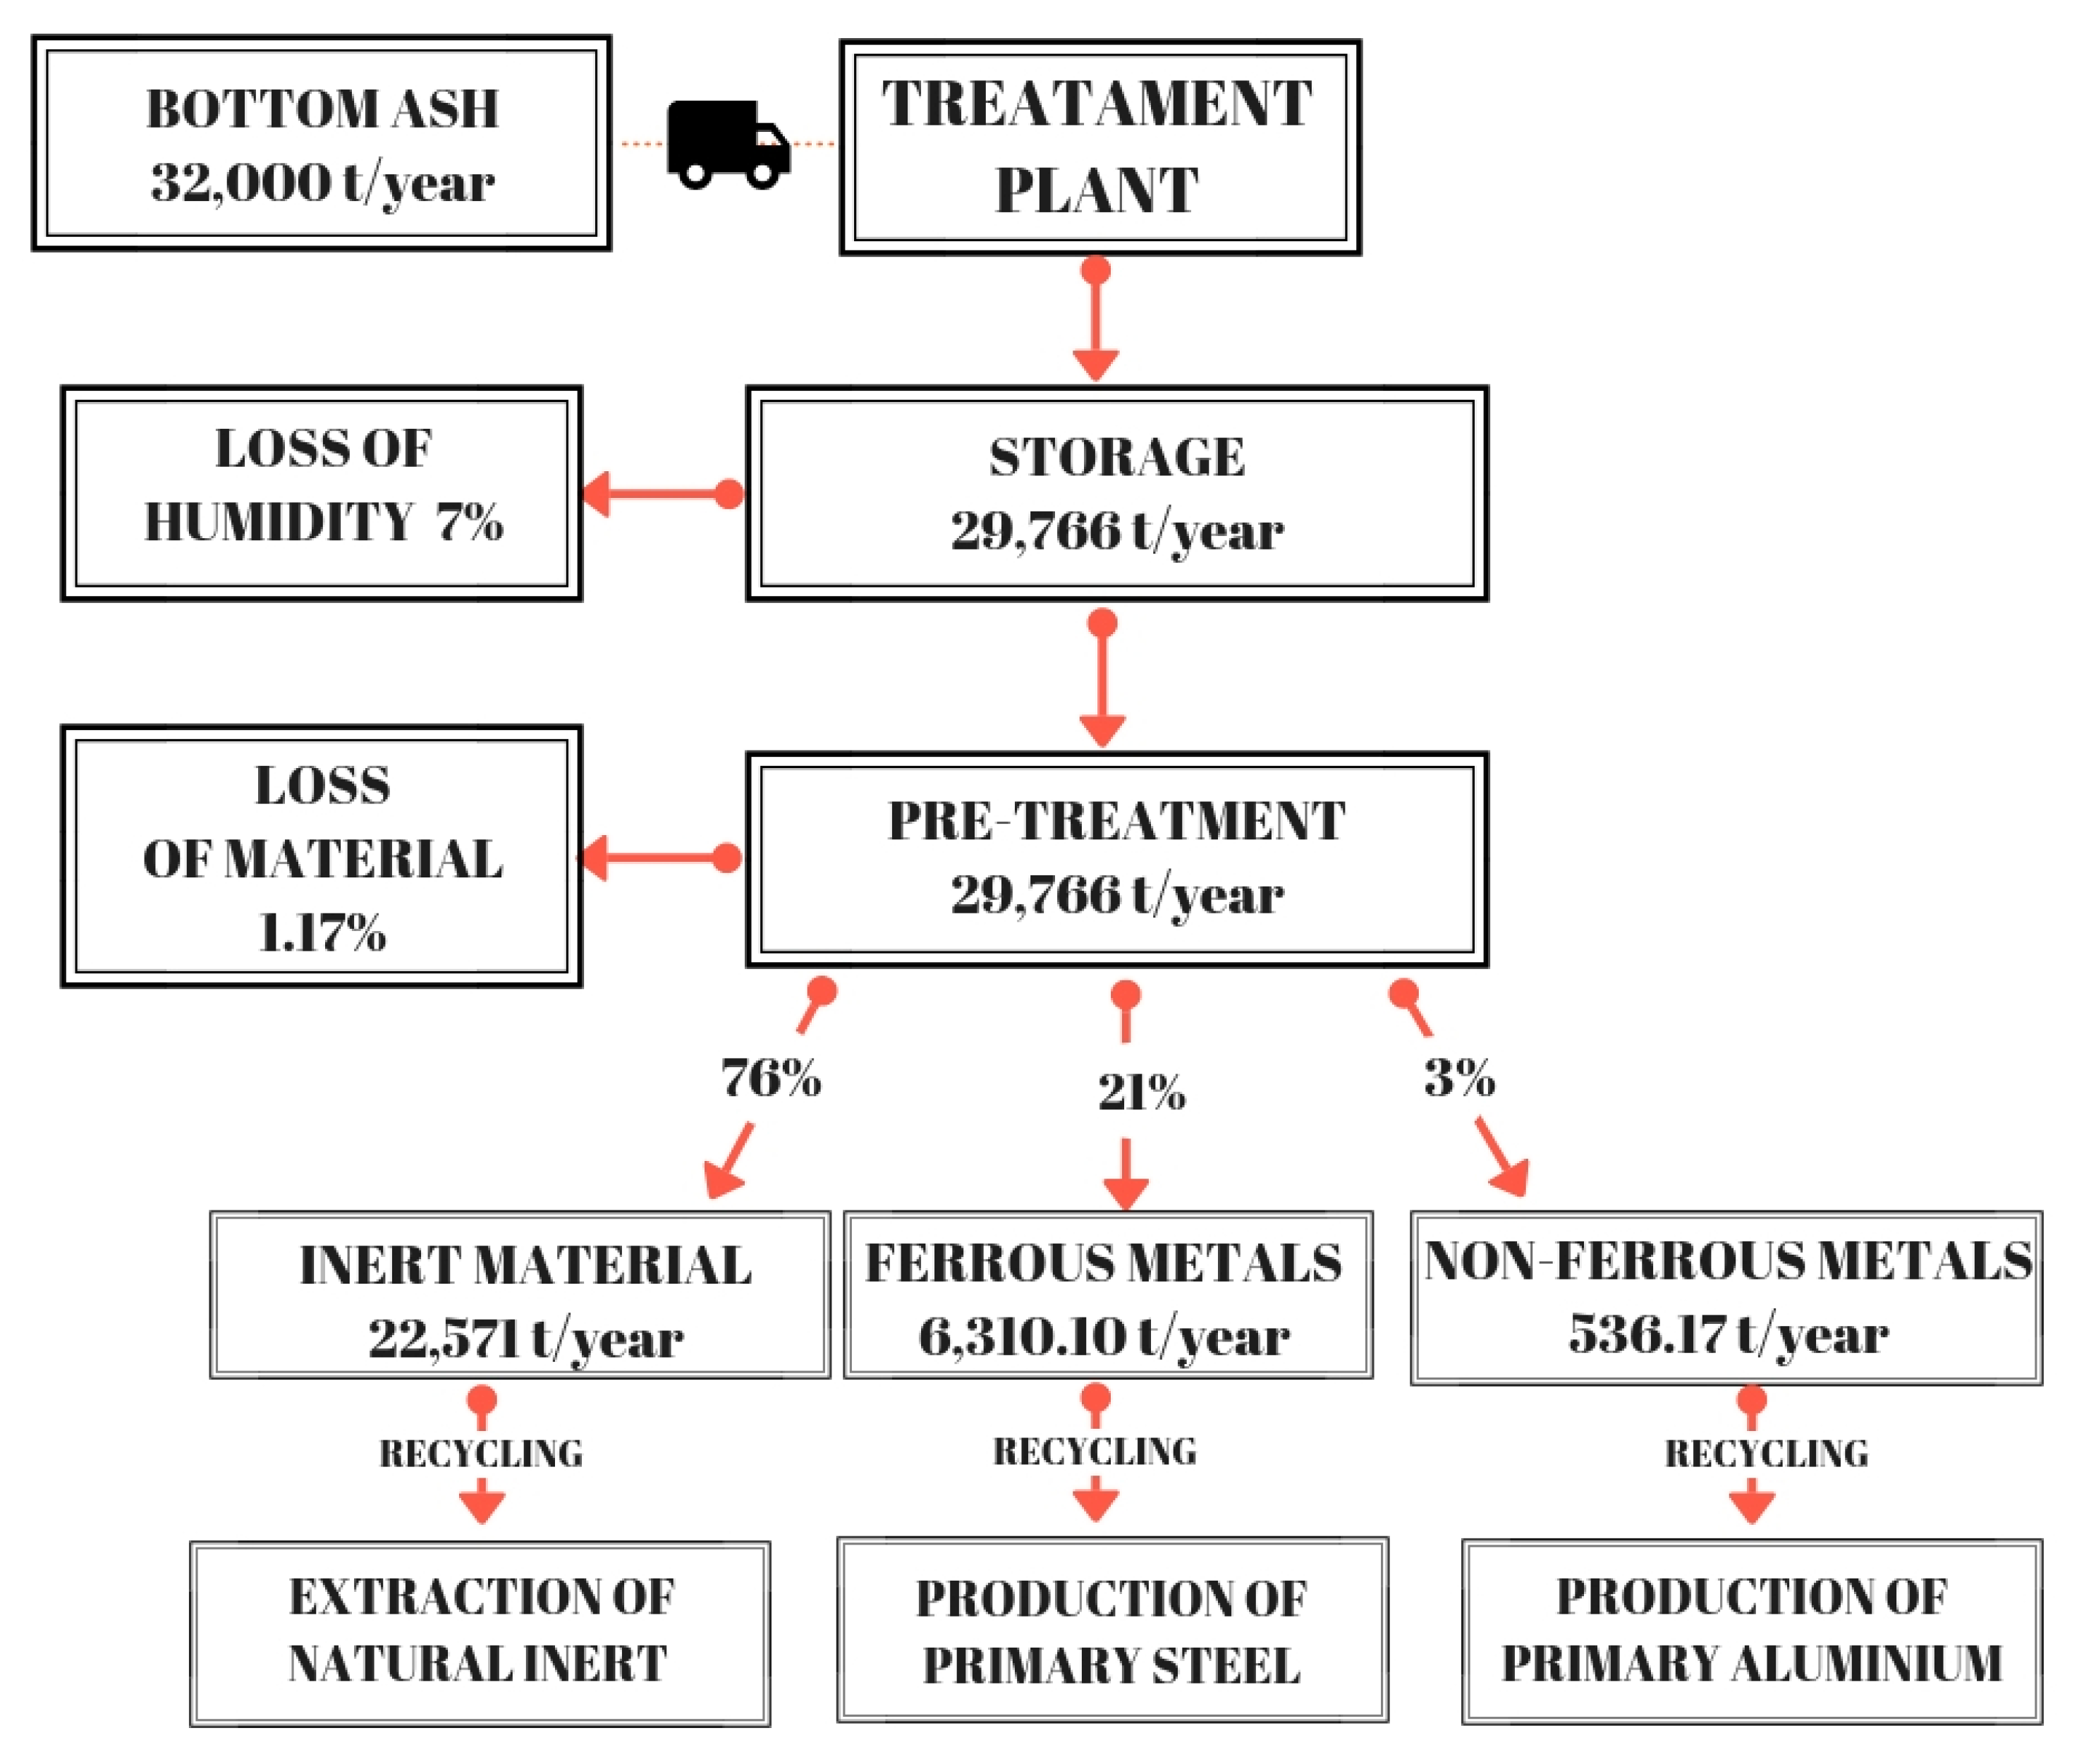
Based on the information acquired from the considered industrial plant, the material balance can be summarized as follows (Figure 5):
  • BA arriving at the industrial plant contain 13% of humidity. During storage, they lose 7% of initial humidity by evaporation and leaching. The produced leachate represents 10% of humidity loss and it is collected through a sewage system.
  • After BA storage, metals are separated by the ashes. A mass of Fe corresponding to 21% of the total ashes is recovered using a magnetic separator belt and a magnetic separator drum. Recovery of NFe is about 3% of the total ashes and was obtained by an Eddy Current Separator (ECS).
  • The residual BA is utilized to produce the ceramic tiles.
The choice of the technologies and of raw material supply used in the study is based on data provided by the industrial plant.
By comparing information sheets from different treatment plants [35], it follows that the recovery of Fe and NFe are respectively higher at 11% and 2% compared to other treatment plants in Italy.

3.3. Life Cycle Impact Assessment

The main task of this phase is to convert LCI data in aggregated indexes able to measure the environmental impacts of the system. Due to the lack of a generally accepted way of assessing the value of the damage to ecosystems, it is possible to refer to the guidelines expressed by the ISO regulations 14041 and 14042—“Environmental management Life Cycle Assessment” [27,28]. They are based on the following procedure:
  • selection of impact categories;
  • classification;
  • characterization.
Six categories of potential impacts have been identified:
  • Global Warming Potential (GWP);
  • Photochemical Ozone Creation Potential (POCP);
  • Acidification Potential (AP);
  • Eutrophication Potential (EP);
  • Human Toxicity Potential (HTP);
  • Resources Depletion Potential (RDP).
The above listed impact categories are the more commonly used for assessment of the impact on the global as well as the regional scale. This is because they have been more widely studied and introduced in many international protocols for Environmental Quality Control, signed by many nations worldwide.
In the classification step, all substances are sorted into classes according to the effect they cause on the environment. Certain substances can be included in more than one class.
Once substances are aggregated within each class, it is necessary to produce an effect potential (EfP). This cannot be done by simply adding up the quantities of substances involved, as some substances may have a more intense effect than others. To overcome this problem weighting factors, generally referred to as Equivalence Factors (EFs), are applied to the different substances, according to the Environmental Design of Industrial Products (EDIP) characterization method [41,42].
The EF of a given substance represents the potential impact of a unit mass of that substance relative to some reference substances, referred to as the common unit of the category indicator.
For example, referring to GWP, the common unit is carbon dioxide (CO2) and consequently the EF of a given greenhouse gas i (EFi) is defined as:
E F G W i = i n t e n s i t y   o f   t h e   e f f e c t s   o n   G W   d u e   t o   g a s i i n t e n s i t y   o f   t h e   e f f e c t s   o n   G W   d u e   t o   C O 2
The list of EFs assumed in this study are reported in Table 5 [43]. As a consequence, the global potential effect for each impact category can be calculated as the amount of emissions multiplied by their specific EF:
E f P j = i ( Q i × E F i j )
where Qi is the total of the i-th substance produced (t/year) and EFij is the Equivalence Factor of the i-th substance referred to the j-th impact class.
The potential impacts can be classified as reported below:
  • Direct impacts, which account for effects directly related to a given impact class;
  • Indirect impacts, which account for possible effects associated to a given impact category due to a transformation after primary emission;
  • Avoided impacts, which consider the saved impacts due to the presence of profitable outputs. They are equivalent to the impacts that would have occurred in actual production of the same amount of recovered energy and they need to be deducted from the impacts caused by other processes.
The considered impacts in the two described scenarios are reported in Table 3 and shown in Figure 4. In the first scenario the direct impacts produced by BA transport from incinerator to landfill and by leachate were regarded. In the second scenario the direct impacts related to the transport of BA from incinerator to industrial plant and of recovered metals to foundry were accounted. In scenario 2 we considered also indirect and avoided impacts. Specifically, the indirect impacts produced by energy consumption for BA treatment and for Al secondary production were taken into account. The avoided impacts related to the first scenario and to the primary production of NFe (Bauxite extraction, its transport from quarry to foundry, Bayer treatment, and Electrolytic process), Fe (Ferrous minerals extraction, their transport from quarry to foundry, and their treatment) and inert material (clay extraction and transport from quarry to the industrial plant) were regarded.
GWP
Global Warming is a phenomenon caused by greenhouse gases. Natural greenhouse gases are water vapor (H2O), methane (CH4), carbon dioxide (CO2), nitrogen peroxide (N2O), and ozone (O3).
GWP is calculated for each greenhouse gas (GWPi), considering their radiation absorption capacity and time spent in the atmosphere. For its quantification standardization factors are used, which refer to the kg of equivalent CO2.
AP
Air acidification is an environmental problem involving air, water, and soil. A substance causes a contribution to acidification if it is able to increase the concentration of hydrogen ions in the environment. Standardization factors that refer to the kg of equivalent SO2 are used for its estimation.
EP
Eutrophication is an impact on the ecosystem caused by an excessive supply of substances (nutrients) containing nitrogen (N) or phosphorus (P).
The standardization of eutrophication takes place by reporting the quantities of the inventoried substances to the kg of NO3 or to the kg of PO4 equivalents.
POCP
Photochemical ozone creation is a phenomenon due to the presence of unburnt hydrocarbons and nitrogen oxides that contribute to ozone formation in presence of solar radiation. Ethylene is used for the standardization of POCP, therefore, evaluation takes place expressing the gases capable of producing ozone in kg of equivalent ethylene.
HTP
The potential of human toxicity is an equivalent factor of toxic potential that is introduced by the definition of potential harm of a released chemical unit. Standardization factors that refer to the kg of equivalent dichlorobenzene are utilized for the HTP evaluation.
RDP
Resource depletion is defined as the decrease in the availability of natural resources. In this study the method proposed by the Centre of Environmental Science of Leiden University [44] was used to express the reduction of non-renewable resources. This method expresses the consumption of non-renewable resources in terms of the fraction of known reserves, adopting an appropriate weight factor (Fi):
F i = 1 R i
where Ri (kg) indicates the reserve still available referred to the analyzed resource.
The total value of the Ri index, which quantifies the overall impact on the category in question, is therefore calculated as follows:
R D P = i F i m i
where Fi is the weight factor of the i-th consumed resourced and mi is the mass (kg) of consumed resource.

4. Results and Discussion

The LCA results, reported in Table 6, are obtained using the whole BA quantity utilized by the industrial plant (32,000 t/year).
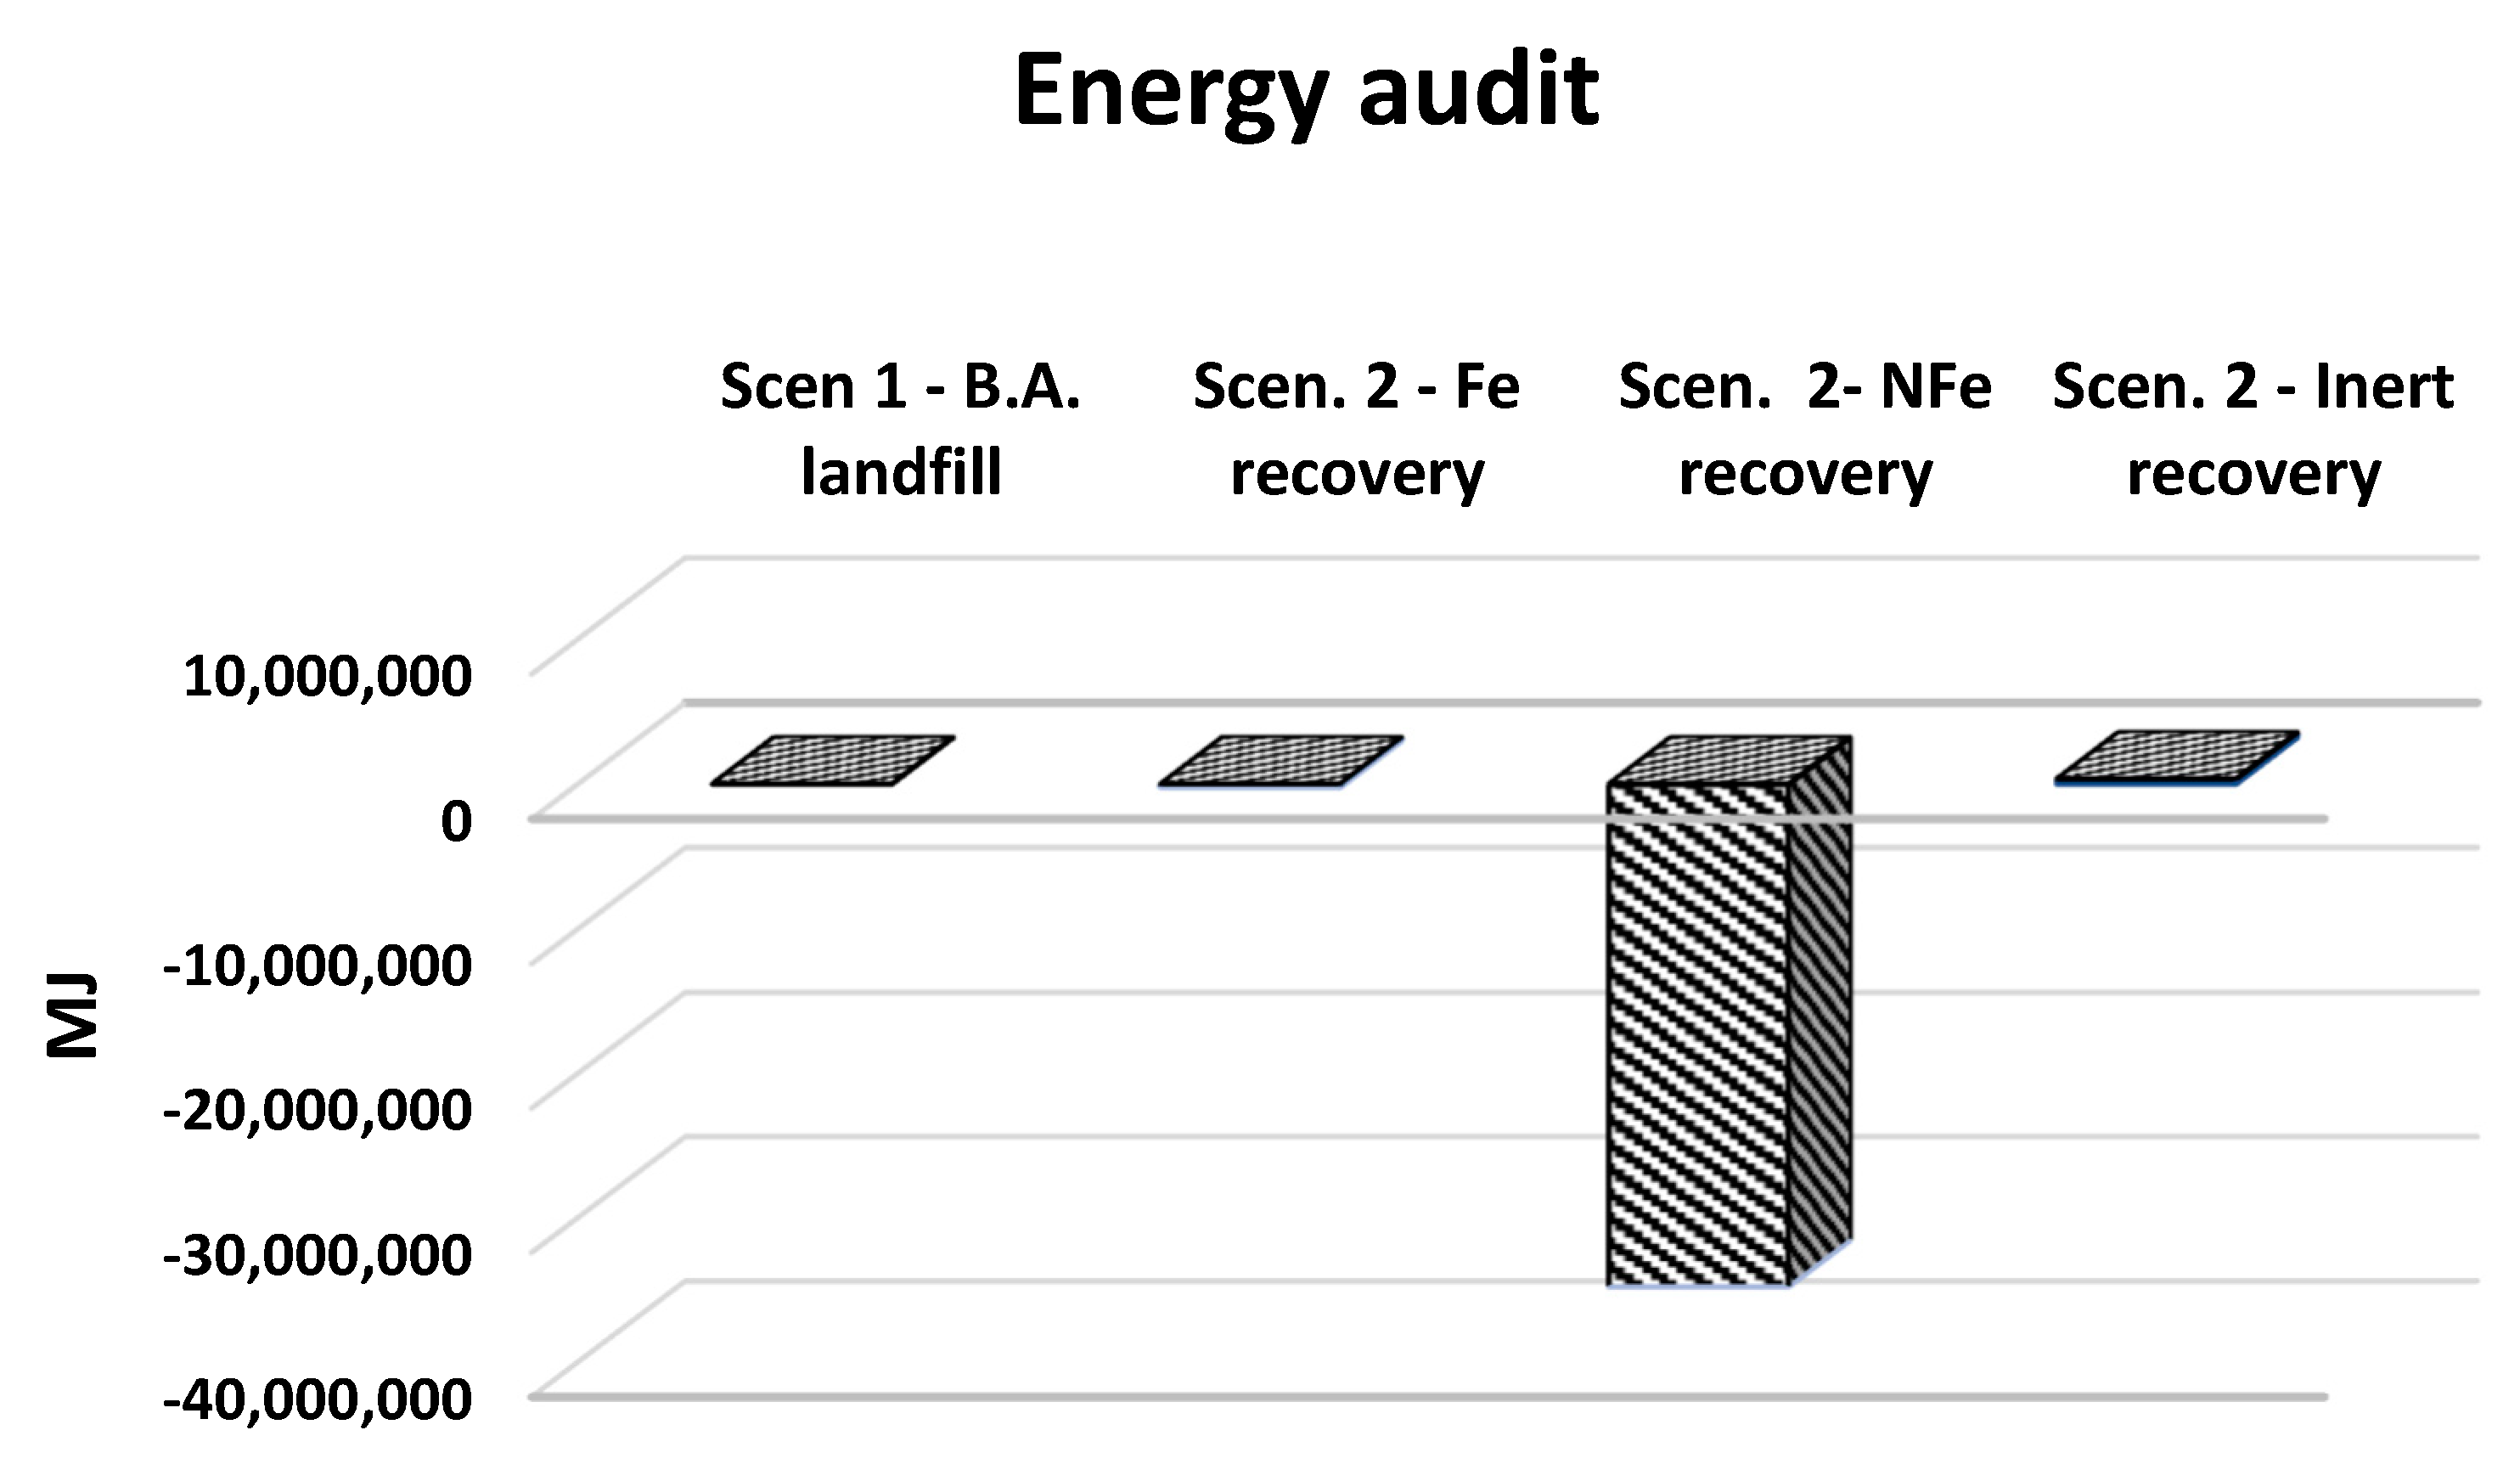
The final energy audit is negative (Figure 6), where negative values indicate that avoided impacts are greater than the added impacts to the environment due to the recovery activity. The higher energy saving is due to the recovery of NFe, because for the secondary production of aluminum is one-twentieth of the necessary energy for primary production (aluminum is the metal with the highest energy intensity needed for extraction on a world scale [19]). However, the drawbacks of using low-quality Al scrap in refining processes were not included because of a lack of quantitative data, suggesting actual benefits could be somewhat smaller [45].
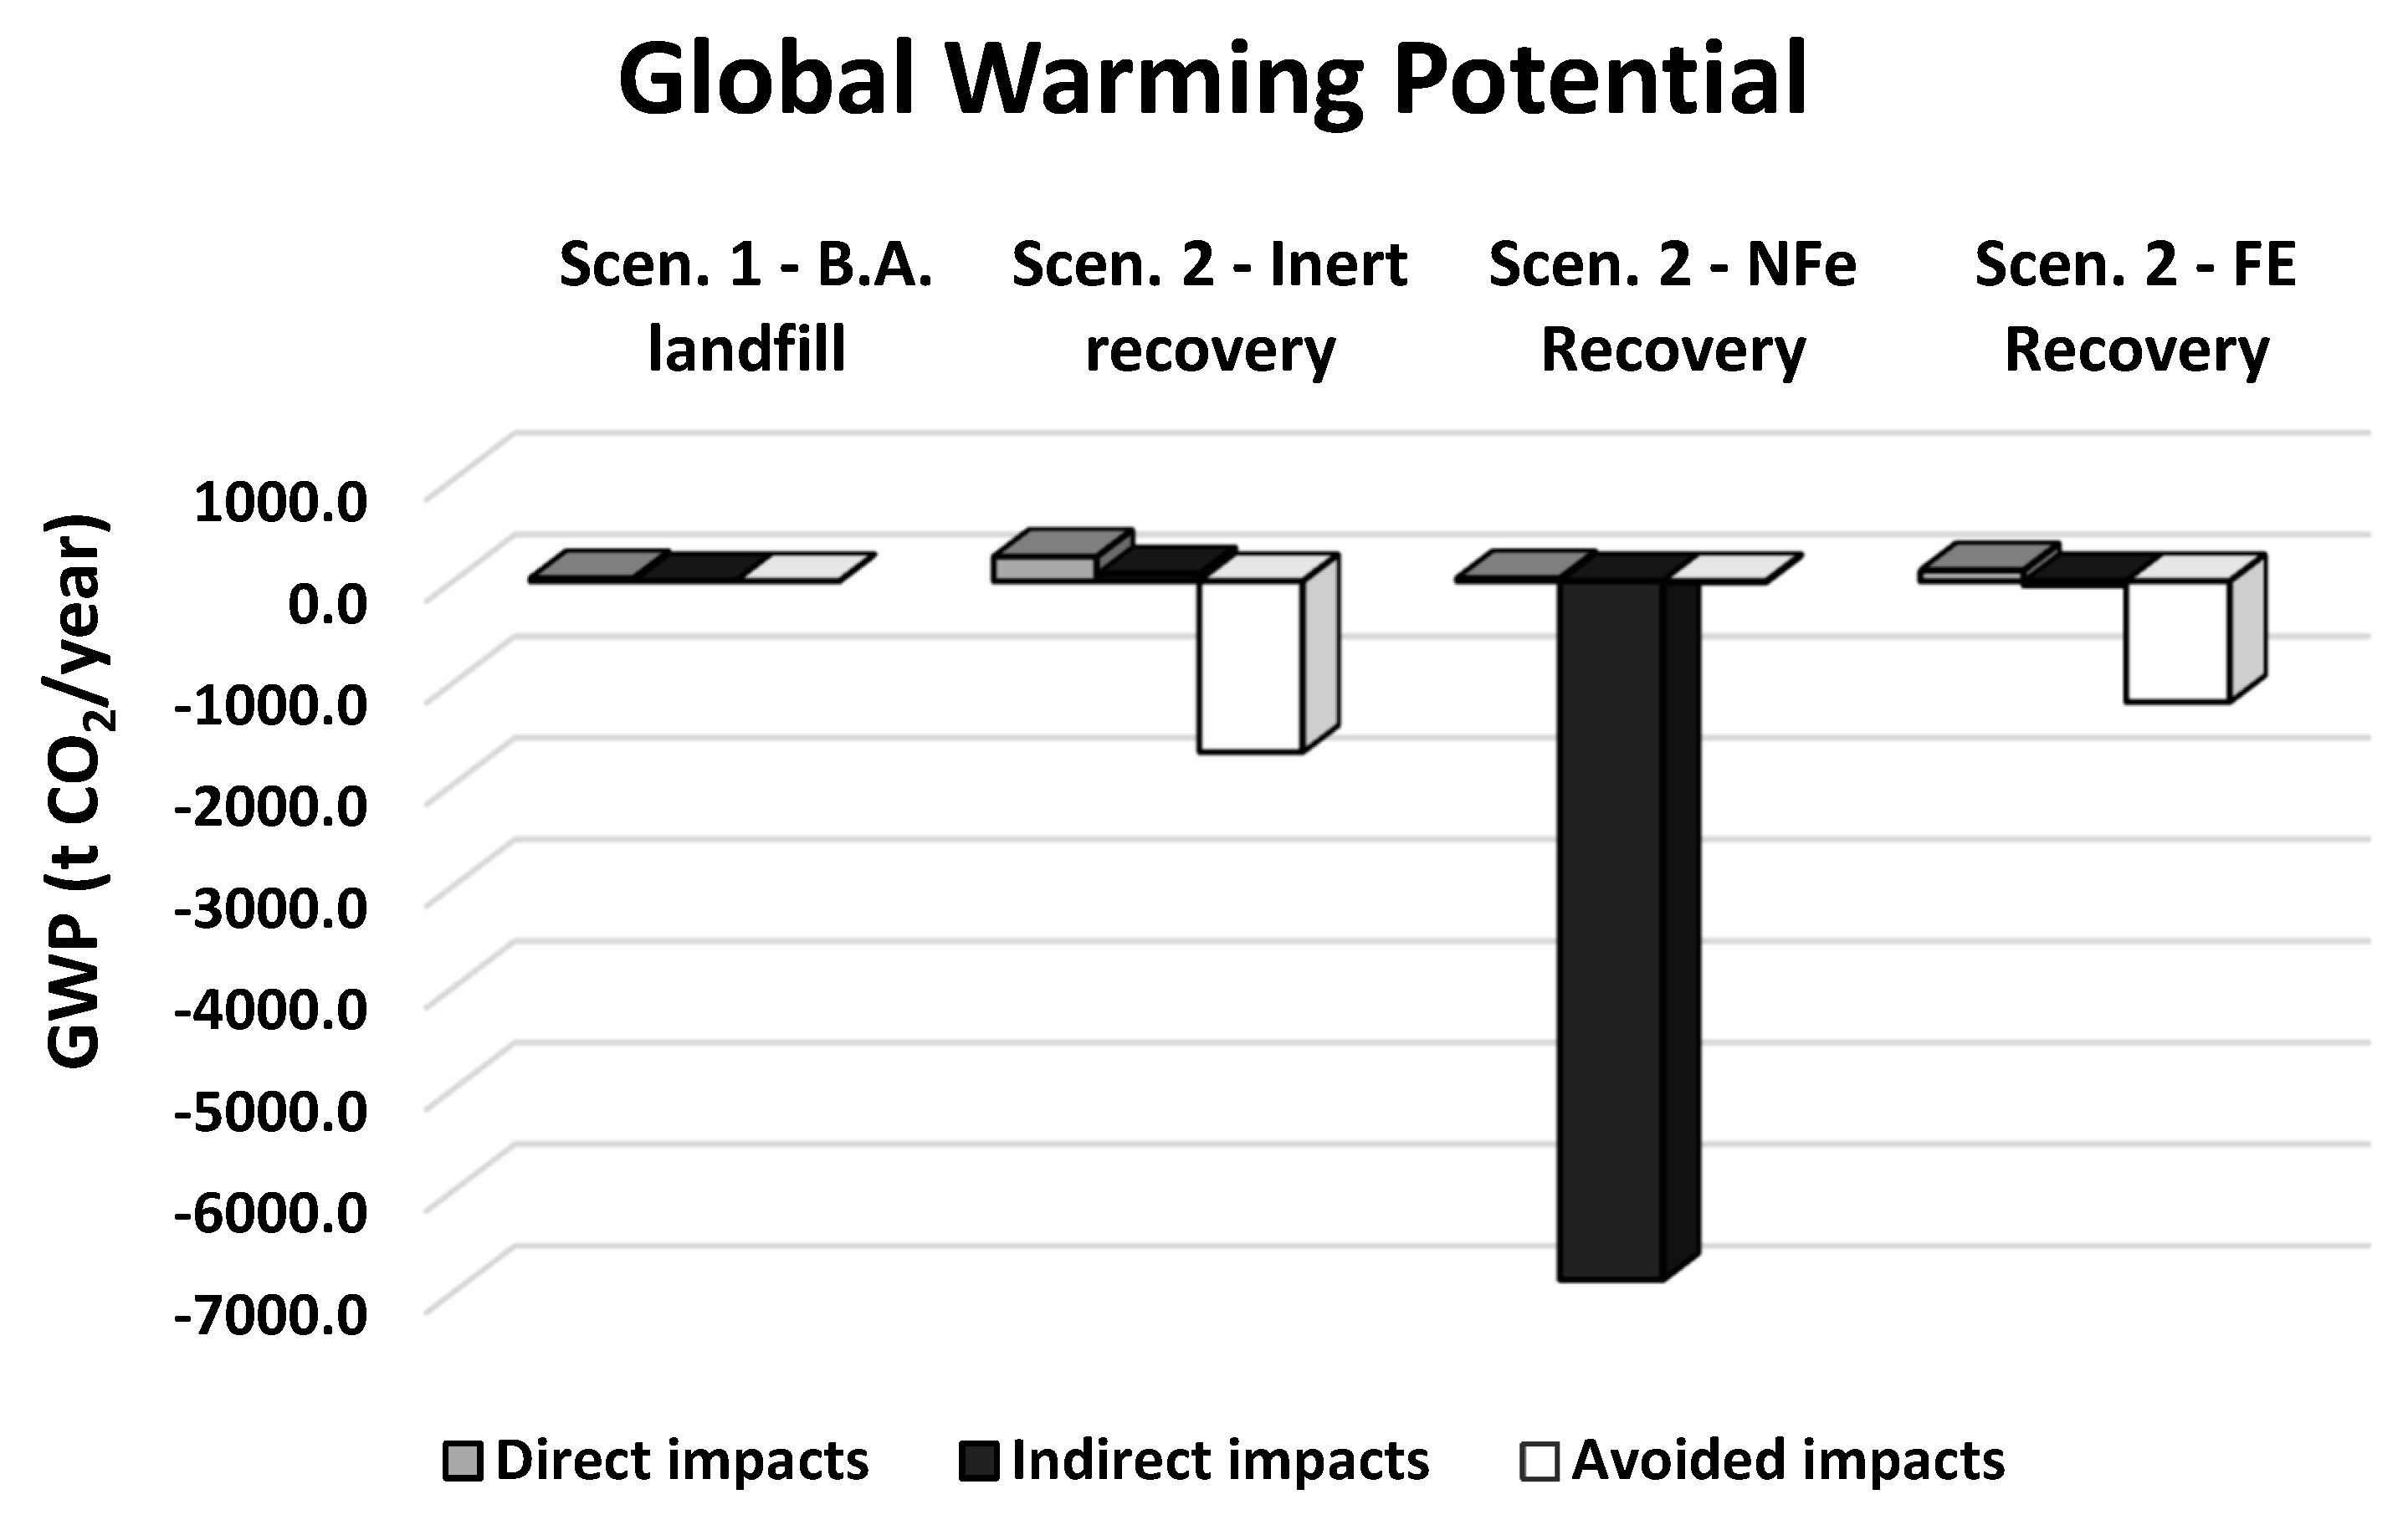
The avoided emissions of greenhouse gases equivalents are related to the recovery of aluminum (Figure 7), due, as above mentioned, to the large difference in energy demand between primary and secondary aluminum production. The remaining part is related to the recovery of inert materials and of Fe scraps, this is connected to the avoided impacts due to transport and extraction consumptions. The emissions produced by BA disposal in landfill can be overlooked with respect to the avoided emissions deriving from BA treatment with materials recovery.
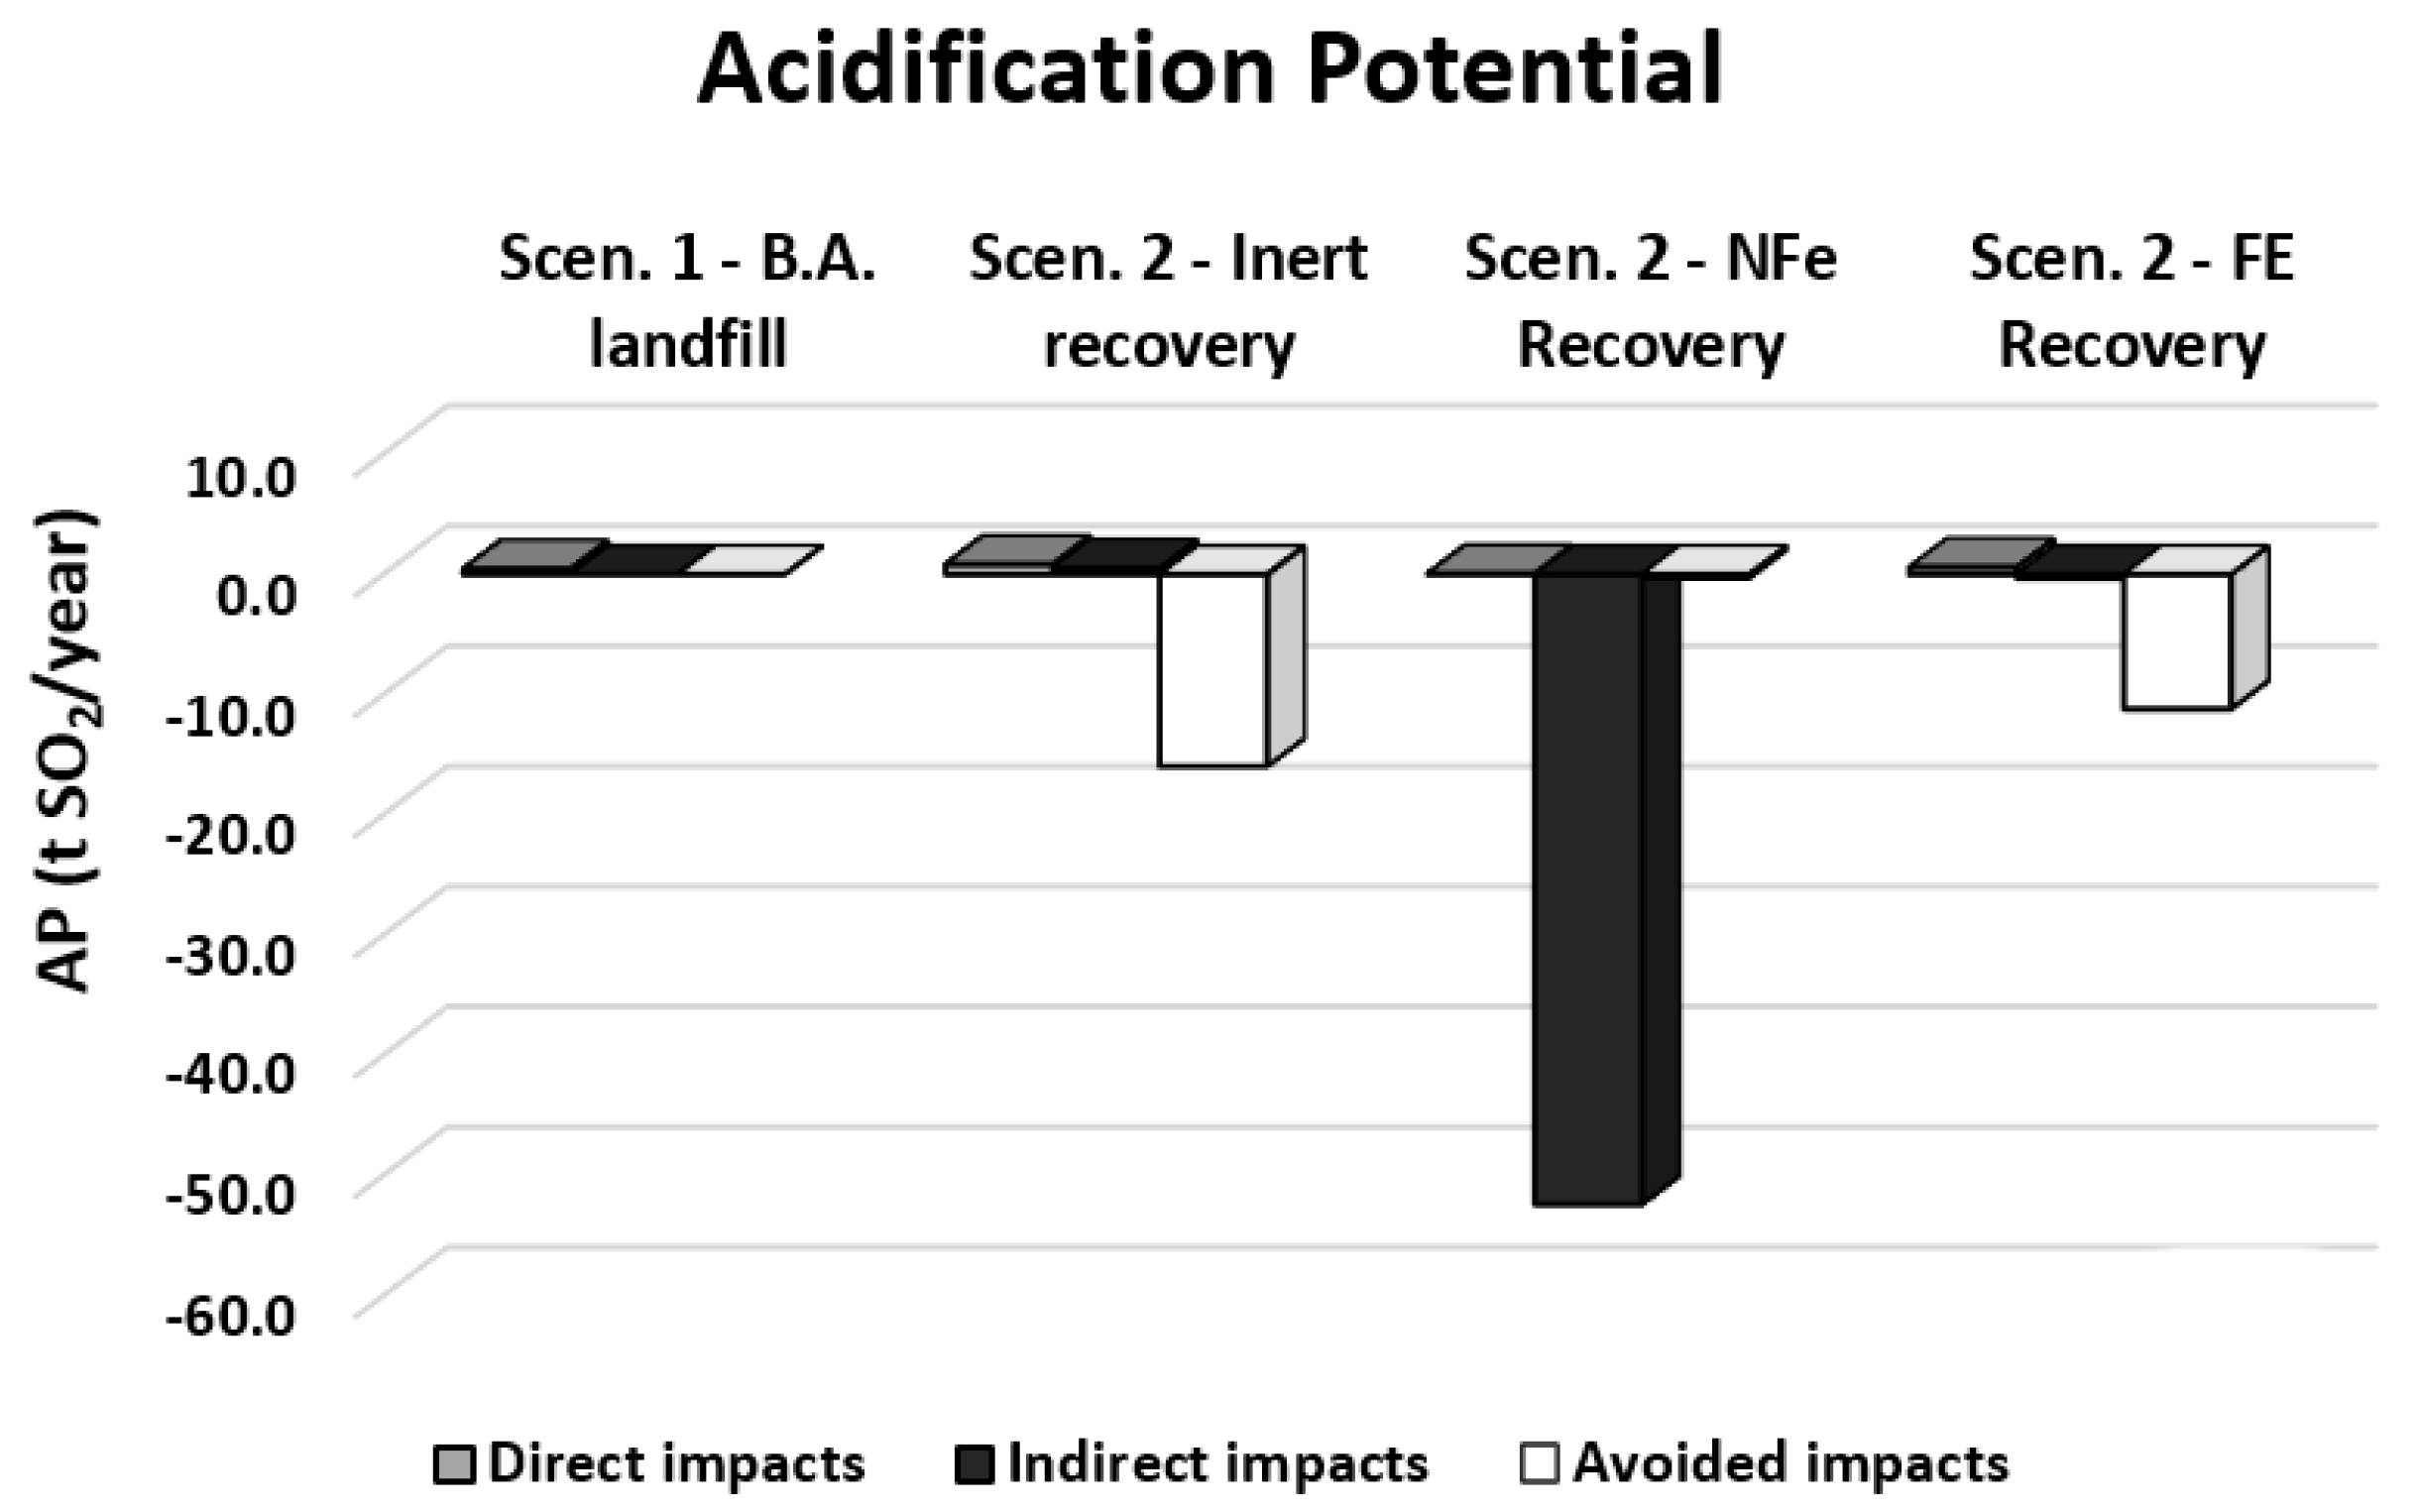
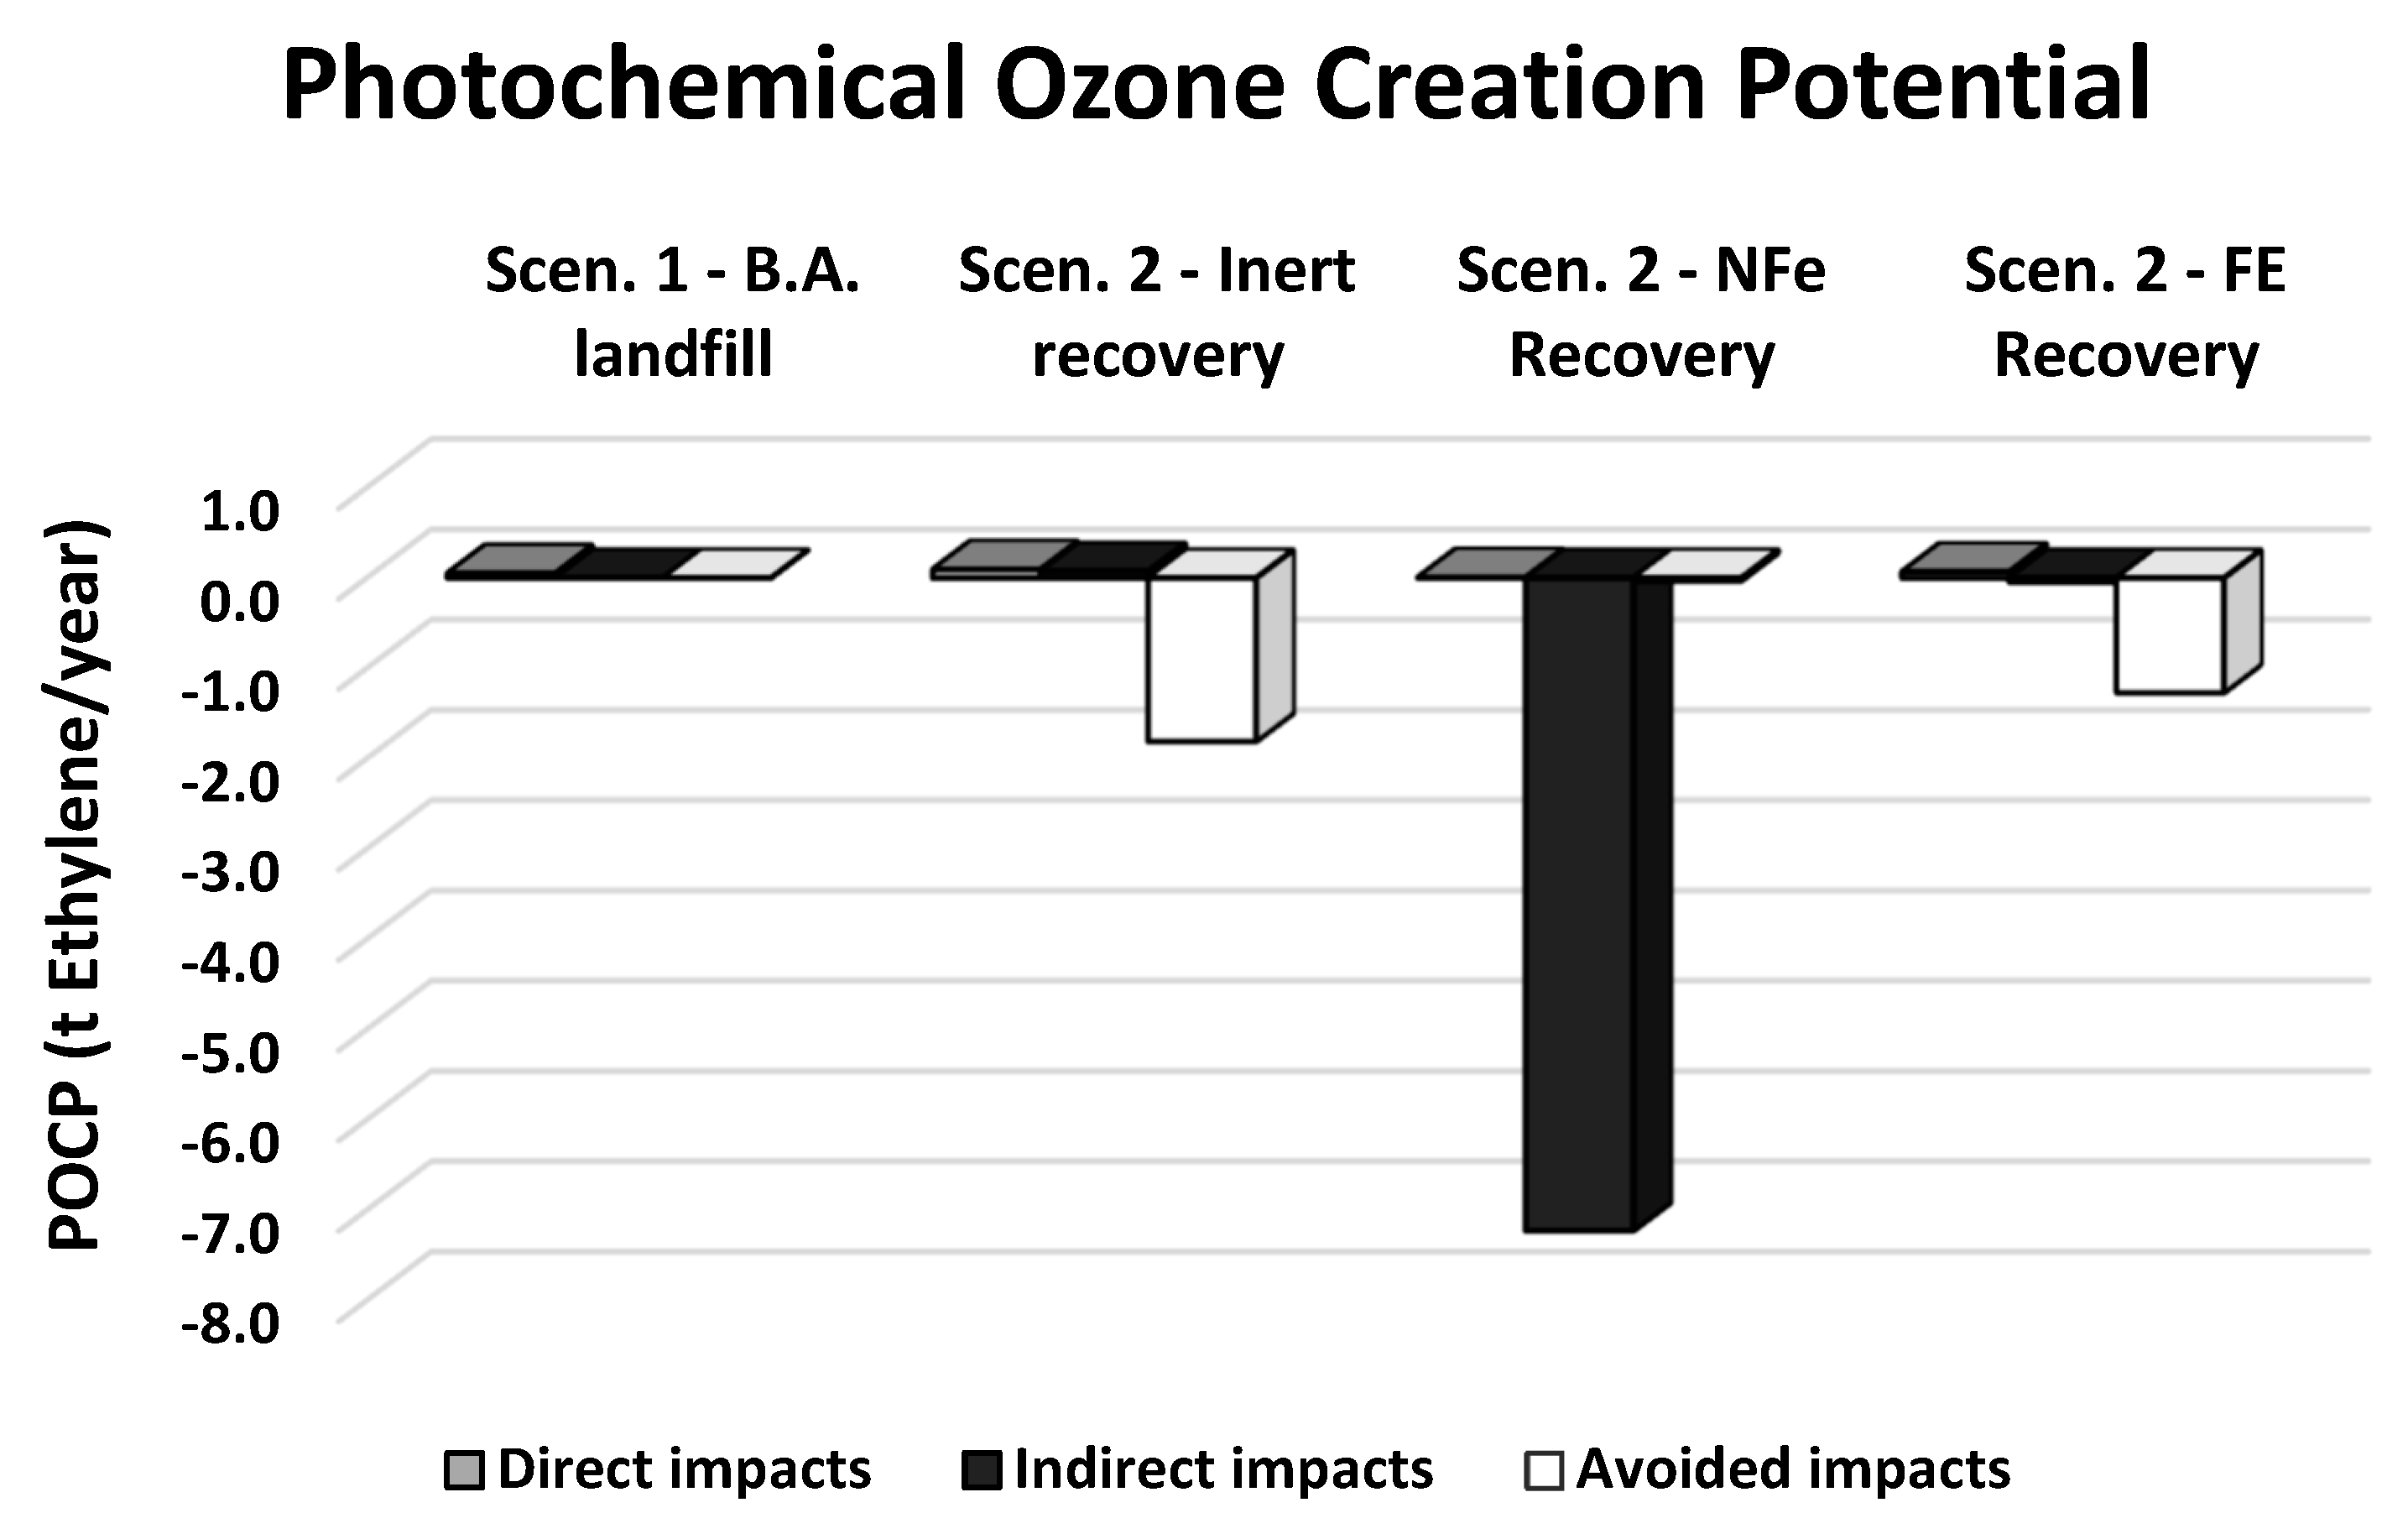
AP and POCP show positive results (Figure 8 and Figure 9), this means potential emissions are not introduced in environment. The greater benefits are due to NFe recovery. Regarding AP, potential impacts were caused by gaseous emissions of SO2 from combustion of fossil fuels for electricity production. Indeed, for POCP, potential impacts were caused by emissions of methane and Volatile Organic Compounds (VOC) produced by transport.
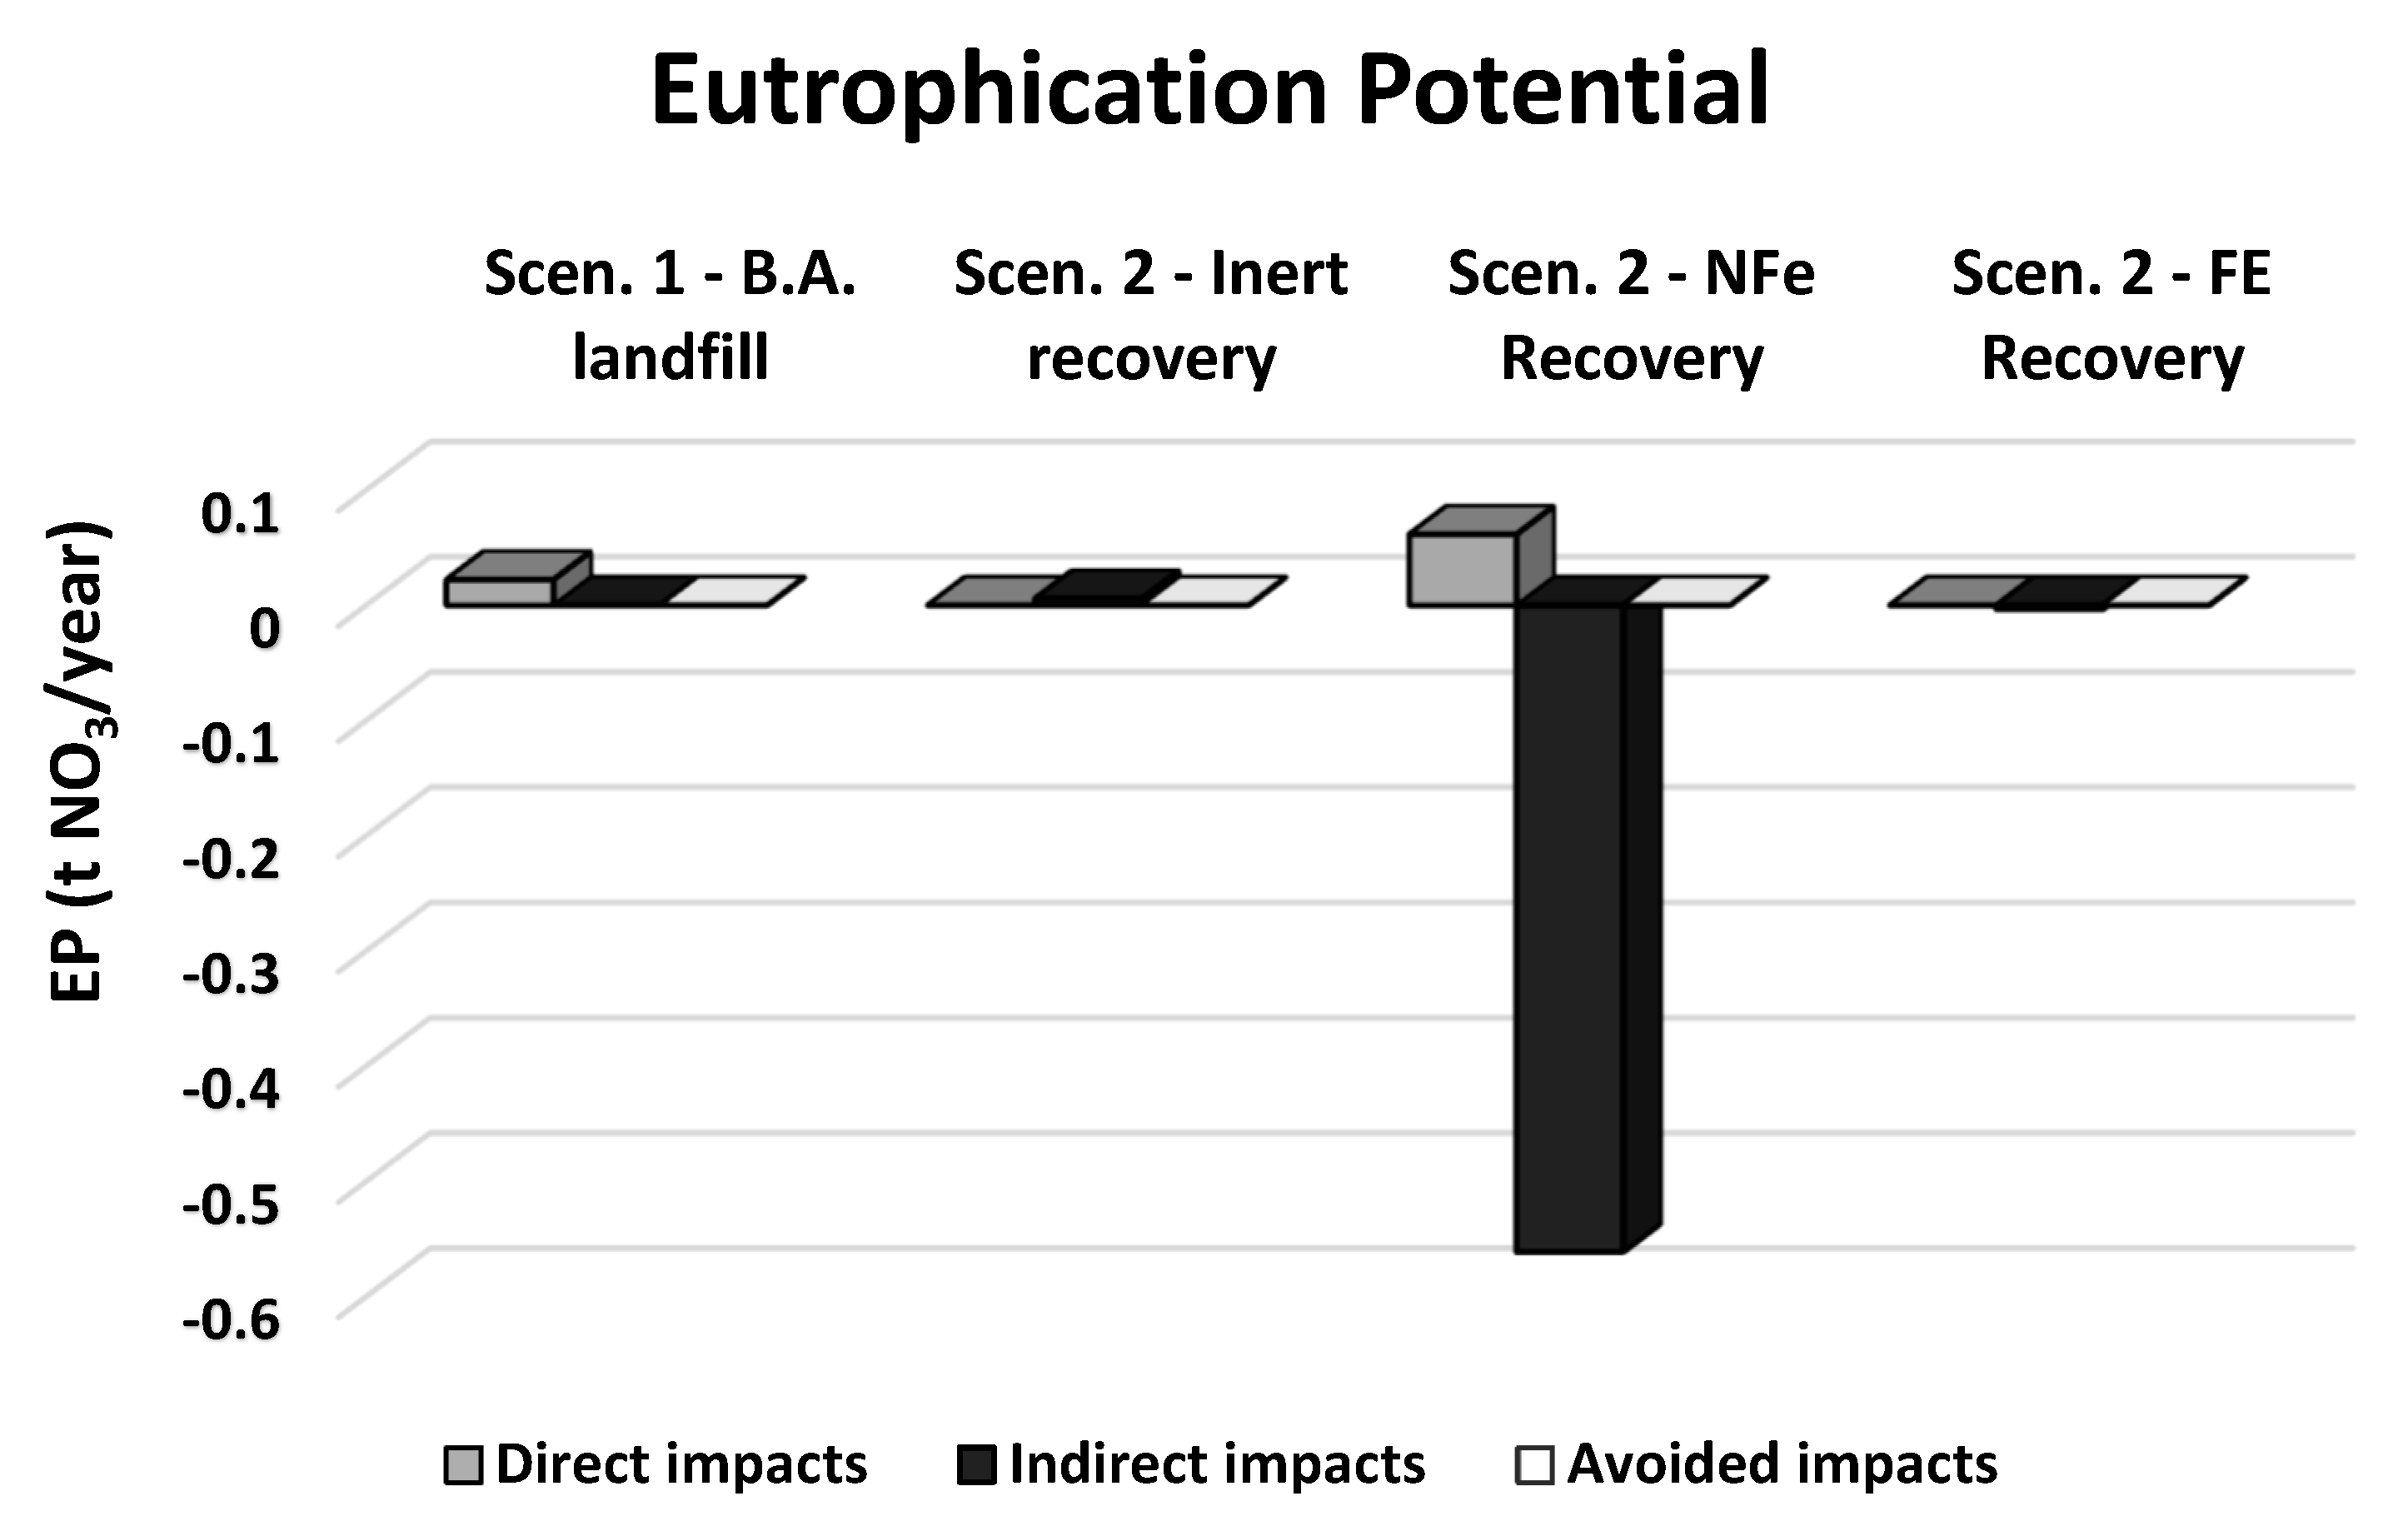
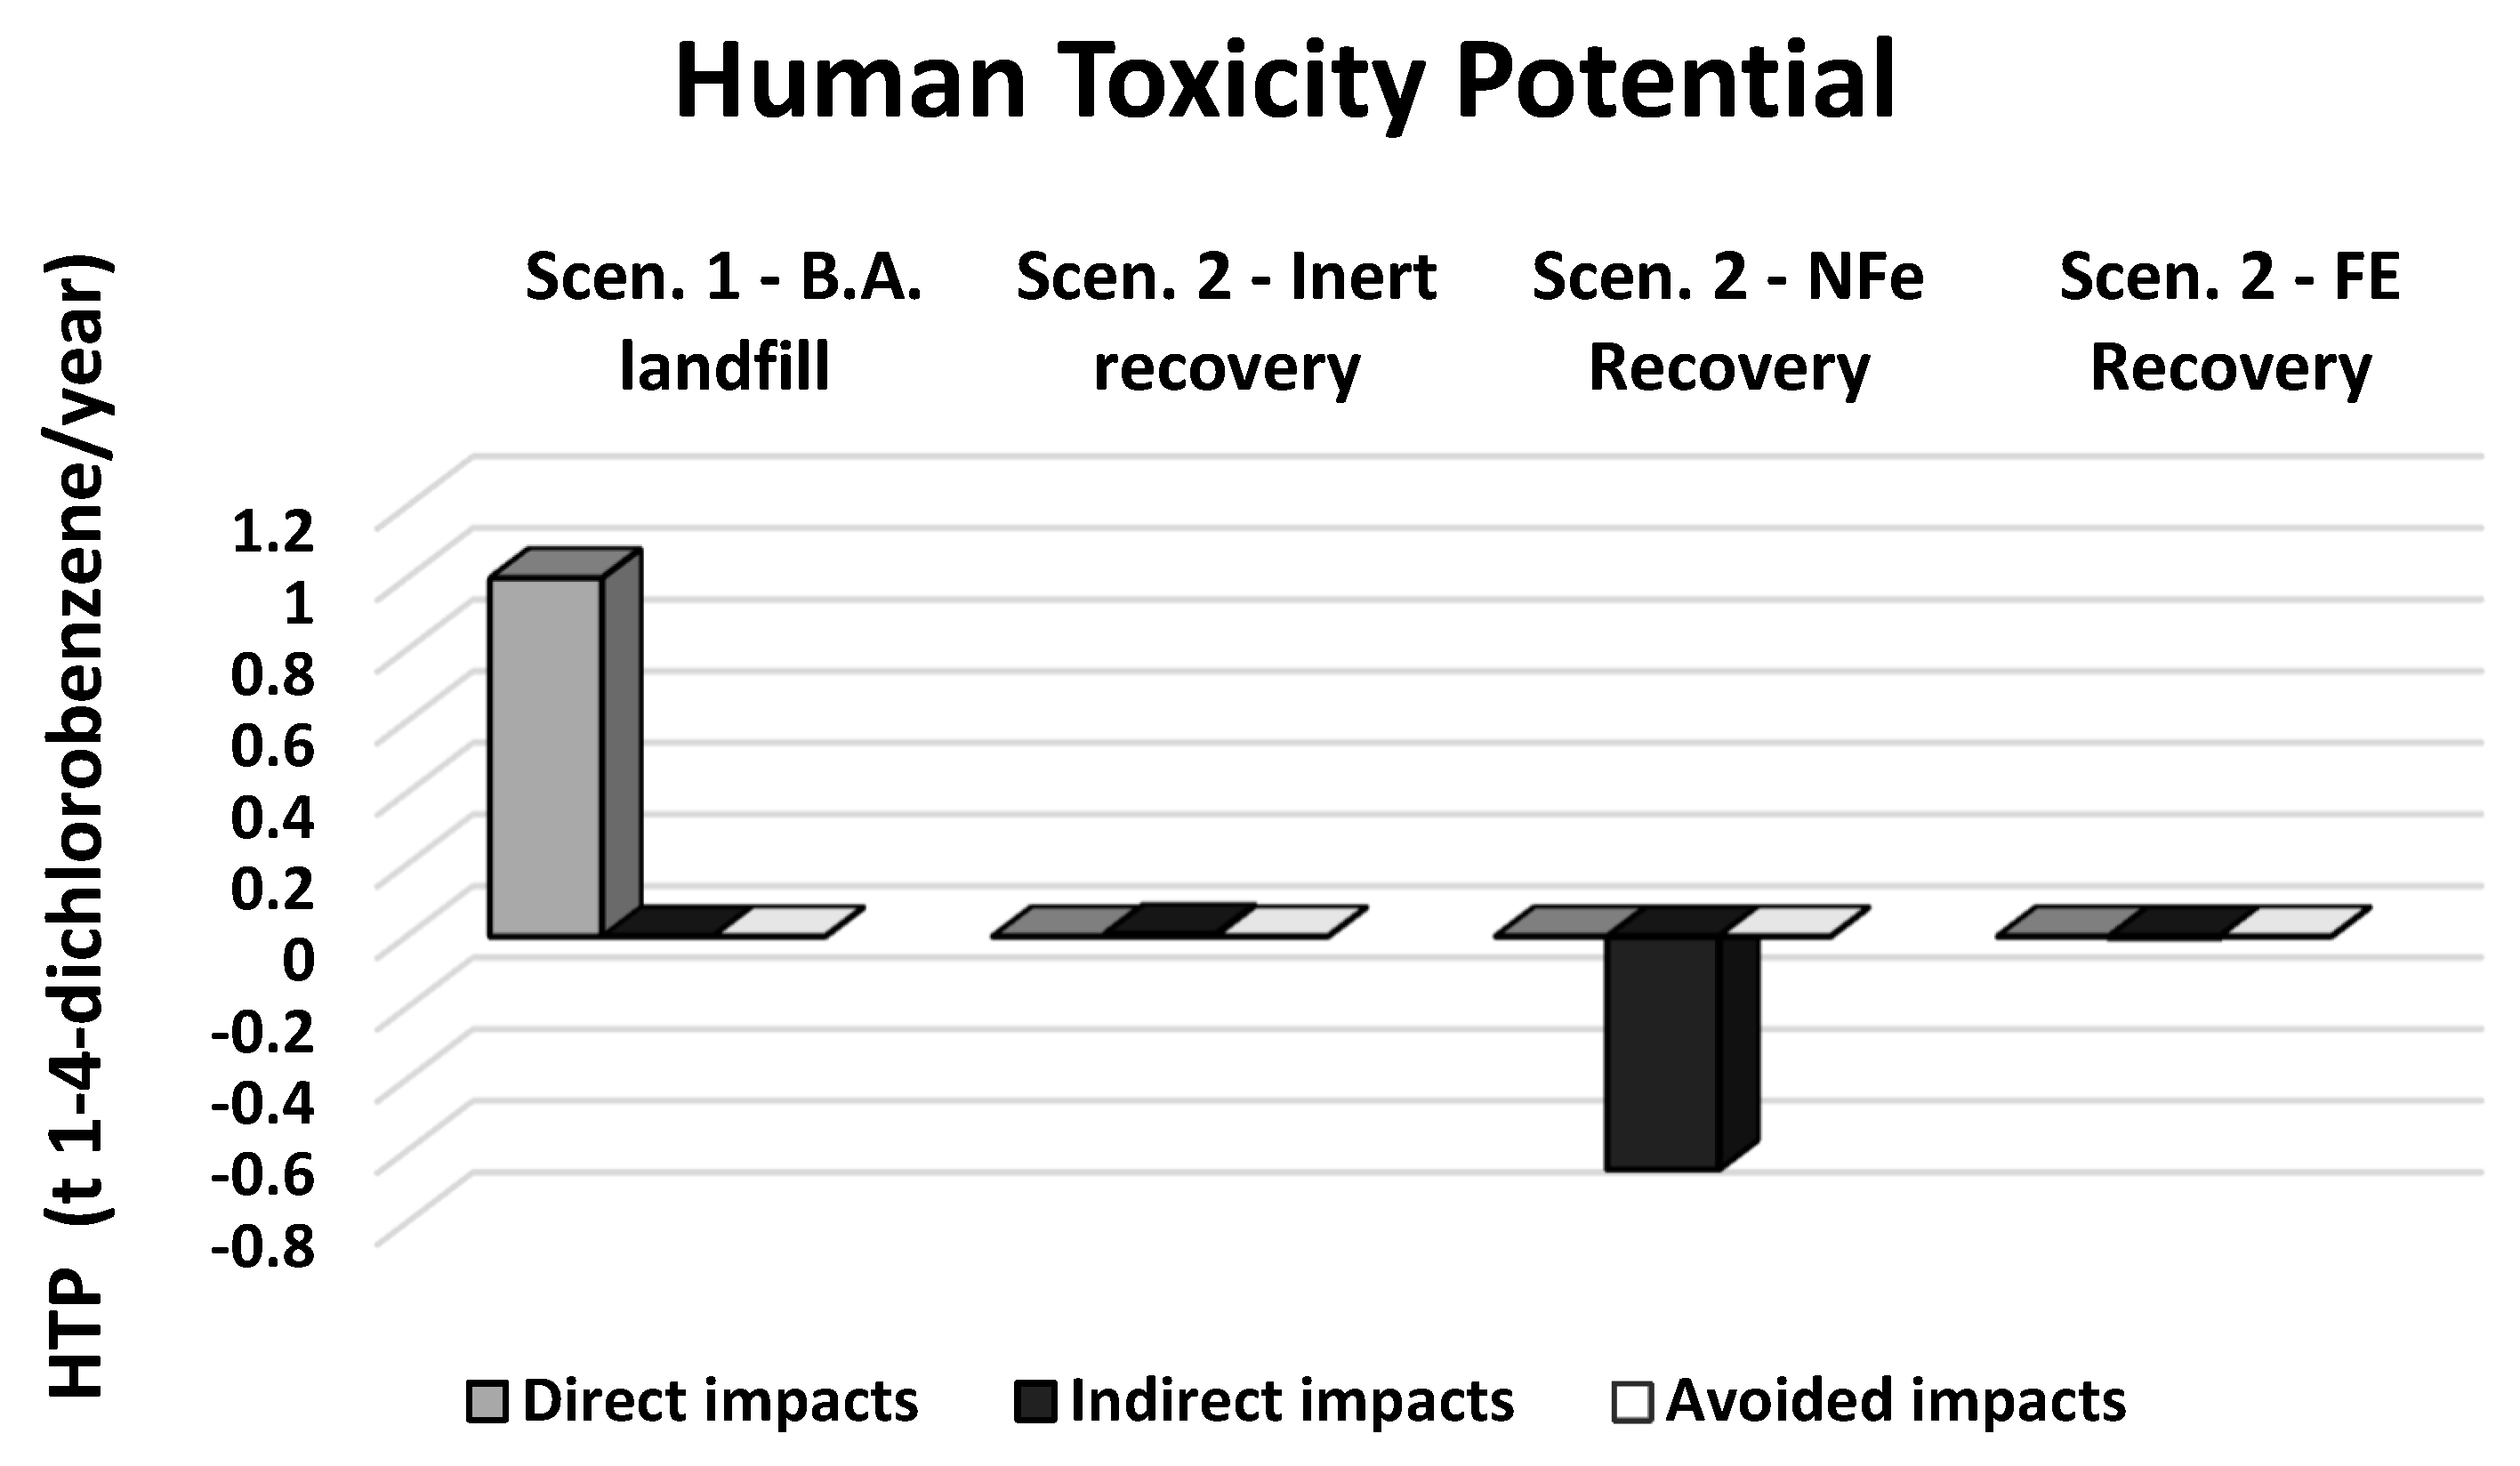
In the graphics of EP and HTP analysis, the most interesting result concerns the hypothesis of BA disposal in landfill (Figure 10 and Figure 11).
The results provide evidence that the BA disposal can avoid the issue of heavy metal with high potential of human toxicity [46]. The substances issued in the water with EP and HTP are reported in Table 7, where the leaching tests of BA samples are shown.
The end life cycle of ceramic tiles mixture with BA is not taken into consideration, but tests performed on tiles show leachate values below the legal limits (Table 7). Nevertheless, the most important environmental impacts that might arise when residues are disposed in landfills or utilized in ceramics tiles are the impacts related to the presence of heavy metals and salts and the potential long-term leaching [47]. A favorable point to be considered is due to the toxicity results avoided for metallurgical activities that are excluded from the considered system. Regarding Al recycling, savings related to HTP and EP are due to avoided disposal of red mud from bauxite mining, while the avoided burdens on HTP are connected to the production of Zn, to be used as an alloying element [45].
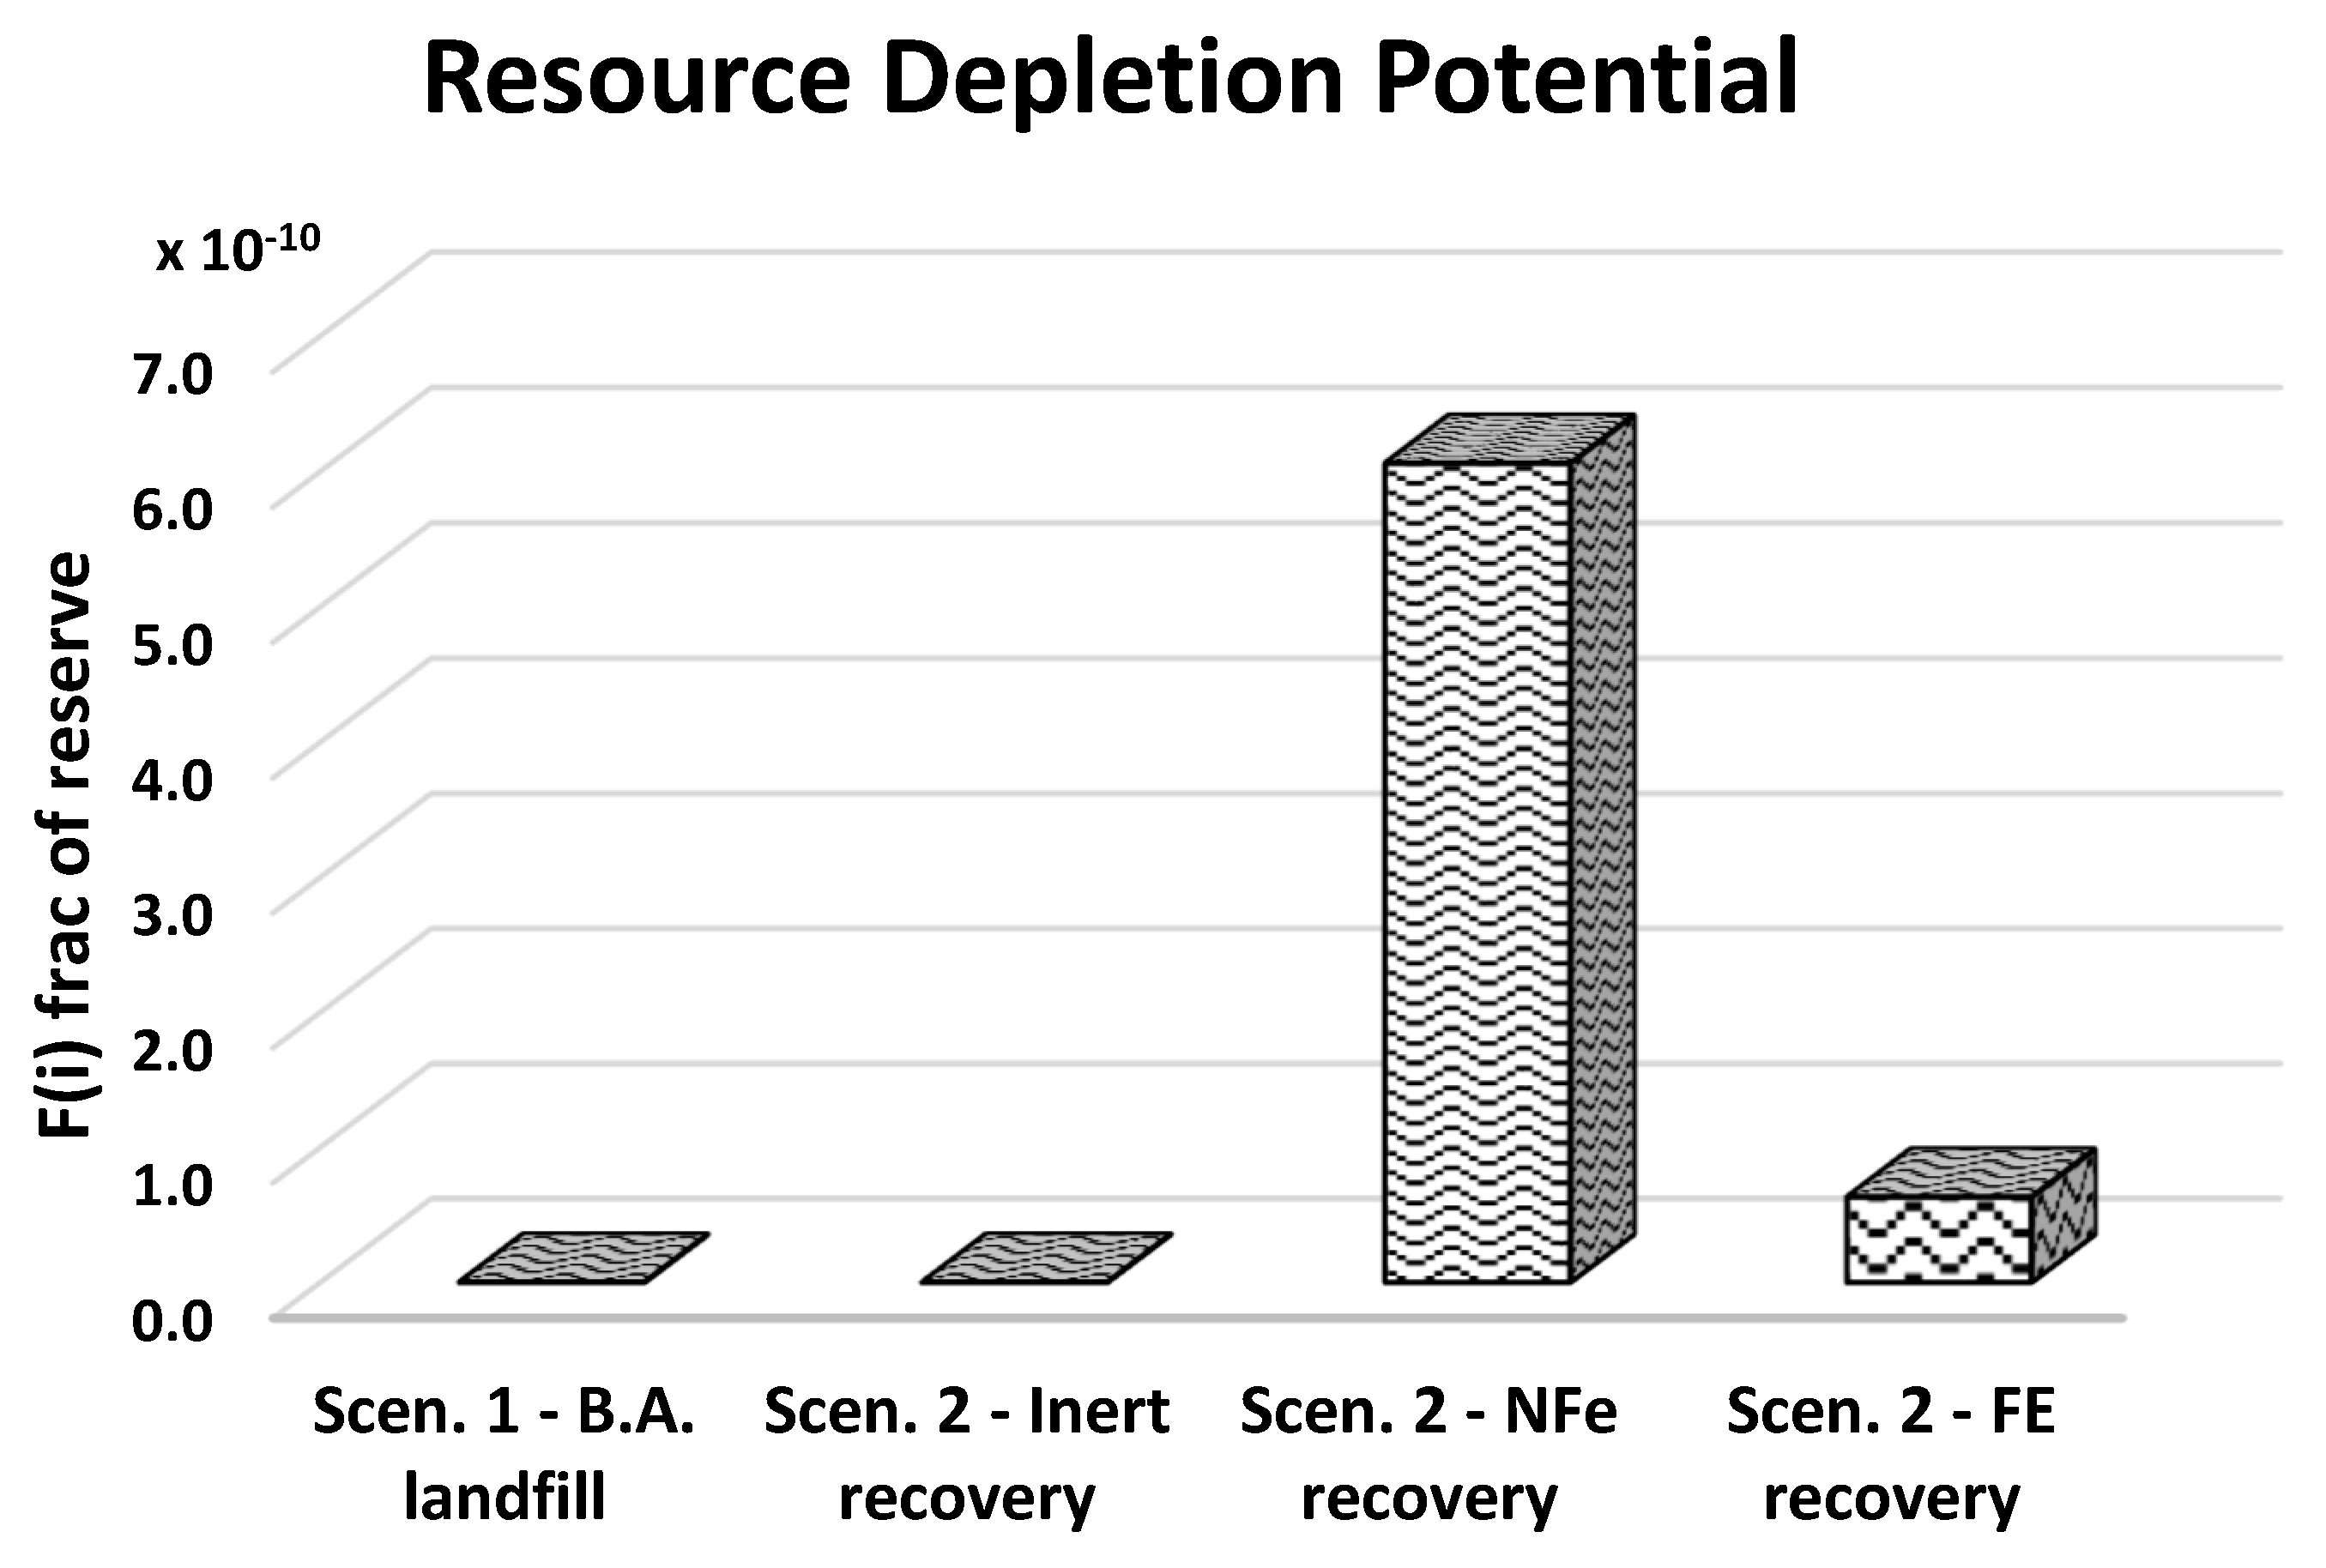
A positive result derives from a gain in the non-renewable resources extraction. From the characterization of the BA during the experimentation phases, the substances affecting the impact indicator are copper, lead, nickel, zinc, bauxite, iron, and manganese. Although there is a higher recovery of Fe than of NFe (Figure 5), the RDP shows a better result for the case of NFe recovery (Figure 12). The obtained result is related to the aluminum indicator of RDP, which is more important than iron in terms of extractable resources. The hypothesis of disposal in landfill of BA has a null impact because materials recovery is not expected; furthermore, the activity of inert recovery is null because impact indicators of RDP do not include clay.
The results of this study show large benefits related to the reuse of BA in ceramic tiles production. The described industrial experimentation represents an alternative and innovative use of MSWI BA in order to avoid their disposal in landfill. In Italy there are no specific rules about the use of MSWI BA in the production of ceramic tiles. Moreover, MSWI BA are classified as special and hazardous waste, which present high disposal costs. For these reasons, the national policies should promote development of protocols to regulate the reuse of BA in ceramic products.

5. Conclusions

The LCA methodology together with the current industrial experimentation, confirms environmental and energy benefits related to the use of MSWI BA in production of ceramic tiles. Therefore, the MSWI BA recovery system presents undoubted advantages with respect to the MSWI BA disposal. In this regard, “La Sapienza” University of Rome has carried out several leaching tests on the BA and on the produced tiles. Results were utilized to set the data used for the LCA application. By adding all the activities adopted in BA treatment together with the recovery of materials, considering all the avoided activities deriving from the recycling of recovered materials and from the BA landfilling, results show a positive judge (Table 6). The negative values of the total impacts indicate that avoided impacts are larger than the impacts caused from the activity of recovery, reuse, and final disposal. The treatment of MSWI BA that brings the recovery of NFe, Fe, inert material, and the avoided potential impacts due to the absence of landfilling, push towards environmental benefits. Benefits regarding the Energy Audit and the GWP categories are related to recovery of Al due to the large difference in energy demand between primary and derived aluminum production. Indirect impacts produced by the recovered energy during Al recycling avoid the emission of 6877 t CO2eq/year. At the same way, recovery of inert materials and recovery of Fe scrubs prevent GWP impacts due to transport and extraction consumptions. Specifically, inert materials recovery avoids the emission of 1681 t CO2eq/year, whereas Fe recovery prevents the release of 1188 t CO2eq/year. A lower AP is due to the recovery of NFe, even if potential impacts were caused by emissions into the air of SO2 from combustion of fossil fuels for electricity production. In fact, Table 6 shows that the highest avoided AP (amounting to 52.40 t SO2 eq/year) is related to the indirect impacts of NFe recovery. The POCP impacts are caused by the emissions into atmosphere of methane and VOC mainly due to transport emissions. Recovery of inert material and Fe prevents emissions of 1.81 t Ethyleneeq /year and 1.27 t Ethyleneeq/year, respectively. EP impacts avoided are due to recovery of NFe (0.56 t NO3eq/year), thanks to a lower emission into water of NH3 coming from the necessary production of electricity. An important element, even if not directly involved in the LCA analysis, is the avoided risks of contamination of water due to disposal of BA in landfill. We can find an indirect evaluation of this aspect into the HTP avoided (amounting to 1 t 1-4-dichlorobenzeneeq/year), because it means that several heavy metals with high potential of human toxicity, as shown by the experiments carried out and confirmed by the literature data, cannot be dispersed in the environment. At the end, the RDP impacts are also positive during the treatment phases because the substances affecting impact indicators, like copper, lead, nickel, zinc, bauxite, iron, and manganese, are recovered.
Based on the positive results obtained from the LCA, the main future challenges regard the improvement of the environmental benefits caused by the BA reuse. In this context, further investigations will be performed using a different percentage of BA in the mixture to maximize the benefits and the environmental sustainability of the process. Furthermore, future research will be focused on the metals recovery system to improve their separation from the other inert materials. By avoiding heavy metal leachate during the life cycle until the disposal of the product deriving from BA reuse, it is possible to increase the positive environmental and human health impacts. In this way, the BA could be reused widely in the productive process of civil engineering, supporting the Green Economy. Regarding the industrial sector, BA reuse is an economic virtuous process because it is a way for companies to save on waste disposal and primary materials costs. Additionally, waste reuse can assist companies in obtaining labels of environmental excellence, which increases their profitability and reputation.

Author Contributions

All the authors contributed equally to the present work.

Funding

This research received no external funding.

Conflicts of Interest

The authors declare no conflict of interest.

Abbreviations

APAcidification Potential
BABottom Ash
ECSEddy Current Separator
EFEquivalence Factor
EFsEquivalence Factors
EfPEffect Potential
EDIPEnvironmental Design of Industrial Products
EPEutrophication Potential
FeFerrous metals
GWPGlobal Warming Potential
HTPHuman Toxicity Potential
LCALife Cycle Assessment
LCILife Cycle Inventory
LCIALife Cycle Impact Assessment
MSWIMunicipal Solid Waste Incineration
NFeNon-ferrous metals
POCPPhotochemical Ozone Creation Potential
VOCVolatile Organic Compounds

References

  1. Lombardi, F.; Lategano, E.; Cordiner, S.; Torretta, V. Waste incineration in rotary kilns: A new simulation combustion’s tool to support design and technical change. Waste Manag. Res. 2013, 31, 739–750. [Google Scholar] [CrossRef] [PubMed]
  2. Mancini, G.; Viotti, P.; Luciano, A.; Fino, D. On the ASR and ASR thermal residues characterization of full scale treatment plant. Waste Manag. 2014, 34, 448–457. [Google Scholar] [CrossRef] [PubMed]
  3. Mancini, G.; Viotti, P.; Luciano, A.; Raboni, M.; Fino, D. Full scale treatment of ASR wastes in a modified rotary kiln. Waste Manag. 2014, 34, 2347–2354. [Google Scholar] [CrossRef] [PubMed]
  4. Torretta, V.; Ionescu, G.; Raboni, M.; Merler, G. The mass and energy balance of an integrated solution for municipal solid waste treatment. Wit Trans. Ecol. Environ. 2014, 180, 151–161. [Google Scholar] [Green Version]
  5. Raboni, M.; Torretta, V.; Urbini, G.; Viotti, P. Automotive shredder residue: A survey of the hazardous organic micro-pollutants spectrum in landfill biogas. Waste Manag. Res. 2015, 33, 48–54. [Google Scholar] [CrossRef] [PubMed]
  6. Rapporto Rifiuti Speciali 2017 (Report on Special Waste); ISPRA: Rome, Italy, 2017. Available online: http://www.isprambiente.gov.it/it/pubblicazioni/rapporti/rapporto-rifiuti-speciali-edizione-2017 (accessed on 3 September 2018).
  7. Brunner, P.H.; Monch, H. The flux of metals through municipal solid waste incinerators. Waste Manag. Res. 1986, 4, 105–119. [Google Scholar] [CrossRef]
  8. Chang, N.B.; Wang, H.P.; Huang, W.L.; Lin, K.S. The assessment of reuse potential for municipal solid waste and refuse-derived fuel incineration ashes. Resour. Conserv. Recycl. 1999, 25, 255–270. [Google Scholar] [CrossRef]
  9. Bruder-Hubscher, V.; Lagarde, F.; Leroy, M.J.F. Utilisation of bottom ash in road construction: Evaluation of the environmental impact. Waste Manag. Res. 2002, 19, 545–556. [Google Scholar] [CrossRef] [PubMed]
  10. Lam, C.H.K.; Ip, A.W.M.; Barford, J.P.; McKay, G. Use of Incineration MSW Ash: A Review. Sustainability 2010, 2, 1943–1968. [Google Scholar] [CrossRef] [Green Version]
  11. Tang, P.; Yu, Q.L.; Yu, R.; Brouwers, H.J.H. The application of MSWI bottom ash fines in high performance concrete. In Proceedings of the 1st International Conference on the Chemistry of Construction Materials, Berlin, Germany, 7–9 October 2013. [Google Scholar]
  12. Tao, Z.; Zengzeng, Z. Optimal Use of MSWI Bottom Ash in Concrete. Int. J. Concr. Struct. Mater. 2014, 8, 173–182. [Google Scholar] [Green Version]
  13. Kockum, P.F.; Lindqvist, J.E.; Loorent, K.; Arm, M. Microstructure of aged MSWI bottom ash in road constructions. In Proceedings of the WASCON 2012 Proceedings, Gothenburg, Sweden, 30 May–1 June 2012. [Google Scholar]
  14. Lynn, C.J.; Ghataora, G.S.; Dhir, R.K. Municipal incinerated bottom ash (MIBA) characteristics and potential for use in road pavements. Int. J. Pavement Res. Technol. 2017, 10, 185–201. [Google Scholar] [CrossRef]
  15. Alhassan, H.M.; Tanko, A.M. Characterization of Solid Waste Incinerator Bottom Ash and the Potential for its Use. Int. J. Eng. Res. Appl. 2012, 2, 516–522. [Google Scholar]
  16. Sappa, G.; (La Sapienza University of Rome, Rome, Italy. Iter procedurale per il raggiungimento della conformità tecnica di piastrelle per pavimentazioni). Personal communication, 2016.
  17. Ergul, S.; Sappa, G.; Magaldi, D.; Pisciella, P.; Pelino, M. Microstructural and phase transformations during sintering of a phillipsite rich zeolitic tuff. Ceram. Int. 2011, 37, 1843–1850. [Google Scholar] [CrossRef]
  18. Ferronato, N.; Rada, E.C.; Gorritty, M.P.; Cioca, L.I.; Ragazzi, M.; Torretta, V. Introduction of the circular economy within developing regions: A comparative analysis of advantages and opportunities for waste valorization. J. Environ. Manag. 2019, 230, 366–378. [Google Scholar] [CrossRef] [PubMed]
  19. Olivieri, G. Environmental and Economic Analysis of Aluminum Recycling Using the LCA Method; ICMET case, Doc. ENEA-PROT–P135–009; ICMET: Bologna, Italy, 2004. [Google Scholar]
  20. Crillesen, K.; Skaarup, J. Management of Bottom Ash from WTE Plants—An Overview of Management Options and Treatment Methods; Report of the International Solid Waste Association (ISWA); ISWA: London, UK, 2006. [Google Scholar]
  21. Bartoli, A. La valorizzazione delle scorie da incenerimento di rifiuti solidi urbani nelle infrastrutture stradali: La sperimentazione di Meta s.pa. Modena. Master’s Thesis, University of Modena and Reggio Emilia, Modena, Italy, 2003. [Google Scholar]
  22. Seniunaite, J.; Vasarevicius, S. Leaching of Copper, lead and zinc from municipal solid waste incineration bottom ash. Energy Procedia 2017, 113, 442–449. [Google Scholar] [CrossRef]
  23. Guidelines for Life-Cycle Assessment: A ‘Code of Practice’; SETAC: Brussels, Belgium, 1993.
  24. Rebitzera, G.; Ekvallb, T.; Frischknechtc, R.; Hunkelerd, D.; Norrise, G.; Rydbergf, T.; Schmidtg, W.-P.; Suhh, S.; Weidemai, B.P.; Pennington, D.W. Life cycle assessment Part 1: Framework, goal and scope definition, inventory analysis, and applications. Environ. Int. 2004, 30, 701–720. [Google Scholar]
  25. Baldo, G.L.; Marino, M.; Rossi, S. Analisi Del Ciclo di Vita LCA. Gli Strumenti per la Progettazione Sostenibile di Materiali, Prodotti e Processi; Edizione Ambiente: Milan, Italy, 2008. [Google Scholar]
  26. Joint Research Centre-JRC. General Guide for Life Cycle Assessment—Detailed Guidance. ILCD Handbook (International Reference Life Cycle Data System Handbook); European Commission, Joint Research Centre, Institute for Environmental and Sustainability: Luxembourg City, Grand Duchy of Luxembourg, 2010. [Google Scholar]
  27. International Standard Organization. ISO 14040: Environmental Management-Life Cycle Assessment-Principles and Framework; ISO: Geneva, Switzerland, 1997. [Google Scholar]
  28. International Standard Organization. ISO 14042: Environmental Management-Life-Cycle Assessment-Life Cycle Impact Assessment; ISO: Geneva, Switzerland, 2000. [Google Scholar]
  29. Colombo, D. Il Riciclaggio Delle Lattine di Alluminio: Da Rifiuto a Risorsa; University of Trento: Trento, Italy, 2001; Available online: http://www.ing.unitn.it/~colombo/VAIADINO/HTM/Pres.htm (accessed on 10 January 2019).
  30. Barthelmy, D. Magnetite Mineral Data. Mineralogy Database. 2018. Available online: http://www.webmineral.com (accessed on 5 August 2018).
  31. Clarence, H. Lorig Holger Gruner. Mineral Processing. Encyclopedia Britannica Inc. 1998. Available online: https://www.britannica.com/technology/mineral-processing (accessed on 3 February 2019).
  32. Biganzoli, L. Aluminium Recovery from MSWI Bottom Ash. Ph.D. Thesis, Politecnico di Milano, Milan, Italy, 2012; p. 159. [Google Scholar]
  33. Nakajima, K.; Takeda, O.; Miki, T.; Matsubae, K.; Nakamura, S.; Nagasaka, T. Thermodynamic analysis of contamination by alloying elements in aluminum recycling. Environ. Sci. Technol. 2010, 44, 5594–5600. [Google Scholar] [CrossRef] [PubMed]
  34. Ministry of Infrastructures and Transport—MIT. Average Cost Per Kilometer for Diesel Consumption of Road Haulage Companies, for Third Parties; MIT: Rome, Italy, 2016. [Google Scholar]
  35. CiAl, Polytechnic of Milan. Separation and Recovery of Metals and Valorization of Waste Slag from Urban Waste; Federambiente: Milan, Italy, 2010. [Google Scholar]
  36. Guastalegname, L.; Trani, M.L. On the Energy Consumption of Construction Equipment. Master’s Thesis, Polytechnic of Milan, Milan, Italy, 2011. [Google Scholar]
  37. Bourtsalas, A.C.; Cheeseman, C.R.; Fthenakis, V.M. Life Cycle Analysis of Processes for Resource Recovery from Waste-To-Energy Bottom. Available online: http://www.seas.columbia.edu/earth/wtert/newwtert/meetings/meet2016/Proceedings/posters/Xu.pdf (accessed on 10 November 2018).
  38. Muchova, L. Wet Physical Separation of MSWI Bottom Ash. Ph.D. Thesis, Technical University of Delft, Delft, The Netherlands, 2010. [Google Scholar]
  39. Environmental and economic life cycle assessment of aluminum-silicon alloys production: A case study in China. J. Clean. Prod. 2012, 24, 11–19. [CrossRef]
  40. Energy Technology Systems Analysis Program (ETSAP). Aluminium Production. Technology Brief I10. 2012. Available online: www.etsap.org (accessed on 10 November 2018).
  41. Hauschild, M.; Wenzel, H.; Alting, L. Environmental Assessment of Products: Methodology, Tools and Case Studies in Product Development; Chapman and Hall. Kluwer Academic Publisher: London, UK, 1997; Volume 1. [Google Scholar]
  42. Hauschild, M.; Wenzel, H.; Alting, L. Environmental Assessment of Products: Scientific Background; Chapman and Hall. Kluwer Academic Publisher: London, UK, 1998; Volume 2. [Google Scholar]
  43. ENEA. Life Cycle Assessment: Development of Specific Indicators for Italy for the Impact Assessment Phase; Masoni, P., Scimia, E., Eds.; ENEA: Rome, Italy, 1999. [Google Scholar]
  44. Heijungs, R.; Guinée, J.B.; Huppes, G.; Lankreijer, R.M.; Udo de Haes, H.A.; Wegener Sleeswijk, A.; Ansems, A.M.M.; Eggels, P.G.; van Duin, R.; de Goede, H.P. Environmental Life Cycle Assessment of Products: Guide and Backgrounds; CML: Leiden, The Netherlands, 1992. [Google Scholar]
  45. Allegrini, E.; Vadenbo, C.; Boldrin, A.; Astrup, T.F. Life cycle assessment of resource recovery from municipal solid waste incineration bottom ash. J. Environ. Manag. 2015, 151, 132–143. [Google Scholar] [CrossRef] [PubMed] [Green Version]
  46. Sundqvist, J.O. Life Cycles Assessments and Solid Waste—Guidelines for Solid Waste Treatment and Disposal in LCA; Swedish Environmental Research Institute: Stockolm, Sweden, 1999. [Google Scholar]
  47. Birgisdóttir, H. Life Cycle Assessment Model for Road Construction and Use of Residues from Waste Incineration. Ph.D. Thesis, Institute of Environment & Resources, Technical University of Denmark, Lyngby, Denmark, 2015. [Google Scholar]
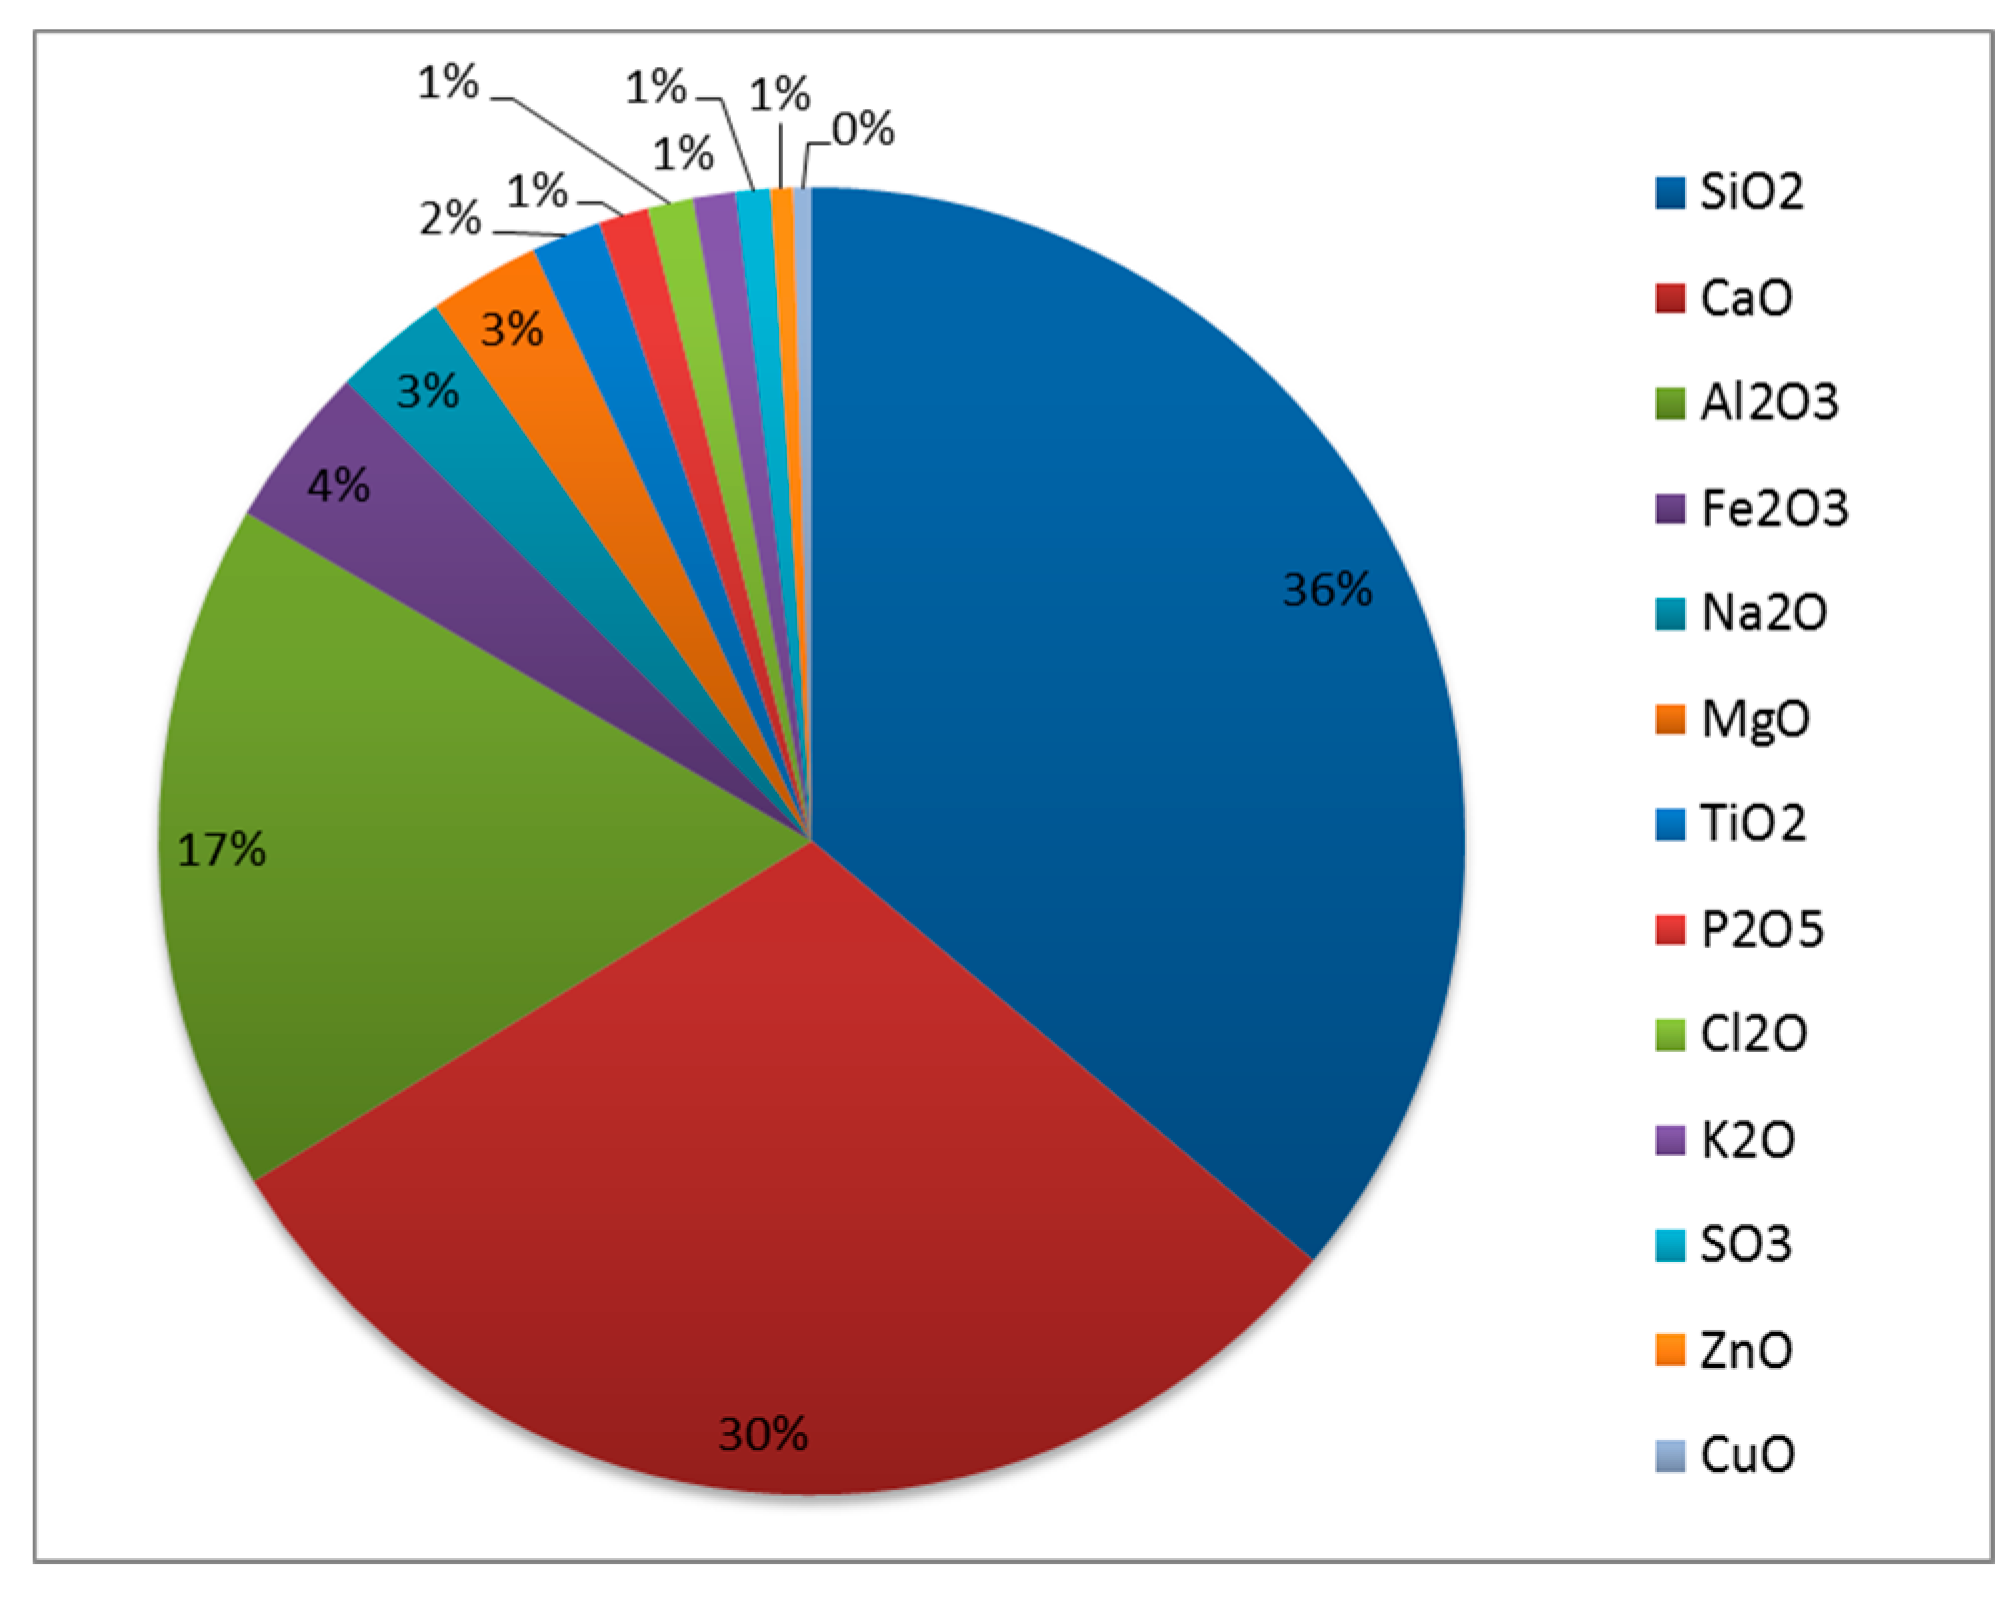
Figure 1. The chemical composition of Municipal Solid Waste Incineration Bottom Ashes (MSWI BA) obtained by laboratory test.
Resources 08 00093 g001
Figure 2. Concentrations of the substances measured in the leaching test before the duration test on the “Tiles”.
Resources 08 00093 g002
Figure 3. Concentrations of the substances measured in the leaching test after the duration test on the “Aged Tiles”.
Resources 08 00093 g003
Figure 4. Comparison between the activities of Scenario 1 (BA disposal in landfill) and Scenario 2 (materials recovery and BA reuse).
Resources 08 00093 g004
Figure 5. The material balance of ashes during the recovery treatment.
Resources 08 00093 g005
Figure 6. Comparison of energy audit between scenario 1 and activities of scenario 2.
Resources 08 00093 g006
Figure 7. Comparison of GWP between scenario 1 and activities of scenario 2.
Resources 08 00093 g007
Figure 8. Comparison of AP between scenario 1 and activities of scenario 2.
Resources 08 00093 g008
Figure 9. Comparison of POCP between scenario 1 and activities of scenario 2.
Resources 08 00093 g009
Figure 10. Comparison of Eutrophication Potential (EP) between scenario 1 and activities of scenario 2.
Resources 08 00093 g010
Figure 11. Comparison of Human Toxicity Potential (HTP) between scenario 1 and activities of scenario 2.
Resources 08 00093 g011
Figure 12. Comparison of Resource Depletion Potential (RDP) between scenario 1 and activities of scenario 2.
Resources 08 00093 g012
Table 1. MSWI BA elements [21].
Composition of MSWI BA
QuantityElements
>10,000 mg/kgSi, Fe, Ca, Al, Na, K, C
1000 mg/kg > x > 10,000 mg/kgMg, Ti, Cl, Mn, Ba, Zn, Cu, Pb, Cr
<1000 mg/kgSn, Sb, V, Mo, As, Se, Sr, Ni, Co, Ag, Mg, B, Br, F, and I
Table 2. Chemical composition of MSWI BA [22].
OxideAmount (% wt)
SpainItalyGermanyNetherlandsJapanChinaTaiwanUSA
SiO243.3033.7055.7054.2331.9359.5950.3023.64
CaO16.9035.0011.9013.4533.407.5815.2723.82
Fe2O314.105.378.8013.835.975.507.7217.05
Na2O7.582.271.402.812.531.321.301.70
Al2O35.8013.3114.107.8616.6518.6116.4314.25
MgO2.224.622.701.813.331.32n.d.1.85
K2O1.111.661.200.882.222.292.140.42
Table 3. Input data used for the Life Cycle Assessment (LCA) process.
Scenario 1—Landfill Disposal of BA
ProcessResourceValueUnitImpact
BA transport from incinerator to landfill [34] Fuel2.8-machine capacity 28 tKm/lDirect
Leachate (data obtained from the experimental test)-10% lost humidity l/yearDirect
Scenario 2—Treatment of BA for Production of Ceramic Tiles for Fe and NFe Recycling
ProcessResourceValueUnitImpact
BA transport from incinerator to industrial plant [34] Fuel2.8-machine capacity 28 tKm/lDirect
BA treatment [35] Electric energy4kWh/tIndirect
Transport of recovered NFe from industrial plant to foundry [34] Fuel2.8-machine capacity 28 tKm/lDirect
Transport of recovered Fe from industrial plant to foundry [34] Fuel2.8-machine capacity 28 tKm/lDirect
Aluminum secondary production [19]Electric energy0.75kWh/kgIndirect
Clay transport [34] Fuel2.8-machine capacity 28 t Km/lAvoided
Clay extraction [36] Fuel17.3-machine potential 80 kWl/hAvoided
Bauxite extraction [36] Fuel17.3-machine potential 80 kWl/hAvoided
Bauxite transport to foundry [34] Fuel2.8-machine capacity 28 tKm/lAvoided
Bayer treatment [19]Electric energy4kWh/kgAvoided
Electrolytic process [19]Electric energy20kWh/kgAvoided
Ferrous mineral extraction [36] Fuel30.3-machine potential 140 kW l/hAvoided
Ferrous mineral transport from quarry to foundry [34] Fuel2.8-machine capacity 28 tKm/lAvoided
Ferrous mineral treatment [31]Electric energy10kWh/tAvoided
Table 4. Comparison between the used LCA input values and values proposed in literature.
ProcessResourceValueUnitReferences
BA treatmentElectric energy4 *kWh/t[35]
10[37]
8[38]
Leachate -10% lost humidity*l/year**
7% lost humidity [35]
Aluminum secondary production Electric energy0.75 *kWh/kgaluminum[19]
2[39]
Electrolytic process -20 *kWh/kgaluminum[19]
13–17[39]
12.9–15.5 [40]
* Value used in the described LCA application. ** Value obtained from the reported experimental industrial activity.
Table 5. Equivalence Factors (EFs) [39].
Global Warming (Time = 100 years) “EDIP”
FormulaSubstanceEquivalence Factor
ValueU.M. (100 years)
CO2Carbon dioxide1g CO2/g substance
N2ONitrous oxide320g CO2/g substance
CH4Methane25g CO2/g substance
CFCl3CFC-114000g CO2/g substance
CF2Cl2CFC-128500g CO2/g substance
CF3ClCFC-1311,700g CO2/g substance
CF2ClCF2ClCFC-1149300g CO2/g substance
CFC-11612,500g CO2/g substance
CCl4Tetrachloromethane 1400g CO2/g substance
HCFC22HCFC221700g CO2/g substance
HCFC141bHCFC141b630g CO2/g substance
HCFC142bHCFC142b2000g CO2/g substance
COCarbon Monoxide 2g CO2/g substance
CF3BrHalon 13016200g CO2/ g substance
Acidification (“EDIP”)
FormulaSubstanceEquivalence Factor
ValueU.M. (100 years)
SO2Sulfur dioxide 1g SO2/g substance
SO3Sulfur trioxide 0.8g SO2/g substance
NO2Nitrogen dioxide 0.7g SO2/g substance
NONitrogen monoxide 1.07g SO2/g substance
HNO3Nitric acid 0.51g SO2/g substance
H2SO4Sulfuric acid 0.65g SO2/g substance
H3PO4Phosphoric acid 0.98g SO2/g substance
H2SHydrogen sulfide 1.88g SO2/g substance
HFHydrofluoric acid 1.6g SO2/g substance
HClHydrochloric acid 0.88g SO2/g substance
NH3Ammonia 1.88g SO2/g substance
Eutrophication (“EDIP”)
FormulaSubstanceEquivalence Factor
ValueU.M. (100 years)
cyanideCyanide2.38g NO3/g substance
NtotTotal nitrogen 4.43g NO3/g substance
N2ONitrous oxide 2.82g NO3/g substance
NH3Ammonia 3.64g NO3/g substance
PtotTotal phosphorus 32.03g NO3/g substance
Photochemical Ozone Creation (“EDIP”)
FormulaSubstanceEquivalence Factor
ValueU.M. (100 years)
CH4Methane0.03g Ethylene/g substance
Ethane0.3g Ethylene/g substance
Propane1.2g Ethylene/g substance
Butane1.2g Ethylene/g substance
Hexane1.5g Ethylene/g substance
Heptane1.7g Ethylene/g substance
Alkane1.2g Ethylene/g substance
CHarom.0.048g Ethylene/g substance
Methanol0.21g Ethylene/g substance
Acetone0.27g Ethylene/g substance
Butene1.2g Ethylene/g substance
Benzene0.45g Ethylene/g substance
Toluene0.83g Ethylene/g substance
EthilBenzene1.1g Ethylene/g substance
Formaldehyde0.58g Ethylene/g substance
Acetaldehyde1.2g Ethylene/g substance
Aldehyde1.3g Ethylene/g substance
VOC0.808g Ethylene/g substance
Human toxicity (USES 2.0)
FormulaSubstanceEquivalence Factor
ValueU.M. (100 years)
air
SbAntimony 6200geq1-4-dichlorobenzene
AsArsenic370,000geq1-4-dichlorobenzene
BaBarium 710geq1-4-dichlorobenzene
CdCadmium 160,000geq1-4-dichlorobenzene
CoCobalt 19000geq1-4-dichlorobenzene
CuCopper4700geq1-4-dichlorobenzene
PbLead360geq1-4-dichlorobenzene
HgMercury 1200geq1-4-dichlorobenzene
MoMolybdenum 4900geq1-4-dichlorobenzene
NiNickel38,000geq1-4-dichlorobenzene
SeSelenium 43,000geq1-4-dichlorobenzene
SnTin1.2geq1-4-dichlorobenzene
VVanadium6000geq1-4-dichlorobenzene
ZnZinc110geq1-4-dichlorobenzene
NH3Ammonia1geq1-4-dichlorobenzene
H2SHydrogen sulfide 0.77geq1-4-dichlorobenzene
HClHydrogen chloride 2.40geq1-4-dichlorobenzene
C2H4Ethylene 0.69geq1-4-dichlorobenzene
CH2OFormaldehyde 0.91geq1-4-dichlorobenzene
C6H6Benzene2000geq1-4-dichlorobenzene
C6H5CH3Toluene0.36geq1-4-dichlorobenzene
C6H5OHPhenols 0.57geq1-4-dichlorobenzene
CHCl3Chloroform 12geq1-4-dichlorobenzene
1,2CH2ClCH2ClDichloroethane7geq1-4-dichlorobenzene
water
AsArsenic880geq1-4-dichlorobenzene
BaBarium570geq1-4-dichlorobenzene
CdCadmium23geq1-4-dichlorobenzene
CrChrome2.1geq1-4-dichlorobenzene
CoCobalt99geq1-4-dichlorobenzene
CuCopper1.3geq1-4-dichlorobenzene
PbLead12geq1-4-dichlorobenzene
HgMercury250geq1-4-dichlorobenzene
MoMolybdenum5000geq1-4-dichlorobenzene
NiNickel310geq1-4-dichlorobenzene
SeSelenium51,000geq1-4-dichlorobenzene
SnTin0.017geq1-4-dichlorobenzene
VVanadium2900geq1-4-dichlorobenzene
ZnZinc0.57geq1-4-dichlorobenzene
CH2OFormaldehyde0.04geq1-4-dichlorobenzene
C6H6Benzene1900geq1-4-dichlorobenzene
C6H5CH3Toluene0.33geq1-4-dichlorobenzene
C6H5OHPhenols0.054geq1-4-dichlorobenzene
soil
AsArsenic490geq1-4-dichlorobenzene
CdCadmium90geq1-4-dichlorobenzene
CoCobalt61geq1-4-dichlorobenzene
CuCopper3.2geq1-4-dichlorobenzene
PbLead180geq1-4-dichlorobenzene
HgMercury200geq1-4-dichlorobenzene
MoMolybdenum2800geq1-4-dichlorobenzene
NiNickel160geq1-4-dichlorobenzene
SeSelenium25,000geq1-4-dichlorobenzene
TIThallium100,000geq1-4-dichlorobenzene
SnTin32geq1-4-dichlorobenzene
VVanadium1600geq1-4-dichlorobenzene
ZnZinc0.35geq1-4-dichlorobenzene
C6H5ClChlorobenzene7.1geq1-4-dichlorobenzene
Depletion of non-renewable resources
FormulaSubstanceReserve available
valueU.M. (100 years)
R(i)F(i): frac of reserve
Oil (in ground)2.4 × 10144.17 × 10−15
Natural gas1.3 × 10147.69 × 10−15
UUranium (hours)1.3 × 10107.69 × 10−11
CuCopper (hours)6.1 × 10111.64 × 10−12
PbLead (hours)1.2 × 10118.33 × 10−12
NiNickel1.1 × 10119.09 × 10−−12
ZnZinc3.3 × 10113.03 × 10−12
Al2O3Bauxite2.8 × 10133.57 × 10−14
FeIron1.0 × 10141.00 × 10−14
MnManganese5.0 × 10122.00 × 10−13
AgSilver4.2 × 1082.38 × 10−9
Coal (in ground)3.0 × 10153.33 × 10−16
Table 6. Results of LCA for the two considered scenarios.
UnitScen. 1-BA LandfillScen. 2-Inert RecoveryScen. 2-NFe RecoveryScen. 2-FE Recovery
GWP
Direct impactst CO2eq/year28.500241.00029.500107.000
Indirect impactst CO2eq/year0.00069.100−6880.000−42.900
Avoided impactst CO2eq/year0.000−1680.000−12.100−1190.000
Total impactst CO2eq/year28.500−1370.000−6860.000−1120.000
AP
Direct impactst SO2eq/year0.4600.8380.0620.613
Indirect impactst SO2eq/year0.0000.527−52.400−0.327
Avoided impactst SO2eq/year0.000−16.000−0.297−11.200
Total impactst SO2eq/year0.460−14.600−52.600−10.900
EP
Direct impactst NO3eq/year0.0220.0000.0620.000
Indirect impactst NO3eq/year0.0000.006−0.561−0.004
Avoided impactst NO3eq/year0.0000.0000.0000.000
Total impactst NO3eq/year0.0220.006−0.500−0.004
POCP
Direct impactst Ethyleneeq/year0.0520.0950.0070.070
Indirect impactst Ethyleneeq/year0.0000.073−7.230−0.045
Avoided impactst Ethyleneeq/year0.000−1.810−0.034−1.270
Total impactst Ethyleneeq/year0.052−1.640−7.260−1.250
HTP
Direct impactst 1-4-dichlorobenzeneeq/year1.0000.0000.0000.000
Indirect impactst 1-4-dichlorobenzeneeq/year0.0000.007−0.651−0.004
Avoided impactst 1-4-dichlorobenzeneeq/year0.0000.0000.0000.000
Total impactst 1-4-dichlorobenzeneeq/year1.0000.007−0.651−0.004
Table 7. Leachate tests results.
ParameterUnitLimit ValuesBottom Ashes 1Bottom Ashes 2Bottom Ashes 3Bottom * Ashes 4Bottom * Asesh 5Bottom * Ashes 6
Fluoridesmg/L≤1.50.1210.1380.16<0.9<0.9<0.9
Chloridesmg/L≤10078.311316578.9173168
Nitratesmg/L≤502.272.242.444.3<1<1
Sulphatesmg/L≤2503.533.644.32<5<58.8
Cyanidesmg/L≤0.05<0.01<0.01<0.01<0.01<0.01<0.01
Arsenicmg/L≤0.05<0.01<0.01<0.010.005<0.005<0.005
Bariummg/L≤14.182.762.54.43.44.2
Berylliummg/L≤0.01<0.005<0.005<0.005<0.0005<0.0005<0.0005
Cadmiummg/L≤0.005<0.002<0.002<0.0020.0003<0.0001<0.0001
Cobaltmg/L≤0.25<0.002<0.002<0.002<0.002<0.002<0.002
Total Chrome mg/L≤0.050.0090.0110.0130.0080.0160.011
Coppermg/L≤0.050.0850.0950.070.0590.080.076
Mercurymg/L≤0.001<0.001<0.001<0.001<0.0005<0.0005<0.0005
Nickelmg/L≤0.01<0.005<0.005<0.005<0.0004<0.0004<0.0004
Leadmg/L≤0.052.31.391.133.83.67.2
Seleniummg/L≤0.01<0.005<0.005<0.005<0.005<0.005<0.005
Vanadiummg/L≤0.250.0070.007<0.005<0.003<0.003<0.003
Zincmg/L≤31.110.640.531.30.871.2
CODmg/L≤305945806911397.7
* Measures carried out in a second different laboratory.