1. Introduction
Climate change together with the increasing population trends, especially in some developing countries, have made food production and consumption among the major issues of the coming years [
1]. Global food supply chains are expanding to match worldwide seasonal food production and demand, following a trend expected to accelerate in future [
2]. Although the relevance of the food dimension for sustainability policies is now widely accepted, efforts are largely lacking toward an integrated policy of sustainable development that covers all actors in the food sector (i.e., farmers, producers, trade, consumers, administrators), with direct consequences on the environment [
3]. Due to the fact that food manufacturing is one of the major drivers of the global environmental issues, there is a strong need to focus on sustainable manufacturing toward achieving long-term sustainability goals in food production [
4]. In this context, food waste reduction is recognized as a key action [
5]. It has been accounted that 1.3 billion tons of food is globally wasted every year, which represents one third of global food production [
6]. It is indeed a common problem to both developed and developing countries, even though in the first case, food is principally wasted at the final stages of the food supply chain (i.e., production, distribution and household level), while in the second case, food is mainly wasted at the early stages (i.e., harvesting, transport, storage) mainly due to poor infrastructure and technological limitations [
7]. Aside from the economic and social consequences, it also significantly contributes to global environmental problems, having unfavorable environmental consequences on the overall sustainability of the current food supply system [
8]. Indeed, the environmental impacts of food waste are twofold: on the one hand, it is associated with the depletion of natural resources used for its production (e.g., soil depletion, biodiversity losses, water) and distribution; on the other hand, it is related to the costs associated with waste management [
9]. In medium and high-income countries, this pattern increases the relevance of non-agricultural activities in the food supply chain, with particular attention to the production and consumer level.
Industrial processes have gradually developed and optimized in order to exploit the maximum yield from agricultural productions [
10]. As the food industry encompasses all stages of the value chain beyond the farm gate and before food consumption, it contributes to environmental degradation in numerous ways, including the generation of air emissions, land contamination and noise pollution [
11]. On the other side, food production, preservation, storage and distribution consume a considerable amount of energy, water and resources, contributing to total carbon emissions and global warming, which are the most crucial problems affecting the planet [
12]. The food transformation sector is assessed to cause approximately a third of all greenhouse gas emissions in the EU [
13]. While the public is aware of the risks due to climate change and biodiversity loss, the similar problematic imbalances in the nitrogen and phosphorous cycles have hardly been discussed yet. However, all of these four global systems are strained, agriculture and food production in particular, which is why more resource-efficient food production is crucially important [
14].
A possible solution to minimize wastage and to promote sustainable local development and resource efficiency can be the wide application of the emerging bioeconomy and circular economy model [
15,
16], which has also been identified as a fundamental requirement for sustainable development by the 2015 Paris Agreement [
17]. The minor environmental impact of the bioeconomy is principally based on the use of renewable energy sources (biomass) instead of fossil energies to produce energy and bio-based products [
18].
Among these, bioenergies have a large potential use since they can be derived by a variety of sources, such as energy crops, wood and crop residues, exploited to generate electricity, heat and biofuels. In fact, bioenergy sources generated 10% of the total energy in 2015 and 61.3% of the total renewable energy consumed in EU [
19]. Several studies assessed the environmental impacts of bioenergy exploitation along the supply chain, including energy crops [
20,
21,
22] and residues [
23,
24], but very few recent studies compare residues-based and fossil energy systems, e.g., [
25,
26].
The Life Cycle Assessment (LCA) is a widely applied technique that is gaining wider acceptance as a method that can help quantification of environmental interventions and evaluation of the improvement options throughout the life cycle of a process, product or activity [
27,
28]. Historically, LCA has mainly been applied to products; however, recent literature suggests that it can assist in identifying more sustainable options in process selection, design and optimization [
29].
The adoption of LCA methodology aims to cover two main scopes. On one hand, the environmental awareness of food supply chain processes may influence the decision-making process of administrators, industry managers and practitioners, which are responsible for the planning, and the design of future development in agro-food systems. On the other, LCA methodology allows the assessment of the environmental impacts associated to food, thereby driving the consumption habits of consumers to adopt more ethical and ecological criteria in their choices [
30]. The challenge for research is to provide a set of guidelines and key performance indicators to assist partners of the food supply chain in identifying the key areas for environmental improvements [
31].
Recent studies demonstrated that a gate-to-gate analysis is effective to assess environmental performances of food transformation [
32,
33,
34,
35] and when used in a comparative approach can highlight the environmental benefits related to the uses of bioenergy in industrial processes [
36,
37].
Unlike the agricultural phase, whose impacts can be managed according to EU and national policies [
38], more information is required for the industrial transformation of food for identifying sustainable solutions and for proposing integrated appraisal methods for comparing possible alternatives, using a LCT (Life Cycle Thinking) and LCA approach [
39], in a perspective of the 2030 Agenda for Sustainable Development challenges [
40].
The aim of this research is to present the results of the LCA of a maize-germ oil production and to assess the environmental benefits derived from the use of residue biomasses. The scope is to analyze the environmental impacts associated to the industrial processing using a gate-to-gate approach, of 1 ton of refined oil. Maize-germ oil is obtained from seedlings from the
Zea mays L. (Gramineae) by pressing (cold-pressed maize-germ oil) or by extraction, after which it is refined (refined maize-germ oil). Its main use is in cooking, where its high smoke point makes refined corn oil a valuable frying oil, but it is also a feedstock used for biodiesel. Other industrial uses for maize oil include soap, salve, paint, rustproofing for metal surfaces, inks, textiles and insecticides. Sometimes, it is used as a carrier for drug molecules in pharmaceutical procedures. Due to its wide uses, maize germ oil is considered as feed commodities traded worldwide [
41]. The main producer is USA with double the annual production from South Africa, its nearest competitor. In Europe, Italy is the principal producer with almost 65,000 tons per year [
42]. In the field of food oils, maize-germ oil processing has not been previously considered in an LCA perspective. In order to measure and evaluate such contributions, this study illustrates the environmental impacts of all the industrial phases of a refined oil production factory located in Faenza (Province of Ravenna, Northern Italy), taking into account the input and output contributions, and a comparison between environmental impact using alternative solutions for energy supplies (conventional energy or bioenergy). The specific factory is the larger European producer for maize oil, and uses biomass residues to supply the energy demand of its industrial processes. Therefore, the analysis can be highly representative for describing the specific food industry transformation.
2. Methodology and Data
2.1. Description of the System under Study
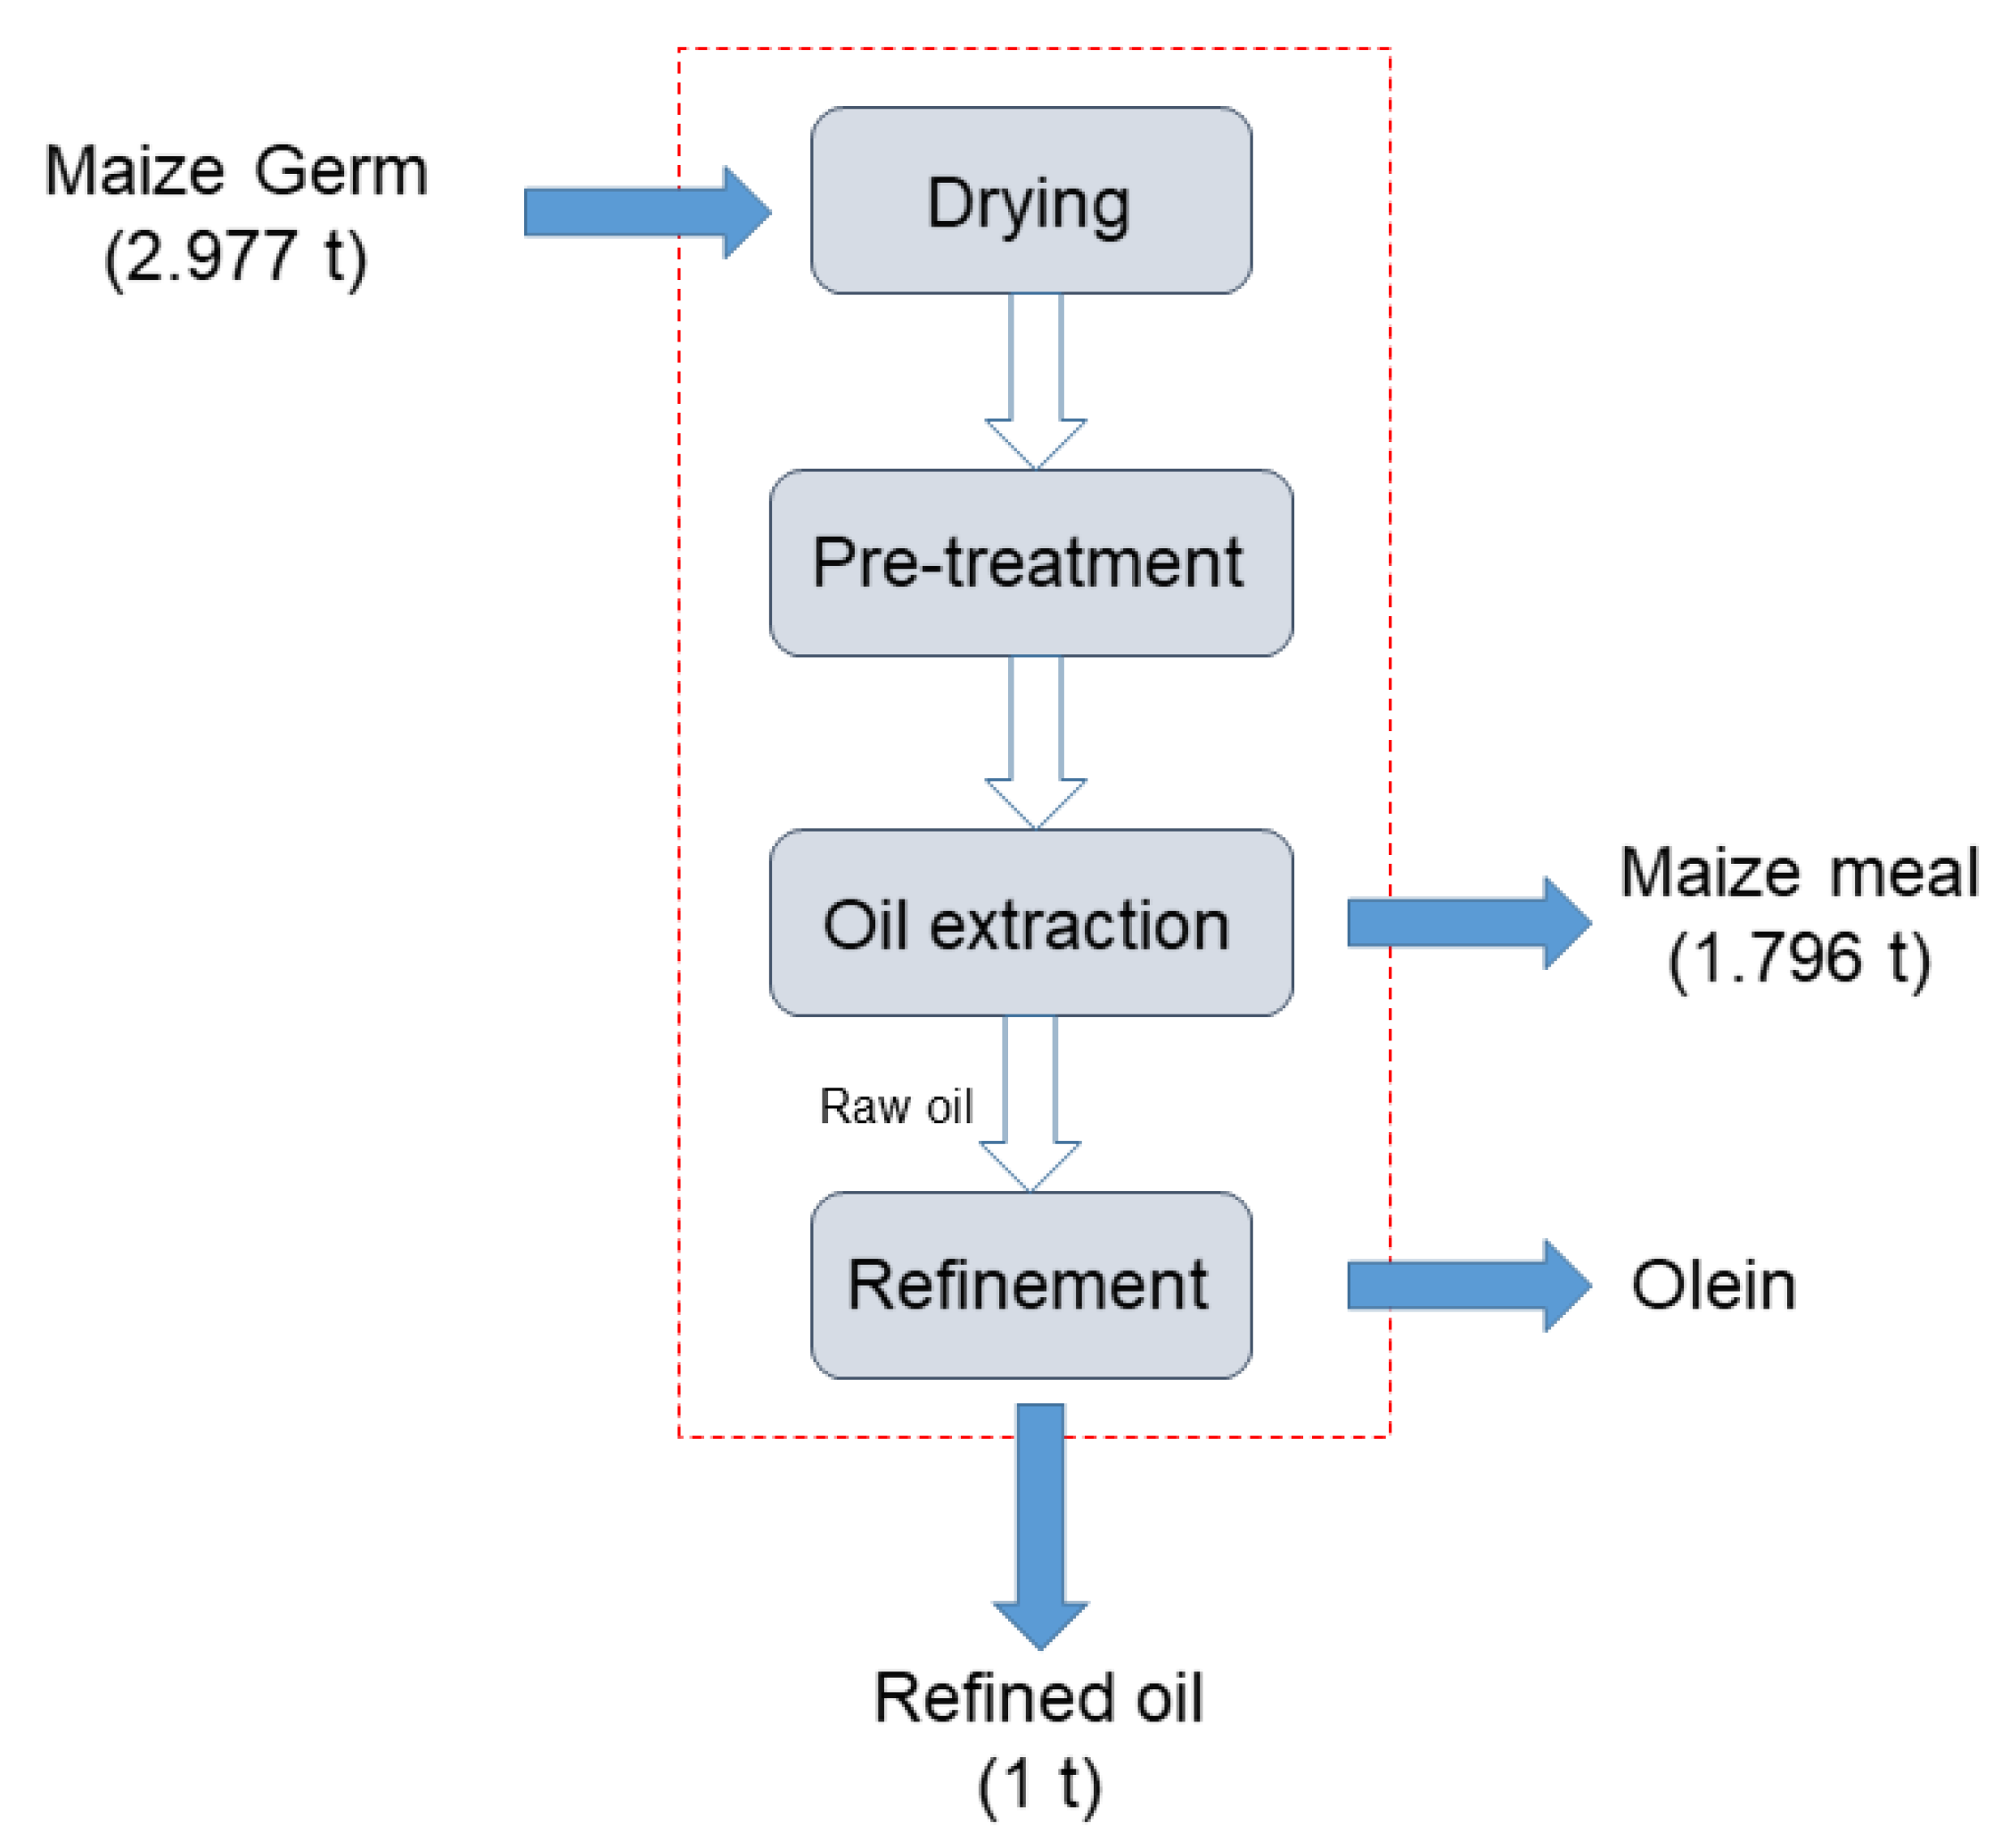
The industrial activities transform maize germ (input) in maize refined oil (main product) and maize meal (co-product). Both products are sold in bulk to market distributors. No canning process occurs. The industrial system includes four processes: (i) germ drying (exsiccation), (ii) pre-treatment, (iii) oil extraction and (iv) oil refinement. The germ exsiccation (i) is performed through an industrial dryer, where the maize-germ loses the moisture contained therein, before stocking and transportation to the next stage.
The pre-treatment process (ii) is a necessary stage before oil extraction. It includes the seed rupture, pre-heating (necessary to increase the final yield), laminating, pressing and pelleting. Subsequently, the oil is extracted (iii) from the resulting pellet through a solvent (hexane). The mixture of hexane-oil undergoes a distillation and heating-cooling processes to eliminate the solvent from the oil and meal, respectively. After this stage, the maize meal can be traded to buyers, while the resulting oil (raw oil) needs to be subjected to the refinement process (iv). The latter allows the production of edible maize oil. The raw oil is treated with phosphoric acid and sodium hydroxide to remove acid phosphatides and free fatty acids, respectively (neutralization). Waxes are separated by winterization (6–8 °C). Finally, the oil is purified with bleaching solids and activated carbons, deodorized with a vapor-based treatment, filtered and insufflated with gaseous nitrogen to avoid oxidation.
The amount of energy necessary to supply all the industrial processes described above is supplied by thermoelectric power plants, which produce steam and electricity (up to 44 MW of electrical energy) from crude vegetable oils and solid biomass.
2.2. Goal and Scope of LCA
The purpose of this study is to investigate: (i) the main impacts related to the industrial process of maize oil, and (ii) the mitigation of the environmental impacts due to the use of second-generation biomasses (i.e., residues from industrial processes of food transformation) for the energy supply of an industrial process of maize oil production. The European leader factory for maize oil production was selected as the representative case study to be exported as an example of using biomass residues to increase the sustainability of the food industry. This factory uses self-produced and imported residues to supply the energy demand of their industrial processes.
LCA was selected in order to evaluate the magnitude of impacts’ mitigation related to the use of biomass residues to cover the energy consumption of the maize oil production process. A gate-to-gate approach was adopted to identify the specific environmental benefits.
As the first step, LCA was performed to assess the environmental impacts at the current conditions (i.e., energy production from residues biomasses). After, a second LCA was carried out for a baseline alternative scenario where the energy demand was supplied by the Italian national electricity network (i.e., energy produced by the national mix of fossil fuels and renewable energies). Finally, the environmental benefits due to the use of biomass residues were assessed by comparing the current and the baseline scenarios. A comparison approach for bioenergy-derived benefits was carried out both for the functional unit and for annual production capacity. The latter can provide suitable information on the magnitude of avoided impacts derived from exploitation of renewable energies.
2.3. Functional Unit, System Boundaries and Assumption
Since the aim was to assess only those environmental impacts related to the industrial process, the study was carried out according to a gate-to-gate approach. This approach restricts the analysis only to a part (the manufacturing stage) of the total life cycle of the product (
Figure 1). Specifically, the analysis neither considered the impacts produced upstream the industrial transformation (e.g., those concerning cropping, harvest, storage, transport, etc.), nor those related to the fate of final products (transport, consumption, waste disposal, etc.). The functional unit was defined as 1 ton of output maize refined oil.
Moreover, a comparative approach was adopted to assess the impacts avoided by the use of energy derived from residual biomasses to supply the industrial processes. The analysis was performed for both (i) the current scenario (RES) where the energy demand of the industrial processes is covered by the use of biomass residues and (ii) an alternative Business as Usual (BAU) scenario where the energy is supplied by the national electricity energy network.
The savings related to the use of bioenergy were calculated using a comparative approach between the current (RES) and baseline (BAU) scenarios, i.e., calculating the differences for each impact category.
The industrial transformation of maize germ involves four processes to produce refined maize oil and maize meal (as a co-product) (
Figure 1). The industrial process also generates by-products, e.g., oleins that were not considered in the analysis.
2.4. Data Acquisition and Life Cycle Inventory
Data collection is the most critical step of the LCA, since the reliability of the outcomes strictly depends on the accuracy of the input data. The data requirements for this analysis were directly collected from the company Tampieri spa, for the year 2015. The use of primary data allows avoiding any bias due to use of data derived from standard databases. The LCA modelling was performed with SimaPro 8.02 [
43], according the ISO standards [
44] and using CML-IA baseline V3.05/EU25 method.
The input data for each process, necessary to produce 1 ton of maize refined oil, are reported in
Table 1. Pre-treatment and oil extraction were considered as unique processes, since the two stages occur in continuum. Moreover, all the inputs, which are not clearly accountable to a specific process, were computed as “general consumption.” These include material and energy consumed for plants maintenance, waste disposal and relative transport. All transport activities were accounted to be carried out by Euro-3 diesel truck, with cargo weight between 16 and 32 tons.
The annual production of 2015 was 66,332.9 tons of maize meal and 27,303.8 tons of refined maize oil.
Table 2 reports inputs and outputs including by-products (ashes) related to the annual bioenergy production (mainly self-produced by the factory). The plant worked for a total of 7368 h during the 2015, to generate 723,883,359 kWh (78.4% of the total and equal to 622,844,190,344 kcal) of thermal energy and 176,250,469 kWh (21.6%) of electric energy.
2.5. Allocation
Mass allocation was performed to analyze the impacts related to co-products (i.e., maize meal) production. Since the analysis did not include by-products, no allocation options were carried out for oleins.
2.6. LCA Impact Categories
The CML-IA baseline standard reports the following impact categories:
- i)
Abiotic Resource Depletion (AD), expressed as kg of Sb eq.
- ii)
Abiotic Resource Depletion (AD fossil fuels), expressed as MJ
- iii)
Global Warming Potential with a period of 100 years (GWP100)
- iv)
Ozone Layer Depletion Potential (ODP), expressed as kg of CFC-11 eq.
- v)
Human toxicity (HT), expressed as kg 1,4-dichlorobenzene (1,4-DB) eq.
- vi)
Freshwater aquatic ecotoxicity (FWE), expressed as kg 1,4-DB eq.
- vii)
Marine aquatic ecotoxicity (MAE), expressed as kg 1,4-DB eq.
- viii)
Terrestrial ecotoxicity (TE), expressed as kg 1,4-DB eq.
- ix)
Photochemical Ozone Creation Potential (POCP), expressed as kg of C2H4 eq.
- x)
Acidification Potential (AP), expressed as kg of SO2 eq.
- xi)
Eutrophication Potential (EP), expressed as kg of PO43- eq.
Moreover, the performances in terms of energy demand were assessed. The Cumulative Energy Demand (CED) represents the direct or indirect energy used throughout the life cycle within the system boundary. It includes the energy directly consumed within the processes, used by energy providers to supply the processes, contained in auxiliary and raw materials and consumed by transport operations. The CED was assessed for both scenarios in order to evaluate the differences in amount and composition of the energy budget. The CED v1.10 classifies six different impact categories, including renewable and non-renewable energy sources:
- i)
Non-renewable fossil
- ii)
Non-renewable nuclear
- iii)
Non-renewable biomasses
- iv)
Renewable biomasses
- v)
Renewable wind, solar, geothermal
- vi)
Renewable water
All the categories are expressed in MJ.
4. Discussion
The present gate-to-gate study provides a detailed analysis of the impacts generated by industrial transformation of maize germ in edible oil. The LCA was applied to maize oil production in an Italian enterprise in the Emilia-Romagna region (Northern Italy). Considering the large size of the factory, the case study is highly representative of both environmental impacts of oil maize transformation and the contributions of biomass residues to mitigating those impacts.
Besides the agricultural stage, that is the most relevant source of environmental impacts throughout the life cycle of edible oil production, gate-to-gate studies can inform private enterprises working in the industrial food transformation and stakeholders on the environmental benefits of promoting the valorization of biomass residues, by providing a relevant metric for circular economy [
46]. In fact, these analyses revealed the most impacting processes along the food transformation, addressing a most “green” design of industrial activities. This, in turn, can increase economic efficiency [
47] and improve the green marketing of enterprises. Environmental indicators given by LCA help to understand impacts and pollution issues. In this production field, in particular, there is a need for indicators that provide the right information to the decision-makers, useful for making comparisons among companies. The results were used as a starting point to identify the critical environmental aspects of the ‘gate-to-gate’ life-cycle system, as a first step for evaluating them like scores to understand the internal processes and, in the future, to compare other local oil production enterprises.
With respect to the LCT vision, the analysis presented in this study should be embedded on a more extended vision, which takes into account a complete LCA from cradle to grave. For instance, the origin of maize germ is expected to markedly affect the life cycle performance of the maize refined oil production chain. Even though uncertainties arise from the use of different calculation methods [
48], the different agricultural practices adopted for maize germ production significantly affect the environmental performances, by involving the use of different amounts of fertilizers and pesticides [
48,
49]. Nonetheless, site-specific data are needed to assess these impacts because of the relevant role played by local factors, such as soil characteristics [
50] and local yield responses of different maize genotypes to fertilizer applications [
51].
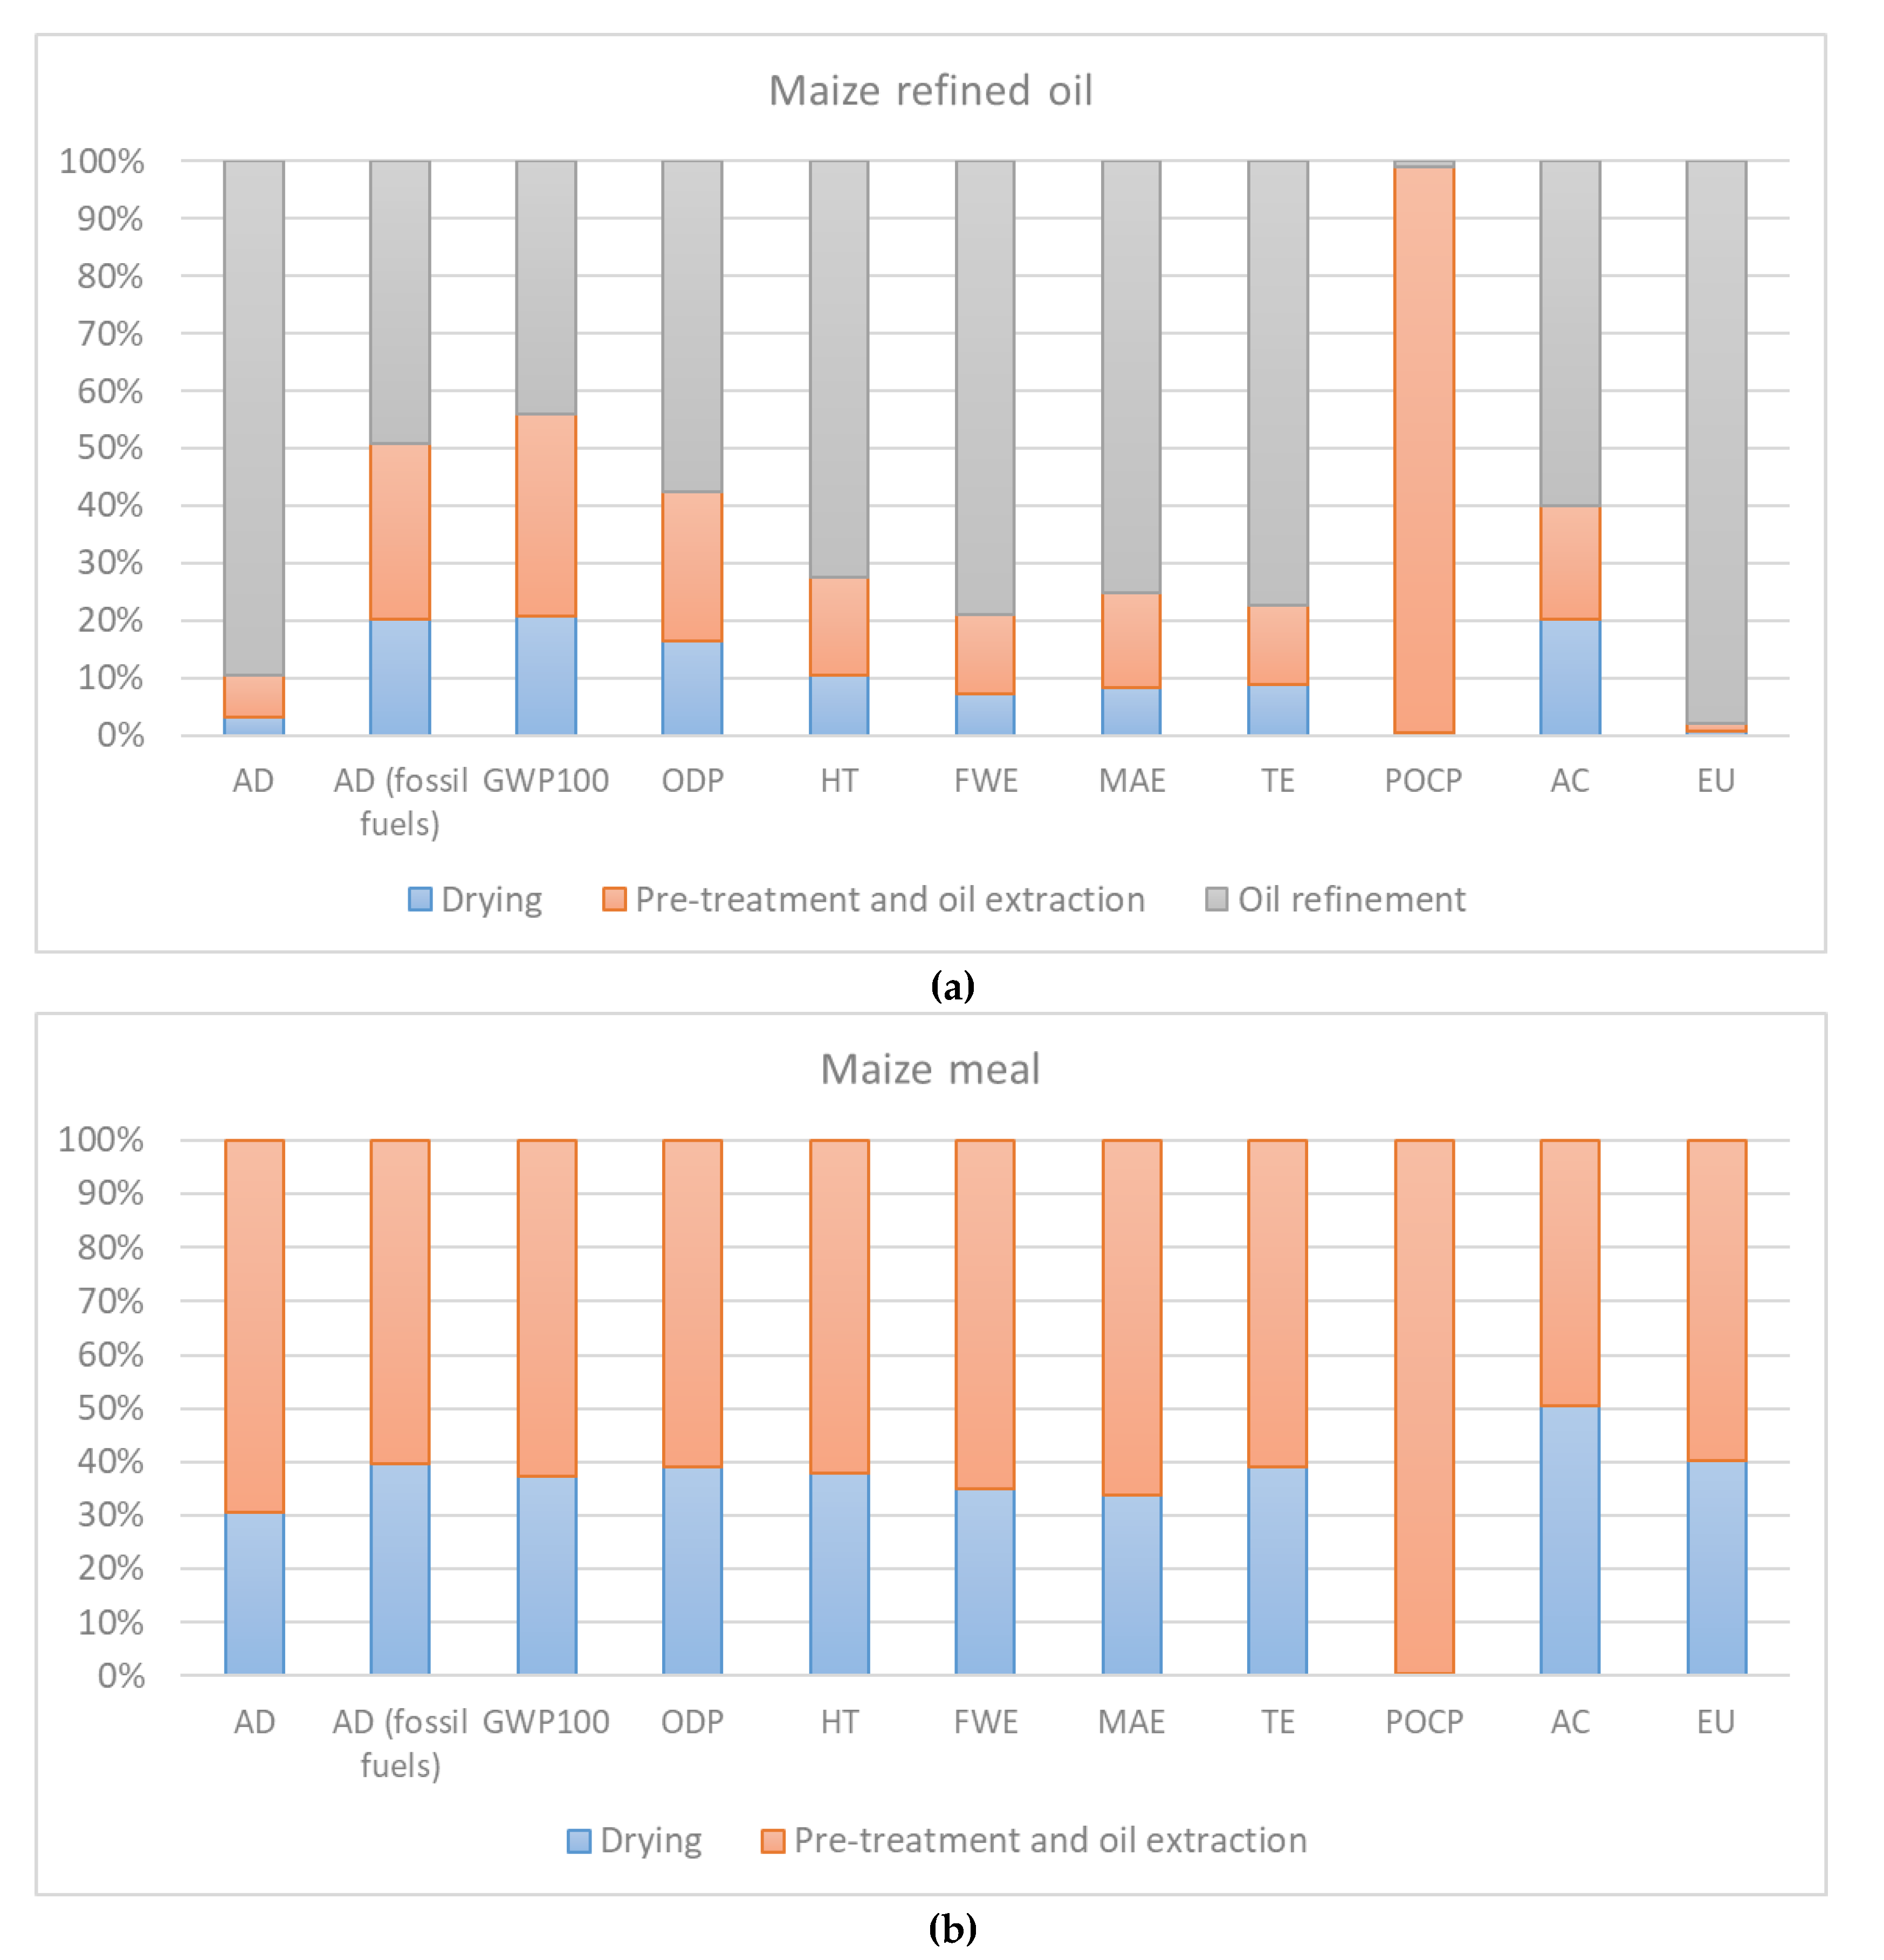
The uneven contribution of the different processes to the impact categories highlights that a process-oriented approach may be effective to reduce environmental impacts. For example, in the case of edible maize oil transformation, oil refinement was found to be the most impacting phase for all the impact categories except POCP. Therefore, specific measures on reducing impacts of this phase are strategic for improving environmental performance. For example, the use of alumina ceramic membrane for microfiltration of treating wastewater from oilseed processing facilities significantly reduces the chemical oxygen demand in wastewaters [
52], and thus significantly mitigates the impacts in MAE, which showed the larger emission values among the ecotoxicological categories.
Particular attention should be focused to the use of hexane in the extraction process, which is responsible for the larger impacts in terms of POCP. Using only yield as a key parameter and the economic issue as the unique perspective, the choice unavoidably falls on organic solvent extraction, with respect to any other method available, because it is well-known that it is possible to achieve oil yields of 95%, with an organic solvent recovery of 95% or more [
53]. However, also taking into account the overall environmental implications shown by LCA, one can discover that organic solvents such as hexane in particular, burden POCP because they can contribute to the industrial emissions of volatile organic compounds that are particularly worrisome since they can react in the atmosphere with other pollutants to produce ozone and other photochemical oxidants, which can be hazardous to human health and can cause damage to crops. Besides this, the volatile organic compounds are “greenhouse gases” while some are carcinogenic and have toxic properties [
54]. With this regard, the use of aqueous enzymatic extraction is known to be a valid and environmentally cleaner alternative for maize oil extraction [
55].
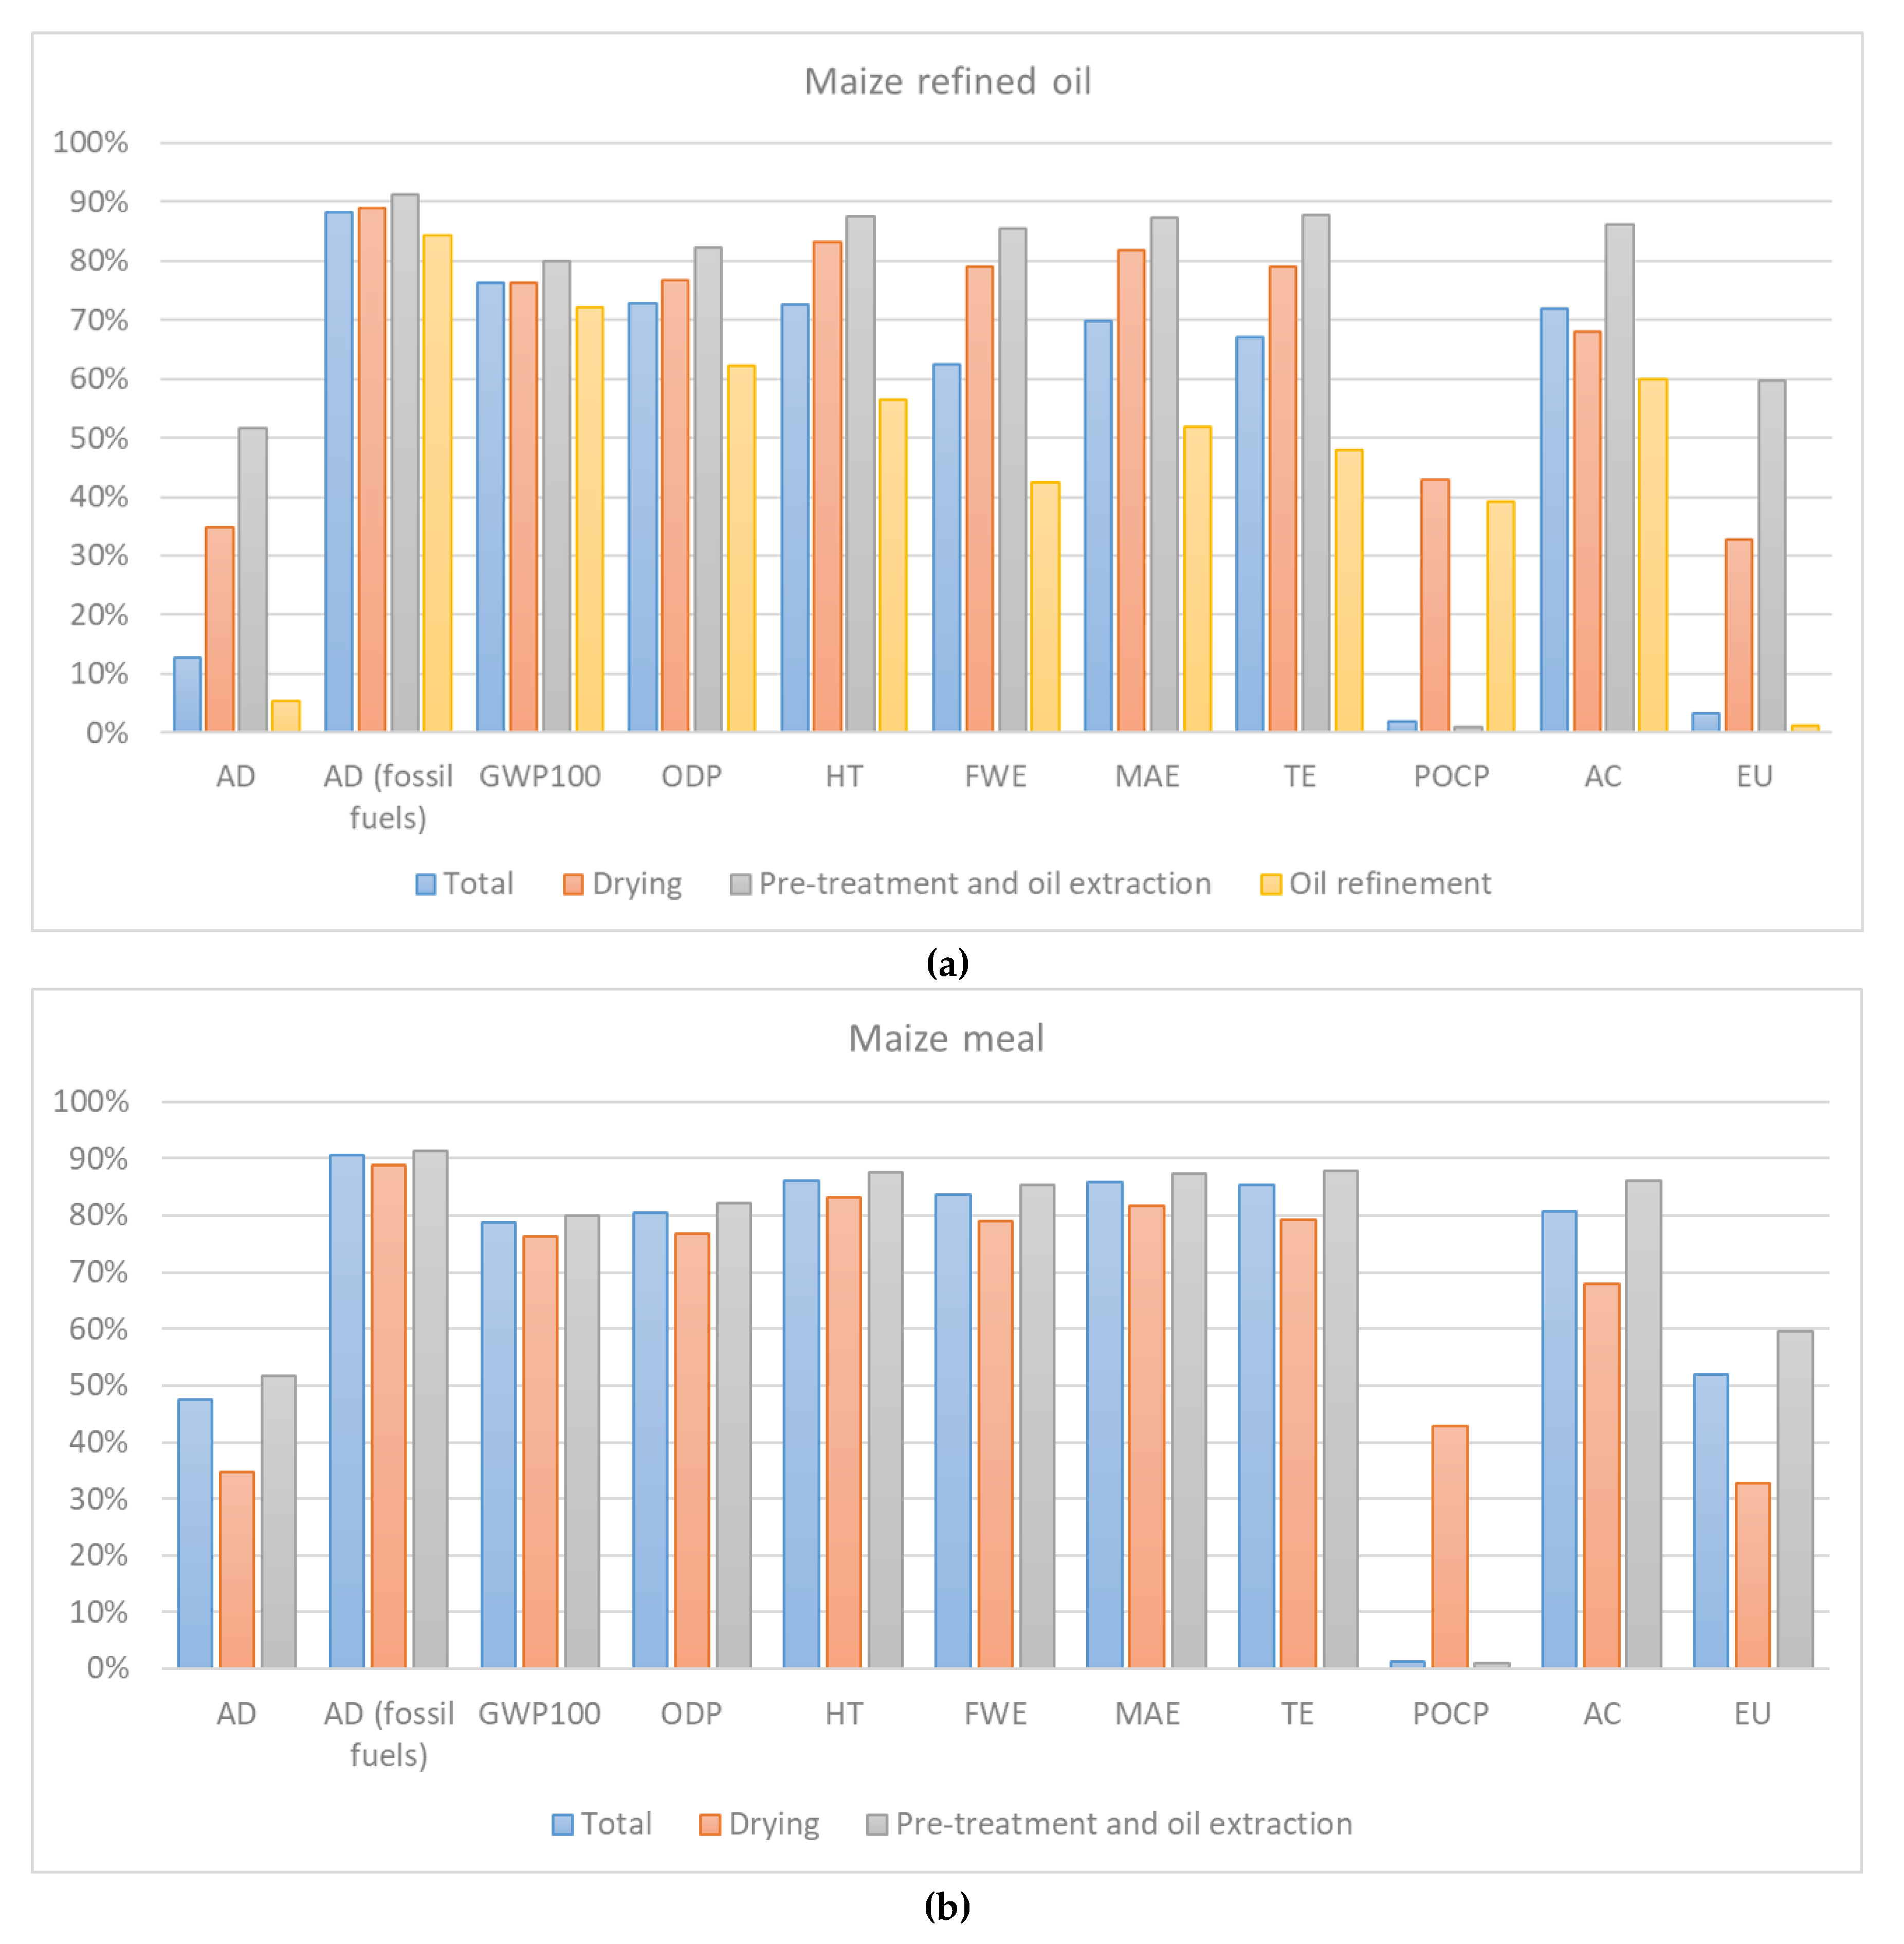
The use of biomass residues significantly reduces environmental impacts for almost all the considered impact categories. Different performances between maize refined oil and maize meal were due to the relevant role of the refining phase that is not involved in maize meal production.
In the oil extraction and refinement step of edible oil industries, natural gas combustion and background processes of natural gas also play major roles in generating environmental impact categories [
26]. For this reason, the effects of using alternative energy sources needs to be investigated. Mitigations for AD and MAE impact categories derived from the exploitation of residues were also assessed in an industrial gate-to-gate analysis by [
56]. However, the authors also found negative outcomes in terms of AC, EP, HT and TE that were not observed in our analysis.
CED analysis highlighted that pre-treatment and oil extraction was the most energy demanding process, while oil refinement was the phase with the higher consumption of non-renewable energies.
CED analysis also revealed that the use of biomass residues increases energy efficiency by leading to a reduction of the total CED of the industrial process. The decrease of total CED obtained by exploiting biomass residues can be explained by the avoided energy consumption related to auxiliary activities (e.g., transport and waste disposal) needed for energy production by the national energy mix. Such performances also have beneficial effects in terms of AD (fossil fuels) and GWP.
Bioenergy systems generally ensure GHG emission savings when compared to conventional fossil reference systems. For instance, net GHG emissions from generation of a unit of electricity from biomass are 10%–30% of those from fossil fuel-based electricity generation [
57]. The ratio will be more favorable, and could arrive at 50% if biomass is produced with low energy input (or derived from residue streams, as in this case), converted efficiently and if the fossil fuel reference is based on conventional non-optimized fossil-intensive technology. If compared with other renewable sources, electricity from biomass generally has higher GHG emissions than hydro, wind and geothermal derived electricity, while it is comparable with photovoltaic power production systems [
58].
The use of energy generated by residual biomasses allows important savings in GWP
100. The savings in GWP
100 (i.e., reduced carbon footprint) could be underestimated because the avoided impacts related to residues disposal were not accounted in the analysis. However, the magnitude of climate change mitigation can be affected by the decay rate of residuals [
59]. It can be envisaged that the RES scenario releases lower GHG emissions than the conventional fossil reference system. For both CO
2 and CH
4 emissions there should be a decrease in airborne emissions (especially CO
2, thanks to the positive balance of carbon sequestration during biomass growing), contributing to the overall impact reduction. With respect to AD (fossil fuels), the scenario based on the biomass recovery leads to a significant impact reduction. In the conventional energy supply, AD is usually higher, due to the large consumption of fossil fuels in the reforming process and in the production of process electricity [
60]. The biorefinery system has lower impacts in all categories except for EP and POCP. Eutrophication is mostly given by nitrogen and phosphorous emitted during the oil refinement phase and for this reason the use of bioenergy does not significantly mitigate EP. However, the contribution of the industrial phase to EP is modest along the total life cycle of oil production, if compared with the agricultural phase that includes fertilizer applications. As reported elsewhere [
61], emissions induced by fertilizer application also influence other environmental categories, like terrestrial and fresh water ecotoxicity, human toxicity and others.
Even for POCP, biomass utilization causes higher emissions than the conventional system, because, as eutrophication, this category is directly affected by NOx and volatile organic compounds emissions [
62] deriving from biomass combustion. Therefore, as observed for EP, the impact mitigations related to the use of residues for energy production is negligible.
Within the gate-to-gate analysis, the larger impact savings were observed for pre-treatment and oil extraction, which are the most energy-demanding processes.
Overall, this study demonstrates the potential capacity of the use of crop and industrial residues for energy production to reduce carbon footprints and to mitigate other environmental impacts as acidification phenomena. Even though residues’ burning produces emissions of several gases (see outputs of
Table 2), it allows savings in the energy-demanding processes that overcompensate their impacts. These findings are in line with those of [
11] and [
12], who demonstrated a significant reduction of environmental impacts due to the use of biomass residues for energy production, when compared to fossil energy sources.
Additionally, the renewable energy produced from these sources avoids the trade-offs caused by growing energy crops. In fact, the latter leads to a wide set of conflicts involving, for example, land use competition with food production [
63], biodiversity [
64] and other ecosystem services [
65,
66].
Despite their abundance in high productive contexts [
67,
68], the exploitability of residues is limited by their scattered distribution in the rural landscape [
69] and by their unstable supply [
70]. Moreover, when residues are not self-produced, long distances between production sites and power plants can decrease economic and environmental benefits by increasing impacts due to transport. In this case, the re-use of waste products permits to obtain a net positive balance on some impact categories, significantly reducing the overall environmental impact of the entire process. It has been estimated that a variation of biomass transport from 25 to 50 km implies up to a 50% increase of the environmental impacts [
71]. Therefore, a preliminary spatial assessment of the potential availability of this resource is needed when designing an effective supply chain and/or discussing energy plans. Intini et al. [
72] carried out an assessment of the benefits arising from the possible use of by-products for energy recovery, confirming that GHG emissions could be effectively reduced if all the residues were not destined for waste (as usually happens today) but rather to electricity and heat production plants.
The results per ton of oil revealed that maize-germ oil (considering only a gate-to-gate approach) can be inserted among the low-medium impact oils for greenhouse gas emissions, such as soybean, rapeseed and sunflower oils [
73], both when considering the RES scenario (59.2 kg CO
2 eq.) and BAU scenario (135 kg of CO
2 eq.). For example, Patthanaissaranukool and Polprasert [
74] report an amount of 167 kg CO
2 eq. for the transformation of 1 ton of soybean oil (excluding packaging). GHG emissions of transforming high-impact oils, such as palm oil, can be dramatically higher. Choo et al. [
75] report the emissions of 1113 kg CO
2 eq. per ton of palm refined oil, which can reach about 2000 kg CO
2 eq. when the incineration of empty fruit bunches is considered [
76].
A comparison with the more studied olive oil has shown that it usually has higher impacts especially in terms of GWP
100, due to the high energy requirements of the technology currently applied in the mill processing (by pressure) and to the lower yield per hectare of olive [
77]. For instance, Iraldo et al. [
78] quantified the GWP
100 impacts of 1 ton of olive oil extraction phase of a factory in Central Italy at 409.5 kg CO
2 eq.
Therefore, this study demonstrates that industrial transformation of maize oil (including refinement and not including packaging) has generally lower impacts than other edible oils, which can be further reduced by the use of residues for the energy production.
5. Conclusions and Recommendation for Further Analysis
This work deals with the impacts produced by the industrial transformation of maize germ in maize refined oil and a related co-product evaluated according a gate-to-gate approach. The analysis assessed the environmental advantages derived by the use of residual biomasses for energy production in the industrial transformation in terms of avoided emissions and energetic performances.
Eleven impact categories and CED indicators including six subcategories were assessed to identify the most critical phases in the industrial processing and to describe the environmental performances of generating energy from biomass residues.
The oil refinement process was found to be the most impacting phase for almost all impact categories, thus identifying a hotspot for mitigation measures.
The use of residual biomasses for energy production within agro-industries was found to be able to significantly reduce environmental impacts for all the considered categories, to increase the efficiency of industrial transformation by reducing the total CED and to drastically decrease the consumption of non-renewable energy sources. These findings can drive the food industry towards more sustainable options, supporting circular economy and improving environmental performances of the food industry. Moreover, the use of biomass residues as energy sources can contribute to reaching the EU targets for renewable energies while avoiding land use conflicts related to bioenergy crops.
The exploitation of self-produced residues for bioenergy purposes should be strongly encouraged by EU policies, under a sustainability perspective based on environmental benefits and circular economy support.
Therefore, both bioenergy certification schemes and incentive mechanisms should support the sustainable use of self-produced renewable energy in the food industry, with the aim to mitigate the growing impacts of food supply chains on climate and ecosystems. The monetary value of avoided GHG emissions obtained by the annual timeframe analysis could represent a trade value on which some incentive mechanisms could be based on.
Our investigation provided evidence that environmental sustainability of bio-energy use and the bio-based production model are key issues for the future agro-food industries. Overall, the proposed study has provided an in-depth understanding of the categories that contribute to the environmental impact of germ oil production and on which to act to improve process sustainability. However, some constraints, such as scattered territorial distribution and unstable supply, limit the use of residual biomasses for energy purposes. Considering this, the design and planning of effective supply chains which take into account the feasible residues potential and transportation distances is a fundamental challenge for their successful exploitation.
Despite the growing consensus on residues-based bioenergies, their explicit inclusion in existing policies is still insufficient. The new EU Renewable Energy Directive (RED II) fixes specific targets for the so-called “advanced biofuels” (i.e., biofuels produced from lignocellulosic feedstocks, industrial waste, forestry and agricultural residues) and provides incentives for their exploitation. However, these measures are restricted to the transport sector and do not include other activities. More effective support to residues-based bioenergy could be provided to national and local energy plans, considering the potential and feasible availability of residues.
The main limitation of this study is that data were collected from only one producer, even though it is a market leader. Future studies could improve the database including other stakeholder categories, primarily from agriculture, as well as further investigations on environmental performances of biomass residues in different contexts, also considering different transformation technologies (e.g., biogas). Moreover, demonstrating that bio-based production is sustainable not only from an environmental point of view, but also from a social and economic perspective (using social life cycle and life cycle costing methods to support analysis) would be the real end-point to improve consumers’ awareness and increase demand.

 ,
, 


