Article

Historical Penetration Patterns of Automobile Electronic Control Systems and Implications for Critical Raw Materials Recycling

1
Empa, Swiss Federal Laboratories for Material Science and Technology, CH-9014 St. Gallen, Switzerland
2
Industrial Ecology Programme and Department of Energy and Process Engineering, Norwegian University of Science and Technology–NTNU, NO-7491 Trondheim, Norway
*
Author to whom correspondence should be addressed.
Resources 2019, 8(2), 58; https://doi.org/10.3390/resources8020058
Submission received: 14 March 2019 / Revised: 26 March 2019 / Accepted: 28 March 2019 / Published: 31 March 2019

Abstract

:
Car electronics form a large but poorly utilized source for secondary critical raw materials (CRMs). To capitalize on this potential, it is necessary to understand the mechanism in which car electronics enter and exit the vehicle fleet over time. We analyze the historical penetration of selected car electronic control systems (ECS) in 65,475 car models sold in the past 14 years by means of statistical learning. We find that the historical penetration of ECS tends to follow S-shaped curves, however with substantial variations in penetration speed and saturation level. Although electronic functions are increasing rapidly, comfort-related ECS tend to remain below 40% penetration even after 14 years on the market. In contrast, safety regulations lead to rapid ECS penetration approaching 100%, while environmental emission regulations seem to indirectly push related ECS to a medium penetration level (e.g., growing to 60% after six years). The trend towards integration of individual ECS poses long-term challenges for car electronics dismantling and recycling. Monitoring the ECS embedded in new cars, such as carried out in this study, can inform timely updates for such strategies. The results also provide a framework for developing scenarios to identify related future CRM stocks and flows.

Graphical Abstract

1. Introduction

Recent studies [1,2,3,4,5,6,7,8,9,10,11,12,13,14,15,16] have found that cars have a large potential for recovering critical raw materials (CRMs). Critical metals (CMs) are of particular interest, due to their increased use in car electronics [7,8,9,11,13,17]. Regarding rare earth element (REE) content in car electronics, Restrepo et al. [8] estimated that the neodymium stock in Swiss car electronics (around 70 t) in 2014 was similar to that in information and communication technologies (ICT) and consumer electronics. Fishman et al. [14] indicated that the neodymium stock in alternative energy vehicles (AEVs) in the United States was about 50% of the 2017 in-ground reserves, and Xu et al. [7] estimated that in 2030 about half of the neodymium demand for the production of new cars in Japan could be covered with neodymium recovered from end-of-life vehicle (ELV) electronics. Estimates of gold content per car vary from 0.2 g/t [10] to 6 g/t [4] of vehicle scrap, which is comparable to the average ore grade of gold deposits worldwide (1 g/t) [18]. Dismantling car electronics could increase the ore grade (mass fraction) of CMs to several orders of magnitude.
The ongoing revision of the Swiss regulation on waste electrical and electronic equipment (WEEE) plans to “set the framework for a mandatory dismantling and subsequent reuse/recycling of selected electrical and electronic (EE) devices embedded in end-of-life vehicles (ELVs), based on CRM mass in the EE devices and when ecologically and economically feasible” [8,19]. The EE devices to be included in the amended regulation are yet to be defined.
Until now, car electronic control systems (ECS) have been embedded in cars mostly independently to accomplish specific functions in the car [20]. However, new ECS are cross-functional, integrating many of the former functions accomplished by individual ECS [20]. The physical form in which new ECS are embedded in cars varies largely across car types and cohorts (production year). For example, the controllers in new ECS can be embedded as dedicated electronic control units (ECUs), integrated circuits in existing ECUs, or as mere software add-ons [20]. The same applies to the corresponding sensors and actuators, for which the size and material composition varies widely. These new developments in automobile ECS pose a challenge for the accounting of the number of embedded ECS as well as of the mass and composition of their related electrical and electronic (EE) devices (i.e., sensors, controllers and actuators).
The use of ECS and corresponding EE devices in vehicles, as well as their composition, is poorly understood, which hampers the development of recycling strategies for CRMs in cars. The changing composition of cars driven by the diffusion of new technologies makes it especially difficult to design policies that will remain effective in the medium or long term. In this context, it is important to understand the mechanisms by which car electronics penetrate across different car types—including the speed of technological diffusion and its response to external factors, such as rising safety and environmental standards—so that relevant scenarios for future car composition may be analyzed. In addition, it is also crucial to identify which technical car characteristics correlate with the presence of ECS, to facilitate a more accurate classification of cars in future estimations of related CRM content for the totality of the car fleet [21,22]. With this in mind, and with the main goal of informing the current revision of the Swiss WEEE regulation, we address the following research questions:
  • What are typical penetration patterns of car ECS over time?
  • What are the car characteristics correlating with the presence of car ECS in different car types?
  • What are the implications of the past trends in ECS penetration for the future recycling of car electronics?
To answer these questions, we apply statistical learning [23] to a dataset of 65,475 car models sold in Switzerland over the past 14 years.
This study informs the current revision of the Swiss WEEE regulation and contributes to improving the prospective accounting of CRM stocks and flows in car electronics by breaking down the historical penetration patterns of selected car ECS. Our study illustrates the impact of safety and environmental regulations as well as of ECS integration on the speed of technological change in the car electronics sector. The methods and results provide a framework for developing scenarios for related future material stocks and flows, and demonstrate how car statistics can be compiled to better reflect differences in equipment level and CRM content.

2. Materials and Methods

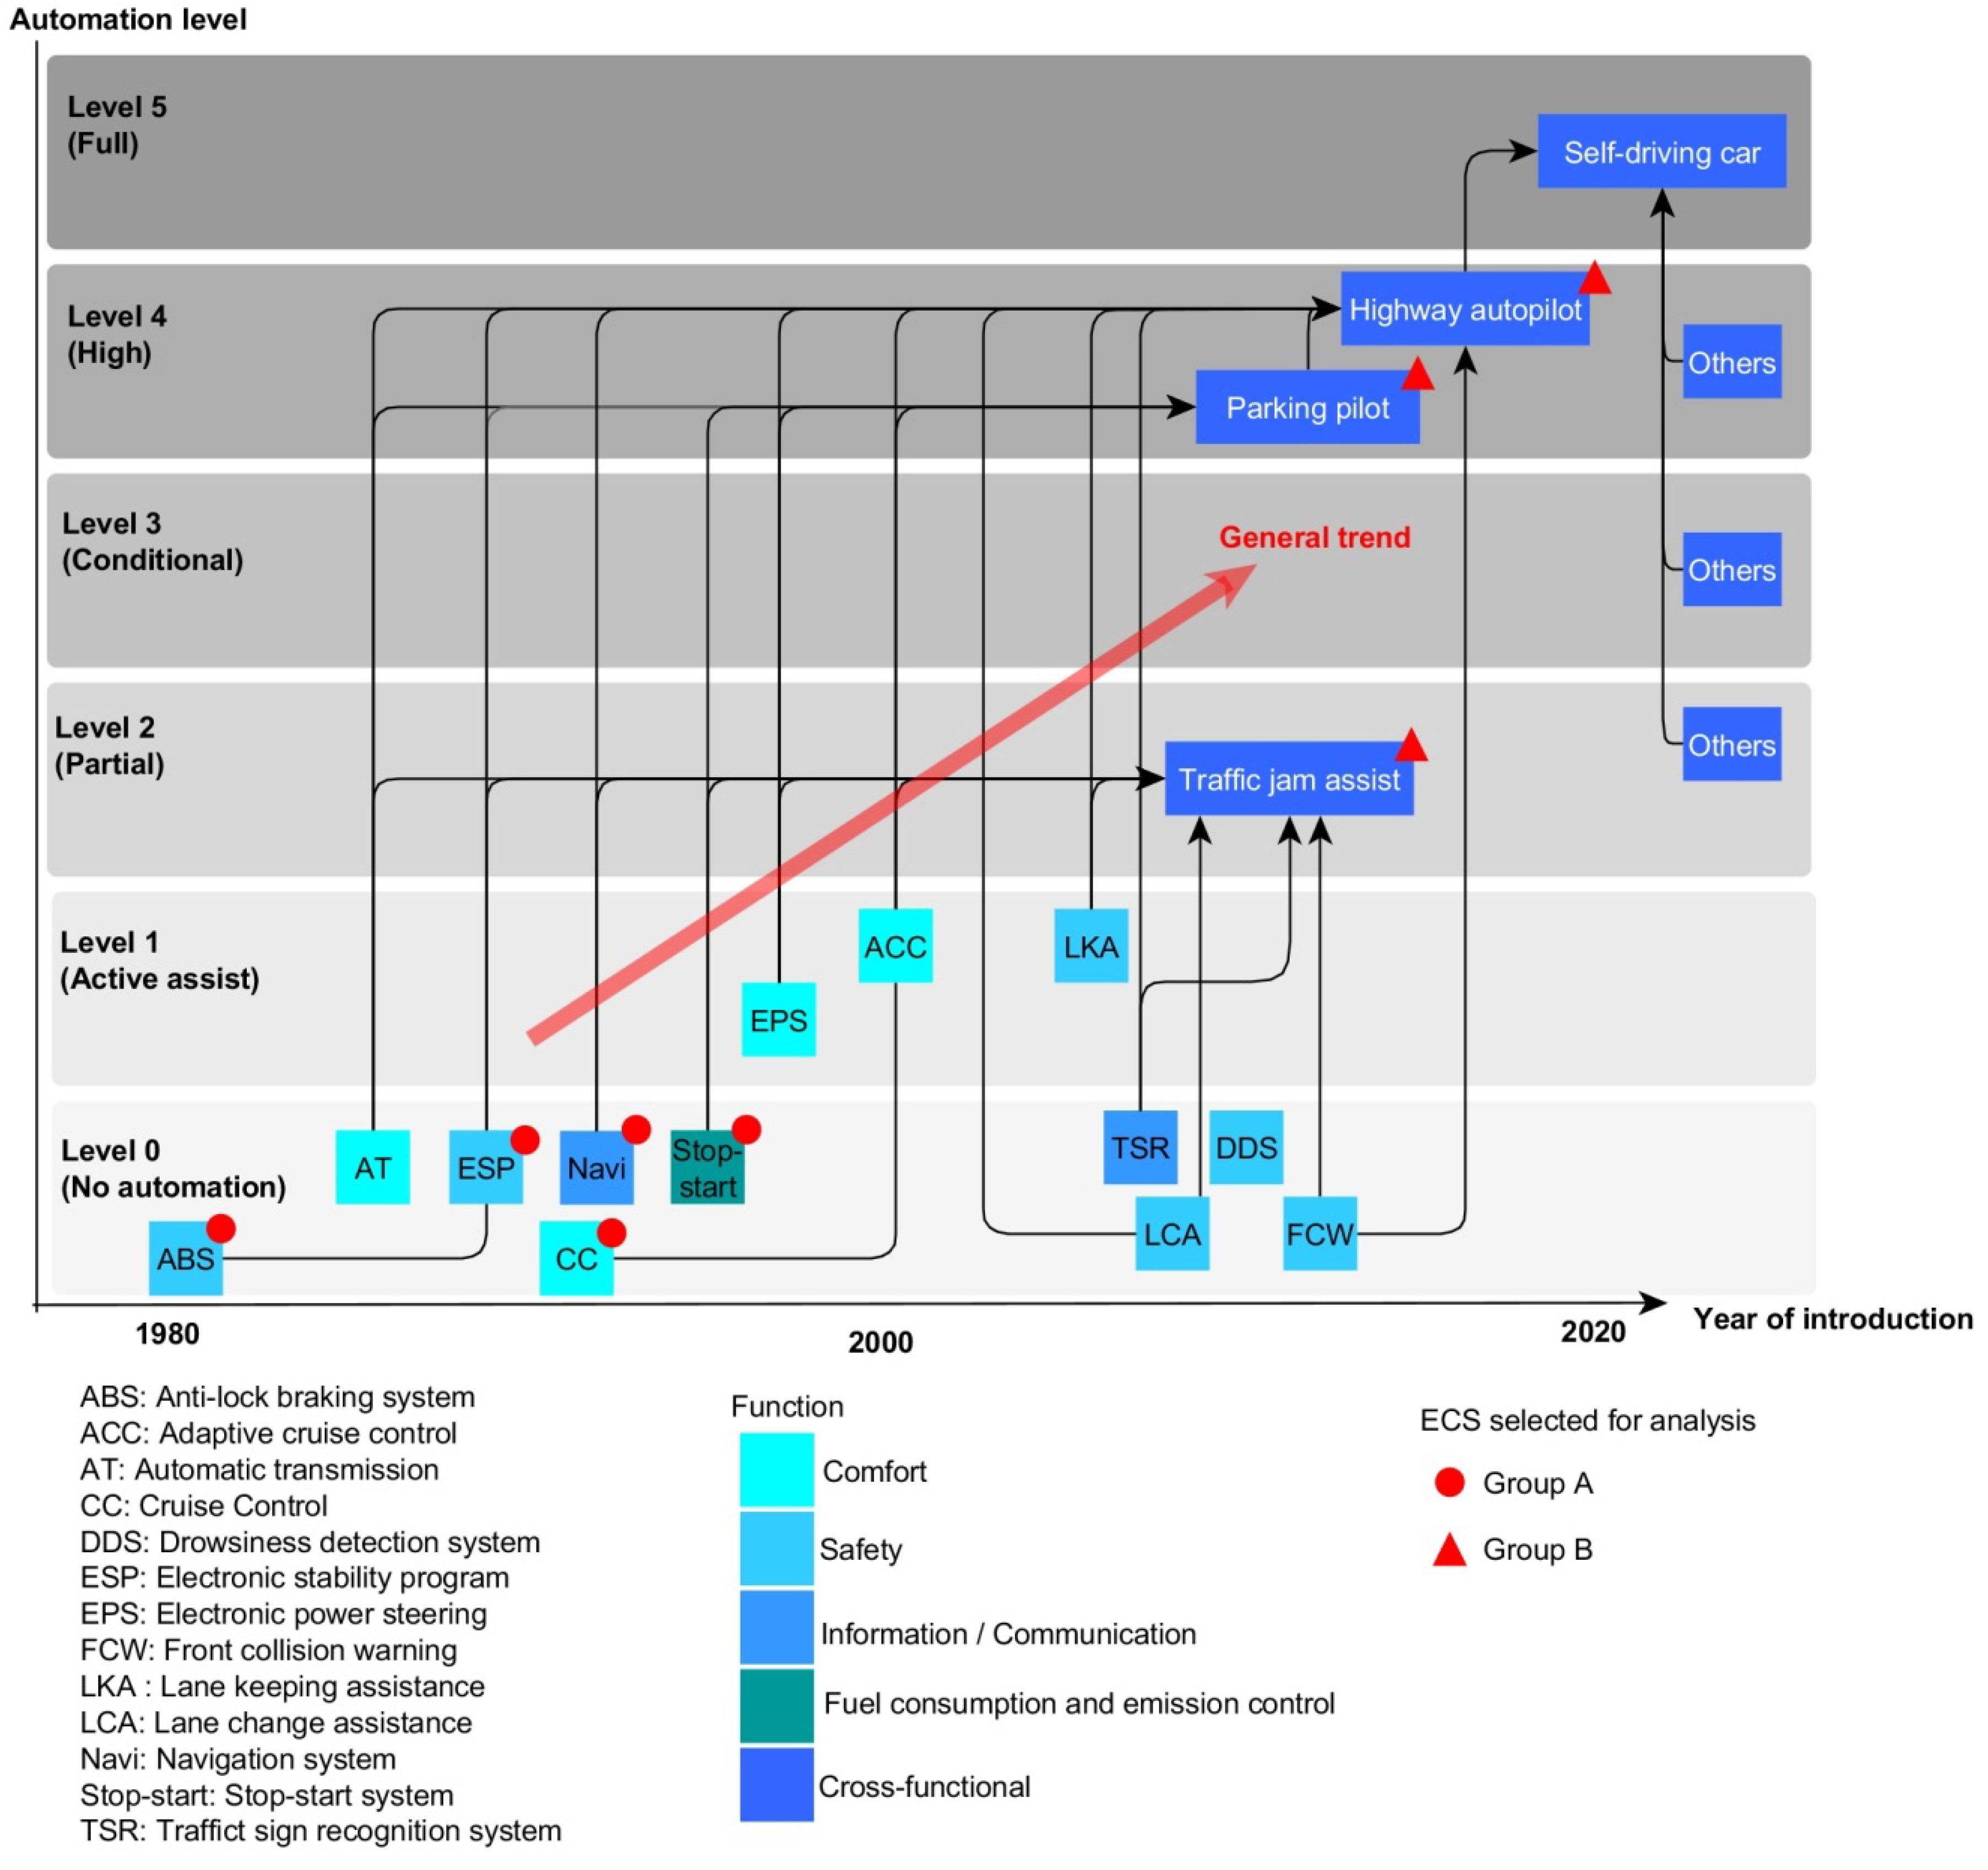
2.1. Selection of Automobile Electronic Control Systems to Consider in This Study
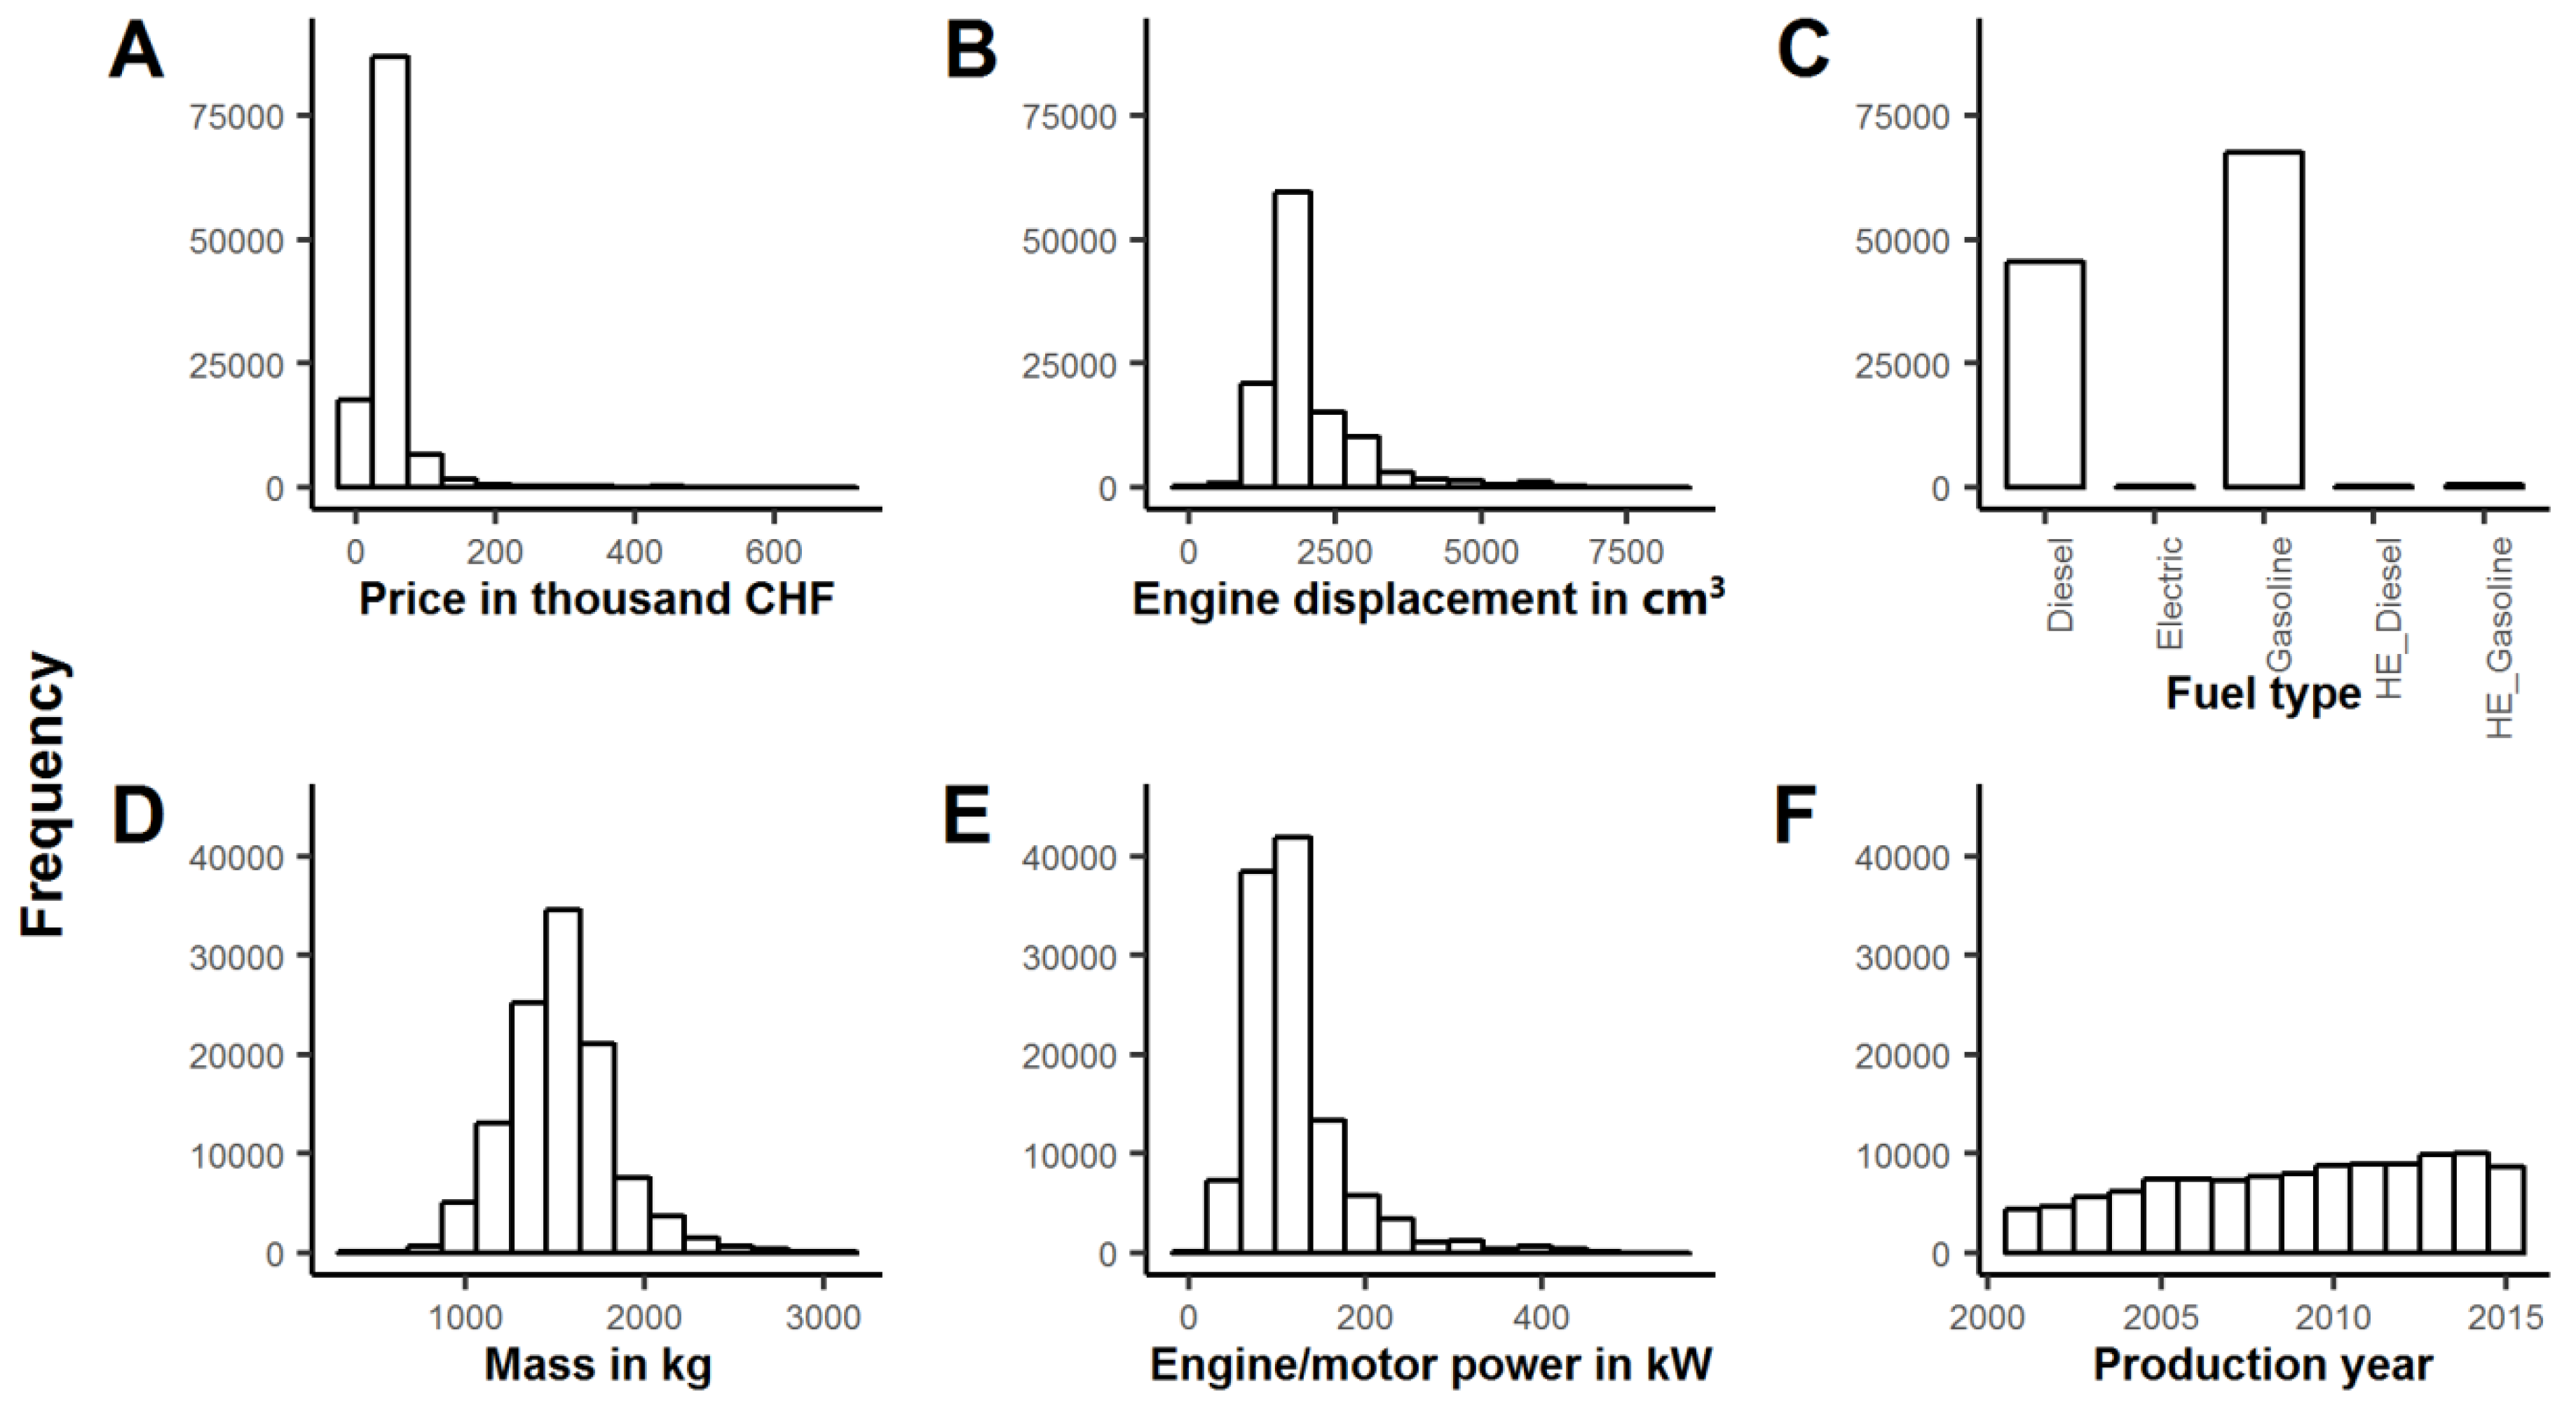
We begin by recalling the main function of a car, which is to transport people or goods. This function is bound by five main requirements or (elastic) constraints related to: (i) passenger and pedestrian safety, (ii) passenger comfort, (iii) information/communication with passenger, other cars and infrastructure, (iv) fuel and energy efficiency, and (v) environmental emission control. ECS are embedded in cars to accomplish one or a combination of these functions (constraints). Each ECS comprises sensors, controllers, and actuators [8]. To ensure accounting consistency, we focused on the number of ECS disregarding the physical form in which its constituent elements were implemented.
Established ECS (with penetration rates over 10% in 2015) were easily classifiable under the main constraints above, while the classification of new ECS (with penetration rates below 10% in 2015) was challenging because of their cross-functional nature. Consequently, we made a distinction between established and new ECS and set them aside into two groups to analyze their trends separately: group A consisted of established ECS and group B consisted of emerging ECS.
The ECS in both groups are however related. Specifically, ECS in group B build upon ECS in group A by integrating them into cross-functional systems. To understand this relationship, it is useful to think in terms of the hierarchical networked structure of automobile ECS as defined by Restrepo et al. [8]. Under this structure, the emerging ECS in group B enter the ECS network as higher hierarchical entities to which existing ECS in group A subordinate. In terms of the car’s automation level as defined by SAE International (Society of Automotive Engineers) [24], established ECS in group A belong to the lowest automation level (Level 0—no automation), while new ECS in group B belong to higher automation levels (Levels 1 to 5—active driver assistance, partial automation, conditional automation, high automation, and full automation, respectively).
To represent ECS in group A, we selected five of the most frequently embedded ECS identified by Restrepo et al. [8]. To represent ECS in group B we selected three emerging ECS in the realm of autonomous driving that built upon the ECS in group A. The selection of the ECS in group A ensured enough data records to analyze: (1) the most important car characteristics correlating with the presence of the selected ECS, and (2) typical penetration patterns of ECS over time, including ECS integration. Trends in ECS integration were further exemplified with two ECS in group A. ECS in group B served to illustrate the general trend towards self-driving cars. The selected ECS are presented in Table 1.

2.2. Data Set

Through the Autohandel database [25] we obtained information about the standard embedded equipment in 65,475 car models registered in Switzerland between 2001 and 2015, amounting to a total of 113,727 dataset records.
Each car was specified by the production year, market price, market class and 11 technical characteristics: mass, engine displacement, fuel type, engine/motor power, number of cylinders, body type, number of seats, number of doors, transmission type, drive type and number of gears (14 car characteristics in total). The distribution of the dataset is summarized in Figure 1 for six selected car characteristics; the distribution of the remaining eight characteristics is presented in the Supplementary Information (SI) Figure S1. Most of the cars were of gasoline and diesel fuel types (Figure 1C), had an average mass of 1500 kg (Figure 1D) and an engine displacement of around 2000 cm3 (Figure 1B). These average characteristics correspond to an “average vehicle”, such as a VW Golf or Ford Focus [26].

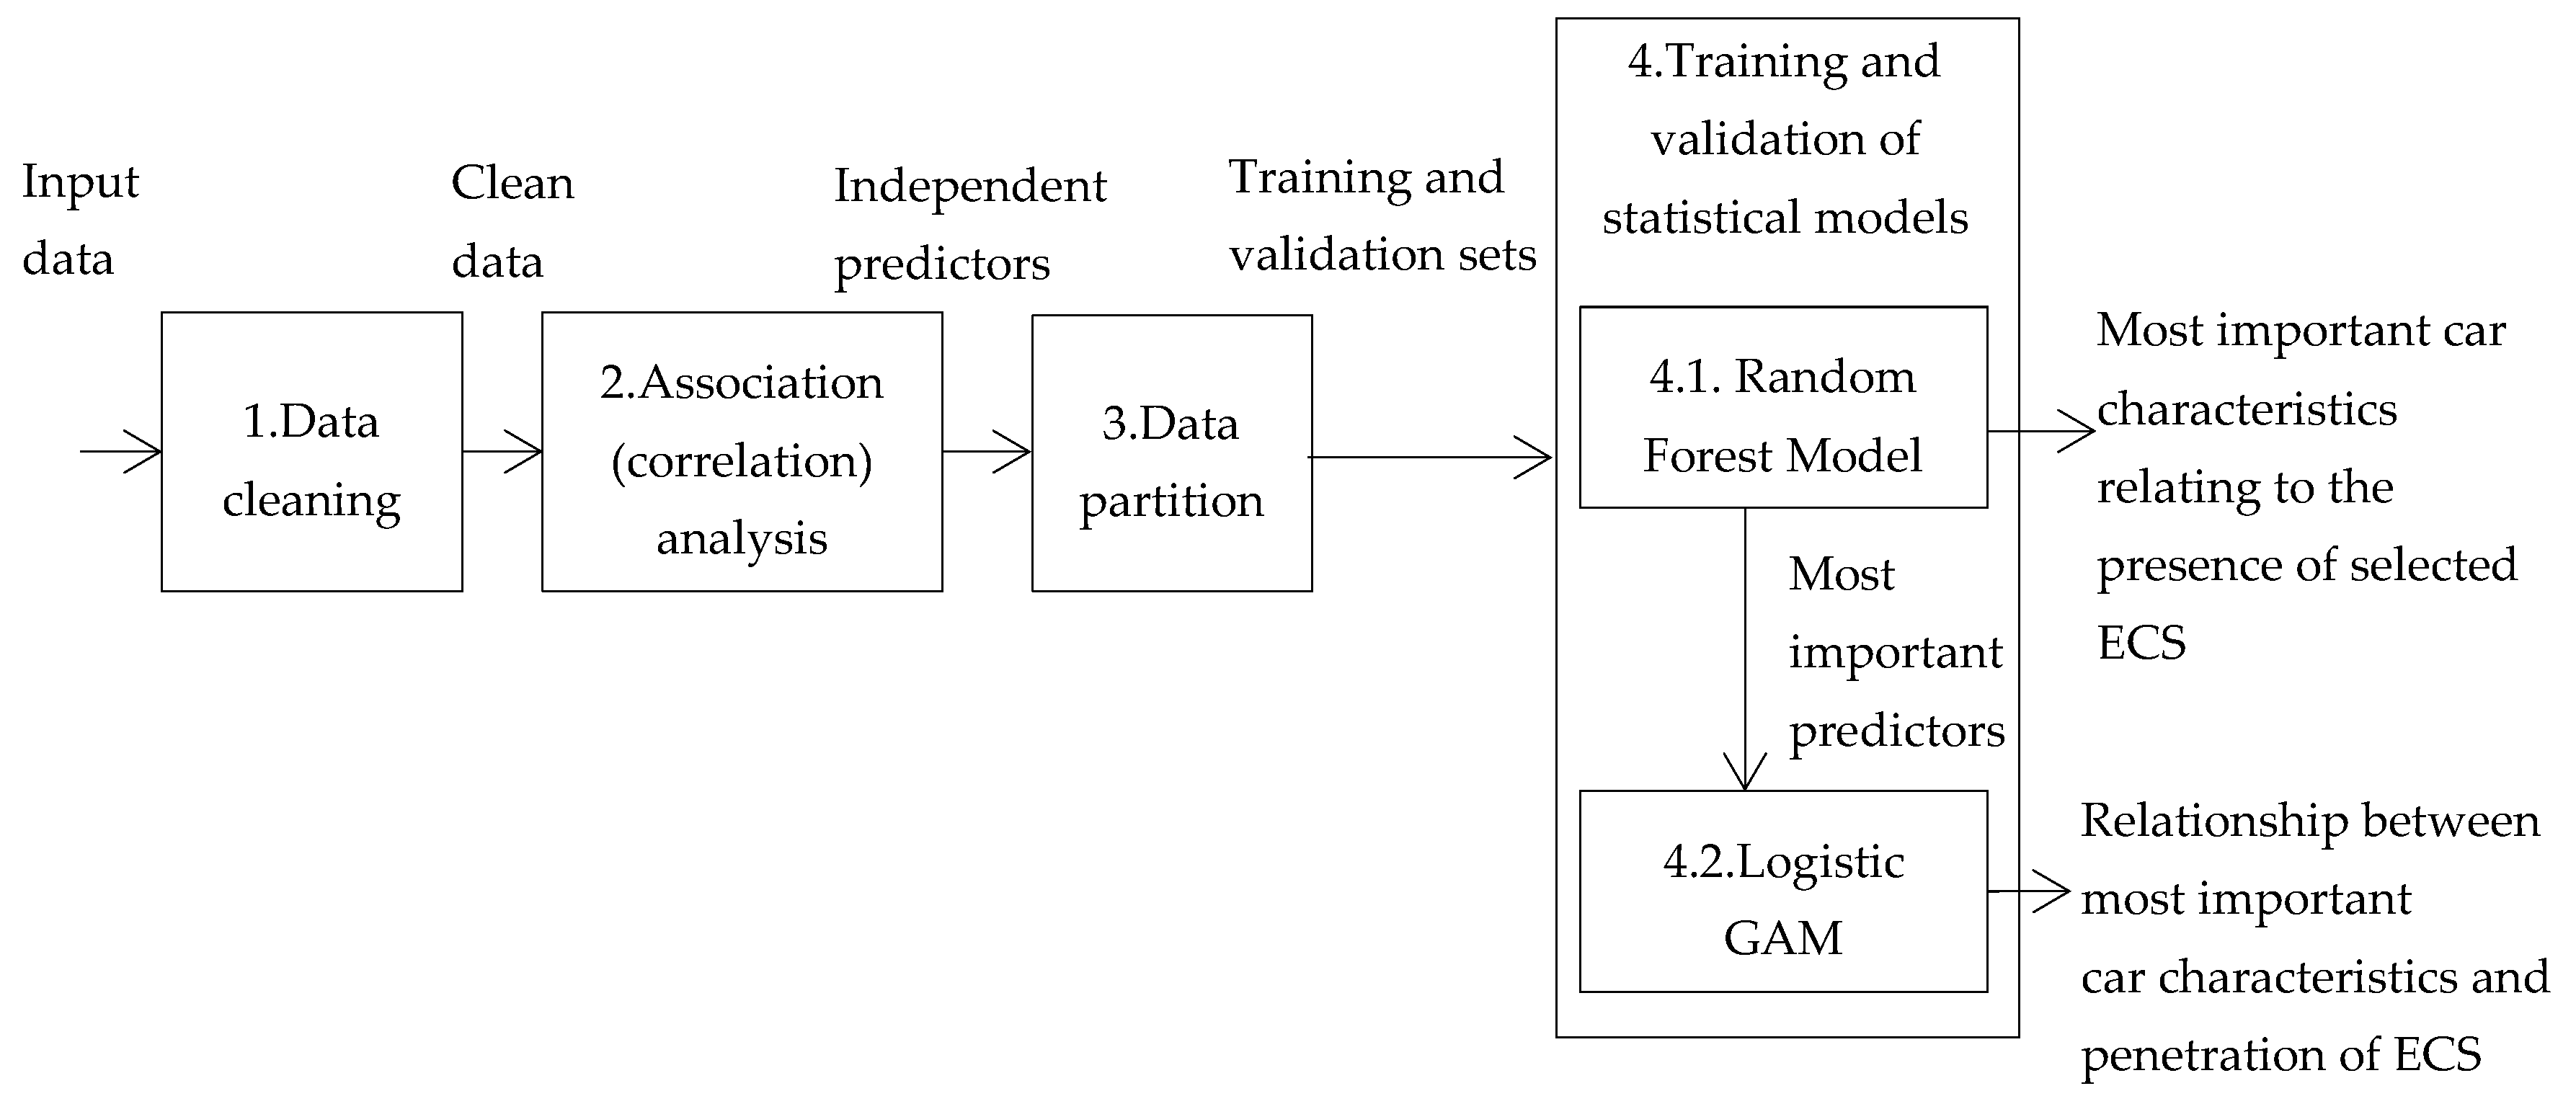
2.3. Analysis of Historical Trends and Indicators for the Use of Automobile Electronic Control Systems

The analysis of the trends was done by means of statistical learning, understood as a “[vast] set of statistical tools for understanding data” [23]. All of the statistical analyses were carried out in R [27]. The specific packages used for the analyses are listed in Table S1 of the SI. Figure 2 summarizes the steps of the statistical analysis.
The average penetration of the selected ECS was obtained by dividing the number of corresponding ECS embedded in cars by the total number of cars analyzed. The past trend in the penetration of each ECS was obtained by performing this calculation by year. Trends in ECS integration were illustrated for two ECS within group A: the anti-lock braking system (ABS) and the electronic stability program (ESP).
The most important car characteristics relating to the presence of the ECS in group A in cars were identified by calculating the Gini variable importance measure (Gini VIM) after fitting a random forest model to the dataset. The relationship between the above characteristics and the penetration of ECS in group A was identified by fitting a logistic regression generalized additive model (Logistic GAM) to the dataset.
We defined the 14 car characteristics as the input variables (also referred to as predictors). The input variables included both numerical (e.g., engine displacement) and categorical (e.g., fuel type) data types. Table S2 of the SI details the data types of the input variables. The output variable, or response, was the number of embedded ECS, which for each ECS analyzed was either one (1) or zero (0), therefore dichotomous.
Data cleaning consisted of removing records with incomplete data and typos. Association analysis was carried out to discard redundant variables before further statistical analysis. Specifically, we calculated the Goodman and Kruskal’s tau measure of association, τ(x,y) [28] which indicates the association (or correlation) between two input variables x and y on a scale from zero to one. For cases with τ(x,y) > 0.5, it was considered that the variables x and y were associated (correlated) or dependent. However, no combination of input variables displayed τ(x,y) higher than 0.4. Hence, all input variables were included in the subsequent statistical analysis. The Goodman and Kruskal’s tau measure of association (τ(x,y)) is presented in the correlogram of Figure S2 in the SI.
Subsequently, we randomly split the data into a training set and a validation set, each containing 50% of the original data. A statistical model was fit (trained) using the training set; validation consisted of using the trained model for predicting the (already known) response in the validation set [23]. We thereby estimated the model accuracy, specified as the fraction of cars for which the presence (zero or one) of the given ECS was correctly predicted.

2.3.1. Random Forest Model for Identifying the Indicators for the Use of ECS in Cars

In statistical models, variable importance measures (VIMs) allow identifying the input variables to which changes the output variable responds more strongly [29]. These input variables are called the most important input variables and are the ones that contribute the most to overall model accuracy [23,29]. Here, we used VIMs to identify the car characteristics that best explain the presence of the selected ECS and can thus be assumed as indicators for their use in cars.
According to a comprehensive review on VIMs by Wei et al. [29], VIMs based on random forest models are particularly suitable for categorical outputs, such as the ones in this study. Thus, we fit a random forest model to the dataset and used a VIM based on it.
Random forest is a machine learning algorithm belonging to the decision tree methods for regression and classification [23,29]. As such, random forest involves segmenting the predictor space into a number of simple regions for which a prediction is made [23]. The name “decision tree” derives for the fact that the set of splitting rules can be summarized in a tree. In the specific case of random forest, multiple trees are produced and combined to yield a single consensus prediction [23].
Specifically, we calculated the Gini VIM based on a random forest which gives a quantitative measure for the most influential input variables in the model [29]. The most influential or most important variable is understood as the input variable X i that leads to the largest decrease in node impurity when chosen as the splitting variable at any father node [23,29]. “Summing all the impurity decreases resulting from X i across each tree in the forest provides an overall measure of the contribution of X i to the accuracy of model prediction” [29]. Further detail on random forest and the Gini VIM can be found in references [23,29].

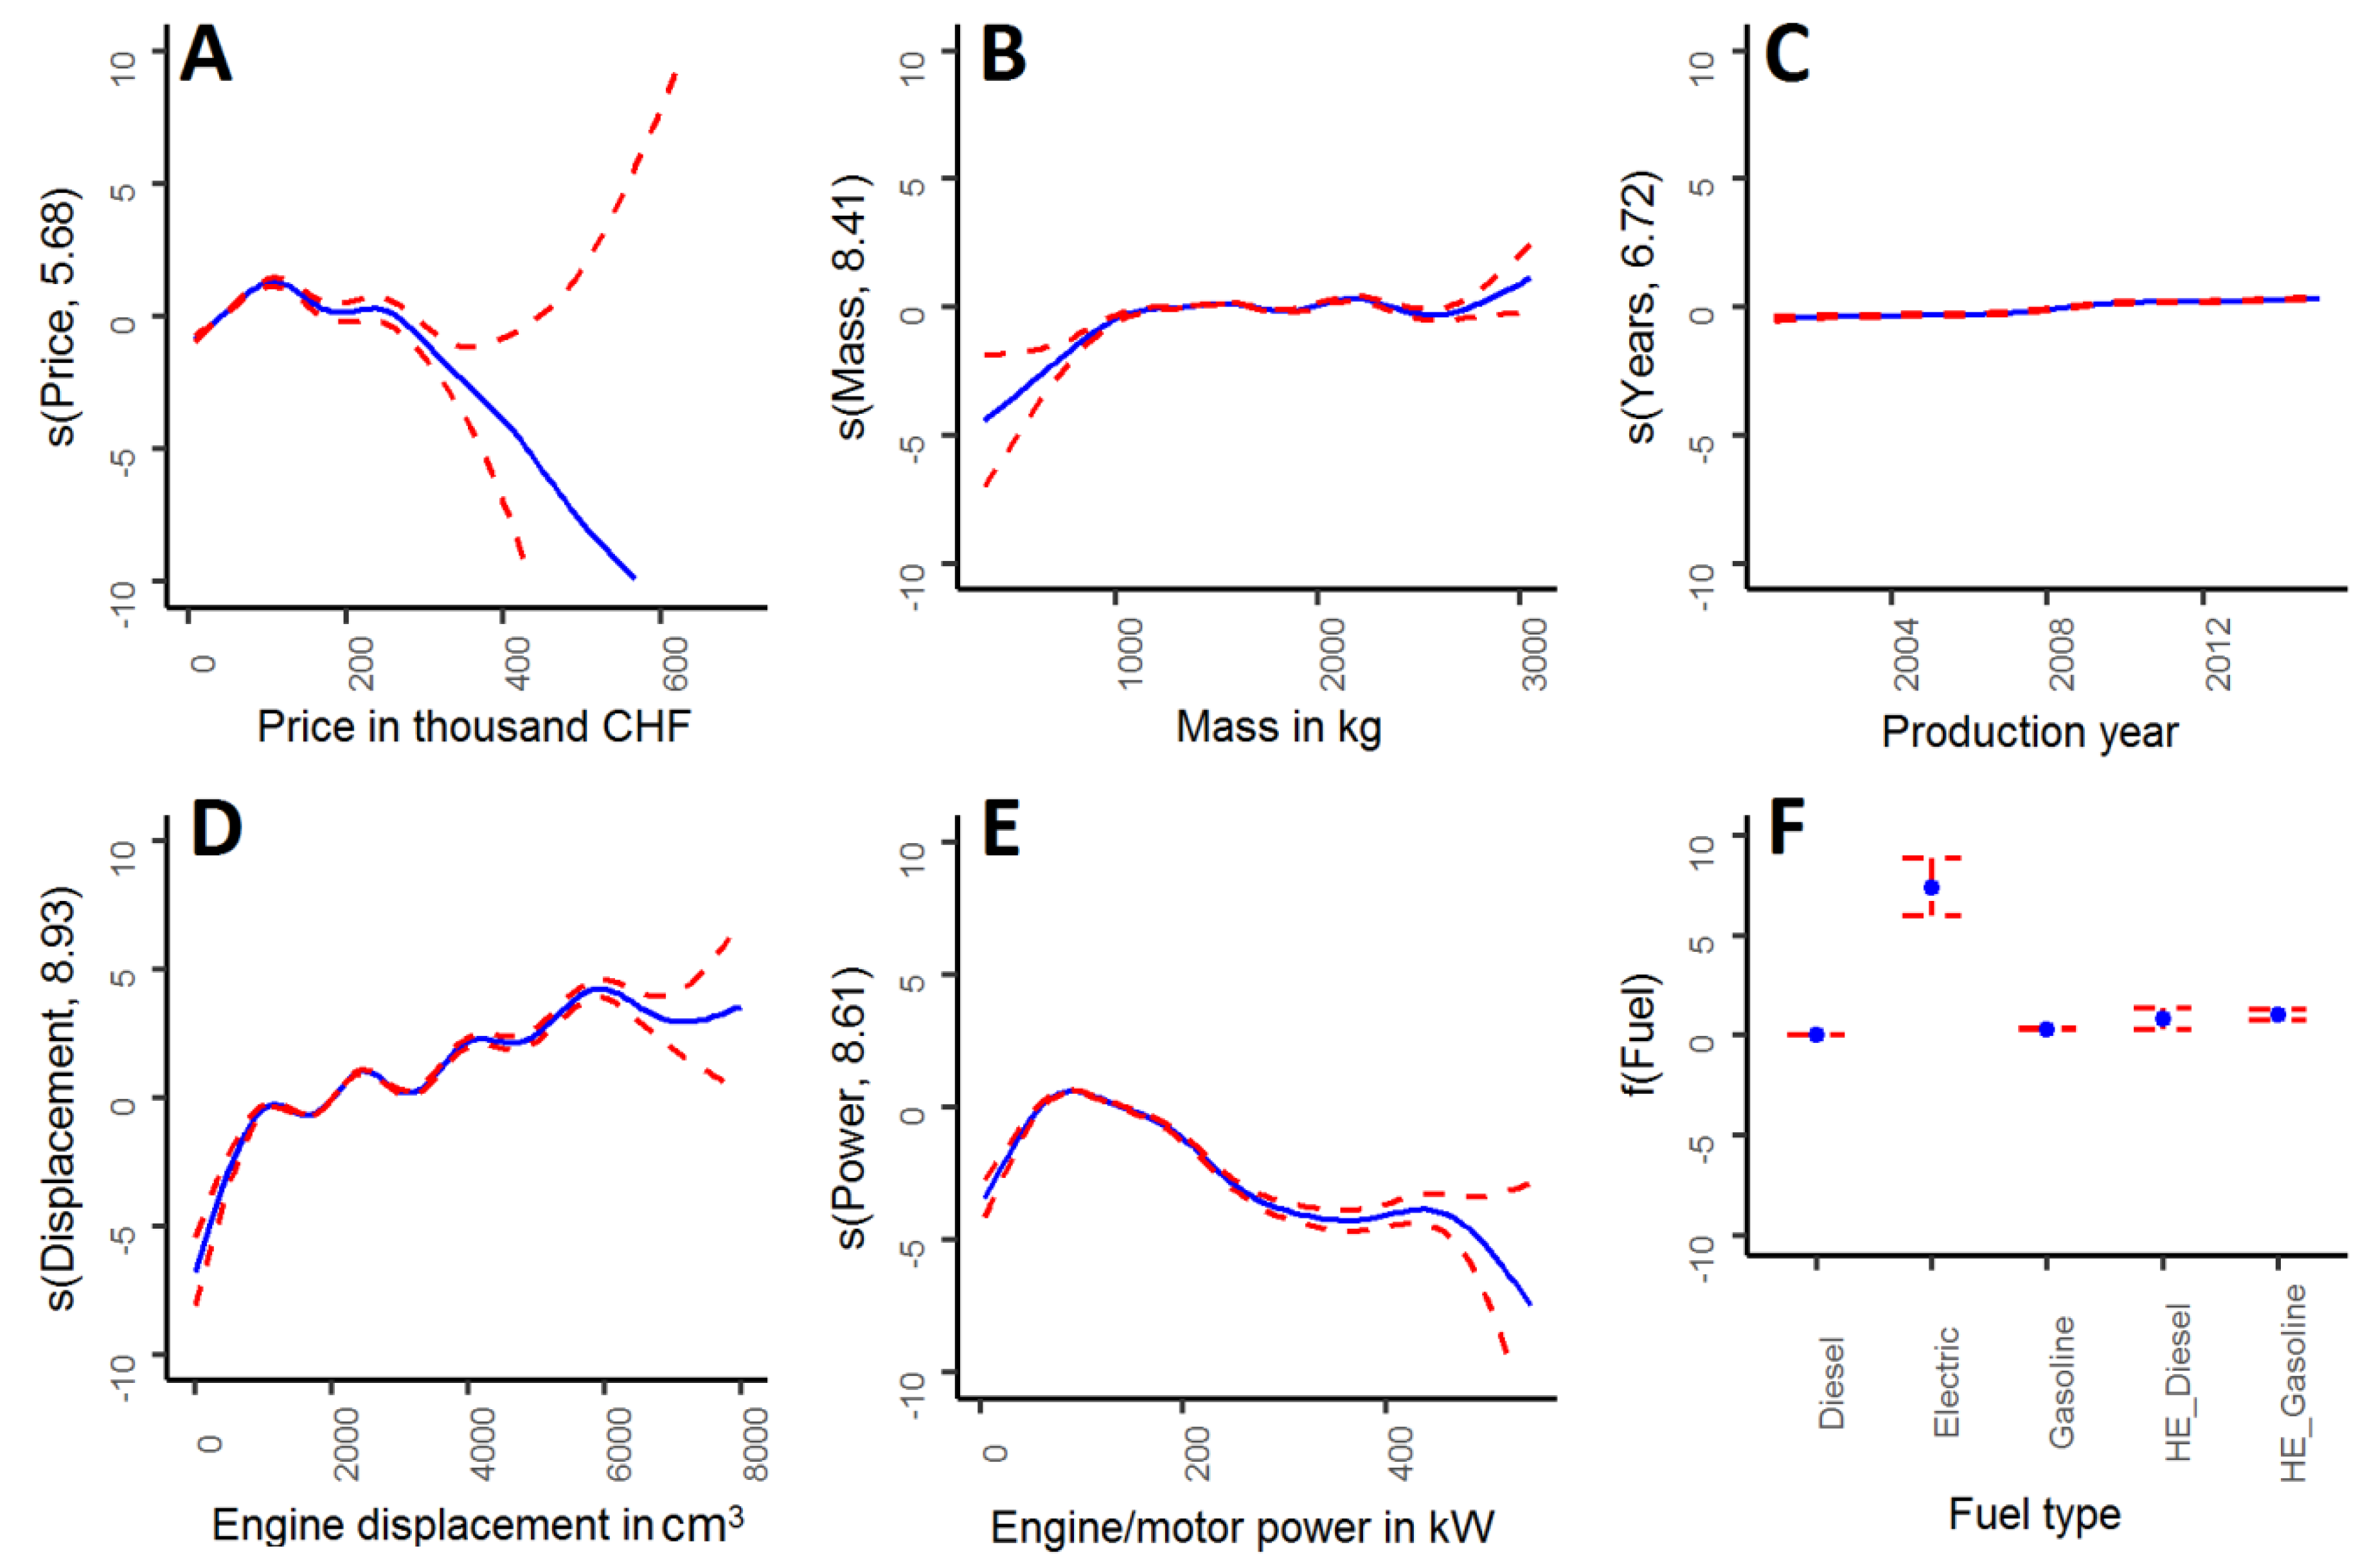
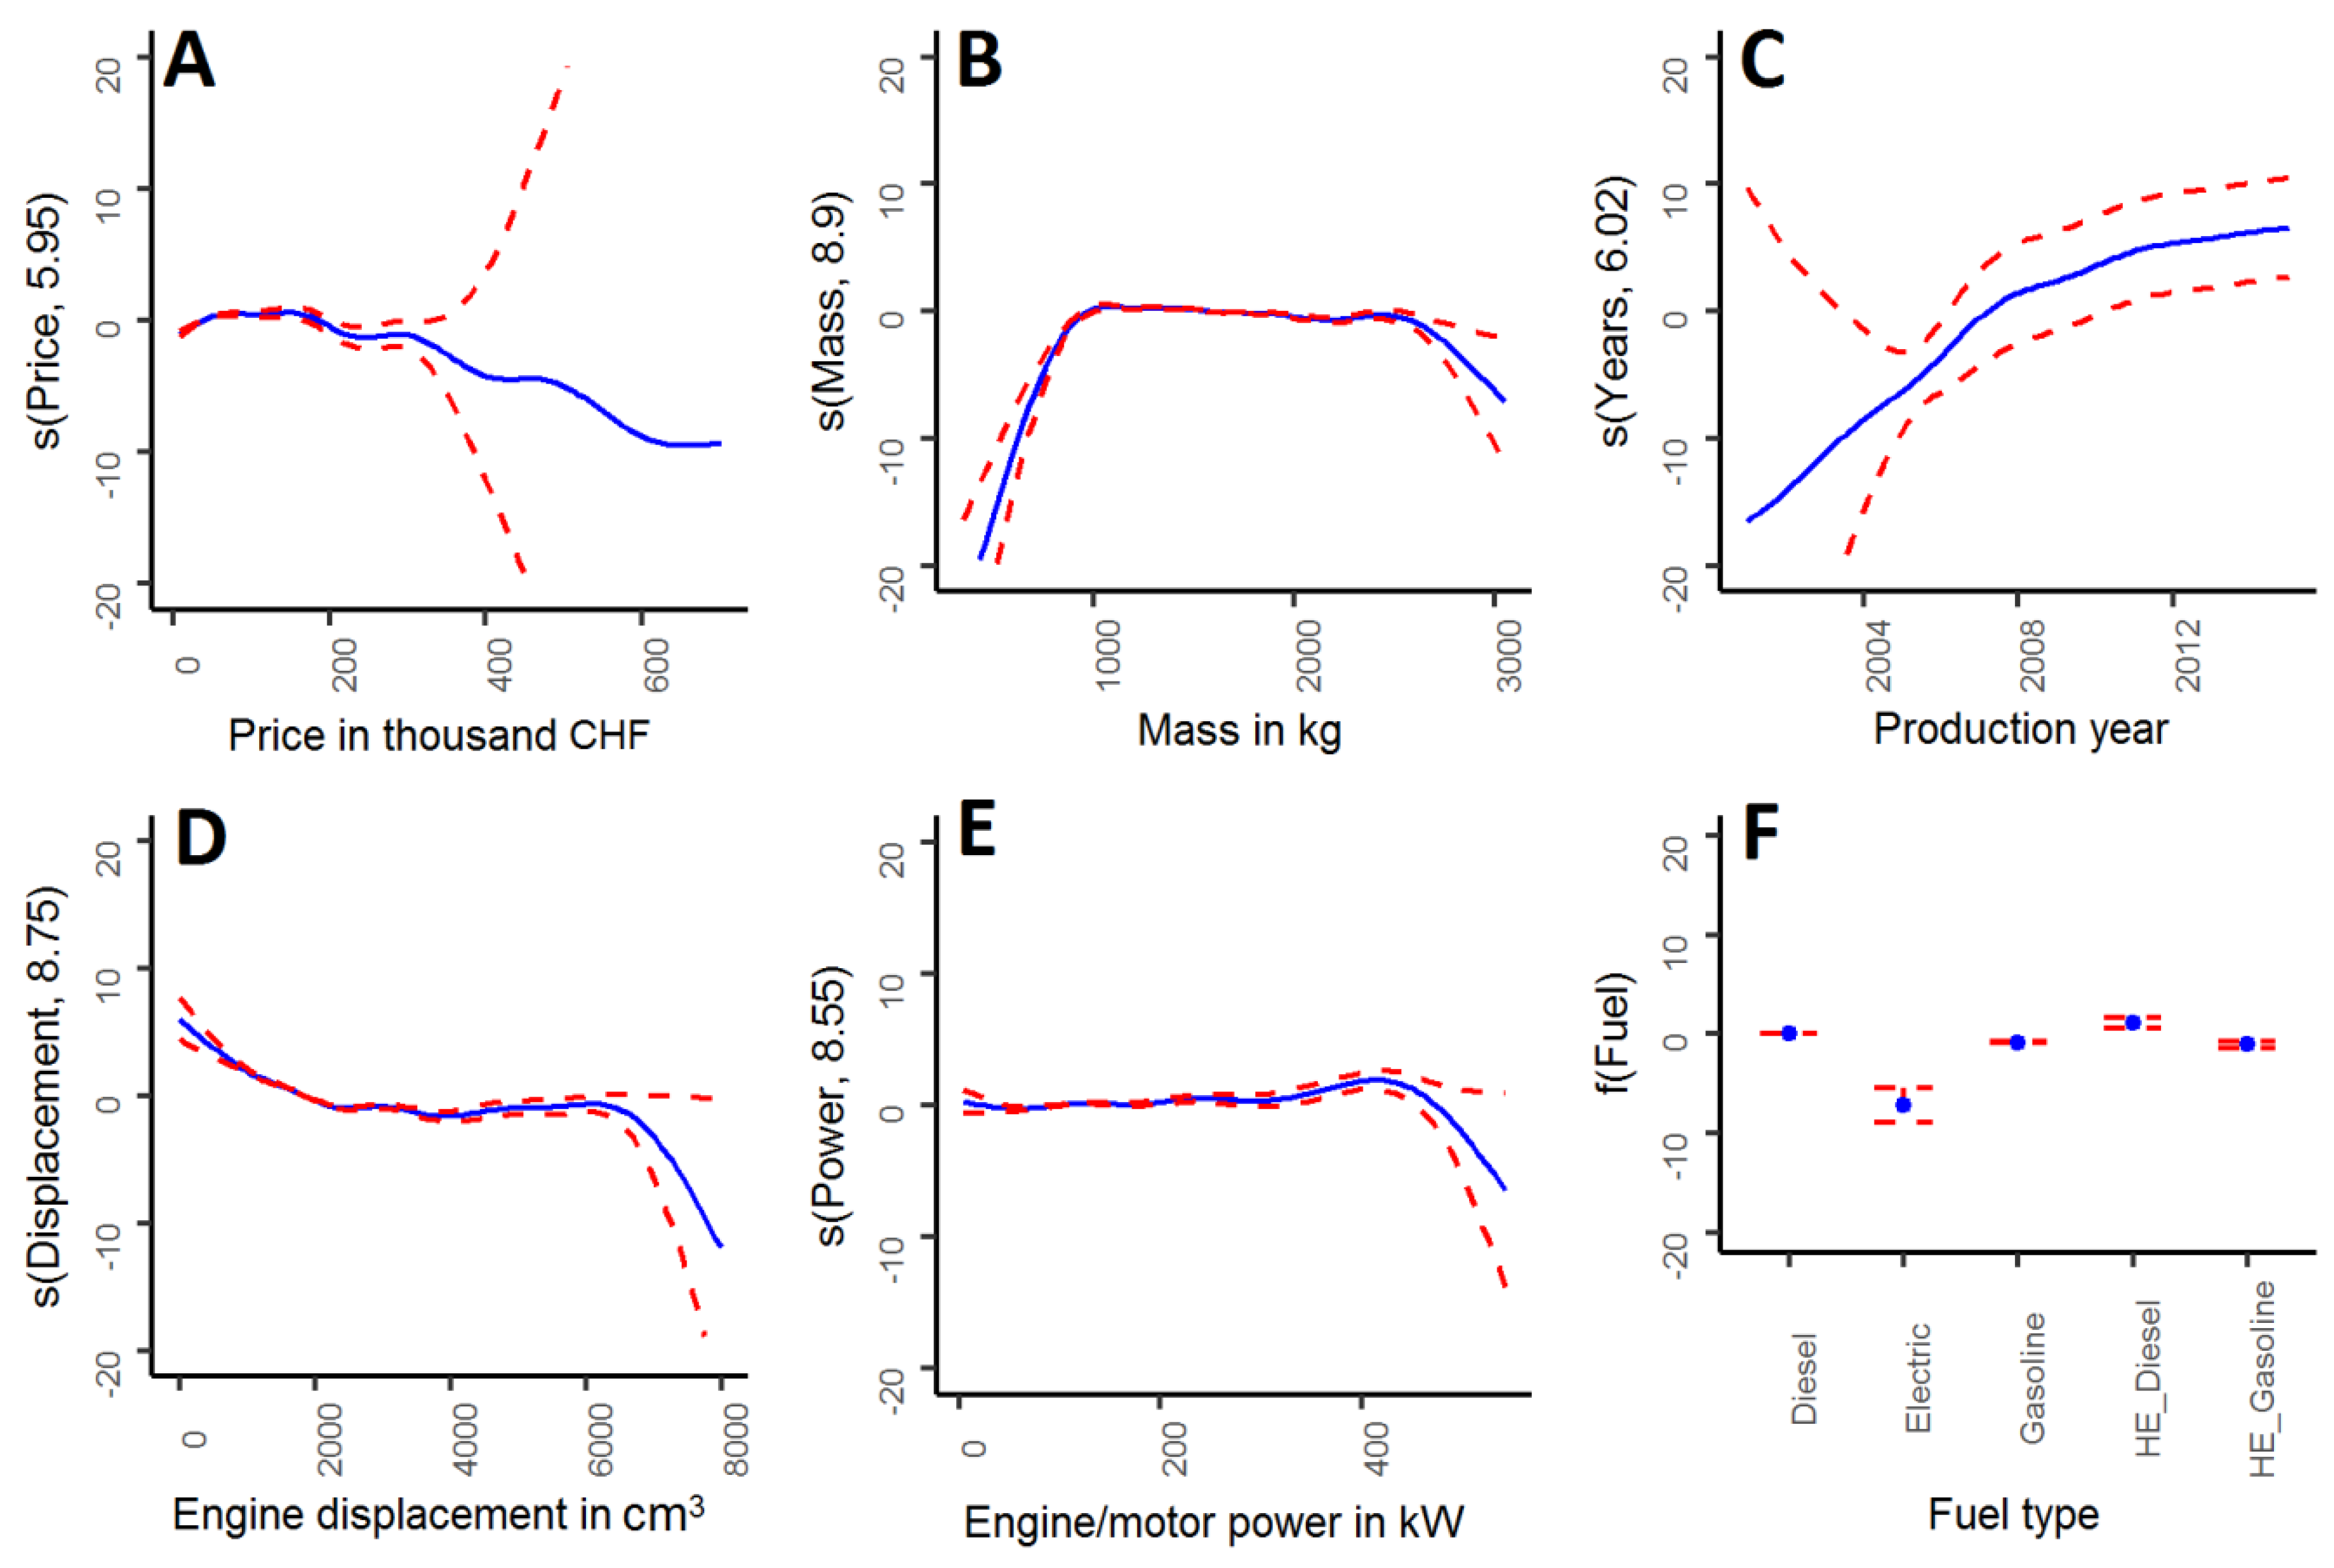
2.3.2. Logistic Generalized Additive Model (GAM) for Examining the Relationship Between the Indicator Characteristics and the Penetration of ECS

We made use of the inference advantages of generalized additive models (GAMs) for revealing the relationship between the past penetration of a given ECS and the indicator characteristics identified above. Specifically, we fit a logistic regression GAM (Logistic GAM) to the dataset. Logistic regression was chosen due to its suitability for dichotomous (categorical with only two categories) responses [23]; the generalized-additive version of the logistic regression was chosen in order to account for likely non-linear relationships between the input and the output variables [23].
GAMs “provide a general framework for extending a standard linear model by allowing non-linear functions of each of the variables, while maintaining additivity” [23]. In the specific case of classification problems using the logistic regression model, each linear component of the logit (log of the odds) is replaced with a (smooth) non-linear function   f j   ( X i ) in order to allow for non-linear relationships between each predictor X i and the response [23]. Further reading on Logistic GAM can be done in reference [23].

3. Results and Discussion

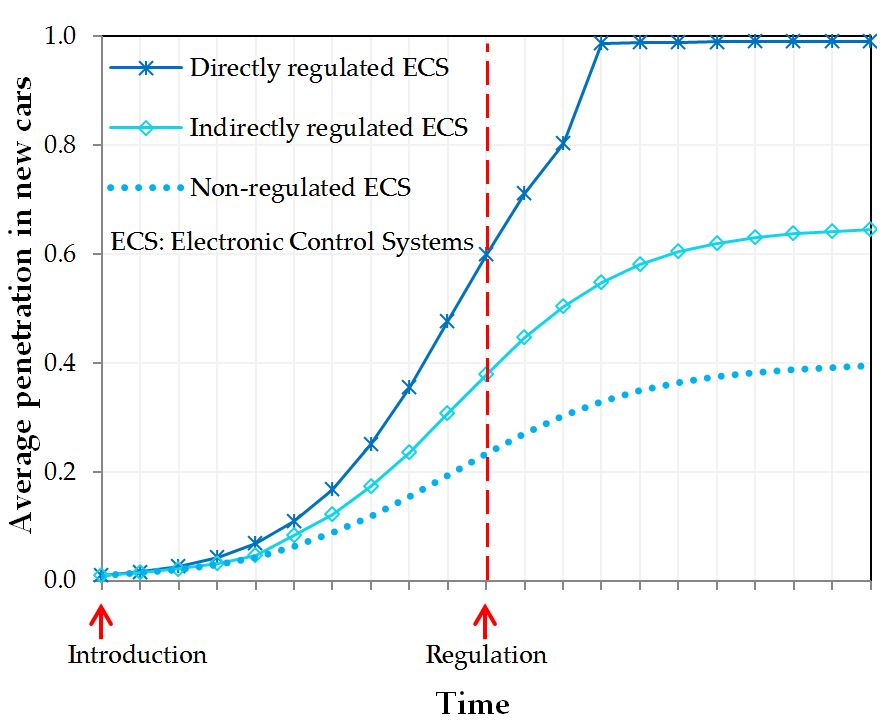
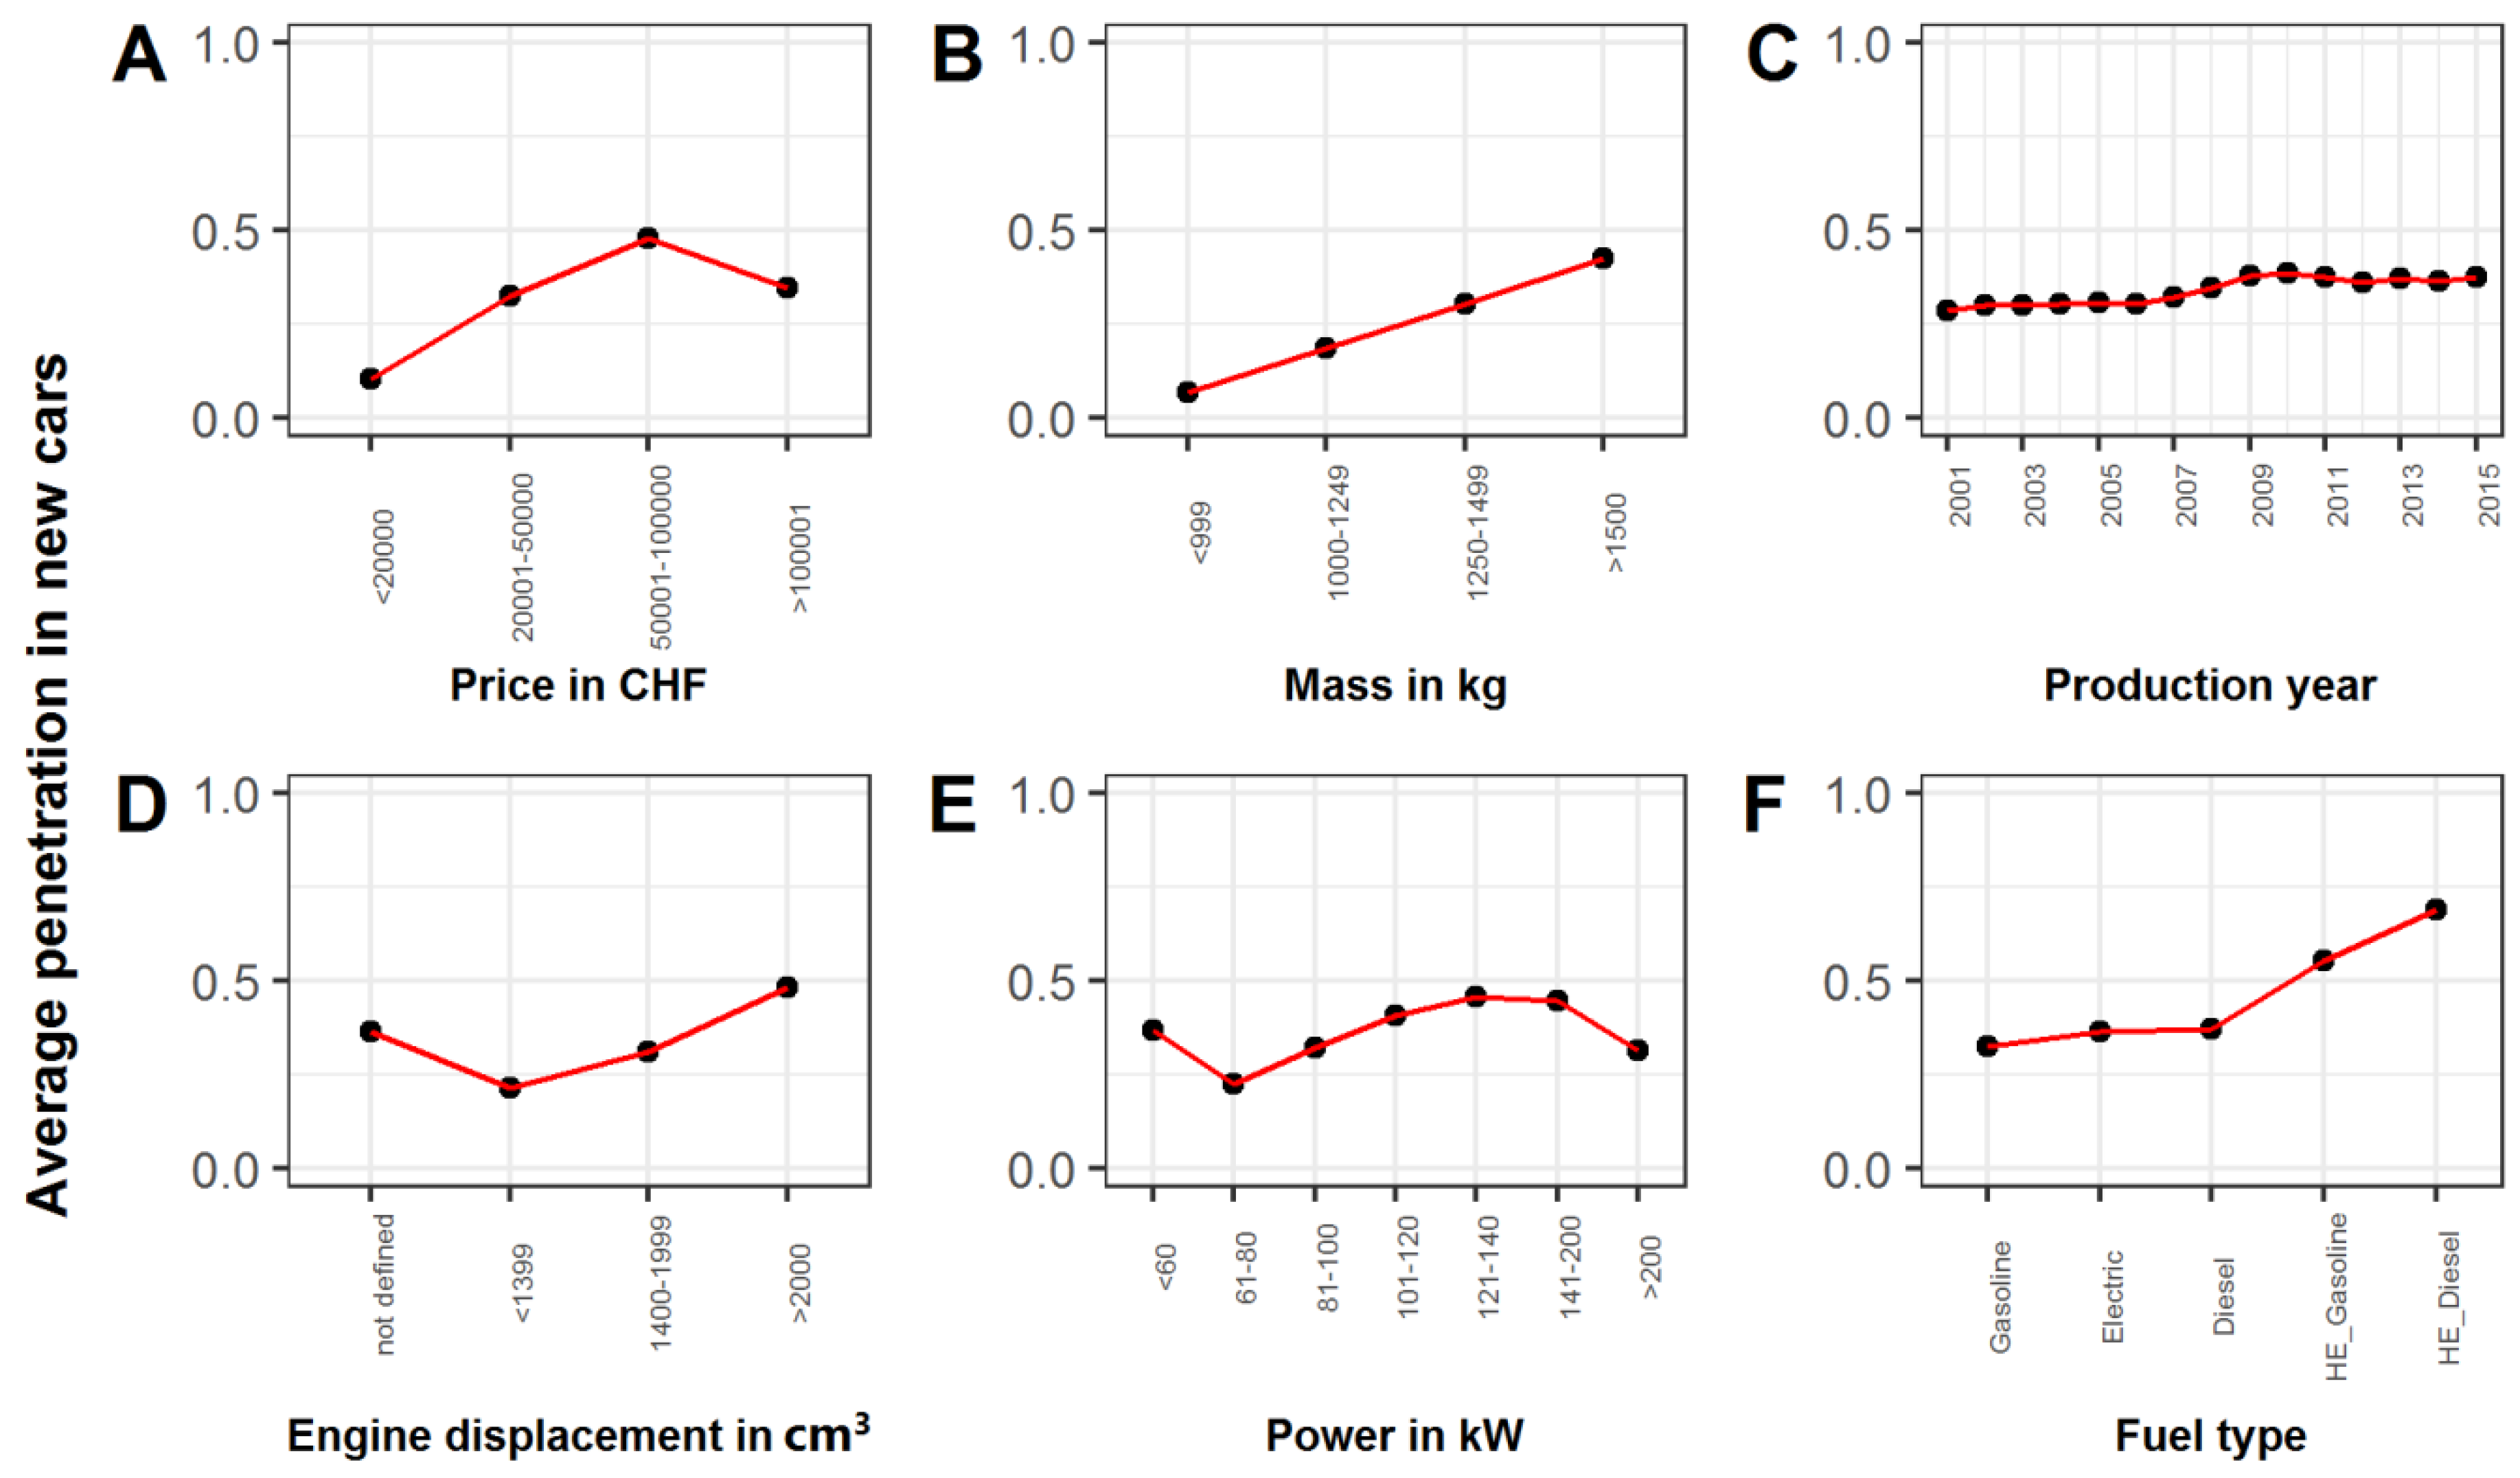
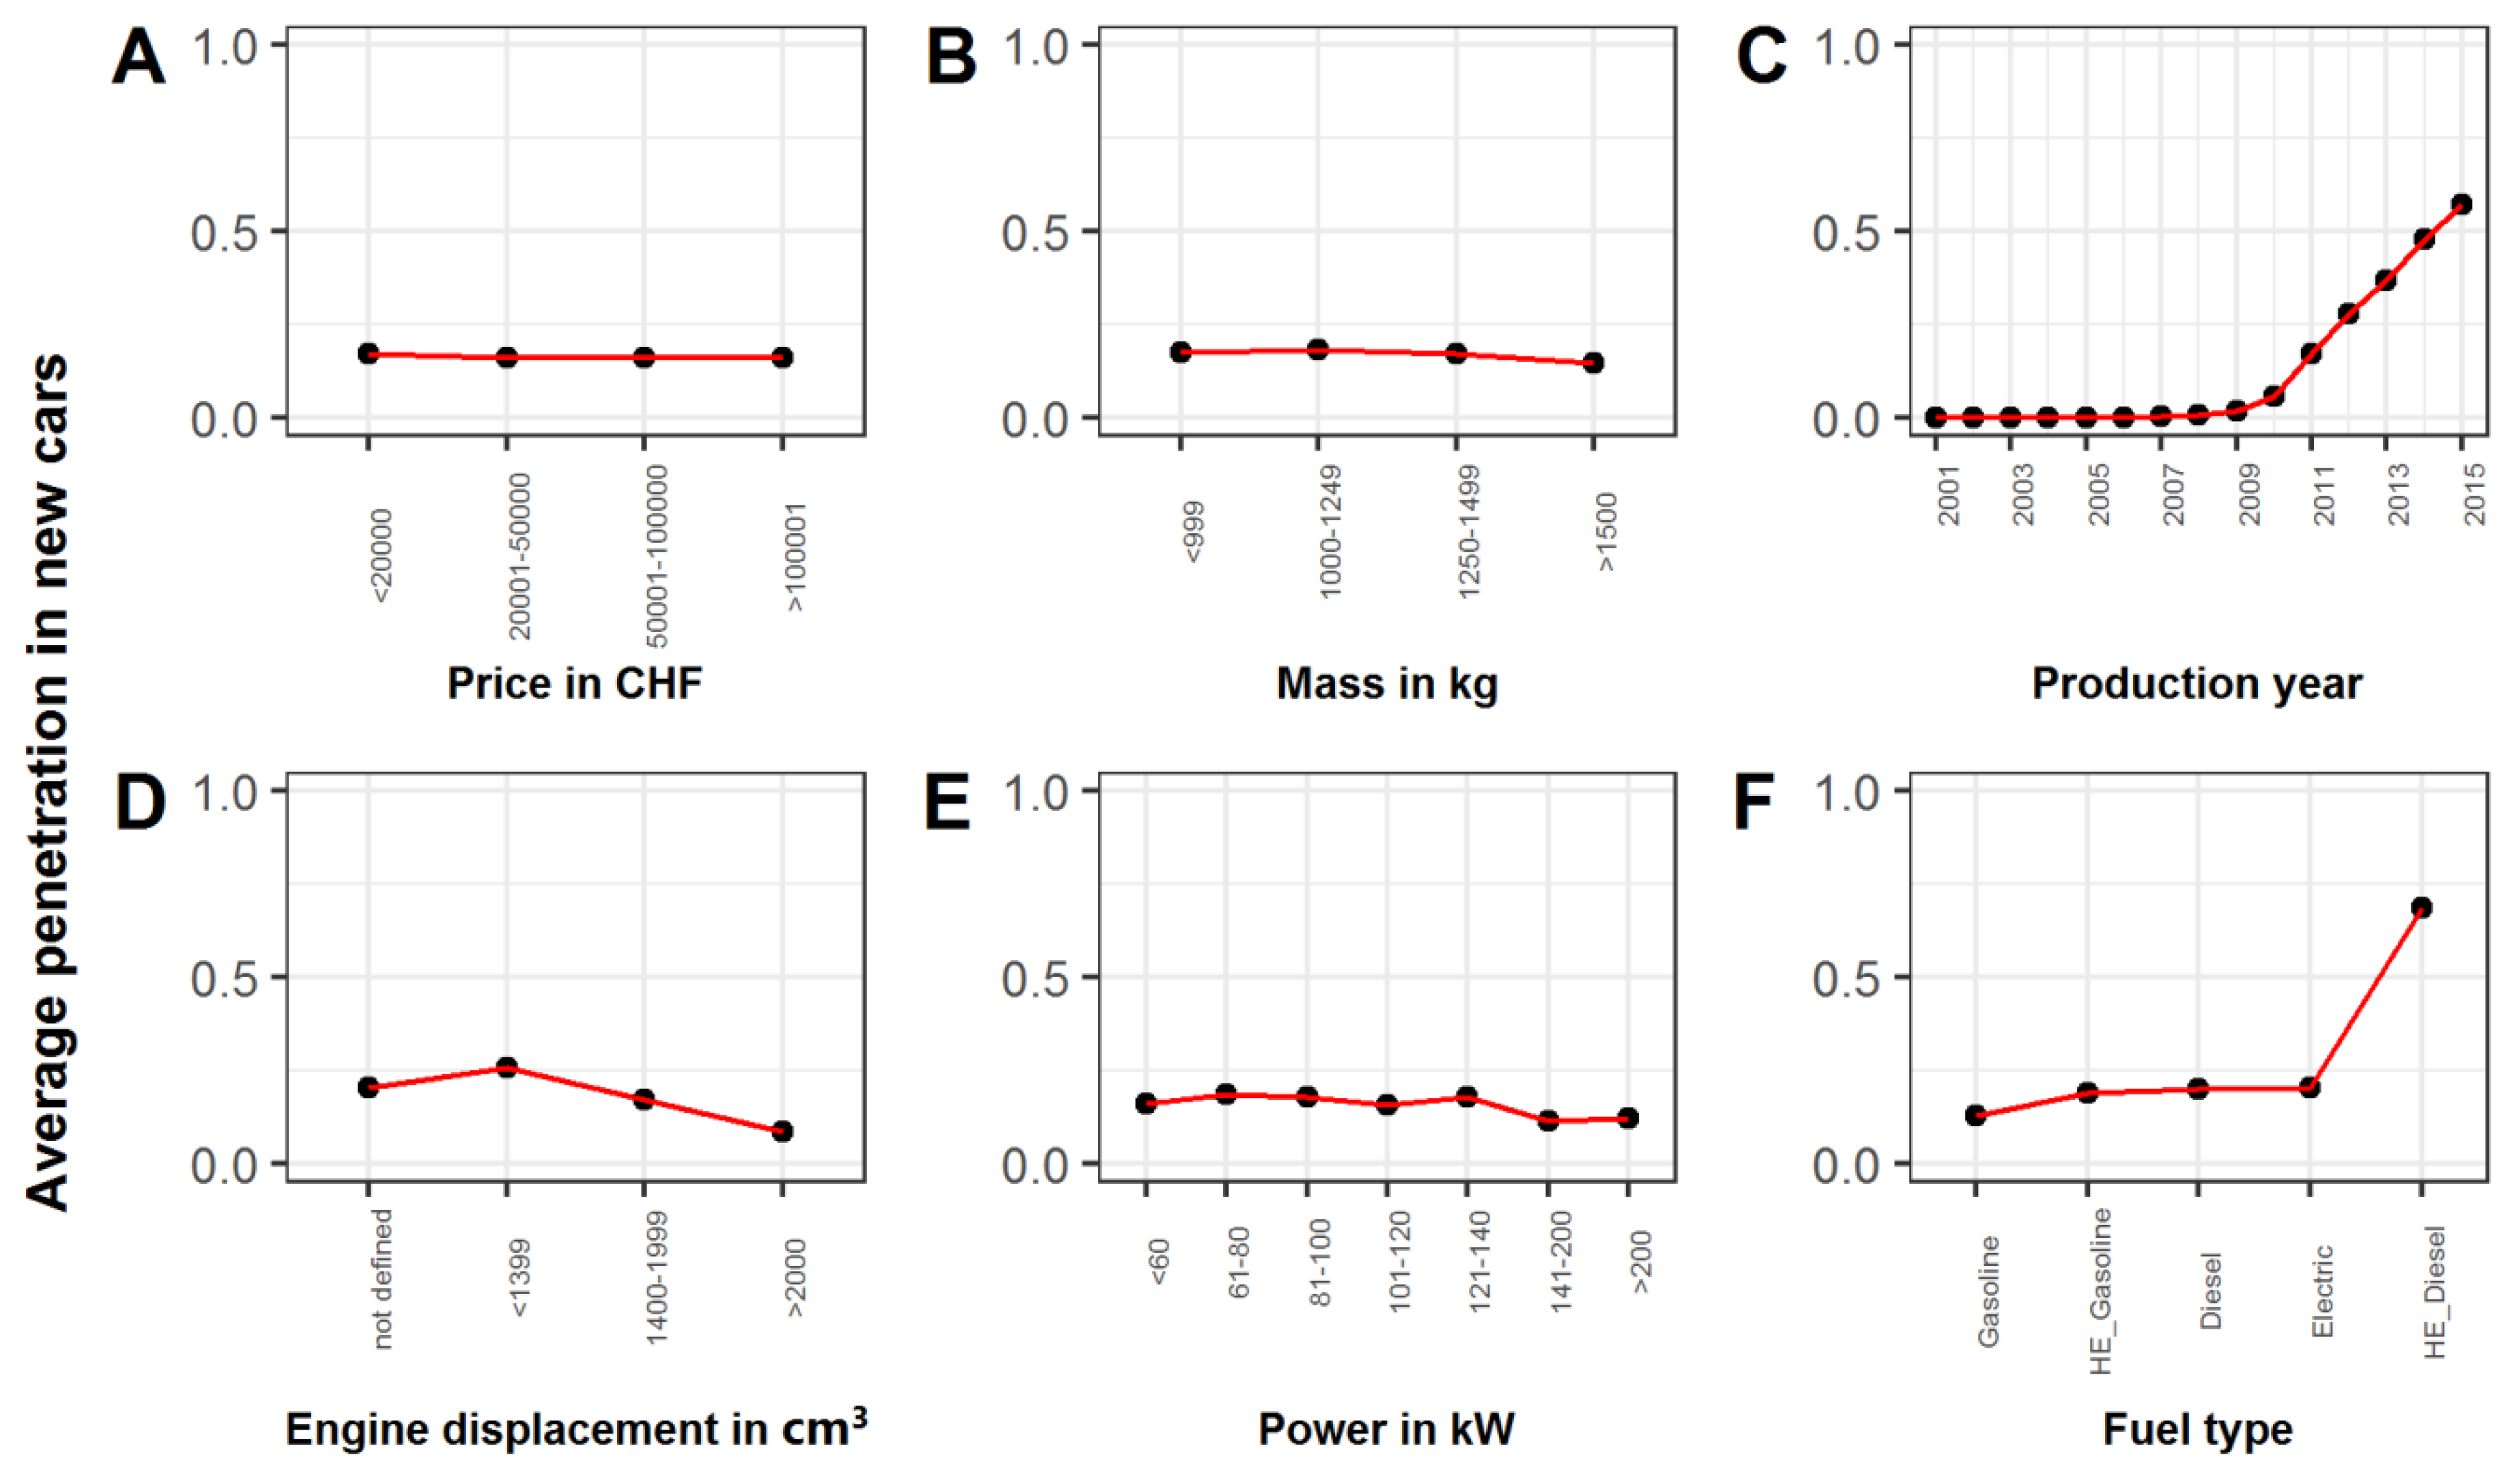
3.1. Historical Trends in Penetration of Automobile Electronic Control Systems (ECS)

Note that these results are calculated on the basis of the standard equipment embedded in the car models analyzed. Selected ECS may have been added to the car models following customized configurations at the time of purchase. Therefore, the values for the penetration rate presented here are conservative and may tend to underestimate the real penetration rate of ECS.

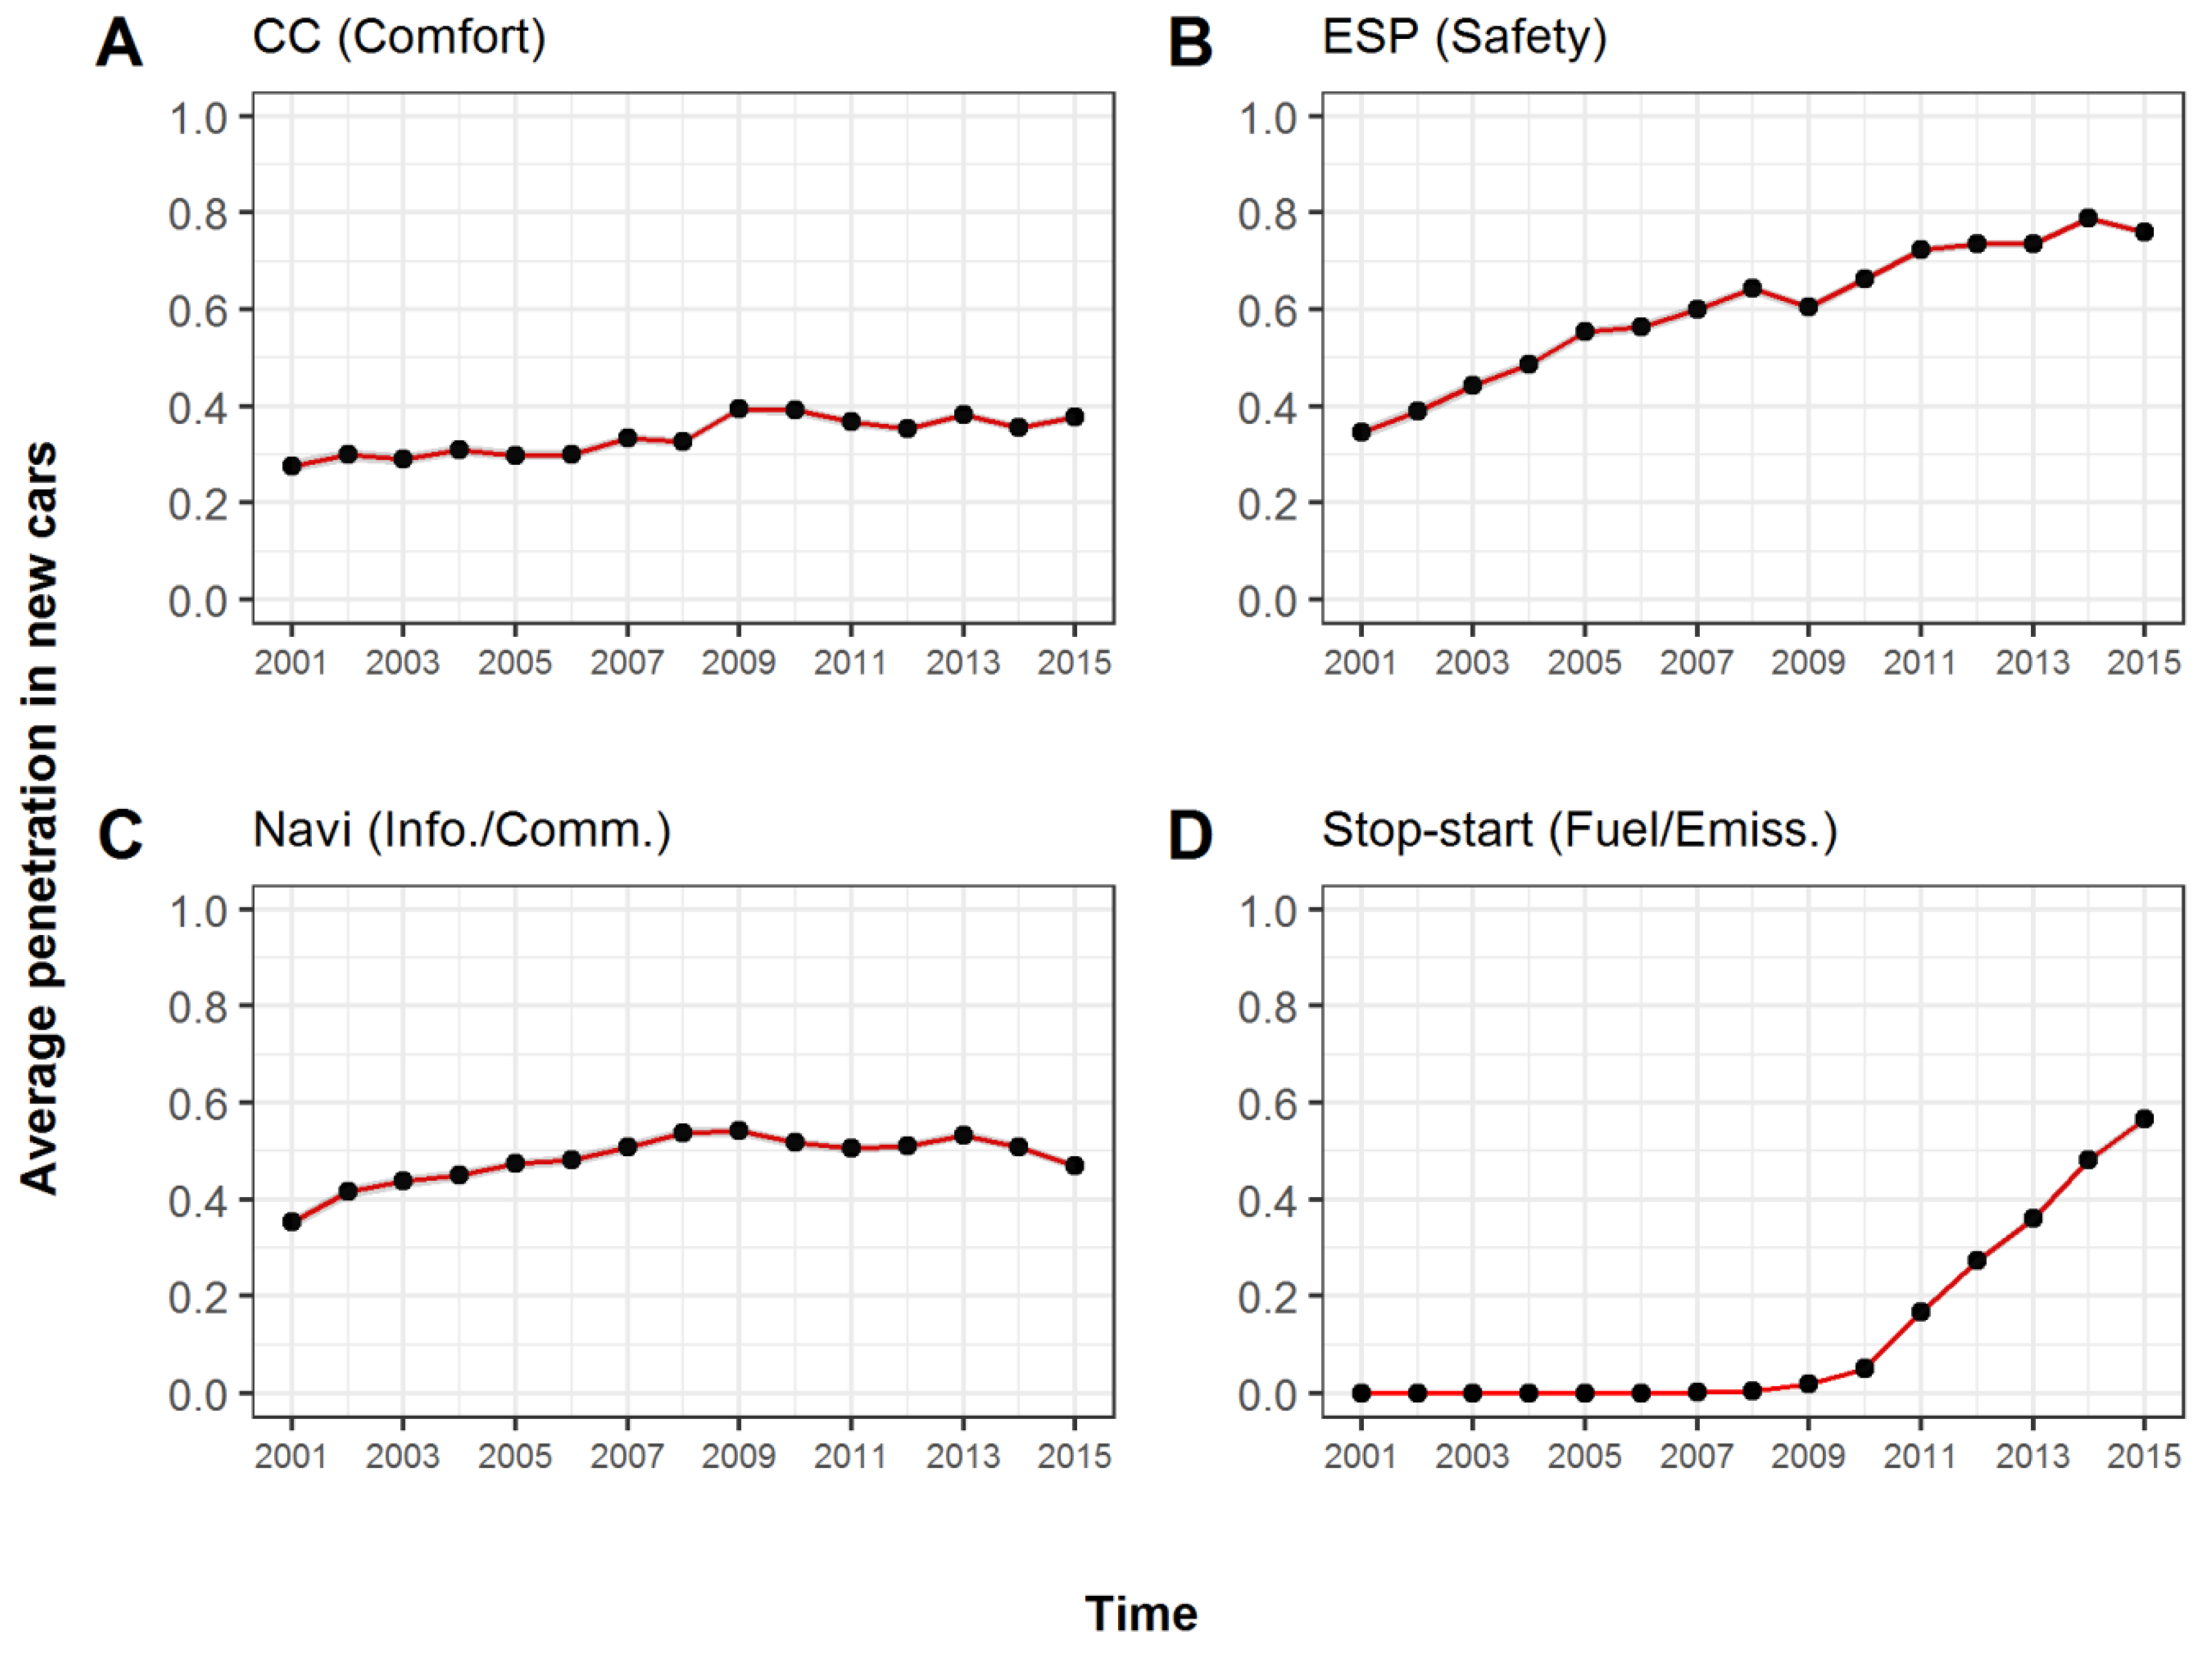
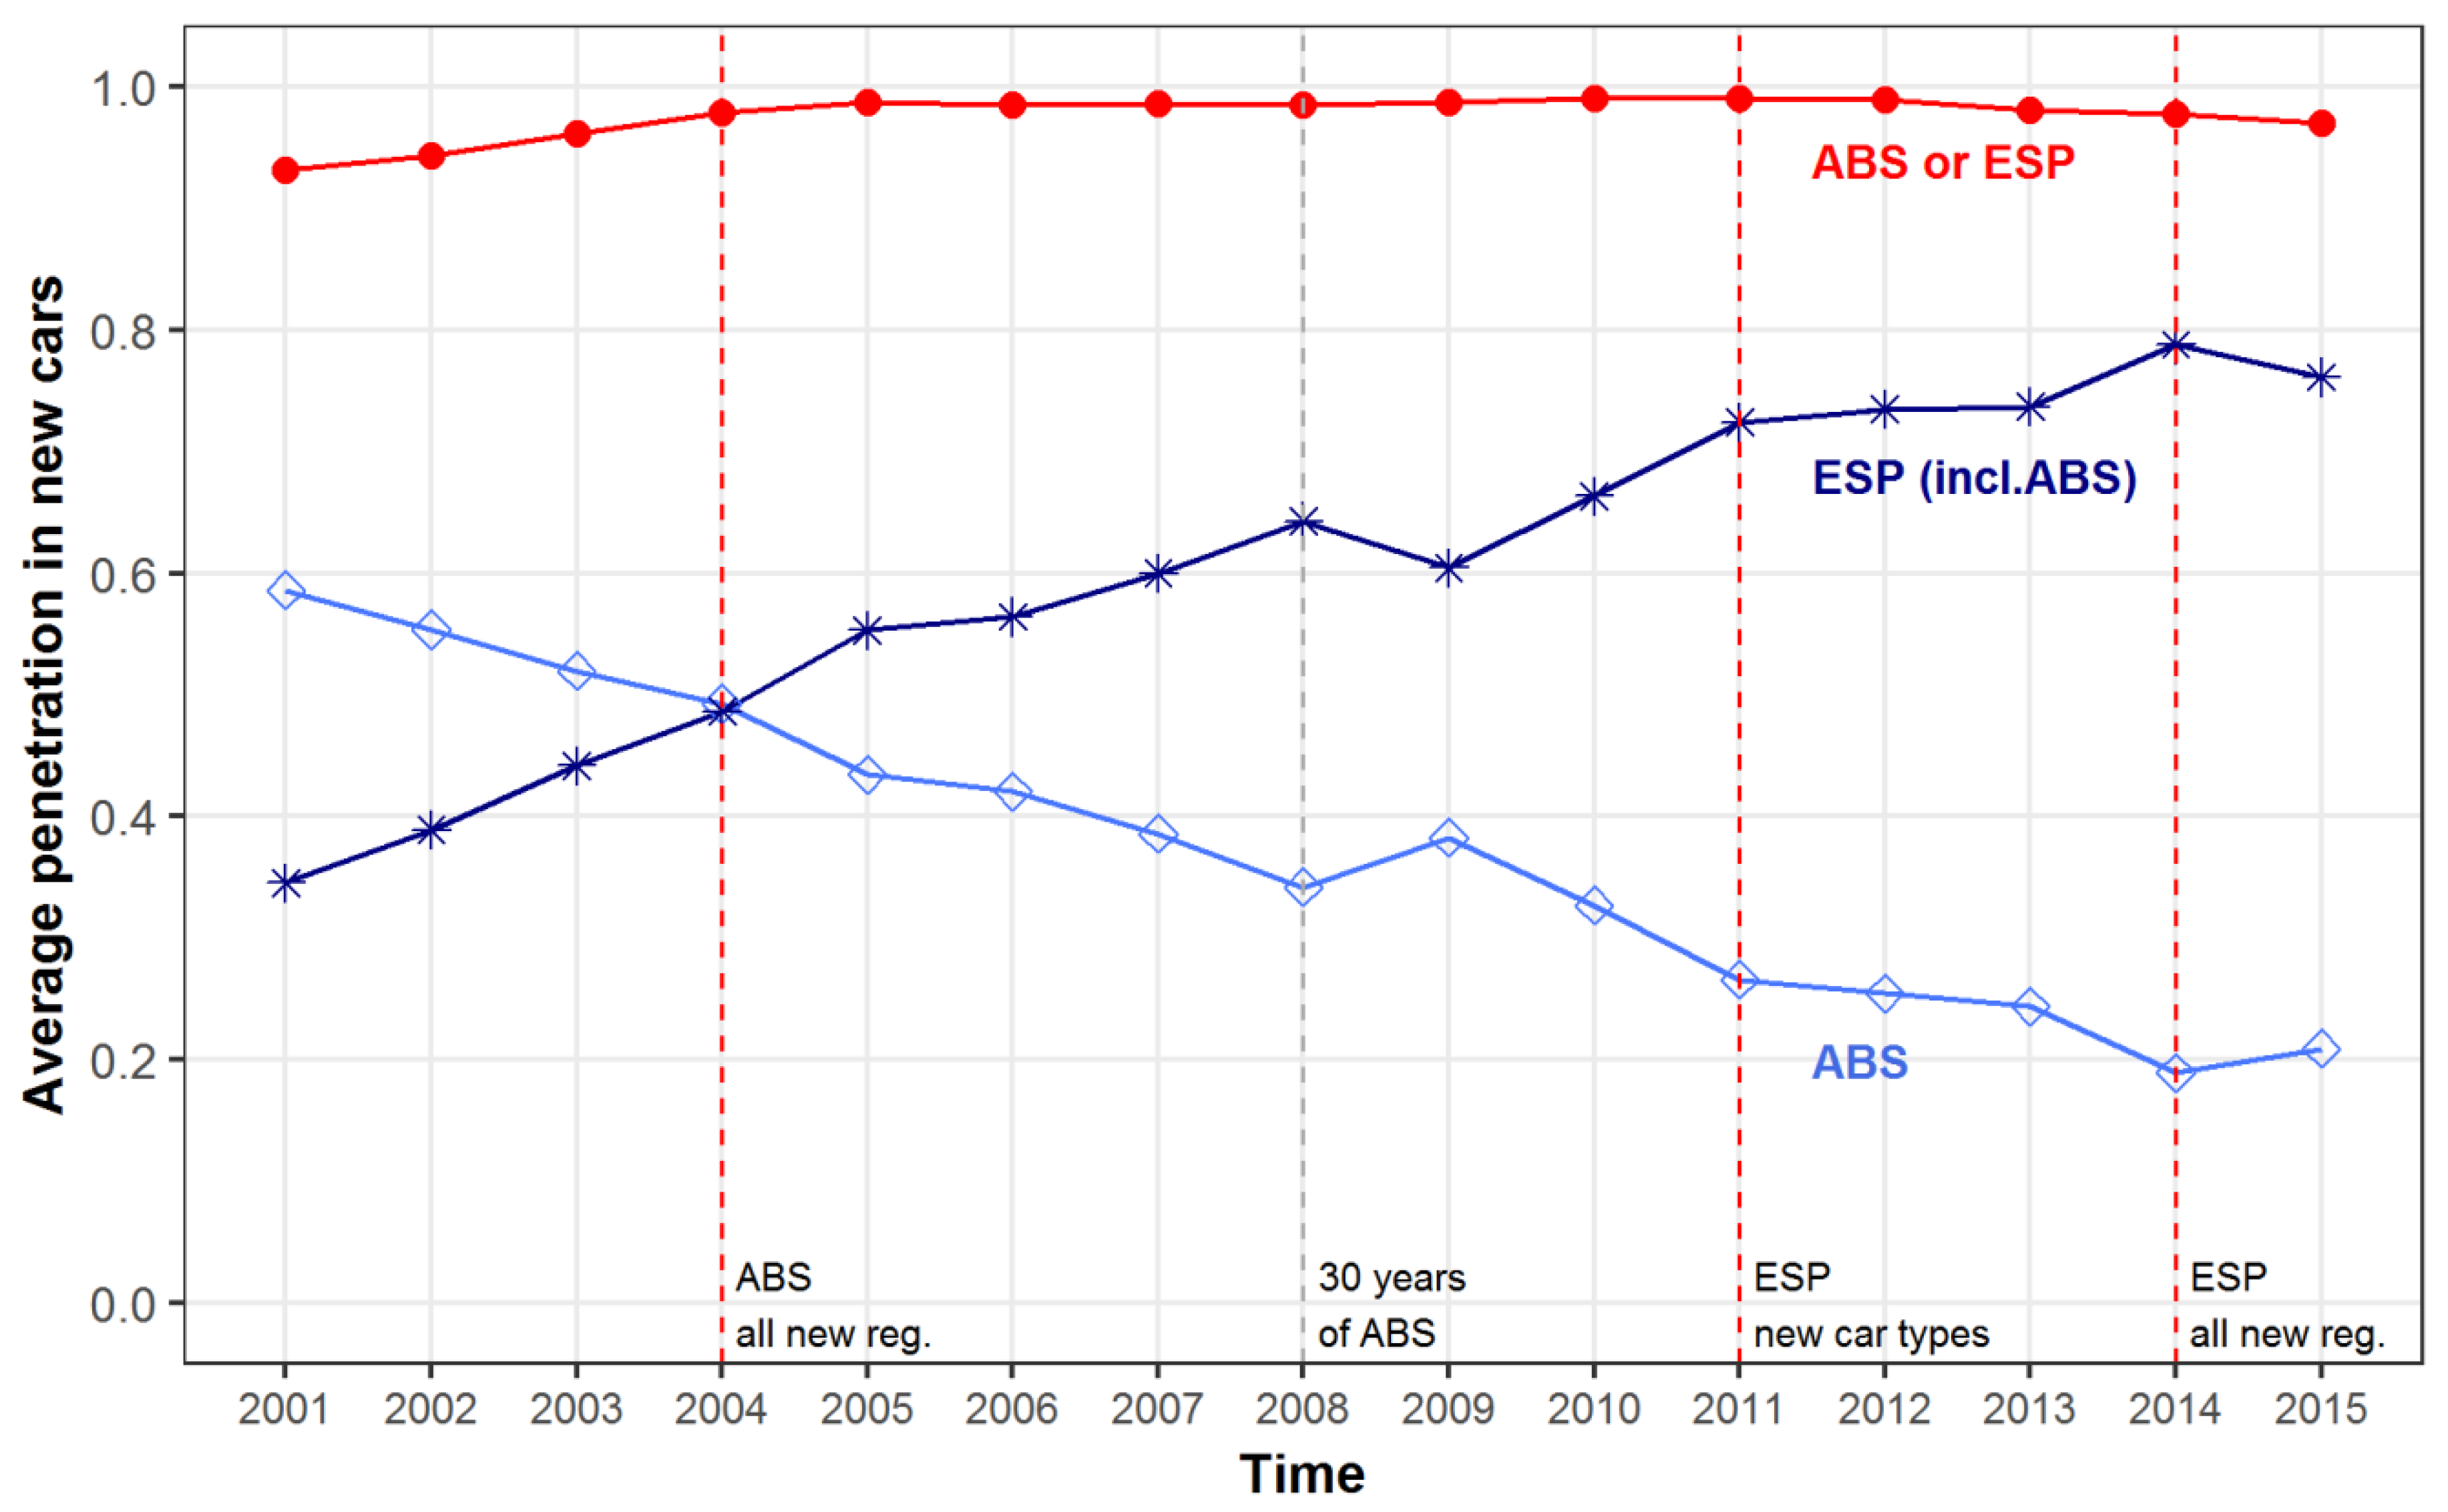
3.1.1. Established ECS
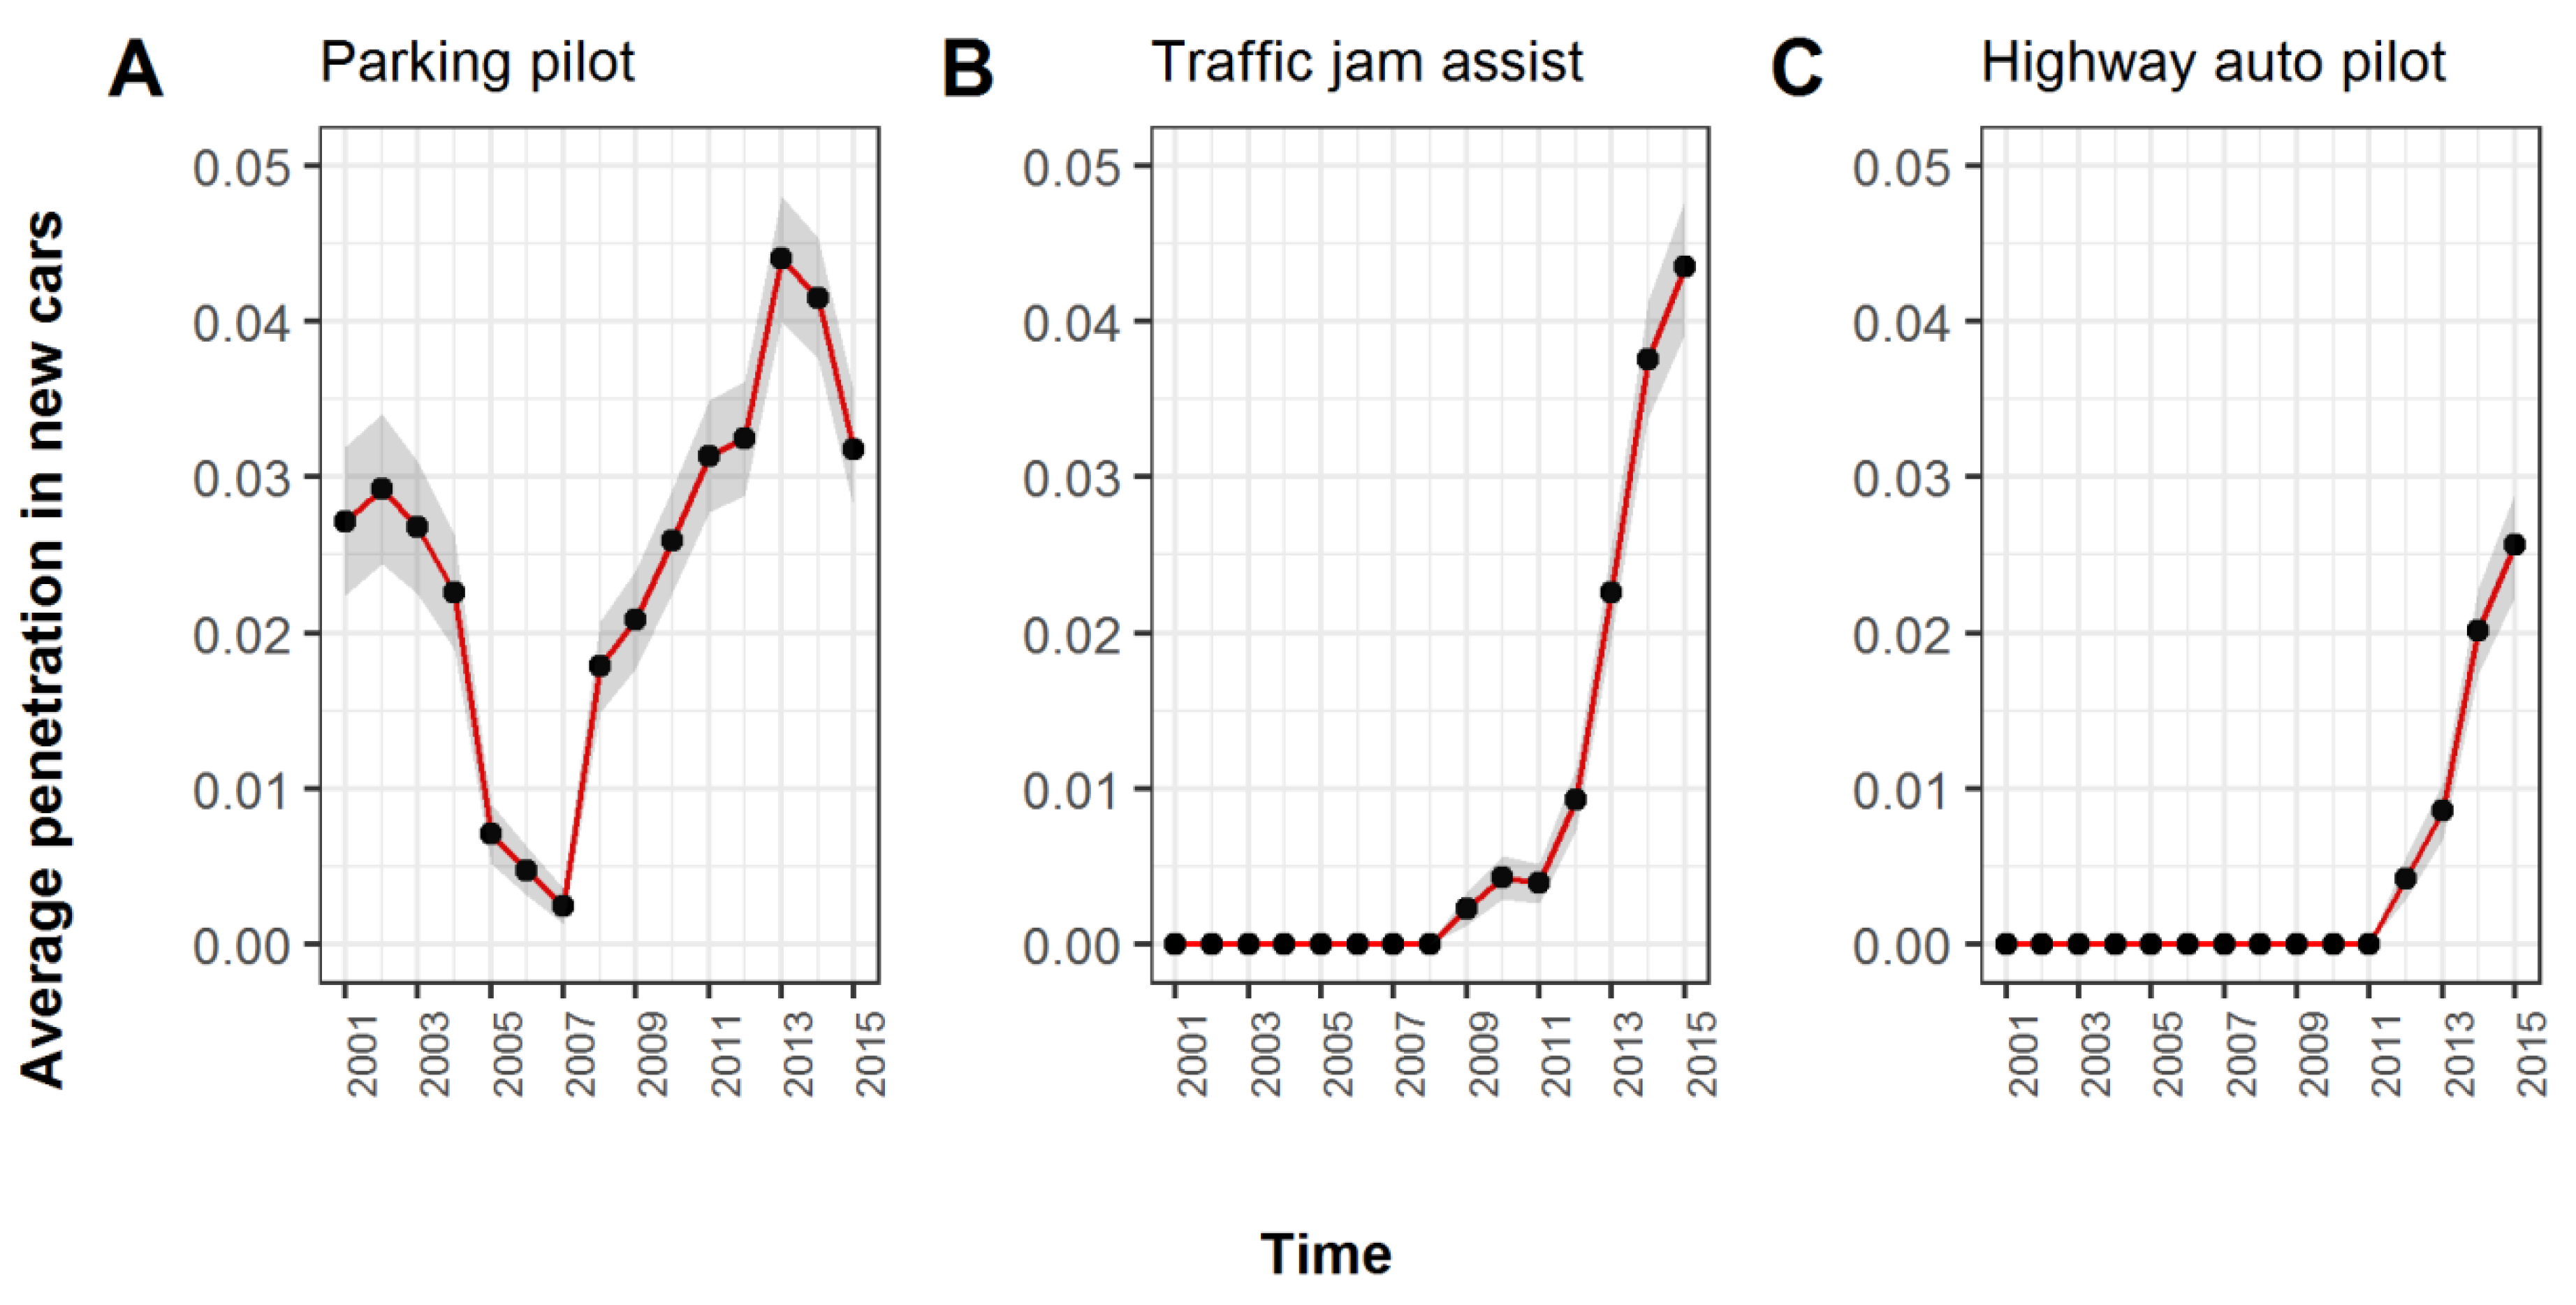
The average penetration of the ECS in group A for the time period 2001 to 2015 is presented in Figure 3. The average penetration values can be found in Table S3 of the SI; average penetration values for additional ECS not analyzed in detail in this study are provided in Table S4.
Figure 3A shows the average penetration of the cruise control system (CC), which is included in vehicles with the purpose of keeping the car’s speed at a predefined level [30]. It can be observed that even though the CC was present in cars during the 14 years of analysis, its penetration remained close to 40% for the entire period. Considering that the CC was first introduced towards the beginning of the 1990s [30,31], and that the proportion of high-end car classes in the dataset was about 50% (see the sum of “luxury”, “upper class” and “upper middle class” cars in panel A of Figure S1 in the Supplementary Information), this implies that even after 25 years on the market the CC has still not penetrated beyond the high-end car classes.
Figure 3B presents the penetration of the electronic stability program (ESP)–a safety device. The ESP is a vehicle dynamics system encompassing other systems, such as the ABS and the traction control system (TCS) [20]. It was first introduced at the beginning of the 1990s with the overall role of preventing the vehicle’s tendency to “plow” or “become unstable and brake away to the side” [20]. Due to its safety benefits, the ESP became mandatory for most new car models since 2011 (regulation EC No 661/2009) [32]. Existing vehicle types were given additional time to comply with this requirement: by 2014 the regulation was extended to new cars registered. As a result of the safety benefits of the ESP and the placement of the safety regulation, the average penetration increased to 80% in 2015.
The trend in the adoption of the navigation system (Navi) is presented in Figure 3C. The penetration of the Navi increased from 35% to 50% in the first six years of analysis (2001–2007). A fairly stable penetration of around 50% can be observed after 2007 with a slight decrease at the end of the study period. Considering that the Navi was first introduced around 1980 [33], it can be inferred that it took about 30 years for this technology to penetrate through half of the car types (and beyond the high-end classes).
Figure 3D displays a rapid adoption of the stop-start system after 2010. Specifically, the penetration of the stop-start system increased from 5% in 2010 to 60% in 2015. This rapid adoption may be attributed to the implementation of the Euro 5 emission standard (regulation EC No 764/2008) for new car type approvals in 2009 [34]. The stop-start system can help reduce up to 10% fuel consumption by turning off the internal combustion engine (ICE) during idling situations (as in the case of stops at traffic lights or jams) and turning it on again upon driver’s demand [35]. This function is particularly useful in diesel cars (both ICE and hybrid electric types) for achieving the emission standards set by the Euro 5 regulation [35]. We can infer that even though the stop-start system is not directly mandated by the Euro 5 regulation, its utility to achieve the required standards particularly for diesel cars has established it as a common ECS in a short period of time.
The average penetration of ECS obtained above is consistent with average penetration values reported by the DAT group (Deutsche Automobil Treuhand GmbH (Ostfildern, Germany)) in German cars during the time period 2001–2015 [36].

3.1.2. Emerging ECS

The historical trends for ECS in group B are presented in Figure 4. Figure 4A shows the penetration of the parking pilot. In this case, we use the name “parking pilot” to describe the system that allows the vehicle to take over steering functions while parking the car [37]. More precisely, the parking system considered here belongs to automation level 4 as described by SAE International (Society of Automotive Engineers) [24]. Other names include “park assist” or “intelligent parking”. “Park pilot” may also be used by some car manufacturers to describe a lower-level automation parking system in which warning signals are sent to aid the driver with parking maneuvers while remaining in full control of the car. The latter shall not be confused with the parking pilot system considered here.
Even though the parking pilot (automation level 4) has been present in newly registered cars during the whole study period its penetration has remained below 4% (except for two years: 2013 and 2014 in which it was between 4% and 5%). Additionally, a declining penetration to levels of less than 1% was observed during the period 2005–2007. The temporary decreases in penetration levels might be attributed to technical challenges in the implementation of the parking pilot, as is typical for early-stage technologies [38].
Essentially, the penetration of all ECS in group B remained well below 5% during the study period. The traffic jam assist (Figure 4B) started penetrating in 2009 while the highway autopilot (Figure 4C) started penetrating in 2012. Both penetrations still remained below 5% and 3% in 2015, respectively. This is in agreement with the early state of innovation for these technologies as well as with current safety regulations restraining the broad use of autonomous cars [39,40].

3.1.3. ECS Integration

Figure 5 illustrates the dependencies between the established ECS in group A and the emerging ECS in group B. The y-axis represents the levels of car automation defined by SAE International [24], and the x-axis represents the approximate year in which the ECS was first introduced.
As it can be appreciated the ECS in group B build upon ECS in group A as higher hierarchical entities increasing the car’s automation level. In the highest automation levels 4 and 5, ECS also start integrating other high level ECS and no longer only those in the lower levels of automation. The car’s automation level increases with the addition of new ECS and with time.
An example of past ECS integration is the ESP, which combines several functions that were previously performed by independent ECS, among them the ABS. Figure 6 shows how the ABS as a separate ECS has steadily been replaced by the higher-level ESP (which contains the ABS function). The dotted red line presents the combined penetration of the systems (ESP or ABS), the starred dark-blue line represents the penetration of the ESP (including ABS) and the diamond light-blue line represents the penetration of the single version of the ABS (ABS alone). The vertical red-dashed lines represent, from left to right, the year in which the ABS became mandatory for all newly registered cars, the year in which the ESP became mandatory for new type approvals, and the year in which the ESP became mandatory for all newly registered cars. New type approvals refer to new car models being registered; new registrations mean all new cars (including previously existing models).
The ABS made its first commercial appearance in 1978 with the purpose of preventing the wheels from locking during emergency braking [42]. Due to the success preventing fatalities in emergency braking situations, the ABS was made mandatory for all new registrations in 2004 [42]. Related systems, such as traction control, emergency braking and hill-hold control system, have followed the development of the ABS aiding with other aspects of vehicle dynamics [20]. As most of these systems involve manipulation of the brake calipers, integration becomes natural. This integration occurs mostly within the overarching ESP (also known by other commercial names, such as electronic stability control (ESC) or vehicle dynamics control (VDC)) [20].
The light-blue line in Figure 4 shows that the penetration of the single version of the ABS declined from almost 60% in 2001 to less than 20% in 2015. Beginning in 2004, the penetration of the single version ABS was overtaken by that of the ESP. By 2015 the ESP had reached around 80% penetration. These results indicate a “lifetime” for the single version of the ABS of around 40 years, with integration into the ESP starting somewhere in the middle of this time period.
The combined penetration of the ABS and the ESP has been close to 100% since 2005 (red-dotted line), indicating that the compliance with the ABS regulation has been met by embedding either the single version of the ABS or the integrated version of it within the ESP. Additionally, this combined penetration exhibits a slight decrease in 2014, which might be an indication of further integration of these systems into new ECS.

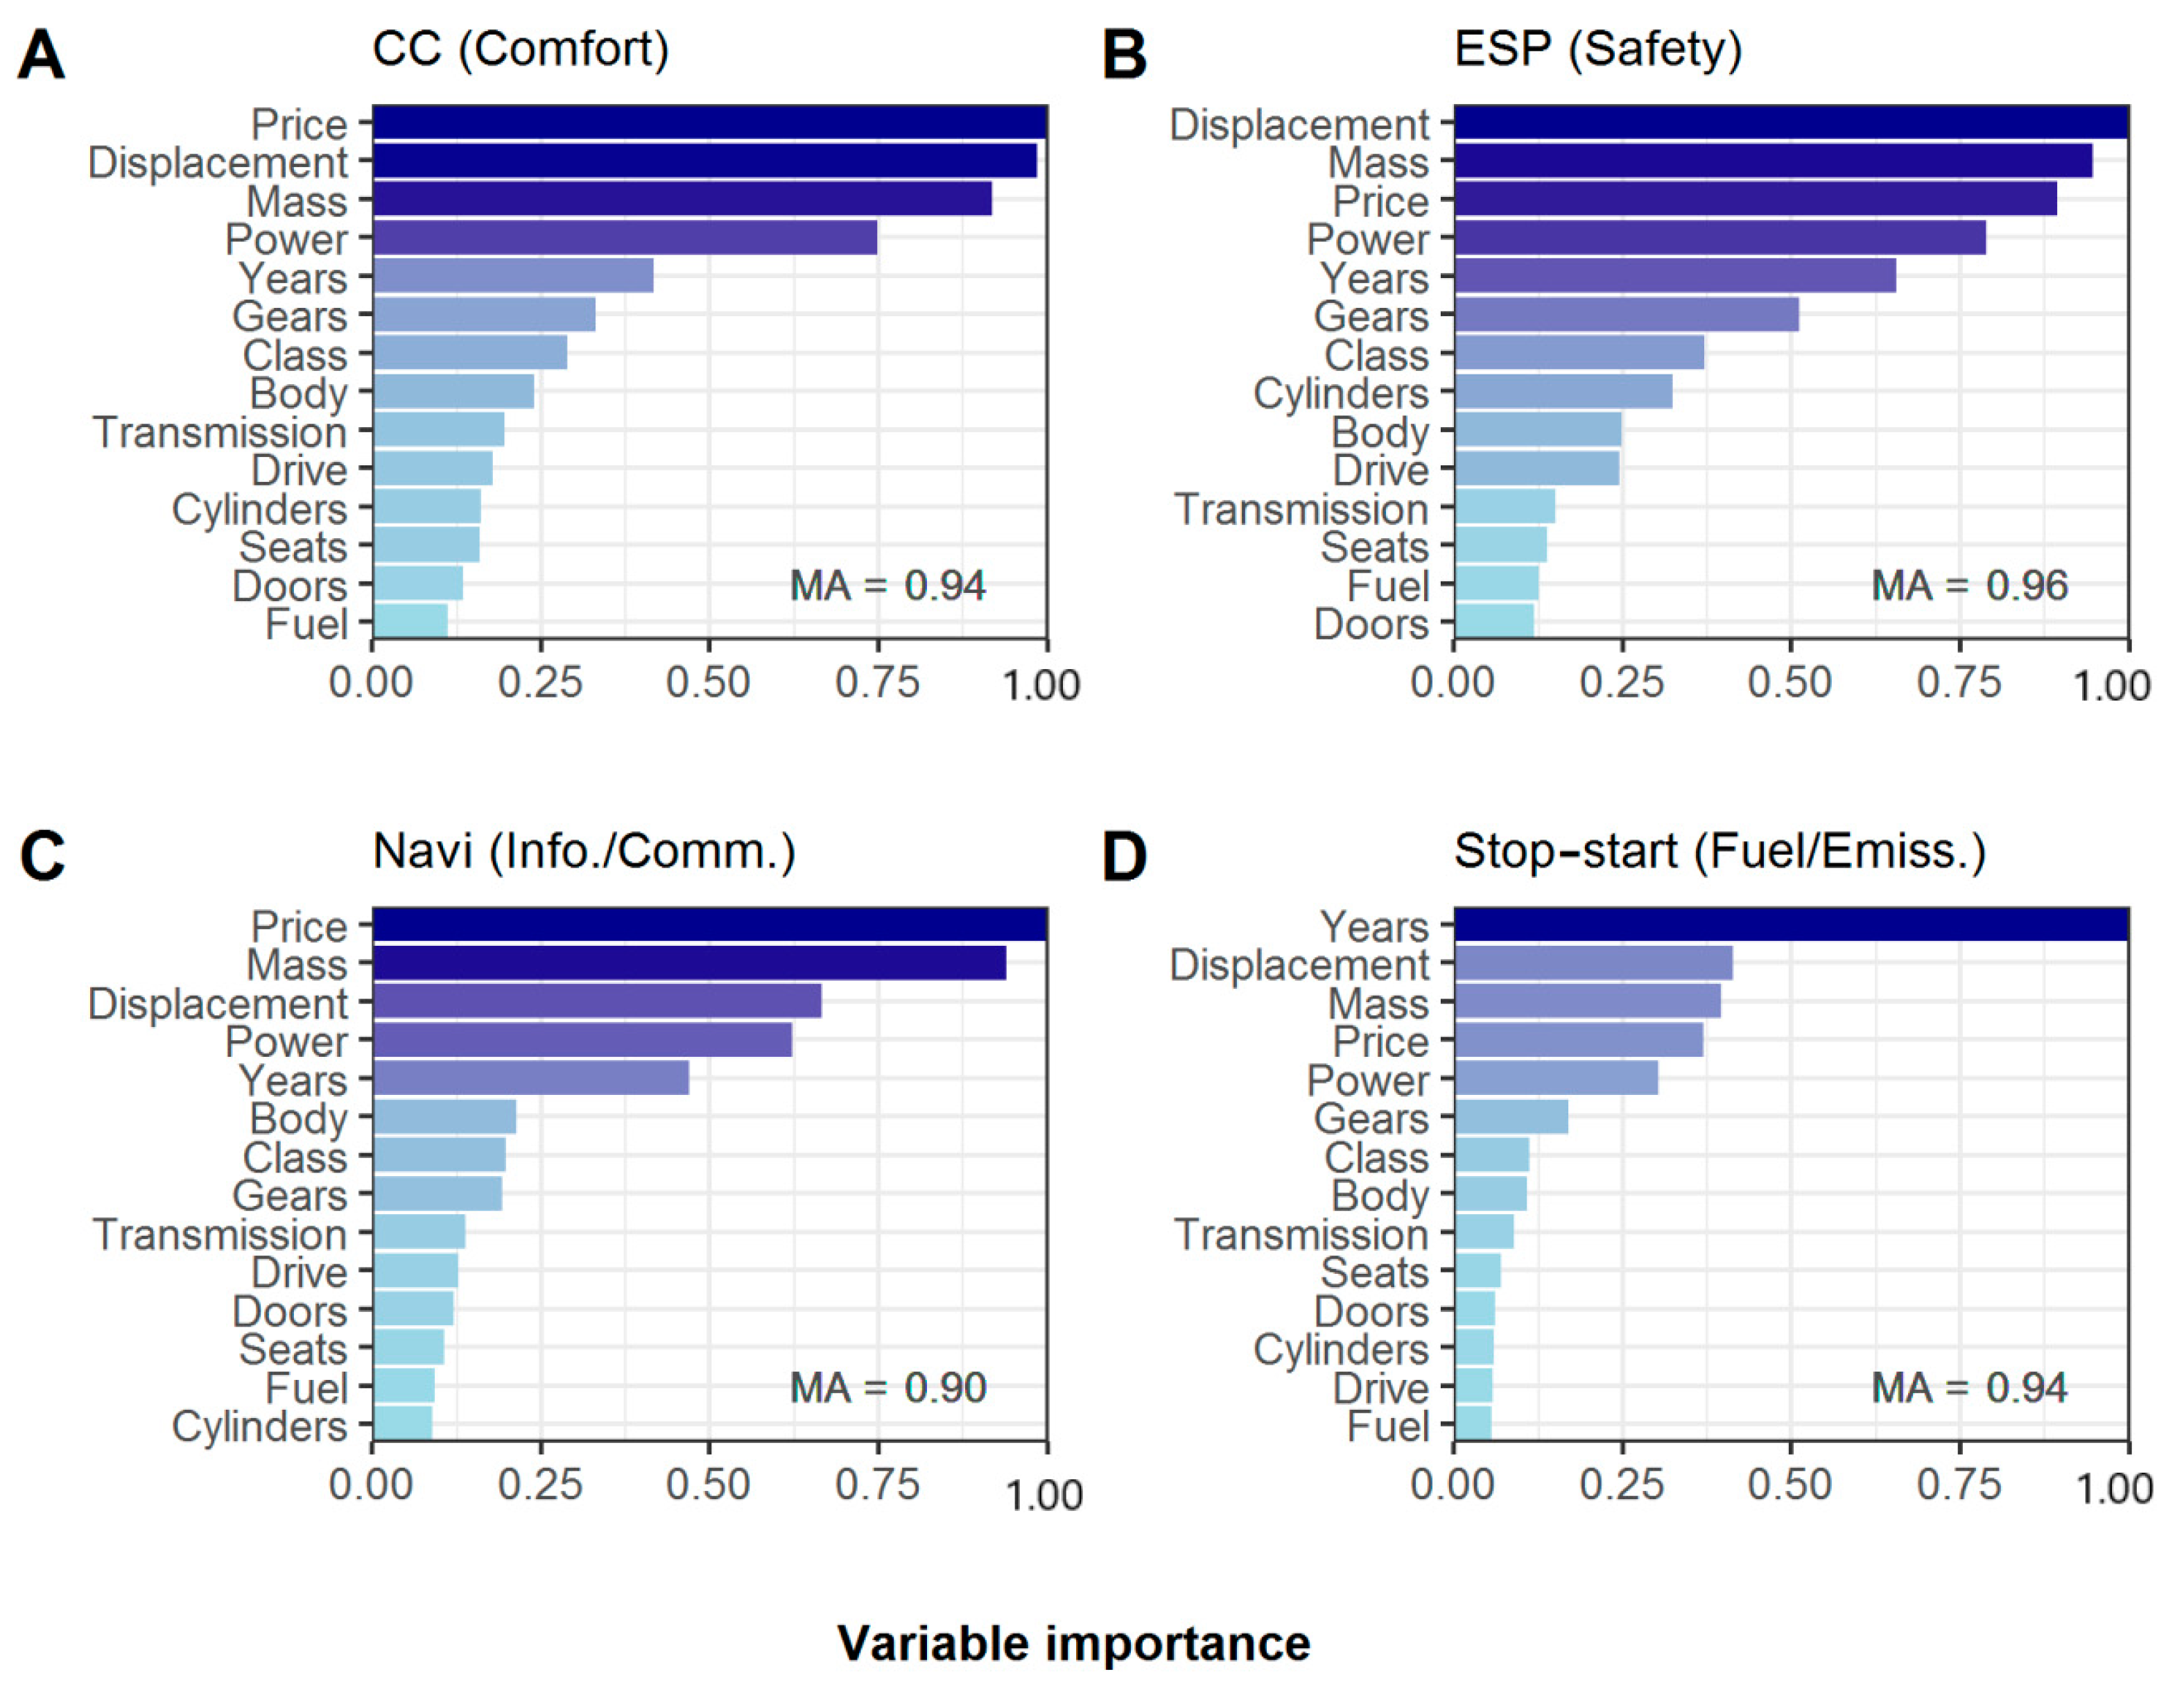
3.2. Indicators for the Historical Use of Automobile ECS

To better understand indicators for the existence of ECS, we trained a random forest model that predicts the presence of specific ECS based on the set of car characteristics. Figure 7 presents the importance of the input variables when estimating the penetration of each of the ECS in group A. The importance is given in terms of the Gini VIM and it is expressed relative to the maximum; a value close to one indicates an important input variable.
In general, the most important input variables were: price, mass, engine displacement, power, and production year of the cars. Evidently, the price was the most important variable for estimating the average penetration of the two non-regulated ECS (CC and Navi). This is expected since adding more functions (particularly related to comfort) to the car naturally leads to a higher price. The car’s mass had a Gini VIM larger than 0.8 in three out of the four cases analyzed, becoming the second most important input variable after the price. This implies that the car’s mass serves as a good indicator for the presence of the ECS analyzed. The next important variable was the engine displacement, followed by the engine/motor power and the production year of the cars.
The car’s production year was the most important variable in the model estimating the average penetration of the stop-start system. This reflects the fact that environmental regulations specify an implementation year in which all newly registered cars must comply with a given emission standard.
The car’s class, body type, number of gears, transmission type, drive type, number of doors, number of seats and number of cylinders had Gini VIM less than 0.5 in all models, becoming of little importance for the estimation of the penetration of the ECS considered.
In summary, and disregarding the car’s price, there would be three indicators for the presence of the ECS analyzed (in order of importance): mass, engine displacement, and production year of the cars. In cars without an ICE, the drive motor power may replace the engine displacement indicator (the association between engine/motor power and engine displacement is positive, with a value of 0.34 out of 1; see Figure S2 of the SI).
The fuel type seemed to have particularly low importance for the average penetration of the ECS considered. This implies that considering the car’s fuel type in the estimation of the selected ECS would not significantly improve the accuracy of such estimation, compared to including the car’s mass or the car’s production year. The fuel type can, however, be important for other ECS, especially those related to fuel management or engine/drive motor control [43]. Considering that there will be a larger variety of fuel types in the future (electric, hybrid-electric, and hydrogen) we presume that the estimation of ECS related to fuel management system and engine/drive motor would be of relevance for further models. Consequently, we include the relationship between the fuel type and the penetration of the selected ECS in the subsequent analysis.
The relationship between each of the most important car characteristics (including fuel type) and the presence of the cruise control system (CC) is presented in Figure 8. The same is presented for the stop-start system in Figure 9. The results for the ESP and the navigation system can be found in Figures S3 and S4 of the SI, respectively. The blue lines in panels A to E are smoothing splines fit the quantitative variables Price, Displacement, Mass, Power, and Years; the degrees of freedom are noted on the y-axis. The scale of the y-axis represents the Logistic GAM transformation of the output variable, and it is not given in the units of the response. The plots thus express how the output variable responds to a change in the input variable and not the value of the output variable corresponding to the input. For an estimated value of the output variable corresponding to each input variable see Figure 10 and Figure 11. Panel F shows a step function fit the qualitative variable Fuel. In all cases, the dashed red lines represent the 95% confidence interval of the fitted function. A more extended description of Logistic GAM and the graphical representations presented here can be found in reference [23].
Figure 8A indicates that, holding all other variables fixed, the penetration of the CC rapidly increases with the price for cars of prices less than 100,000 CHF, which is most cars in the dataset (and in general). This is in agreement with the fact that the CC is a comfort system, therefore more likely to exist as a standard feature in cars of higher price ranges. The flattening and subsequent decrease of the curve above 100,000 CHF is likely due to a small number of specialized cars found in this range and for which the CC is less common (e.g., sports cars). The CC also seems less common for small cars of masses < 1000 kg (Figure 8B). Except for local wiggles, Figure 8D indicates that the penetration of the CC increases rapidly with the engine displacement: the larger the engine of the car the more likely it is to contain a CC. Regarding the engine/motor power of the cars, Figure 8E indicates that the penetration of the CC is highest for cars of engine/motor power around 100 kW. Likewise, the CC seems more likely to exist in electric cars than in hybrid and conventional cars (Figure 8F). The production year of the cars (Figure 8C) explains very little of the penetration among different car models, compared to other characteristics, such as displacement, mass, and fuel type.
In contrast, Figure 9C indicates that the existence of the stop-start system clearly increases with time. As expected, the stop-start system is more likely to exist in diesel cars, especially in hybrid-electric diesel ones (Figure 9F), reflecting the fact that the stop-start system is particularly suitable to achieve efficiency in fuel consumption in these types of cars [35]. In addition, the stop-start system seems less common for small cars and large cars and (mass < 1000 kg and mass > 2500 kg), Figure 9B. The high uncertainties in panel A of Figure 8 and Figure 9 are due to the small number of cars at very high price ranges in the dataset. Likewise, the larger uncertainties for electric car types (panel F in both Figure 8 and Figure 9) result from the smaller number of electric cars in the data set.
Figure 10 and Figure 11 show the prediction of the penetration of the CC and the Stop-start in the validation set using the models described in Figure 8 and Figure 9, respectively. The y-axis is given in the units of the response and corresponds to the average penetration of the ECS by each of the predictor variables considered. In simple terms, the predicted value is the likelihood of a car containing the ECS times the corresponding number of cars. Panel C in both figures shows how the prediction in the validation set closely resembles the real average penetration of the ECS in time presented in Figure 3 above.
The plots in Figure 8 and Figure 9 complement the historical patterns in Figure 3 by illustrating how the penetration of the selected ECS relates to the characteristics of the car. As seen for the CC in Figure 3, even if a comfort-related ECS has existed in cars for over 14 years, its penetration may remain below 40%. Figure 8 complements this finding by indicating that despite seemingly stable penetration rates, future shifts in consumer preference, e.g., towards larger cars with higher engine displacement, may lead to substantial changes in the overall penetration rate of this ECS; a shift towards electric cars in the future may also increase such penetration. An increase of hybrid cars—particularly using diesel fuel might uplift the average penetration of fuel efficiency ECS (such as the stop-start system). Preferences for larger cars (high mass) may trigger the penetration of both comfort and fuel efficiency ECS. However, this assumes that changes in car characteristics cause effects in the penetration of ECS, which may not be the case. In fact, the opposite may be true. For example, an increase in ECS penetration may be the cause of an increase in car mass. Future estimations of ECS penetration should not be based on assumptions about the development of car characteristics only.
As seen for the ESP and the stop-start system in Figure 3, once an ECS delivers safety and/or environmental benefits at reasonable costs, a fast penetration in newly registered cars, most likely reaching 80% or higher, can be expected following the implementation of a corresponding regulation. Both the time to reach saturation and the saturation level seem to depend on whether the regulation affects the implementation of an ECS directly or indirectly. Safety regulations directly mandate the installation of a given ECS in two stages: (i) new type approvals and (ii) new registrations. New type approvals refer to new car models; new registrations mean all new cars (including previously existing models). As in safety regulation (EC) 661/2009 there is usually a fixed date in which a certain ECS must be implemented in new type approvals (i.e., the ESP in 2011) while existing vehicle types “should be allowed an additional time period to comply with the requirements” [34,41]. As seen for the ESP, the result of such regulation is a rapid adoption almost reaching full penetration (80%) within three years of implementation in new type approvals.
In contrast, environmental regulations, which tend to stipulate emission limits without mandating certain technologies, seem to trigger both (i) changes in the car characteristics (e.g., fuel type and engine displacement) and (ii) increased installation of specific ESC in certain car types exclusively. As seen for the stop-start system, the result of adopting the Euro 5 regulation [34] was a rapid penetration, however, reaching only 60% penetration after five years of implementation. This derives from the fact that the stop-start system is mainly suited for diesel cars [35] and that there are other means to achieve what the regulation requires. For example, in the case of fuel efficiency, this can also be achieved, among others, by combined efforts of more efficient internal combustion engines, a switch to electric and hybrid-electric drives and an improved tire-pressure monitoring system [33,34].
The key factor influencing rapid penetration and high saturation levels seems to be regulation, either related to safety or fuel consumption/environmental emissions. In addition, increases in car’s mass and engine displacement seem to be related to an increase in ECS penetration, particularly for ECS related to comfort.
Similar penetration curves were observed for comfort and information/communication ECS: a slow penetration over the 14 years of analysis. Likewise, the penetration curves of safety and fuel efficiency/emission control ECS were similar: a rapid penetration following the implementation of a respective regulation. In general:
  • Comfort-related ECS, as well as ECS related to information, communication, and entertainment, tend to remain below 50% for more than 10 years as long as under reasonable implementation costs no significant safety or environmental benefits are provided.
  • Safety-related ECS can be expected to grow rapidly to approach 100% penetration within two to five years of implementation of the regulation.
  • Fuel efficiency- and environmental emission-related ECS tend to grow rapidly after the implementation of the regulation. The saturation level seems to depend on the benefits of the ECS for achieving the specific standards for different car types.

3.3. Autonomous Cars and Other Trends in the Automobile Sector

Transferring the results of this study to the realm of autonomous cars, it seems more likely that higher levels of automation would be first achieved for larger cars (larger masses, larger engine displacements), while small cars would remain in the lower automation levels where the average penetration of ECS is low. However, these cause and effect relationships were not analyzed in this study. An assessment of the future developments of ECS and the path to autonomous cars requires tools outside this study, such as scenario analysis [44].
Considering that ECS necessary for self-driving tasks rely on the existence of other lower-level ECS, it seems likely that the penetration of fully autonomous cars would happen rather slowly, unless truly disruptive changes affecting the car characteristics, safety and environmental standards take place. On the other hand, as high automation levels rely on a host of higher- and lower-level ECS, external trends that favor autonomous cars could lead to massive increases in the amount of ECS. Examples of such developments would be a preference towards shared mobility, which could trigger the growth of self-driving features in cars or liberalization of the regulatory framework [39,40,45]. The level of ECS penetration in new cars depends on the interaction of such trends in consumer behavior, technological maturity, physical constraints, and regulatory framework. Future research should, therefore, explore how the penetration of ECS may develop under different scenarios of such external drivers.

3.4. Implications for Critical Raw Material (CRM) Content in Cars

Increased penetration of ECS does not necessarily mean an increased number of related EE devices (sensors, controllers, and actuators) and a corresponding increased CRM content in cars. Some authors argue that the number of physical, electronic control units (ECUs/controllers) is likely to decrease with increasing integration of ECS [20,46]. Moreover, increased penetration of an ECS may be accompanied by a mass reduction for the related EE devices, as exemplified by the hydraulic actuator in the ESP/ABS and related systems [20,47]. For a single car, integration trends may reduce the number of EE devices and miniaturization may reduce the mass of the related CRMs. The total stocks and flows of CRMs in cars may nevertheless increase, due to the increased penetration of ECS in all car types. Future estimations of CRM stocks and flows in car electronics should account for the effects of all of these trends.

3.5. Implications for Policy on Car Electronics Dismantling

Considering the trends in ECS penetration and integration identified in this study, a potential list of mandatory EE devices to be dismantled from cars would need to be updated on a regular basis. In addition, in order to capture differences in embedded ECS in different car types, such a list may benefit from a definition at the level of car functions instead of at the level of specific EE devices. For example, it would be more inclusive to decree the dismantling of “controllers (ECUs) related to vehicle dynamics” instead of mandating the dismantling of “ABS controllers”.
The growing penetration of ECS in new cars will eventually be mirrored in end-of-life vehicles (ELVs), and may bring advantages to the recycling of car electronics through economies of scale. Disadvantages might arise depending on the level of miniaturization of the related EE devices.
Considering the average lifetime of cars in Switzerland (15–20 years), the analysis of ECS penetration in new cars presented in this study provides robust estimations for the ECS penetration in ELVs in the short to medium term. However, the long term seems more uncertain, particularly considering the rapid increase in ECS integration and the effects that new safety and environmental emission regulations have on the penetration of ECS. Continued analysis of ECS penetration in new cars, such as carried out in this study, can support a timely update of ELV-related regulations.

4. Conclusions

The results illustrate several important trends and indicators for the penetration of electronic control systems (ECS) in cars. Some ECS, typically those affected by regulations on safety, fuel efficiency and/or emissions, have increased rapidly to high levels. Examples include the stop-start system and the electronic stability program (ESP). Other ECS, typically those that are unaffected by regulation, have been stable at intermediate penetration levels for many years. Examples include the navigation system and the cruise control system (CC). Higher-level cross-functional ECS related to autonomous driving have increased fast, but are still at low levels (<5% of new cars in 2015). In parallel to these increasing ECS penetration levels, there are clear indications of integration of different ECS, as shown for the ABS and ESP. In general, there are two major trends that are coinciding: (i) automation of cars, (ii) integration of ECS. The combined effects of these trends on critical raw material (CRM) use in car electronics and their recycling potentials need to be considered. The results presented here provide a foundation for a subsequent estimation of CRM content in cars and the definition of related car recycling policy.
We found that the four most important car characteristics indicating the presence of ECS are price, mass, engine displacement (or power), and production year. Fuel type did not appear among the most important predictors for the selected ECS, but may nevertheless be very important for other ECS related to fuel and energy management. Statistics and models of the passenger car fleet should therefore ideally employ car classification systems based on the aforementioned characteristics to be useful for prospecting secondary raw materials in car electronics.
The statistical analysis presented allows inferences about ECS penetration in the short to medium term. For example, preferences towards larger cars (high mass, high engine displacement) may be associated with increased use of embedded ECS. However, long-term penetration of ECS is influenced by the interaction of external drivers, such as regulatory framework, technological maturity, and consumer behavior. In particular, regulations that favor automated driving may drive a large increase in lower- and higher-level ECS. Future estimations should account for the influence of these external drivers on the penetration of automobile ECS and related material content.

Supplementary Materials

The following are available online at https://www.mdpi.com/2079-9276/8/2/58/s1, Figure S1: Distribution of the dataset by additional car characteristics, Figure S2: Association (correlation) among input variables, Figure S3: Relationship between selected car characteristics and the penetration of the electronic stability program (ESP) in new cars, Figure S4: Relationship between selected car characteristics and the penetration of the navigation system (Navi) in new cars, Figure S5: Average predicted penetration of the electronic stability program (ESP) in the validation set, Figure S6. Average predicted penetration of the navigation system (Navi) in the validation set, Table S1: R software packages used in the statistical analysis, Table S2: Description of car characteristics considered in this study, Table S3: Average penetration of the investigated ECS by production year of the cars, Table S4: Average penetration of additional ECS by production year of the cars.

Author Contributions

Conceptualization, E.R., A.N.L., R.W., P.W. and D.B.M.; formal analysis, E.R.; funding acquisition, E.R., R.W., P.W. and D.B.M.; investigation, E.R.; methodology, E.R., A.N.L. and D.B.M.; project administration, R.W. and P.W.; supervision, R.W., P.W. and D.B.M.; validation, E.R., A.N.L., R.W. and D.B.M.; visualization, E.R.; writing—original draft, E.R.; writing—review & editing, E.R., A.N.L., R.W., P.W. and D.B.M.

Funding

This research was funded by the Swiss Federal Office for the Environment (FOEN) as part of the project “Recycling Electronics from ELVs–EVA”. The project partners include: Auto-Schweiz (Swiss association of automobile importers), AWEL (Office of Waste, Water, Energy, and Air of the Canton of Zurich), SARS (Foundation Auto Recycling Switzerland), VASSO (Association of the Official Car Collection Point Proprietors of Switzerland and the Principality of Liechtenstein), and VAREX (Swiss Association of Automobile Recyclers and Exporters).

Acknowledgments

Special thanks to Auto-i-Dat AG for access to the Autohandel database. Thanks to the following project partners for their feedback on the original manuscript: Isabelle Baudin from FOEN, Daniel Christen from SARS and Andreas Kaufmann from VASSO.

Conflicts of Interest

The authors declare no conflict of interest. The study was designed in collaboration with the project partners. The funders had no role in the collection, analyses, or interpretation of data, in the writing of the manuscript, or in the decision to publish the results.

Abbreviations

ABSAnti-lock braking system
CCCruise control
CIConfidence interval
CRMCritical raw material
ECEuropean Commission
ECUElectronic control unit
ELVEnd-of-life vehicle
ESPElectronic stability program
GAMGeneralized additive model
HEHybrid electric
ICEInternal combustion engine
NaviNavigation system
SAESociety of automotive engineers
SISupplementary information
Stop-startStop-start system
TCSTraction control system
VIMVariable importance measure

References

  1. Sander, K.; Kaerger, W.; Groke, M.; Bergamos, M.; Kohlmeyer, R. Separation of Components and Materials from End-Of-Life Vehicles Aiming at the Recovery of Critical Metals. In Proceedings of the 4th International Conference on Industrial and Hazardous Waste Management, Crete, Greece, 13–17 July 2014. [Google Scholar]
  2. Sander, K.; Wagner, L.; Sanden, J.; Wilts, H. Development of Proposals, Including Legal Instruments, to Improve the Data Situation on the Whereabouts of End-of-Life Vehicles; German Environmental Agency (UBA): Dessau-Roßlau, Germany, 2017. [Google Scholar]
  3. Andersson, M.; Söderman, M.L.; Sandén, B.A. Are scarce metals in cars functionally recycled? Waste Manag. 2017, 60, 407–416. [Google Scholar] [CrossRef] [PubMed]
  4. Cullbrand, K.; Magnusson, O. The Use of Potentially Critical Materials in Passenger Cars; Chalmers University of Technology: Gothenburg, Sweden, 2012. [Google Scholar]
  5. Alonso, E.; Wallington, T.; Sherman, A.; Everson, M.; Field, F.; Roth, R.; Kirchain, R. An Assessment of the Rare Earth Element Content of Conventional and Electric Vehicles. SAE Int. J. Mater. Manuf. 2012, 5, 473–477. [Google Scholar] [CrossRef]
  6. Du, X.; Restrepo, E.; Widmer, R.; Wäger, P. Quantifying the distribution of critical metals in conventional passenger vehicles using input-driven and output-driven approaches: A comparative study. J. Mater. Cycles Waste Manag. 2015, 17, 218–228. [Google Scholar] [CrossRef]
  7. Xu, G.; Yano, J.; Sakai, S. Scenario analysis for recovery of rare earth elements from end-of-life vehicles. J. Mater. Cycles Waste Manag. 2016, 18, 469–482. [Google Scholar] [CrossRef]
  8. Restrepo, E.; Løvik, A.N.; Wäger, P.; Widmer, R.; Lonka, R.; Müller, D.B. Stocks, Flows, and Distribution of Critical Metals in Embedded Electronics in Passenger Vehicles. Environ. Sci. Technol. 2017, 51, 1129–1139. [Google Scholar] [CrossRef] [PubMed]
  9. Xu, G.; Yano, J.; Sakai, S. Recycling Potentials of Precious Metals from End-of-Life Vehicle Parts by Selective Dismantling. Environ. Sci. Technol. 2018, 53, 733–742. [Google Scholar] [CrossRef] [PubMed]
  10. Widmer, R.; Du, X.; Haag, O.; Restrepo, E.; Wäger, P. Scarce Metals in Conventional Passenger Vehicles and End-of-Life Vehicle Shredder Output. Environ. Sci. Technol. 2015, 49, 4591–4599. [Google Scholar] [CrossRef] [PubMed]
  11. Huisman, J.; Leroy, P.; Tertre, F.; Ljunggren Söderman, M.; Chancerel, P.; Cassard, D.; Løvik, A.N.; Wäger, P.; Kushnir, D.; Rotter, V.S.; et al. Prospecting Secondary Raw Materials in the Urban Mine and Mining Wastes (ProSUM)—Final Report; ProSUM Consortium: Brussels, Belgium, 2017; ISBN 978-92-808-9060-0 (print); 978-92-808-9061-7 (electronic). [Google Scholar]
  12. Field, F.R.; Wallington, T.J.; Everson, M.; Kirchain, R.E. Strategic Materials in the Automobile: A Comprehensive Assessment of Strategic and Minor Metals Use in Passenger Cars and Light Trucks. Environ. Sci. Technol. 2017, 51, 14436–14444. [Google Scholar] [CrossRef] [PubMed]
  13. Ortego, A.; Valero, A.; Valero, A.; Restrepo, E. Vehicles and Critical Raw Materials: A Sustainability Assessment Using Thermodynamic Rarity: Vehicles and Critical Raw Materials. J. Ind. Ecol. 2018, 22, 1005–1015. [Google Scholar] [CrossRef]
  14. Fishman, T.; Myers, R.; Rios, O.; Graedel, T.E. Implications of Emerging Vehicle Technologies on Rare Earth Supply and Demand in the United States. Resources 2018, 7, 9. [Google Scholar] [CrossRef]
  15. Seo, Y.; Morimoto, S. Analyzing Platinum and Palladium Consumption and Demand Forecast in Japan. Resources 2017, 6, 61. [Google Scholar] [CrossRef]
  16. Nguyen, R.T.; Imholte, D.D.; Matthews, A.C.; Swank, W.D. NdFeB content in ancillary motors of U.S. conventional passenger cars and light trucks: Results from the field. Waste Manag. 2019, 83, 209–217. [Google Scholar] [CrossRef] [PubMed]
  17. European Commission. Report on Critical Raw Materials for the EU; European Commission: Brussels, Belgium, 2014. [Google Scholar]
  18. Sebag, R. Global Gold Mine Deposit Rankings; Natural Resource Holdings: Vancouver, BC, Canada, 2013. [Google Scholar]
  19. Swiss Federal Office for the Environment (FOEN). Revision der Verordnung über die Rückgabe, die Rücknahme und die Entsorgung Elektrischer und Elektronischer Geräte (VREG, SR 814.620); FOEN: Ittigen, Switzerland, 2013. [Google Scholar]
  20. Robert Bosch GmbH. Bosch Automotive Electrics and Automotive Electronics; Robert Bosch GmbH, Ed.; Springer Fachmedien Wiesbaden: Wiesbaden, Germany, 2014. [Google Scholar]
  21. ProSUM Project. Urban Mine Platform. 2019. Available online: http://www.urbanmineplatform.eu/homepage (accessed on 11 February 2019).
  22. Downes, S.; Huisman, J.; Leroy, P.; Ljunggren Söderman, M.; Kushnir, D.; Løvik, A.N.; Wäger, P.; Rotter, V.S.; Mählitz, P.; Chancerel, P.; et al. Secondary Raw Materials in the Urban Mine and mining wastes (ProSUM) Recommendations Report; ProSUM Consortium: Brussels, Belgium, 2017. [Google Scholar]
  23. James, G.; Witten, D.; Hastie, T.; Tibshirani, R. An introduction to Statistical Learning—With Applications in R; Springer: Heidelberg, Germany, 2013. [Google Scholar]
  24. SAE. Taxonomy and Definitions for Terms Related to On-Road Motor Vehicle Automated Driving Systems; Society of Automotive Engineers (SAE): Troy, MI, USA, 2014. [Google Scholar]
  25. Auto-i-Dat AG. Autohandel Database; Auto-i-Dat AG: Zurich, Switzerland, 2015. [Google Scholar]
  26. Contestabile, M.; Offer, G.J.; Slade, R.; Jaeger, F.; Thoennes, M. Battery electric vehicles, hydrogen fuel cells and biofuels. Which will be the winner? Energy Environ. Sci. 2011, 4, 3754. [Google Scholar] [CrossRef]
  27. Team, R.C. R: A Language and Environment for Statistical Computing; R Foundation for Statistical Computing: Vienna, Austria, 2018. [Google Scholar]
  28. Pearson, R. GoodmanKruskal: Association Analysis for Categorical Variables. R Package Version 0.0.2. Available online: https://CRAN.R-project.org/package=GoodmanKruskal (accessed on 30 March 2019).
  29. Wei, P.; Lu, Z.; Song, J. Variable importance analysis: A comprehensive review. Reliab. Eng. Syst. Saf. 2015, 142, 399–432. [Google Scholar] [CrossRef]
  30. Varney, V. The Evolution of Cruise Control. Available online: https://360.here.com/the-evolution-of-cruise-control (accessed on 27 February 2019).
  31. Toyota Corporation. Technical Development of Electronics Parts—Toyota. 2012. Available online: http://www.toyota-global.com/company/history_of_toyota/75years/data/automotive_business/products_technology/technology_development/electronics_parts/index.html (accessed on 31 January 2019).
  32. European Parliament and The Council. Regulation (EC) No 661/2009 of the European Parliament and of the Council of 13 July 2009 Concerning Type-Approval Requirements for the General Safety of Motor Vehicles, Their Trailers and Systems, Components and Separate Technical Units Intended Therefor; European Parliament and The Council: Brussels, Belgium, 2009. [Google Scholar]
  33. Akerman, J.R. Cartographies of Travel and Navigation; University of Chicago Press: Chicago, IL. USA, 2010. [Google Scholar]
  34. European Parliament and The Council. Regulation (EC) No 764/2008 of the European Parliament and of the Council of 20 June 2007 on Type Approval of Motor Vehicles with Respect to Emissions from Light Passenger and Commercial Vehicles (Euro 5 and Euro 6) and on Access to Vehicle Repair and Maintenance Information; European Parliament and The Council: Brussels, Belgium, 2009. [Google Scholar]
  35. Fonseca, N.; Casanova, J.; Valdés, M. Influence of the stop/start system on CO2 emissions of a diesel vehicle in urban traffic. Transp. Res. Part Transp. Environ. 2011, 16, 194–200. [Google Scholar] [CrossRef]
  36. Deutsche Automobil Treuhand GmbH (DAT). DAT Reports 2001–2015: DAT—Deutsche Automobil Treuhand, 2015–2001. Available online: https://www.dat.de/presse/dat-report/ (accessed on 28 February 2019).
  37. Paromtchik, I.E.; Laugier, C. Motion Generation and Control for Parking an Autonomous Vehicle. In Proceedings of the IEEE International Conference on Robotics and Automation, Minneapolis, MN, USA, 24–27 April 1996. [Google Scholar]
  38. Kucharavy, D.; de Guio, R. Application of S-shaped curves. Procedia Eng. 2011, 9, 559–572. [Google Scholar] [CrossRef] [Green Version]
  39. European Commission. Autonomous Cars: A Big Opportunity for European Industry; European Commission: Brussels, Belgium, 2017. [Google Scholar]
  40. International Transport Forum. Automated and Autonomous Driving: Regulation under uncertainty. In Proceedings of the 2015 International Transport Forum (ITF), Leipzig, Germany, 27–29 May 2015. [Google Scholar]
  41. Secretary-General of the European Commission. Commission Staff Working Document—Impact Assessment. Accompanying the document Proposal for a Regulation of the European Parliament and the Council on Type-Approval Requirements for Motor Vehicles and Their Trailers, and Systems, Components and Separate Technical Units Intended for Such Vehicles, as Regards Their General Safety and the Protection of Vehicle Occupants and Vulnerable Road Users, Amending Regulation (EU) 2018... and Repealing Regulations (EC) No 78/2009, (EC) No 79/2009 and (EC) No 661/2009; Council of the European Union: Brussels, Belgium, 2018. [Google Scholar]
  42. BOSCH. From Innovation to Standard Equipment 30 Years of Safe Braking with Bosch ABS, BOSCH. 2019. Available online: https://www.bosch.co.jp/en/press/group-0807-05.asp (accessed on 22 January 2019).
  43. Chan, C.C. The State of the Art of Electric, Hybrid, and Fuel Cell Vehicles. Proc. IEEE 2007, 95, 704–718. [Google Scholar] [CrossRef]
  44. Intergovernmental Panel on Climate Change and Working Group III. Emissions Scenarios. A Special Report of IPCC Working Group III; Intergovernmental Panel on Climate Change: Geneva, Switzerland, 2000. [Google Scholar]
  45. Litman, T. Autonomous Vehicles Implementation Predictions—Implications for Transport Planning; Victoria Transport Policy Institute: Victoria, BC, Canada, November 2018. [Google Scholar]
  46. Scobie, J.; Stachew, M. Electronic Control System Partitioning in Autonomous Cars. Automotive-EDN Asia. 11 September 2015. Available online: https://archive.ednasia.com/www.ednasia.com/ART_8800525576_1000000_TA_388bcfae.HTM (accessed on 4 February 2019).
  47. Torque. Bosch ESP Development. News Powered by Cision. 29 October 2014. Available online: http://news.cision.com/torque/i/bosch-esp-development,c1573803 (accessed on 4 February 2019).
Figure 1. Distribution of cars in the dataset by: (A) price, (B) engine displacement, (C) fuel type, (D) mass, (E) engine/motor power, and (F) production year. Note the y-axis scale difference between the two rows of plots. The distribution of cars by the remaining eight characteristics is presented in Figure S1 of the SI.
Resources 08 00058 g001
Figure 2. Steps in the statistical analysis and corresponding results (to the right of the figure).
Resources 08 00058 g002
Figure 3. Average historical penetration of established ECS in new cars: (A) cruise control (CC)–representing comfort ECS, (B) electronic stability program (ESP)–representing safety ECS, (C) navigation system (Navi)—representing information/communication ECS, and (D) stop-start system—representing fuel efficiency/emission control ECS. The curves are accompanied by a gray ribbon corresponding to the 95% confidence interval (CI) of the mean. In this case, the gray ribbon is almost invisible, due to the CI being very narrow. Figure data are presented in the SI Table S3.
Resources 08 00058 g003
Figure 4. Average historical penetration of emerging automobile ECS in new cars: (A) parking pilot, (B) traffic jam assist, and (C) highway autopilot. All ECS are cross-functional, integrating other ECS. The gray ribbon represents the 95% confidence interval (CI) of the mean. Figure data are presented in the SI Table S3.
Resources 08 00058 g004
Figure 5. General trend in ECS integration in new cars. The y-axis represents the levels of car automation as defined by SAE International [24] and the x-axis represents the approximate year in which the ECS was first introduced. Data sources [8,25,40,41].
Resources 08 00058 g005
Figure 6. Historical integration trends for the ESP and its subordinate ABS in new cars. The dotted red line above presents the combined penetration of the systems (ESP or ABS), the starred dark-blue line represents the penetration of the ESP (including ABS) and the diamond light-blue line represents the penetration of the single version of the ABS (ABS alone). The vertical dashed red lines indicate the year in which the ABS and the ESP became mandatory for new car types and all newly registered cars (all new reg.). The vertical dashed gray line marks the 30th anniversary of the ABS. Figure data can be found in the SI Table S3.
Resources 08 00058 g006
Figure 7. Importance of car characteristics for estimating the presence of established automobile ECS: (A) cruise control (CC), (B) electronic stability program (ESP), (C) navigation system (Navi) and (D) stop-start system. Variable importance is given relative to the maximum. A value close to one indicates an important variable. The most important variables are displayed in darker shades of blue. MA = Model Accuracy.
Resources 08 00058 g007
Figure 8. Relationship between car characteristics and the presence of the cruise control system (CC) in new cars. The blue lines represent the smoothing splines fit to each predictor after a Logistic GAM: (A) price, (B) mass, (C) production year, (D) engine displacement, (E) engine/motor power, (F) fuel type. The red dotted lines correspond to the confidence interval of the estimated function. The scale of the y-axis corresponds to the model transformation of the response variable and it is not given in the units of the response; the value in parenthesis indicates the degrees of freedom of each function (smoothing spline). The model’s validation accuracy was equal to 0.70.
Resources 08 00058 g008
Figure 9. Relationship between car characteristics and the presence of the stop-start system in new cars. The blue lines represent the smoothing splines fit to each predictor after a Logistic GAM: (A) price, (B) mass, (C) production year, (D) engine displacement, (E) engine/motor power, (F) fuel type. The red dotted lines correspond to the confidence interval of the estimated function. The scale of the y-axis corresponds to the model transformation of the response variable and it is not given in the units of the response; the value in parenthesis indicates the degrees of freedom of each function (smoothing spline). The model’s validation accuracy was equal to 0.87.
Resources 08 00058 g009
Figure 10. Average predicted penetration of the cruise control (CC) in the validation set by the car’s: (A) price, (B) mass, (C) production year, (D) engine displacement, (E) power, (F) fuel type.
Resources 08 00058 g010
Figure 11. Average predicted penetration of the stop-start system in the validation set by the car’s: (A) price, (B) mass, (C) production year, (D) engine displacement, (E) power, (F) fuel type.
Resources 08 00058 g011
Table 1. Electronic control systems (ECS) selected for analysis.
Selected ECSDescription/Function
Group AEstablished ECS frequently embedded in cars
CCComfort
ESPSafety
ABSSafety
NaviInformation/Communication
Stop-startFuel efficiency/Environmental emission control
Group BEmerging ECS building upon ECS in group A
Traffic jam assistCross-functional
Parking pilotCross-functional
Highway autopilotCross-functional
CC: cruise control, ESP: electronic stability program, ABS: antilock-braking system, Navi: navigation system, Stop-start: stop-start system.

