1. Introduction
The liberalisation of electricity markets in Greece has not been accompanied by the appropriate development of competition in the generation and procurement, as in other European countries. The electricity market liberalisation in Greece is a much-delayed case. The procedures for the liberalisation started in 1999 with the institution of the Regulatory Authority for Energy (RAE) and the Transmission System Operator (TSO) and the authorisation of the first private producers. Following this, it took years to decide on the desired electricity market model, and the Power Public Corporation (PPC) continued its dominant role in electricity generation [
1]. However, the new markets introduced, according to the new Code Management System and Power Exchange, having set new rules for the operation of the deregulated electricity market, aim to ensure the quality and reliability of supply to consumers and long-term power adequacy. This new framework has only lately started to contribute to the development of competition in the previously, in reality, intensely monopolistic electricity market in Greece.
The PPC has a significant advantage over any potential competitors. This is due both to its easy access to lignite and to its long-term participation in primary energy markets (lignite, gas and oil). Until recently, the private sector could not operate in the Greek electricity market. The main reason for this was the PPC’s dominant position and the protection that PPC earned from the State. Other barriers were the lack of an institutional framework for the determination of electricity market opening conditions and the lack of an “independent” system operator, together with the hesitation of investors to be involved as retailers or aggregators. The promotion of Renewable Energy Sources (RES) started during the 1970s in the EU. The main reason for the support and promotion of renewable energy was to reduce the dependence of European countries on fossil fuels and to cover their energy needs. With the gradual replacement of fossil fuels (the Greek case is shown in
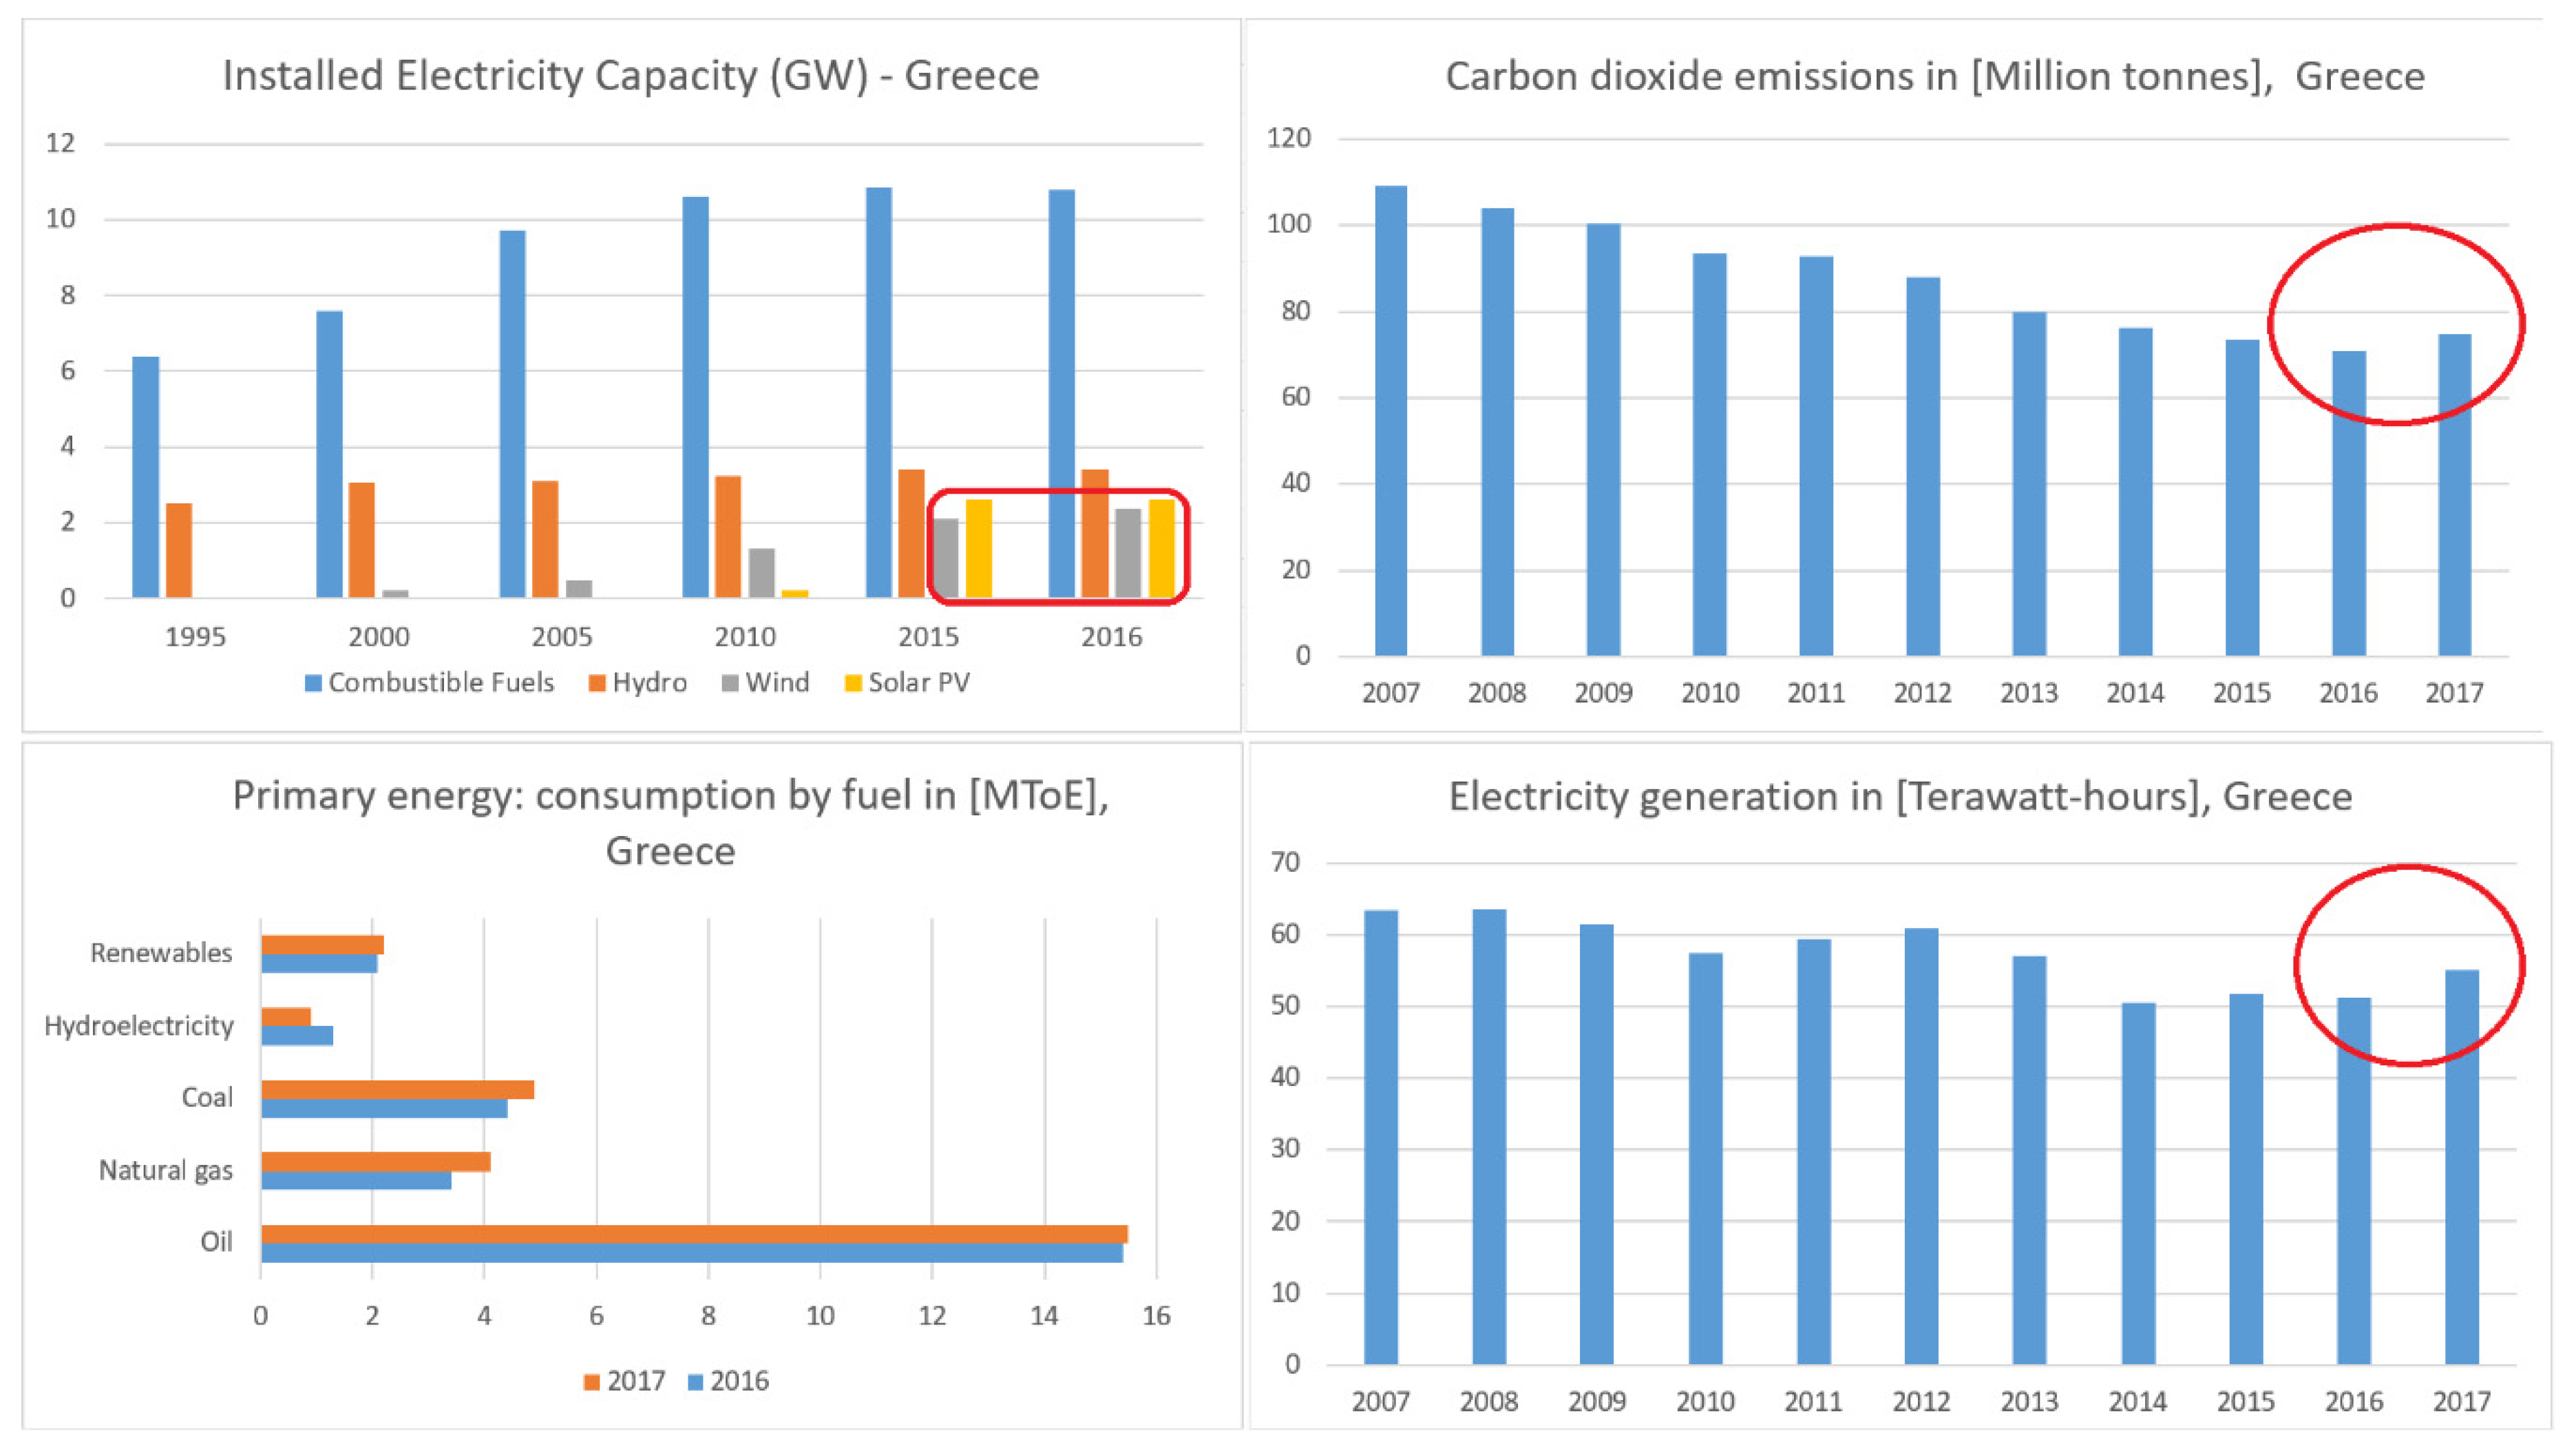
Figure 1), European countries realised that this way would have reduced risk from an upcoming oil crisis [
2,
3,
4]. The installed electricity capacity, the generation, the consumption by fuel and the CO
2 emissions in Greece are shown in
Figure 1. It can be seen that after 2015 wind and especially solar PV have occupied significantly more space than 5 or 10 years ago. It can also been seen that because of higher electricity generation, CO2 emissions have again increased in 2017 compared to 2015 or 2016.
A key feature of the most known RES financial mechanism, Feed-in Tariff (FiT), is that the market operator is obliged to buy the electricity generated by the renewable energy source paying a specific amount per kWh to the Independent Power Producer (IPP). The IPP provides the generated electricity at a specific price that was predefined by the State for a given time period in Greece for 20 years. A variation of Feed-in Tariff is the Feed-in Premium (FiP). Under the frames of the operating aid mechanism for RES, the FiP tool is in the form of a fixed price, defined by the government, that is paid in addition to the marginal price, to the IPP owner. The income that the generators receive is not fixed, as in the case of Feed-in Tariffs, as it depends on the System Marginal Price (SMP). The FiPs, therefore, are more “market integrated”, as they depend on the market dynamics. However, the fixed-price Feed-in Tariffs are still the most known support and promotion scheme of RES worldwide [
5,
6].
FiPs are considered policies, which encourages competition between both conventional sources and RES. This is based on the design of FiP policies as all generators sell their electricity in the spot market and thus compete against one another, which means lower electricity bills for the end-users. However, such policies demonstrate greater risk for the investors as there is no purchase guarantee for their electricity, imposing significant risks for the investors (and eventually the grid), who are always on the look-out for higher levels of compensation per kWh of electricity generated.
Despite the fact that researchers are already proposing new schemes that implicate end-users [
7,
8], and have already proposed various markets set-ups [
9,
10], the authorities still work only with the mandatory pool and the Day-Ahead Market.
The current model, however, has only created issues related to high electricity prices, delays in payments for the IPPs and strong associations to market regulation. In practice, payments are delayed due to relatively high tariffs which may have led the country to an increase in renewable energy source capacity, but at the same time, due to the weak economy overall, created these delays in the compensation of IPPs. Furthermore, the average SMP for 2011 was 74 €/MWh when the renewable Fixed Feed-in-Tariff generators received an average of 150 €/MWh [
11], a huge difference that jeopardised the sustainable operation of the Greek grid in the future. Taking into account the problems of the Greek wholesale electricity market (payment delays), the MoUs that the country has agreed on with the European Union (one of the requirements is the liberalisation of the electricity sector, reforming the renewables compensation mechanism) and the renewable investments that are needed until 2020 for instance, Greece has a commitment for 7500 MW of installed wind power by 2020. In 2018 this number was still lower than 3000 MW [
12], which makes the obligation for reforming the structure of the electricity markets and the compensation mechanism crucial factors for the Greek electricity sector and the Greek economy in general.
2. Methodology
The FiP policy can be separated into two main subcategories. The first refers to a scheme in which the premium added on top of the SMP always remains constant. For that reason, this scheme is called constant FiP. One major drawback of this scheme is that it can lead to significantly higher payment levels, thus making the policy more expensive to implement. Furthermore, these higher payments can distort the fair competition in the market as they can skyrocket the profits of renewable energy sources project owners [
13,
14].
The other option of FiP was introduced initially in Spain with the RD 661/2007 (Royal Decree published, which regulates the production of electricity) [
15].The system operator of the country, in order to avoid the overcompensation risk of the renewable generators in times of high demand, introduced the “caps and floors” system which turned the added premium into a variable that could rise when the electricity prices are falling and could be decreased when the prices increase. In this system the “floor” is the lowest “guaranteed” payment that the generators will receive. That “floor” combines the SMP that electricity markets clear, plus a premium, while the “cap” system is a price, which the total payment cannot exceed.
The scheme examined in this paper, is the “caps and floors” FiP. The lower price that the generator will receive is 40 €/MWh and the highest price will be 80 €/MWh. Based on the above, the producer will receive in €/MWh:
where the SMP is the System’s Marginal Price. The net annual electricity generated,
Net AEP, will be
where
ExCF is the exergetic capacity factor of the wind or PV park,
Ci is the capacity of the plant, and 8760 is the total hours throughout the year, according to [
16]. Therefore, taking into account all the initial capital,
Ic and the amortisation costs,
Ao, the annual revenue,
Ro, will be equal to
For simplicity reasons, we investigated only the final compensation that the RES producer will receive. In order to test the FiP policy, two renewable energy projects, a 10 MW wind park and a 2 MW solar PV park were introduced. These investments were tested for capacity factors (CFs) 22% to 32% for the wind farm and 19% to 25% for the solar PV, which are typical average CFs in the Greek territory. For each technology, the viability of the investments was estimated.
In order to have a better picture of the performance of the investments, the Complete Payback Period was calculated each time using linear interpolation when the Net Present Value equaled zero. In addition, a viability criterion for each technology was set in order to be able to separate the investments that were more attractive for an investor from the ones that were not.
In order to attempt the capture of the essence of the free wholesale electricity market by investigating the performance of the investments in some specific cases, the methodology included the assumption that the investor would manage to sell his generated electricity at 100%, 75% and 50% during the participation period at the market. An extension was, in addition, considered on the duration of the contract from 20 to 25 years.
3. Results
3.1. Scenario of a 10 MW Wind Farm under the FiP Scheme
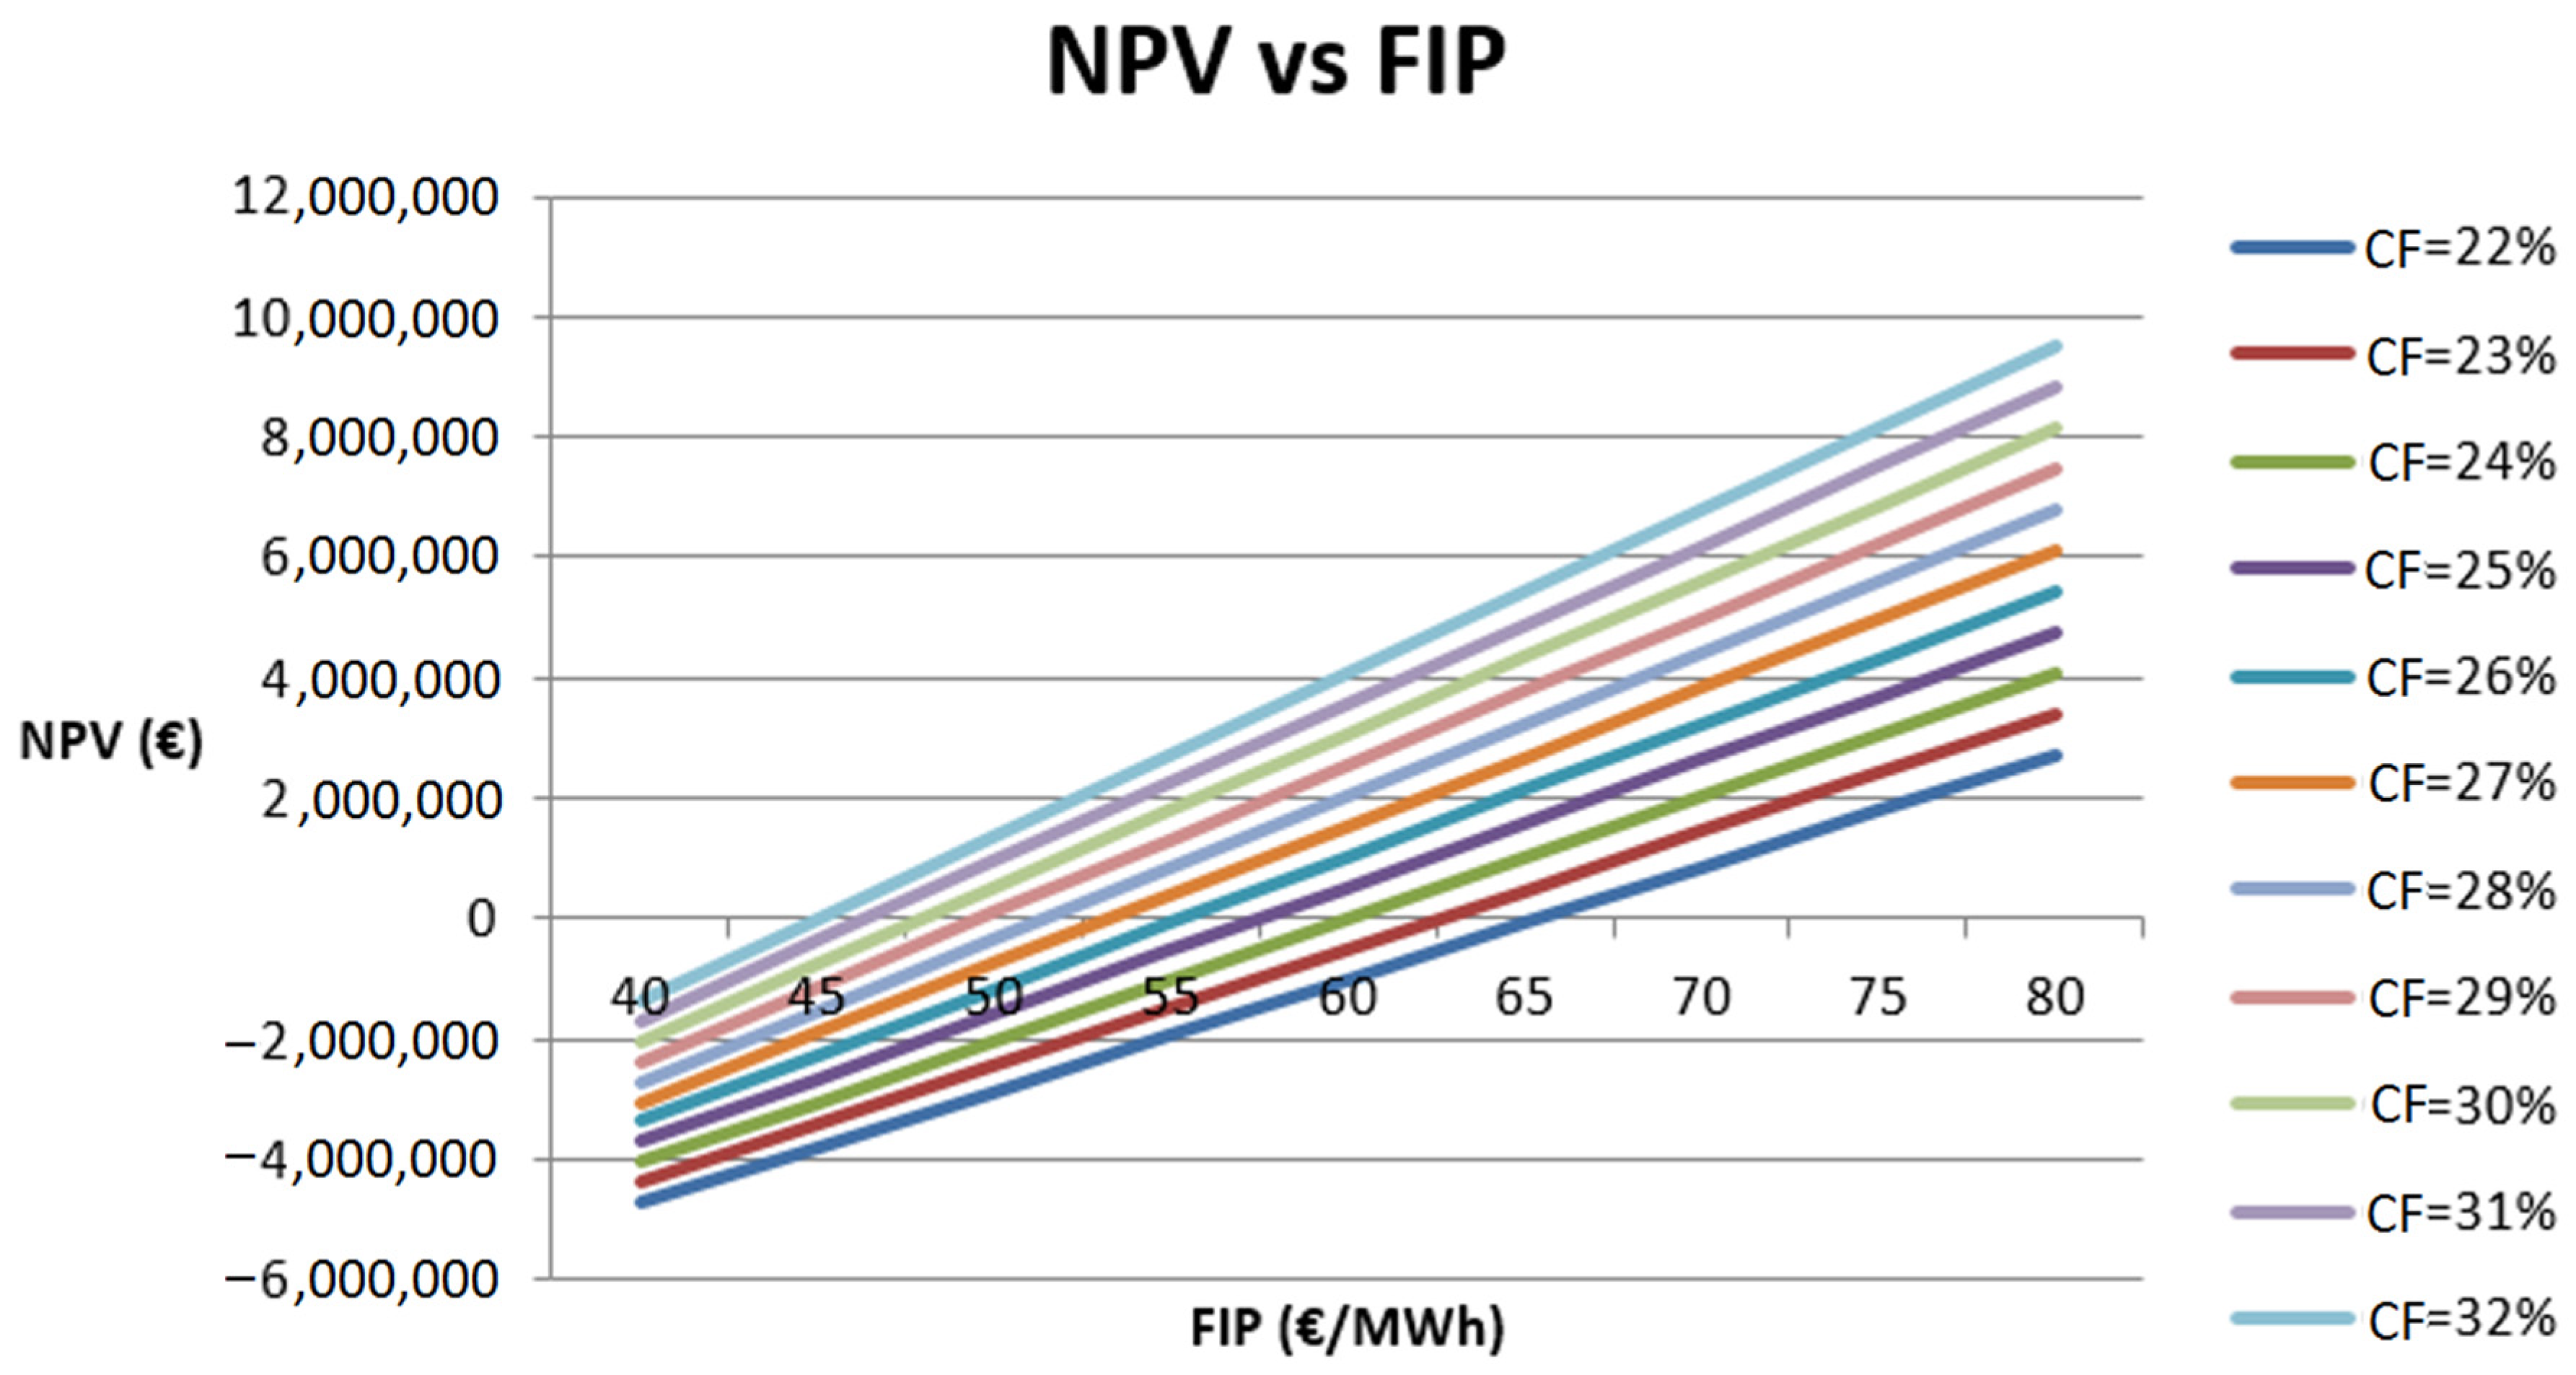
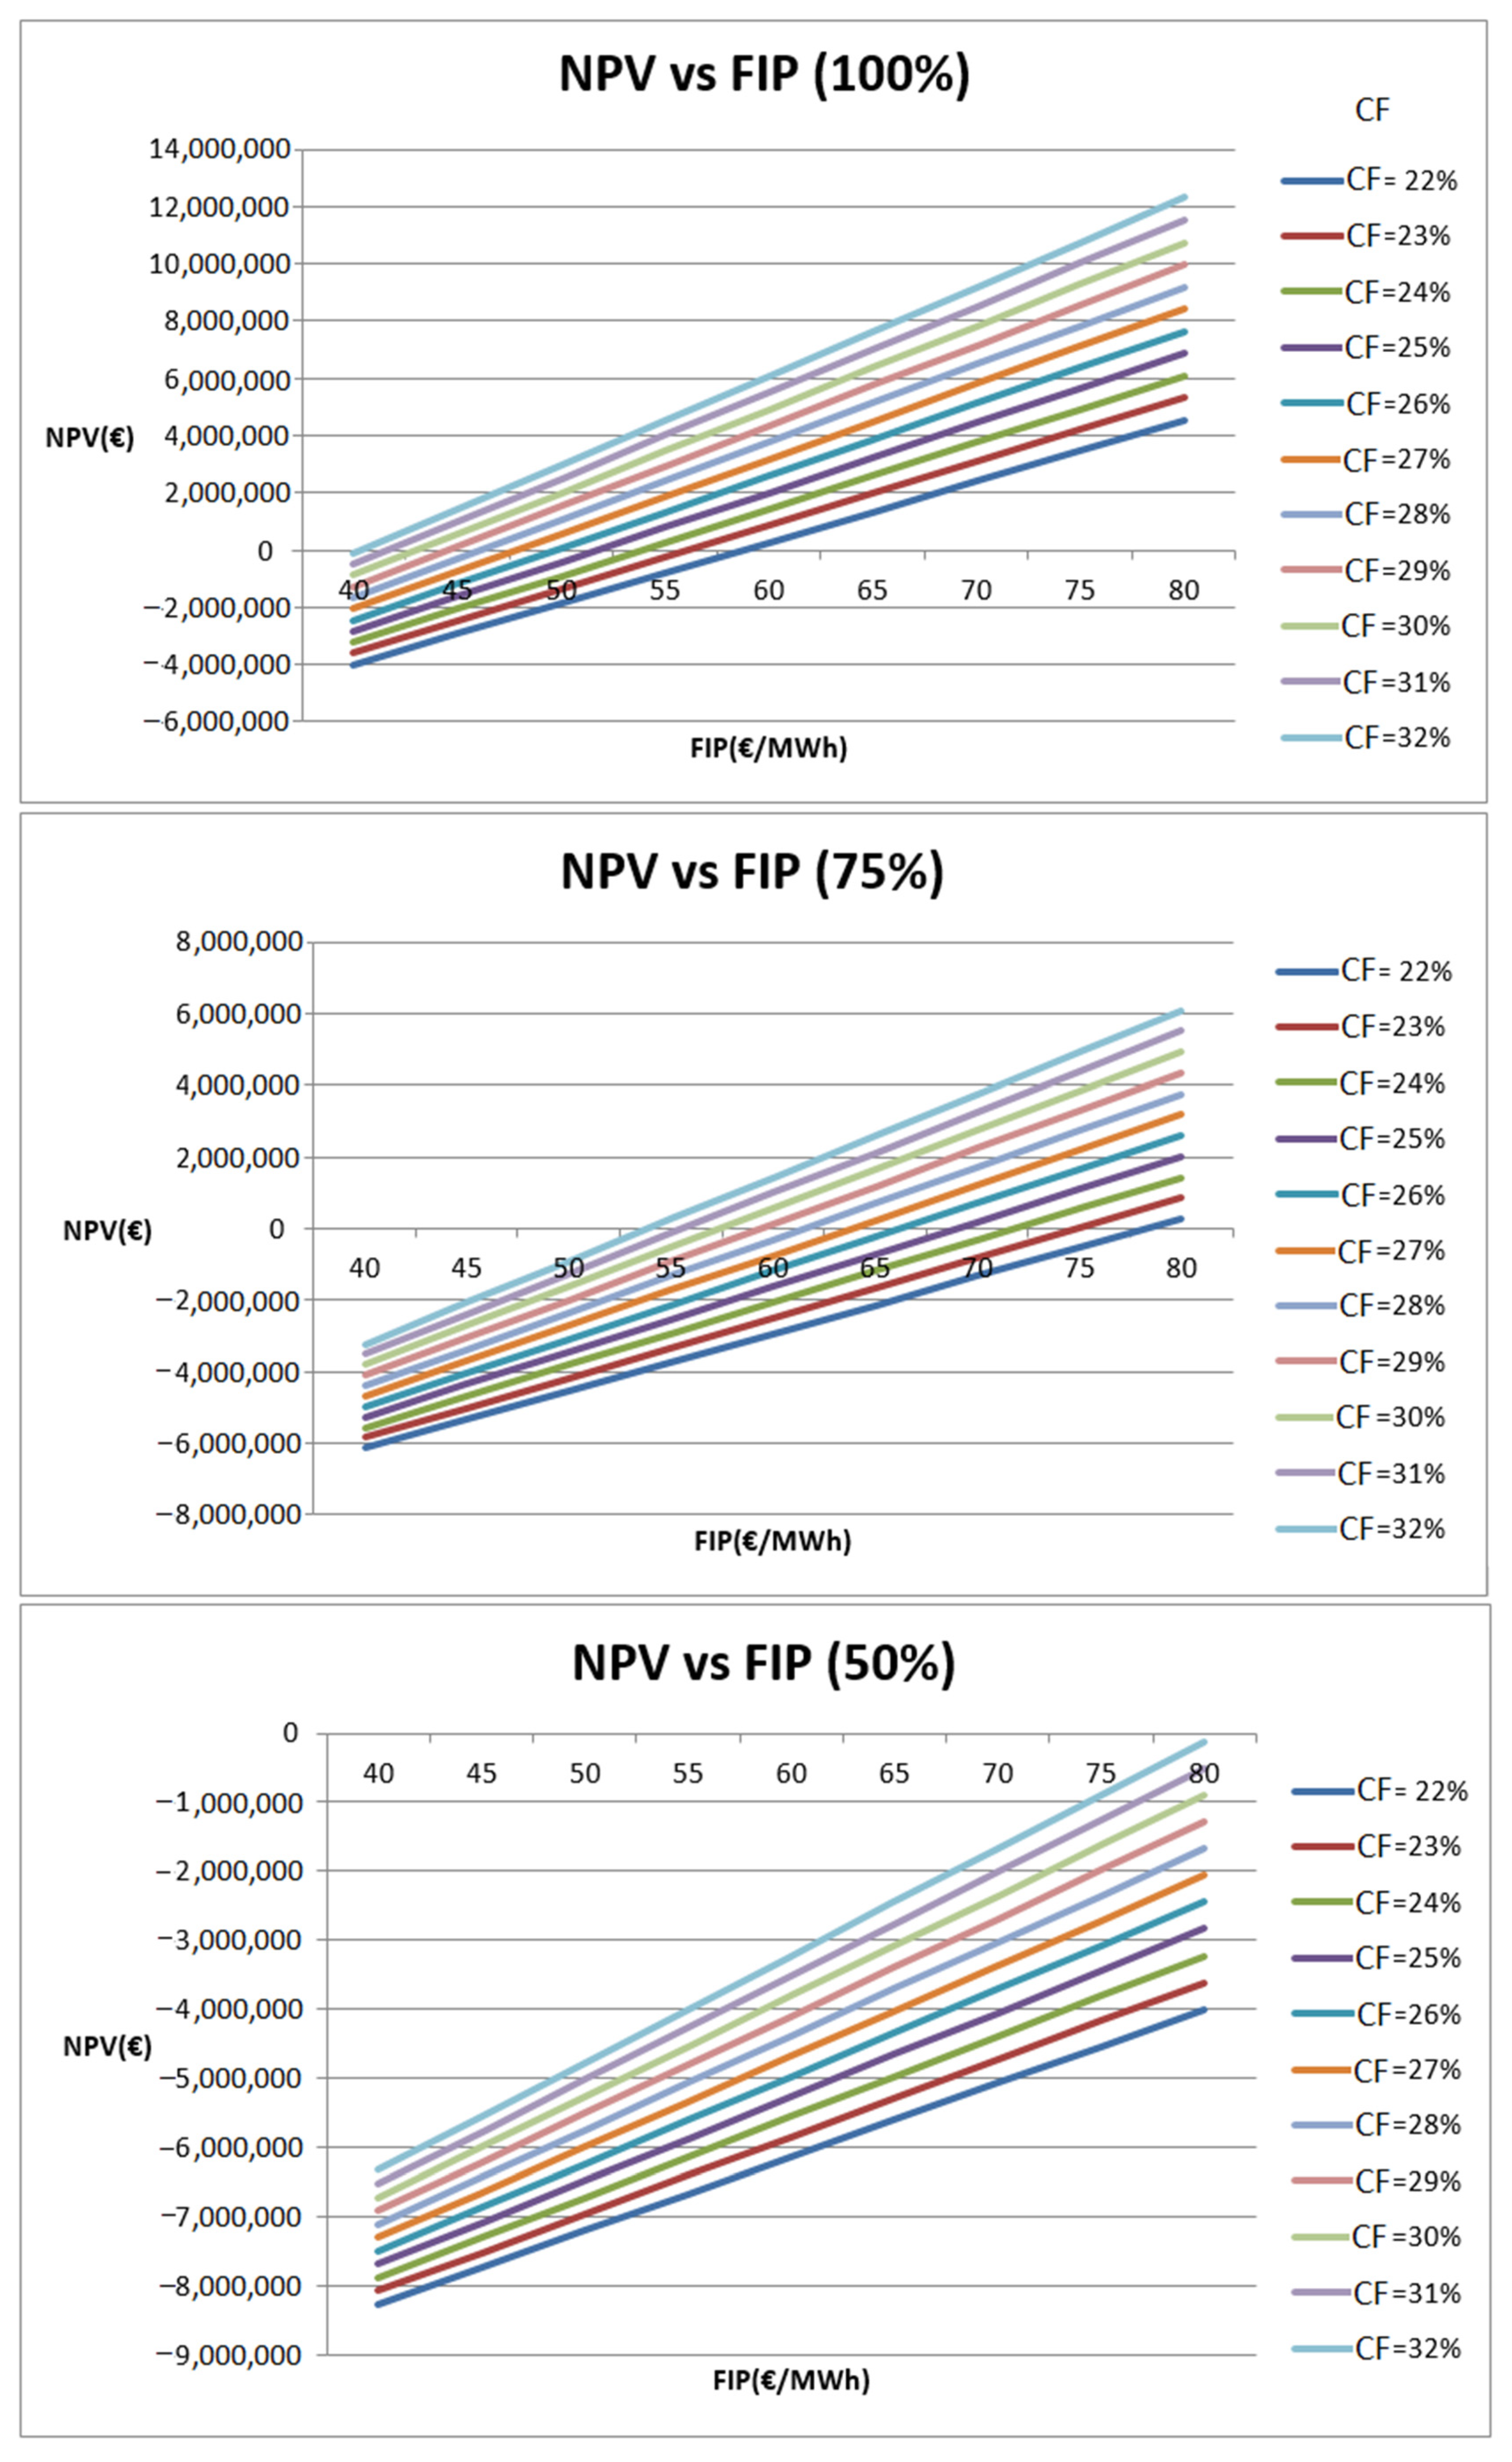
For this purpose, a consideration of an average SMP and the corresponding premium for the investor in the range of 40–80 €/MWh (with a step of 5 €/MWh) was taken into account along with the net CFs in the range of 22% to 32%. The investment was tested under no state subsidisation and the assumption was that the investor managed to sell 100% of the generated electricity to the spot market.
Figure 2 shows the profitability of the investment under the proposed scheme. Wind farms with different CFs became viable at different FiPs. A wind farm with a 32% CF became profitable at 45 €/MWh. Under the same reasoning a wind farm with a CF of 22% became viable only for a FiP at 70 €/MWh.
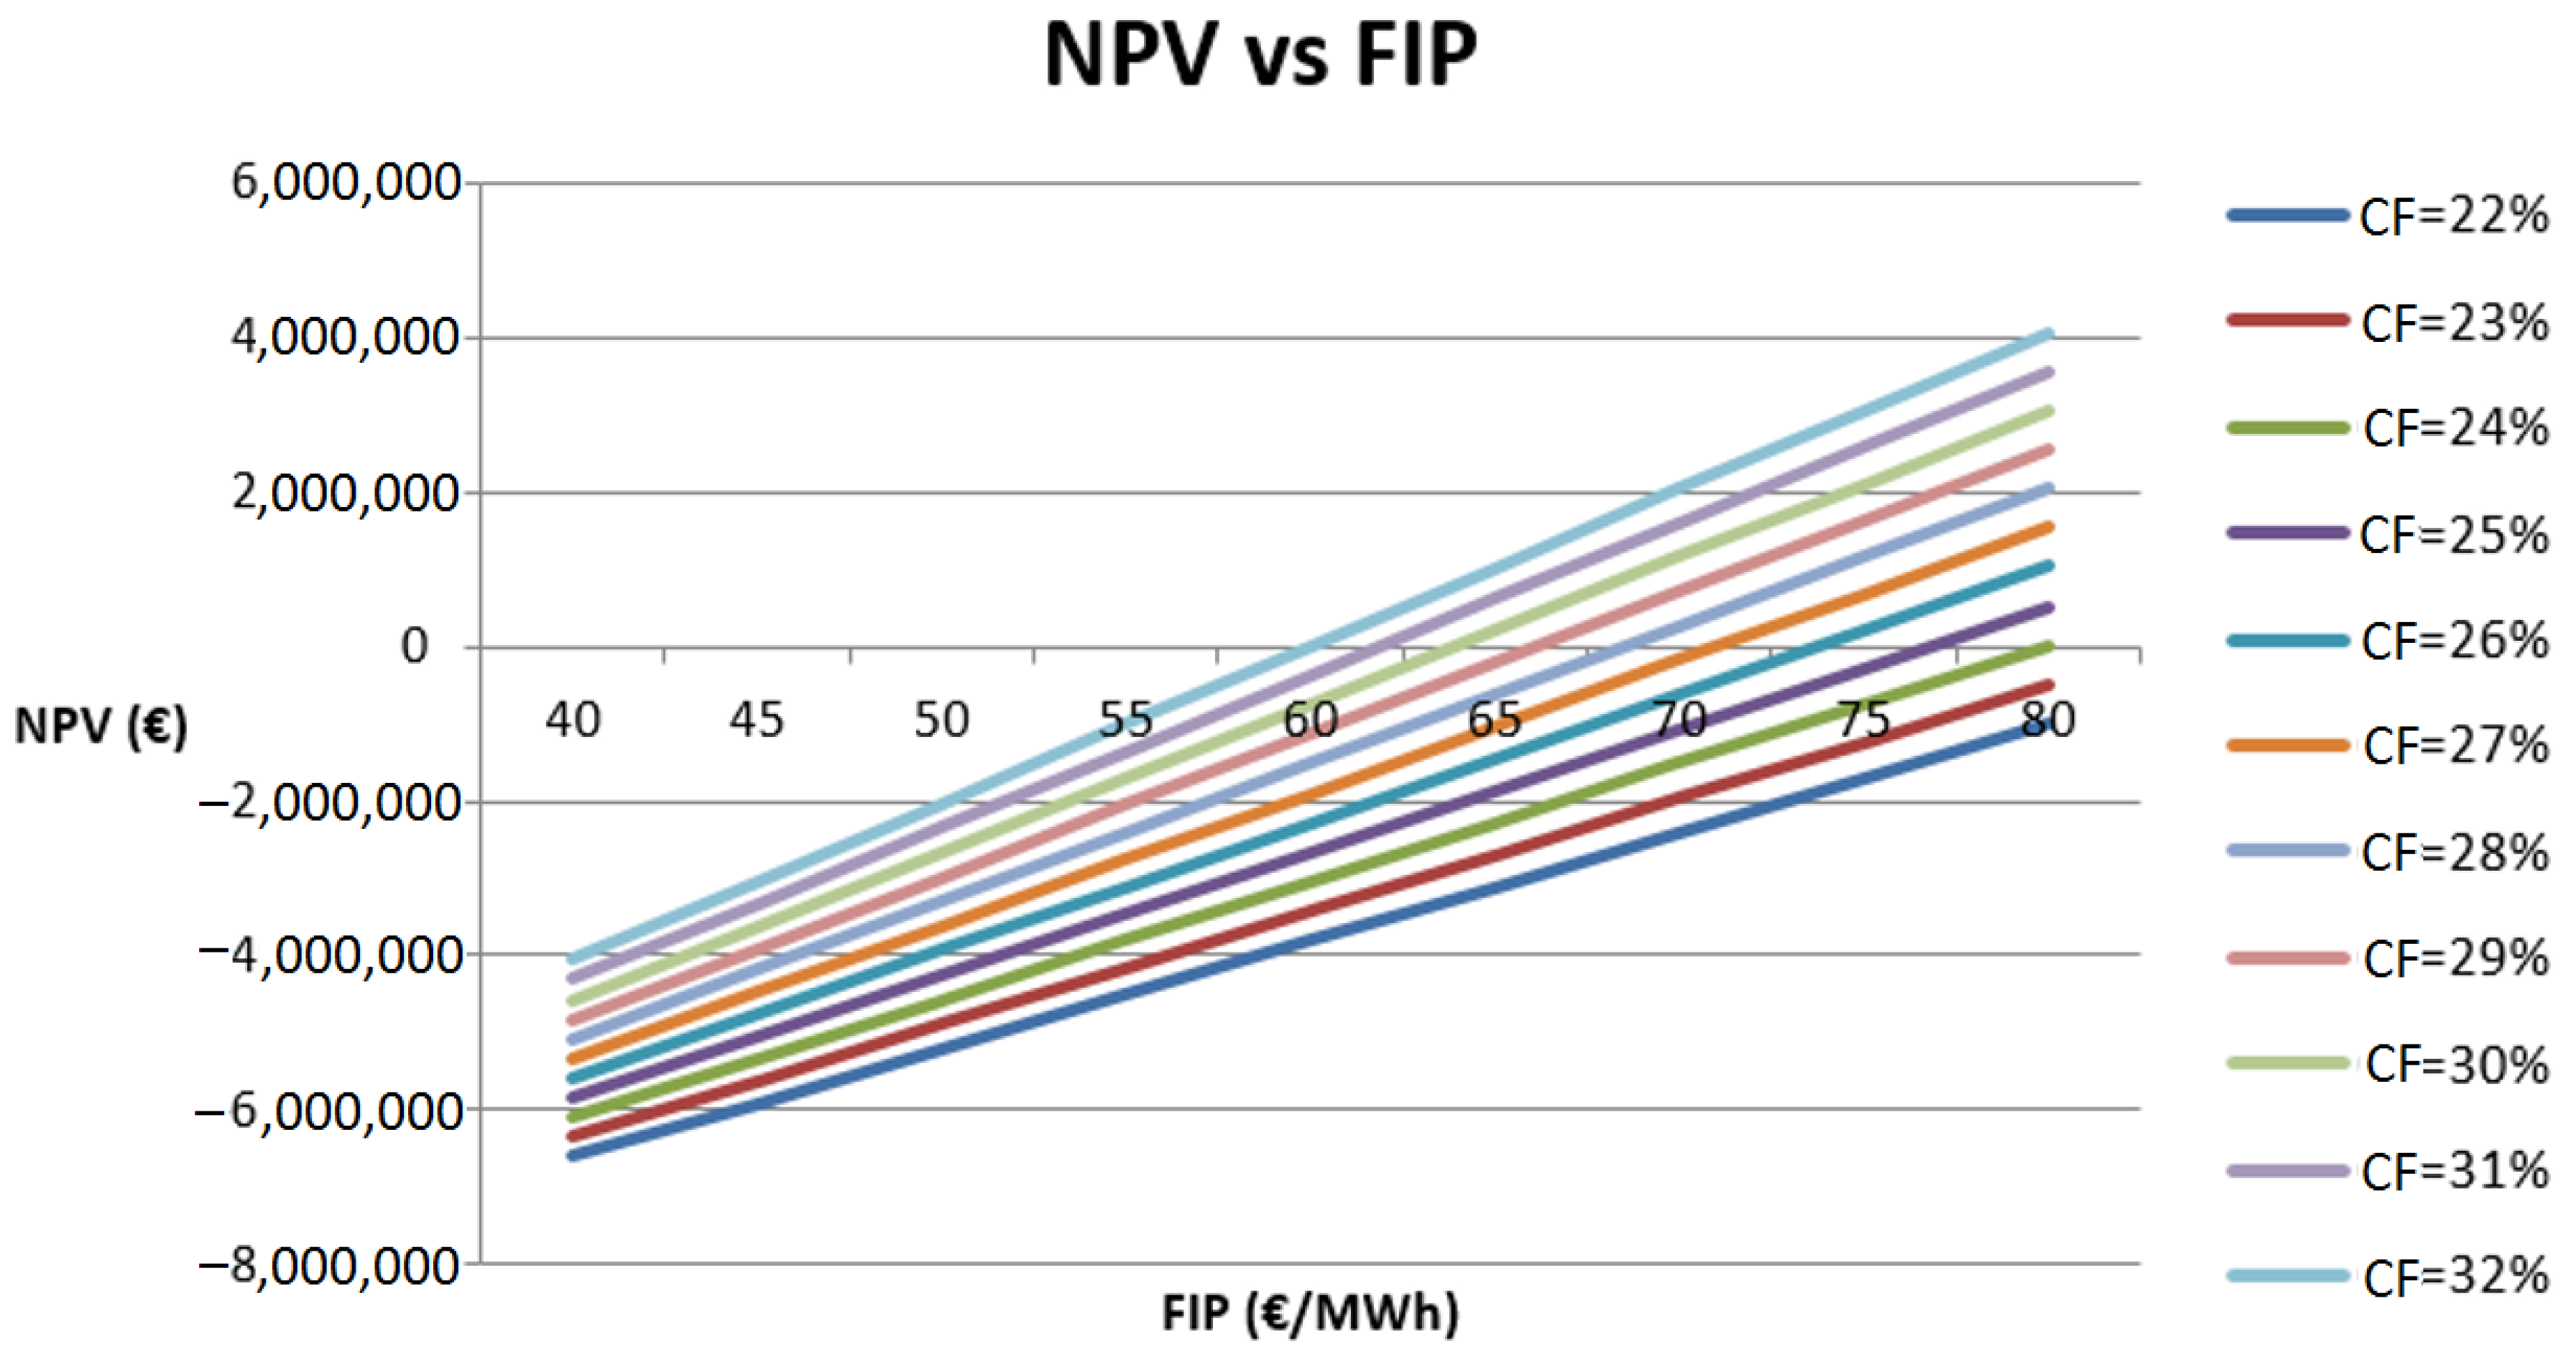
If 75% was successfully sold to the market the Net Present Value (NPV)–FiP relation diagram is shown in
Figure 3.
With 75% being successfully sold to the market, projects with 22% to 23% CF failed to be profitable (even at 80 €/MWh).
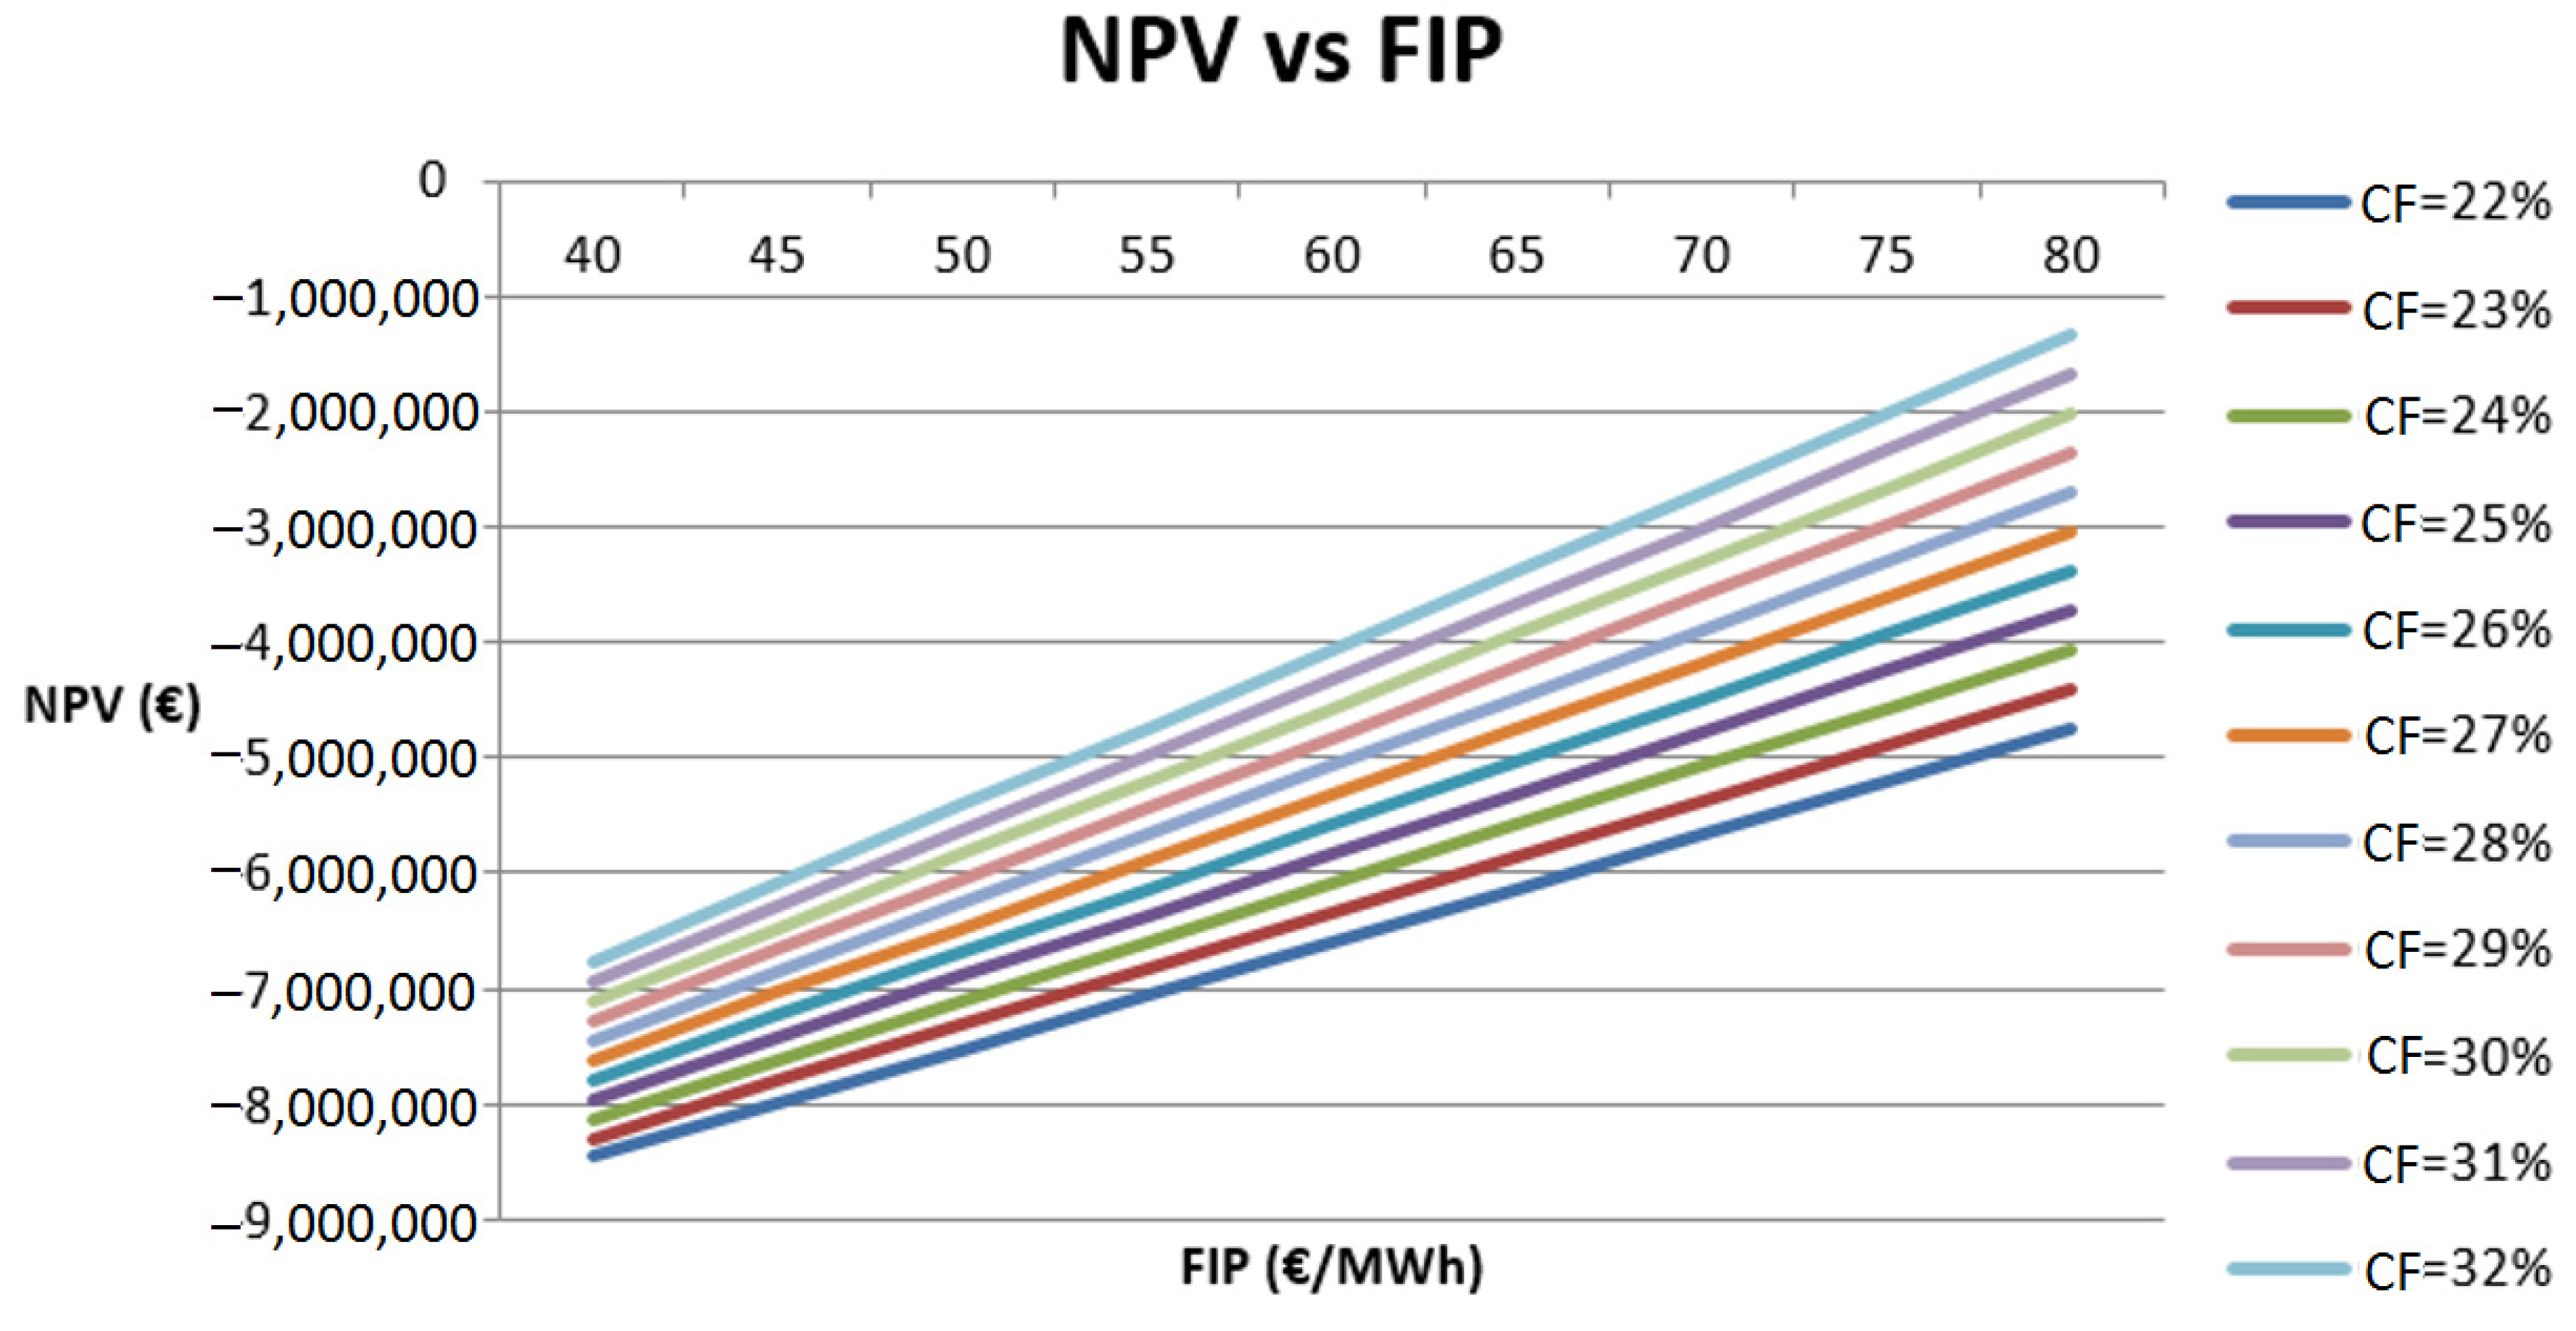
If 50% was successfully sold to the market the NPV–FiP relation diagram is shown in
Figure 4.
This time, results show that all were unprofitable scenarios for the wind farm as the NPV for all CFs were negative. The payback period was zero, meaning that the investor would never receive back his initial capital.
However, what happened in the three cases when the contract period increased from 20 to 25 years (since this is a scenario discussed, in order to convince investors to break the FiT contract and participate in the new market structure and the use of FiP)?
It can be seen (
Figure 5), when there were grounds for high selling (75% or 100%), that share profitability increased significantly, especially for high CF wind projects. For instance, for 32% CF for 20 years and 75%, the NPV was 4 M€; for 25 years, it became 6 M€. In another example, for 24% CF for 20 years and 100%, the NPV was 4 M€; for 25 years, it became 6 M€. For 50% successful selling in the market, though, NPV remained negative and no investor would proceed with installing a wind turbine knowing that a recapitalisation would never succeed.
It is acceptable that in weak grids, where grid infrastructure remains outdated (no smart meters, no new transmission lines, little or not at all end-user participation), curtailment rates will be increased. They will also be increased due to integration limits and other reasons. For instance, in Germany, when wind energy should be curtailed, imports switch off first; therefore, wind energy coming from Denmark is often not needed, and investors in central Denmark often see their wind farms disconnected [
17,
18]. This new situation influences NPV and therefore the income and payback period of investors. Therefore, high selling shares are required for investors considering leaving the FiT contract and participating in the new market.
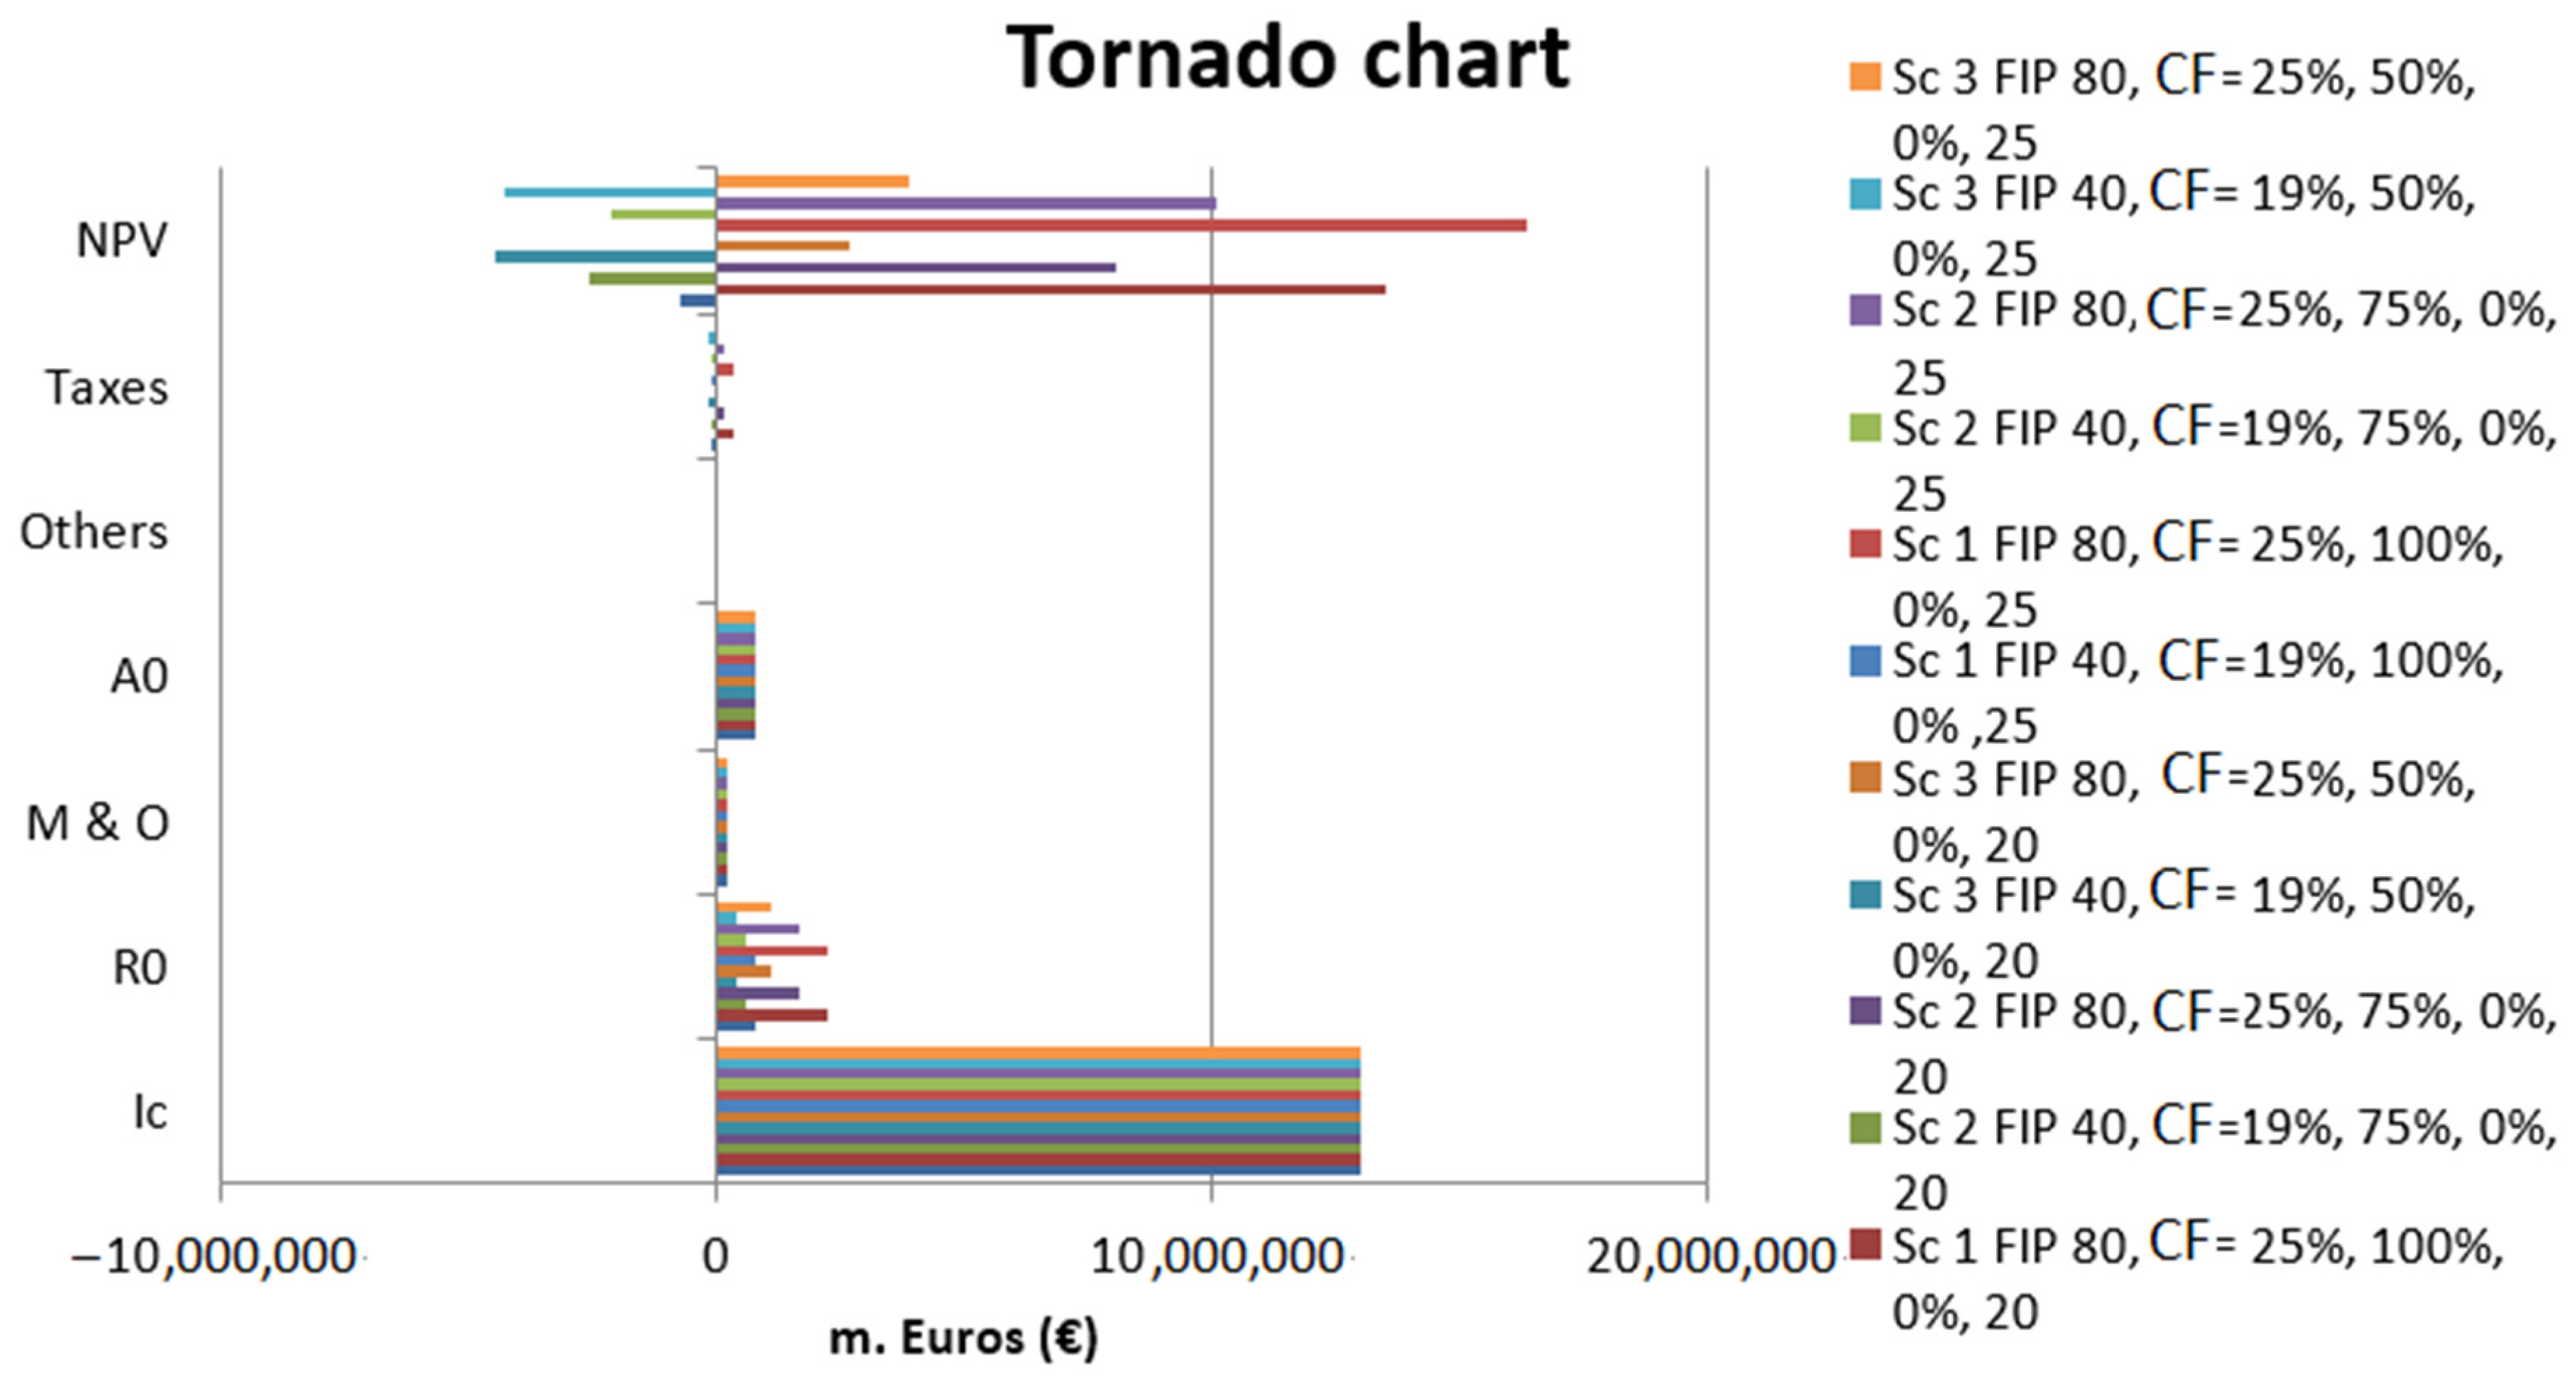
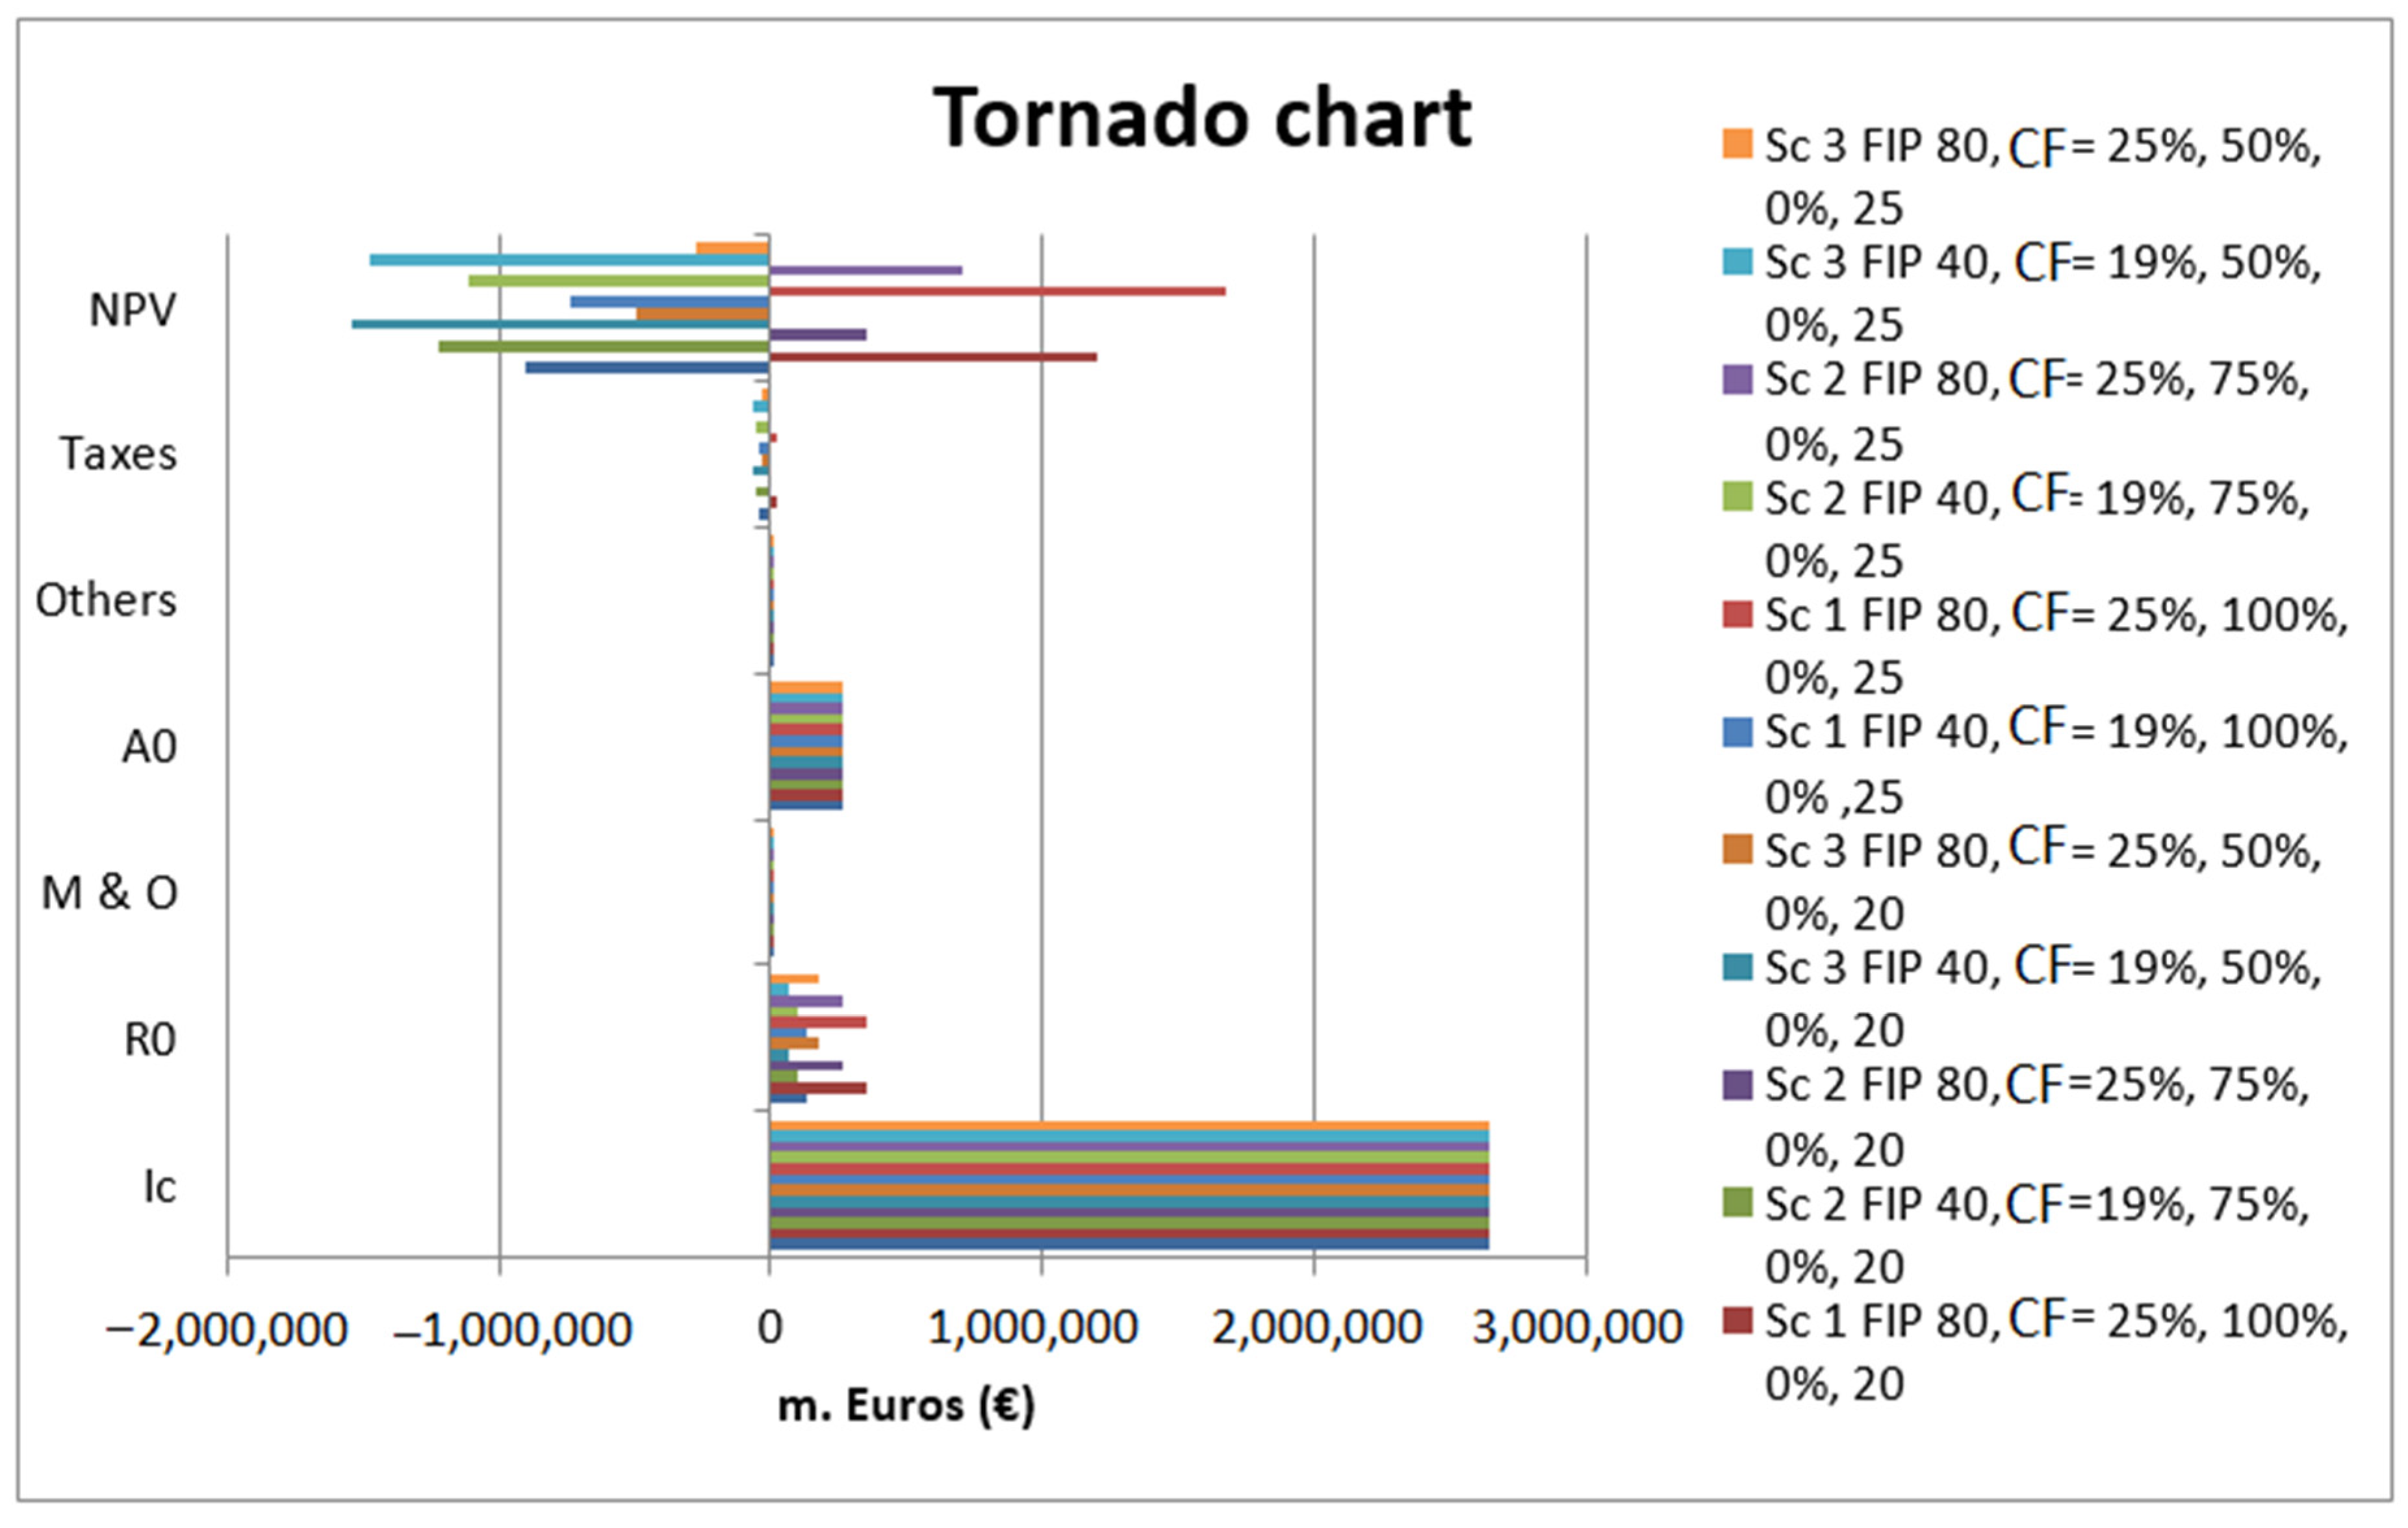
A sensitivity analysis was conducted including the scenarios investigated. A tornado chart (
Figure 6) compares, economically in one diagram, the results for 20 and 25 year contract durations.
The sensitivity analysis showed that the factors influencing the final profits of the project in all scenarios were found to be the taxes, the maintenance and operation costs, the amortisation costs and the state taxes. The most significant impact however, on the final profits was made by the sale price of electricity.
3.2. Scenario of a 2 MW Solar PV Park under FiP Scheme
This section includes the extension of the duration of the solar PV park operation from 20 to 25 years in order to evaluate alternative business development plans. The analysis was conducted for no subsidisation options and three rates of success (100%, 75% and 50%) for sales of generated electricity to the market. After all, since Greece has achieved the 20
–20
–20 targets (the National Action Plan) for PV installation since 2013, solar curtailments are common [
18].
For utility-sized PV plants (this specific case study was focused on a 2 MW PV park), recent studies have shown that the PV projects’ capacity factor has significantly increased [
19].
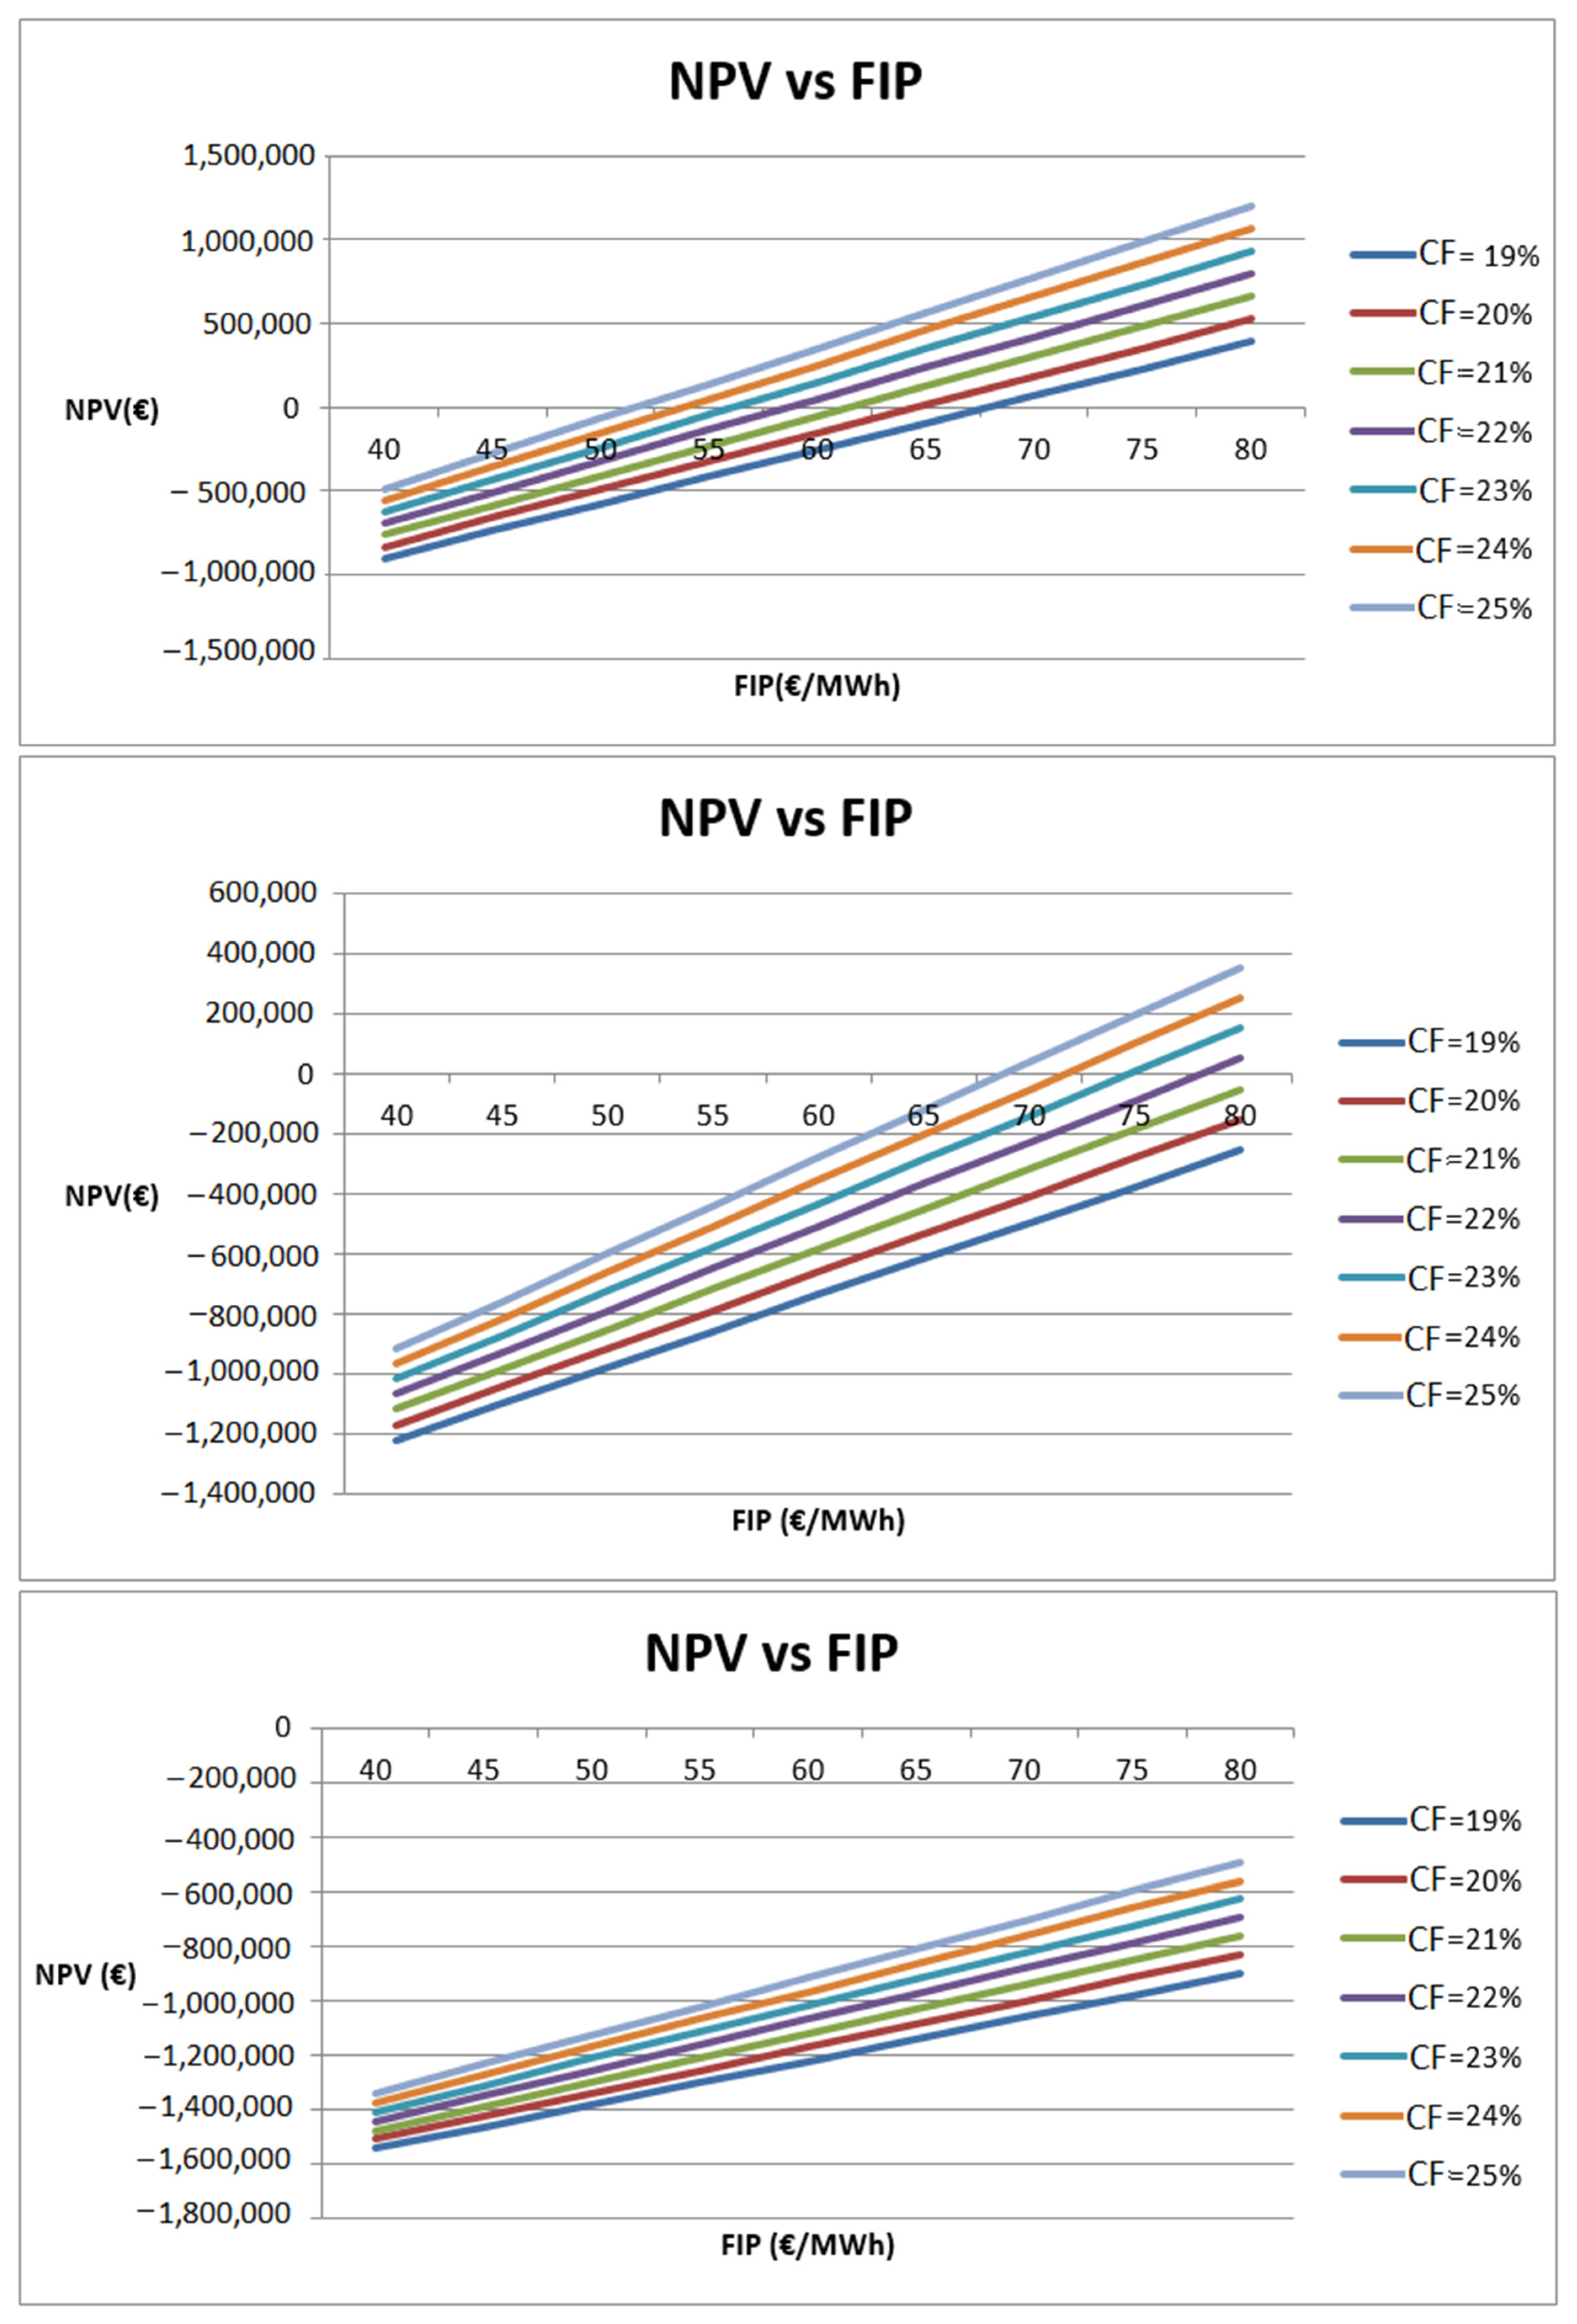
Following the same analysis implemented for the wind farm, and taking into account that the investment was under no state subsidisation and that the investor managed to sell 100%, 75%, and 50% of the generated electricity to the spot market, the results of the NPV for various CFs in relation to FiP (for a 20 years contract) are shown in
Figure 7.
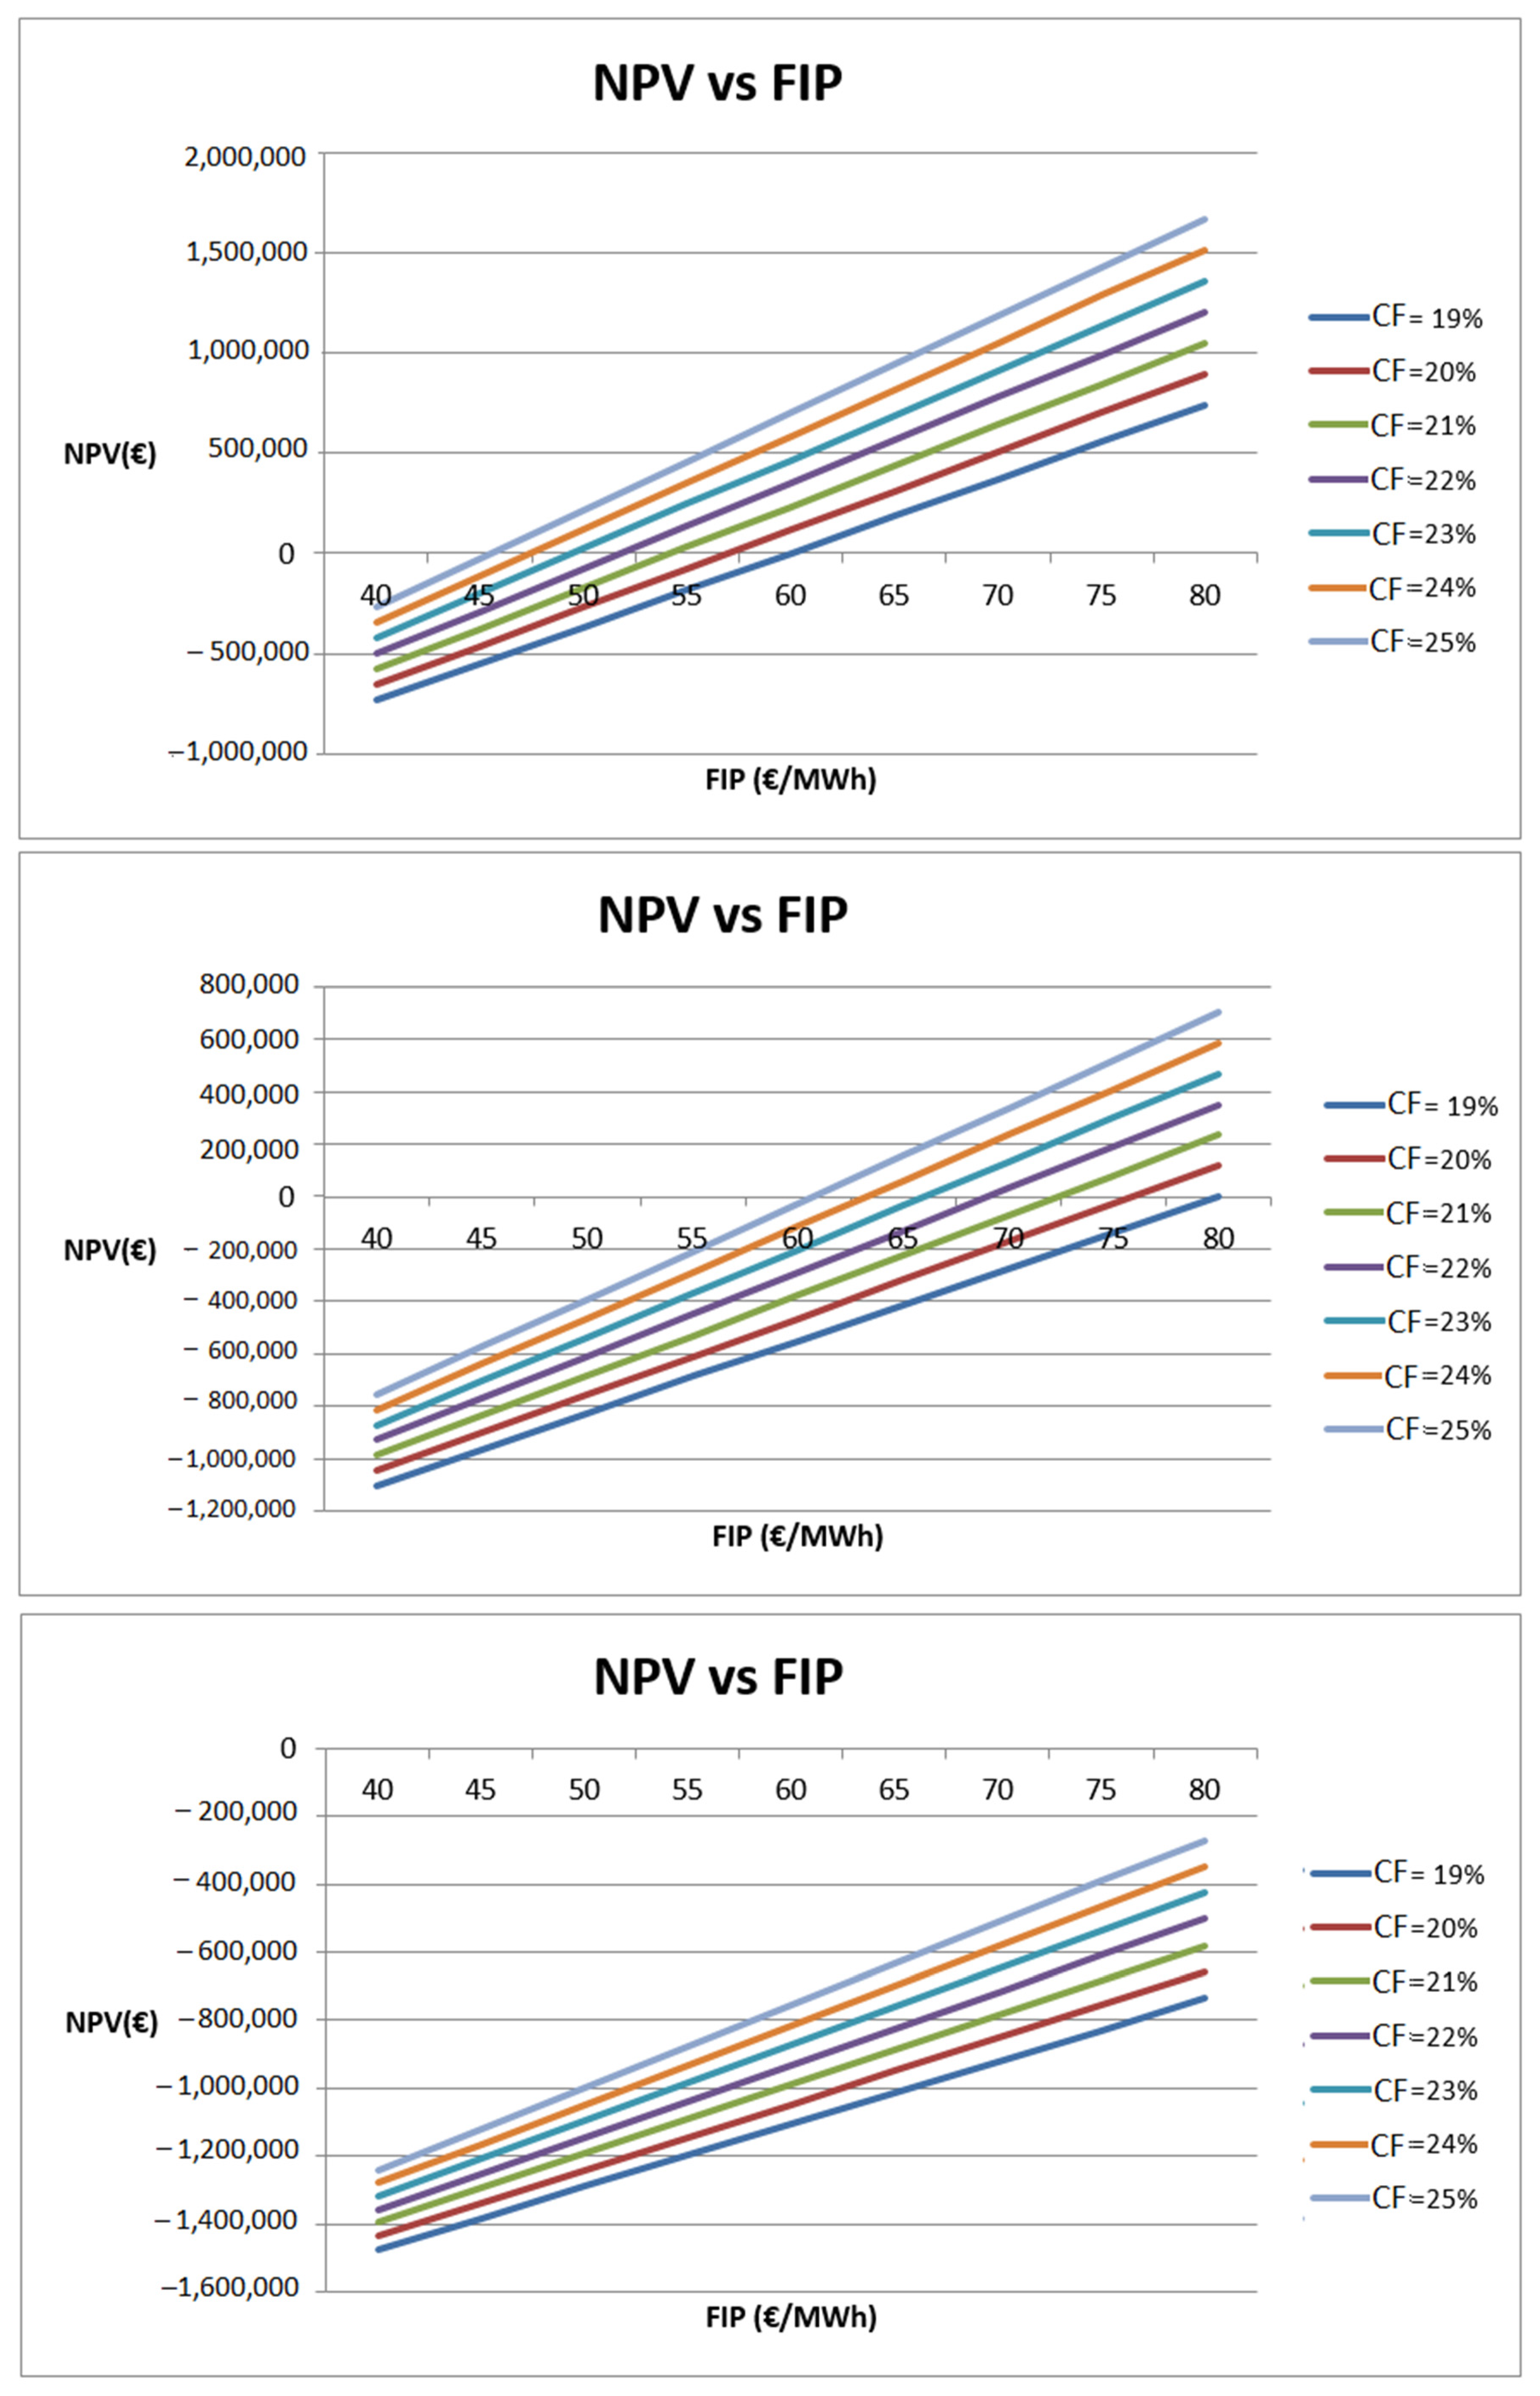
Regarding the licence extension for 25 years, for the 100% scenario, the project analysis showed that profitability was ensured for different FiPs (
Figure 8). Specifically, the project with capacity factors of 19% to 20% became viable at 60 €/MWh. Higher capacity factors made the project profitable at 50 €/MWh. For the 75% scenario, the project with the lowest capacity factor became hardly profitable at 80 €/MWh, while the project with the highest capacity factor became profitable at 60 €/MWh. In the last case, for the 50% scenario, the project did not manage to be profitable for any FiP. It can be seen that, especially for the 100% scenario, there was a significant difference in profitability between the 20 and 25 year contracts. For the 25% CF and 20 year contract, the PV project became viable at 52 €/MWh, while for the 25 year contract, this happened at 45 €/MWh.
A sensitivity analysis was conducted including the scenarios investigated. A tornado chart (
Figure 9) compared economically, in one diagram, the results for the 20 and 25 year contract durations for the PV park.
The sensitivity analysis for the solar PV park showed that the maintenance and operation costs had insignificant effect on the final NPVs in all scenarios. The final NPV values were more sensitive to amortisation costs, taxes and revenues.
3.3. A Multiple Revenue Stream Concept
What has been gaining scientific attention lately is the multiple revenue stream approach. Renewable energy has started to be considered not only as a clean electricity generation method, but as an integral part of smart communities. Since energy demand and the demand response occupy more and more space of the grid operators’ time and the energy services providers offer more and more competitive packages, meeting energy demand with intermittent energy sources on a constant basis comes as the big bet in the industry.
Wind turbines have clearly evolved, and the industry has achieved cost minimisation in manufacturing. The same has happened with the PV industry. The capital cost per installed kW since 2009 has gone down by more than 10 times [
20,
21]. However, since there is a constant need for lowering the marginal price costs for the end-user, it is important that this percentage (0–50% depending on the case) is not completely wasted. A far more viable solution could have been to store and save the not offered (or curtailed) energy to meet the needs of local industry.
For a holistic transformation of the energy system within a smart community concept, a shift towards an integrated energy system is required. A real-time energy demand-based programme via a Food-Energy nexus could integrate the wasted or not selected amounts of energy, producing herbs and leafy products in a hydroponics unit, minimising CO
2 emissions at the same time. The excess or rejected power could be stored and used later when the electricity prices are high. When the electricity prices are high, the proposed system could offer what is required for the plants, and when the electricity prices are lower than usual, electricity could be stored for later use [
22,
23]. A mass deployment of such systems within a city context with intensive participation in Demand Response (DR) programmes from the consumers could definitely increase renewables’ integration and save a significant amount of the power rejected or not offered to the grid.
4. Discussion
Under the current situation, in Greece and many other countries, the FiP policy cannot be fully implemented. Until recently, the investment law in force in Greece did not offer support via subsidisations but mainly via tax incentives. The process has recently changed and has become a bid-based competitive process. Moreover, countries that have successfully implemented this support scheme such as Spain and Germany [
24] have different market environments, and different supply and demand in a much less monopolistic environment. In order to be implemented, the policy must be designed carefully and should have specific objectives and aims. Some of the objectives may be the successful integration of a higher share of renewable energy in the grid or the creation of new green jobs, taking into account the high level of unemployment that the country faces due to the long-lasting financial crisis. Minimising the power generation loss should be one of the parameters taken into account.
From a business development perspective, the high tax rate directly affects the profits of the projects, and the fact that the banks are less ready to offer loans to potential investors has significant impact on liquidity and worsens the environment for further growth. Therefore, under the current situation, moving to FiP, for an investor, at this stage, seems risky.
From the policy point of view, FiP encourages competition among market participants. It is obvious that the potential investors need to sell their electricity 100% of the time and that they participate in the market in order to have higher profits and shorter payback periods on their investment. The best results for both technologies, were found for the 100% selling scenarios. The results have shown that the extension of the contract from 20 to 25 years gave higher Net Present Values. These profits for an investor may secure an investment with lower risk levels.
5. Conclusions
The conclusion for both technologies is that the FiP policy creates incentives for the investors to seek the optimum location to install their projects as the higher profits came from the higher capacity factors.
The FiP, if implemented without any other kind of support to the potential investor (tax incentives, state subsidisation), under the third bail-out programme, (Law 4336/2015) [
25], may lead Greece to flexible participants. A possible solution to this issue may be the fast introduction of net metering based on the type of the generator, such as commercial and industrial self-producers. Another barrier/consideration is the technology eligibility. This work has investigated the performance of a 10 MW wind park and a 2 MW solar PV park based on the country’s potential. It was found that for projects where all or almost all their electricity production (100% or 75%) is offered to the market successfully, their operation increase for five years, as an incentive to participate in the FiP scheme, instead of the FiT one, could lead to increase in profitability in most cases, for both technologies. However, in situations with high curtailment and low selling rates (50%), the viability of the projects is more than questionable.
Less intermittent RES technologies such as hydro and biomass may benefit from the FiP implementation, even at medium (75%) or low (50%) selling rates. However, new technologies which tend to be costly (and less mature) may not benefit from the FiP scheme and may require support such as wind farms and PVs used to have few years ago.
In this work, the investigation was conducted for two specific technologies that have stochastic behaviour and great potential in Greece. Further research may include more renewable technologies such as small hydro and biomass, which are also utilised in the country. More scenarios may include tax incentives and different “caps” and “floors” of the FiP scheme perhaps under a multiple revenue stream approach.


