Communication

The Local Value Chain of Hunted Red Deer Meat: A Scenario Analysis Based on a Northern Italian Case Study

Department of Health, Animal Science and Food Safety (VESPA), University of Milan, Via Celoria, 10-20133 Milano, Italy
*
Author to whom correspondence should be addressed.
Resources 2018, 7(2), 34; https://doi.org/10.3390/resources7020034
Submission received: 14 February 2018 / Revised: 10 May 2018 / Accepted: 22 May 2018 / Published: 25 May 2018

Abstract

:
Although in recent decades, meat from hunted wild ungulates has shown interesting results in terms of market opportunities, the scientific literature is still lacking in economic studies concerning the estimation of the meat’s value for involved stakeholders. We present an analysis of the evolution of price in the local red deer meat supply chain. This analysis has been conducted through a survey based on in-depth interviews with the stakeholders involved in an Italian local supply chain. Findings derived from this study describe a case study, however, they also represent the potential dynamics of the value of Italian game meat, highlighting that the development of a sustainable local supply chain of this product may represent an economic resource for involved stakeholders.

1. Introduction

In recent years, the trends of the population of large wild ungulates (wild boar, red deer, chamois, mouflon) became worrisome for Italy and many European countries. Ironically, while two decades ago these animals were listed as endangered species, they turned out to be a social cost. In fact, their population is growing with damage to ecosystems [1,2,3], economic losses in forestry and agriculture [4,5,6,7], increased risk of zoonotic diseases [8,9], and increased frequency of vehicle collisions [10,11,12]. Due to this overpopulation, management and containment strategies have been developed, with a cost for public institutions and an increase in culling rates, as well as availability of game meat [13,14,15,16]. Furthermore, according to European trade and safety regulations (Reg. EC No. 178/2002, No. 853/2004 and No. 854/2004), hunters are considered primary food producers (such as farmers and breeders) and, under certain conditions, they can sell the game they harvest. Consumers’ willingness to pay for this product is also likely to be positive [17]. In fact, large wild ungulate meat has optimal nutritional attributes [18] and can be considered an environmentally friendly and local food [17].
Given the availability of meat, the legal framework and consumers’ preferences, a professional supply chain for hunted game meat has been developed in some European countries, such as France, Slovenia, Austria, and Scotland [19]. On the other end, despite favourable market environment conditions, the Italian hunting sector continues to have only a recreational and social purpose and the growing demand of Italian consumers is met by a significant amount of imported meat [20]. As reported in research by Gaviglio et al. [15], Italian hunted meat is mainly consumed by hunters and their acquaintances. Put simply, the empirical evidence suggests that most Italian hunters do not consider themselves as food producers and neglect the idea that game meat can enter the market.
Building on basic microeconomics principles, it is evident that the Italian hunting sector would highly benefit from the creation of a professional supply chain for wild game meat. Indeed, profit- and utility-driven choices are mostly efficient in terms of organising multiple and complex networks between producers and consumers of goods. In this sense, the creation of a market for hunted game meat is expected to generate the following positive outcomes by means of the respective economic incentives:
-
Hunters can gain revenue from selling their game; therefore, to maximise their revenue, they will be interested in achieving a higher quality of meat, which will be possible only by following good hunting practices.
-
Transformers and restaurateurs can diversify their production and increase their revenue by selling a local product with high value added; therefore, to protect their reputation and obtain a price premium from consumers, they will search for high-quality meat from hunters.
On the other hand, the creation of this new market involves the participation of multiple private and public stakeholders. Studies aimed at estimating the real economic value of this local supply chain (i.e., the expected value of the economic incentives) would greatly contribute to the debate by providing grounded evidence for supporting (or not) this project. Although in recent decades, meat from hunted wild ungulates has shown interesting results in terms of market opportunities and economic benefits [15,16,17,18], scientific literature is still lacking in research concerning the estimation of revenue for the Italian stakeholders involved in this kind of supply chain. To fill this gap, this paper answers the following research questions:
  • What is the economic value of large wild game meat in Italy?
  • How is this value created and distributed among the private stakeholders involved in the supply chain?
To answer these questions, we present the results of an exploratory analysis that quantifies the value transmission along a local supply chain of large wild game meat by the application of revenue accounting analysis [21,22]. The research has been carried out through in-depth interviews with the stakeholders involved. The case study discussed in the paper is represented by hunters, transformers, and restaurateurs from the Italian Alpine area of the Valle Ossola (Piedmont, Verbano-Cusio-Ossola, Italy). The results derived from this study allow us to understand the ideal flow sheet and the current potential dynamics of the value of game meat. They also highlight that the development of a sustainable local supply chain of hunted game meat could be economically interesting for all involved stakeholders as well as their territories.
The remainder of the text is organised into four sections. Section 2 presents materials and methods used in the study. Section 3 presents the results of the analysis and their discussion, organised into two subsections. Section 3.1 shows the flow sheet of the supply chain, while Section 3.2 reports the results concerning the value of the meat for each involved stakeholder, namely, hunter (Section 3.2.1), transformer (Section 3.2.2), and restaurateur (Section 3.2.3). Finally, a concluding section offers a summary of the research and discusses its implications under the light of some limitations.

2. Materials and Methods

The data needed for the analysis of the price transmission were collected in 2016 through in-depth interviews carried out with the stakeholders involved in the supply chain.
In-depth interviews are a useful qualitative and quantitative data collection method that allows the interviewer to deeply explore specific aspects and collect data [23]. This technique consists of a face-to-face conversation, during which the researcher tries to obtain detailed information on the topic under study. The conversation is led by the interviewer on the basis of a flexible and non-standardised questionnaire scheme [24]. The task of the researcher is to ensure that the conversation is focused on the topic and deeply examines important aspects for the object of research [25]. Therefore, it is clear that the final purpose of this method is not to reach a generalisation of results, but to collect accurate information; for this reason, the number of respondents is not a crucial factor [23].
The stakeholders identified for in-depth interviews belong to these groups:
-
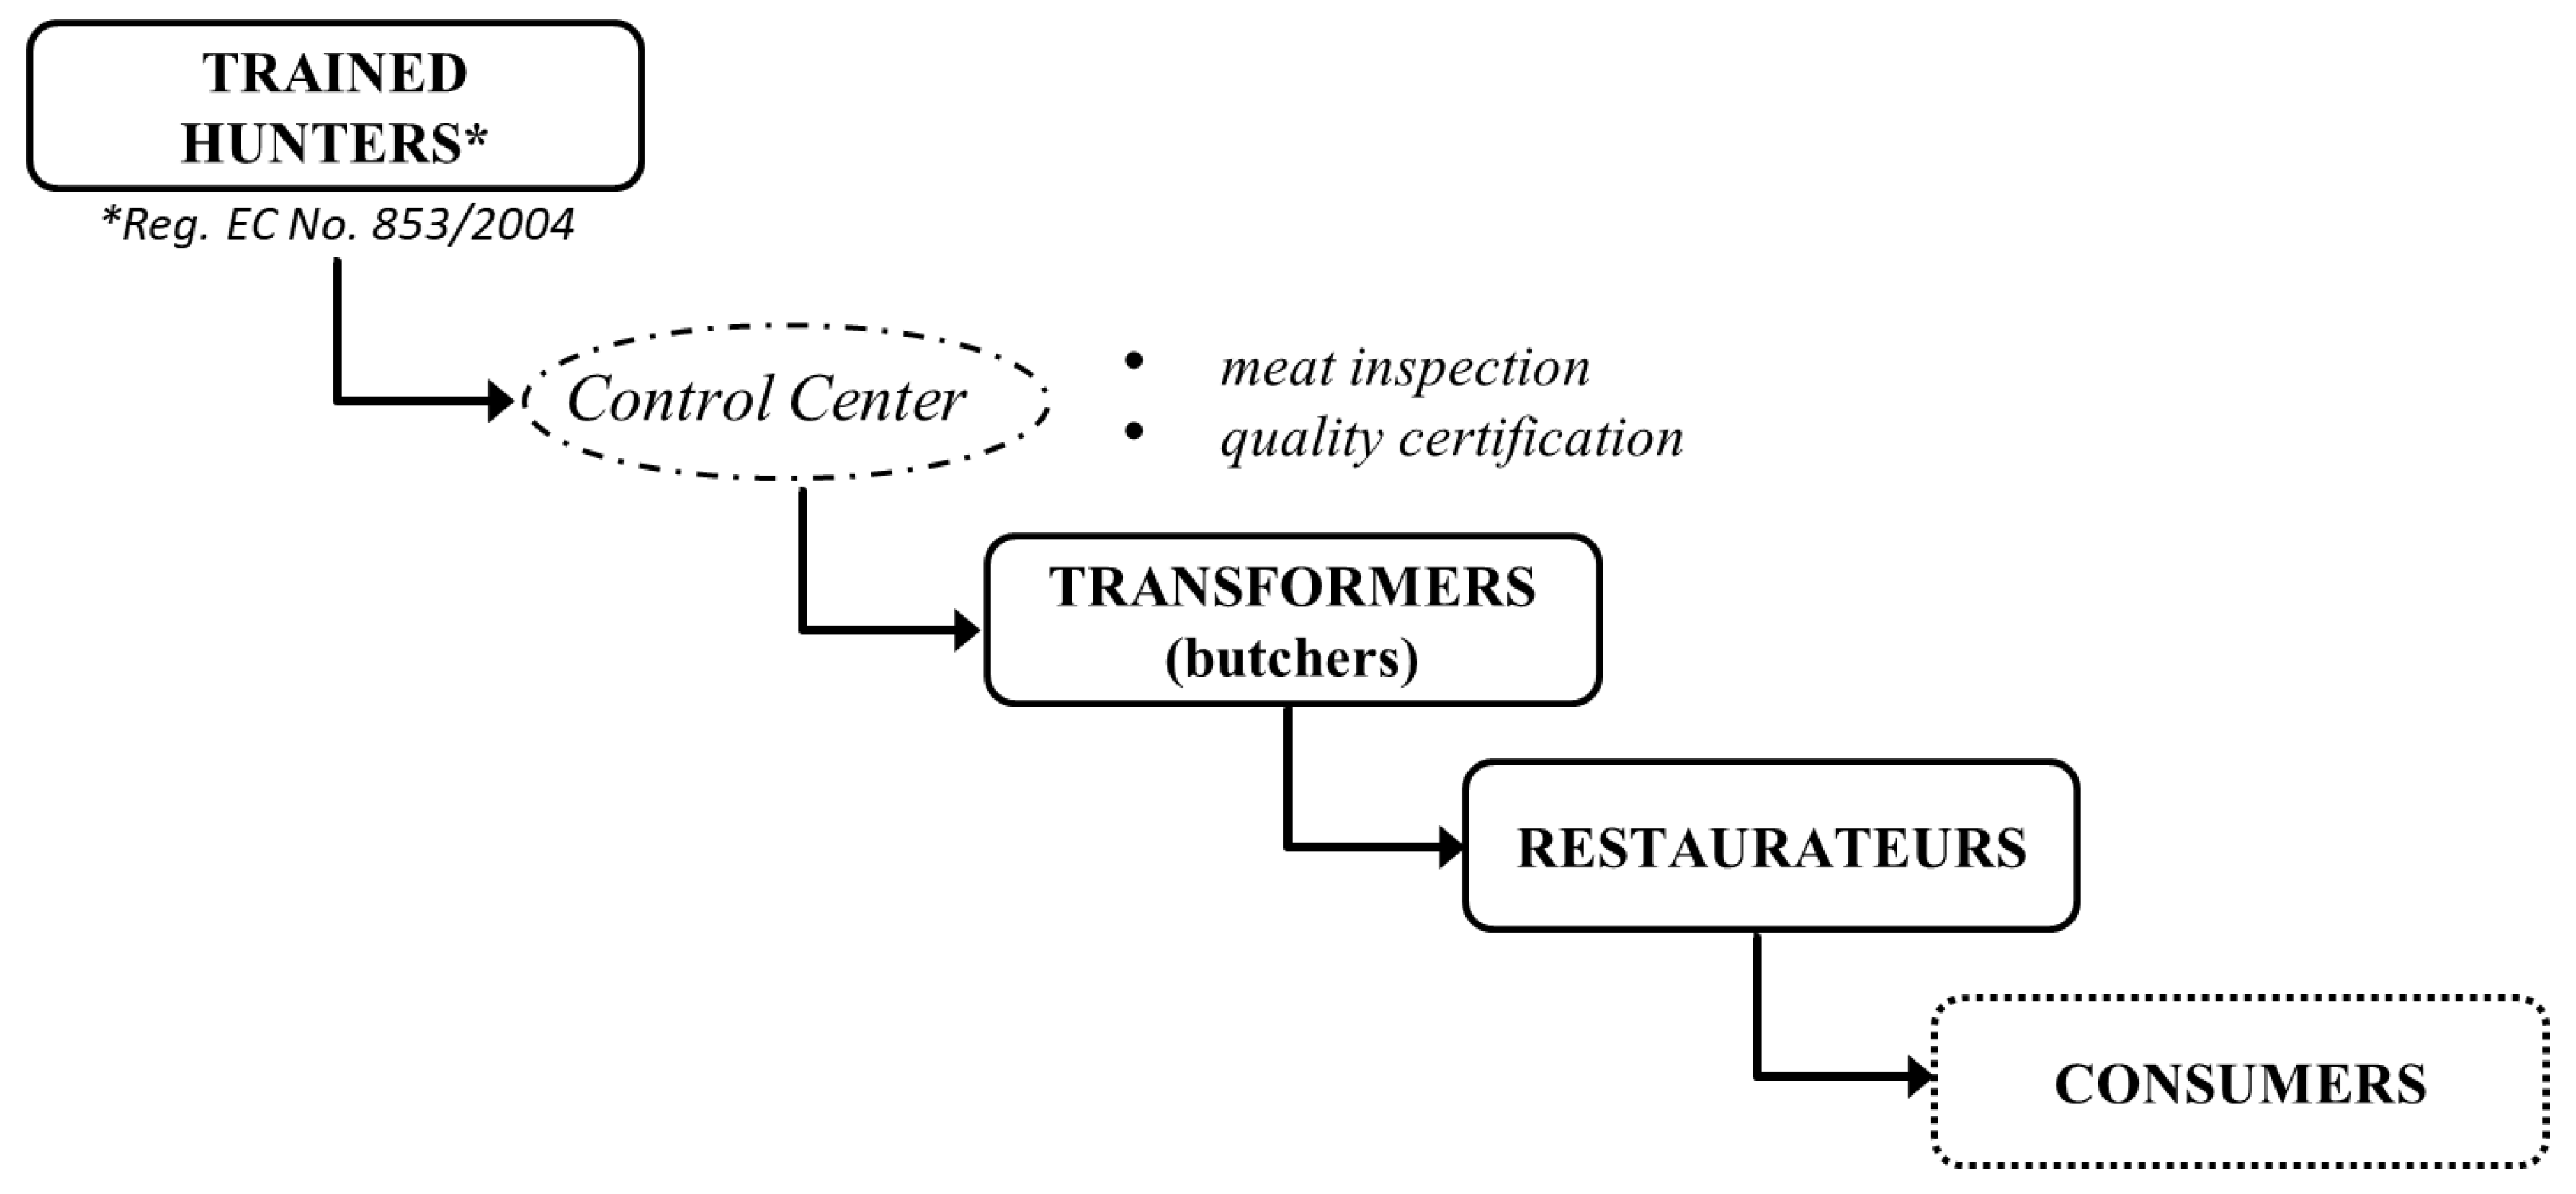
Trained hunters, which are considered by European Regulation (EC) 853/2004 to be primary producers;
-
Transformers, including the local butchers, which have the skills to process game carcasses;
-
Restaurateurs that offer game meat dishes.
In some cases, the same respondent belonged to multiple categories of stakeholders. In fact, currently, the supply chain of game meat is frequently represented by a single specialised operator who embodies the roles of all the different stakeholders (i.e., a restaurateur who practises hunting, personally transforms the carcasses, uses them for the preparation of dishes, and then offers the dishes to the consumer). However, it is not a professional supply chain, and there are not well-defined quality standards and parameters.
The stakeholders were chosen among the restricted number of available experts in the field of the area under study (see below). Each in-depth interview lasted about an hour.
Due to the constraints (non-existent supply chain), the final sample consisted of eight people concurrently categorised as three hunters, three local butchers, and five restaurateurs.
A pre-interview questionnaire (differentiated for each of the three groups of stakeholders involved) with the key questions, was sent to each respondent by e-mail few days before the actual interview. During the interviews, data were reported and afterwards analysed systematically to identify any deficiencies or other aspects to be further investigated [26].
Following Vavra and Goodwin [21] and Drury [22], a methodology based on revenue accounting analysis was adopted for the identification of the price transmission along the value chain. This analysis accumulates, classifies, summarises, and reports information that will assist managers in their decision-making [22].
According to the methodology, we have identified the stakeholder’s revenue at each step of the supply chain’s flow sheet. The costs were not taken into account.
Information collected during the interviews allowed us to carry out the economic flow sheet of the red deer meat by the identification of the values of the meat in any phase of the chain. The final value of the game meat, at the end of the supply chain, corresponds to the price of different dishes of red deer meat at the restaurant.
The survey was conducted in the Italian Alpine area of Valle Ossola, which is located in Piedmont region, in the province of Verbania Cusio Ossola (VCO). The VCO province is divided into three alpine hunting districts (Comprensori Alpini di Caccia—CAC). The interviewed hunters belonged to the CAC VCO2 Ossola Nord.
Among the large wild ungulate species that can be hunted in Italy, red deer (Cervus elaphus) meat has been chosen as the reference product for the category in consideration of its representativeness among European large wild ungulates, its traditional culinary consumption, and its potential availability due to their populations’ trend in the peninsula and its large size.
In this study, the value of red deer meat for each stakeholder was calculated by considering the path, across the supply chain, of a hypothetical locally-hunted red deer. According to the findings of the in-depth interviews, the identified reference product is a male red deer with an average weight of 84 kg. By assuming this, we obtain the average value per kilogram of meat at each step of the chain.

3. Results and Discussion

3.1. Flow Sheet and Segmentation of the Game Meat Supply Chain

As reported in Figure 1, the ideal flow sheet of the red deer meat supply chain begins with the trained hunter (Regulation (EC) 853/2004), which through hunting gets the game. The hunter brings the carcass to the control centre, where a veterinarian carries out a meat inspection and certifies the quality of the product. Then, the route of the game continues with the transformer, who will have the task of working the carcasses in order to obtain high value-added products. The next step in the chain is the local restaurateur, who proposes local game meat dishes to the final consumer.

3.2. The Value of the Meat at Each Step of the Supply Chain

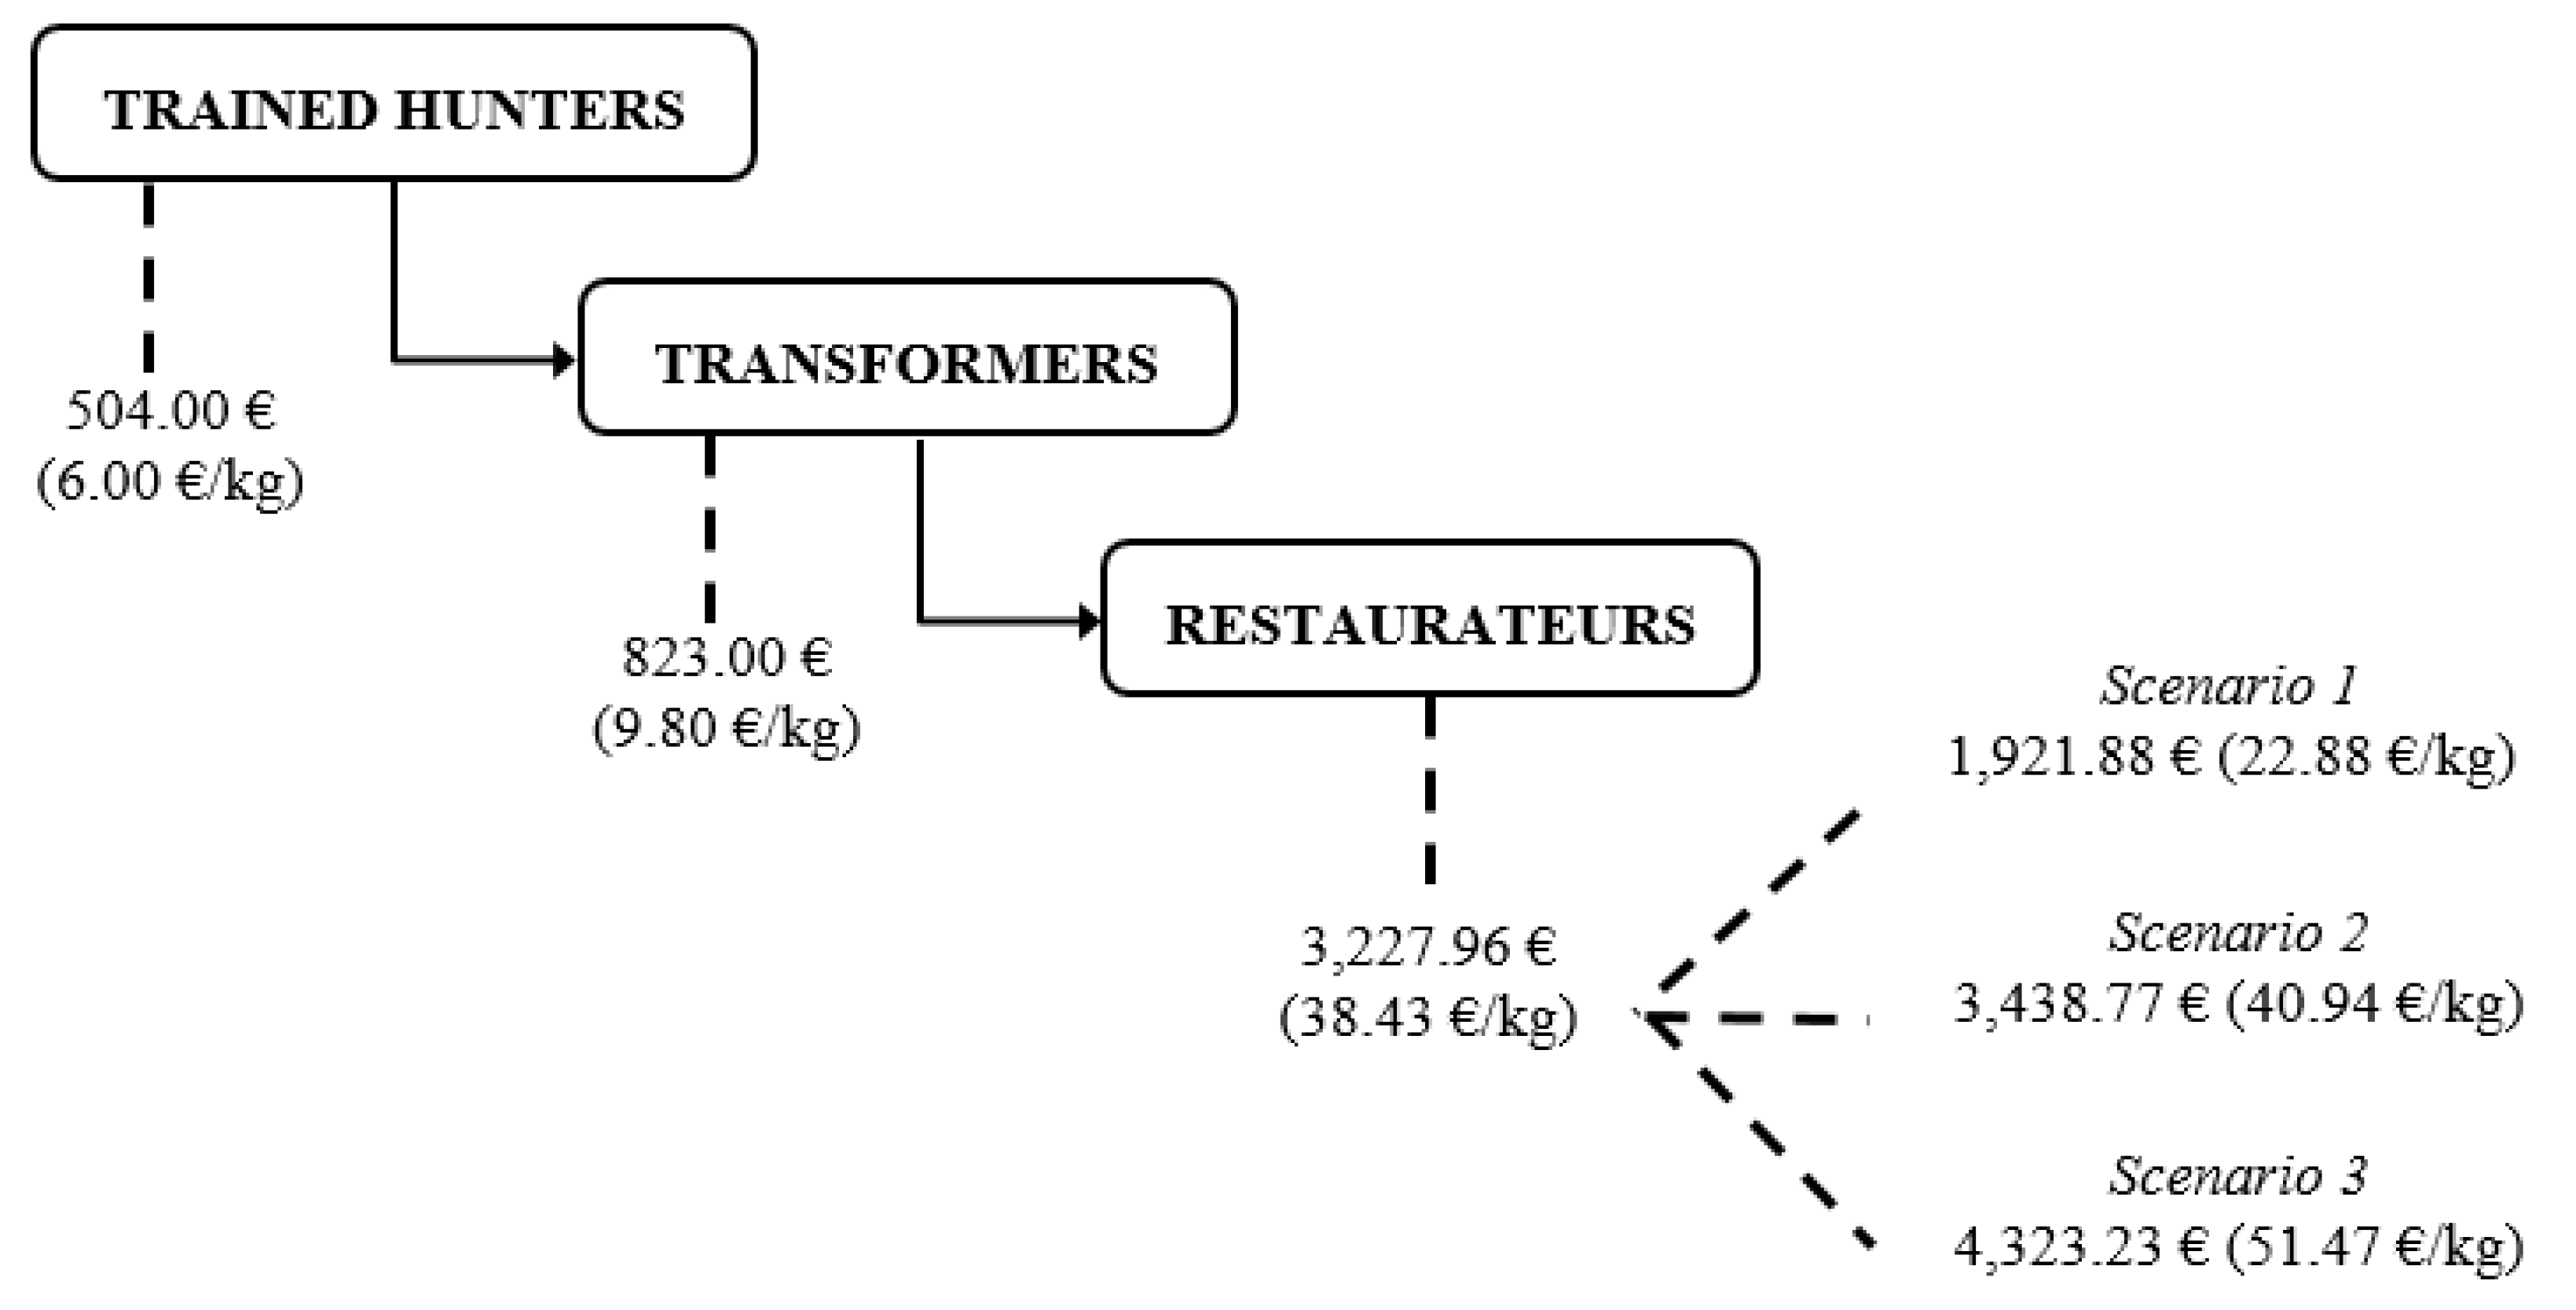
3.2.1. The Value of the Meat for the Hunter

Data collection during the in-depth interviews allowed us to identify the value of the red deer meat for the trained hunter.
From the male red deer of reference with the hypothetical weight of 84 kg, the hunter can obtain a total value of 504.00 €. This means that the price at which hunters sell the game meat (and the purchase cost for the transformer) is, on average, 6.00 €/kg. This final value has been confirmed by experts in the field.
The in-depth interviews conducted with hunters highlighted that the costs related to their hunting activity are mainly fixed cost connected to the fee payment (hunting license, regional hunting card, liability insurance, and hunting district registration), equipment purchase (rifle, clothing), and firearms practice activities at shooting ranges. Variable costs change in relation with the number and characteristics of the animals harvested (species, age, gender).

3.2.2. The Value of the Meat for the Transformer

In the revenue accounting analysis of the meat’s value for the transformer, we have assumed an ideal meat yield that can be reached only through a maximum enhancement of the red deer carcass, worked in order to obtain high-quality products and without any waste.
Table 1 reports meat cuts and their values resulting from the ideal processing of the carcass of the same male red deer with the hypothetical weight of 84 kg considered in the previous section. Data have been identified through examining the information collected during the interviews and wholesale market lists (which are related to imported meat). The quantity of each cut of meat has been specified with its respective value €/kg in order to obtain the total value of each cut.
Through the recovery and reuse of the scraps, the red deer (84 kg) can reach a total value of 823.00 €. This equates to a hypothetical average price of 9.80 €/kg. It is worth noting that these scraps are not currently present on the wholesalers’ lists and, thus, are not available on the market. Therefore, it is an ideal value.
On the costs side, as large wild ungulate meat is processed as domesticated species meat [17], therefore, no additional costs might be considered for transformers except for the attendance of a specific training course focused on wild game meat safety. This training is often free offered by the Local Health Centre (Azienda Sanitaria Locale, “ASL”).

3.2.3. The Value of the Meat for the Restaurateurs

Through the in-depth interviews with the restaurateurs, we have found the main game meat dishes offered, the average portion weight of each dish and the average menu prices.
To identify the value of the red deer for the restaurateur, we have calculated the revenue of each game dish by using the portion weight, the menu prices, and the cost of the cut of meat. The obtained results are schematically shown in Table 2.
It is important to highlight that some dishes are prepared with the same cuts of meat. This is the case of stew and scraps; they can be used to prepare both tartare and pot roast. However, this latter dish has a substantially lower net revenue if compared with the tartare (10.75 €/portion vs. 13.97 €/portion of the tartare). This also occurs for shoulder and back leg, which can be used for the carpaccio (11.50 €/portion) and for roast/goulash (8.88 €/portion).
After this preliminary analysis, the value of the meat has been calculated through the definition of three different selling combination scenarios, outlined by considering the red deer (84 kg) previously used for reference in the other phases. In fact, as previously mentioned, some dishes are prepared with the same cuts. Therefore, the final total hypothetical value of the carcass will change according to the destination of the meat cuts in the courses proposed and then sold to the consumer.
The three identified selling combination scenarios are:
(1)
Mountain lodge
(2)
Mountain restaurant
(3)
Innovative restaurant
In all three scenarios we have assumed an ideal meat yield, therefore, we do not consider the possible presence of meat wasted or discarded.

Scenario 1

The first selling combination scenario is the mountain lodge. In this context, the consumer’s preference is oriented towards the most popular and traditional courses; thus, the raw meat dishes (tartare and carpaccio) are excluded from the culinary offerings. Therefore, in this case, the shoulder and back leg will be fully destined to the preparation of roast/goulash, and the stew meat and scraps will be fully destined to the preparation pot roast.
As shown in Table 3, the final value of the red deer under study at the mountain lodge is 1921.88 €, equal to 22.88 €/kg.

Scenario 2

The second scenario involves a situation typically found in a mountain restaurant. In this hypothetical scenario, both traditional and sophisticated courses are offered to the consumer, but the sales of these last dishes (such as tartare and carpaccio) will be less than the sale of roast/goulash and pot roast. This is because the customers are not yet familiar with these raw courses. Therefore, we have assumed that the stew meat and scraps are used for the preparation of both the tartare, as well as pot roast and polenta, with a hypothetical sales ratio between these courses of 1:2 weighted in favour of the pot roast. The same also occurs for the shoulder and back leg, which are utilised for both the carpaccio and roast/goulash (sales ratio 1:2, weighted in favour of the roast/goulash).
Accordingly, to these assumptions, the final value of the carcass at the mountain restaurant is 3438.77 €, equal to 40.94 €/kg (Table 4).

Scenario 3

The third scenario (innovative restaurant) involves a situation in which the consumer preferences are oriented towards more sophisticated and expensive gourmet meals, such as tartare and carpaccio. Therefore, in this case, for the estimation of the red deer’s final value, it is assumed that the stew meat and scraps will equally be used for both the preparation of tartare and pot roast. Therefore, we have considered equal sales to both of these dishes (sales ratio pot roast vs. tartare 1:1).
As reported in Table 5, it is assumed that the final value of the red deer at the innovative restaurant is 4323.23 €, which equates to 51.47 €/kg.
It is worth mentioning that these raw dishes can be prepared only from meat of high and guaranteed quality.
Thus, the final hypothetical value of the locally hunted male red deer weighing of 84 kg varies considerably according to the dishes proposed in the restaurant menu, ranging from 1921.88 € (22.88 €/kg) of the mountain lodge in Scenario 1, increasing to 3438.77 € (40.94 €/kg) of the mountain restaurant in Scenario 2, up to a maximum value of 4323.23 € (51.47 €/kg) of the innovative restaurant in Scenario 3. Therefore, on average, the value of the red deer for the restaurateur is 3227.96 €, equal to 38.43 €/kg (Table 6).

4. Conclusions

Although in recent decades, hunted game meat has shown interesting results in terms of economic potential, scientific literature is still lacking in research concerning the estimation of the revenue for Italian stakeholders involved in this kind of supply chain. To fill the present gap, this paper aimed at estimating the price distribution among the private stakeholders involved in a local supply chain of hunted red deer meat. The presented case study is represented by hunters, transformers, and restaurateurs from the Italian Alpine area of the Valle Ossola (Piedmont, Verbano-Cusio-Ossola, Italy).
Following the revenue accounting analysis theory [21,22], we have identified:
-
the flow sheet of the supply chain with the involved stakeholders; and
-
the stakeholders’ revenue at each step of the supply chain.

4.1. What Is the Economic Value of the Large Wild Game Meat in Italy?

As schematically shown in Figure 2, the value of the deer meat changes for the stakeholders involved, from a starting value of 6.00 €/kg for the hunter, to 9.80 €/kg for the transformer, and reaching a final average value of 38.43 €/kg for the restaurateur. This last value varies considerably depending on the presence of high value-added courses, such as tartare and carpaccio, in the restaurant menu.

4.2. How Is This Value Is Created and Distributed among the Private Stakeholders Involved in the Supply Chain?

The elaborations of the data collected from experts in the field show that the value of the red deer meat is considerably increasing across the supply chain (Figure 2), from 6.00 €/kg for the hunter to a maximum of 51.47 €/kg for the restaurateurs. We can reasonably assume that there will be a redistribution of the value across the supply chain with an increasing quality of the hunted meat and the establishment of the supply chain with the certification of the products with a local brand.
The present results assume relevance in relation to the current condition of the Italian hunting sector, which faces a lack of a professional supply chain of hunted game meat mainly due to hunters, who do not consider themselves as food producers and neglect the idea that game meat can enter the market [15]. The estimated economic value of hunted meat could be an adequate incentive for the hunters which, in order to maximise their revenue by the achievement of a higher quality of the meat, will start to follow good hunting practices.
Despite the findings described in this paper were derived from a single case study, the present research constitutes the only available benchmark for Italian hunted game meat and suggests that the development of a sustainable local supply chain of this product may represent an economic resource for the involved private and public stakeholders.
From the environmental and ethical points of view, the present paper promotes a sustainable management of large wild ungulates, which means that hunting activity must be conducted under well-defined culling plans, which guarantees the respect of the environment, assures control over wild ungulate populations, and the respect of wild animals.
Finally, the study limitations are worth mentioning. While the research provides original estimates of the value of large wild ungulate game meat, the costs have not been taken into consideration; consequently, it is not possible to calculate the expected profit for each stakeholder. In this sense, the differences in prices seen from hunters to restaurateurs may be perceived as higher than the actual differences in profit. Unfortunately, there is no information on the cost side of this supply chain, which might be considered a shortcoming of this paper. However, a reliable cost analysis would have required analytical accountancy tools different from in-depth interviewees. Due to budget constraints, we had to restrict the analysis to revenues only. Underlining that no strong, neither final, results can be inferred from the available data, we still consider our contribution relevant for Italian hunting sector management because the market prices are always important for private stakeholders when deciding whether to enter the market, as well as for public institutions when planning policy interventions.

Author Contributions

Anna Gaviglio, Maria Elena Marescotti and Eugenio Demartini jointly contributed to Introduction (Section 1), Result and Discussion (3) and Conclusions (Section 4). Anna Gaviglio wrote the Material and Methods (Section 2), Maria Elena Marescotti reviewed the literature and carry out the stakeholders’ interviews, Eugenio Demartini described the Flow Sheet and Segmentation of the Game Meat Supply Chain (Section 3.1) and wrote the limitations of the study (contained in Section 4). The framework and conception of the analysis result from a join work of the authors.

Funding

This research was funded by Fondazione Cariplo “Bandi Ambiente 2014”—Progetto “La Filiera Eco-alimentare. Progetto per la valorizzazione delle carni di selvaggina: la gestione di prodotto sostenibile come strumento di stimolo al miglioramento ambientale dei territori alpini”.

Conflicts of Interest

The authors declare no conflict of interest.

References

  1. Gerhardt, P.; Arnold, J.M.; Hackländer, K.; Hochbichler, E. Determinants of deer impact in European forests—A systematic literature analysis. Ecol. Manag. 2013, 310, 173–186. [Google Scholar] [CrossRef]
  2. ISPRA—Istituto Superiore per la Protezione e la Ricerca Ambientale (Italian National Institute for Environmental Protection and Research). Linee guida per la gestione degli ungulati. ISPRA 2013, 91, 1–225. [Google Scholar]
  3. Winkelmayer, R.; Stangl, P.V.; Paulsen, P. Assurance of food safety along the game meat production chain: Inspection of meat from wild game and education of official veterinarians and ’trained person’ in Austria. In Game Meat Hygiene in Focus; Wageningen Academic Publishers: Wageningen, The Netherlands, 2011; pp. 245–258. [Google Scholar]
  4. Apollonio, M.; Andersen, R.; Putman, R. European Ungulates and Their Management in the 21st Century, 1st ed.; Cambridge University Press: New York, NY, USA, 2010. [Google Scholar]
  5. Gill, R.M.A.; Beardall, V. The impact of deer on woodlands: The effect of browsing and seed dispersal on vegetation structure and composition. Forestry 2001, 74, 209–218. [Google Scholar] [CrossRef]
  6. Schley, L.; Roper, T.J. Diet of wild boar Sus scrofa in western Europe, with particular reference to consumption of agricultural crops. Mamm. Rev. 2003, 33, 43–56. [Google Scholar] [CrossRef]
  7. Zamora, R.; Gomez, J.M.; Hódar, J.A.; Castro, J.; García, D. Effect of browsing by ungulates on sampling growth of Scots pine in a Mediterranean environment: Consequences for forest regeneration. For. Ecol. Manag. 2001, 144, 33–42. [Google Scholar] [CrossRef]
  8. Ferroglio, E.; Vicente, J. Wild ungulate diseases and the risk for livestock and public health. In Ungulate Management in Europe: Problems and Practices; Cambridge University Press: New York, NY, USA, 2011; pp. 192–214. [Google Scholar]
  9. Gortázar, C.; Ferroglio, E.; Höffle, U.; Frölich, K.; Vicente, J. Diseases shared between wildlife and livestock: A European perspective. Eur. J. Wildl. Res. 2007, 53, 241. [Google Scholar] [CrossRef]
  10. Malo, J.E.; Suarez, F.; Diez, A. Can we mitigate animal–vehicle accidents using predictive models? J. Appl. Ecol. 2004, 41, 701–710. [Google Scholar] [CrossRef]
  11. Langbein, J.; Putman, R.; Pokorny, B. Traffic collisions involving deer and other ungulates in Europe and available measures for mitigation. In Ungulate Management in Europe: Problems and Practices; Cambridge University Press: New York, NY, USA, 2010. [Google Scholar]
  12. Sielecki, L.E. Evaluating the effectiveness of wildlife accident mitigation installations with the Wildlife Accident Reporting System (WARS) in British Columbia. In Proceedings of the International Conference on Ecology and Transportation, Keystone, CO, USA, 24–28 September 2001; Center for Transportation and the Environment, North Carolina State University: Raleigh, NC, USA, 2001. [Google Scholar]
  13. Avagnina, A.; Nucera, D.; Grassi, M.; Ferroglio, E.; Dalmasso, A.; Civera, T. The microbiological conditions of carcasses from large game animals in Italy. Meat Sci. 2012, 91, 266–271. [Google Scholar] [CrossRef] [PubMed]
  14. Côté, S.D.; Rooney, T.P.; Tremblay, J.P.; Dussault, C.; Waller, D.M. Ecological impacts of deer overabundance. Annu. Rev. Ecol. Evol. Syst. 2004, 35, 113–147. [Google Scholar] [CrossRef]
  15. Gaviglio, A.; Demartini, E.; Marescotti, M.E. The creation of a local supply chain for large wild ungulates meat: Opportunities and limitation from an Italian alpine case study. Qual. Access Success 2017, 18, 215–222. [Google Scholar]
  16. Ramanzin, M.; Amici, A.; Casoli, C.; Esposito, L.; Lupi, P.; Marsico, G.; Mattiello, S.; Olivieri, O.; Ponzetta, M.P.; Russo, C.; et al. Meat from wild ungulates: Ensuring quality and hygiene of an increasing resource. Ital. J. Anim. Sci. 2010, 9, 318–331. [Google Scholar]
  17. Hoffman, L.C.; Wiklund, E. Game and venison: Meat for the modern consumer. Meat Sci. 2006, 74, 197–208. [Google Scholar] [CrossRef] [PubMed]
  18. Bureš, D.; Bartoň, L.; Kotrba, R.; Hakl, J. Quality attributes and composition of meat from red deer (Cervus elaphus), fallow deer (Dama dama) and Aberdeen Angus and Holstein cattle (Bos taurus). J. Sci. Food Agric. 2014, 95, 2299–2306. [Google Scholar] [CrossRef] [PubMed]
  19. Winkelmayer, R.; Paulsen, P. Direct marketing of meat from wild game in Austria: A guide to good practice according to Regulations (ECC) 852 and 853/2004. Fleischwirtschaft 2008, 88, 122–125. [Google Scholar]
  20. Bertolini, R.; Zgrablic, G.; Cuffolo, E. Wild game meat: Products, market, legislation and processing controls. Vet. Res. Commun. 2005, 29, 97–100. [Google Scholar] [CrossRef] [PubMed]
  21. Vavra, P.; Goodwin, B. Analysis of Price Transmission along the Food Chain; OECD Food, Agriculture and Fisheries Papers, No. 3; OECD Publishing: Paris, France, 2005. [Google Scholar]
  22. Drury, C. Management and Cost Accounting, 3rd ed.; The Chapman & Hall Series in Accounting & Finance; Chapman & Hall: London, UK, 1992. [Google Scholar]
  23. Guion, L.A.; Diehl, D.C.; McDonald, D. Conducting an In-depth Interview; FCS6012; IFAS (Institute of Food and Agricultural Sciences) Extension; University of Florida: Gainesville, FL, USA, 2001.
  24. Corbetta, P. Metodologia e Tecniche della Ricerca Sociale; Il Mulino: Bologna, Italy, 1999. [Google Scholar]
  25. Pani, R.; Sagliaschi, S. Dinamiche e Strategie del Colloquio Clinico; Carocci: Roma, Italy, 2006. [Google Scholar]
  26. Foglia, E.; Vanzago, A. Metodologia e Metodi della Ricerca Qualitativa; Centro di Ricerca in Economia e Management in Sanità e nel Sociale; Università Carlo Cattaneo–LIUC: Castellanza (VA), Italy, 2011. [Google Scholar]
Figure 1. Flow sheet of the red deer meat supply chain.
Resources 07 00034 g001
Figure 2. Current potential dynamics of the value of the red deer meat supply chain.
Resources 07 00034 g002
Table 1. Meat cuts resulting from the processing of a male red deer (84 kg) and their values.
Meat CutQuantityValueCut Value
(kg)(€/kg)(€)
Loin (filets)2.0026.0052.00
Backstrap (chops, roast)5.0015.2076.00
Back leg (bone-in, ×2)32.0010.00320.00
Shoulders (boneless)6.0015.0090.00
Shoulder stew6.007.7046.20
Shoulder’s scrap *4.006.0024.00
Neck (boneless)9.007.7069.30
Neck’s scrap *5.006.0030.00
Ribs and scraps15.007.70115.50
Total84.00 823.00
* Not currently on the market, hypothetical value.
Table 2. Value of the red deer meat for the restaurateur by type of dish.
DishMeat CutWeightGross Revenue (Menu Prices)Meat Cut CostNet Revenue
(kg/Portion)(€/Portion)
TartareStew, scraps (from shoulder and back leg)0.1515.001.0313.97
CarpaccioShoulder and back leg0.1213.001.5011.50
Roast/GoulashShoulder and back leg0.2512.003.138.88
SteakBackstrap0.2016.004.1211.88
Pot roast and polentaStew, scraps (from shoulder and back leg)0.2512.501.7610.75
Table 3. Deer’s final value estimation—Mountain lodge.
DishMeat CutWeightGross RevenueMeat Cut CostNet RevenuePortions/DeerNet Revenue/Deer
(kg/Portion)(€/Portion)(n)(€)
Roast/GoulashShoulder and back leg0.2512.003.138.8868603.50
SteakBackstrap0.2016.004.1211.8835415.80
Pot roast and polentaStew, scraps (from shoulder and back leg)0.2512.501.7610.7584902.58
Total1871921.88
Table 4. Deer’s final value estimation—Mountain restaurant.
DishMeat CutWeightGross RevenueMeat Cut CostNet RevenuePortions/DeerNet Revenue/Deer
(kg/Portion)(€/Portion)(n)(€)
TartareStew, scraps (from shoulder and back leg)0.1515.001.0313.9753745.20
CarpaccioShoulder and back leg0.1213.001.5011.5047543.06
Roast/GoulashShoulder and back leg0.2512.003.138.8845402.33
SteakBackstrap0.2016.004.1211.8835415.80
Pot roast and polentaStew, scraps (from shoulder and back leg)0.2512.501.7610.751241332.38
Total3053438.77
Table 5. Deer’s final value estimation—Innovative restaurant.
DishMeat CutWeightGross RevenueMeat Cut CostNet RevenuePortions/DeerNet Revenue/Deer
(kg/Portion)(€/Portion)(n)(€)
TartareStew, scraps (from shoulder and back leg)0.1515.001.0313.97801117.80
CarpaccioShoulder and back leg0.1213.001.5011.501421629.17
SteakBackstrap0.2016.004.1211.8835415.80
Pot roast and polentaStew, scraps (from shoulder and back leg)0.2512.501.7610.751081160.46
Total3654323.23
Table 6. Value of the red deer meat for the restaurateur in the three hypothetical selling combination scenario.
DishMeat CutMountain Lodge (1)Mountain Restaurant (2)Innovative Restaurant (3)
HYPOTHETICAL Net Revenue/Deer
(€)
TartareStew, scraps (from shoulder and back leg)-745.201117.80
CarpaccioShoulder and back leg-543.061629.17
Roast/GoulashShoulder and back leg603.50402.33-
SteakBackstrap415.80415.80415.80
Pot roast and polentaStew, scraps (from shoulder and back leg)902.581332.381160.46
Total (€)1921.883438.774323.23
(€/kg)22.8840.9451.47

