Article

Damage Effects and Fractal Characteristics of Coal Pore Structure during Liquid CO2 Injection into a Coal Bed for E-CBM

1
College of Safety Science and Engineering, Xi’an University of Science and Technology, Xi’an 710054, China
2
Shaanxi Key Laboratory of Prevention and Control of Coal Fire, Xi’an 710054, China
*
Authors to whom correspondence should be addressed.
Resources 2018, 7(2), 30; https://doi.org/10.3390/resources7020030
Submission received: 23 March 2018 / Revised: 24 April 2018 / Accepted: 27 April 2018 / Published: 3 May 2018

Abstract

:
Pore structure has a significant influence on coal-bed methane (CBM) enhancement. Injecting liquid CO2 into coal seams is an effective way to increase CBM recovery. However, there has been insufficient research regarding the damage effects and fractal characteristics of pore structure at low temperature induced by injecting liquid CO2 into coal samples. Therefore, the methods of low-pressure nitrogen adsorption-desorption (LP-N2-Ad) and mercury intrusion porosimetry (MIP) were used to investigate the damage effects and fractal characteristics of pore structure with full aperture as the specimens were frozen by liquid CO2. The adsorption isotherms revealed that the tested coal samples belonged to type B, indicating that they contained many bottle and narrow-slit shaped pores. The average pore diameter (APD; average growth rate of 18.20%), specific surface area (SSA; average growth rate of 7.38%), and total pore volume (TPV; average growth rate of 18.26%) increased after the specimens were infiltrated by liquid CO2, which indicated the generation of new pores and the transformation of original pores. Fractal dimensions D1 (average of 2.58) and D2 (average of 2.90) of treated coal samples were both larger the raw coal (D1, average of 2.55 and D2, average of 2.87), which indicated that the treated specimens had more rough pore surfaces and complex internal pore structures than the raw coal samples. The seepage capacity was increased because D4 (average of 2.91) of the treated specimens was also higher than the raw specimens (D4, average of 2.86). The grey relational coefficient between the fractal dimension and pore structure parameters demonstrated that the SSA, APD, and porosity positively influenced the fractal features of the coal samples, whereas the TPV and permeability exerted negative influences.

1. Introduction

Coal is China’s main energy source and accounted for 67.4% of the total energy consumption in the latest survey [1,2]. In recent decades, the relationship between resource utilization and environmental protection has become increasingly tense [3,4]. Coal resource development has generated massive amounts of CO2, CH4, and other pollutant gases, which threaten the safety of workers and have exacerbated the greenhouse effect [5,6]. Coal-bed methane (CBM), a potential natural gas resource, is abundant in Chinese coal seams. Pre-extracting gas before coal mining can control gas emissions and has a positive influence on economic development and the environment [7].
Coal, an organic, fractured solid material with complex pores, supplies numerous gas storage sites and affects coal-bed methane extraction [8]. However, owing to the low permeability, high gas content, deep mine pressure behaviors, and other issues, gas drainage productivity is lower in most Chinese mines. Therefore, improving the permeability of coal seams is essential for enhancing the efficiency of gas extraction [9]. Injecting liquid CO2 (LqCO2) into the coal seam to enhance methane extraction is a common technology that has been used internationally [10,11].
Generally, coal pore structure is classified into five types according to IUPAC and the BB Hodot theory [12,13]: micropores (2–10 nm in diameter), transition pores (10–100 nm in diameter), mesopores (100–1000 nm in diameter), macropores (1000–10,000 nm in diameter), and microfractures (>10,000 nm in diameter). This classification method was adopted in this research. Several studies have demonstrated that micropores and transition pores are the main adsorption and storage sites of CBM, whereas mesopores and macropores are the main channels for CBM seepage and diffusion [14,15]. Coal pore structure parameters include shape, size distribution, specific surface area, and pore volume. Currently, the typical methods of studying pore structure are centered on scanning electron microscopy (SEM), low-pressure nitrogen adsorption (LP-N2-Ad), mercury intrusion porosimetry (MIP), nuclear magnetic resonance (NMR), and small-angle X-ray scattering (SAXS) [16,17,18,19]. Therefore, in this work, a combination of LP-N2-Ad (the measuring aperture rang is 0–300 nm) and MIP (the measuring aperture rang is 0.3–360 μm) were used to study the damage effect and fractal characteristics of pore structures during low-temperature freezing-thawing with LqCO2.
The relationship between pore structure and CBM properties has been studied by several researchers in recent decades [20]. Xu [21] and Vishal [22] et al. adopted several methods to research the variation and permeability of coal pore structures in multiple LqCO2 freezing-thawing cycles. Their results indicated that the multiple freezing-thawing cycles positively affect the porosity and permeability of coal pores. Zhang et al. [23,24] has been researched on the supercritical CO2 injected into coal and concluded that the swelling stress in the coal matrix can fracture the inorganic mineral and discovered the supercritical CO2 could closed the cleats and made some new fractures generated in the un-swelling phase by the swelling effect. Wen et al. [25] conducted an in situ fracturing test in the Yanzhou Coal Field by injecting LqCO2 and reported the mechanism of damage during liquid CO2 injection. Ma et al. [26] performed a liquid CO2 injection test in the Hancheng Mining Area and observed an improved gas extraction efficiency. However, little research has focused on the structural characteristics and fractal geometry features of pores under low temperatures. It is difficult to accurately describe the heterogeneity of coal reservoirs using traditional geometric methods as coal pore structure is a complex, three-dimensional geometric model [27]. A theory based on fractal geometry was presented by Mandelbrot in 1975 [28], and recent studies have stated that fractal theory has provided a useful method to quantitatively define the complexity of the structure, surface roughness, and heterogeneity of coal pores.
Therefore, this study will examine the variation in pore structure parameters before and after coal samples are treated by LqCO2, and the fractal dimensions D1 and D2 will be calculated by LP-N2-Ad, and D4 by MIP. Furthermore, the grey relational theory will be used to describe the relationship between fractal dimension and pore structure parameters. This study could provide a theoretical basis for E-CBM by liquid CO2 injection.

2. Coal Samples and Methods

2.1. Coal Samples Re-Preparation

To discuss the damage effects and fractal characteristics of coal pore structure during LqCO2 injection, three coal samples were taken directly from previous industrial test mines in China: meager coals from the Hancheng Mining Area, Shaanxi Province; and 1/3 cocking coal (denoted as 1/3CC) from Huainan City, Anhui Province. One of the meager coals has a greater hardness (denoted as MHC), while the other is soft (denoted as MSC). Three coal samples were collected following the Chinese Standard Method GB/T 1922-2003. One kilogram of each type of coal was collected and then sent to the experimental laboratory immediately after classification and packing. The basic properties of the coal samples are presented in Table 1.
To test the initial and LqCO2-treated coal samples with full-aperture pore structure-evolution tendencies at room temperature, the low-temperature N2 isotherm adsorption/desorption method was followed using ASAP 2020 (Micromeritics Instrument, Shanghai, China) and the international standard, ISO 15901-3:2007. Auto pore IV 9500 equipment (Shanghai, China) was used for the MIP measurement in accordance with the international standard ISO-15901-1:2005. The coal sample was smashed to a particle size of 80–120 mesh (0.178–0.125 mm) for the LP-N2-Ad test and was crushed to approximately 3.0 mm for the MIP test. Prior to the LP-N2-Ad and MIP tests, the test coal samples were infiltrated by LqCO2, and the infiltration process of three coal samples were as follows.
(1)
Three specimens were infiltrated in LqCO2 at −50 °C for 4 h with self-developed equipment. A previous study indicated that the cooling radius of LqCO2 injected into coal seam was approximately 10 m, meanwhile the coal around the injection hole was fully infiltrated after 4 h of LqCO2 injection [25,26].
(2)
After the infiltration process, raw and treated coal samples were added into a vacuum oven at 65 °C for 12 h until the mass changes in the initial and treated coal samples did not exceed 0.2% [5].
(3)
All the coal samples were desorbed in a vacuum chamber for 48 h to remove the mixed gases adsorbed on the surface of the coal samples.

2.2. Fractal Dimension from LP-N2-Ad Isotherms

Several studies have demonstrated that fractal Brunauer–Emmett–Teller (BET) and Frenkel–Halsey–Hill (FHH) models can be the most practical methods for describing the fractal features of the adsorbed pores of coal reservoirs [29,30]. The FHH model is the most accurate and simplest method of calculating fractal dimensions, as follows [31].
ln V = A [ ln ( ln P 0 P ) ] + C
D = A + 3
where P is the gas equilibrium pressure, MPa; P0 is the gas saturation pressure, MPa; V is the volume of the gas adsorbed at the equilibrium pressure, cm3/g; D is the fractal dimension, which can be calculated by Equation (2), whereas D = 3A + 3 is usually <2, and this calculation method is beyond the definition of fractal dimension; and A is the slope, which can be calculated by plotting the gas adsorption isotherm data in terms of lnV vs. ln[ln(P0/P)].

2.3. Fractal Dimension from MIP

The fractal dimension of seepage pores (>100 nm in diameter) can be calculated from the data provided by the MIP test. Several mathematical models for the fractal analysis of seepage pores have been proposed and discussed by scholars in detail [32]. The seepage pore fractal model was initially presented by Mikula and Friesen [33], and was selected to calculate the fractal dimension of seepage pores in this study (Equation (3)):
ln [ d V d P ] = ( D 4 ) ln P
where P represents the absolute injection pressure, MPa; V is the cumulative mercury injection volume at the correlative pressure P, cm3/g; and D is the fractal dimension of the seepage pores that was obtained from the MIP data.

2.4. Grey System Theory

The grey relational space theory was proposed in Chinese by professor Deng JL and has been developed rapidly over the last few decades [34,35]. Grey relational analysis is a systematic method that can quantitatively compare and describe the subject investigated [35]. The core target of grey relational analysis is determining whether the influencing factors and the research objects are closely linked according to the degree of similarity between the shapes of the sequence curve. The degree of similarity between the research object and impact factors is also described using grey relational analysis [36,37]. Using this method, the similarity between the coal pore fractal dimensions and structural parameters (including porosity, permeability, APD, SSA, and TPV) before and after LqCO2 treatment can be analyzed, and the grey relational degree can be used to quantitatively describe the damage to the coal pore structure and changes in its fractal characteristics caused by LqCO2 freezing-thawing.
The fractal dimensions of coal pore structure for the initial and LqCO2-treated coal samples can be taken as the system behavior sequences X 0 and X 0 , respectively. Additionally, the structural coal pore parameters were selected as the systematically internal correlation sequences X i and X i (i = 1, 2, 3, 4, 5). Therefore, the correlation coefficients ζ i ( k ) and ζ i ( k ) can be defined as follows [34]:
ζ i ( k ) = min i   min k | X 0 ( k ) X i ( k ) | + ρ   max i   max k | X 0 ( k ) X i ( k ) | | X 0 ( k ) X i ( k ) | + ρ   max i   max k | X 0 ( k ) X i ( k ) |
The grey relational degree r i , r i (ranging from 0.0 to 1.0) among X 0 , X 0 and X i , X i can then be calculated by the following equation [34,35,36,37]:
r i = k = 1 n ζ i ( k ) n
where k is a constant with a value of 1, 2, or 3; ρ is a correction factor with a value of 0.5; and n represents the three coal samples with a value of 3.

3. Results and Discussion

3.1. Evolution and Fractal Characteristics of Adsorbed Pores

3.1.1. LP-N2-Ad Isotherms and Pore Structure Parameters Analysis of Adsorbed Pores

The LP-N2-Ad isotherms for the studied coal samples are shown in Figure 1. All isotherms for the adsorption curves show that the hysteresis loops for the tested coal samples are of type B according to the International Union of Pure and Applied Chemistry. When the relative pressure is 0.5, the desorption curves have an inflection point that divides the curves into two regions (regions 1 and 2). At a relative pressure of 0 < P/P0 < 0.5 (region 1), the adsorption curves increased more slowly, and the coal matrix surface is a monolayer of adsorbed nitrogen molecules [38]. Furthermore, multilayer adsorption occurred at a relative pressure of 0.5 < P/P0 < 0.95 (region 2), when the adsorption curves gradually increased. The adsorption curves then increased sharply as the relative pressure exceeded 0.95, indicating that capillary condensation occurred in accordance with the Kelvin equation, increasing the quantity of adsorbed nitrogen [39].
The type of pore hysteresis loop indicated the presence of cylindrical-shaped pores with one closed side, slit-shaped pores with all sides open, and bottle-shaped pores in the studied coal samples [40]. However, there are many open pores in the 1/3CC coal sample as the hysteresis loop was not closed because the relative pressure was below 0.5 [41]. Thus, the pore structure of the studied coal sample is appropriate for CBM gathering, but detrimental for gas seepage [42]. Moreover, Figure 1 indicates a large difference between the raw and LqCO2-frozen coal samples. The quantities of adsorbed nitrogen molecules in the untreated MHC, MSC, and 1/3CC coal samples were 2.46, 1.14, and 5.56 cm3/g (Figure 1a), respectively. However, when the coal samples were infiltrated by LqCO2, the quantities of adsorbed nitrogen molecules were 2.93, 1.54, 6.23 (Figure 1b), respectively. This indicates that the structure of coal pores was damaged by the frozen-heave force as the LqCO2 infiltrated coal samples, causing changes in the relevant parameters. The coal pore structure was also damaged by the prestressing and shearing stress in the infiltration process, performed the coal matrix shrinkage and the surface was more rough and complex under low temperature by LqCO2 infiltration [25]. This result was different from the study of Zhang et al. [23,24], and Zhang’s article mainly used Discrete Element Method (DEM) model to simulate the cleats’ variation in the swelling process under high temperature and high pressure conditions [24]. To accurately determine the effect of LqCO2 infiltration, further analysis is based on the pore structure parameters of the coal samples [5].
Figure 2 shows the relationships of the APD, BET surface area, and Barrett–Joyner–Halenda (BJH) pore volume with the untreated and LqCO2-treated coal samples under relative pressure conditions. The APD, BET surface area, and BJH pore volume increased when the coal samples were frozen by LqCO2, which is in agreement with the results of Wen and Xu et al. [5,21]. The APD of the adsorbed pores of the treated samples were 9.88, 6.34, and 6.96 nm larger than those of the initial samples, respectively. The SSA and TPV of the three LqCO2-treated coal samples were generally higher than those of the original samples. For instance, the SSA of the treated coal samples were 23.53 (MHC), 13.52 (MSC), and 4.08% (1/3CC) higher than that of the raw samples, and the TPV were 14.90 (MHC), 12.64 (MSC), and 11.87% (1/3CC) higher, respectively. It can be concluded that the pore structure of coal is damaged by the frost heaving force of liquid CO2 at low temperature [41]. The damage occurs due to the generation of countless micropores and transition pores, as the SSA and TPV of the adsorbed pores are higher. However, many of the adsorbed pores are converted into mesopores and macropores at low temperature [21]. The SSA and TPV of the micropores and transition pores are presented in Table 2. These results indicated that the pore structures of the treated coal samples varied distinctly.

3.1.2. Fractal Characteristics of the Adsorbed Pores from Raw and LqCO2-Treated Coal Samples

The FHH model was used to calculate the fractal dimensions of the original and LqCO2-treated coal samples, as shown in Figure 3. The ln(ln(P0/P)) vs. ln(V) fitting curves represented the LP-N2-Ad isotherms and can be divided into two segments with delivery points equal to approximately −1.5. From the above analysis and isotherm descriptions, monolayer adsorption generally occurred in region 1, where nitrogen molecules are gradually adsorbed to the pores of the coal sample. Accordingly, the fractal dimension D1 was calculated to be in region 1 and could be used to describe the fractal characteristics of the pores’ surface areas [16]. Multilayer adsorption and capillary condensation mainly occurred in region 2, and the fractal dimension D2 was calculated in region 2 and can be used to describe fractal characteristics of internal pore structure [43].
The fractal dimensions D1 and D2 for the initial and treated coal samples are presented in Table 3. The D1 and D2 of the three treated coal samples were typically higher than those of the untreated samples. D1 ranged from 2.46 to 2.63 (avg. 2.55), while D2 ranged from 2.83 to 2.93 (avg. 2.87) for the raw coal samples. After the coal samples were frozen treated by LqCO2, D1 ranged from 2.47 to 2.65 (avg. 2.58) and D2 ranged from 2.85 to 2.94 (avg. 2.90). It can be known that the coal matrix’s surface and internal pore structure of the treated samples were more rough and complex due to the damaged effect by the frost-heave force as the coal samples infiltrated in LqCO2, which caused the increase in the fractal dimension [22,26,42]. There is a positive linear correlation between D1 and D2 (Figure 3), which is consistent with the results of previous research [5,16,43]. The fractal characteristics of the adsorbed pores were clearer when the coal samples were frozen by LqCO2 [32]. Research has demonstrated that the mesopores and macropores influence coal pore seepage properties [44], exceeding the test scope of LP-N2-Ad. Therefore, other investigations should be conducted.

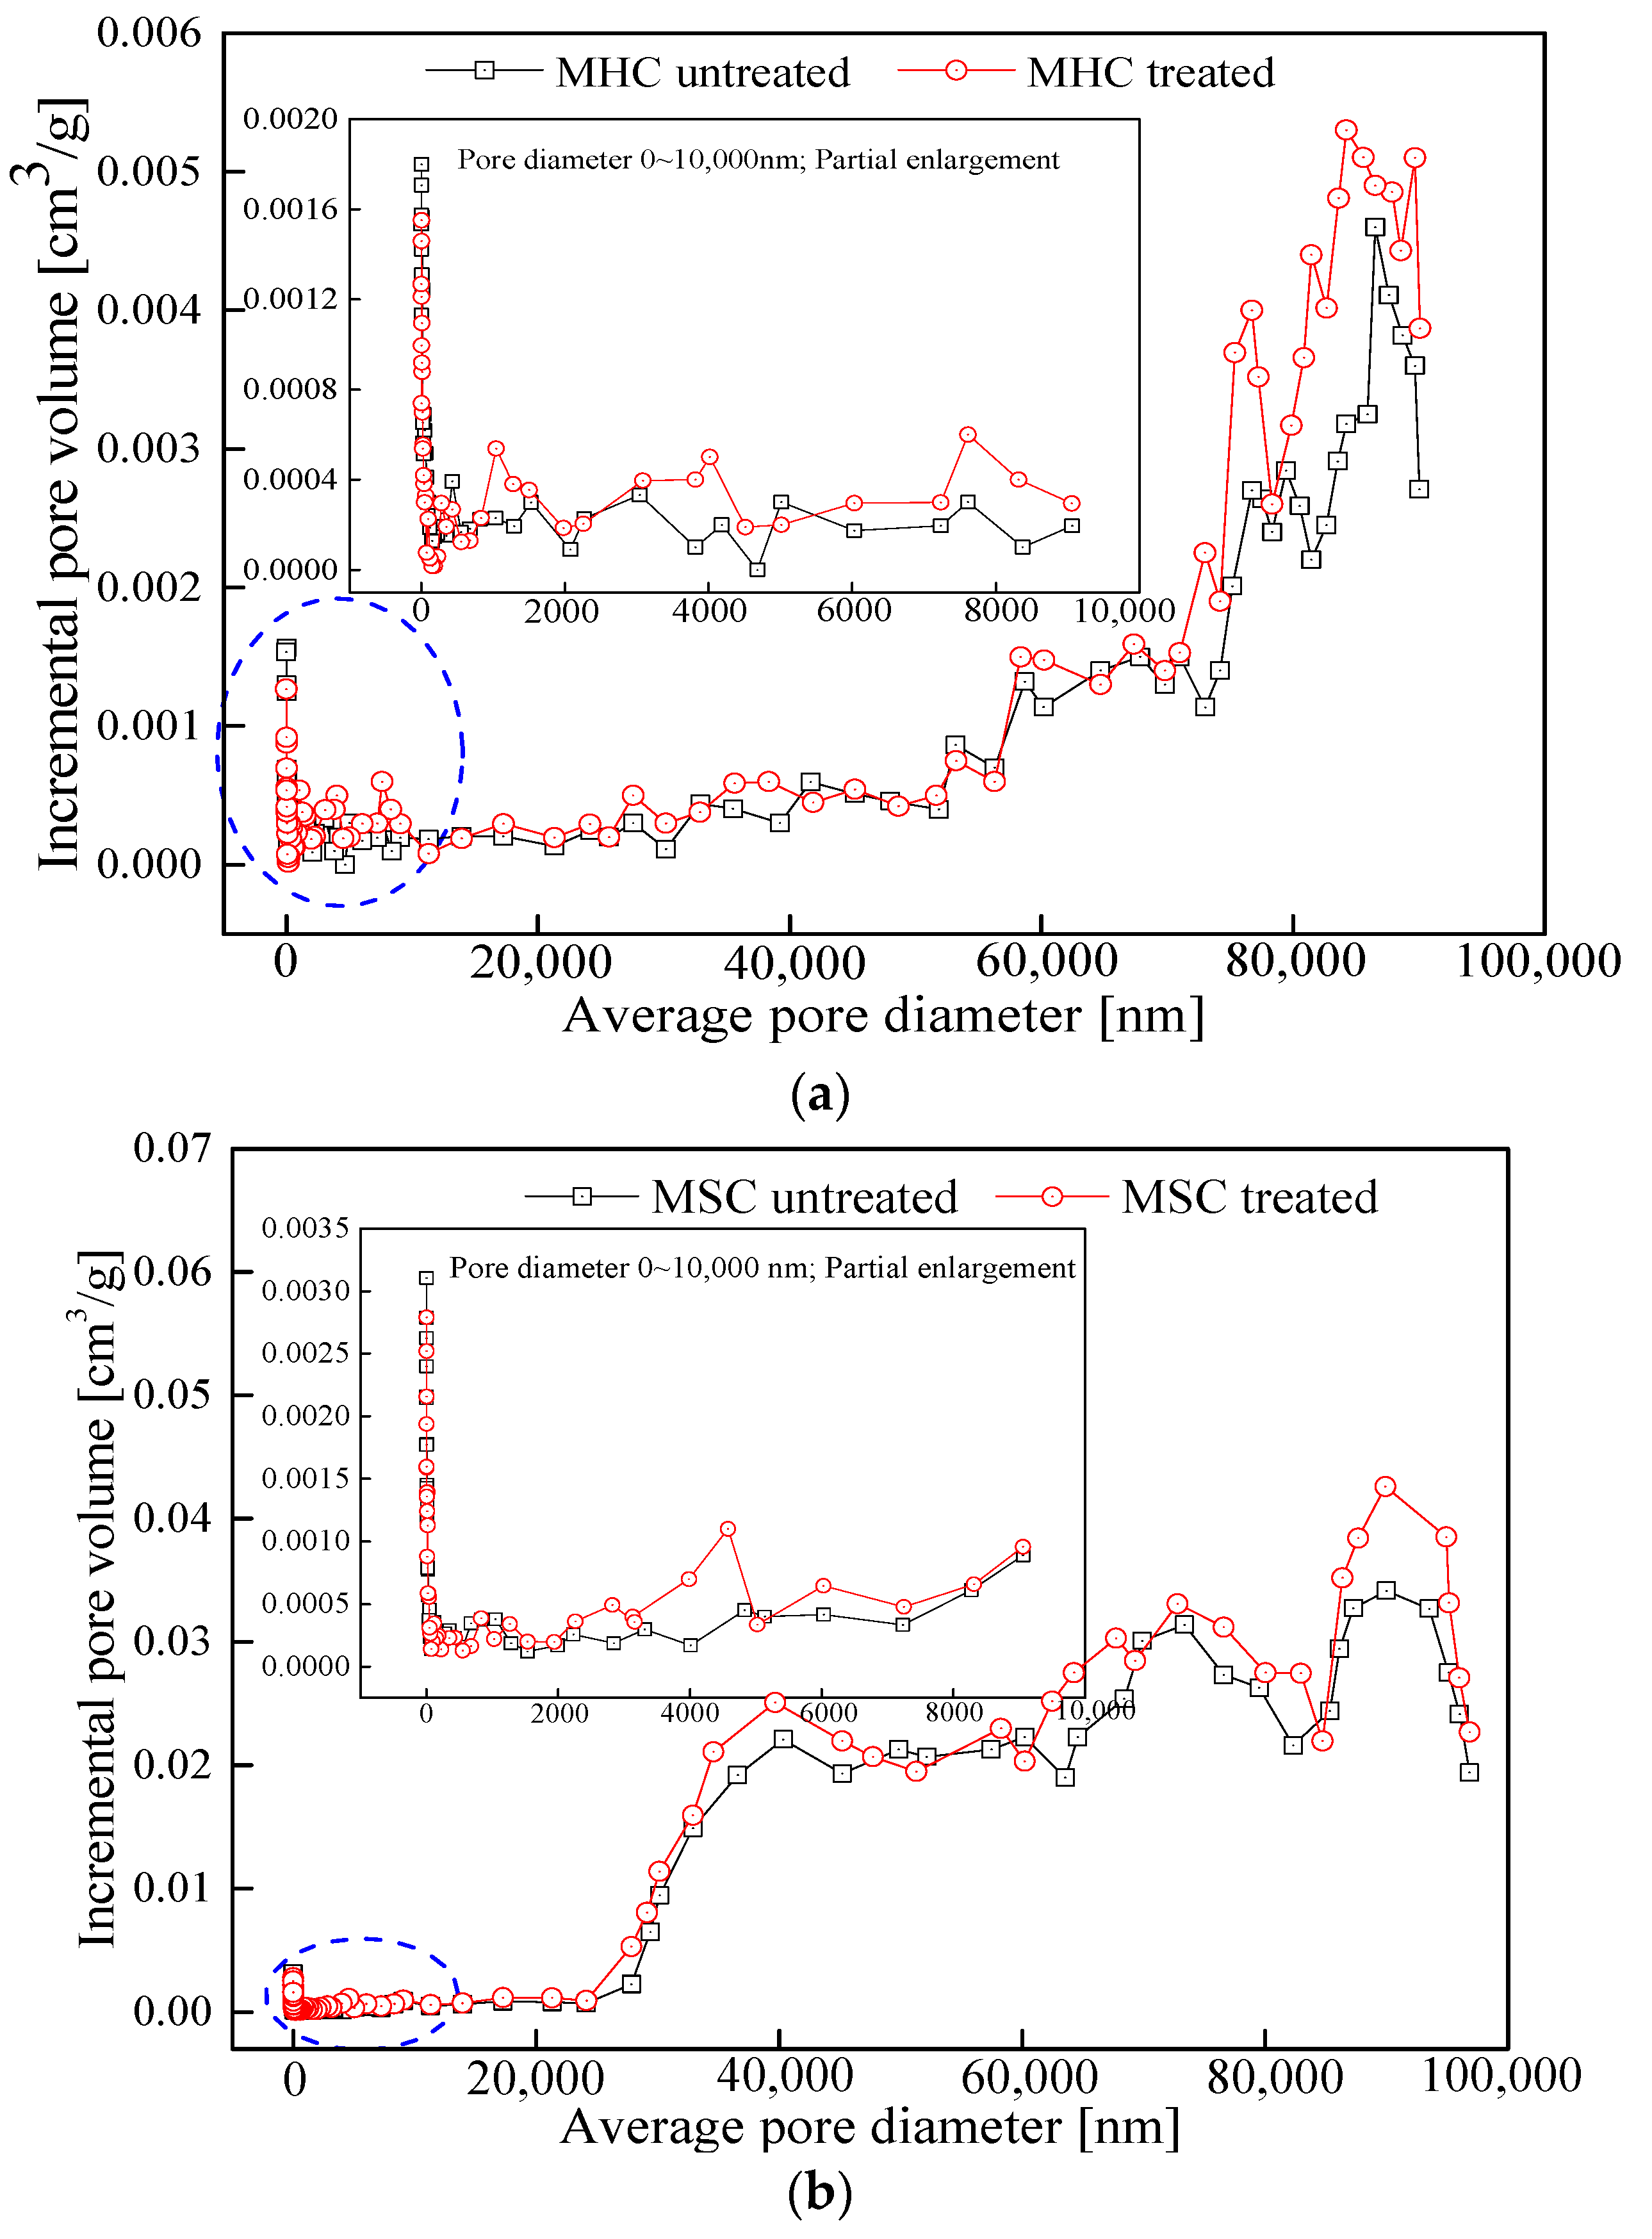
3.2. Variations and Fractal Characteristics of Seepage Pores
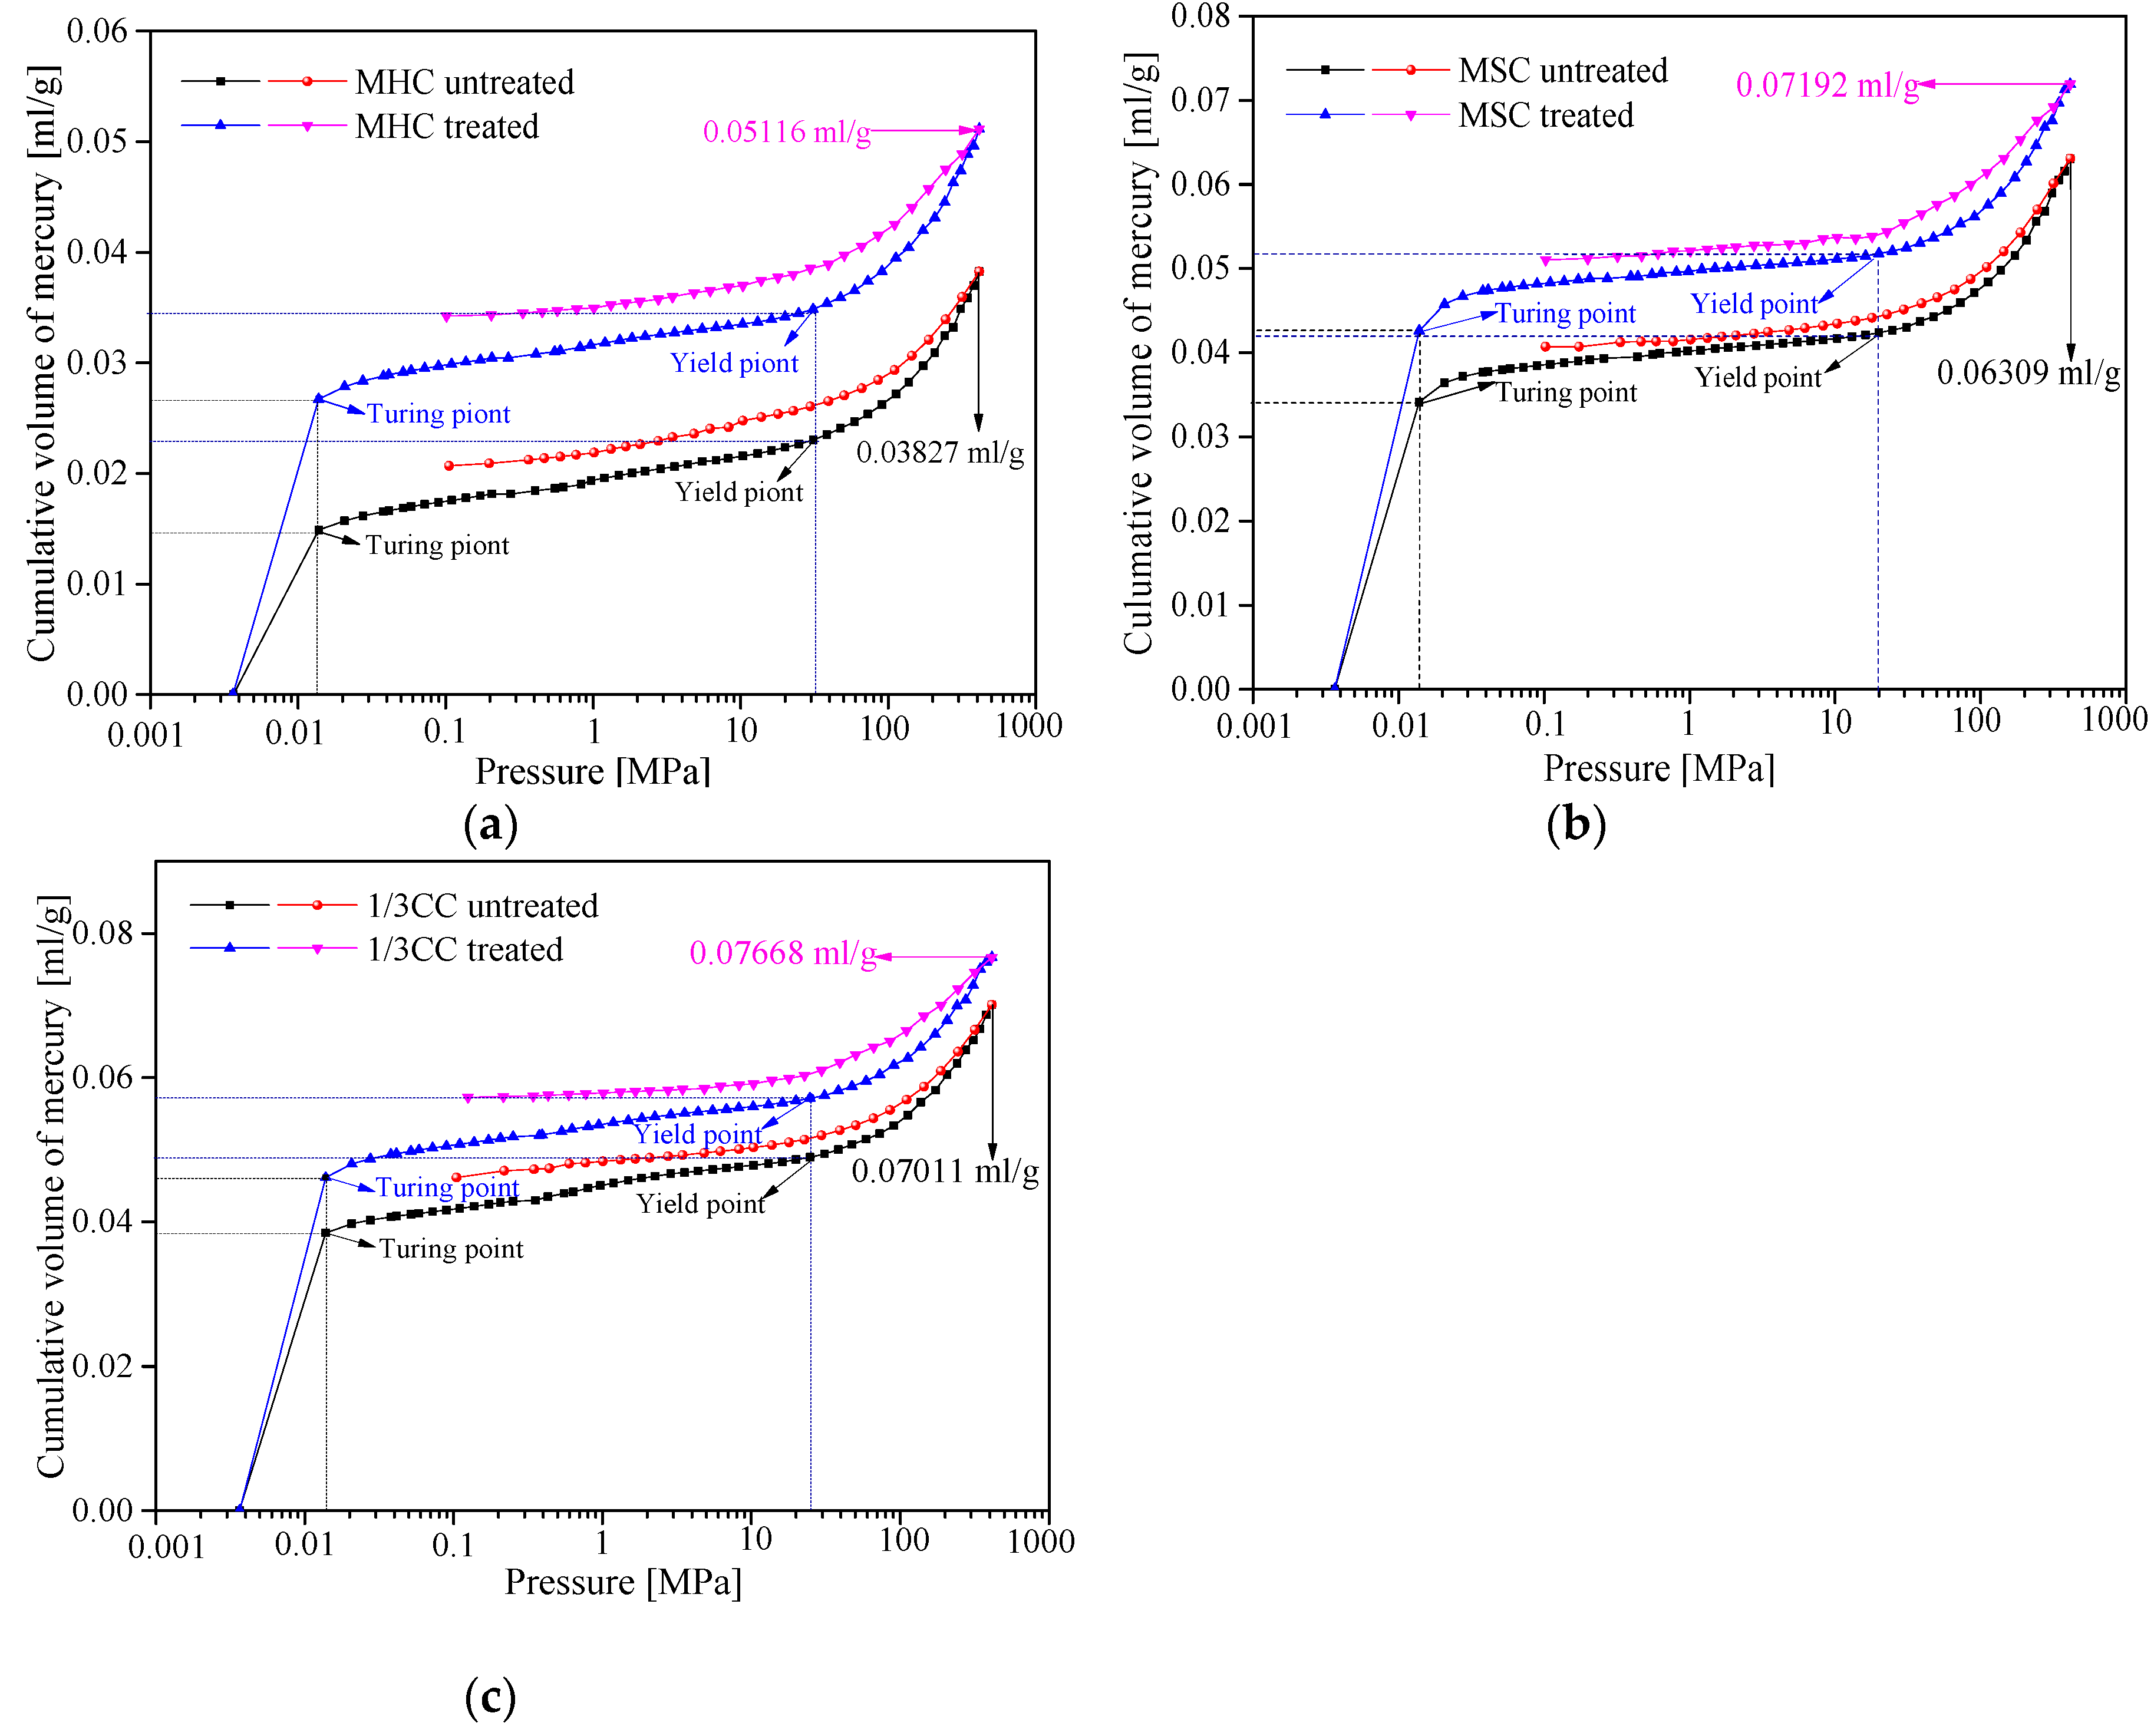
3.2.1. MIP Curves

The MIP method is widely used for analyzing the structural characteristics of the seepage pores of porous materials [15,31]. Thus, this method was applied in this study to test the structural properties of the seepage pores and their fractal characteristics. The MIP curves for the initial and LqCO2-treated samples are shown in Figure 4. MIP curves have some clear traits that have been researched previously [5,19], and can be divided into three sections, as shown in Figure 4. The cumulative mercury volume increased rapidly in section 1, before the intrusion pressure increased from 0.0013 to 0.035 MPa, the intruded mercury volume for the raw coal samples were 0.015 (MHC), 0.034 (MSC), and 0.039 mL/g (1/3CC), respectively, while those for the three treated coal samples were 0.027 (MHC), 0.041 (MSC), and 0.044 mL/g (1/3CC), respectively. At this point, the mercury molecules come into contact with the coal’s surface and enter the pores (pore size: 10–20 μm). When the pressure exceeded 0.0013 MPa, the curves changed as the intrusion pressure continued to increase, the cumulative mercury volume in Section 2 increased slowly until the pressure reached 50 MPa. During this period, the mercury molecules entered the internal pore spaces (pore size: 0.03–0.15 μm), and the mercury intrusion volumes of the untreated coal samples were 0.025, 0.042, and 0.051 mL/g, respectively. However, those of the treated coal samples were 0.051, 0.052, and 0.058 mL/g, respectively. When the pressure reached 50 MPa, the yield point was reached and coal matrix compression began, particularly for the seepage pores (i.e., mesopores and macropores). The capillary condensation phenomenon would occur in Section 3 as the injected mercury pressure increased from 50 to 100 MPa. Furthermore, the coal matrix would be compressed by the largest injection pressure. Therefore, the intrusion volumes in this section were 0.038, 0.063, 0.0701 mL/g for the initial samples, respectively, and 0.051, 0.072, 0.077 mL/g for the infiltrated coal samples, respectively.
From the MIP curves, it can be concluded that pore volume is significantly enhanced by treatment with LqCO2. The total pore volume was increased, based on the results of the MIP test. Some new adsorbed and seepage pores may have been generated, and the coal pore structures may have converted between each other [19]. Therefore, more detailed investigation of the next step is required.

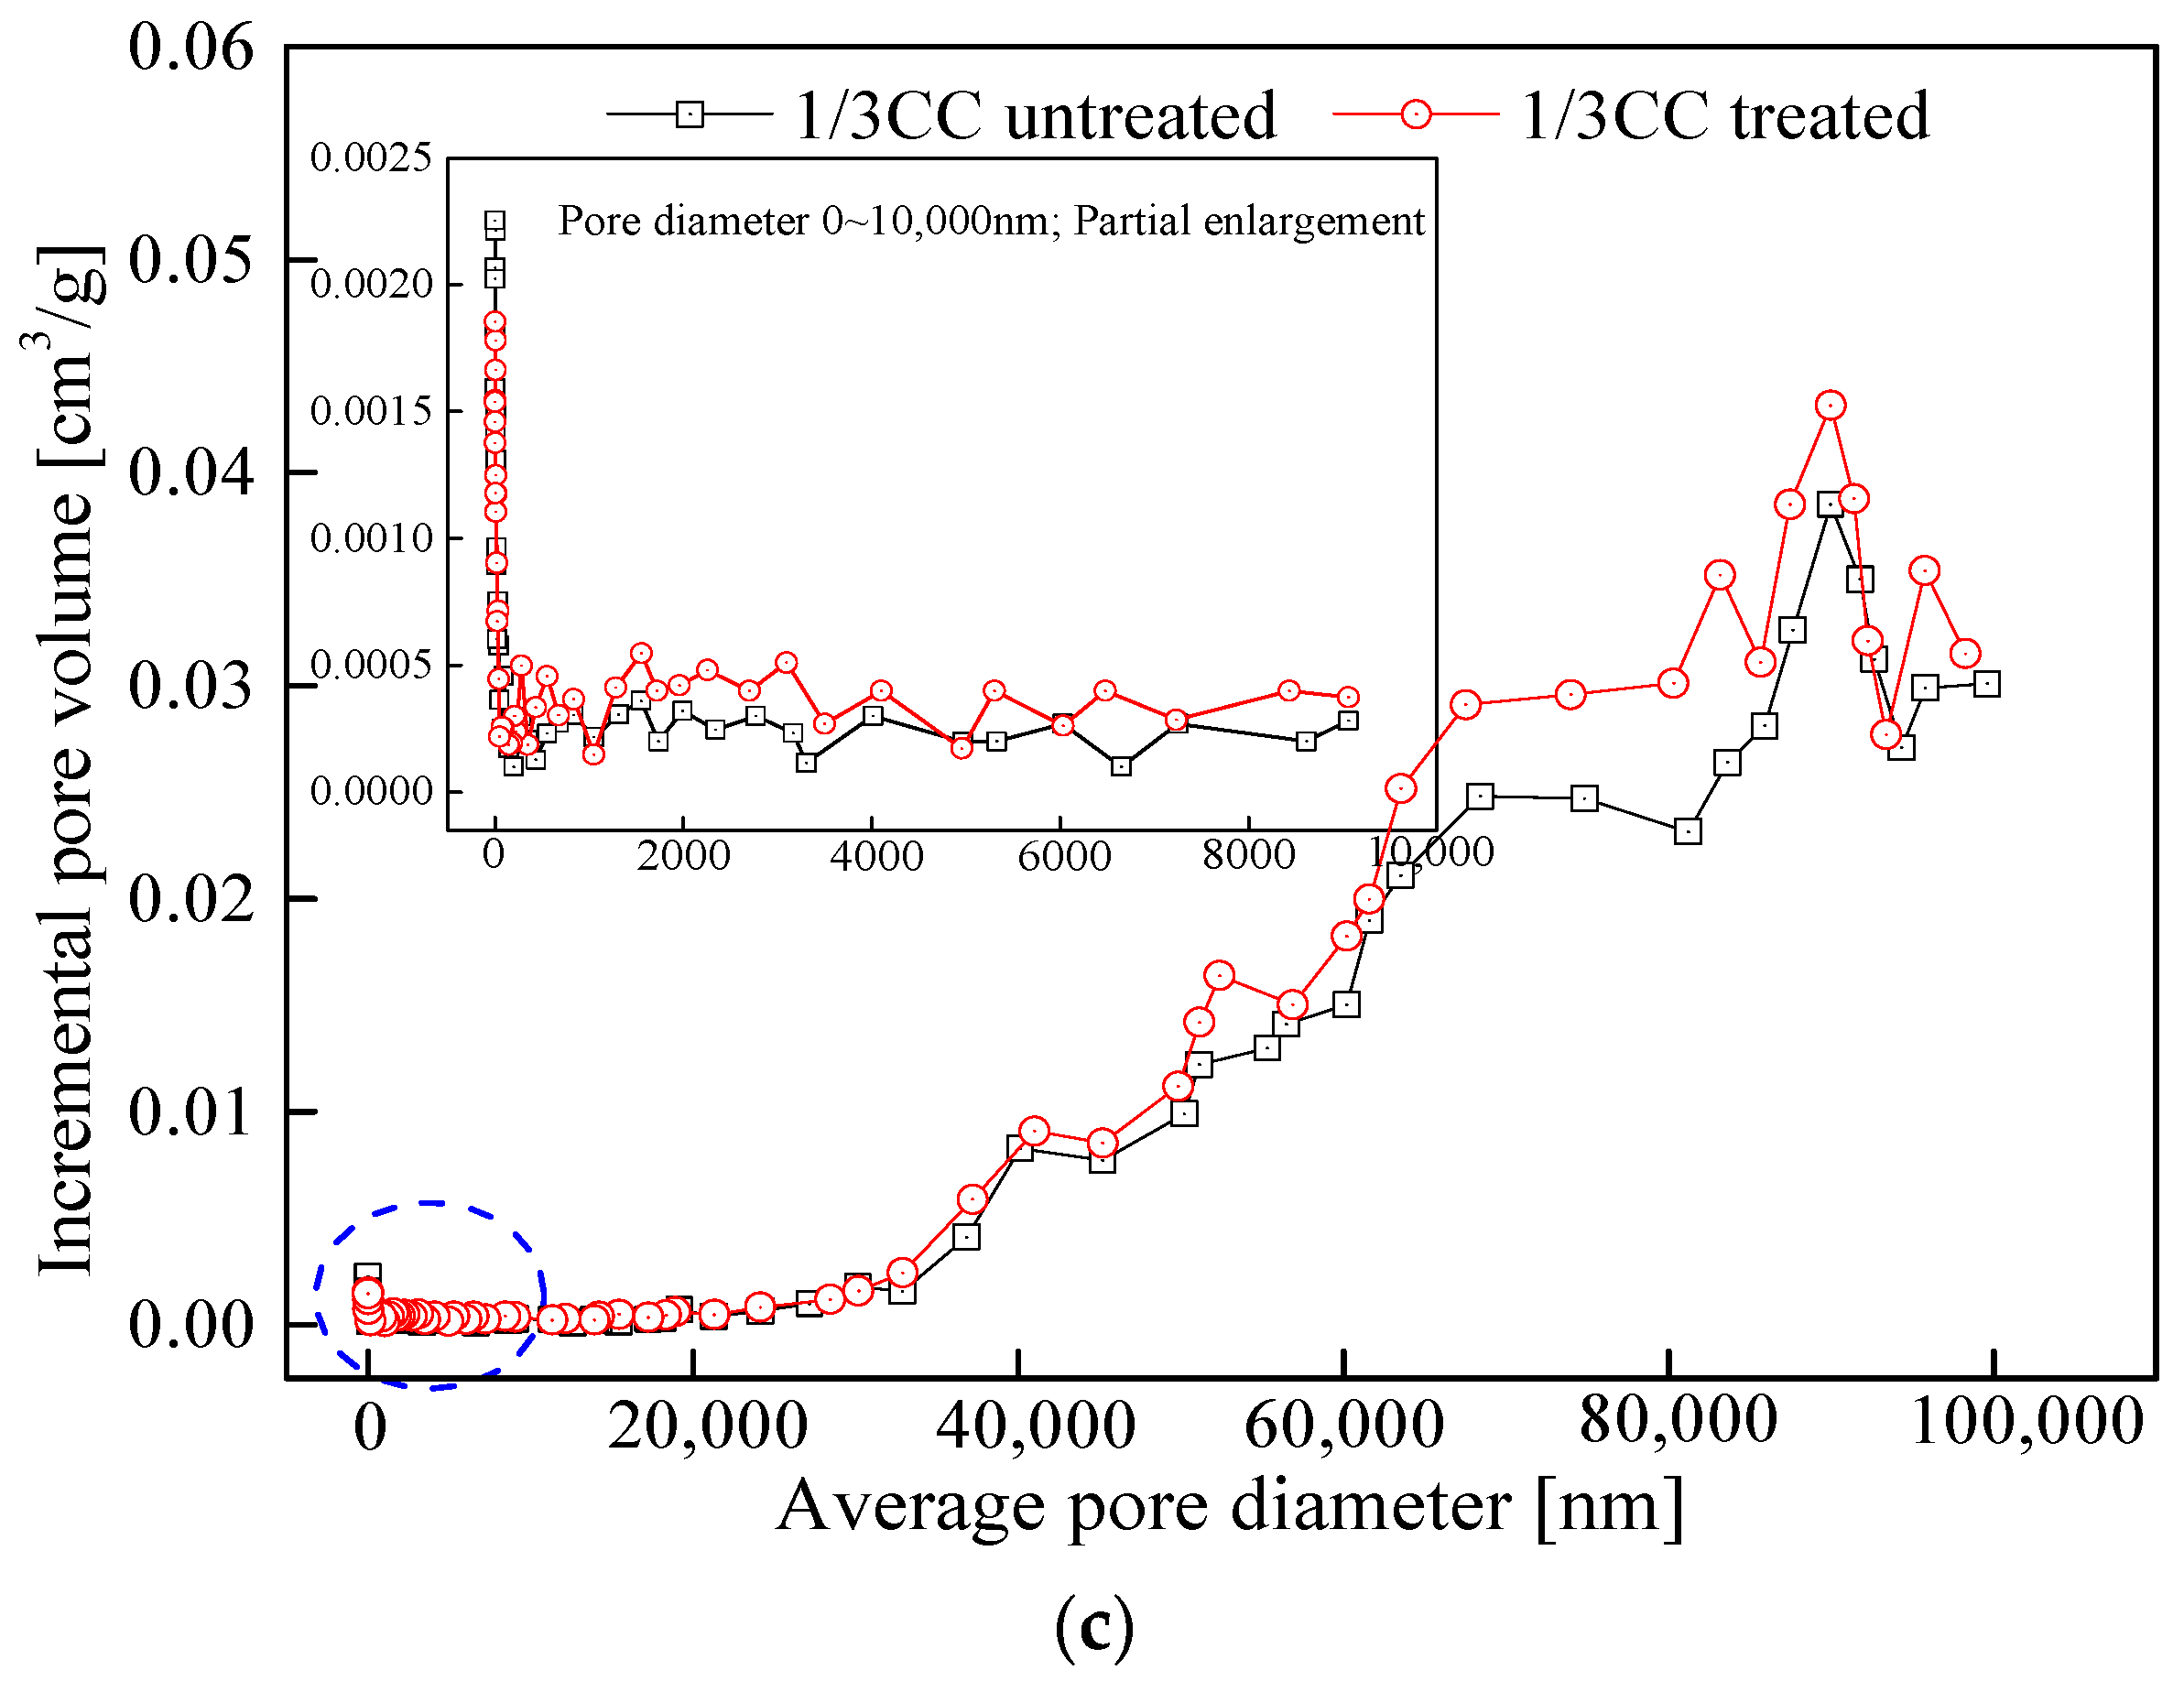
3.2.2. Pore Structure Parameters Analysis of Seepage Pores

The variation in pore structure parameters obtained from the MIP for the coal samples is listed in Table 4. Before the infiltration of LqCO2, the porosity of the initial samples was 5.47, 7.63, and 8.77%, respectively. However, those of the treated coal samples increased to 7.03, 8.57, and 9.44%, respectively. Thus, the porosity increased by an average of 12.82% after the coal samples were treated by LqCO2. Similarly, the permeability of the treated samples was increased at an average rate of 7.64%. The growth rates of the APD, SSA, and TPV were 18.50, 16.16, and 20.11% (avg. 18.2%), 6.34, 4.42, and 11.38% (avg. 7.38%), and 8.60, 13.95, and 25.20% (avg. 18.26%) higher than those of the raw coal samples, respectively. It is revealed that new pores were generated, including more macropores and some micro-fractures from the transformation of prime pores during LqCO2 treatment [5,27]. These results exhibit similar variations in micropores and transition pores to those obtained using LP-N2-Ad.
The pore size distribution and incremental pore volume of the untreated and treated coal samples are given in Figure 5. The incremental seepage pore volume for the treated coal specimens is larger than that of the original coal samples, and the adsorbed pore volume of the treated specimens was slightly higher because the structure of coal pore was damaged by LqCO2 infiltration under the low temperature (i.e., −50 °C), indicating that the methane seepage and diffusion ability of the treated samples were increased, while the adsorbed capacity was decreased [42]. Furthermore, the application site of LqCO2 injection has revealed that the permeability and gas extraction efficiency of the coal seam was significantly improved [25,26]. However, the fracture damage effect of coal with the LqCO2 injection needs further research, and the result of Zhang’s research will provide great enlightenment for future research.

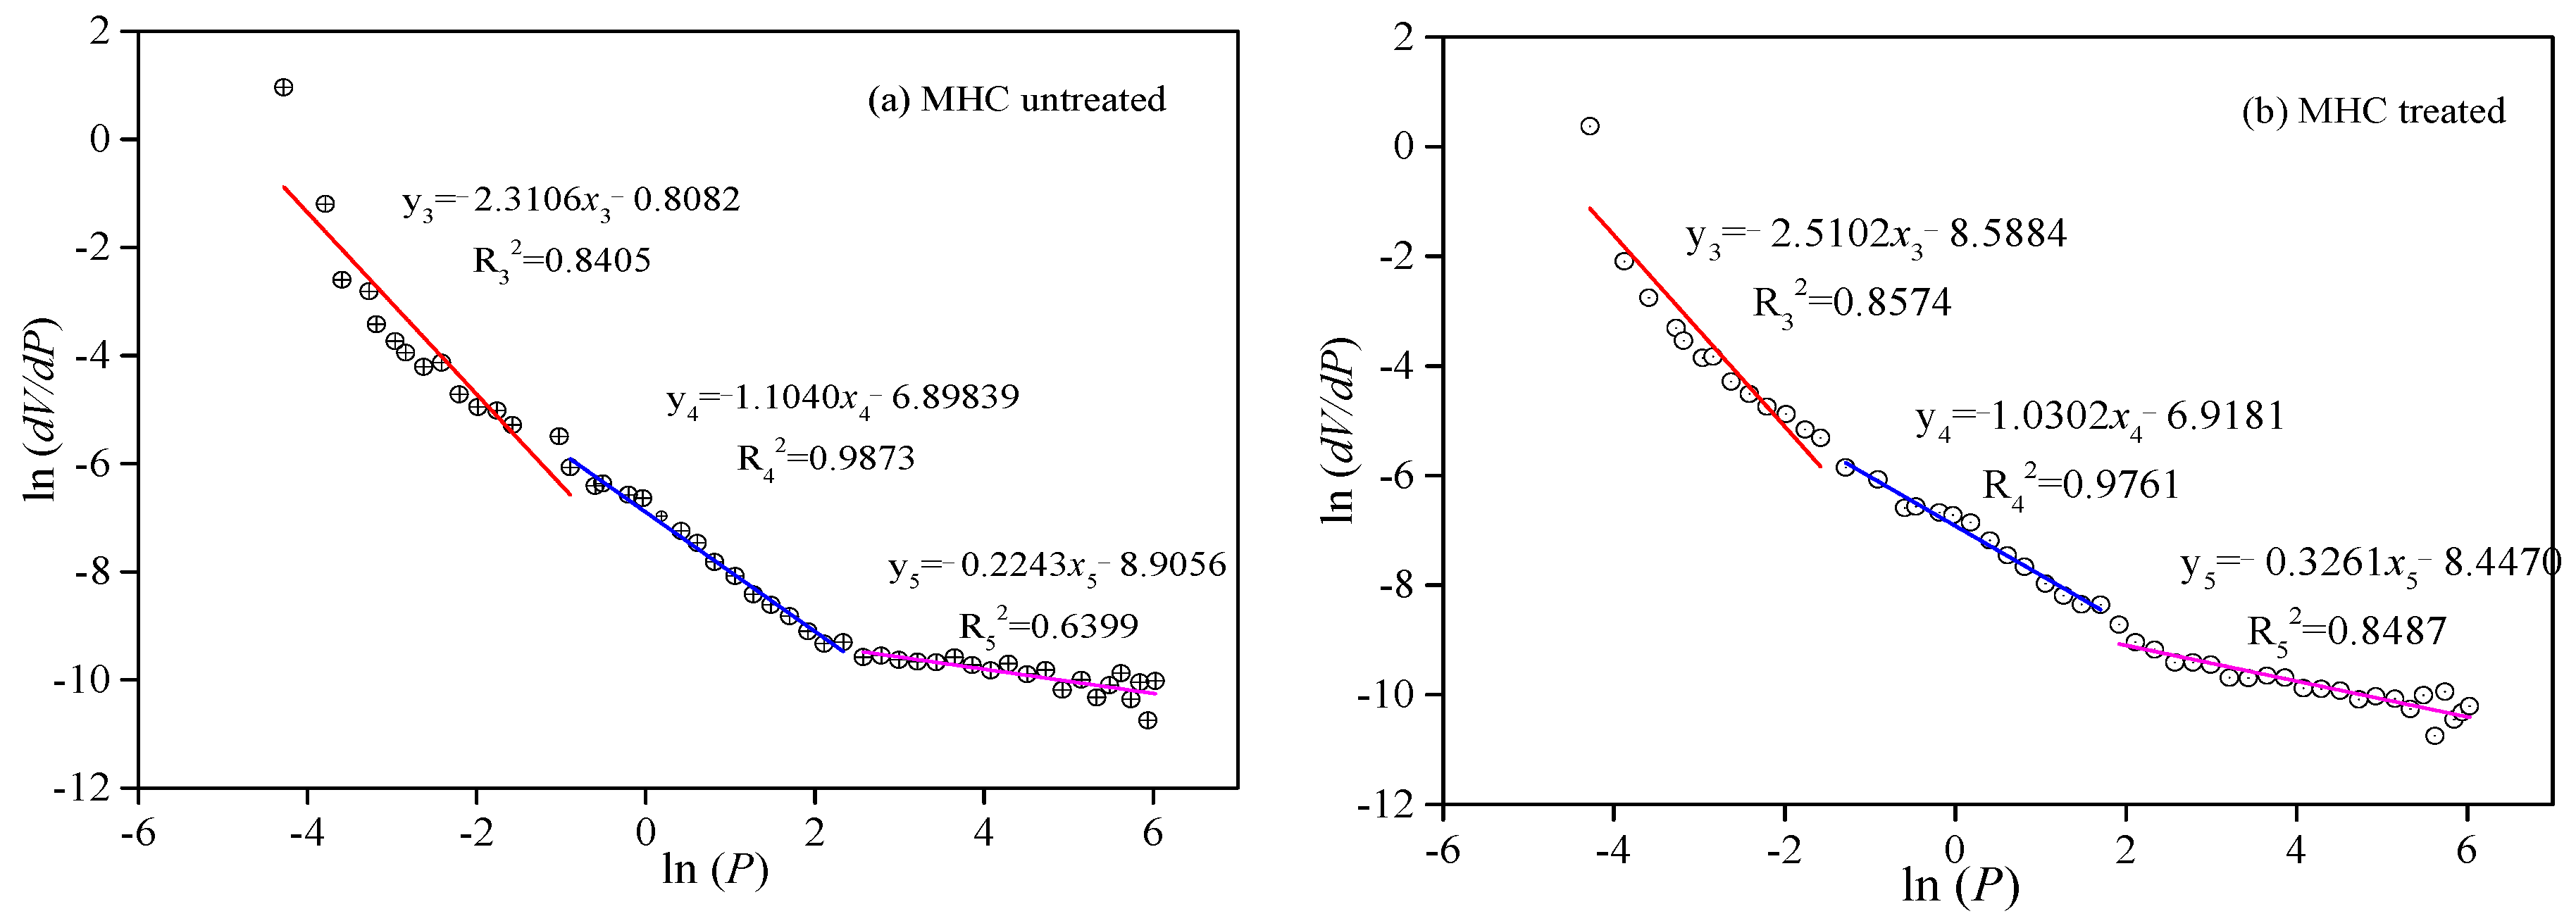
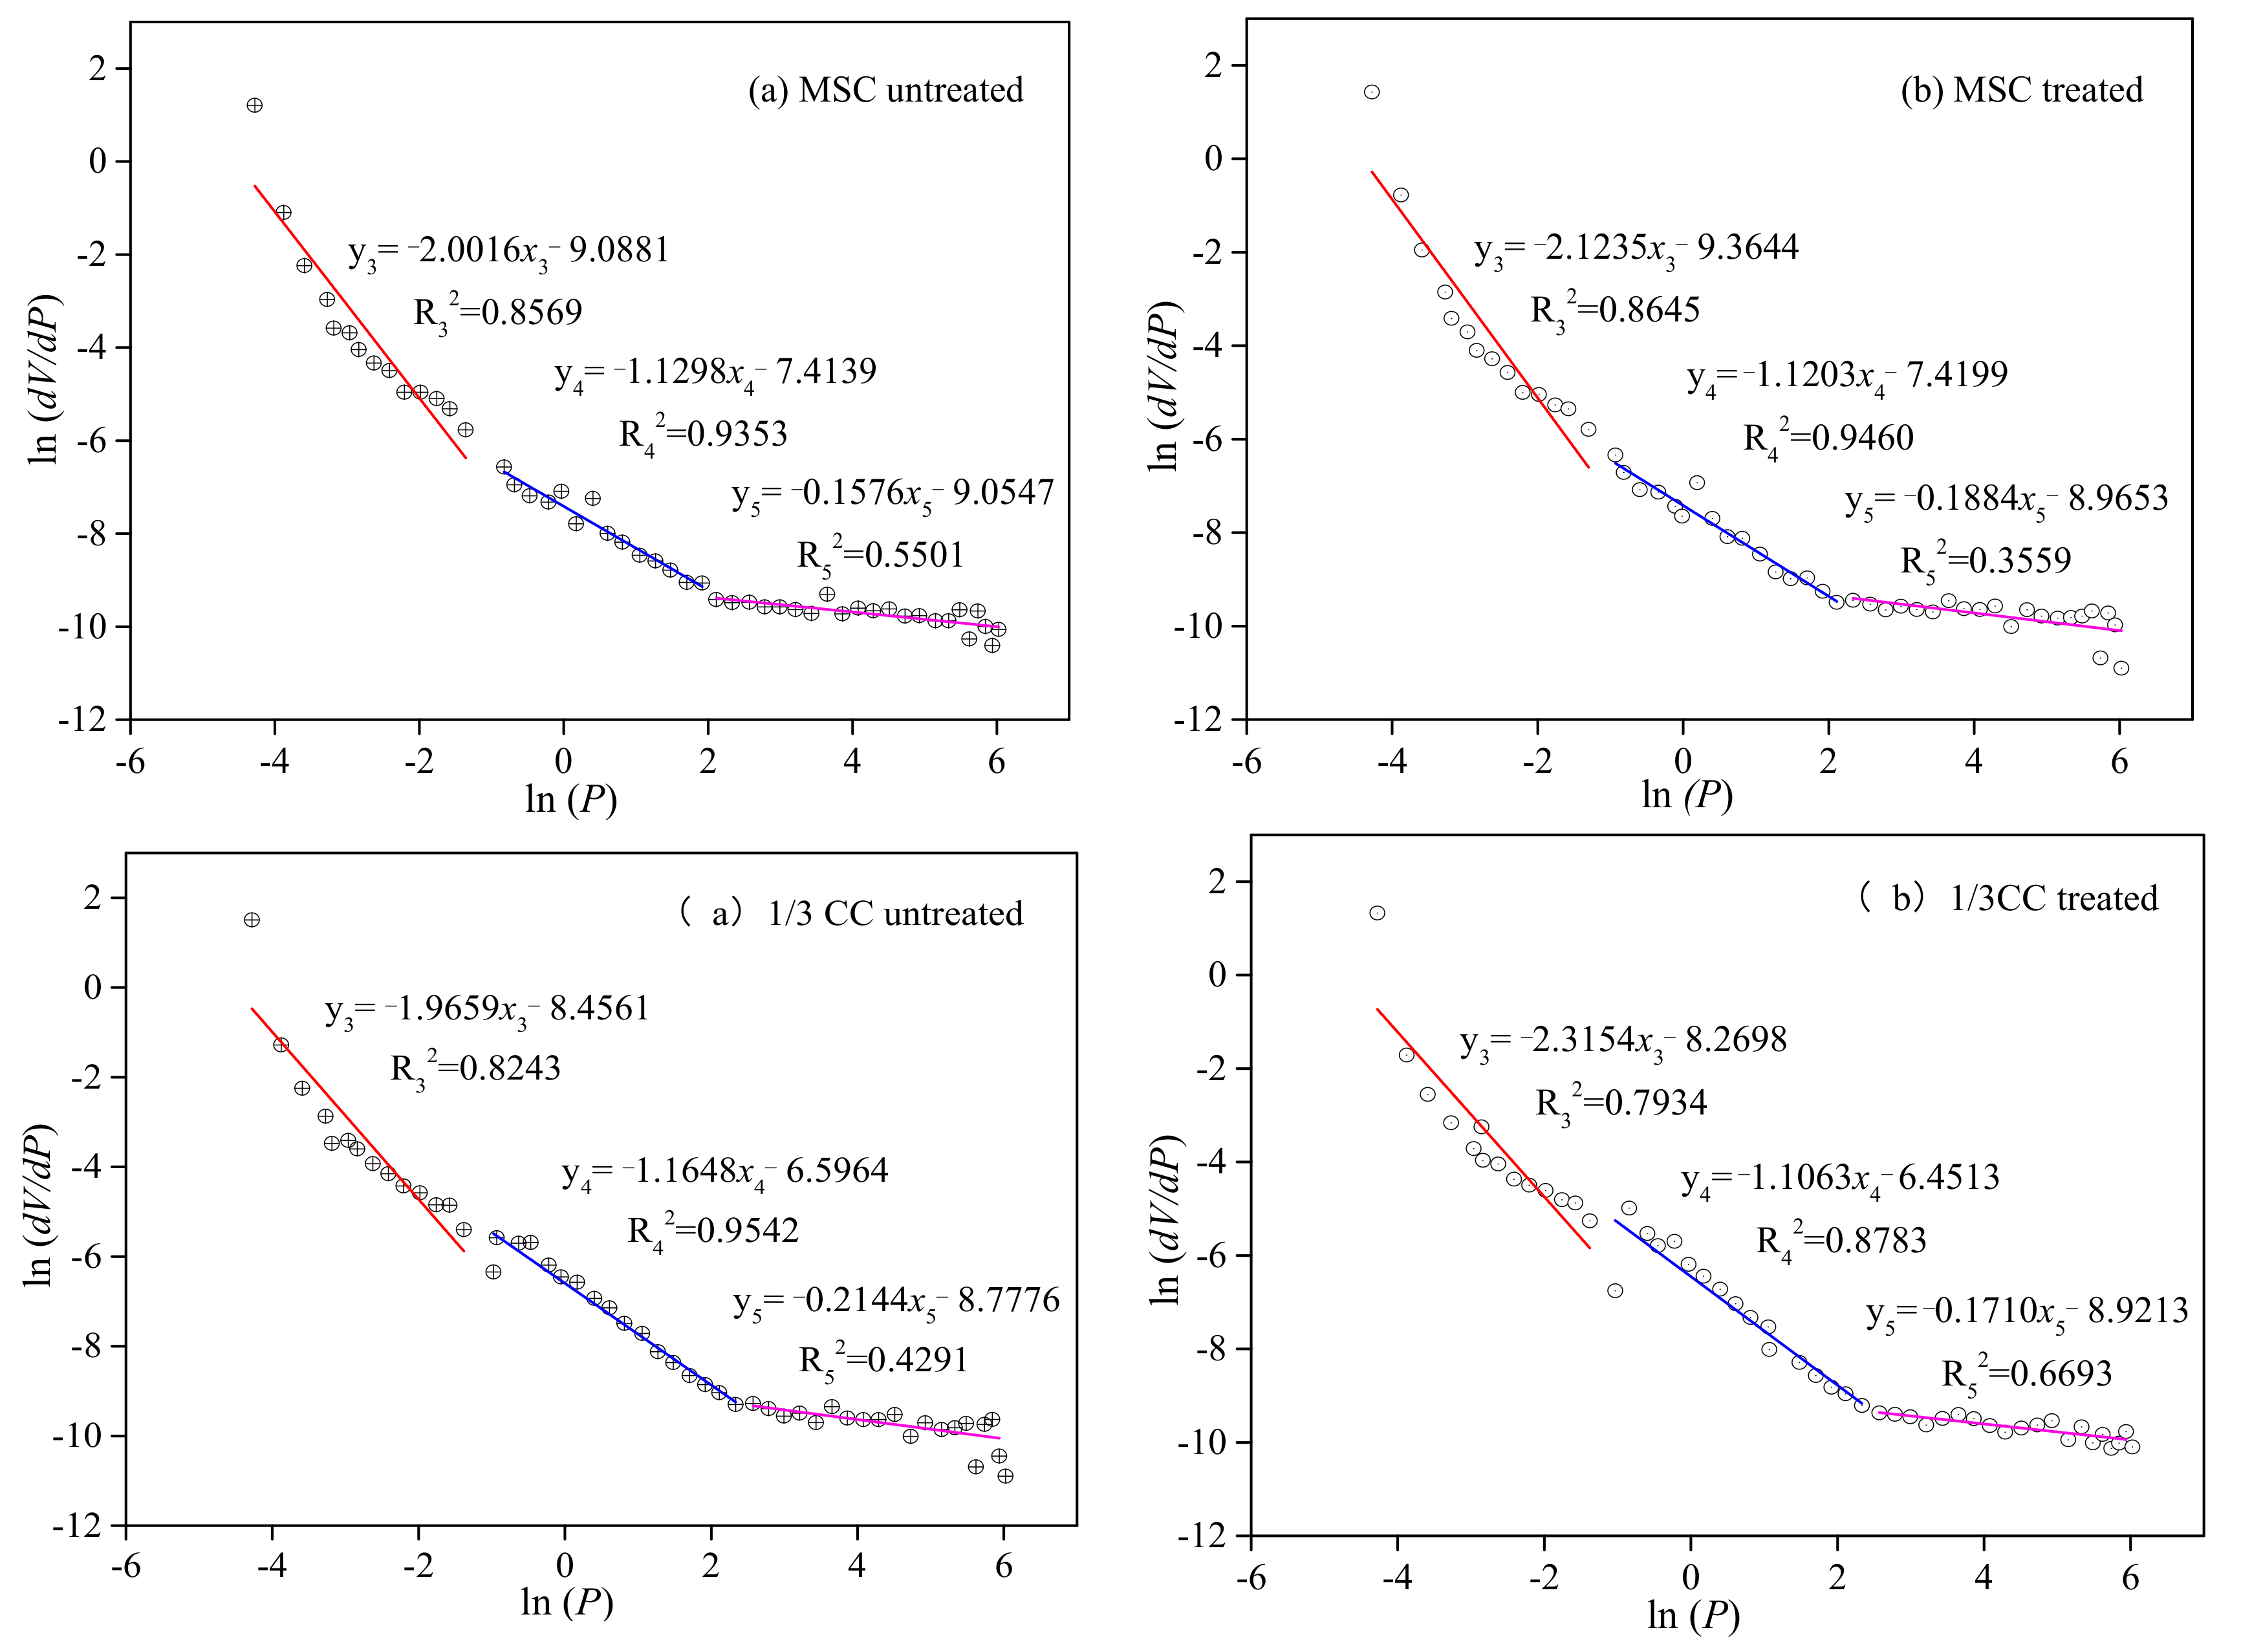
3.2.3. Fractal Features of Seepage Pores between the Initial and LqCO2-Treated Coal Samples

The calculation processes for the fractal dimensions of the seepage pores in the tested coal samples are shown in Figure 6. The fractal dimensions D3, D4, and D5 were calculated from the three parts that were divided by the relationships between the ln ( d V / d P ) and ln(P) for the three coal samples, based on Equation (3). Previous studies demonstrated that D3, D4, and D5 were related to coal particle shape, internal seepage pore structure, and coal matrix compressibility [15,45], respectively. The values of the three fractal dimensions for all coal samples are listed in Table 5. From the fractal theory model, the fractal dimension Di ranged from 2 to 3 and is a suitable parameter for discussing the fractal characteristics of the coal matrixes surface [16]. The value for D3 was below 2 (avg. 1.80) except for the untreated 1/3CC coal sample, while all values for D5 exceeded 3 (avg. 3.79). D3 and D5 were outside the range of the denoted fractal theory, therefore these dimensions are meaningless in this section. However, fractal dimension D4, which corresponds to intra-particle filling and can describe the mesopore and macropore matrix surface features, was between 2 and 3 for all samples, and thus D4 can be used to determine the characteristics of the seepage pores [45]. The value of D4 for the original coal sample ranged from 2.84 to 2.89 (avg. 2.86), while that for the treated samples increased from 2.88 to 2.97 (avg. 2.91) at an average rate of increase of 1.62%.
The treated coal sample had a more complex morphological pore structure under cryogenic freezing conditions, and the roughness and irregularity of the coal pore surfaces were the most prominent characteristics of the treated coal sample. Combined with the pore structure results from Table 4, the larger the APD, SSA, and TPV, the higher the value of D4. These features indicate that the coal pore structure was transformed, and the seepage pore structure was more complicated [5,15].

3.3. Grey Relational Application and Discussion

3.3.1. Calculated Degrees of Correlation

From Table 4 and Table 5, the grey systematic behavior sequences X 0 , X 0 can be calculated by the equalization and dimensionless data transformation of the fractal dimensions Dj (j = 1, 2, 4). The internal effect factor sequences X i , X i (i = 1, 2, 3, 4, 5) can also be calculated from the coal pore structure parameters in Table 4 following the same method. The results are as follows [34].
[ X 0 X 1 X 2 X 3 X 4 X 5 ] = [ 1.01 , 1.00 , 0.99 0.75 , 1.05 , 1.20 0.89 , 1.27 , 0.85 0.82 , 1.05 , 1.13 0.87 , 1.08 , 1.05 0.67 , 1.11 , 1.23 ]   and   [ X 0 X 1 X 2 X 3 X 4 X 5 ] = [ 1.02 , 0.99 , 0.99 0.85 , 1.02 , 1.10 0.93 , 1.22 , 0.85 0.84 , 1.02 , 1.13 0.88 , 1.01 , 1.03 0.76 , 1.04 , 1.13 ]
The differences in the absolute values of X 0 , X 0 and the corresponding X i , X i are obtained (Table 6), and these values are defined as Δ i ( k ) and Δ i ( k ) , respectively. Table 6 shows that the maximum and minimum values of the absolute difference between | X 0 X i | and | X 0 X i | are as follows [36]:
min i   min k | X 0 ( k ) X i ( k ) | = 0.046     min i   min k | X 0 ( k ) X i ( k ) | = 0.032
max i   max k | X 0 ( k ) X i ( k ) | = 0.338     max i   max k | X 0 ( k ) X i ( k ) | = 0.255
In grey relational theory, ρ is used as a constant and its value is usually 0.5, therefore, by bringing the data for the highest and lowest absolute difference values into Equation (4), we can calculate the correlation coefficients ζ i ( k ) and ζ i ( k ) , respectively:
ζ i ( k ) = 0.046 + 0.5 × 0.338 Δ i ( k ) + 0.5 × 0.338     ζ i ( k ) = 0.032 + 0.5 × 0.255 Δ i ( k ) + 0.5 × 0.255
From combining the data from Table 5 with the above formulae, the results are as follows [34]:
ζ i ( k ) = ( ζ i ( 1 ) , ζ i ( 2 ) , ζ i ( 3 ) )     ζ i ( k ) = ( ζ i ( 1 ) , ζ i ( 2 ) , ζ i ( 3 ) )
[ ζ 1 ζ 2 ζ 3 ζ 4 ζ 5 ] = [ 0.50 , 1.00 , 0.56 0.73 , 0.49 , 0.40 0.61 , 1.00 , 0.70 0.69 , 0.87 , 0.94 0.42 , 0.78 , 0.52 ]   and   [ ζ 1 ζ 2 ζ 3 ζ 4 ζ 5 ] = [ 0.53 , 0.98 , 0.68 0.75 , 0.44 , 0.58 0.53 , 0.99 , 1.00 0.59 , 1.10 , 1.00 0.42 , 0.83 , 0.62 ]
Then, by taking ζ i ( k ) and ζ i ( k ) into Equation (5), the systematic grey correlation degrees γ i and γ i can be calculated as follows, respectively [37]:
[ γ 1 γ 2 γ 3 γ 4 γ 5 ] = [ 0.69 0.54 0.77 0.84 0.58 ]   and   [ γ 1 γ 2 γ 3 γ 4 γ 5 ] = [ 0.73 0.59 0.84 0.90 0.62 ]

3.3.2. Characterization of the Fractal Dimension and Coal Pore Structure Parameters by the Grey Correlation Degree

The section above presents the process of calculating the grey correlation degrees γ i and γ i between the fractal dimension and pore structure parameters for the initial and LqCO2-treated coal samples. Next, we will describe the relationship between the fractal dimension and pore structure parameters based on the grey relational theory. γ i and γ i can be sorted in descending order, as follows:
γ i γ i   ( i = 1 ,   2 ,   3 ,   4 ,   5 )
From comparing the sizes of γ i and γ i , it can be seen that the degree of correlation between the specific surface area of the raw and LCO2 treated coal samples was largest, followed by the that of the full aperture, porosity and total pore volume, and permeability. Similarly, when the tested coal samples were treated by LqCO2, γ i was larger than the initial coal sample’s grey correlation degree γ i . According to the grey relational theory, of correlation degree γ is higher, the internal behavioral factors will have a greater influence on the system [36]. The above analysis indicates that γ i and γ i are positively correlated with D i and D i , respectively. Therefore, the coal matrix surface and internal pore structure of the treated coal samples became more rough and complex (i.e., fractal characteristics are more evident).
The size of γ for homologous pore structures shows that the pore specific surface area, average pore diameter, and porosity have the greatest effect on the roughness and irregularity of the coal matrix surface. Therefore, total pore volume and permeability have less of an effect on the coal, and this conclusion fully considers the rate of increase for each pore structure parameter (i.e., specific surface area, average pore diameter, porosity, total pore volume, and permeability).

4. Conclusions

The structure of coal pores significantly influences the adsorption and seepage of CBM as liquid CO2 was injected into coal seam. The LP-N2-Ad and MIP methods were combined to investigate the full aperture pore structure evolution for original and treated coal samples. Furthermore, based on the grey theory, the relationship between the fractal dimension and pore structure parameters were quantitively analyzed. Some principal conclusions were as follows.
(1)
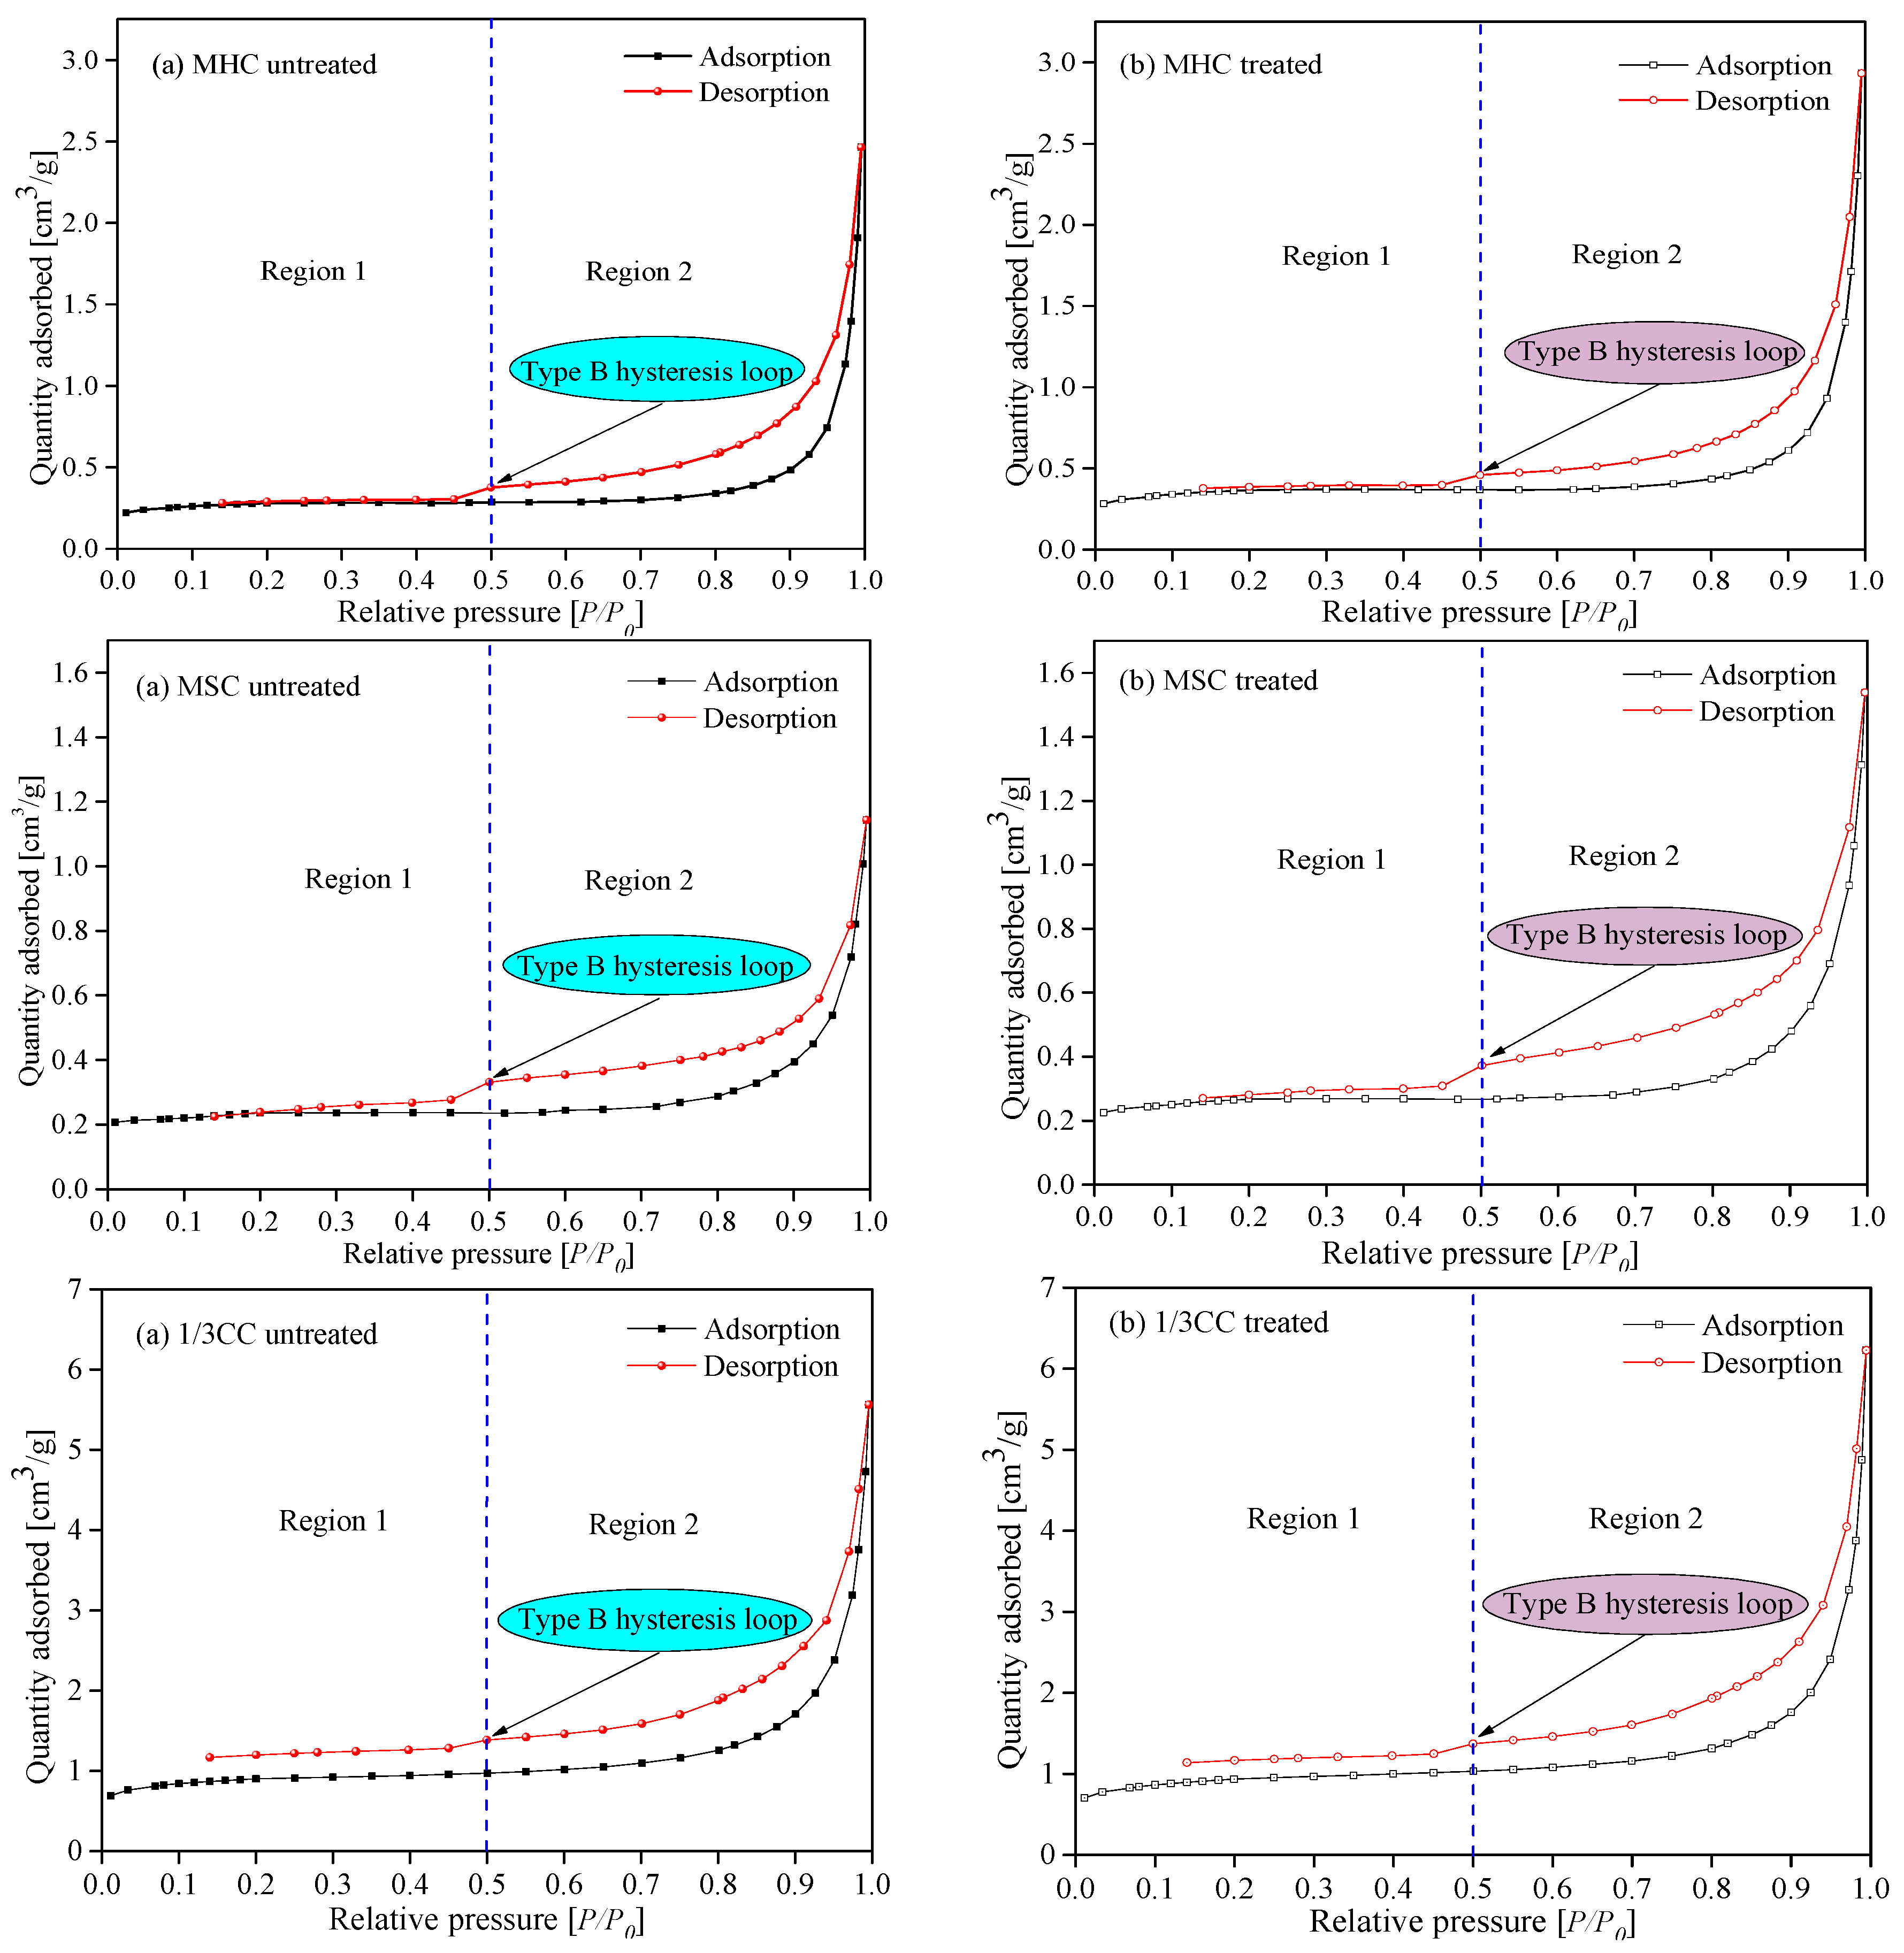
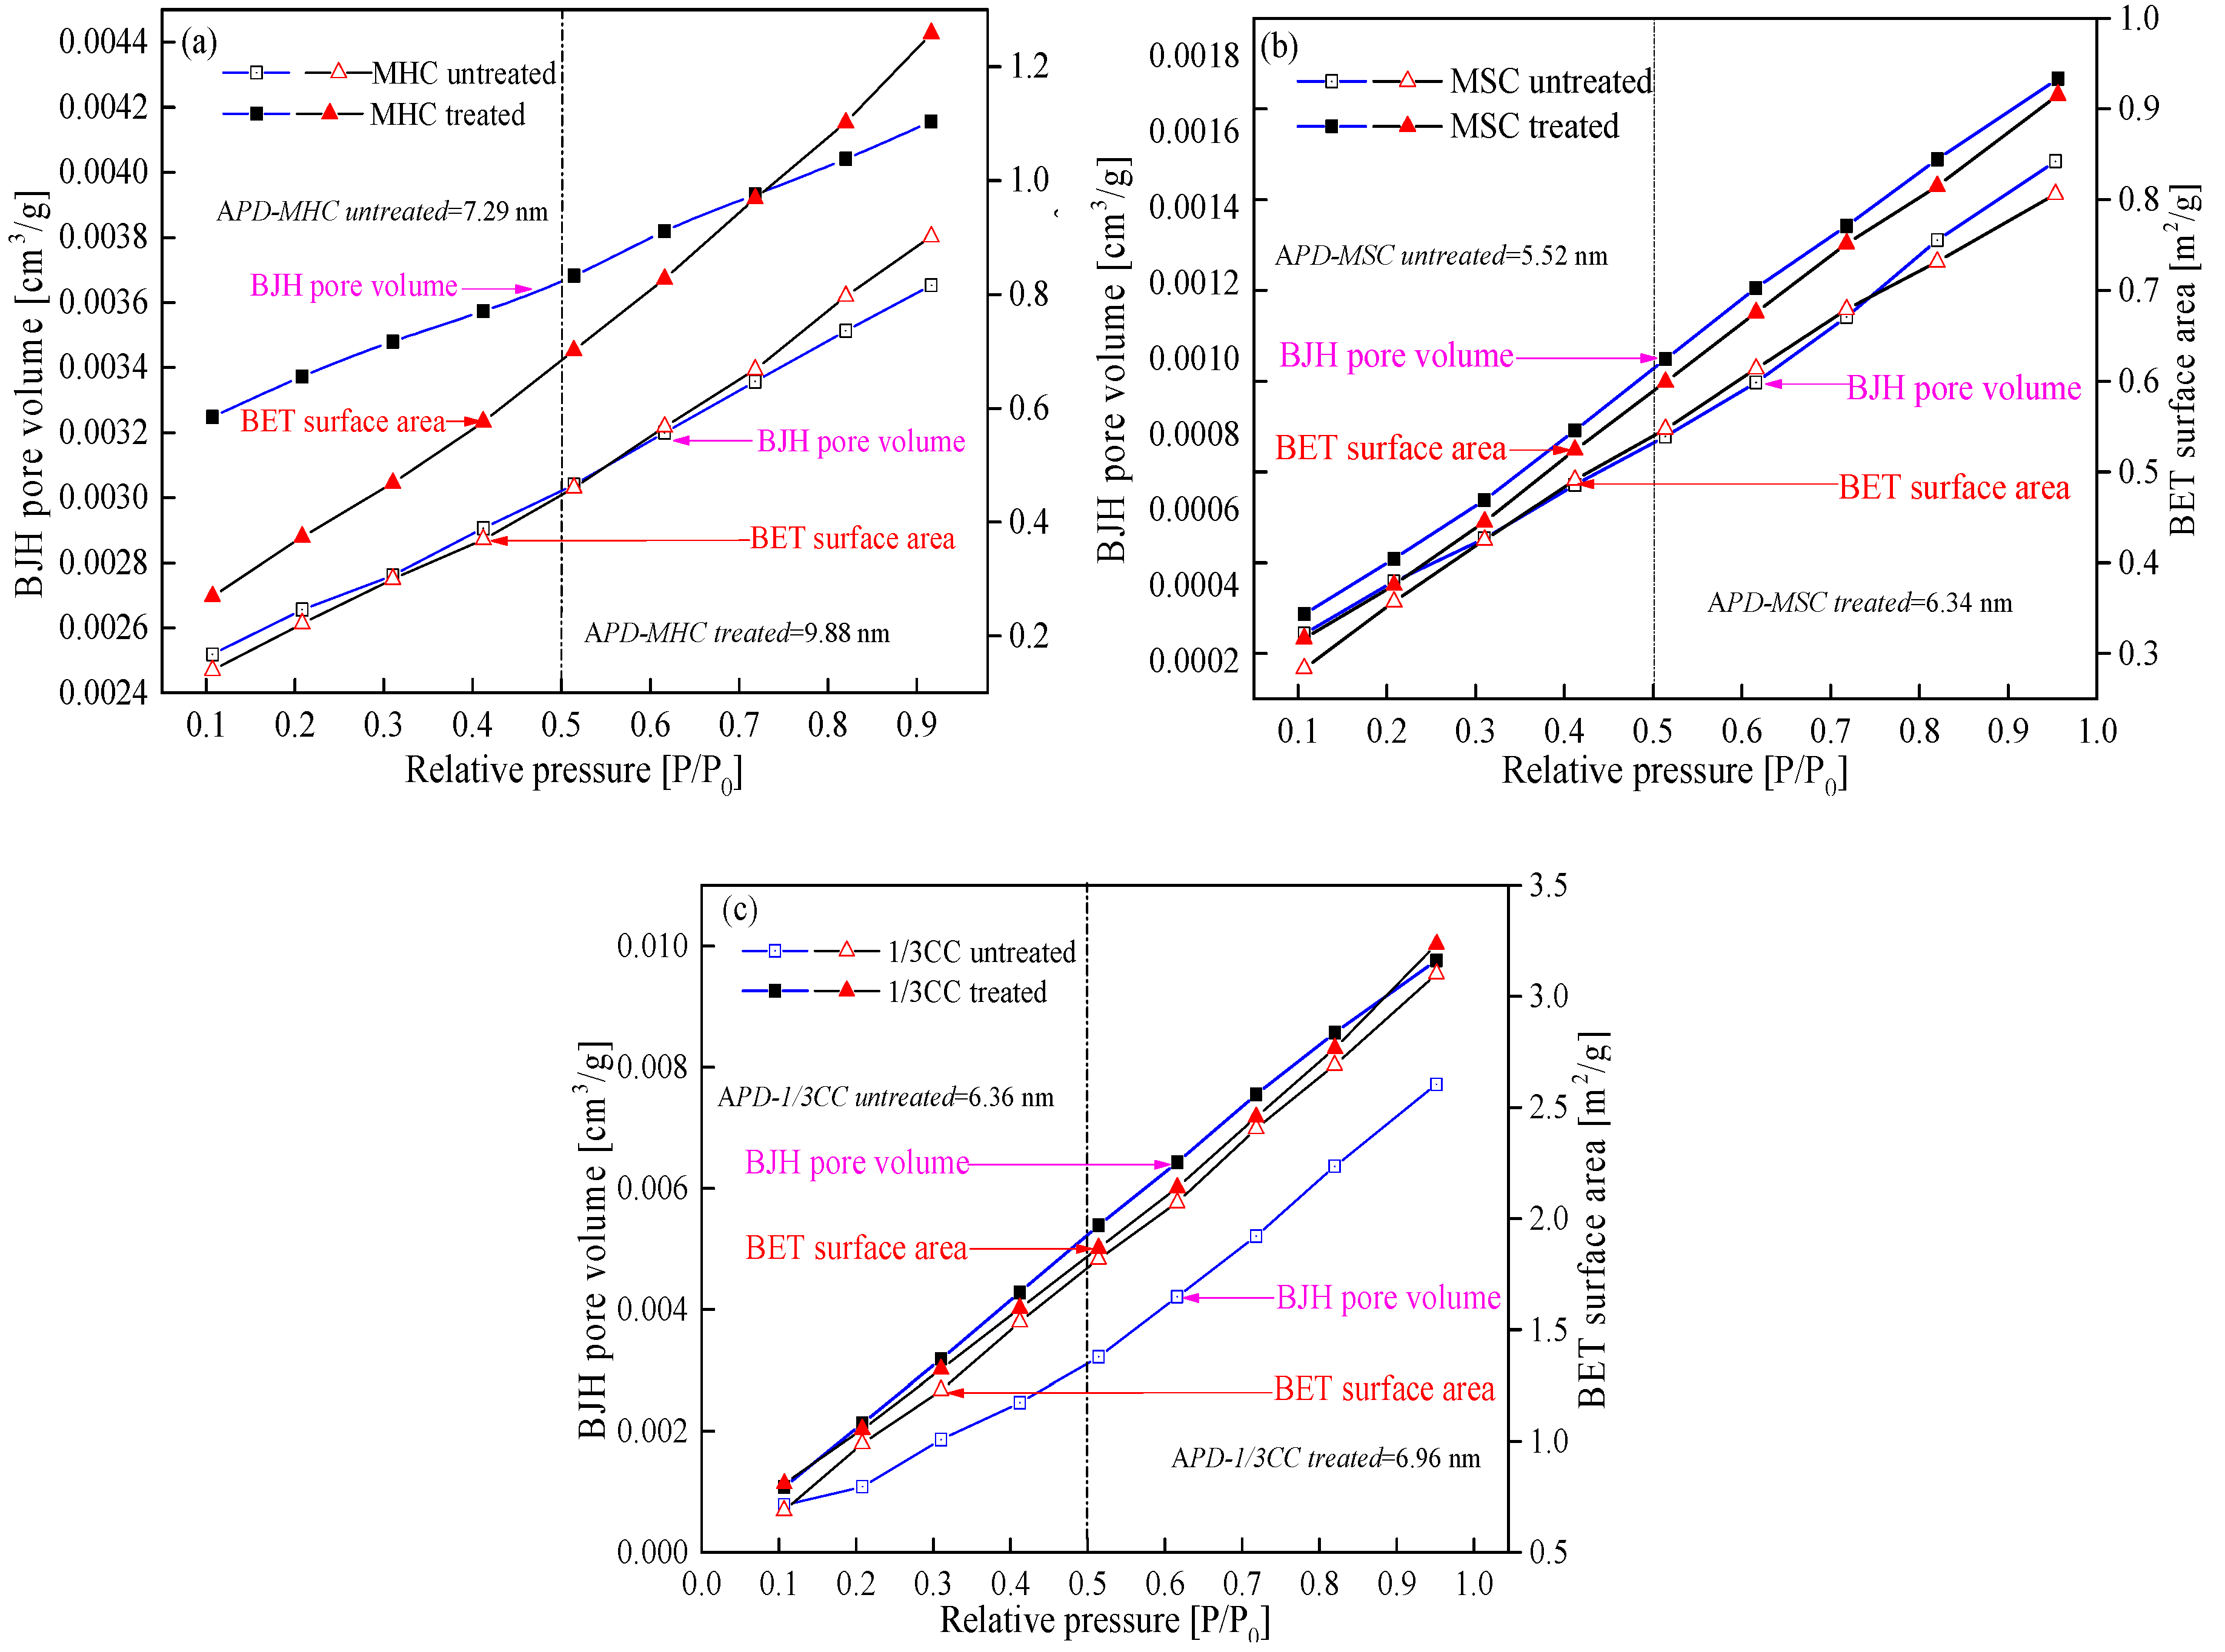
The adsorption isotherms of three coal specimens were of type B, which illustrates that the coal samples contained numerous cylindrical shaped-pores with one closed side and slit-shaped and bottle-shaped pores. From the LP-N2-Ad and MIP tests, the APD (average growth rate of 18.20%), SSA (average growth rate of 7.38%), and TPV (average growth rate of 18.26%) were higher after the coal specimens were infiltrated by liquid CO2. This is because of the large number of new pores generated and plenty of micropores and transition pores transferred into mesopores and macropores. Therefore, the adsorption ability was lower while the seepage capacity was higher, which is suitable for CBM recovery.
(2)
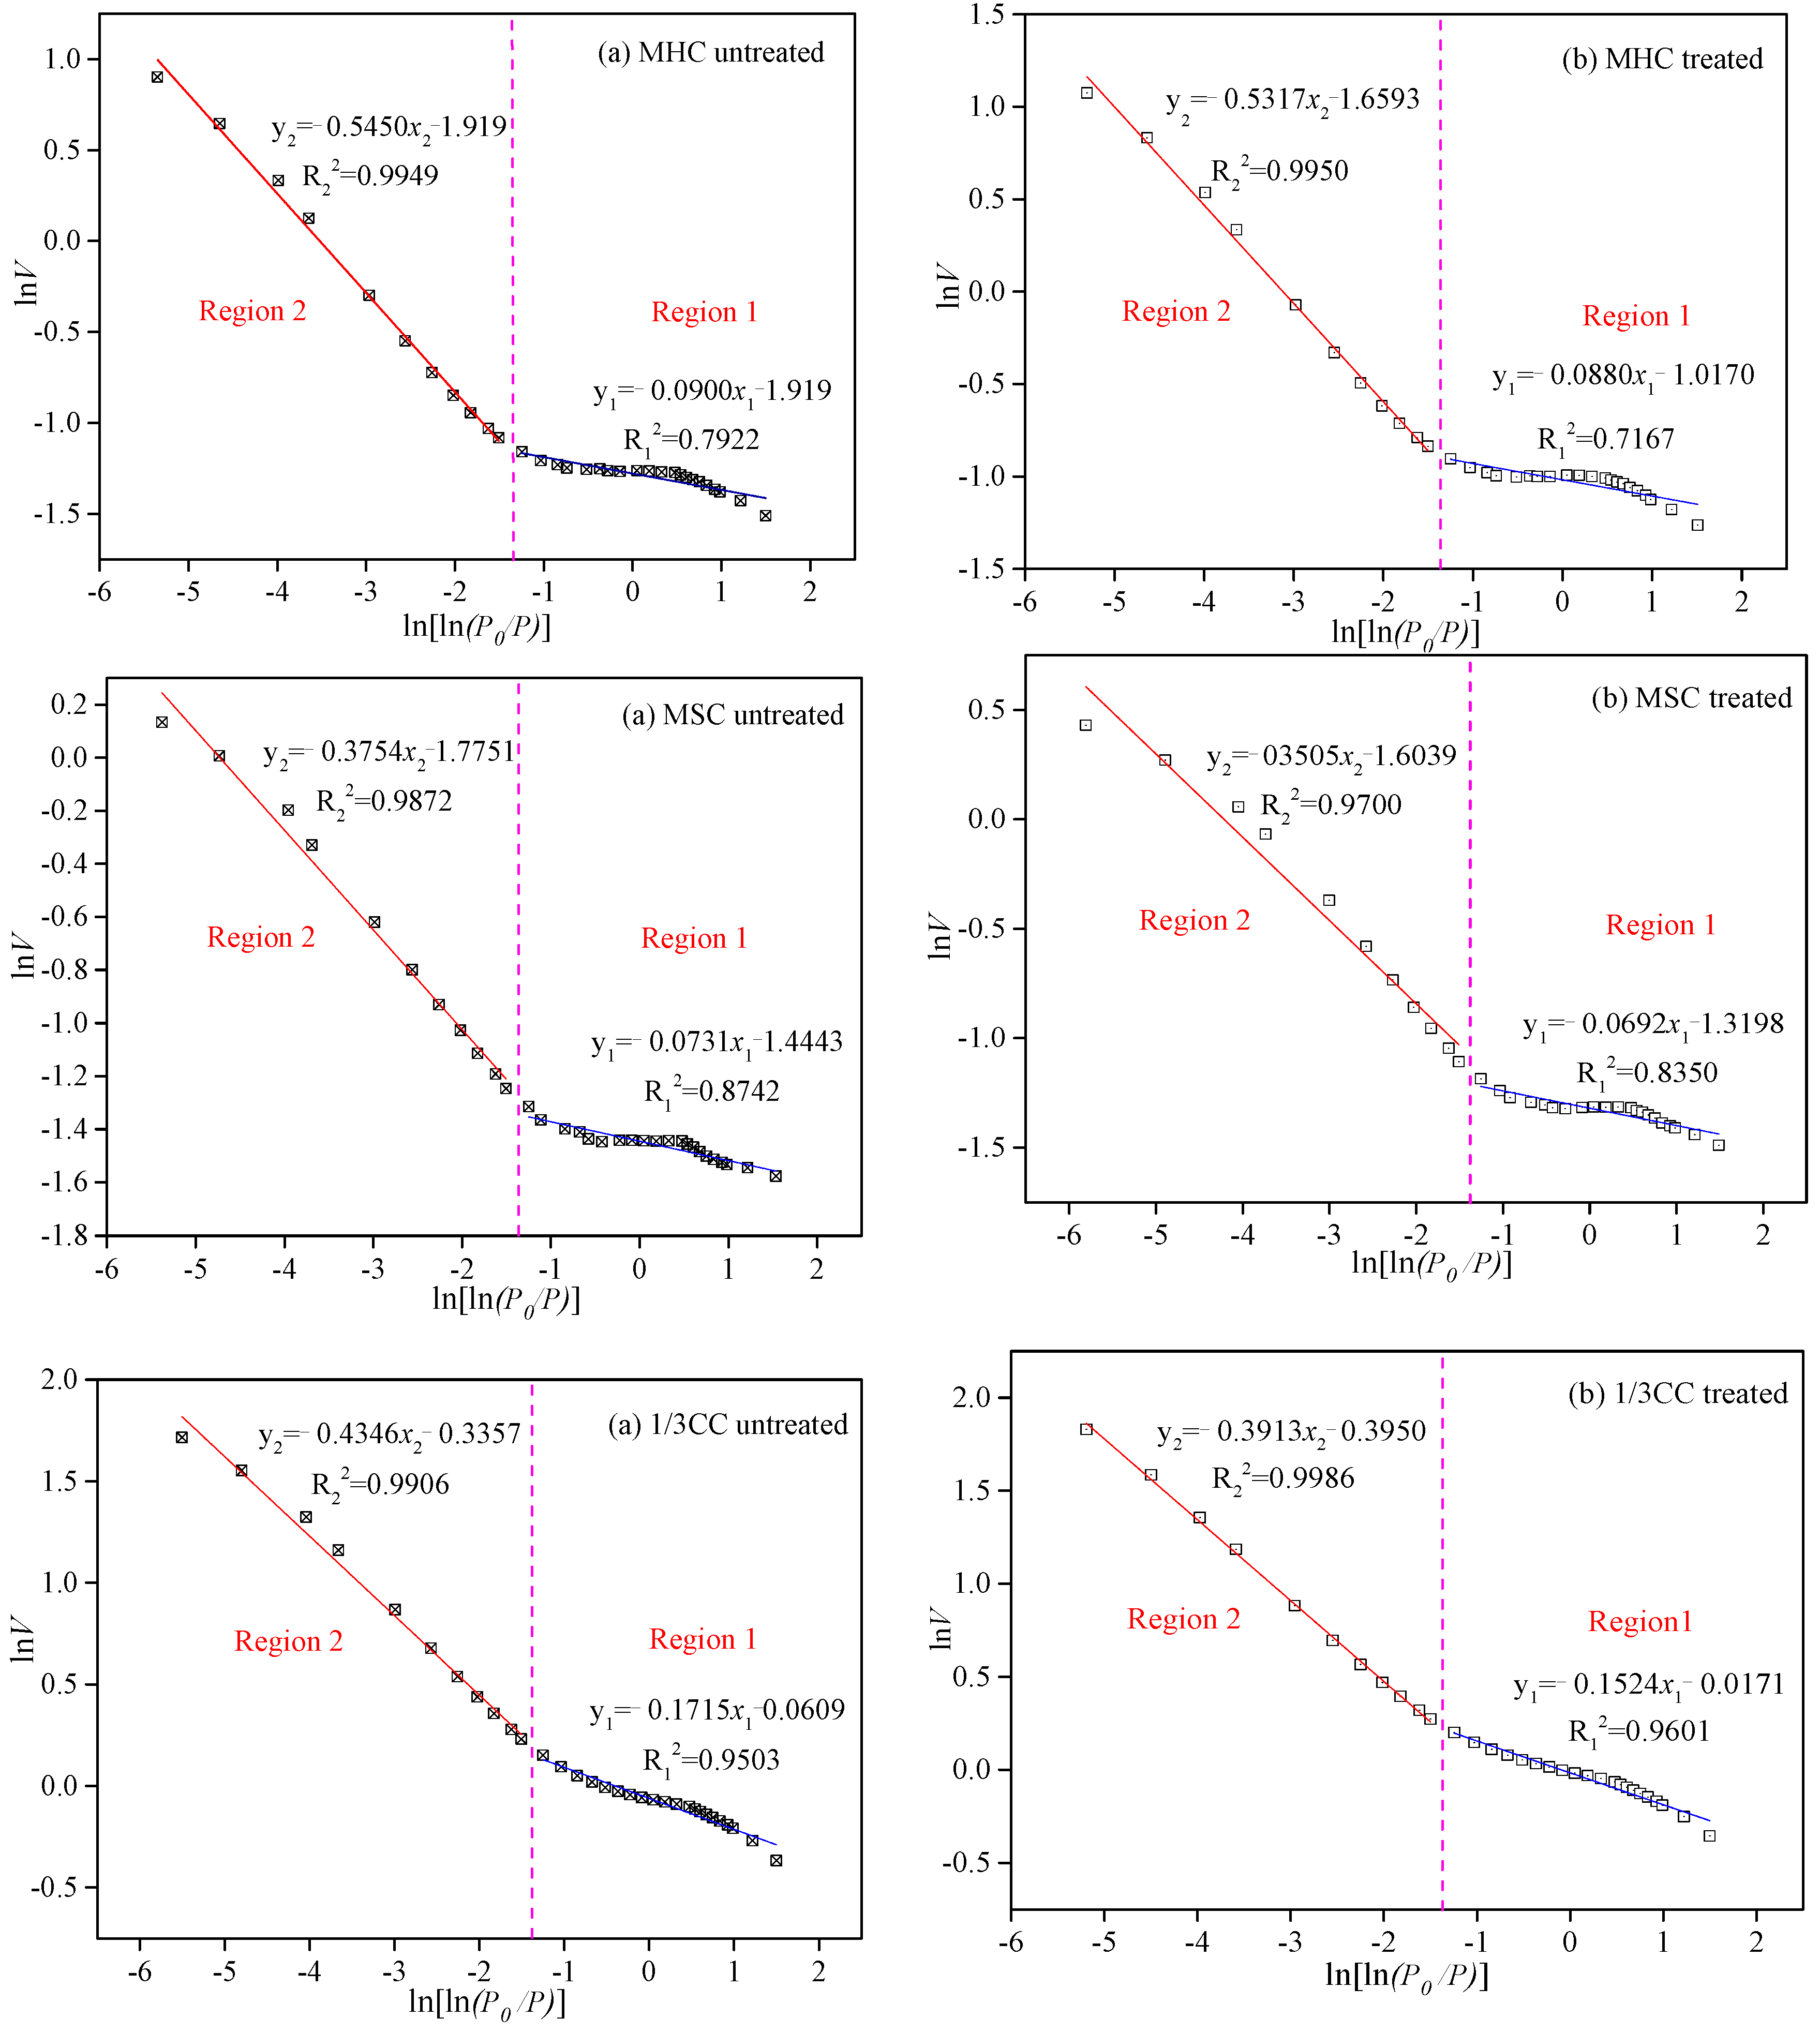
Fractal dimensions D1 (average of 2.58), D2 (average of 2.90), and D4 (average of 2.91) exhibited the same tendencies for the treated coal samples, which were typically higher than those of the original specimens (D1, average of 2.55, D2, average of 2.87, and D4, average of 2.86), indicating that the coal surfaces are rougher and the internal pore structures are more complex after the coal samples were treated by LCO2.
(3)
The grey relational theory was applied to analyze the relationship between fractal dimension and coal pore structure parameters. The correlation degree γ i was higher than γ i , indicating that the fractal features of the treated coal specimens are more evident. The degree of correlation between the fractal dimension and pore structure parameters show that the SSA of the raw and treated coal samples was largest, followed by APD, porosity, TPV, and permeability. The SSA, APD, and porosity positively influence the fractal characteristics of coal samples, but TPV and permeability exert negative influences.

Author Contributions

Conceptualization, L.M. and G.W.; Methodology, Z.L. and G.W.; Software, Q.W.; Validation, W.W., L.M. and Q.W.; Formal Analysis, G.W.; Investigation, G.W.; Resources, L.M.; Data Curation, Z.L. and G.W.; Writing-Original Draft Preparation, G.W.; Writing-Review & Editing, Q.W. and Z.L.; Visualization, L.M.; Supervision, L.M.; Project Administration, L.M.; Funding Acquisition, L.M. and W.W.

Funding

This research was funded by [National Natural Science Foundation of China] grant number [51574193 and 51504186], and [National Key Research and Development Plan] grant number [2016YFC0800102].

Conflicts of Interest

The authors declare no conflict of interest.

References

  1. Fu, F.; Liu, H.; Polenske, K.R.; Li, Z. Measuring the energy consumption of China’s domestic investment from 1992 to 2007. Appl. Energy 2013, 102, 1267–1274. [Google Scholar] [CrossRef]
  2. Chandran Govindaraju, V.G.R.C.; Tang, C.F. The dynamic links between CO2 emissions, economic growth and coal consumption in China and India. Appl. Energy 2013, 104, 310–318. [Google Scholar] [CrossRef]
  3. Wang, K.; Wei, Y.; Zhang, X. Energy and emissions efficiency patterns of Chinese regions: A multi-directional efficiency analysis. Appl. Energy 2013, 104, 105–116. [Google Scholar] [CrossRef]
  4. Zhao, L.; Dong, H.; Tang, J.; Cai, J. Cold energy utilization of liquefied natural gas for capturing carbon dioxide in the flue gas from the magnesite processing industry. Energy 2016, 105, 45–56. [Google Scholar] [CrossRef]
  5. Wen, H.; Li, Z.; Deng, J.; Shu, C.; Lai, W.; Wang, Q. Influence on coal pore structure during liquid CO2-ECBM process for CO2 utilization. J. CO2 Util. 2017, 21, 543–552. [Google Scholar] [CrossRef]
  6. Cheng, Y.; Wang, L.; Zhang, X. Environmental impact of coal mine methane emissions and responding strategies in China. Int. J. Greenh. Gas Control. 2011, 5, 157–166. [Google Scholar] [CrossRef]
  7. Wang, H.; Cheng, Y.; Wang, W.; Xu, R. Research on comprehensive CBM extraction technology and its applications in China’s coal mines. J. Nat. Gas Sci. Eng. 2014, 20, 200–207. [Google Scholar] [CrossRef]
  8. Green, U.; Aizenstat, Z.; Gieldmeister, F.; Cohen, H. CO2 adsorption inside the pore structure of different rank coals during low temperature oxidation of open air coal stockpiles. Energy Fuels 2011, 25, 4211–4215. [Google Scholar] [CrossRef]
  9. Chen, H.; Wang, Z.; Chen, X.; Wang, L. Increasing permeability of coal seams using the phase energy of liquid carbon dioxide. J. CO2 Util. 2017, 19, 112–119. [Google Scholar] [CrossRef]
  10. Wang, H.; Ran, Q.; Liao, X.; Zhao, X.; Xu, M.; Fang, P. Study of the CO2 ECBM and sequestration in coalbed methane reservoirs with SRV. J. Nat. Gas Sci. Eng. 2016, 33, 678–686. [Google Scholar] [CrossRef]
  11. Ranathunga, A.S.; Perera, M.S.A.; Ranjith, P.G.; Zhang, X.; Wu, B. Super-critical carbon dioxide flow behavior in low rank coal: A meso-scale experimental study. J. CO2 Util. 2017, 20, 1–3. [Google Scholar] [CrossRef]
  12. IUPAC. Reporting physisorption of naturally fractured reservoirs. Trans. Soc. Petrol. Eng. AIME 1963, 228, 245–255. [Google Scholar]
  13. Hodot, B.B. Outburst of Coal and Coalbed Gas; China Industry Press: Beijing, China, 1966; pp. 23–25. [Google Scholar]
  14. Clarkson, C.R.; Wood, J.; Burgis, S.; Aquino, S.; Freeman, M. Nanopore-structure analysis and permeability predictions for a tight gas siltstone reservoir by use of low-pressure adsorption and mercury-intrusion techniques. SPE Reserv. Eval. Eng. 2012, 15, 648–661. [Google Scholar] [CrossRef]
  15. Yao, Y.; Liu, D.; Tang, S.; Huang, W.; Liu, Z.; Che, Y. Fractal characterization of seepage-pores of coals from China: An investigation on permeability of coals. Comput. Geosci. 2009, 35, 1159–1166. [Google Scholar] [CrossRef]
  16. Fu, H.; Tang, D.; Xu, T.; Xu, H.; Tao, S.; Li, S. Characteristics of pore structure and fractal dimension of low rank coal: A case study of lower jurassic Xishanyao coal in the southern Junggar basin, NW China. Fuel 2017, 193, 254–264. [Google Scholar] [CrossRef]
  17. Pan, J.; Peng, C.; Wan, X.; Zheng, D.; Lv, R.; Wang, K. Pore structure characteristics of coal-bearing organic shale in Yuzhou coalfield, China using low temperature N2 adsorption and FESEM methods. J. Pet. Sci. Eng. 2017, 153, 234–243. [Google Scholar] [CrossRef]
  18. Okolo, G.N.; Everson, R.C.; Neomagus, H.W.J.P.; Roberts, M.J.; Sakurovs, R. Comparing the porosity and surface areas of coal as measured by gas adsorption, mercury intrusion and SAXS techniques. Fuel 2015, 141, 293–304. [Google Scholar] [CrossRef]
  19. Zou, M.; Wei, C.; Zhang, M.; Shen, J.; Chen, Y. Classifying coal pores and estimating reservoir parameters by nuclear magnetic resonance and mercury intrusion porosimetry. Energy Fuels 2013, 27, 3699–3708. [Google Scholar] [CrossRef]
  20. Zhao, Y.; Liu, S.; Elsworth, D.; Jiang, J.; Zhu, J. Pore structure characterization of coal by synchrotron small-angle X-ray scattering and transmission electron microscopy. Energy Fuels 2014, 28, 3704–3711. [Google Scholar] [CrossRef]
  21. Xu, J.; Zhai, C.; Liu, S.; Qin, L.; Wu, S. Pore variation of three different metamorphic coals by multiple freezing-thawing cycles of liquid CO2 injection for coalbed methane recovery. Fuel 2017, 208, 41–51. [Google Scholar] [CrossRef]
  22. Vishal, V. In-situ disposal of CO2: Liquid and supercritical CO2 permeability in coal at multiple down-hole stress conditions. J. CO2 Util. 2017, 17, 235–242. [Google Scholar] [CrossRef]
  23. Zhang, Y.; Lebedev, M.; Sarmadivaleh, M.; Barifcani, A. Swelling-induced changes in coal microstructure due to supercritical CO2 injection. Geophys. Res. Lett. 2016, 43, 9077–9083. [Google Scholar] [CrossRef]
  24. Zhang, Y.; Zhang, Z.; Sarmadivaleh, M.; Lebedev, M.; Barifcani, A.; Yu, H. Micro-scale fracturing mechanisms in coal induced by adsorption of supercritical CO2. Int. J. Coal Geol. 2017, 175, 40–50. [Google Scholar] [CrossRef]
  25. Wen, H.; Li, Z.; Wang, Z.; Ma, L.; Guo, Y.; Wang, X. Experiment on the liquid CO2 fracturing process for increasing permeability and the characteristics of crack propagation in coal seam. J. China Coal Soc. 2016, 41, 2793–2799. (In Chinese) [Google Scholar]
  26. Ma, L.; Wei, G.; Wang, S.; Li, Z.; Liu, X. Experimental study of displacing and replacing methane in low permeability coal seam by liquid CO2 injection. J. Chongqing Univ. 2018, 31, 251–277. (In Chinese) [Google Scholar]
  27. Tsakiroglou, C.D.; Payatakers, A.C. Characterization of the pore structure of reservoir rocks with the aid of serial auctioning analysis, mercury porosimetry and network simulation. Adv. Water Resour. 2000, 23, 773–789. [Google Scholar] [CrossRef]
  28. Mandelbrot, B.B. Les Objects Fractals: Forme, Hazard et Dimension; Flammarion: Paris, France, 1975. (In French) [Google Scholar]
  29. Yang, F.; Ning, Z.; Liu, H. Fractal characteristics of shales from a shale gas reservoir in the Sichuan Basin, China. Fuel 2014, 115, 378–384. [Google Scholar] [CrossRef]
  30. Pfeifer, P.; Wu, Y.; Cole, M.W.; Krim, J. Multilayer adsorption on a fractally rough surface. Phys. Rev. Lett. 1989, 62, 1977–2000. [Google Scholar] [CrossRef] [PubMed]
  31. Mahamud, M.M. Textural characterization of active carbons using fractal analysis. Fuel Process. Technol. 2006, 87, 907–917. [Google Scholar] [CrossRef]
  32. Cai, Y.; Liu, D.; Yao, Y.; Li, J.; Liu, J. Fractal characteristics of coal pores based on classic geometry and thermodynamics models. Acta Geol. Sin. 2011, 85, 1150–1162. [Google Scholar] [CrossRef]
  33. Frisen, W.I.; Mikula, R.J. Fractal dimensions of coal particles. J. Colloid Interface Sci. 1987, 120, 263–271. [Google Scholar] [CrossRef]
  34. Deng, J.L. Grey Theory; Huazhong University of science and Technology Press: Wuhan, China, 2002; pp. 218–227. (In Chinese) [Google Scholar]
  35. Chiang, Y.M.; Hsieh, H.H. The use of the Taguchi method with grey relation analysis to optimize the thin-film sputtering process with multiple quality characteristic in color filter manufacturing. Comput. Ind. Eng. 2009, 56, 648–661. [Google Scholar] [CrossRef]
  36. Rao, R.; Yadava, V. Multi-objective optimization of Nd: YAG laser cutting of thin superalloy sheet using grey relational analysis with entropy measurement. Opt. Laser Technol. 2009, 41, 922–930. [Google Scholar]
  37. Khanna, R.; Kumar, A.; Garg, M.P.; Singh, A.; Sharma, N. Multiple performance characteristics optimization for Al 7075 on electric discharge drilling by Taguchi grey relational theory. J. Ind. Eng. Int. 2015, 11, 459–472. [Google Scholar] [CrossRef]
  38. Takara, E.A.; Quiroga, E.; Matozfernandez, D.A.; Ochoa, N.A.; Ramirezpastor, A.J. Fractional statistical theory of finite multilayer adsorption. Appl. Surf. Sci. 2016, 360, 14–19. [Google Scholar] [CrossRef]
  39. Zhu, J.F.; Liu, J.Z.; Yang, Y.M.; Cheng, J.; Zhou, J.H.; Cen, K.F. Fractal characteristics of pore structures in 13 coal specimens: Relationship among fractal dimension, pore structure parameter, and slurry ability of coal. Fuel Process. Technol. 2016, 149, 256–267. [Google Scholar] [CrossRef]
  40. Everett, D.H.; Stone, F.S. The Structure and Properties of Porous Materials; Butterworths: London, UK, 1958; pp. 68–94. [Google Scholar]
  41. Nie, B.; Liu, X.; Yang, L.; Meng, J.; Li, X. Pore structure characterization of different rank coals using gas adsorption and scanning electron microscopy. Fuel 2015, 158, 908–917. [Google Scholar] [CrossRef]
  42. Sun, X.; Wang, Z.; Sun, B.; Wang, W. Research on hydrate formation rules in the formations for liquid CO2 fracturing. Fuel 2016, 33, 1390–1401. [Google Scholar]
  43. Tang, J.; Feng, L.; Li, Y.; Liu, J.; Liu, X. Fractal and pore structure analysis of Shengli lignite during drying process. Powder Technol. 2016, 303, 251–259. [Google Scholar] [CrossRef]
  44. Wang, G.; Wang, K.; Ren, T. Improved analytic methods for coal surface area and pore size distribution determination using 77 K nitrogen adsorption experiment. Int. J. Min. Sci. Technol. 2014, 24, 329–334. [Google Scholar] [CrossRef]
  45. Liu, C.; Wang, G.; Sang, S.; Gilani, W.; Rudolph, V. Fractal analysis in pore structure of coal under condition of CO2 sequestration process. Fuel 2015, 139, 125–132. [Google Scholar] [CrossRef]
Figure 1. Nitrogen adsorption and desorption curves for (a) the raw coal sample, and (b) the liquid CO2-infiltrated coal samples.
Resources 07 00030 g001
Figure 2. Barrett–Joyner–Halenda (BJH) pore volume and Brunauer–Emmett–Teller (BET) surface area of the initial and LqCO2-treated coal samples, (a) MHC coal sample, (b) MSC coal sample, (c) 1/3CC coal sample.
Resources 07 00030 g002
Figure 3. Fractal dimensions obtained from LP-N2-Ad for (a) the raw and (b) LqCO2-treated coal samples.
Resources 07 00030 g003
Figure 4. Mercury intrusion and extrusion curves for the untreated and treated coal samples, (a) MHC coal sample, (b) MSC coal sample, (c) 1/3CC coal sample.
Resources 07 00030 g004
Figure 5. Incremental pore volume distributions between the untreated and LqCO2-treated coal samples obtained from the MIP test, (a) MHC coal sample, (b) MSC coal sample, (c) 1/3CC coal sample.
Resources 07 00030 g005aResources 07 00030 g005b
Figure 6. Fractal characterization using the MIP results for (a) raw and (b) treated coal samples.
Resources 07 00030 g006aResources 07 00030 g006b
Table 1. General information for tested samples.
Sample No.R0 (%)Coal Macerals (%)Proximate and Ultimate (wt %)Coal Species
VIEM,adA,dV,dafFC,ad
MHC2.2062.0626.901.701.5321.9512.5065.14Meager coal
MSC1.9063.3829.152.101.6722.4712.4665.43Meager coal
1/3CC0.9952.6031.6015.801.6725.7138.8733.751/3 cocking coal
Note: R0: vitrinite reflectance, %; V: vitrinite, %; I: inertinite, %; E: exinite, %; M,ad: moisture air-dried basis; A,d: dry basis; V,daf: dry, ash free basis; FC,ad: fixed carbon air-dried basis.
Table 2. Structural coal pore parameters obtained using LP-N2-Ad.
Sample No.SBET,Ad (m2/g)Smi+tra (m2/g)VBJH,Ad (cm3/g)Vmi+tra (cm3/g)
SmiProportion/%StraProportion/%VmiProportion/%VtraProportion/%
MHC untreated0.960.3232.70.6667.00.00350.0003911.00.003289.0
MHC treated1.260.4233.50.8466.50.00420.000133.10.004096.9
MSC untreated0.810.3649.10.4150.90.00150.0003825.00.001175.0
MSC treated0.920.4043.80.5156.20.00170.0002413.80.001586.2
1/3CC untreated3.101.5750.41.5449.60.00770.0002329.40.005570.6
1/3CC treated3.241.5848.71.6651.30.00880.0002123.90.006776.1
Notes: SBET, BET surface area, m2/g; Smi, micropore surface area, m2/g; Stra, transition pore surface area, m2/g; VBJH, BJH pore volume, cm3/g; Vmi, micropore volume, cm3/g; Vtra, transition pore volume, cm3/g.
Table 3. Fractal dimensions obtained from the LP-N2-Ad test.
Coal SampleD = 3 + A
Relative Pressure (P/P0): 0.0–0.5Relative Pressure (P/P0): 0.5–1.0
A2D2R22A1D1R12
MHC untreated−0.0902.900.792−0.5452.450.995
MHC treated−0.0882.910.717−0.5322.470.995
MSC untreated−0.0732.920.874−0.3752.630.987
MSC treated−0.0692.940.835−0.3512.650.970
1/3CC untreated−0.1712.820.950−0.4352.560.991
1/3CC treated−0.1522.850.960−0.3912.610.999
Table 4. Porosity and pore parameter (specific surface area, pore volume, average pore diameter) results obtained using MIP.
Sample No.Φ (%)K (mD)APD (nm)St (m2/g)Sme+ma (cm2/g)Vt (cm3/g)Vme+ma (cm3/g)
SmeSmaVmeVma
MHC-untreated5.4719.615.110.140.0440.0130.0380.00330.011
MHC-treated7.0221.518.910.820.0260.0270.0510.00280.028
MSC-untreated7.6328.119.212.580.0300.0280.0630.00410.018
MSC-treated8.5930.222.913.160.0120.0350.0720.00180.038
1/3 CC-untreated8.7718.820.712.220.0460.0380.0700.00510.016
1/3 CC-treated9.4420.025.413.790.0210.0460.0770.00350.040
Notes: φ, porosity; K, permeability; Sme+ma, total specific surface area of mesopores and macropores; Sme, specific surface area; Sma, specific surface area; Vme+ma, total pore volume of mesopores and macropores per unit mass; Vme, pore volume of mesopores per unit mass; Vma, pore volume of macropores per unit mass.
Table 5. Fractal dimensions for raw (a) and (b) treated coal samples obtained by MIP.
Coal SamplesAPD (100–1000 nm)APD (1000–20,000 nm)APD (>20,000 nm)
R32A3D3R42A4D4R52A5D5
MHC untreated0.841−2.3101.690.987−1.1042.890.640−0.2243.78
MHC treated0.857−2.5101.490.976−1.0302.970.849−0.3263.67
MSC untreated0.857−2.0021.990.935−1.1292.870.550−0.1583.84
MSC treated0.865−2.1241.880.946−1.1202.880.356−0.1183.88
1/3CC untreated0.824−1.9652.030.954−1.1652.830.429−0.2143.79
1/3CC treated0.793−2.3151.680.878−1.1062.890.669−0.1713.83
Notes: D3, fractal dimension with pore diameters (mesopore) ranging from 100 to 1000 nm; D4, fractal dimension with pore diameters (macropore) ranging from 1000 to 20,000 nm; D5, fractal dimension with pore diameters (microfissure) greater than 20,000 nm.
Table 6. The absolute difference between the grey systematic behavior sequence and its internal correlation factors sequence.
Sample No. | X 0 X i | for Raw Coal Samples | X 0 X i | for LCO2 Frozen Treated Coal Samples
Δ 1 ( k ) Δ 2 ( k ) Δ 3 ( k ) Δ 4 ( k ) Δ 5 ( k ) Δ 1 ( k ) Δ 2 ( k ) Δ 3 ( k ) Δ 4 ( k ) Δ 5 ( k )
MHC0.2600.1240.1860.1390.3380.1720.0860.1750.1430.255
MSC0.0460.2670.0460.0790.1060.0350.2350.0340.0170.055
1/3CC0.2140.1430.1400.0600.2410.1080.1480.0320.0320.132

