Article

Future Trajectories of Renewable Energy Consumption in the European Union

by
Federica Cucchiella
,
Idiano D’Adamo
* and
Massimo Gastaldi
Department of Industrial and Information Engineering and Economics, University of L’Aquila, Via G. Gronchi 18, 67100 L’Aquila, Italy
*
Author to whom correspondence should be addressed.
Resources 2018, 7(1), 10; https://doi.org/10.3390/resources7010010
Submission received: 21 November 2017 / Revised: 26 January 2018 / Accepted: 9 February 2018 / Published: 11 February 2018

Abstract

:
Renewable energy sources (RESs) are able to reduce the European Union (EU)’s dependence on foreign energy imports, also meeting sustainable objectives to tackle climate change and to enhance economic opportunities. Energy management requires a quantitative analysis and the European Commission follows the performance of each Member State (MS) in order to define the corrective measures towards 2020 targets. Starting from historical data reported in the Eurostat database and through a mathematical model, this work proposes future trajectories towards 2020 of the share of energy from renewables (REs) in terms of gross final energy consumption (GFEC). Furthermore, a quantitative analysis based on two indices—(i) the share of REs in GFEC, and (ii) gross final renewable energy consumption (GFREC) per capita—permits a comparison among 28 MSs. The share of REs in GFEC in EU 28 varies from 19.4% to 21.8% in future trajectories towards 2020. Sweden and Finland occupy the top part of the ranking, while six MSs (Belgium, France, Ireland, Luxembourg, The Netherlands, and the United Kingdom) are not able to reach the 2020 targets.

1. Introduction

In March 2015, the EU submitted to the United Nations Framework Convention on Climate Change (UNFCCC) the Intended Nationally Determined Contribution (INDC) as a result of decisions emerging from the 21st Session of the Conference of the Parties (COP 21) [1]. At the COP 21 in December 2015, 195 countries have agreed to legally-binding targets by limiting global warming to well below 2 °C [2]. Consequently, the Paris Agreement is the opportunity to strengthen the bond between today’s policies and climate-neutrality before the end of the century [3]. The development of REs is a relevant item to achieve the targets, considering that more than half of the world’s current CO2 emissions are due to burning fossil fuels [4]. The relationship among energy consumption, emissions, and economic growth is well defined in the literature [5]. Several approaches are based on the environmental Kuznets curve (EKC), in which economic development initially leads to deterioration in the environment and, in the later stage, environmental quality degradation slows down relative to economic growth. The application of EKC is conducted on both developed and developing countries [6].
RESs are able to produce many potential benefits, such as a reduction in greenhouse gas (GHG) emissions, the diversification of energy supplies, the development of economic opportunities for investors and consumers, a reduced dependency on fossil fuel markets, and the creation of new jobs [7]. RES expansion can be achieved without compromising growth or employment [8] and several financial advantages are linked to their use [9]. Business models reported in the literature depend basically on two aspects: (i) the type of the analysed resource, and (ii) the different characteristics of developing and industrialized countries [10].
Wind and solar power are intermittent resources, but this limit can be overcome through two potential ways: (i) cross-border interconnection and (ii) cross-sector interconnection [11]. The European case study is analysed in the literature and the application of energy storage systems is considered [12]. Europe is trying to move towards a low-carbon energy system with an increased amount of variable renewable electricity sources [13] and a technically possible approach of 100% renewable energy [14].
The Renewable Energy Directive, officially coded as 2009/28/EC, defines an overall policy for the energy production from RESs within Europe. This Directive forces European countries to gather at least 20% of their total energy needs by REs by 2020, with specific targets for each MS. Furthermore, European MSs agreed recently on a new 2030 framework on climate and energy, imposing at least a 27% in the share of RE consumption [
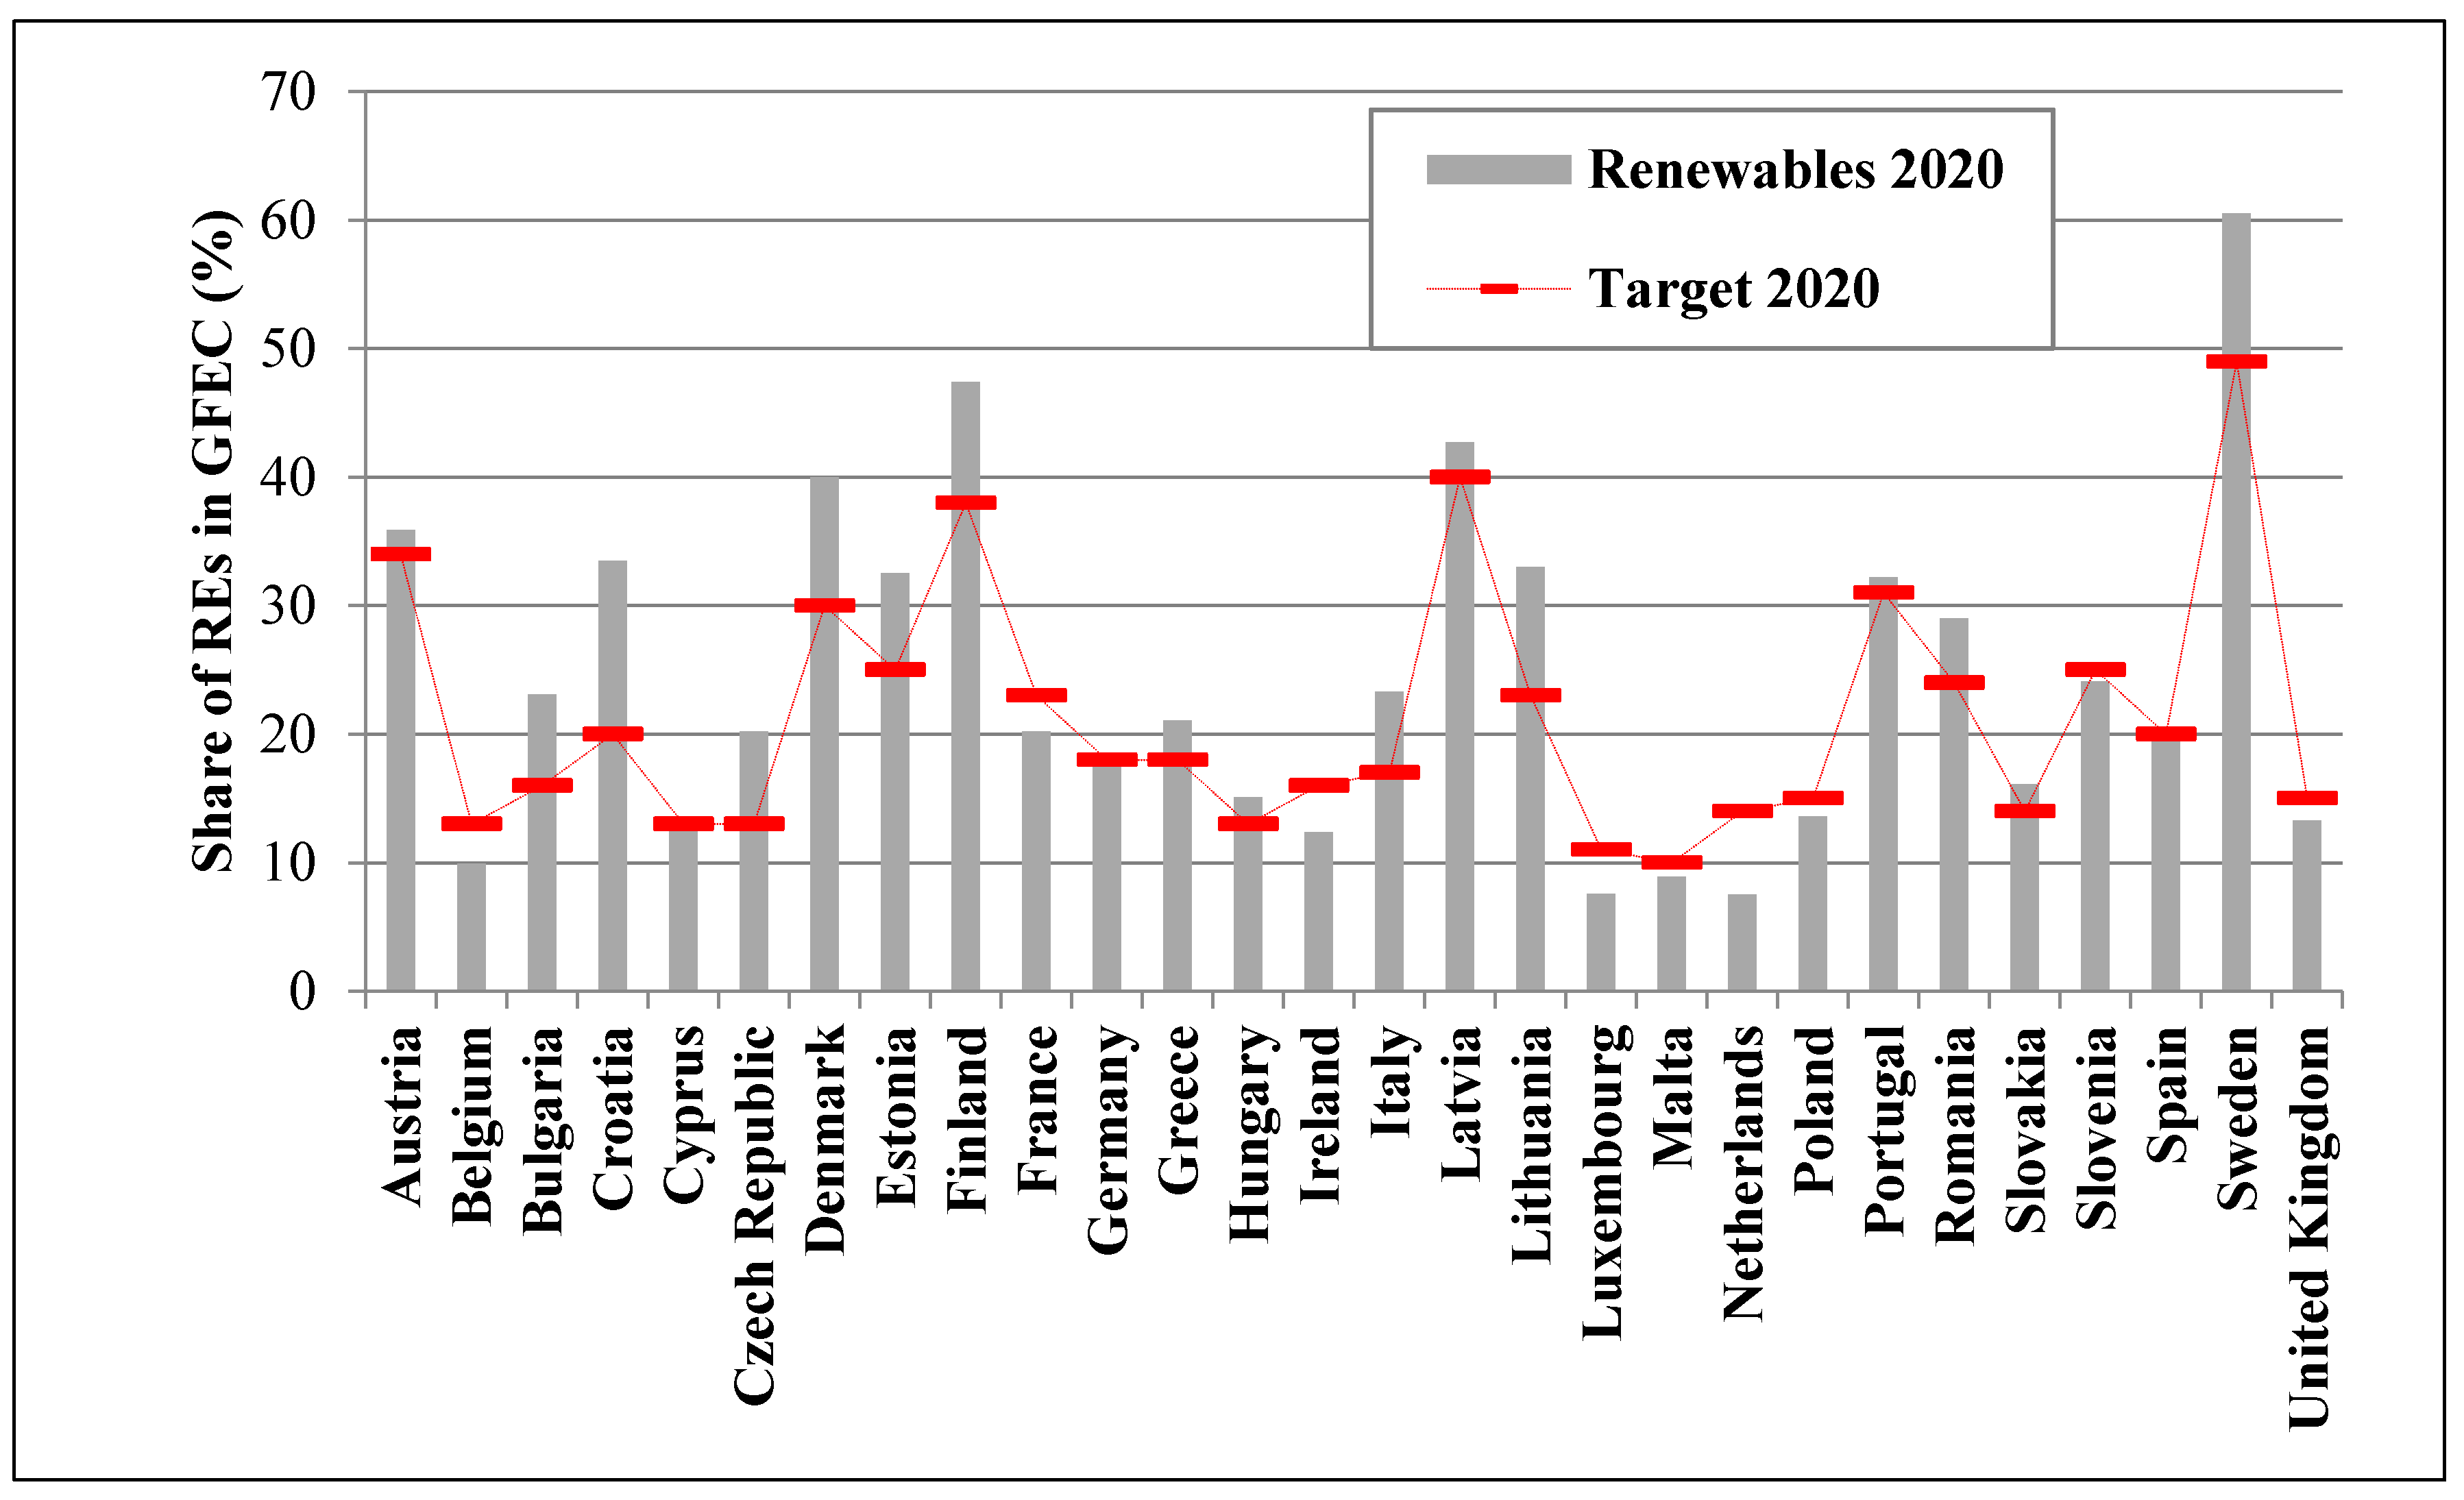
15]. The share of energy from RESs in GFEC reached 16.7% in the EU 28 MSs in 2015, an increase of 7.7% compared to 2005 data (9%). Eleven MSs already achieved their 2020 targets [16]. A quantitative approach can be a valid support for governmental actors and decision-makers involved in climate change in order to evaluate the policy adopted and the performance reached. In this direction, literature analysis proposes a comparison among several countries also evaluating their ability and capacity to reach national targets. This topic can be examined from multiple perspectives. For example, Sweden, Denmark, Austria, and Finland occupy the top of the ranking evaluating the levels of implementation of the Europe 2020 Strategy [17] and the same countries, in addition to Italy, France, Lithuania, Germany, Portugal, Ireland, Croatia, and Latvia, have a value greater than the European average, considering their environmental and energy performance [18]. Another work has, instead, defined Portugal, Latvia, Italy, Austria, and France as having the best results in terms of environmental protection [19] and evidence for EU 28 MSs define that the increase of 1% in primary production of RESs produces a growth of Gross Domestic Product (GDP) per capita by 0.05–0.06% [20].
Moreover, an interesting approach aims to propose the trajectories towards national targets [21]. In particular, the difficulties of some countries to reach their target can be underlined: The Netherlands and Malta concerning levels of GHG emissions [22]; and France, Ireland, Luxembourg, The Netherlands, and the United Kingdom regarding the share of REs [23]. This work aims to give new information to decision-makers in order to propose suggestions towards 2020 targets. Consequently, new inputs and alternative models are applied to define the trajectories of the share of energy from REs in GFEC towards 2020. The trajectories are defined as functions of mathematical parameters based on historical data considering different reference periods. Another aim of this work is to propose a comparison among 28 MSs in the function of two indices based on REs. The share of REs in GFEC and GFREC per capita are based on the current data, in which the average value of EU 28 and the target value can be chosen as references.
The paper is organised as follows: Section 2 presents the methodology used in this paper and historical data proposed by Eurostat in 2008–2015 interval. Results are illustrated in Section 3 proposing both current and future pictures of RESs in EU 28. Section 4 presents some concluding remarks.

2. Data and Methods

2.1. Current Situation of Renewables in Europe

Eurostat is a General Directorate of the European Commission with the main responsibility to give statistical information to European institutions, by favouring the harmonisation of statistical methods across countries. The 28 EU MSs have registered increases of GDP Purchasing Power Standards (PPS) from 2009 to 2015. In particular, it is equal to 14,714 billion in 2015 (+5.1% in comparison to previous year). GHG emissions excluding land use, land-use change and forestry (LULUCF) reduced from 2010 to 2014. Conversely there is a low increase from 4424 million CO2eq in 2014 to 4452 million CO2eq in 2015 (+0.6%). GFEC is equal to 1121 Mtoe in 2015 (+2.2%) and the role of RESs is primary within increase from 177 to 187 Mtoe (+5.5%) (see Table 1). Considering the average value of EU 28 MSs, the share of energy from REs is equal to 16.66% in 2015 with an increase of 0.53% [16].
An analysis of the current performances of the share of energy from REs in GFEC highlights that (Table 2):
  • Thirteen MSs have a value greater than European average in 2015 (also Spain was among these countries in 2014). Sweden occupies the first position (53.9%), followed by Finland (39.3%), Latvia (37.6%), Austria (33.0%), and Denmark (33.0%). These five countries have already reached the final target of the EU 28 in 2030 (as defined in Section 1, it is equal to 30%).
  • Four MSs (Latvia, Romania, Hungary, and Belgium) have registered in 2015 a decrease of the share in comparison to the previous year. Instead, ten countries present an increase greater than the European average and, in particular, the first positions are occupied by Estonia (+2.3%), Lithuania (+2.2%), Denmark (+1.5%), and Sweden (+1.4%).
  • Twelve MSs are characterised by an increase greater than the European average in the last ten years (2015–2005). The initial year of reference is 2005. Sweden guides this ranking with +14.1%, followed by Denmark (+13.8%), Italy (+12.3%), and Finland and Lithuania (+10.8%).
  • All previous values analyse historical data, while the increase “∆2015–2020” measures the difference between the last available data and the 2020 target value. Eleven MSs have already reached their 2020 targets. In addition to Croatia (+9.0%), Sweden (+4.9%), Estonia (+3.6%), Lithuania (+2.8%), Bulgaria (+2.2%), Czech Republic (+2.1%), Finland (+1.3%), Romania (+0.8%) and Italy (+0.5%), and also Hungary (+1.5%) and Denmark (+0.8%) have reached 2020 targets in 2015.

2.2. The Description of the Model

The evaluation of energy future trends is analysed in literature as defined in Section 1. A description of the models used to assess European decarbonisation pathways is proposed by [24]. It regards partial equilibrium energy system models, energy models dedicated to specific sectors, general equilibrium models, and macro-econometric models. In particular, the GREEN-X model underlines the development of RESs policy choices in energy sector [25] evaluating the possible impacts of green technologies costs on European 2020 targets [26].
However, the European Commission proposed a model based on average annual growth rate (AAGR) for the evaluation of intermediate and future trajectories. It is the arithmetic mean of a series of growth rates and it is a linear measure that does not take into account the effect of compounding [27]. Directive 2009/28/EC proposes an indicative trajectory aiming to reach a binding target of 20% of the final energy consumption from RESs by 2020. Given the initial level of RESs (taken 2005 as reference period), a growing steps structure is taken into account in which this target is distributed among the 28 EU MSs with national action plans.
Starting from this approach a previous research project has proposed indicative trajectory towards 2020 [23]. It considered three alternatives in the function of the value of the annual growth rate considering 2008–2014 as the interval. It was equal to its AAGR in a moderate scenario for each of the MSs, while an intermediate value was chosen between AAGR and the maximum one in an intermediate scenario. Finally, it was assumed equal to the maximum value of the rate in an accelerated scenario. This work follows this direction. A future trajectory is proposed and it is based again on historical data. Six alternative scenarios are obtained by the combination of two critical variables: (i) the annual growth rate, and (ii) the reference period (see Table 3).
The first is the mathematical variable of reference, which can assume three values. In fact, the annual growth rate is calculated on AAGR of the share of REs (called AAGRS) or alternately a new approach is followed. It defines that the linear increase of GFREC (called Ir)—the numerator—is replicated for the same number of periods, while GFEC—the denominator—assumes the minimum (called MinE) or maximum (called MaxE) value registered in this period. The second is the reference period, which can assume two values. From one side, the 2016–2020 interval is composed of four periods and, consequently, the same number of periods is verified when the 2011–2015 interval is considered (called short period (Sp)). From the other side, the 2008–2015 interval is analysed (called the medium period (Mp)). In fact the 2008–2014 interval was considered in a previous analysis [23], but 2015 data are currently available. New mathematical parameters and a different reference of time increase the number of case studies analysed in accordance with [22]. The simplicity of the model used (and. thus, its replicability) and inputs obtained from a consolidated database represent two advantages. On the contrary, this work does not examine the specific influence of technological, environmental, economic, and political factors on the development of RESs, and this represents a disadvantage in a dynamic context. The mathematical model used in this work is reported as follows:
AAGR ( t 2015 , t 2011 ) = ( ( V ( t 2015 ) V ( t 2014 ) ) / V ( t 2014 ) + ( V ( t 2014 ) V ( t 2013 ) ) / V ( t 2013 ) + ( V ( t 2013 ) V ( t 2012 ) ) / V ( t 2012 ) + ( V ( t 2012 ) V ( t 2011 ) ) / V ( t 2011 ) ) / 4
AAGR ( t 2015 , t 2008 ) = ( ( V ( t 2015 ) V ( t 2014 ) ) / V ( t 2014 ) + ( V ( t 2014 ) V ( t 2013 ) ) / V ( t 2013 ) + ( V ( t 2013 ) V ( t 2012 ) ) / V ( t 2012 ) + ( V ( t 2012 ) V ( t 2011 ) ) / V ( t 2011 ) + ( V ( t 2011 ) V ( t 2010 ) ) / V ( t 2010 ) + ( V ( t 2010 ) V ( t 2009 ) ) / V ( t 2009 ) + ( V ( t 2009 ) V ( t 2008 ) ) / V ( t 2008 ) ) / 7
V ( t 2020 ) = V ( t 2015 ) + AAGR ( t 2015 , t 2011 ) t N
V ( t 2020 ) = V ( t 2015 ) + AAGR ( t 2015 , t 2008 ) t N
X ( t 2020 ) Sp = X ( t 2015 ) + ( X ( t 2015 ) X ( t 2011 ) )
X ( t 2020 ) Mp = X ( t 2015 ) + ( X ( t 2015 ) X ( t 2008 ) )
V ( t 2020 ) = X ( t 2020 ) Sp / minY ( t 2015 , t 2011 )
V ( t 2020 ) = X ( t 2020 ) Sp / maxY ( t 2015 , t 2011 )
V ( t 2020 ) = X ( t 2020 ) Mp / minY ( t 2015 , t 2008 )
V ( t 2020 ) = X ( t 2020 ) Mp / maxY ( t 2015 , t 2008 )
For example, the share of energy from REs in GFEC is calculated on its previous values registered during the 2011–2015 period. Equation (1) calculates the AAGR for this interval. Starting from its initial value in 2015, the share of REs is obtained by the sum of this value and the value of AAGR multiplying for five (equal to difference between 2020 and 2015) in AAGRS-Sp scenario (see Equation (3)). A similar approach is used for AAGRS-Mp scenario (see Equation (4)), where, instead, a different value of AAGR is considered. In fact, a medium period is analysed and so the AAGR is calculated for the 2008–2015 period in Equation (2). Alternatively, another mathematical value can be chosen as a reference. In this case, the first step is represented by the definition of GFREC in 2020. It is assumed equal to the sum between the initial value in 2015 and the linear increase of this variable during the reference period (short period (see Equation (5)) or medium period (see Equation (6))). The second step is represented by the definition of GFEC. In this way, the share of REs is defined as the ratio between GFREC and GFEC. IrMinE-Sp scenario (see Equation (7)) is obtained when the historical data of reference is the minimum value of GFEC in short period, while IrMaxE-Sp scenario (see Equation (8)) is defined by the maximum value of GFEC during the 2011–2015 interval. Finally, IrMinE-Mp scenario (see Equation (9)) and IrMaxE-Mp scenario (see Equation (10)) are linked to minimum and maximum values of GFEC in the medium period, respectively. Input data (GFEC and GFREC) for each MSs are reported in Tables S1 and S2, respectively. Furthermore, this work proposes a comparison among European MSs in 2015. Two indicators are considered:
  • The share of energy from REs in GFEC; and
  • GFREC per capita.

3. Results

3.1. The Share of Energy from REs in GFEC—Trajectory towards 2020

Starting from Equations (1)–(10) and considering inputs defined in Tables S1, S2, and Table 2, the share of REs in GFEC is calculated. For example, Table 4 proposes an Excel sheet used for the calculations of Austria. It has an initial value of the share of REs in GFEC equal to 33.0% in 2015. Furthermore, it has an AAGR of 0.7% referring to the 2008–2015 period, and of 0.6% in 2011–2015. Consequently, the future projection in 2020 will be equal to 36.4% and 35.9% in AAGRS-Mpand AAGRS-Sp scenarios, respectively. Different results are, instead, obtained when the variable of reference is changed. In fact, GFREC is equal to 9231 ktoe in 2015. The increase of RE consumption is equal to 1349 ktoe from 2008 to 2015 and it is equal to 777 ktoe, instead, in the 2011–2015 interval. Consequently, the future projection in 2020 is equal to 10,580 ktoe and 10,007 ktoe, respectively. Starting from these values, the share of REs in GFEC is calculated. It is equal to 39.4% in IrMinE-Mp scenario, obtained dividing 10,580 ktoe for the minimum value registered in the 2008–2015 interval (equal to 26,879 ktoe). When, instead, the maximum value of GFEC (28,587 ktoe) is considered, the share is 37.0% in the IrMaxE-Mp scenario. Alternatively, the short period (2011–2015) can be considered. In this case, the minimum and maximum values of GFEC are equal to 27,193 ktoe and 28,514 ktoe, respectively. Consequently, the share is 36.8% and 35.1% in IrMinE-Sp and IrMaxE-Sp scenarios, respectively. Finally, the share obtained in each scenario is compared, relatively, with 2020 national targets (equal to 34% for Austria) and it is obtained that the goal is always reached. The same procedure is repeated for all 28 European countries (see Table 5).
The results of this quantitative analysis underline that Europe could reach its target in four of the six scenarios examined. In fact, the increase of the share is not sufficient when the growth of RESs is coupled with the high level of energy consumption and the level target of 20% is not reached in both IRMaxE-MP and IRMaxE-SP scenarios. The analysis of future trajectories of each country highlights the presence of four groups:
  • First Group (target is reached): Eleven MSs that always have a value greater than their 2020 target in scenarios examined in this work. Among them, there are ten countries (Bulgaria, Croatia, Czech Republic, Denmark, Estonia, Finland, Hungary, Italy, Lithuania, and Sweden) that have already reached this target in 2015 and, in addition, Austria is also in this group. Hungary had negative performances in a previous analysis [23], but this result was caused by incorrect data presented in [28].
  • Second Group (target is near to reach): Five MSs that basically have a value greater than their 2020 target. It is verified for Germany, Romania, and Slovakia in five scenarios and for Greece and Latvia in four scenarios. A high value of energy consumption also determines this effect, as highlighted for the European average value. Romania has already reached its target, but a negative performance is registered due to the value of GFEC in 2008.
  • Third Group (target is far to reach): Six MSs that basically do not have a value greater than their 2020 target. Cyprus, Portugal, Slovenia, and Spain can fix this goal in two scenarios, while Malta and Poland can fix it only in one scenario. The IrMinE-Mp scenario presents the best performance.
  • Fourth Group (target is not reached): Six MSs (Belgium, France, Ireland, Luxembourg, The Netherlands, and the United Kingdom) do not reach their target in all scenarios. This negative performance was also highlighted in the literature analysis [23].
The European countries have been divided into separate groups with respect to the function of the future projection of the share of REs in 2020. This analysis confirms two urgent measures. The first is a policy action aiming to support the development of REs regarding MSs of the third and fourth groups. The second underlines that the evolution of a low-carbon society is played by both REs and energy efficiency. The levels of GFEC must be suitable to the needs of citizens and firms considering the economic perspective, but the analysis of environmental effects is necessarily required. This work shows a quantitative analysis, in which several countries are far from their 2020 target and, consequently, new 2030 targets are only suitable for some MSs.
Finally, this work did not assign a probability to several scenarios, but tries to propose alternative snapshots that might occur in 2020. In particular, the AAGRS-SP scenario is chosen as a reference (see Figure 1). In fact, from one side, the AAGR is the variable of reference and, from the other side, the 2016–2020 interval is covered by the same number of periods referring to the 2011–2015 interval. Specifically, ten MSs do not reach their 2020 targets in this scenario. The difference between the value estimated and the relative target can be calculated for each country. It varies from −6.5% for The Netherlands to −1.7% for the United Kingdom, considering the six MSs of the fourth group and, in addition, Poland (−1.4%), Malta (−1.1%), Slovenia (−0.9%), and Spain (−0.2%).

3.2. A Comparison among 28 EU MSs in terms of the Function of RE Indices

Directive 2009/28/EC proposed the share of energy from REs in GFEC as the reference index and the literature analysis added another index represented by GFREC per capita [23]. It lacks a 2020 target and, consequently, it can be fixed as follows:
  • In the function of the AAGR methodology calculated for both GFREC and GFEC, considering the short period (2011–2015), these two variables are 244 Mtoe and 1096 Mtoe, respectively. The share of REs is equal to 22.3% and the GFREC is equal to 473 koe per capita (considering a population equal to 516 million). Instead, considering the medium period (2008–2015), they are equal to 237 Mtoe and 1062 Mtoe, respectively. In this way, the share of REs is equal to 22.4% and the GFREC per capita is equal to 461 koe (considering a population of 514 million).
  • In the function of the target (20% of the share of REs) proposed by the European Directive, the GFEC is assumed equal to 1096 Mtoe in the short period and 1062 Mtoe in the medium period in accordance with a previous work [23]. Consequently, the GFREC per capita is equal to 425 koe in the short period (considering a population of 516 million) and 413 koe in the medium period (considering a population of 514 million).
A ranking of European countries in the renewable sector in 2015 can be obtained in accordance with the two above-cited indices (see Table 6).
The results obtained permit the following observations:
  • Ten MSs (Sweden, Finland, Latvia, Austria, Denmark, Croatia, Estonia, Portugal, Lithuania, and Slovenia) have a value greater than the EU 28 averages.
  • Six MSs (Croatia, Denmark, Estonia, Finland, Lithuania, and Sweden) have reached their 2020 targets in 2015, considering both indices.
Furthermore, considering the GFREC per capita, only twelve MSs have a value greater than the European average. The Czech Republic is the new entry in comparison to the previous year [23]. In addition to the six countries above-cited, four other MSs (Austria, Latvia, Portugal, and Slovenia) have also reached their 2020 moderate targets (413–425 koe per capita). Considering a more ambitious 2020 target (461–473 koe per capita), this value is reached by seven MSs (Sweden, Finland, Austria, Denmark, Latvia, Estonia, and Slovenia).
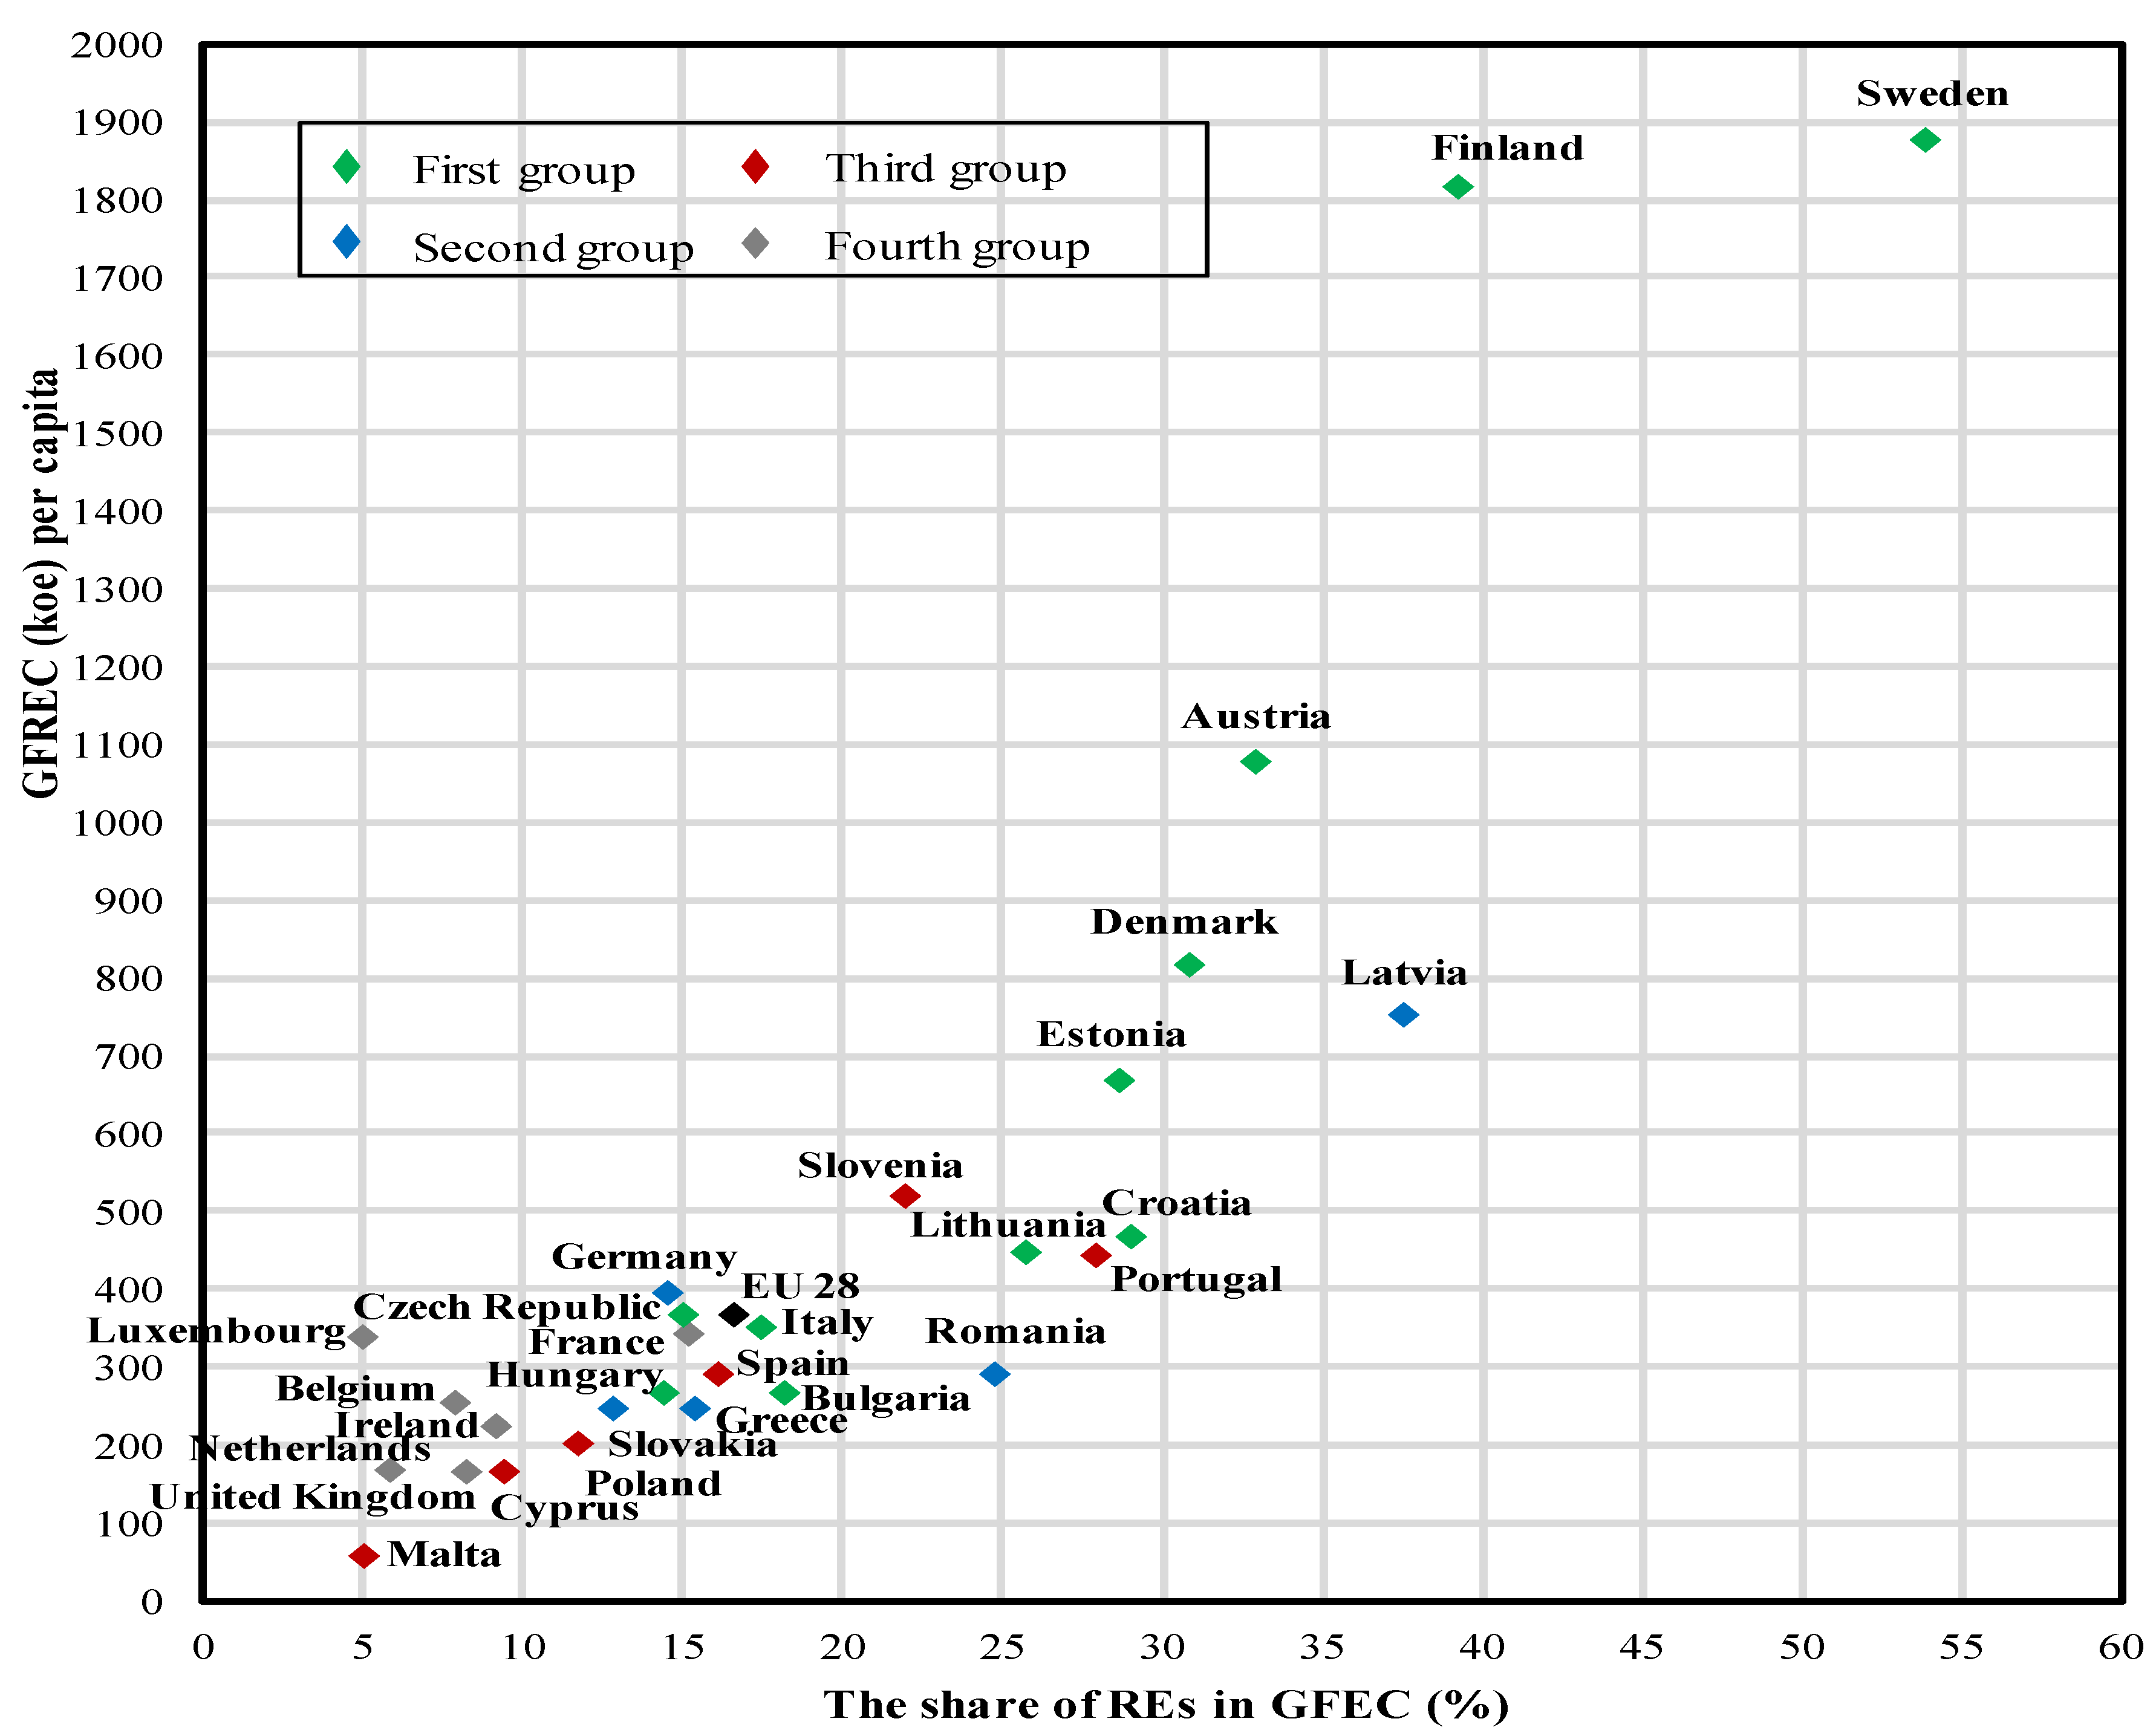
Finally, the work is completed by a diagram composed of the two indices analysed (Figure 2). From one side, Sweden and Finland have a dominant position, considering both indices. The share of REs in GFEC are 53.9% and 39.3%, respectively. GFREC is, instead, 1876 koe per capita and 1816 koe per capita, respectively. From the other side, three MSs (Ireland, The Netherlands, and the United Kingdom) of the fourth group occupy the last six positions of both rankings. France presents values near to the European average, while Belgium and Luxembourg are positioned in 20° and 15° positions, considering the gross final RE consumption per capita. In both indices Malta presents a weak performance.
The role of RESs is strategic in a sustainable agenda. From the other side, this work proposes a quantitative analysis useful to decision-makers, in which the performance of REs is evaluated and values of reference are proposed. The objectivity of results is defined by the use of historical data, but also by the methodology used. In fact, it is based on common mathematical parameters. This work defines the importance of developing renewable energy technologies as a way for countries to achieve INDC. The map of REs in European MSs defines the key-role of RESs in some countries, in which their development is extremely significant. Furthermore, GFREC per capita is increased in twenty-seven countries (Latvia is the exception) in 2015 in comparison to the previous year.
Future research can explore two topics: firstly, a policy proposal in which funding opportunities released by Europe are not given to the MSs that have not reached their national targets. Secondly, a rule could endorse economic benefits only for the MSs that are positioned in the first positions of a ranking obtained by reliable indicators. Following the first topic, some MSs of the third and fourth groups must be investigated, analysing two aspects: (i) the political, economic, social, environmental, and technological factors in terms of strength and weakness points; and (ii) the potentiality of the single renewable resources. Following the second topic, the analysis of the countries that are ranked in the first positions can be useful. It is extremely interesting to define the impact on the development of RES of the following factors and their relationships: community policies, subsidy policy, internal energy production, foreign dependence, technological development, industrial know-how, investment in research and development, and the attention of citizens and businesses towards the environment.

4. Conclusions

A roadmap for a green future is the final scope of several policy-makers and researchers. The European energy policy has supported the development of RESs initially by 2020 climate and energy package and recently, by a new 2030 Framework for climate and energy.
In EU 28, the share of REs in GFEC is equal to 16.7% in 2015 and it varies from 19.4% to 21.8% in future trajectories towards 2020. Consequently, the target of 20% could not be reaches with high levels of energy consumption. GFREC per capita was equal to 367 koe in 2015 and it ranges from 461 koe to 473 koe in 2020. These two indices do not provide the same performance indications. Six MSs (Croatia, Denmark, Estonia, Finland, Lithuania, and Sweden) have satisfied 2020 targets and have values greater than the EU 28 averages for both indices, as confirmed by Table 7, which presents the main findings of this work.
An analysis of the performance of each country permits highlighting that Sweden and Finland occupied the first positions of the rankings and, in addition to Latvia, Austria, and Denmark, have already reached an ambitious share of REs in GFEC of 30%. Nonetheless, Latvia and Austria actually do not satisfy their 2020 targets. Austria, Denmark, and Latvia also occupied the top part of the ranking when GFREC is analysed, but, in this case, the 2020 targets are reached. Europe continues to move towards sustainable targets, but several countries must improve their performance. In fact, the quantitative analysis proposed in this work defines their difficulties to reach their 2020 targets concerning the share of REs in GFEC. From one side, six MSs (Cyprus, Portugal, Slovenia, Spain, Malta, and Poland) reach it only in some scenarios, while six other MSs (Belgium, France, Ireland, Luxembourg, The Netherlands, and the United Kingdom) are never able to satisfy their targets.

Supplementary Materials

The following are available online at https://www.mdpi.com/2079-9276/7/1/10/s1, Table S1: Gross final energy consumption in the EU 28—data in ktoe; Table S2: Gross final renewable energy consumption in the EU 28—data in ktoe.
Supplementary File 1

Author Contributions

The authors contributed equally to this work.

Conflicts of Interest

The authors declare no conflict of interest.

Nomenclature

AAGR( t 2015 , t 2011 )Annual growth rate in the 2011–2015 period
AAGR( t 2015 , t 2008 )Annual growth rate in the 2008–2015 period
maxY( t 2015 , t 2008 ) Maximum value of Y in the 2008–2015 period
maxY( t 2015 , t 2011 ) Maximum value of Y in the 2011–2015 period
minY( t 2015 , t 2008 ) Minimum value of Y in the 2008–2015 period
minY( t 2015 , t 2011 ) Minimum value of Y in the 2011–2015 period
tNNumber of periods
VShare of energy from res
V( t 2008 ) Value of V in 2008
V( t 2009 ) Value of V in 2009
V( t 2010 ) Value of V in 2010
V( t 2011 ) Value of V in 2011
V( t 2012 ) Value of V in 2012
V( t 2013 ) Value of V in 2013
V( t 2014 ) Value of V in 2014
V( t 2015 ) Value of V in 2015
V( t 2020 ) Value of V in 2020
XGross final renewable energy consumption
X( t 2015 )Value of X in 2015
X( t 2011 )Value of X in 2011
X( t 2008 )Value of X in 2008
X( t 2020 )MpValue of X in 2020 considering Mp
X( t 2020 )SpValue of X in 2020 considering Sp
YGross final energy consumption

References

  1. Fragkos, P.; Tasios, N.; Paroussos, L.; Capros, P.; Tsani, S. Energy system impacts and policy implications of the european intended nationally determined contribution and low-carbon pathway to 2050. Energy Policy 2017, 100, 216–226. [Google Scholar] [CrossRef]
  2. European Commission. Climate Action—Paris Agreement. 2015. Available online: Https://ec.Europa.Eu/clima/policies/international/negotiations/paris_en (accessed on 15 May 2017).
  3. Rogelj, J.; den Elzen, M.; Höhne, N.; Fransen, T.; Fekete, H.; Winkler, H.; Schaeffer, R.; Sha, F.; Riahi, K.; Meinshausen, M. Paris agreement climate proposals need a boost to keep warming well below 2 °C. Nature 2016, 534, 631–639. [Google Scholar] [CrossRef] [PubMed] [Green Version]
  4. Jäger-Waldau, A. Snapshot of photovoltaics—March 2017. Sustainability 2017, 9, 783. [Google Scholar] [CrossRef]
  5. Antonakakis, N.; Chatziantoniou, I.; Filis, G. Energy consumption, CO2 emissions, and economic growth: An ethical dilemma. Renew. Sustain. Energy Rev. 2017, 68, 808–824. [Google Scholar] [CrossRef]
  6. Özokcu, S.; Özdemir, Ö. Economic growth, energy, and environmental kuznets curve. Renew. Sustain. Energy Rev. 2017, 72, 639–647. [Google Scholar] [CrossRef]
  7. Cucchiella, F.; Adamo, I.; Gastaldi, M. Biomethane: A renewable resource as vehicle fuel. Resources 2017, 6, 58. [Google Scholar] [CrossRef]
  8. Blazejczak, J.; Braun, F.G.; Edler, D.; Schill, W.-P. Economic effects of renewable energy expansion: A model-based analysis for germany. Renew. Sustain. Energy Rev. 2014, 40, 1070–1080. [Google Scholar] [CrossRef] [Green Version]
  9. Ruggiero, S.; Lehkonen, H. Renewable energy growth and the financial performance of electric utilities: A panel data study. J. Clean. Product. 2017, 142, 3676–3688. [Google Scholar] [CrossRef]
  10. Engelken, M.; Römer, B.; Drescher, M.; Welpe, I.M.; Picot, A. Comparing drivers, barriers, and opportunities of business models for renewable energies: A review. Renew. Sustain. Energy Rev. 2016, 60, 795–809. [Google Scholar] [CrossRef]
  11. Thellufsen, J.Z.; Lund, H. Cross-border versus cross-sector interconnectivity in renewable energy systems. Energy 2017, 124, 492–501. [Google Scholar] [CrossRef]
  12. Müller, M.; Viernstein, L.; Truong, C.N.; Eiting, A.; Hesse, H.C.; Witzmann, R.; Jossen, A. Evaluation of grid-level adaptability for stationary battery energy storage system applications in europe. J. Energy Storage 2017, 9, 1–11. [Google Scholar] [CrossRef]
  13. Collins, S.; Deane, J.P.; Ó Gallachóir, B. Adding value to EU energy policy analysis using a multi-model approach with an EU-28 electricity dispatch model. Energy 2017, 130, 433–447. [Google Scholar] [CrossRef]
  14. Connolly, D.; Lund, H.; Mathiesen, B. Smart energy europe: The technical and economic impact of one potential 100% renewable energy scenario for the european union. Renew. Sustain. Energy Rev. 2016, 60, 1634–1653. [Google Scholar] [CrossRef]
  15. European Commission. A Policy Framework for Climate and Energy in the Period from 2020 to 2030; European Commission: Juba, South Sudan, 2014. [Google Scholar]
  16. Eurostat. Statistics Database. Available online: Http://ec.Europa.Eu/eurostat/data/database (accessed on 15 May 2017).
  17. Fura, B.; Wojnar, J.; Kasprzyk, B. Ranking and classification of eu countries regarding their levels of implementation of the europe 2020 strategy. J. Clean. Product. 2017, 165, 968–979. [Google Scholar] [CrossRef]
  18. Cucchiella, F.; D’Adamo, I.; Gastaldi, M.; Koh, S.C.L.; Rosa, P. A comparison of environmental and energetic performance of european countries: A sustainability index. Renew. Sustain. Energy Rev. 2017, 78, 401–413. [Google Scholar] [CrossRef]
  19. García-Álvarez, M.T.; Moreno, B.; Soares, I. Analyzing the environmental and resource pressures from european energy activity: A comparative study of eu member states. Energy 2016, 115 Pt 2, 1375–1384. [Google Scholar] [CrossRef]
  20. Armeanu, D.; Vintilă, G.; Gherghina, Ş. Does renewable energy drive sustainable economic growth? Multivariate panel data evidence for eu-28 countries. Energies 2017, 10, 381. [Google Scholar] [CrossRef]
  21. Štreimikienė, D.; Balezentis, T. Kaya identity for analysis of the main drivers of ghg emissions and feasibility to implement eu “20–20–20” targets in the baltic states. Renew. Sustain. Energy Rev. 2016, 58, 1108–1113. [Google Scholar] [CrossRef]
  22. Liobikienė, G.; Butkus, M. The european union possibilities to achieve targets of europe 2020 and paris agreement climate policy. Renew. Energy 2017, 106, 298–309. [Google Scholar] [CrossRef]
  23. D’Adamo, I.; Rosa, P. Current state of renewable energies performances in the european union: A new reference framework. Energy Convers. Manag. 2016, 121, 84–92. [Google Scholar] [CrossRef]
  24. Capros, P.; Paroussos, L.; Fragkos, P.; Tsani, S.; Boitier, B.; Wagner, F.; Busch, S.; Resch, G.; Blesl, M.; Bollen, J. Description of models and scenarios used to assess european decarbonisation pathways. Energy Strategy Rev. 2014, 2, 220–230. [Google Scholar] [CrossRef]
  25. Resch, G.; Gephart, M.; Steinhilber, S.; Klessmann, C.; del Rio, P.; Ragwitz, M. Coordination or harmonisation? Feasible pathways for a european res strategy beyond 2020. Energy Environ. 2013, 24, 147–170. [Google Scholar] [CrossRef]
  26. Klessmann, C.; Rathmann, M.; de Jager, D.; Gazzo, A.; Resch, G.; Busch, S.; Ragwitz, M. Policy options for reducing the costs of reaching the european renewables target. Renew. Energy 2013, 57, 390–403. [Google Scholar] [CrossRef]
  27. Markaki, M.; Belegri-Roboli, A.; Sarafidis, Υ.; Mirasgedis, S. The carbon footprint of greek households (1995–2012). Energy Policy 2017, 100, 206–215. [Google Scholar] [CrossRef]
  28. Eurostat. Energy from Renewable Sources (Summary-Results-Shares-2014). Available online: http://ec.Europa.Eu/eurostat/web/energy/data/shares (accessed on 5 February 2016).
Figure 1. The share of energy from REs in GFEC—AAGRS-SP Scenario.
Resources 07 00010 g001
Figure 2. Map of REs in European countries in 2015.
Resources 07 00010 g002
Table 1. Statistical data in the EU 28 [16].
Data20082009201020112012201320142015
Population (million)500502503503504505507509
GDP PPS (billion)13,05512,29812,81813,19313,44913,55914,00314,714
GHG excl. LULUCF (MCO2eq)51794804491047594693459944244452
GFEC (Mtoe)12161151120311431147114610981121
GFREC (Mtoe)134142155151165174177187
Table 2. The share of energy from renewables in gross final energy consumption—data in % [16].
Countries2015∆2015–2014∆2015–2005∆2015–2020
Sweden53.9+1.4+14.1+4.9
Finland39.3+0.6+10.8+1.3
Latvia37.6−1.1+5.0−2.4
Austria33.0+0.2+9.7−1.0
Denmark30.8+1.5+13.8+0.8
Croatia29.0+1.1+5.2+9.0
Estonia28.6+2.3+10.6+3.6
Portugal28.0+1.0+7.5−3.0
Lithuania25.8+2.2+10.8+2.8
Romania24.8−0.1+7.0+0.8
Slovenia22.0+0.4+6.0−3.0
Bulgaria18.2+0.2+8.8+2.2
Italy17.5+0.4+12.3+0.5
EU 2816.7+0.5+7.7−3.3
Spain16.2+0.0+7.5−3.8
Greece15.4+0.1+8.5−2.6
France15.2+0.5+4.9−7.8
Czech Republic15.1+0.0+9.0+2.1
Germany14.6+0.8+8.8−3.4
Hungary14.5−0.1+10.2+1.5
Slovakia12.9+1.2+6.2−1.1
Poland11.8+0.3+4.6−3.2
Cyprus9.4+0.4+6.5−3.6
Ireland9.2+0.5+6.1−6.8
United Kingdom8.2+1.2+6.9−6.8
Belgium7.9−0.1+5.7−5.1
The Netherlands5.8+0.3+3.4−8.2
Malta5.0+0.3+5.0−5.0
Luxembourg5.0+0.5+4.1−6.0
Table 3. Six alternative scenarios.
Variable (i)Variable (ii)
Short PeriodMedium Period
AAGRAAGRS-Sp scenarioAAGRS-Mp scenario
LinearGFREC/MinGFECIrMinE-Sp scenarioIrMinE-Mp scenario
LinearGFREC/MaxGFECIrMaxE-Sp scenarioIrMaxE-Mp scenario
Table 4. The Austrian case study.
Data20082009201020112012201320142015
GFEC (ktoe)28,02826,87928,58727,66127,61228,51427,19328,009
GFREC (ktoe)78818049867984548673920189109231
Share of REs in GFEC (%)28.129.930.430.631.432.332.833.0
ParameterValueParameterValue
AAGR(t2015, t2011)0.6%X(t2020)Sp10,008 ktoe
AAGR(t2015, t2008)0.7%X(t2020)Mp10,580 ktoe
X(t2015)9231 ktoeminY(t2015, t2011)27,193 ktoe
X(t2011)8454 ktoemaxY(t2015, t2011)28,514 ktoe
X(t2008)7881 ktoeminY(t2015, t2008)26,879 ktoe
V(t2015)33.0%maxY(t2015, t2008)28,587 ktoe
ScenariosValueScenariosValue
AAGRS-Mp36.4%AAGRS-Sp35.9%
IrMinE-Mp39.4%IrMinE-Sp36.8%
IrMaxE-Mp37.0%IrMaxE-Sp35.1%
Table 5. The share of renewable energy in gross final energy consumption in 2020—data in %.
ScenariosAAGRS-MpAAGRS-SpIrMinE-MpIrMaxE-MpIrMinE-SpIrMaxE-SpTarget 2020
Austria36.435.939.437.036.835.134
Belgium10.9 √9.9 √12.6 √11.4 √10.0 √9.4 √13
Bulgaria23.723.127.724.324.222.416
Croatia34.033.535.229.832.929.620
Cyprus12.4 √13.613.210.8 √12.4 √10.6 √13
Czech Republic19.720.221.419.619.518.613
Denmark39.640.042.436.737.934.630
Estonia35.632.537.533.931.430.125
Finland45.047.446.242.044.843.038
France18.1 √20.2 √18.8 √17.0 √19.7 √18.3 √23
Germany18.918.521.119.718.317.6 √18
Greece20.821.122.416.4 √20.116.5 √18
Hungary20.215.124.122.515.914.913
Ireland12.8 √12.4 √14.1 √11.4 √12.4 √11.9 √16
Italy21.823.322.419.222.020.317
Latvia43.142.742.538.8 √40.838.4 √40
Lithuania31.433.032.929.932.231.323
Luxembourg6.5 √7.6 √6.8 √6.1 √6.8 √6.2 √11
Malta8.4 √8.9 √12.19.8 √9.8 √8.4 √10
The Netherlands7.4 √7.5 √7.8 √6.6 √7.0 √6.4 √14
Poland14.7 √13.6 √16.114.9 √13.1 √12.5 √15
Portugal31.632.229.9 √25.7 √29.6 √27.0 √31
Romania27.929.026.823.6 √27.726.324
Slovakia16.516.117.314.915.013.8 √14
Slovenia26.924.1 √27.724.2 √22.7 √20.8 √25
Spain20.019.8 √20.016.8 √18.4 √16.9 √20
Sweden60.160.562.557.758.756.249
United Kingdom12.2 √13.3 √13.7 √12.0 √12.5 √11.8 √15
EU 2820.721.021.819.7 √20.319.4 √20
National target 2020 not reached is denoted by the symbol √.
Table 6. Ranking of European Member States in function of renewable energy indices in 2015.
The Share of REs in GFEC (%)GFREC (koe) per Capita
RankingCountriesValueRankingCountriesValue
Sweden53.9Sweden1876
Finland39.3Finland1816
Latvia37.6Austria1076
Austria33.0Denmark817
Denmark30.8Latvia751
Croatia29.0Estonia667
Estonia28.6Slovenia520
Portugal28.0Croatia469
Lithuania25.8Lithuania447
10°Romania24.810°Portugal442
11°Slovenia22.011°Germany395
12°Bulgaria18.212°Czech Republic368
13°Italy17.5EU 28367
EU 2816.713°Italy350
14°Spain16.214°France343
15°Greece15.415°Luxembourg339
16°France15.216°Romania292
17°Czech Republic15.117°Spain290
18°Germany14.618°Bulgaria267
19°Hungary14.519°Hungary266
20°Slovakia12.920°Belgium254
21°Poland11.821°Greece247
22°Cyprus9.422°Slovakia246
23°Ireland9.223°Ireland225
24°United Kingdom8.224°Poland202
25°Belgium7.925°The Netherlands168
26°The Netherlands5.826°Cyprus167
27°Malta5.027°United Kingdom166
28°Luxembourg5.028°Malta59
Table 7. Main findings.
CountriesThe Share of REs in GFECGFREC per Capita
2020 Target>EU 282020 Target>EU 28
Austria®®®
Bulgaria®®
Croatia®®®®
Czech Republic®®
Denmark®®®®
Estonia®®®®
Finland®®®®
Germany®
Hungary®
Italy®®
Latvia®®®
Lithuania®®®®
Portugal®®®
Romania®®
Slovenia®®®
Sweden®®®®
® = Goal reached.

