Abstract
In sub-Saharan Africa, the high demand for wood-based cooking fuels calls for urgent policy action to steer the cooking energy sector towards more sustainability. While the subnational scale is growing in importance for policy planning, current energy assessments still only consider individual entities without taking into account resource flows. Ignoring flows of biomass cooking fuels in supply–demand assessments is a system boundary problem that can lead to misleading policy recommendations. In this paper, we tackle the boundary problem in subnational supply–demand assessments and provide a tool to support knowledge-based decision-making on the management of biomass cooking fuels in sub-Saharan Africa. Using Kitui County as a case study, we developed and tested an approach consisting of a supply model, local demand model, balance model, availability model, and adjusted balance model. The balance model only considers local fuel supplies and demand, whereas the adjusted balance model also considers external demand, which reduces the locally available supply of fuel. The results show that fuel demand and supply are spatially heterogeneous and vary between wood-based and non-woody fuels, and that the transport distance of fuels strongly affects local fuel availability and determines whether the supply–demand balance is positive or negative. We conclude that subnational energy policies should consider geographical distribution of supply and demand, aim to increase the fuel mix, consider external demand in supply–demand assessments, and differentiate between fuels for self-consumption and the market.
Keywords:
biomass; energy; cooking fuels; Kenya; spatial modelling; supply–demand balance; boundary problem 1. Introduction
1.1. The Energy Policy Challenge
In sub-Saharan Africa, wood-based fuels are the primary source of energy for cooking. About 90% of rural and low-income urban households use mainly firewood or charcoal [1,2,3]. Wood-based cooking fuels are renewable, often available locally, and constitute an important income opportunity, notably for poor households in rural areas [4,5,6,7,8]. However, the sourcing, production, and use of these fuels is mainly unsustainable. Charcoal production has a substantial carbon footprint, contributing to climate change [9]; unsustainable cutting of wood is an important driver of environmental degradation [10,11,12]; charcoal emits high amounts of carbon monoxide; and the combustion of firewood releases fine particles both leading to indoor air pollution and the premature death of millions every year [13,14].
Urgent policy actions are needed to steer the current and future cooking energy sector towards more sustainability. Wood-based fuels will remain important in the next few decades, as the number of consumers is expected to increase [1]. It is estimated that in sub-Saharan Africa, almost 920 million people will use wood-based fuels by 2030, compared to approximately 750 million today [15]. In order to reduce the risk of a looming supply–demand mismatch, appropriate resource management strategies must be developed based on an accurate assessment of the current energy situation at the local scale [16].
The local governance scale is growing in importance, since, in major parts of East Africa, policymaking is increasingly devolved to the subnational level [17,18,19], a process that entails opportunities and challenges. Local authorities tend to have a better understanding than national authorities of the local energy situation, which is key to effective planning [20,21,22]. However, the subnational energy sector is not a closed system. Cooking fuels such as charcoal are traded from supply areas to consumer markets, sometimes over long distances. Such movements can substantially affect the supply–demand balance at local level. Therefore, local governments should include resource flows across administrative boundaries into their strategies and development plans.
To our best knowledge, current studies fail to provide policy advice to local and national governments while accounting explicitly for spatial flows of biomass. This shortcoming is particularly evident in the case of cooking fuels and big urban centres, as cities often generate massive demand, especially for charcoal, and considerably impact distant supply areas. Hence, to effectively support subnational energy planning, studies are needed that help integrate external demands into the assessment of energy situations.
1.2. The Boundary Problem
The challenge described above is also known as the system boundary problem (or edge effect) [23,24]. It refers to the fact that geographical study areas are bounded but spatial processes are not [23]. Ignoring this fact can produce misleading results in supply–demand assessments. In spatial analyses and statistics, several different strategies for coping with this problem are applied: ignoring, torus mapping, empirical buffer zones, artificial buffer zones, extrapolation into buffer zones, and correction factors [24]. Approaches have been developed, but none have been able to solve the problem entirely. The boundary problem therefore remains a challenge for spatial analysts but also for decision-makers concerned with the planning of energy supply or natural resource management in general.
Some conceptual approaches do tackle the boundary problem implicitly, in the context of natural resource management at a subnational scale. Documenting and taking into account transboundary flows is the most commonly applied approach on national level. National governments usually keep well-documented statistics on the import and export of natural resources. This allows planners to gain an overview of the current resource situation, considering external demands and supplies. At a subnational level, the concept of urban metabolism [25] is a well-known approach for analysing flows of energy and materials. An alternative concept is the Energyscape developed by [26] and defined as “the complex spatial and temporal combination of the supply, demand and infrastructure for energy within a landscape”. However, data availability on flows of natural resources is a major challenge in both the concepts of urban metabolism and Energyscape.
A way of bypassing the boundary problem is to extend the study area to a higher geographical scale, i.e., to include the areas surrounding the main area of interest. Transboundary natural resource management, for instance, is the process of collaboration across boundaries, with the aim of increasing the effectiveness of natural resource management [27] and addressing the boundary problem. Similarly, the management of natural resources at national rather than subnational level can defuse the boundary problem at a lower geographical scale. While imperatively this requires the collaboration of neighbouring areas, it has been argued that managing resources independently from neighbours might be more effective [27]. Furthermore, scaling up from the subnational to the national level in this way does imply an additional workload and additional demand for data covering the entire country rather than only a part of it.
A widely used approach is the definition of management (or analysis) boundaries based on the main resource flows. Water resource management based on watersheds rather than administrative boundaries has become a common practice [28,29]. In analogy to the watershed approach, Drigo et al. [30] created the concept of urban woodshed to visualize, define, and map the territory required for the sustainable supply of the woody biomass needed in cities. However, this approach has two main disadvantages. First, the urban woodshed is a result of the analysis rather than a pre-defined delimitation of a study area. Second, the concept is suitable for isolated areas, but does not provide solutions on how to handle potentially overlapping urban woodsheds, for example in the case of adjacent urban centres.
In conclusion and to the best of our knowledge, no approach exists that allows assessment of the supply–demand balance of wood-based cooking fuels at a subnational level, while accounting adequately for the boundary problem. This methodological gap needs to be filled, since the risk of supply–demand mismatches is a dominant issue for energy policies [31], with assessment of demand and supply a prerequisite for optimizing these policies [32].
1.3. Objectives
Against this background, the overall goal of this research is to develop a method to tackle the boundary problem in the context of a subnational supply–demand balance, and thus to provide a tool to support knowledge-based decision-making on the management of biomass cooking fuels in sub-Saharan Africa. To achieve this overall goal, we address two specific objectives:
- To develop an approach to model the supply–demand balance of biomass cooking fuels, considering not only demand originating inside, but also outside a specific planning area.
- To provide spatially explicit estimates of the potential and current demand for biomass cooking fuels, the potential supply of currently used and alternative biomass cooking fuels, and the resulting supply–demand balance.
The outputs of this research have a twofold practical relevance. On the one hand, we aim to develop a generic approach that can be used for supply–demand assessment of different natural resources. On the other, we will provide specific recommendations for cooking fuel-related energy policies in a selected case study area (cf. Section 2.1.1).
2. Methods
2.1. Scope
2.1.1. Case Study Area
We selected Kitui County in Eastern Kenya as our case study area. Kenya’s new constitution, which took effect in 2010, includes the devolution of governance to the subnational level, thus giving counties more legislative power than before. In parallel, the national “Sustainable energy for All (SE4All) Kenya Action Agenda” [33] aims to facilitate the development and planning of sustainable energy policies from 2015 to 2030. It advocates the establishment of an integrated approach, taking into consideration devolution of governance. At the national level, the Ministry of Energy and Petroleum supports the establishment of a SE4All County technical committee to oversee implementation in counties and to provide a link with the national government. Counties are encouraged to develop energy planning documents that include the status of energy use and demand, as well as the energy resource potential. Furthermore, the agenda suggests the development of a strategy to promote alternative cooking fuels (bioethanol, biogas, solar cookers, vegetable oils, briquettes, and agricultural waste), with clear goals and targets.
Within Kenya, we selected Kitui County because of its national importance as a charcoal supply area [34], particularly for Nairobi due to its proximity, and its vast woodlands and bushlands. The county covers an area of 30,496 km2, including 6369 km2 occupied by Tsavo East National park (cf. Figure 1), and has a population of approximately 1 million [35]. Most inhabitants are engaged in small-scale and subsistence farming. Firewood is the main cooking fuel for most households [35], but charcoal production for the Nairobi market is widespread and constitutes an important income opportunity, notably for poor households in rural areas [36,37]. The county government has designed and adopted a Charcoal Management Act [38], aiming to regulate and manage production, use, and trade. Furthermore, adequate and effective communication mechanisms between county and national governments have been identified as critical for effective implementation of the act [33]. However, the current County Integrated Development Plan (2013–2017) does not include an alternative cooking fuel strategy as proposed by the SE4All agenda.
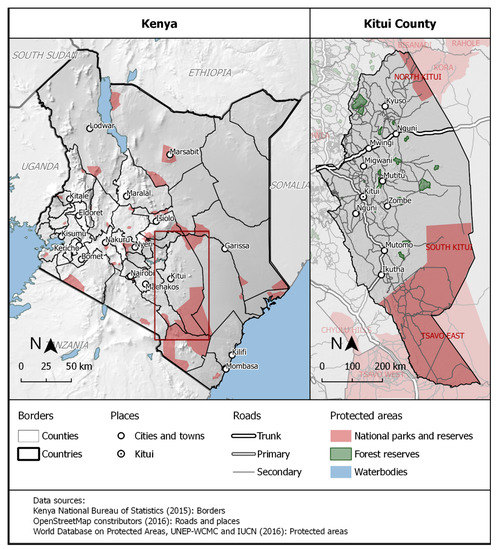
Figure 1.
Overview map of Kenya (left) and the case study area Kitui County (right).
For the above reasons, Kitui County is an interesting case study area. Many areas in sub-Saharan Africa face similar challenges and opportunities. This study will therefore provide results that are relevant for Kitui’s decision-makers but that may also be generalized and transferred to other regions.
2.1.2. Fuels
We selected five biomass fuels: firewood, charcoal, biogas, jatropha seeds, and maize cobs. This selection covers the cooking fuels that are currently used at household level but also others that are used only marginally or not at all. It also covers fuels that can be transported and traded over long distances, and fuels that cannot be transported due to technical barriers or economic constraints.
Firewood is wood that is used for cooking without prior processing and it is the most widely used cooking fuel in rural areas of sub-Saharan Africa [1]. Households collect firewood mostly in their immediate surroundings [39,40,41], but it is also a commodity sold on local markets. In contrast, its transport to distant markets is hardly profitable due to its low energy density [5,42]. In this study, we consider the annual supply of harvestable deadwood [43] a sustainable source for firewood.
Charcoal is a solid residue obtained through the pyrolysis of wood. It is currently the dominant cooking fuel in low-income urban households in sub-Saharan Africa [44,45,46]. It is preferred over firewood due to its high energy density, lower emissions of particulate matter, and lower transport costs. In order to supply urban areas with charcoal, the fuel is sometimes transported over hundreds of kilometres [47,48,49,50]. Its production and trade is an important source of income for hundreds of thousands of people in both urban and rural areas [51,52].
Biogas is a mixture of methane and carbon dioxide obtained from the anaerobic digestion of organic matter. The digestate, a co-product of this process, can be spread on the fields to improve soil fertility. Therefore, we assume that using cow dung for biogas production does not result in utilization trade-offs. Biogas is frequently promoted as an alternative source of cooking energy, but technical, economic, sociocultural, and institutional barriers have limited its dissemination [53,54,55,56]. In our analysis, we calculate supply potential based on the availability of animal dung and water, which is essential for biogas production. Technical solutions to transport biogas exist, but are currently not well known. Therefore, production and consumption of biogas usually take place on the same site.
Jatropha curcas (jatropha) seeds contain a high percentage of oil that is used for lighting, cooking, fuelling engines, or producing soap. The seeds can also be used directly as a cooking fuel without prior processing [57]. In order to avoid competition for land with food crop production, we only consider jatropha cultivated as hedges around plots [58,59]. Jatropha seeds have a high energy density [60] and transport over long distances to reach commercial markets might be viable. However, in recent years, jatropha production was not profitable in East Africa, leading to the failure of most commercial investments [61,62,63,64]. Using jatropha seeds as a by-product of hedges might be an option, thanks to a lack of opportunity costs and the multifunctionality of this land use [65].
Maize cobs are residues that can be used as cooking fuel. They can be dried and burned directly, or dried, ground, and subsequently pressed into briquettes [66,67,68,69]. Maize cobs can be used as litter for animals and as mulch and soil conditioner [70]. To our knowledge, they have no major importance in agricultural practices and we therefore consider that maize cobs in their entirety are available for cooking purposes. Maize cobs are frequently used as supplementary fuel for cooking [71]. Due to their low energy density, we do not consider maize cobs an economically viable product and hence their transport over long distances is very unlikely.
2.2. Framework and Components
2.2.1. Framework
The conceptual framework consists of five components: Supply model, Local demand model, Balance model, Availability model, and Adjusted balance model. Each component provides relevant results for energy policy planning and uses different input data. A main objective of the conceptual framework was to minimize the data requirements. The availability model depends on data (i.e., the number of households) covering the entire country; the supply model and local demand model depend only on data for Kitui County; and the balance model and adjusted model depend only on the results of the other models as inputs. An overview of the framework structure is given in Figure 2 and its components are explained in detail thereafter.
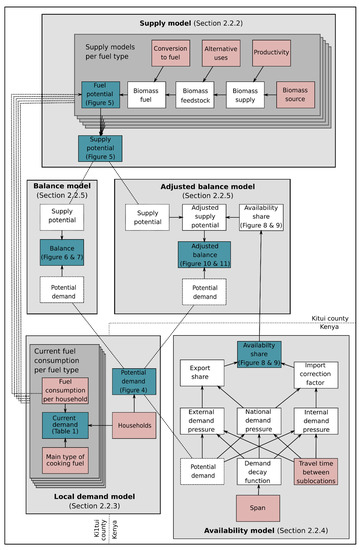
Figure 2.
Overview of the assessment model consisting of the five components: supply, demand, local balance, external demand, and adjusted balance. Model inputs are represented with red boxes, intermediate results in white boxes, and model results in green boxes.
2.2.2. Supply Model
The Supply model estimates the potential fuel supply in Kitui County according to the different types of fuel (Fuel potential) and in total (Supply potential). We calculated the fuel potential of each cooking fuel in five steps following a simplified supply chain [72]: (1) Identifying and quantifying the biomass source; (2) calculating the annual biomass supply based on its current volume and productivity; (3) estimating the biomass feedstock by subtracting alternative uses; and (4) estimating the amount of biomass fuel by including a conversion factor from raw biomass to final fuel. In an additional step; (5) we converted the supply potential of each fuel into household equivalents (Fuel potential).
For firewood, we calculated the potential fuel supply as a share [43] of the existing wood stock (biomass source) [73]. The firewood demand per household was taken from the Kenya Integrated Household Budget Survey (KIHBS) 2005/06 [74] (cf. Appendix A).
For charcoal, we calculated the mean annual increment of woody biomass (biomass supply) as a function [75] of the existing wood stock [73] and subtracted the biomass located in exclusion areas (i.e., national parks and reserves, and forest reserves). We then reduced the supply to the share of biomass that can actually be used for charcoal production (biomass feedstock), by factoring in alternative uses such as construction material [76], firewood [43], and various other uses (assumptions). The charcoal demand per household was taken from the KIHBS 2005/06 [74] (cf. Appendix B).
For biogas, we considered three biomass sources: exotic cattle, indigenous cattle, and pigs. For each, we estimated the annual dung supply (biomass supply) based on daily production figures by Orskov et al. [77]. Since indigenous cattle are often grazed outside [78] and dung collection is only possible when cattle are stabled overnight, we halved its biomass supply (assumption). As dung must be mixed with the same amount of water [79] to obtain slurry (biomass feedstock), we only considered households with a less than 10-min walk to the next source of water [79,80]. We subsequently estimated the annual biogas supply (biomass fuel) using a gas production rate [77] for the dung of each category of animal. The biogas demand per household was taken from Kossmann et al. [81] (cf. Appendix C).
For jatropha seeds, we first calculated the average maize cultivation area in each sublocation based on the Kitui agricultural statistics [37] and the land use/land cover map for the county [82]. We calculated the total length of plot boundaries based on an average plot size of 0.52 ha [37] and the assumption of square-shaped plot geometries. We reduced the potential hedge length for seed production to 40% of the total length to factor in alternative hedge uses and adjacent plots that share boundaries. We calculated the amount of jatropha seeds (biomass feedstock/biomass fuel) by multiplying the hedge length with the seed productivity of hedges per metre [83]. The seed demand per household was taken from City Stove Works [57] (cf. Appendix D).
For maize cobs, we first estimated the annual maize yield per sublocation, based on the Kitui County yield statistics [38], and the land use/land cover map for the county [82]. We considered only maize cobs and disregarded stalks and leaves, in order to avoid competition with alternative uses such as mulching and fodder, and therefore considered only 15% of plant weight (biomass feedstock/biomass fuel) [84]. We estimated the demand for maize cobs per household by conducting a water boiling test (fuel needed to boil 5 L of water, allowing it to simmer for 45 min) [85] and assuming an average number of 2.5 hot meals per household per day (cf. Appendix E).
2.2.3. Local Demand Model
The Local demand model calculates the two different types of potential fuel demand. Current demand, on the one hand, is defined as the amount of each type of fuel that is currently consumed each year within a specific area. It was calculated from the number of households [86], their main type of cooking fuel [86], and the fuel consumption per household [74]. Potential demand, on the other hand, is defined as the number of potential consumer households irrespective of the type of cooking fuel they are currently using, and equals the total number of households residing in a specific area. We used current demand to obtain an overview of the actual biomass resource demand and potential demand to calculate the supply–demand balance of biomass cooking fuels.
2.2.4. Availability Model
The Availability model estimates the impact of external demand, i.e., how much demand originating from outside Kitui County reduces the fuel supply available for consumption in Kitui County. We quantified this impact using an Availability share that we defined as the share of the supply potential that remains for on-site consumption.
We used the demand pressure as the underlying concept to calculate the availability share. Based on the Steward model [87,88], we defined the demand pressure as a stock of potential consumer households weighted by travel distance between the sublocations as follows:
where Ai is the demand pressure in sublocation i, Oj is the actual number of households in sublocation j, and f(dij) is a negative function of the travel time between sublocation i and sublocation j (distance decay). In other words, the demand pressure in a specific sublocation is the number of households within that location and the sum of the households in the other sublocations, reduced by a specific distance decay function and their specific travel time distances to that specific sublocation. All related calculations were done using the R package SpatialPosition [89].
The distance decay used in the above formula describes how the distant demand of one sublocation on another sublocation decreases as a function of the travel time distance between these two sublocations. We used a negative, exponential function [90,91,92,93,94] defined as follows:
where Oij is the demand pressure in the sublocation i originating from sublocation j, Oj is the potential demand (number of households) in sublocation j, dij is the travel time distance between sublocation i and sublocation j, and α is a rate parameter of distance decay computed from the parameter span as follows:
We can depict this distance decay function also as the probability function of the transport distances of cooking fuels.
Span is a key parameter in the distance decay and defined as the travel time distance at which demand pressure has decreased to 50% of its initial value. For example, sublocation A has 10,000 households, the decay function shows a span of 90 min, and sublocation B is at a travel distance of 90 min from Sublocation A. This means that sublocation B would receive demand pressure of 5000 households from sublocation A. As we did not have any empirical data of the transport distance of biomass cooking fuels, we were not able to calibrate the distance decay function. Instead, we used multiple spans, i.e., assumptions about the transport distances of biomass cooking fuels, between 0 and 210 min to run our model and to show their impact on the model outcomes.
The travel time distance between sublocations was calculated with R’s gDistance package [95]. As inputs, we used OpenStreetMap data [96] for the road network and waterways, the SRTMv4.1 digital elevation model [97] for deriving slope values in the terrain, and Africover data [82] for the land cover. The detailed specification of all the model parameters are listed in Appendix F.
In order to obtain the availability share, we differentiated between three types of demand pressure (Figure 3): national demand pressure, external demand pressure, and internal demand pressure. National demand pressure considers all sublocations in Kenya, and equals the sum of the internal demand pressure and external demand pressure. In contrast, internal demand pressure considers all sublocations in Kitui County, and external demand pressure all sublocations outside Kitui. For each sublocation, we subsequently derived national demand pressure and internal demand pressure, providing us with import share. The ratio between the internal demand pressure and national demand pressure in the sublocation in Kitui County provided us with the export share, i.e., share of supply potential that will remain in the county.
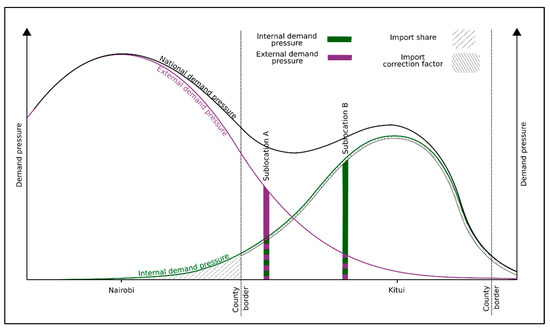
Figure 3.
Calculation of availability share.
Furthermore, we estimated an import correction factor to take into account that fuels are possibly imported to Kitui County from surrounding areas. We calculate this factor as the ratio between the internal demand pressure and national demand pressure for all sublocations outside Kitui County. In order to obtain the final availability share, we subtracted the import correction factor from the import share. This correction is not spatially disaggregated. However, we tried to keep the model as simple as possible, as we assume that imports of biomass cooking fuels are marginal and will therefore only slightly affect the result.
2.2.5. Balance and Adjusted Balance
The balance model and the adjusted balance model provide us with a supply–demand balance while accounting differently for external demands. The Balance is the difference between potential demand and supply potential. It takes into consideration demand and supply originating only from within Kitui County. By contrast, the Adjusted balance is the difference between potential demand and adjusted supply potential. The underlying assumption of the adjusted supply potential is that some part of the supply potential is not available for local consumption, but exported to sublocations outside Kitui County. We therefore calculate the adjusted supply potential by reducing the supply potential using the availability share. In both cases—the balance and the adjusted balance—positive values indicate a supply surplus, whereas negative values indicate a supply deficit.
2.3. Computation
2.3.1. Unit of Analysis
We use sublocations as spatial units of analysis, as provided by the Kenya National Bureau of Statistics (KNBS). They are the lowest administrative level for which boundary geometries, linked with socio-economic data from the Population and Housing Census, are available in digital format [35]. All raster data were aggregated to the sublocation level. All data available at country or district level were downscaled to that level, weighting the data by population [35] or agricultural area [82]. The related R scripts can be found in the Supplementary Material.
2.3.2. Result Aggregation
In order to aggregate the results to the county level, we had to distinguish between transportable and non-transportable fuels. The reason for this is that the distant demand only impacts transportable fuels. We considered charcoal and jatropha seeds to be transportable, and maize cobs, biogas, and firewood to be non-transportable due to economic or technical considerations.
As a result, we can distinguish between four types of supply potential: locally consumed supply potential, potential supply surplus, exported supply, and untapped supply potential. Locally consumed supply potential is the supply potential that is consumed in the same sublocation as it originates. It does not exceed the availability share unless the fuels are non-transportable, and it is limited to the potential demand within the sublocation. Potential supply surplus is the supply potential of transportable fuels that exceed potential demand within a sublocation and are not exported to areas outside Kitui County. Therefore, this surplus can be used to compensate deficit balances of sublocations in Kitui County, and contributes positively to the supply–demand balance of the county. Exported supply is any supply potential of transportable fuels exported to areas outside Kitui County. Untapped supply potential is supply potential that exceeds the potential demand within a sublocation but remains untapped as the fuels cannot be transported. The underlying assumption of this classification is that non-transportable fuels are given priority in local consumption.
3. Results
3.1. Balance
3.1.1. Local Demand
Fuel demand in Kenya and Kitui County is spatially heterogeneous and there are clear differences between wood-based and non-woody fuels. Figure 4 shows the distribution of potential demand in terms of potential consumer households in Kenya (left) and Kitui (right). The potential demand for cooking fuels at national scale is highest along the coast and between Lake Victoria and Kitui County, which is at the eastern edge of the densely populated area between Nairobi and Mount Kenya. With 200,000 households, it is home to only a small share of the national population (8.5 million households). In Kitui County, households are concentrated in the western part of the county, which enjoys favourable agro-climatic conditions, and steadily decrease towards the less accessible areas in the north, south, and east.
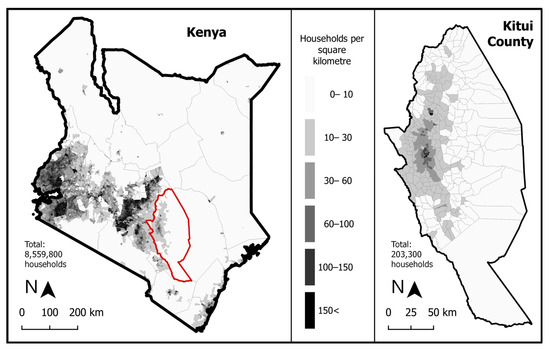
Figure 4.
Potential demand in terms of household in Kenya (left) and Kitui County (right).
Table 1 shows the current demand in Kitui County according to different types of fuel. Current demand is strongly dominated by wood-based fuels. Around 303,500 t of firewood are used by 89% of households. Charcoal is the second most important fuel (7.9% of the households; 9800 t annually). Fossil fuels such as paraffin and liquefied petroleum gas (LPG) are the main fuels in only 3% of the households and other fuels (e.g., biogas, crop residues, and electricity) in less than 1%. The dominance of wood-based fuels (96.9%) is above the national average (83%).

Table 1.
Current fuel consumption in Kitui County (Based on KNBS 2005 and KNBS 2009).
The fuel mix in the households of Kitui County is very low. Around 90% of the households in Kitui use only one type of fuel and the remaining 10% use at most two different types. Diversity is more pronounced at national level, with one-quarter of households using more than one type of fuel. In most cases, households use only firewood, charcoal, or paraffin. In cases where households use multiple fuels, the most common combinations are firewood with charcoal, or charcoal with paraffin.
3.1.2. Supply
The fuel potentials of biomass cooking fuels are distributed unevenly and there are clear differences between wood-based fuels and non-woody fuels (Figure 5). In total, the supply potential of the five fuels assessed in Kitui County would sustainably cover the demand of 537,000 households. However, there is a strong divergence in fuel potential: firewood and charcoal provide 87% of the supply potential, while biogas, jatropha, and maize share the remaining 13%.
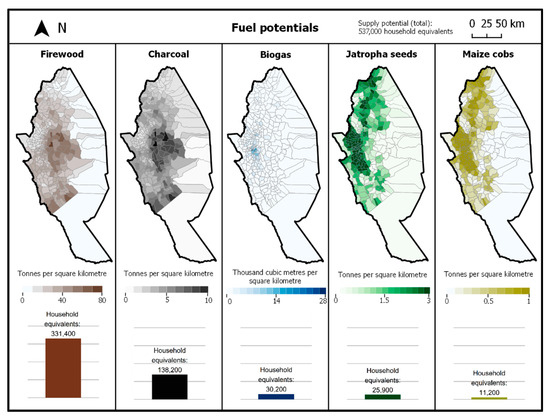
Figure 5.
Geographical distribution of the potential supply of the different biomass cooking fuels (biomass fuel) and number of households whose demand for cooking fuels can be satisfied with it (fuel potentials).
The fuel supply potential is concentrated in the centre of the county, but there are clear differences in the spatial distribution between the different fuels. The potential of firewood and charcoal is highest in the hilly centre of Kitui County and to some degree in the south, in the area bordering Tsavo East National Park. The highest potential for biogas is in the area around Kitui town, where the density of both population and livestock are highest. The highest supply potentials for jatropha seeds and maize cobs are in the main agricultural areas in the west and north-west of the county.
3.1.3. Balance
Most sublocations show a positive supply–demand balance, i.e., the potential supply of biomass cooking fuels in a sublocation exceeds demand for those fuels in this sublocation (Figure 6). Sublocations with a negative balance are located along the densely populated axis between Kitui town and Mwingi. This area overlaps with the area where the potentials for biogas, maize, and jatropha are highest. However, since the supply potential of these alternative fuels is rather moderate in absolute terms, their supply is not sufficient to cover demand.
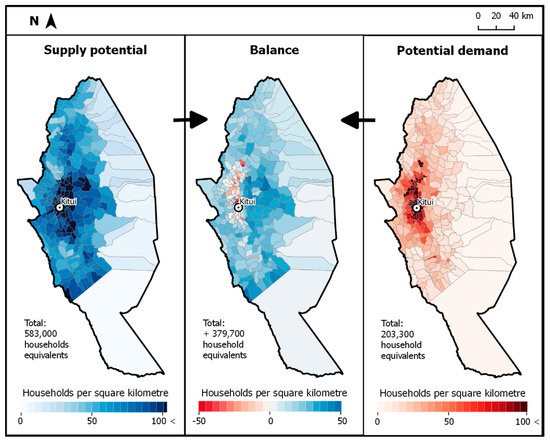
Figure 6.
Supply potential, potential demand, and balance of biomass cooking fuels.
At county level, the balance in Kitui is clearly positive (Figure 7). The county can supply firewood, charcoal, biogas, jatropha seeds, and maize cobs to cover the cooking fuel needs of 537,000 households in total. However, since we assume that several fuels (firewood, maize, and biogas) are not transportable, a share of the surplus that is equivalent to the demand of 209,000 households cannot be used (untapped supply potential). Still, the entire demand of the county’s 203,000 households can be covered locally. Consumption of fuels in the same sublocation where they are sourced (locally consumed supply potential) allows 87% of the fuel demand (176,000 households) to be covered. The remaining demand (13%) can be covered by transporting the surplus supply of charcoal and jatropha to other sublocations (potential supply surplus). The rest of this transportable surplus could cover the needs of 124,000 additional households outside Kitui County.
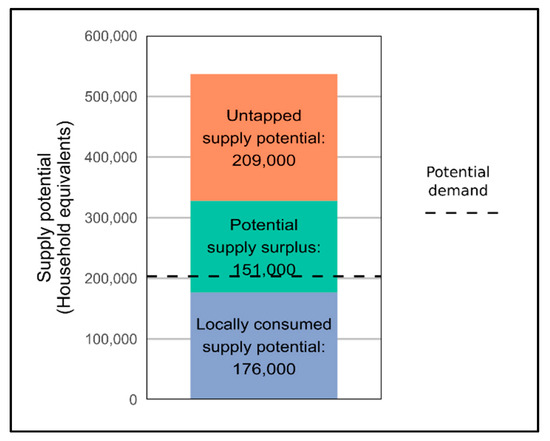
Figure 7.
Balance aggregated to county level distinguishing between untapped supply potential (red), potential supply surplus (green), locally consumed supply potential (blue), and potential demand (dashed line).
3.2. Adjusted Balance
3.2.1. Availability
The availability of cooking fuels substantially depends on external demand. Figure 8 shows availability share as a function of different assumptions about the transport distance of biomass cooking fuels (span). In other words, the figure shows how much of the cooking fuel supply could be available for consumption within Kitui County compared to the exported supply.
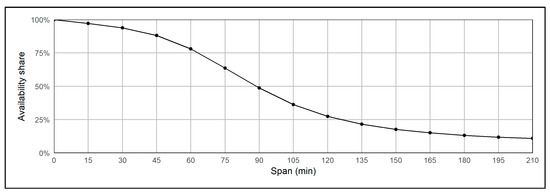
Figure 8.
Span and availability share.
The result follows a negative, s-shaped curve. A span of zero minutes yields an availability share of 100%, meaning that there is no external demand pressure and therefore no fuels would be exported. In contrast, a span of 210 min yields an availability share of 11%, meaning that the external demand pressure was substantially higher than the internal demand pressure, and that most of the supply potential would probably be exported. Furthermore, differences in the span do not substantially affect the availability share if we assume a small or large span, but strongly affect it if we assume a span of between 45 and 100 min. For instance, increasing the span from 0 to 15 min decreases the availability share by three percentage points; increasing the span from 75 to 90 min decreases the supply by 15 percentage points; and increasing the span from 195 to 210 min decreases the supply by one percentage point.
It has to be taken into account that no differentiation between transportable and non-transportable has been made in this example. For instance, if all fuels would be non-transportable, the entire supply potential would be locally available, despite the fact that the availability ratio could be low and therefore indicate that only a small share of the fuels was available.
We used a span of 90 min to provide a visual example of the spatial differences. Figure 9 shows the national demand pressure (left), the external demand pressure exerted on Kitui County (centre top), the internal demand pressure (centre bottom), and the availability share within Kitui County (right) as model results with the respective span.
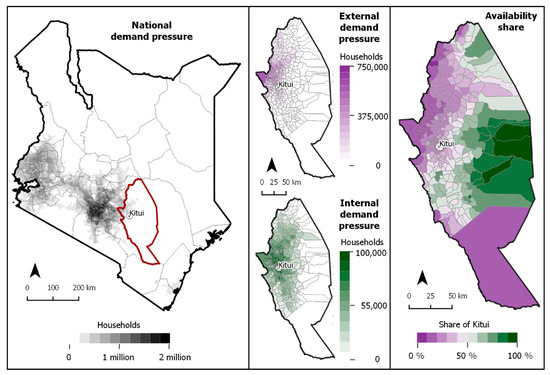
Figure 9.
Demand pressure for the entire country (left); demand pressure with its source outside Kitui (centre top) and inside Kitui (centre bottom); and the resulting availability share in Kitui County (right), all based on a span of 90 min.
National demand pressure is the demand for cooking fuel in each sublocation considering the demand originating in neighbouring and more distant sublocations. Compared to local demand (cf. Section 3.1.1), national demand is more dispersed, amplified around Nairobi, and pronounced along roads. The external demand pressure in Kitui is concentrated in the west and decreases towards the north, south, and east. It originates in Nairobi and follows the main road (A3) into Kitui County. Internal demand pressure has a similar pattern to local demand, but is amplified around Kitui town and along the main transport ways. External demand clearly exceeds internal demand in the north-west of the county. In contrast, internal demand is dominant in the main towns (Kitui and Mwingi) and in the less accessible eastern parts.
3.2.2. Adjusted Supply Potential and Adjusted Balance
Based on potential demand, supply potential, and availability share, we calculated the adjusted balance. Figure 10 shows fuel demand (dashed line); fuel supply available to the county, composed of Locally consumed supply (blue) and Local surplus (green); and fuel supply not available to the county, composed of Exported supply (yellow) and Untapped supply potential (orange), as a function of increasing distance decay.
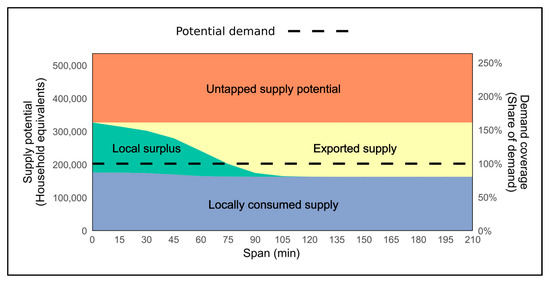
Figure 10.
Relation between the span and the supply–demand balance of biomass cooking fuels.
The fuel available for the county is decreasing significantly, due to the growing amount of exported fuels (exported supply). Beyond a span of 70 min, the available fuel for the county falls below the county’s demand. However, the deficit does not exceed 40,000 households, which is reached after approximately 120 min. This levelling off is due to non-transportable fuels, which can cover fuel demand in most sublocations and therefore constitute the main part of the locally consumed supply.
In contrast, the fuel not available to the county is increasing, due to the growing share of exported fuels, which is reducing mostly the local surplus and to some small degree the locally consumed supply. Furthermore, a supply potential equivalent to the needs of 209,000 households remains untapped (untapped supply potential) since it exceeds local needs but is not exported, because the fuels forming this potential (firewood, maize, and biogas) are not transportable.
3.2.3. Sensitivity to Modified Assumption
The balance changes fundamentally if firewood is considered a transportable fuel, a change in assumption that cuts the share of non-transportable fuels from 69% to 8%. Figure 11 compares the available supply of biomass cooking fuels in Kitui County as a function of the span for both assumptions. The blue curve shows the available amount under the assumption that firewood is a traded and therefore transported fuel; the red curve shows the available amount under the assumption that firewood is a non-traded fuel and therefore not transported.
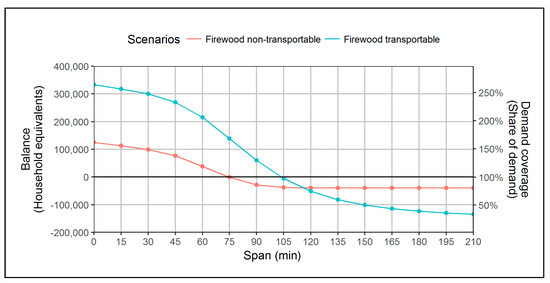
Figure 11.
Relation between the span and the supply–demand balance of biomass cooking fuels under different assumptions about the transport of firewood.
The share of transportable fuels only moderately affects the change from a positive to a negative supply–demand balance. The supply balance becomes negative with a span larger than approximately 100 min under the assumption that firewood is transportable, compared to 70 min under the assumption that it is non-transportable.
In contrast, the share of transportable fuel strongly affects the sensitivity of the supply–demand balance to the distance decay. With a span of zero, the positive balance is more than twice as high (320,000 instead of 120,000) if firewood is considered to be transportable, than when it is considered non-transportable. In relative terms, the former corresponds to a supply of 164% of the demand, whereas the latter corresponds to 261% of the demand. In contrast, using a decay parameter of 210 min would result in a deficit of 134,000, under the assumption of firewood as a transportable fuel, compared to a deficit of only 40,000 households under the assumption of firewood as a non-transportable fuel. In relative terms, only 34% of the demand in Kitui County can be covered in the former case, whereas 81% of the demand could be covered in the latter case.
These differences in sensitivity are due to the levelling effect of the non-transportable fuels. On the one hand, a big share of non-transportable fuels reduces the amplitude of the positive balance as losses, i.e., supplies in sublocations that exceed their demands are more likely. On the other hand, however, it reduces the impact of the external demand and therefore mitigates potentially negative supply–demand balances.
4. Discussion
4.1. Estimates of Potential Supply, Demand, Balance, and External Impact
4.1.1. Supply of Different Fuels
In order to develop sustainable cooking fuel strategies, the contribution of different fuels should be assessed based on their supply potential, geographical distribution, and potential demand. The results of the supply calculations show the clear dominance of wood-based fuels. The high supply potential of charcoal and firewood exceeds demand in most areas. Therefore, they have a high theoretical potential to supply remote and urban areas. Non-woody biomass fuels such as biogas, jatropha seeds, and maize cobs play only a secondary role. Depending on the context, however, they might occupy niches and contribute to diversifying the fuel mix of households, thereby securing the local cooking energy supply and providing new income opportunities.
Biogas is promising for in situ consumption. Although its overall supply potential is rather modest, households can cover their entire cooking energy needs with it given they have sufficient animals and access to water. However, policies are required to tackle the technical and socio-economic hurdles associated with this fuel, for example, by promoting simple and affordable solutions, and providing loans or government assistance [53,54,55].
Maize cobs do not contribute substantially, but are easy-to-use fuel supplements for on-site consumption. They are available in most agricultural households in large amounts, but their energetic value is low, such that the average maize producing household in Kitui County would not be able the cover its own demand using only maize cobs. Therefore, they are at best secondary fuels with low market prospects in urban areas, due to high emissions of particulate matter.
Jatropha seeds have a moderate supply potential, but could theoretically be commercialized or used on-site. They have a comparatively high energy density and can therefore be transported to other areas for direct consumption or further processing. We recommend combusting jatropha seeds on site, without further processing, as a complement to other cooking fuels, unless affordable and user-friendly technologies are found for the combustion of jatropha oil, and a viable market for jatropha oil develops.
4.1.2. Fuel Mix
A more diversified fuel mix could considerably contribute to the energy security of local households. The fuel mix in Kitui County is currently very low and dominated by wood-based fuels. However, users are quite willing to diversity their cooking fuels [98], and broadening the range of available and accessible fuels could be an adequate strategy to alleviate energy poverty [99]. Therefore, making available alternative cooking fuels such as jatropha seeds or biogas could have considerable potential to improve the energy supply, despite their comparatively small supply potential.
4.1.3. Balance and External Impact
Our results confirm the known fact that Kitui County is an important charcoal supply area for Nairobi. However, it is likely that the demand for biomass cooking fuels will increase in the future, and therefore policies need to consider not only the local demand but also demand from outside Kitui County. A strong external demand for biomass cooking fuels is a risk and an opportunity at the same time. On the one hand, it could lead to a local supply deficit and to increased fuel prices, and thus affect the energy security of local households. On the other, it could provide new income sources, especially for rural households, which would otherwise not be available. Non-transportable fuels such as biogas and maize are less affected by external demand for biomass cooking fuels and are therefore in rather stable supply. However, promoting the supply beyond local demand would not make any sense: these fuels cannot be sold on the market and do not provide any additional income opportunity.
Based on the above, one can state that energy policies and strategies should differentiate between cooking fuels that are mainly used for self-consumption and those that are sold on local, subnational, and national markets. They should help find ways of reducing exports or increasing the local production of non-transportable fuels to secure local supply. Exports that are based on a local demand–supply surplus and therefore do not impair the local fuel security are a substantial income opportunity and should be promoted as much as possible.
4.1.4. Impacts of Assumptions on Results
The results need to be interpreted in light of our underlying assumptions. First, we used potential demand instead of actual demand. In other words, the actual demand for biomass cooking fuels might be lower, since some of the households use alternative cooking fuels such as paraffin or liquefied petroleum gas (LPG). Thus, a negative supply–demand balance does not necessarily mean that there is a supply–demand deficit. In the case of Kitui County however, such alternative fuels are little used (3%), and hence their impact on the supply–demand balance is negligible.
Second, our selection of biomass resources does not include all available possibilities, such as sawdust and char dust briquettes from other crop residues (e.g., sorghum, millet, beans, peas, or rice husks). Investigating the supply potential of such additional resources would help to achieve a more comprehensive assessment of biomass energy potentials.
Third, we assumed deadwood to be the only source of firewood, and allocated timber to the production of charcoal. However, a different allocation of the two wood sources would influence the results quite strongly. For example, avoiding pyrolysis, which is responsible for the loss of around 50% of the wood’s caloric value [100], and replacing charcoal with sawdust briquettes, wood chips, or pellets, would lead to a substantial increase in the potential supply of energy from woody biomass.
Lastly, we assumed that firewood is not transported over long distances; even though the results show that the question of transportability has a substantial impact on the balance and can therefore not be ignored.
4.2. Approach
4.2.1. Informative Value and Generalizability
The approach used in this study has four main advantages: (1) it can handle the missing information on transboundary flows; (2) it requires data on demand but none on supply outside the area of interest; (3) it can handle diametric resource flows and overlapping resource supply catchments; and (4) it can be applied to different types of natural resources (food, timber, soils, fossil fuels, etc.). These advantages are crucial in enhancing the effectiveness of natural resource management in a subnational administrative entity independently from planning processes in neighbouring entities. Of course, the approach cannot substitute collaboration and coordination beyond county boundaries, which remains a vital aspect of planning.
4.2.2. Methodological Limitations
The used approach has some methodological limitations. Understanding these limitations is vital in order to apply the approach and interpret the results correctly. First, our approach uses a span for external demand, but assumes constant internal demand. As a result, the aggregation of the supply–demand balance might overestimate the supply side, especially under the assumption of short spans. In order to achieve consistency across the model, the distance decay should be applied to internal demand too. However, adjusting the model accordingly would require the analysis of the external pressure of every single sublocation within the county. We also assumed that imports of biomass cooking fuels are negligible, and consequently adjusted the availability share uniformly.
Second, we assumed that imports of biomass cooking fuels are negligible, and consequently adjusted the availability share uniformly. This simplification is reasonable in the case of Kitui County, since the imports of fuel are expected to be marginal. However, it might not be transferable to other case study sites without adjustments to the method. We therefore recommend the further development of the model accordingly, before applying it in areas with a higher share of imported fuels.
Third, this study provides results for the current state, but not for possible future developments. However, key aspects such as population growth and changes in fuel consumption patterns are momentous in Kenya and most sub-Saharan countries and they are likely to affect considerably the supply–demand balance of biomass cooking fuels. We therefore recommend developing model scenarios that allow capturing possible future developments.
4.2.3. Data Demand
The proposed approach helps to reduce the demand for input data. In the case of Kitui, only the demand and supply data within the county and the demand data outside the county are required, whereas for the rest of the surrounding area (all of Kenya), the only data needed are on the demand for cooking fuels. Nevertheless, results suggest that additional data would substantially increase the model’s validity and accuracy. Empirical data would help to improve the parameterization and calibration of the distance decay function. In the case of Kenya, charcoal movement permits, introduced as part of the Forest Regulations of 2009 [53], would offer a promising opportunity to fill this data gap, as they include information about the quantity, source, and destination of the transported charcoal. This data would allow us to calibrate the decay function and determine the accuracy of our supply–demand model.
Literature [39,40,41] and field visits suggest that firewood is mainly used locally. Therefore, a substantial amount of the available biomass supply is not tapped as cooking fuel, as it exceeds the local demand and because it is not transported elsewhere. At the same time, our results show that the assumption about the transportability and trade of firewood can substantially affect the supply–demand balance. Therefore, more evidence is needed on the likeliness and economic feasibility of transporting and trading the different types of biomass cooking fuels.
5. Conclusions
We developed an approach to consider external demand in modelling the supply–demand balance of biomass cooking fuels in a specific case study area, and we tested the model by estimating the demand, potential supply, and supply–demand balance of five biomass cooking fuels in Kitui County, Kenya. Our approach allows policymakers, planners, and researchers to assess the supply–demand balance at a subnational level, while considering resource demands from outside their areas of jurisdiction or research. The spatially explicit estimates for the different biomass fuels provide a sound basis for recommendations on cooking-fuel-related energy policies in Kitui County. However, both the approach and the specific findings can be generalized and hence applied to different contexts and other resources.
We argue that our approach is particularly suitable for most administrative areas at a subnational decision-making level that have a resource management mandate and that are mainly resource suppliers. The method is suitable for a wide range of different natural resources that are traded across a country, as well as for resources that are not traded or non-transportable.
Our findings and recommendations are transferable to various geographic areas. Many sub-Saharan African countries include regions with similar climatic, natural, and socio-economic conditions. In such areas, cooking fuel diversification can contribute to alleviating pressure on the wood resources and improving local energy security.
Nonetheless, the model could still be further improved and additional knowledge generated to provide additional and more specific recommendations for policy planning in the cooking energy sector. Above, we listed specific recommendations to conceptually improve the model and the data inputs, to increase its reliability and improve its validity. We also recommend testing the model further in different geographical contexts and developing model scenarios reflecting future developments of key aspects such as population size and fuel consumption patterns.
Supplementary Materials
The following are available online at http://www.mdpi.com/2079-9276/7/1/11/s1. R scripts of the supply models, the demand model, the demand pressure model (gravity), and the balance models.
Supplementary File 1Acknowledgments
The research presented in this paper is part of the project titled “Prospects for Biomass Energy in East Africa” (project IZ01Z0_146875) and was funded by the “Swiss Programme for Research on Global Issues for Development” (r4d programme). The programme is an initiative jointly supported by the Swiss Agency for Development and Cooperation (SDC) and the Swiss National Science Foundation (SNSF). We are very grateful for the valuable inputs and comments of the anonymous reviewers.
Author Contributions
Roger Bär conceived and designed the assessment framework, implemented the models, and analyzed the data; Roger Bär and Albrecht Ehrensperger wrote the paper.
Conflicts of Interest
The authors declare no conflict of interest.
Appendix A. Firewood Supply Model
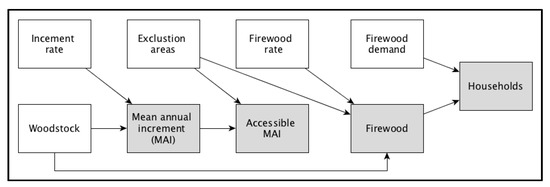
Figure A1.
Overview of variables in the firewood supply model (Data inputs in white; intermediate and final results in grey).

Table A1.
Detailed description of the variables in the firewood supply model (Data inputs in white; intermediate and final results in grey).
Table A1.
Detailed description of the variables in the firewood supply model (Data inputs in white; intermediate and final results in grey).
| Variable | Description | Values | Source/Assumption/Computation |
|---|---|---|---|
| Woodstock | Aboveground live woody biomass estimations per sublocation | County total: 27’488’903 t (901 t/km2) | [73] Downloaded from: http://www.globalforestwatch.org |
| Increment rate | Relation of above-ground woody biomass to mean annual increment of woody biomass | Formula: Increment = 16.7 * Woodstock−0.49 | [75] |
| Mean annual increment (MAI) | Annual supply of woody biomass per sublocation | County total: 1,080,475 t | Mean annual increment = 16.7 * (Woodstock)−0.49 |
| Exclusion areas | National Parks, National Reserves, and forest reserves | [101] Downloaded from: http://www.wdpa.org/ | |
| Accessible MAI | Annual supply of woody biomass per sublocation outside protected areas | County total: 818,323 t | Accessible MAI = Mean annual increment − Mean annual increment within Exclusion areas |
| Firewood rate | Share of woodstock available for firewood each year | 1.7% | [43] |
| Firewood | Potential supply of firewood per sublocation and year | 556,460 t | Firewood = (Woodstock − Woodstock in protected areas) * Firewood rate |
| Firewood demand | Firewood consumption per household | 4.6 kg per day (1.679 t per year) | [74] Downloaded from: http://statistics.knbs.or.ke/nada/index.php/catalog |
| Households | Number of household per sublocation that could potentially cover their cooking energy demand with firewood | 331,423 households | Households = Firewood/Firewood demand |
Appendix B. Charcoal Supply Model
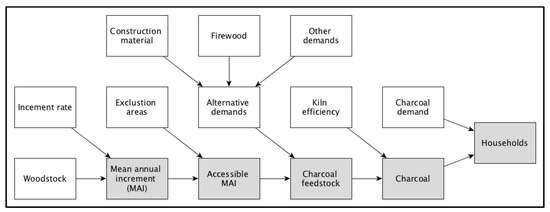
Figure A2.
Overview of variables in charcoal supply model (Data inputs in white; intermediate and final results in grey).

Table A2.
Detailed description of the variables in the charcoal supply model (Data inputs in white; intermediate and final results in grey).
Table A2.
Detailed description of the variables in the charcoal supply model (Data inputs in white; intermediate and final results in grey).
| Variable | Description | Values | Source/Assumption/Computation |
|---|---|---|---|
| Woodstock | Aboveground live woody biomass estimations | County total: 27’488’903 t (901 t/km2) | [73] Downloaded from: http://www.globalforestwatch.org |
| Increment rate | Relation of above-ground woody biomass to mean annual increment of woody biomass | Formula: Increment = 16.7 * Woodstock−0.49 | [75] |
| Mean annual increment (MAI) | Annual supply of woody biomass per sublocation | County total: 1,080,475 t | Mean annual increment = 16.7 * (Woodstock)−0.49 |
| Exclusion areas | National Parks, National Reserves, and forest reserves | [101] Downloaded from: http://www.wdpa.org/ | |
| Accessible MAI | Annual supply of woody biomass per sublocation outside protected areas | County total: 818,323 t | Accessible MAI = Mean annual increment − Mean annual increment within Exclusion areas |
| Alternative demands | Construction material | 19.2 kg of wood per person and year in rural areas 12.4 kg of wood per person and year in peri-urban areas 5.4 kg of wood per person and year in urban areas | [76] |
| Firewood | 1.7% of woodstock for firewood | [43] | |
| Other demands | 20% of MAI for diverse | Assumption | |
| Charcoal feedstock | Potential supply of woody biomass for charcoal production per year and sublocation | County total: 554,884 t | Charcoal feedstock = Accessible MAI − Alternative demands |
| Kiln efficiency | Conversion factors from wood to charcoal | 15% | [102] |
| Charcoal | Potential supply of charcoal per sublocation and year | County total: 83,232 t | Charcoal = Charcoal feedstock * Kiln efficiency |
| Charcoal demand | Amount of charcoal required by a household | 0.602 t per household and year (1.65 kg per household and day) | [74] Downloaded from: http://statistics.knbs.or.ke/nada/index.php/catalog |
| Households | Number of household per sublocation that could potentially cover their cooking energy demand with charcoal | County total: 138,203 households | Households = Charcoal/Charcoal demand |
Appendix C. Biogas Supply Model
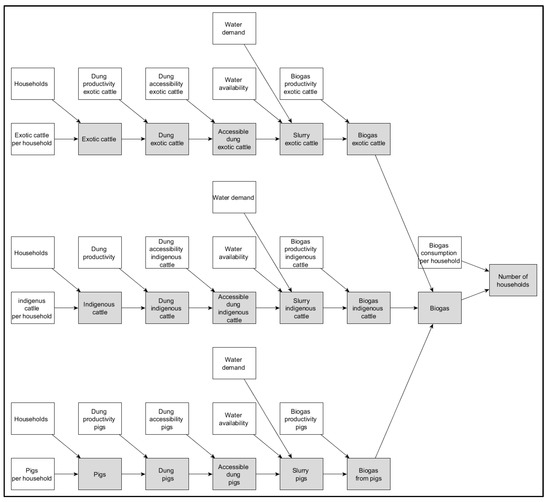
Figure A3.
Overview of variables in the biogas supply model (Data inputs in white; intermediate and final results in grey).

Table A3.
Detailed description of the variables in the biogas supply model (Data inputs in white; intermediate and final results in grey).
Table A3.
Detailed description of the variables in the biogas supply model (Data inputs in white; intermediate and final results in grey).
| Variable | Description | Values | Source/Assumption/Computation |
|---|---|---|---|
| Households | Number of households per sublocation | Total: 203,264 households | [86] Downloaded from: http://statistics.knbs.or.ke/nada/index.php/catalog |
| Exotic cattle per household | Average number of exotic cattle per household and sublocation | County average: 0.05 | [86] Downloaded from: http://statistics.knbs.or.ke/nada/index.php/catalog |
| Indigenous cattle per household | Average number of indigenous cattle per household and sublocation | County average: 1.60 | [86] Downloaded from: http://statistics.knbs.or.ke/nada/index.php/catalog |
| Pigs per household | Average number of pigs per household and sublocation | County average: 0.01 | [86] Downloaded from: http://statistics.knbs.or.ke/nada/index.php/catalog |
| Exotic cattle | Average number of exotic cattle per household and sublocation | County total: 9583 | Exotic cattle = Exotic cattle per household * Households |
| Indigenous cattle | Average number of indigenous cattle per household and sublocation | County total: 326,026 | Indigenous cattle = Indigenous cattle per household * Households |
| Pigs | Average number of pigs per household and sublocation | County total: 1204 | Pigs = Pigs per household * Households |
| Dung productivity exotic cattle | Daily production of fresh waste (kg) per exotic cow breed | 25.75 kg per head and day | [77] |
| Dung productivity indigenous cattle | Daily production of fresh waste (kg) per indigenous cow breed | 9.98 kg per head and day | [77] |
| Dung productivity pigs | Daily production of fresh waste (kg) per pig | 2.3 kg per head and day | [77] |
| Dung exotic cattle | Dung production from exotic cattle per sublocation | County total: 90,076 t per year | Dung exotic cattle = Exotic cattle × Dung productivity exotic cattle * 365 |
| Dung indigenous cattle | Dung production from indigenous cattle per sublocation | County total: 1,187,614 t per year | Dung indigenous cattle = Indigenous cattle × Dung productivity indigenous cattle * 365 |
| Dung pigs | Dung production from pigs per sublocation | County total: 1011 t per year | Dung pigs = Pigs * Dung productivity pigs * 365 |
| Dung accessibility exotic cattle | Share of exotic cattle dung that can be collected | 100% | Assumption: Cattle is kept in zero-grazing practice [78] |
| Dung accessibility indigenous cattle | Share of indigenous cattle dung that can be collected | 50% | Assumption: Cattle is kept only overnight in stables. Therefore, half of the dung is not easy collectable [78] |
| Dung accessibility pigs | Share of pig dung that can be collected | 100% | Assumption: Pigs are kept in zero-grazing practice [78] |
| Accessible dung exotic cattle | Accessible dung from exotic cattle per sublocation | County total: 90,076 t per year | Accessible dung exotic cattle = Dung exotic cattle * Dung accessibility exotic cattle |
| Accessible dung indigenous cattle | Accessible dung from indigenous cattle per sublocation | County total: 593,807 t per year | Accessible dung indigenous cattle = Dung indigenous cattle * Dung accessibility indigenous cattle |
| Accessible dung pigs | Accessible dung from pigs per sublocation | County total: 1011 t per year | Accessible dung pigs = Dung pigs × Dung accessibility pigs |
| Water availability | Share of household in Kitui County with a less than 10 min of walking distance to the next source of water for drinking, bathing, cooking, or livestock | 70.7% | [74] Downloaded from: http://statistics.knbs.or.ke/nada/index.php/catalog |
| Water demand | Share of dung in the slurry compared to the water | 0.5 | [79] |
| Slurry exotic cattle | Potential supply of slurry from exotic cattle per sublocation | County total: 127,337 t per year | Slurry exotic cattle = Accessible dung exotic cattle * Water availability/Water demand |
| Slurry indigenous cattle | Potential supply of slurry indigenous cattle per sublocation | County total: 839,446 t per year | Slurry exotic cattle = Accessible dung indigenous cattle * Water availability/Water demand |
| Slurry pigs | Potential supply of slurry from pigs per sublocation | County total: 1430 t per year | Slurry exotic cattle = Accessible dung pigs * Water availability/Water demand |
| Biogas productivity exotic cattle | Amount of biogas produced from exotic breed cattle dung | 100 m3 per t of exotic breed cattle dung | [77] |
| Biogas productivity indigenous cattle | Amount of biogas produced from indigenous breed cattle dung | 32 m3 per t of exotic breed cattle dung | [77] |
| Biogas productivity pigs | Amount of biogas produced from pig dung | 81 m3 per t of pig dung | [77] |
| Biogas exotic cattle | Potential supply of biogas from exotic cattle per sublocation | County total: 636,860 m3 per year | Biogas exotic cattle = Slurry exotic cattle * Water demand * Biogas productivity exotic cattle |
| Biogas indigenous cattle | Potential supply of biogas from indigenous cattle per sublocation | County total: 1,3431,131 m3 per year | Biogas indigenous cattle = Slurry indigenous cattle * Water demand * Biogas productivity indigenous cattle |
| Biogas pigs | Potential supply of biogas from pigs per sublocation | County total: 57,909 m3 per year | Biogas pigs = Slurry pigs * Water demand * Biogas productivity pigs |
| Biogas demand | Amount of biogas required by a household | 657 m3 per year (1800 L per day) | [81] |
| Households | Number of household per sublocation that could potentially cover their cooking energy demand with biogas | County total: 30,222 households | Households = (Biogas exotic cattle + Biogas indigenous cattle + Biogas pigs)/Biogas demand |
Appendix D. Jatropha Supply Model
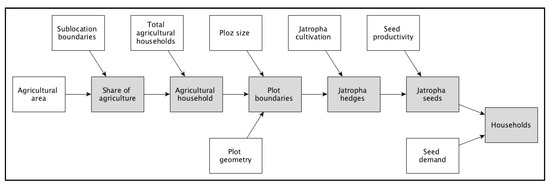
Figure A4.
Overview of variables in the jatropha seeds supply model (Data inputs in white; intermediate and final results in grey).

Table A4.
Detailed description of the variables in the jatropha seeds supply model (Data inputs in white; intermediate and final results in grey).
Table A4.
Detailed description of the variables in the jatropha seeds supply model (Data inputs in white; intermediate and final results in grey).
| Variable | Description | Values | Source/Assumption/Computation |
|---|---|---|---|
| Agricultural area | Agricultural areas in Kitui county | Raster map | [82] Downloaded from: http://www.fao.org/geonetwork/srv/en/main.home |
| Sublocation boundaries | Boundaries of sublocations in Kitui County | Vector map | Provided by Kenya National Bureau of Statistics (KNBS) |
| Share of agriculture | Share of the total agricultural area per sublocation | Intersection of Agricultural area and Sublocation boundaries | |
| Total agricultural households ) | Number of agricultural households in Kitui County | 180,570 households | [86] Downloaded from: http://statistics.knbs.or.ke/nada/index.php/catalog |
| Agricultural household | Agricultural household per sublocation | County total: 180,570 households | Agricultural household = Total agricultural households * Share of agriculture |
| Maize plot size | Average size of maize plot per agricultural households | 0.52 ha | [37] |
| Plot geometry | Relation between plot size and the corresponding contour | Plots have the form of squares | Assumption |
| Plot boundaries | Length of total boundaries per sublocation | 52,002 km | Plot boundaries = (Maize plot size)(1/2) * 4 * Agricultural household |
| Jatropha cultivation | Share of the plot boundaries that can be used for jatropha hedge cultivation | 40% | Assumption The remaining 50% are used for alternative hedge plants (e.g., for fodder) |
| Jatropha hedges | Total length of potential jatropha hedges per sublocation | 20,800 km | Jatropha hedges = Plot boundaries * Jatropha cultivation |
| Seed productivity | Amount of jatropha seeds yielded per unit of jatropha hedge length | 1 kg of jatropha seeds per meter of hedge and year | [83] |
| Jatropha seeds | Potential supply of jatropha seeds per sublocation and year | 20,800 t | Jatropha seeds = Jatropha hedges * Seed productivity |
| Seed demand | Amount of jatropha seeds required by a household | 2.2 kg per household and day (0.803 t per year) | [57] |
| Households | Number of households that could potentially be supplied with jatropha | 25,904 households | Households = Jatropha seeds/Seed demand |
Appendix E. Maize Supply Model
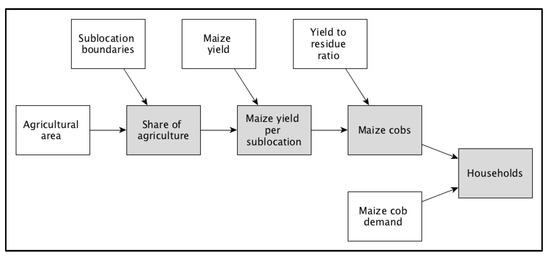
Figure A5.
Overview of variables in the maize cobs supply model (Data inputs in white; intermediate and final results in grey).

Table A5.
Detailed description of the variables in the maize cobs supply model (Data inputs in white; intermediate and final results in grey).
Table A5.
Detailed description of the variables in the maize cobs supply model (Data inputs in white; intermediate and final results in grey).
| Variable | Description | Values | Source/Assumption/Computation |
|---|---|---|---|
| Agricultural area | Agricultural areas in Kitui county | Geometries | [82] Downloaded from: http://www.fao.org/geonetwork/srv/en/main.home |
| Sublocation boundaries | Boundaries of sublocations in Kitui County | Geometries | Provided by Kenya National Bureau of Statistics (KNBS) |
| Share of agriculture | Share of the total agricultural area per sublocation | Intersection of Agricultural area and Sublocation boundaries | |
| Maize plots | Area under maize cultivation (values based on the year 2012) | 93,600 ha | [37] |
| Maize yield | Amount of maize yielded per year and sublocation | County total: 46,716 t per year | Maize yield = Maize plots * Share of agriculture |
| Yield to cob ratio | Share of the maize yield that is the maize cob (%) (values based on the year 2012) | 15% | [84] |
| Maize cobs | Potential supply of maize cobs per sublocation and year | County total: 7007 t per year | Maize cobs = Maize yield * Yield to cob ratio |
| Maize cob demand | Number of maize cobs required by a household | 0.625 t per year and household (1.7125 kg per day and household) | Own Water Boiling Test (i.e., demand for boiling 5 L of water and simmering it 45 min) [101]: 800 g to 930 g Assumption: 2.5 meals per day |
| Households | Number of household per sublocation that could potentially cover their cooking energy demand with maize cobs | County total: 11,200 households | Households = Maize cobs * Cob demand |
Appendix F. Parameters of Travel Time Distance Model

Table A6.
Travel speed by land cover type.
Table A6.
Travel speed by land cover type.
| Land Cover Class | Speed |
|---|---|
| Post-flooding or irrigated croplands | 4 km/h |
| Rainfed croplands | 4 km/h |
| Mosaic cropland (50–70%)/vegetation (20–50%) | 4 km/h |
| Mosaic vegetation (50–70%)/cropland (20–50%) | 4 km/h |
| Closed to open broadleaved evergreen or semi-deciduous forest | 4 km/h |
| Closed broadleaved deciduous forest | 4 km/h |
| Open broadleaved deciduous forest/woodland | 3 km/h |
| Closed needleleaved evergreen forest | 4 km/h |
| Open needleleaved deciduous or evergreen forest | 3 km/h |
| Closed to open mixed broadleaved and needleleaved | 4 km/h |
| Mosaic forest or shrubland (50–70%)/grassland | 4 km/h |
| Mosaic grassland (50–70%)/forest or shrubland | 4 km/h |
| Closed to open shrubland | 4 km/h |
| Closed to open herbaceous vegetation | 4 km/h |
| Sparse vegetation | 4 km/h |
| Closed to open broadleaved forest (regularly flooded) | 4 km/h |
| Closed to open grassland or woody vegetation | 2 km/h |
| Artificial surfaces and associated areas | 3 km/h |
| Bare areas | 5 km/h |
| Water bodies | 5 km/h |
| Permanent snow and ice | 0 km/h |

Table A7.
Travel speed by road type.
Table A7.
Travel speed by road type.
| Road Class | Speed |
|---|---|
| Trunk | 80 km/h |
| Primary | 60 km/h |
| Secondary | 50 km/h |
| Tertiary | 30 km/h |
| Road | 30 km/h |
| Unclassified | 30 km/h |
| Residential | 30 km/h |
| Track | 30 km/h |

Table A8.
Travel speed by waterway type.
Table A8.
Travel speed by waterway type.
| Waterway Class | Speed |
|---|---|
| River | 0.5 km/h |
| Stream | 0.5 km/h |
References
- United Nations Economic Commission for Africa (UNECA). Energy Access and Security in Eastern Africa: Status and Enhancement Pathways; United Nations Economic Commission for Africa (UNECA): Addis Ababa, Ethiopia, 2014; ISBN 978-99944-61-18-9. [Google Scholar]
- Bonjour, S.; Adair-Rohani, H.; Wolf, J.; Bruce, N.G.; Mehta, S.; Prüss-Ustün, A.; Lahiff, M.; Rehfuess, E.A.; Mishra, V.; Smith, K.R. Solid fuel use for household cooking: Country and regional estimates for 1980–2010. Environ. Health Perspect. 2013, 121, 784–790. [Google Scholar] [CrossRef] [PubMed]
- International Energy Agency (IEA). Africa Energy Outlook: A Focus on Energy Prospects in Sub-Saharan Africa; International Energy Agency (IEA): Paris, France, 2014. [Google Scholar]
- Karekezi, S.; Kimani, J.; Onguru, O. Energy access among the urban poor in Kenya. Energy Sustain. Dev. 2008, 12, 38–48. [Google Scholar] [CrossRef]
- Felix, M.; Gheewala, S.H. A review of biomass energy dependency in Tanzania. Energy Procedia 2011, 9, 338–343. [Google Scholar] [CrossRef]
- Kiplagat, J.K.; Wang, R.Z.; Li, T.X. Renewable energy in Kenya: Resource potential and status of exploitation. Renew. Sustain. Energy Rev. 2011, 15, 2960–2973. [Google Scholar] [CrossRef]
- Global Energy Assessment—Toward a Sustainable Future: Key Findings, Summary for Policymakers, Technical Summary; Johansson, T.B., Nakićenović, N., Eds.; Cambridge University Press: Cambridge, UK; New York, NY, USA, 2012; ISBN 978-94-007-2180-7. [Google Scholar]
- Vollmer, F.; Zorrilla-Miras, P.; Baumert, S.; Luz, A.C.; Woollen, E.; Grundy, I.; Artur, L.; Ribeiro, N.; Mahamane, M.; Patenaude, G. Charcoal income as a means to a valuable end: Scope and limitations of income from rural charcoal production to alleviate acute multidimensional poverty in Mabalane district, southern Mozambique. World Dev. Perspect. 2017, 7–8, 43–60. [Google Scholar] [CrossRef]
- Okoko, A.; Reinhard, J.; von Dach, S.W.; Zah, R.; Kiteme, B.; Owuor, S.; Ehrensperger, A. The carbon footprints of alternative value chains for biomass energy for cooking in Kenya and Tanzania. Sustain. Energy Technol. Assess. 2017, 22, 124–133. [Google Scholar] [CrossRef]
- Mwampamba, T.H. Has the woodfuel crisis returned? Urban charcoal consumption in Tanzania and its implications to present and future forest availability. Energy Policy 2007, 35, 4221–4234. [Google Scholar] [CrossRef]
- Ahrends, A.; Burgess, N.D.; Milledge, S.A.H.; Bulling, M.T.; Fisher, B.; Smart, J.C.R.; Clarke, G.P.; Mhoro, B.E.; Lewis, S.L. Predictable waves of sequential forest degradation and biodiversity loss spreading from an African city. Proc. Natl. Acad. Sci. USA 2010, 107, 14556–14561. [Google Scholar] [CrossRef] [PubMed]
- Ghilardi, A.; Guerrero, G.; Masera, O. A GIS-based methodology for highlighting fuelwood supply/demand imbalances at the local level: A case study for Central Mexico. Biomass Bioenergy 2009, 33, 957–972. [Google Scholar] [CrossRef]
- World Health Organization (WHO). Burning Opportunity: Clean Household Energy for Health, Sustainable Development, and Wellbeing of Women and Children; WHO: Geneva, Switzerland, 2016. [Google Scholar]
- World Health Organization (WHO). Global Health Observatory: Household Air Pollution Burden of Disease by Countries, 2012; WHO: Geneva, Switzerland, 2012. [Google Scholar]
- International Energy Agency (IEA). World Energy Outlook 2010; World Energy Outlook; International Energy Agency: Paris, France, 2010; ISBN 978-92-64-08624-1. [Google Scholar]
- Mandelli, S.; Barbieri, J.; Mattarolo, L.; Colombo, E. Sustainable energy in Africa: A comprehensive data and policies review. Renew. Sustain. Energy Rev. 2014, 37, 656–686. [Google Scholar] [CrossRef]
- Kerre, M.; PERC-PACE International LTD. Decentralisation and Local Democracy: East Africa Region; PERC-PACE International LTD: Nairobi, Kenya, 2012. [Google Scholar]
- Devas, N.; Delay, S. Local democracy and the challenges of decentralising the state: An international perspective. Local Gov. Stud. 2006, 32, 677–695. [Google Scholar] [CrossRef]
- Larson, A.; Ribot, J. Democratic decentralisation through a natural resource lens: An introduction. Eur. J. Dev. Res. 2004, 16, 1–25. [Google Scholar] [CrossRef]
- Pasimeni, M.R.; Petrosillo, I.; Aretano, R.; Semeraro, T.; De Marco, A.; Zaccarelli, N.; Zurlini, G. Scales, strategies and actions for effective energy planning: A review. Energy Policy 2014, 65, 165–174. [Google Scholar] [CrossRef]
- Ochola, W.O.; Sanginga, P.; Bekalo, I. African Books Collective: Managing Natural Resources for Development in Africa; University of Nairobi Press: Nairobi, Kenya, 2011; ISBN 978-9966-792-09-9. [Google Scholar]
- Bugembe, B.N. Natural Resource Governance Framework Challenges and Opportunities in Eastern and Southern Afriva: A Regional Scoping Synthesis of the Critical Natural Resource Governance Issues; International Union for Conservation of Nature and Natural Resources (IUCN): Gland, Switzerland, 2016. [Google Scholar]
- Fotheringham, A.S.; Rogerson, P.A. GIS and spatial analytical problems. Int. J. Geogr. Inf. Syst. 1993, 7, 3–19. [Google Scholar] [CrossRef]
- Griffith, D.A. The boundary value problem in spatial statistical analysis. J. Reg. Sci. 1983, 23, 377–387. [Google Scholar] [CrossRef] [PubMed]
- Wolman, A. The metabolism of cities. Sci. Am. 1965, 213, 179–190. [Google Scholar] [CrossRef] [PubMed]
- Howard, D.C.; Burgess, P.J.; Butler, S.J.; Carver, S.J.; Cockerill, T.; Coleby, A.M.; Gan, G.; Goodier, C.J.; Van der Horst, D.; Hubacek, K.; et al. Energyscapes: Linking the energy system and ecosystem services in real landscapes. Biomass Bioenergy 2013, 55, 17–26. [Google Scholar] [CrossRef]
- Van der Linde, H.; Oglethorpe, J.; Sandwith, T.; Snelson, D.; Tessema, Y. Beyond Boundaries: Transboundary Natural Resource Management in Sub-Saharan Africa; Biodiversity Support Program: Washington, DC, USA, 2001. [Google Scholar]
- Benson, D.; Gain, A.; Rouillard, J. Water governance in a comparative perspective: From IWRM to a “nexus” approach? Water Altern. 2015, 8, 756–773. [Google Scholar]
- Giordano, M.; Shah, T. From IWRM back to integrated water resources management. Int. J. Water Resour. Dev. 2014, 30, 364–376. [Google Scholar] [CrossRef]
- Drigo, R.; Salbitano, F. WISDOM for Cities: Analysis of Wood Energy and Urbanization Using WISDOM Methodology; Food and Agriculture Organization of the United Nations (FAO): Rome, Italy, 2008. [Google Scholar]
- International Business Publications (IBP). Norway: Oil, Gas and Mining Industry Business Opportunities Handbook Volume 1; International Business Publications (IBP): Washington, DC, USA, 2015; ISBN 978-0-7397-3271-7. [Google Scholar]
- Gicquel, R.; Gicquel, M. Introduction to Global Energy Issues; CRC Press: Boca Raton, FL, USA, 2013; ISBN 978-1-138-00014-8. [Google Scholar]
- Kenya Ministry of Energy and Petroleum (MoEP). Kenya Action Agenda: Pathways for Concerted Action towards Sustainable Energy for All by 2030; Kenya Ministry of Energy and Petroleum (MoEP): Nairobi, Kenya, 2015.
- Wanjiru, H.; Omedo, G. How Kenya Can Transform the Charcoal Sector and Create New Opportunities for low-Carbon Rural Development; Stockholm Environment Institute (SEI) and United Nations Development Programme (UNDP): Nairobi, Kenya, 2016. [Google Scholar]
- Kenya National Bureau of Statistics (KNBS). The 2009 Kenya Population and Housing Census: Population Distribution by Administrative Units; Kenya National Bureau of Statistics (KNBS): Nairobi, Kenya, 2010.
- County Ministry of Environment and Natural Resources. Kitui County Environment Action Plan 2013–2018 (Draft); County Government of Kitui: Kitui, Kenya, 2012.
- County Government of Kitui. County Government of Kitui County Integrated Development Plan 2013–2017; County Government of Kitui: Kitui, Kenya, 2014.
- Kitui County Government the Kitui County. Charcoal Management Act 2014; Kitui County Gazette Supplement No. 17 (Acts No. 6); Government of Keny: Nairobi, Kenya, 2014.
- Sassen, M.; Sheil, D.; Giller, K.E. Fuelwood collection and its impacts on a protected tropical mountain forest in Uganda. For. Ecol. Manag. 2015, 354, 56–67. [Google Scholar] [CrossRef]
- Brouwer, I.D.; Hoorweg, J.C.; van Liere, M.J. When households run out of fuel: Responses of rural households to decreasing fuelwood availability, Ntcheu District, Malawi. World Dev. 1997, 25, 255–266. [Google Scholar] [CrossRef]
- Adkins, E.; Oppelstrup, K.; Modi, V. Rural household energy consumption in the millennium villages in Sub-Saharan Africa. Energy Sustain. Dev. 2012, 16, 249–259. [Google Scholar] [CrossRef]
- Malimbwi, R.E.; Zahabu, E. The analysis of sustainable chacoal production systems in Tanzania. In Criteria and Indicators for Sustainable Woodfuels: Case Studies from Brazil, Guyana, Nepal, Philippines and Tanzania; FAO, Ed.; Food and Agriculture Organization of the United Nations: Rome, Italy, 2009. [Google Scholar]
- Shackleton, C.M. Annual production of harvestable deadwood in semi-arid savannas, South Africa. For. Ecol. Manag. 1998, 112, 139–144. [Google Scholar] [CrossRef]
- Mwampamba, T.H.; Ghilardi, A.; Sander, K.; Chaix, K.J. Dispelling common misconceptions to improve attitudes and policy outlook on charcoal in developing countries. Energy Sustain. Dev. 2013, 17, 75–85. [Google Scholar] [CrossRef]
- Ngusale, G.K.; Luo, Y.; Kiplagat, J.K. Briquette making in Kenya: Nairobi and peri-urban areas. Renew. Sustain. Energy Rev. 2014, 40, 749–759. [Google Scholar] [CrossRef]
- Scholz, S.B.; Sembres, T.; Roberts, K.; Whitman, T.; Wilson, K.; Lehmann, J. Biochar Systems for Smallholders in Developing Countries: Leveraging Current Knowledge and Exploring Future Potential for Climate-Smart Agriculture; The World Bank: Washington, DC, USA, 2014; ISBN 978-0-8213-9525-7. [Google Scholar]
- Nkoua, M.; Gazull, L. Les enjeux de la filiere “plantation industrielles d’eucalyptus” dans la gestion durable du bassin d’approvisionnement en bois-energie de la ville de Pointe-Noire (Republique du Congo). In 48ème Colloque de l’ASRDLF: Migrations et Territoires; Association de Sciene Régionale de Langue Française: Schoelcher, Martinique, 2011; pp. 175–194. [Google Scholar]
- Van Beukering, P.; Kahyarara, G.; Massey, E.; di Prima, S.; Hess, S.; Makundi, V.; Van der Leeuw, K. Optimization of the Charcoal Chain in Tanzania; Poverty Reduction and Environmental Management (PREM); Institute for Environmental Studies Vrije Universiteit: Amsterdam, The Netherlands, 2007. [Google Scholar]
- Kinyanjui, M. Fuelling Nairobi: The importance of small-scale charcoaling enterprises. Unasylva 1987, 39, 17–19. [Google Scholar]
- United States Agency for International Development. Recommendations Concerning Inventoriy of Timber, Fuelwood, and Nontimber Products and Charcoal Species Regeneration for Areas of Wula Nafaa Intervention in Eastern and Southern Senegal; United States Agency for International Development (USAID): Washington, DC, USA, 2007.
- Schaafsma, M.; Morse-Jones, S.; Posen, P.; Swetnam, R.D.; Balmford, A.; Bateman, I.J.; Burgess, N.D.; Chamshama, S.A.O.; Fisher, B.; Freeman, T.; et al. The importance of local forest benefits: Economic valuation of non-timber forest products in the Eastern Arc Mountains in Tanzania. Glob. Environ. Chang. 2014, 24, 295–305. [Google Scholar] [CrossRef]
- Sander, K.; Haider, S.W.; Hyseni, B. Wood-Based Biomass Energy Development for Sub-Saharan Africa: Issues and Approaches; The World Bank: Washington, DC, USA, 2011. [Google Scholar]
- Rupf, G.V.; Bahri, P.A.; de Boer, K.; McHenry, M.P. Barriers and opportunities of biogas dissemination in Sub-Saharan Africa and lessons learned from Rwanda, Tanzania, China, India, and Nepal. Renew. Sustain. Energy Rev. 2015, 52, 468–476. [Google Scholar] [CrossRef]
- Roopnarain, A.; Adeleke, R. Current status, hurdles and future prospects of biogas digestion technology in Africa. Renew. Sustain. Energy Rev. 2017, 67, 1162–1179. [Google Scholar] [CrossRef]
- Lwiza, F.; Mugisha, J.; Walekhwa, P.N.; Smith, J.; Balana, B. Dis-adoption of household biogas technologies in Central Uganda. Energy Sustain. Dev. 2017, 37, 124–132. [Google Scholar] [CrossRef]
- Surendra, K.C.; Takara, D.; Hashimoto, A.G.; Khanal, S.K. Biogas as a sustainable energy source for developing countries: Opportunities and challenges. Renew. Sustain. Energy Rev. 2014, 31, 846–859. [Google Scholar] [CrossRef]
- Jet City StoveWorks. How Much Jatropha Seed Does the Jiko Safi Use? Available online: www.jetcitystoveworks.com (accessed on 11 June 2017).
- Van der Horst, D.; Vermeylen, S.; Kuntashula, E. The hedgification of maizescapes? Scalability and multifunctionality of Jatropha curcas hedges in a mixed farming landscape in Zambia. Ecol. Soc. 2014, 19. [Google Scholar] [CrossRef]
- Ehrensperger, A.; Randriamalala, J.R.; Raoliarivelo, L.I.B.; Husi, J.M. Jatropha mahafalensis for rural energy supply in south-western Madagascar? Energy Sustain. Dev. 2015, 28, 60–67. [Google Scholar] [CrossRef]
- Achten, W.M.J.; Verchot, L.; Franken, Y.J.; Mathijs, E.; Singh, V.P.; Aerts, R.; Muys, B. Jatropha bio-diesel production and use. Biomass Bioenergy 2008, 32, 1063–1084. [Google Scholar] [CrossRef]
- Van Eijck, J.; Romijn, H. Prospects for Jatropha biofuels in Tanzania: An analysis with strategic niche management. Energy Policy 2008, 36, 311–325. [Google Scholar] [CrossRef]
- Endelevu Energy; World Agroforestry Centre; Kenya Forestry Research Institute. Jatropha Reality Check: A Field Assessment of the Agronomic and Economic Viability of Jatropha and Other Oilseed Crops in Kenya; Deutsche Gesellschaft für Technische Zusammenarbeit (GTZ): Nairobi, Kenya, 2009. [Google Scholar]
- Iiyama, M.; Newman, D.; Munster, C.; Nyabenge, M.; Sileshi, G.W.; Moraa, V.; Onchieku, J.; Mowo, J.G.; Jamnadass, R. Productivity of Jatropha curcas under smallholder farm conditions in Kenya. Agrofor. Syst. 2012, 87, 729–746. [Google Scholar] [CrossRef]
- Mogaka, V.; Ehrensperger, A.; Iiyama, M.; Birtel, M.; Heim, E.; Gmuender, S. Understanding the underlying mechanisms of recent Jatropha curcas L. adoption by smallholders in Kenya: A rural livelihood assessment in Bondo, Kibwezi, and Kwale districts. Energy Sustain. Dev. 2014, 18, 9–15. [Google Scholar] [CrossRef]
- Ehrensperger, A.; Gmuender, S.; Jongschaap, R.; Keane, J.; Pirot, R.; Sonnleitner, A. Bioenergy in Africa (BIA): Final Operational Report; Centre for Development and Environment (CDE): Bern, Switzerland, 2013. [Google Scholar]
- Mitchual, S.J.; Frimpong-Mensah, K.; Darkwa, N.A.; Akowuah, J.O. Briquettes from maize cobs and Ceiba pentandra at room temperature and low compacting pressure without a binder. Int. J. Energy Environ. Eng. 2013, 4, 38. [Google Scholar] [CrossRef]
- Tripathi, A.K.; Iyer, P.V.R.; Kandpal, T.C.; Singh, K.K. Assessment of availability and costs of some agricultural residues used as feedstocks for biomass gasification and briquetting in India. Energy Convers. Manag. 1998, 39, 1611–1618. [Google Scholar] [CrossRef]
- Mahiri, I.O. Rural household responses to fuelwood scarcity in Nyando District, Kenya. Land Degrad. Dev. 2003, 14, 163–171. [Google Scholar] [CrossRef]
- Berazneva, J. Economic Value of Crop Residues in African Smallholder Agriculture; Agricultural and Applied Economics Association: Washington, DC, USA, 2013. [Google Scholar]
- Lathrop, E.C.; Elbert, C. Corncobs: Their Composition, Availability, Farm and Industrial Uses; U.S. Dept. of Agriculture, Agricultural Research Administration, Bureau of Agricultural and Industrial Chemistry, Northern Regional Research Laboratory: Peoria, IL, USA, 1947. Available online: http://archive.org/details/corncobstheircom177lath (accessed on 3 August 2017).
- Grimsby, L.K.; Rajabu, H.M.; Treiber, M.U. Multiple biomass fuels and improved cook stoves from Tanzania assessed with the Water Boiling Test. Sustain. Energy Technol. Assess. 2016, 14, 63–73. [Google Scholar] [CrossRef]
- Bär, R.; Heinimann, A.; Ehrensperger, A. Assessing the potential supply of biomass cooking fuels in Kilimanjaro region using land use units and spatial Bayesian networks. Energy Sustain. Dev. 2017, 40, 112–125. [Google Scholar] [CrossRef]
- Zarin, D.J.; Harris, N.L.; Baccini, A.; Aksenov, D.; Hansen, M.C.; Azevedo-Ramos, C.; Azevedo, T.; Margono, B.A.; Alencar, A.C.; Gabris, C.; et al. Can carbon emissions from tropical deforestation drop by 50% in 5 years? Glob. Chang. Biol. 2016, 22, 1336–1347. [Google Scholar] [CrossRef] [PubMed]
- Kenya National Bureau of Statistics. Kenya Integrated Household Budget Survey 2005; Kenya National Bureau of Statistics (KNBS): Nairobi, Kenya, 2007.
- Drigo, R.; Bailis, R.; Masera, O.; Ghilardi, A. Pan-Tropical Analysis of Woodfuel Supply, Demand and Sustainability; Yale University and Universidad Nacional Autónoma de México: New Haven, CT, USA; Mexico City, Mexico, 2014; Available online: https://www.google.com.hk/url?sa=t&rct=j&q=&esrc=s&source=web&cd=1&ved=0ahUKEwjU4IamoaLZAhUeSI8KHbvDAi8QFgglMAA&url=http%3A%2F%2Fwww.wisdomprojects.net%2Fpdf%2F%3Ffile%3DTier_I_Final_report_rev_May2015.pdf&usg=AOvVaw0qVaSvdSwKygNi3QPNiR_Z (accessed on 12 December 2016).
- Drigo, R.; Bailis, R.; Ghilardi, A.; Masera, O. WISDOM Kenya—Analysis of Woodfuel Supply, Demand and Sustainability in Kenya; Geospatial Analysis and Modeling of Non-Renewable Biomass: WISDOM and Beyond; Yale University and Universidad Nacional Autónoma de México: New Haven, CT, USA; Mexico City, Mexico, 2015; Available online: https://cleancookstoves.org/binary-data/RESOURCE/file/000/000/424-1.pdf (accessed on 12 December 2016).
- Orskov, B.; Yongabi, K.; Subedi, M.; Smith, J. Overview of holistic application of biogas for small scale farmers in Sub-Saharan Africa. Biomass Bioenergy 2014. [Google Scholar] [CrossRef]
- Nalunkuuma, J.; Affognon, H.; Kingori, S.W.; Salifu, D.; Njonge, F.K. Adoption of zero grazing and impact on livestock keepers’ knowledge of cattle reproductive parameters in Western Kenya. Livest. Res. Rural Dev. 2015, 27. Available online: http://www.lrrd.org/lrrd27/9/nalu27176.html (accessed on 1 May 2017).
- Ng’wandu, E.; Shila, L.C.; ter Heegde, F.E.W. Tanzania Domestic Biogas Programme: Programme Implementation Document; Agricultural Mechanization and Rural Technologies (CARMATEC) and Netherlands Development Organisation (SNV): Arusha, Tanzania; The Hague, The Netherlands, 2009. [Google Scholar]
- Pickering, A.J.; Davis, J. Freshwater Availability and Water Fetching Distance Affect Child Health in Sub-Saharan Africa. Environ. Sci. Technol. 2012, 46, 2391–2397. [Google Scholar] [CrossRef] [PubMed]
- Kossmann, W.; Pönitz, U.; Habermehl, S.; Hoerz, T.; Krämer, P.; Klingler, B.; Kellner, C.; Wittur, T.; Klopotek, F.V.; Euler, H. Biogas Digest Vol II: Biogas—Application and Product Development; Gesellschaft für Technische Zusammenarbeit (GTZ) and Information and Advisory Service on Appropriate Technology (ISAT): Eschborn, Germany; Wageningen, The Netherlands, 1999. [Google Scholar]
- Food and Agriculture Organization of the United Nations. Multipurpose Landcover Database for Kenya—AFRICOVER; Food and Agriculture Organization of the United Nations (FAO): Rome, Italy, 2002; Available online: http://www.fao.org/geonetwork/srv/en/main.home?uuid=7b07bb4c-bf31-4487-8615-3a6a32643b1f (accessed on 11 June 2017).
- Ehrensperger, A.; Wörgetter, M.; Moraa, V.; Sonnleitner, A. Can jatropha improve the energy supply of rural households in Africa? Jatropha Facts Ser. 2013. [Google Scholar] [CrossRef]
- Pordesimo, L.O.; Edens, W.C.; Sokhansanj, S. Distribution of aboveground biomass in corn stover. Biomass Bioenergy 2004, 26, 337–343. [Google Scholar] [CrossRef]
- Reinhard, J.; Zah, R.; Okoko, A.; Kiteme, B.; Bär, R.; Ehrensperger, A.; Willi, S.; Wymann von Dach, S. More Out of Less: Future Scenarios of Clean Cooking Solutions in East Africa; ProBE Policy Briefs; Quantis, Centre for Training and Integrated Research in ASAL Development (CETRAD), and Centre for Development and Environment (CDE): Nanyuki, Kenya; Bern, Switzerland, 2017. [Google Scholar]
- Kenya National Bureau of Statistics. Kenya Population and Housing Census 2009; Kenya National Bureau of Statistics: Nairobi, Kenya (KNBS), 2010. Available online: http://statistics.knbs.or.ke/nada/index.php/catalog/55 (accessed on 1 September 2017).
- Stewart, J.Q. A Measure of the Influence of a Population at a Distance. Sociometry 1942, 5, 63–71. [Google Scholar] [CrossRef]
- Sen, A.; Smith, T.E. Gravity Models of Spatial Interaction Behavior; Springer Verlag: Berlin/Heidelberg, Germany, 2012; ISBN 978-3-642-79880-1. [Google Scholar]
- Giraud, T.; Commenges, H. SpatialPosition: Spatial Position Models; 2016. Available online: https://CRAN.R-project.org/package=SpatialPosition (accessed on 14 July 2017).
- Halás, M.; Klapka, P.; Kladivo, P. Distance-decay functions for daily travel-to-work flows. J. Transp. Geogr. 2014, 35, 107–119. [Google Scholar] [CrossRef]
- Skov-Petersen, H. Estimation of Distance-Decay Parameters—GIS-Based Indicators of Recreational Accessibility; Danish Forest and Landscape Research Institute: Hørsholm, Denmark, 2001. [Google Scholar]
- Lenormand, M.; Bassolas, A.; Ramasco, J.J. Systematic comparison of trip distribution laws and models. J. Transp. Geogr. 2016, 51, 158–169. [Google Scholar] [CrossRef]
- Drobne, S.; Lakner, M. Which distance-decay function for migration and which one for commuting? A case study of Slovenia. Croat. Oper. Res. Rev. 2015, 5, 259–272. [Google Scholar] [CrossRef]
- Emeno, K.; Bennell, C. The effectiveness of calibrated versus default distance decay functions for geographic profiling: A preliminary examination of crime type. Psychol. Crime Law 2013, 19, 215–232. [Google Scholar] [CrossRef]
- Van Etten, J. R Package gdistance: Distances and Routes on Geographical Grids. J. Stat. Softw. 2017, 76, 1–21. [Google Scholar] [CrossRef]
- OpenStreetMap Contributors. Planet Dump. Available online: https://planet.osm.org (accessed on 6 June 2017).
- Jarvis, A.; Reuter, H.I.; Nelson, A.; Guevara, E. Hole-filled SRTM for the Globe Version 4.1. Available from the CGIAR-CSI SRTM 90m Database. 2008. Available online: http://srtm.csi.cgiar.org (accessed on 6 June 2017).
- Mutea, E. Socio-Economic Factors Influencing Adoption of Improved Biomass Energy Technologies in Rural and Urban Households in Kitui. Master’s Thesis, University of Nairobi, Nairobi, Kenya, 2015. [Google Scholar]
- Treiber, M.U.; Grimsby, L.K.; Aune, J.B. Reducing energy poverty through increasing choice of fuels and stoves in Kenya: Complementing the multiple fuel model. Energy Sustain. Dev. 2015, 27, 54–62. [Google Scholar] [CrossRef]
- Kammen, D.M.; Lew, D.J. Review of Technologies for the Production and Use of Charcoal; University of California and National Renewable Energy Laboratory: Berkley, CA, USA; Golden, CO, USA, 2005. [Google Scholar]
- IUCN; UNEP. The World Database on Protected Areas (WDPA). Available online: http://protectedplanet.net/ (accessed on 27 May 2014).
- Malimbwi, R.E.; Zahabu, E.M. Woodlands and the Charcoal Trade: The Case of Dar es Salaam City; Finnish Forest Research Institute: Helsinki, Finland, 2007; Available online: http://www.metla.fi/julkaisut/workingpapers/2008/mwp098-12.pdf (accessed on 16 May 2014).
© 2018 by the authors. Licensee MDPI, Basel, Switzerland. This article is an open access article distributed under the terms and conditions of the Creative Commons Attribution (CC BY) license (http://creativecommons.org/licenses/by/4.0/).