Abstract
Aquifers within the Columbia River Basalt Group (CRBG) provide a critical water supply throughout much of the Pacific Northwest of the United States. Increased pumping has resulted in water level declines in this region. Recharge into this aquifer system is generally not well understood. Recent suggestions of probable decades-long droughts in the 21st century add to this problem. We show that geophysical methods can provide useful parameters for improved modeling of aquifers in a primary CRBG aquifer located on the eastern edge of the Columbia Plateau. Groundwater models depend in part on the area, thickness, porosity, storativity, and nature of confinement of this aquifer, most of which are poorly constrained by existing well information and previous stress tests. We have made use of surface gravity measurements, borehole gravity measurements, barometric efficiency estimates, earth tidal response, and earthquake seismology observations to constrain these parameters. We show that the aquifer, despite its persistent drawdown, receives a great deal of recharge annually. Much of the recharge to the aquifer is due to leakage from overlying flows, ultimately tied to precipitation, an important result for future aquifer management in times of sustained drought.
1. Introduction
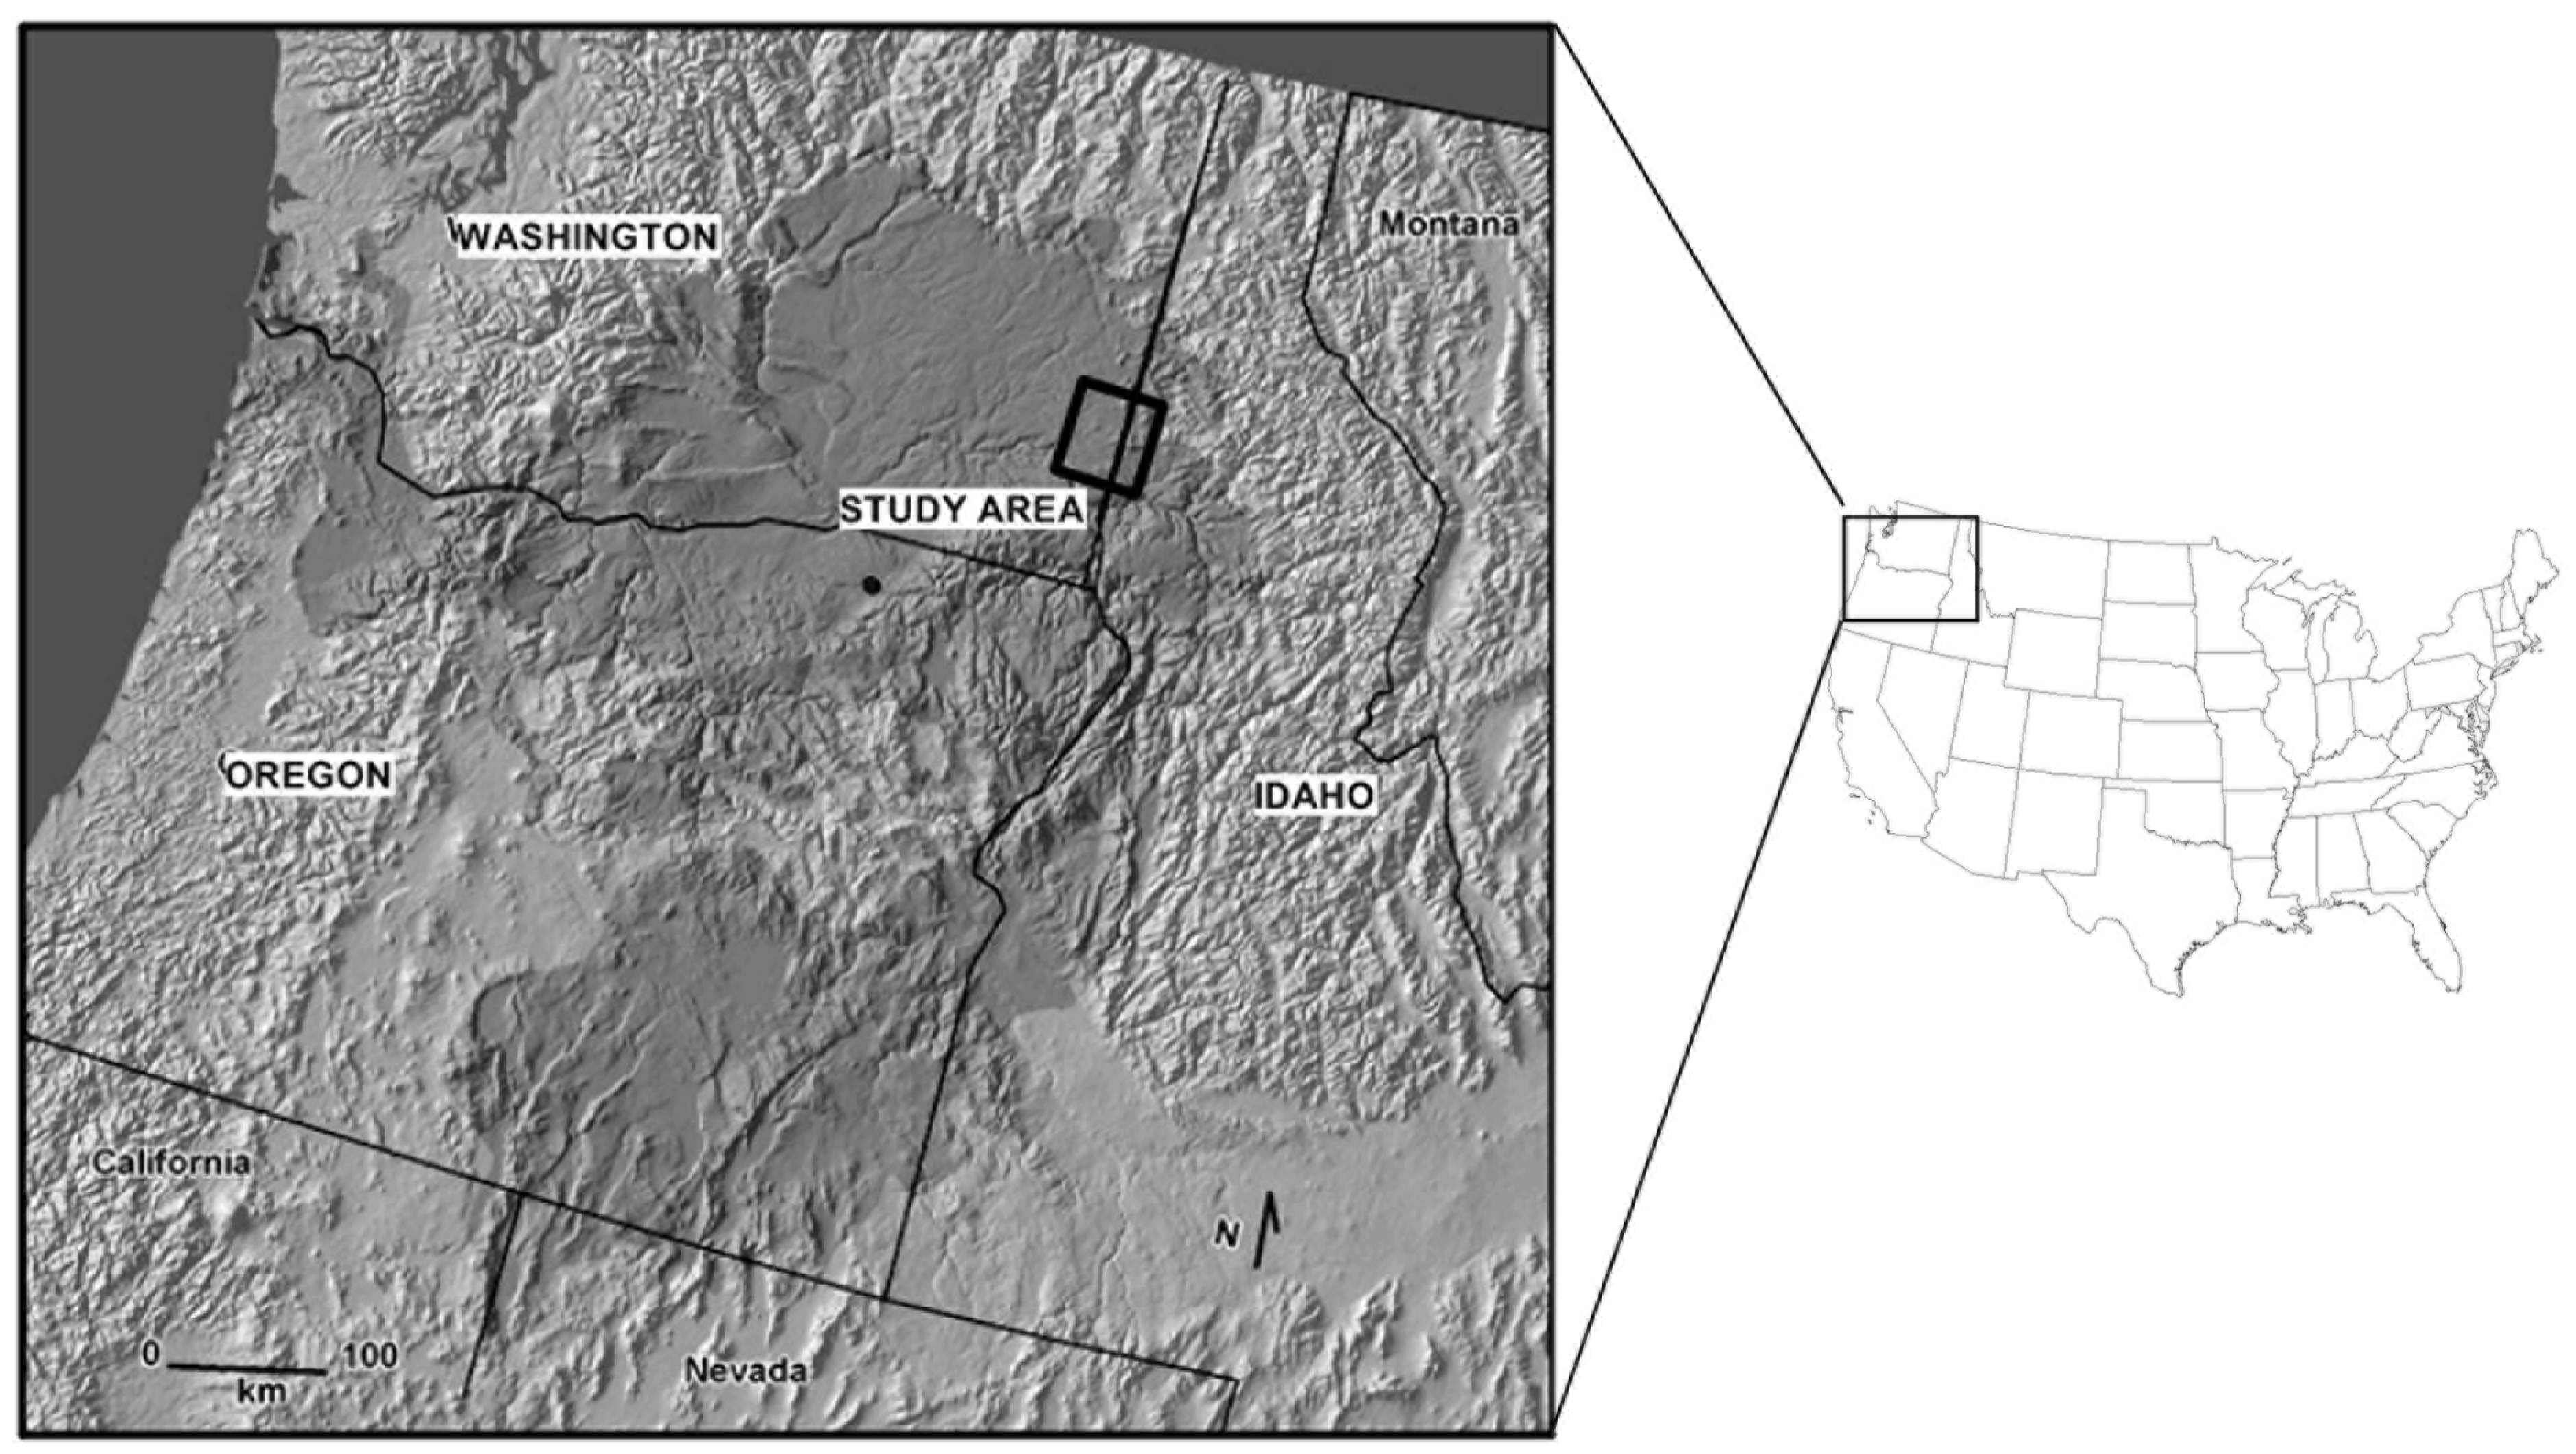
The Columbia River Basalt Group (CRBG) in the Pacific Northwest of the United States hosts a regional aquifer system that extends from the foothills of the northern Rocky Mountains in west-central Idaho into the Columbia Basin of Washington and Oregon (Figure 1). In many locations within the region, it is the only water source for communities, residences, industry, agriculture, and aquaculture [1]. The CRBG aquifer system is a significant concern to water resources managers because of long-term water level decline and a general lack of knowledge about natural recharge.
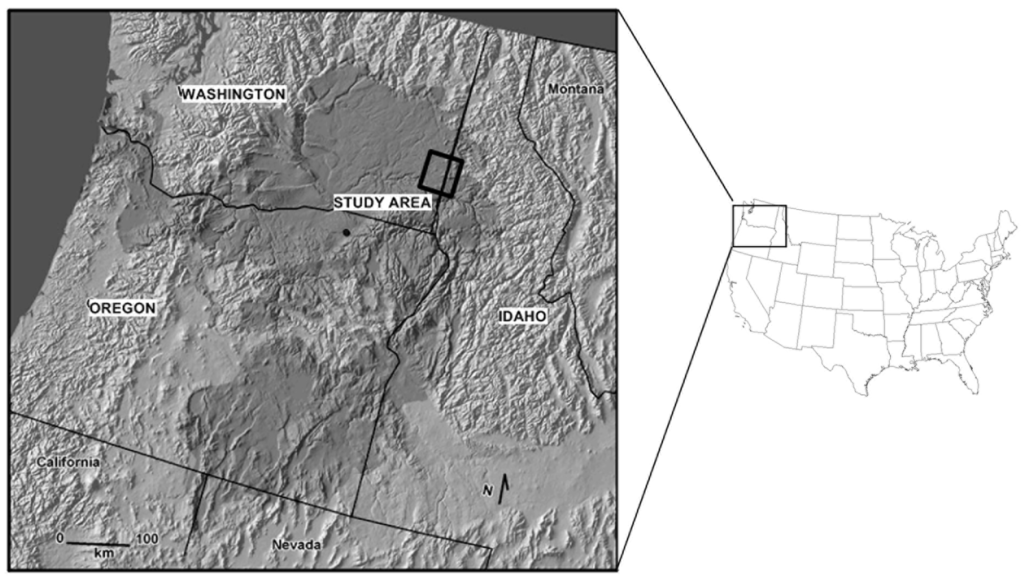
Figure 1.
The darkly shaded area is the CRBG regional aquifer system in the Pacific Northwest of the contiguous United States. The rectangle on the left map shows the location of the general study area, the Palouse basin.
Figure 1.
The darkly shaded area is the CRBG regional aquifer system in the Pacific Northwest of the contiguous United States. The rectangle on the left map shows the location of the general study area, the Palouse basin.
A recent study has suggested that in the western states, drought risk in the 21st century will likely exceed the driest centuries of the past millennia, leading to unprecedented drought conditions [2]. Much of the inland Pacific Northwest is characterized by an arid to semiarid climate. The majority of surface water in this region originates as upland precipitation. The causes of past and future drought will not be identical but the paleoclimatic record demonstrates the plausibility of extensive, severe droughts [3]. In the past half century, the up-dip areas of the Columbia Basin abutting the northern Rocky Mountains region have experienced a substantial decline in peak snow water equivalent [4]. A recent USGS study of the Columbia Basin suggests that climate change will result in a drop in water levels across the region with resultant degradation and disappearance of aquatic ecosystems [5]. Water managers in the Columbia Basin need to understand the nature of recharge into the aquifer system and the effect a sustained drought will have on aquifer system productivity.
Recharge, if any, of the deeper CRBG aquifers is generally inferred to occur (1) from groundwater movement originating around the edge of the Columbia Basin in up-dip areas where units pinch out; and (2) from vertical leakage through younger more shallow flows via open faults and tectonic fractures. Both of these sources are intimately related to precipitation and ultimately climate change. The general area of this study (the Palouse basin), lies at the eastern up-dip edge of the CRBG in good position to study the nature of CRBG recharge (Figure 1). Furthermore, excellent records of pumping volumes and historic records of annual water level declines are maintained by the Palouse Basin Aquifer Committee [6].
The key to understanding the nature of recharge in the study area is to have an adequate groundwater model that explains the dynamics of the aquifer system. However, previous groundwater models [7,8] for the study area have neither predicted the annual drop in water levels within the aquifer system nor have they provided any useful insight into the nature of recharge. We believe the lack of success of these models was at least in part the result of incorrect parameters employed, particularly with respect to the area, thickness, porosity, storativity, and nature of confinement of the aquifer system. The purpose of this study is to show that geophysical methods including surface gravity measurements, borehole gravity measurements, barometric efficiency estimates, earth tidal response, and earthquake seismology observations can be useful to better constrain these parameters for future groundwater models.
1.1. CRBG Aquifers
Numerous studies of CRBG aquifers have been conducted within the Columbia Basin to better understand their hydrogeology [9,10,11,12,13,14,15,16,17]. One of the most significant findings of these studies is the similarity of the hydrogeological characteristics, properties, and behavior of the CRBG aquifers across the region. These general characteristics include: (1) simple sheet flows of basalt 10 to >100 m thick of great lateral extent that act as aquitards; (2) intraflow structures such as vesicular flow-tops, rubble zones, and sedimentary interbeds that act as aquifers; (3) control of lateral continuity of the aquifers by erosion, flow pinchouts, folds, faults and dikes; (4) flow pathways dominantly sub-horizontal down-dip; (5) limited vertical groundwater movement. These similar characteristics allow for the application of the knowledge of the general hydraulic characteristics and behavior of the CRBG aquifers in one area to be applied to CRBG aquifers in other areas [18].
1.2. Study Area
Our general study area (Figure 2) is the Palouse basin of western Idaho and eastern Washington abutting the crystalline rocks of the northern Rockies foothills. The Palouse is an important dryland agricultural region, with a semi-arid climate and topography dominated by rolling hills composed predominantly of windblown loess. A larger amount of precipitation falls in the mountainous terrain which bounds the study area to the east, southeast, and north [19]. The Palouse River, its tributaries, and other local streams drain the area and flow towards the northwest to eventually join the Snake River. Some 800 water wells have been cataloged in the Palouse basin [20] which covers an area of 1280 km2. Most are shallow, very-low productivity domestic wells hosted in the loess soil cover or in the crystalline rocks of the surrounding highlands.
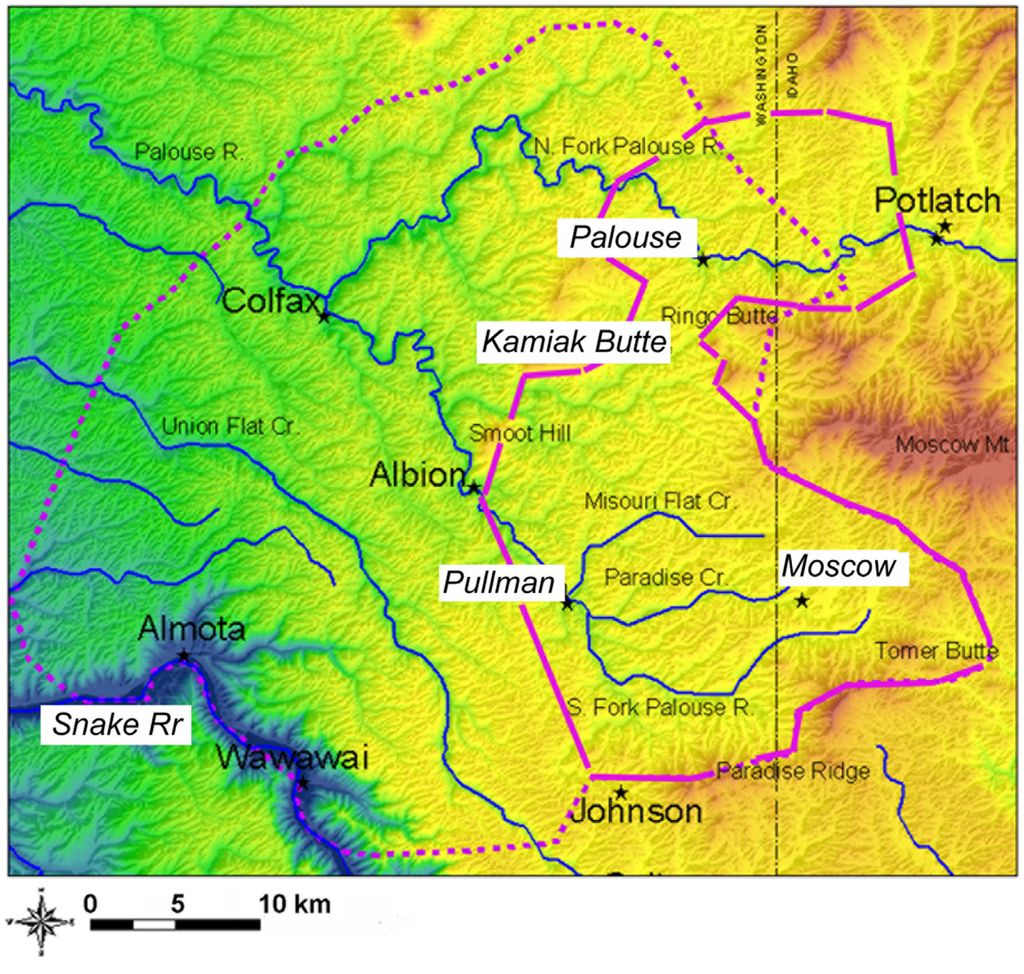
Figure 2.
The Palouse basin general study area. See Figure 1 for location. The specific study area, the Moscow-Pullman basin is indicated by the solid purple line. The dashed line is the boundary of the larger area under the political jurisdiction of the Palouse Basin Aquifer Committee.
Figure 2.
The Palouse basin general study area. See Figure 1 for location. The specific study area, the Moscow-Pullman basin is indicated by the solid purple line. The dashed line is the boundary of the larger area under the political jurisdiction of the Palouse Basin Aquifer Committee.

1.3. The Moscow-Pullman Basin
Based on the very similar piezometric elevations and historic water level declines, the primary aquifer system that serves the cities of Pullman and Moscow appears to be restricted to an area referred to as the Moscow-Pullman basin (Figure 2) which is partially hydraulically isolated from the larger Palouse basin and the main body of the CRBG regional ground-water flow system. This is a lava embayment of the CRBG Grande Ronde Formation which flowed into the area during Miocene time from the southwest following a pre-basalt stream system cut into the western slope of the northern Rockies. The Moscow-Pullman basin has an area of 420–660 km2 and encompasses the cities of Pullman, Washington and Moscow, Idaho plus multiple smaller communities and rural areas, as well as two large universities. This basin is part of the much larger Palouse basin, also shown on Figure 2.
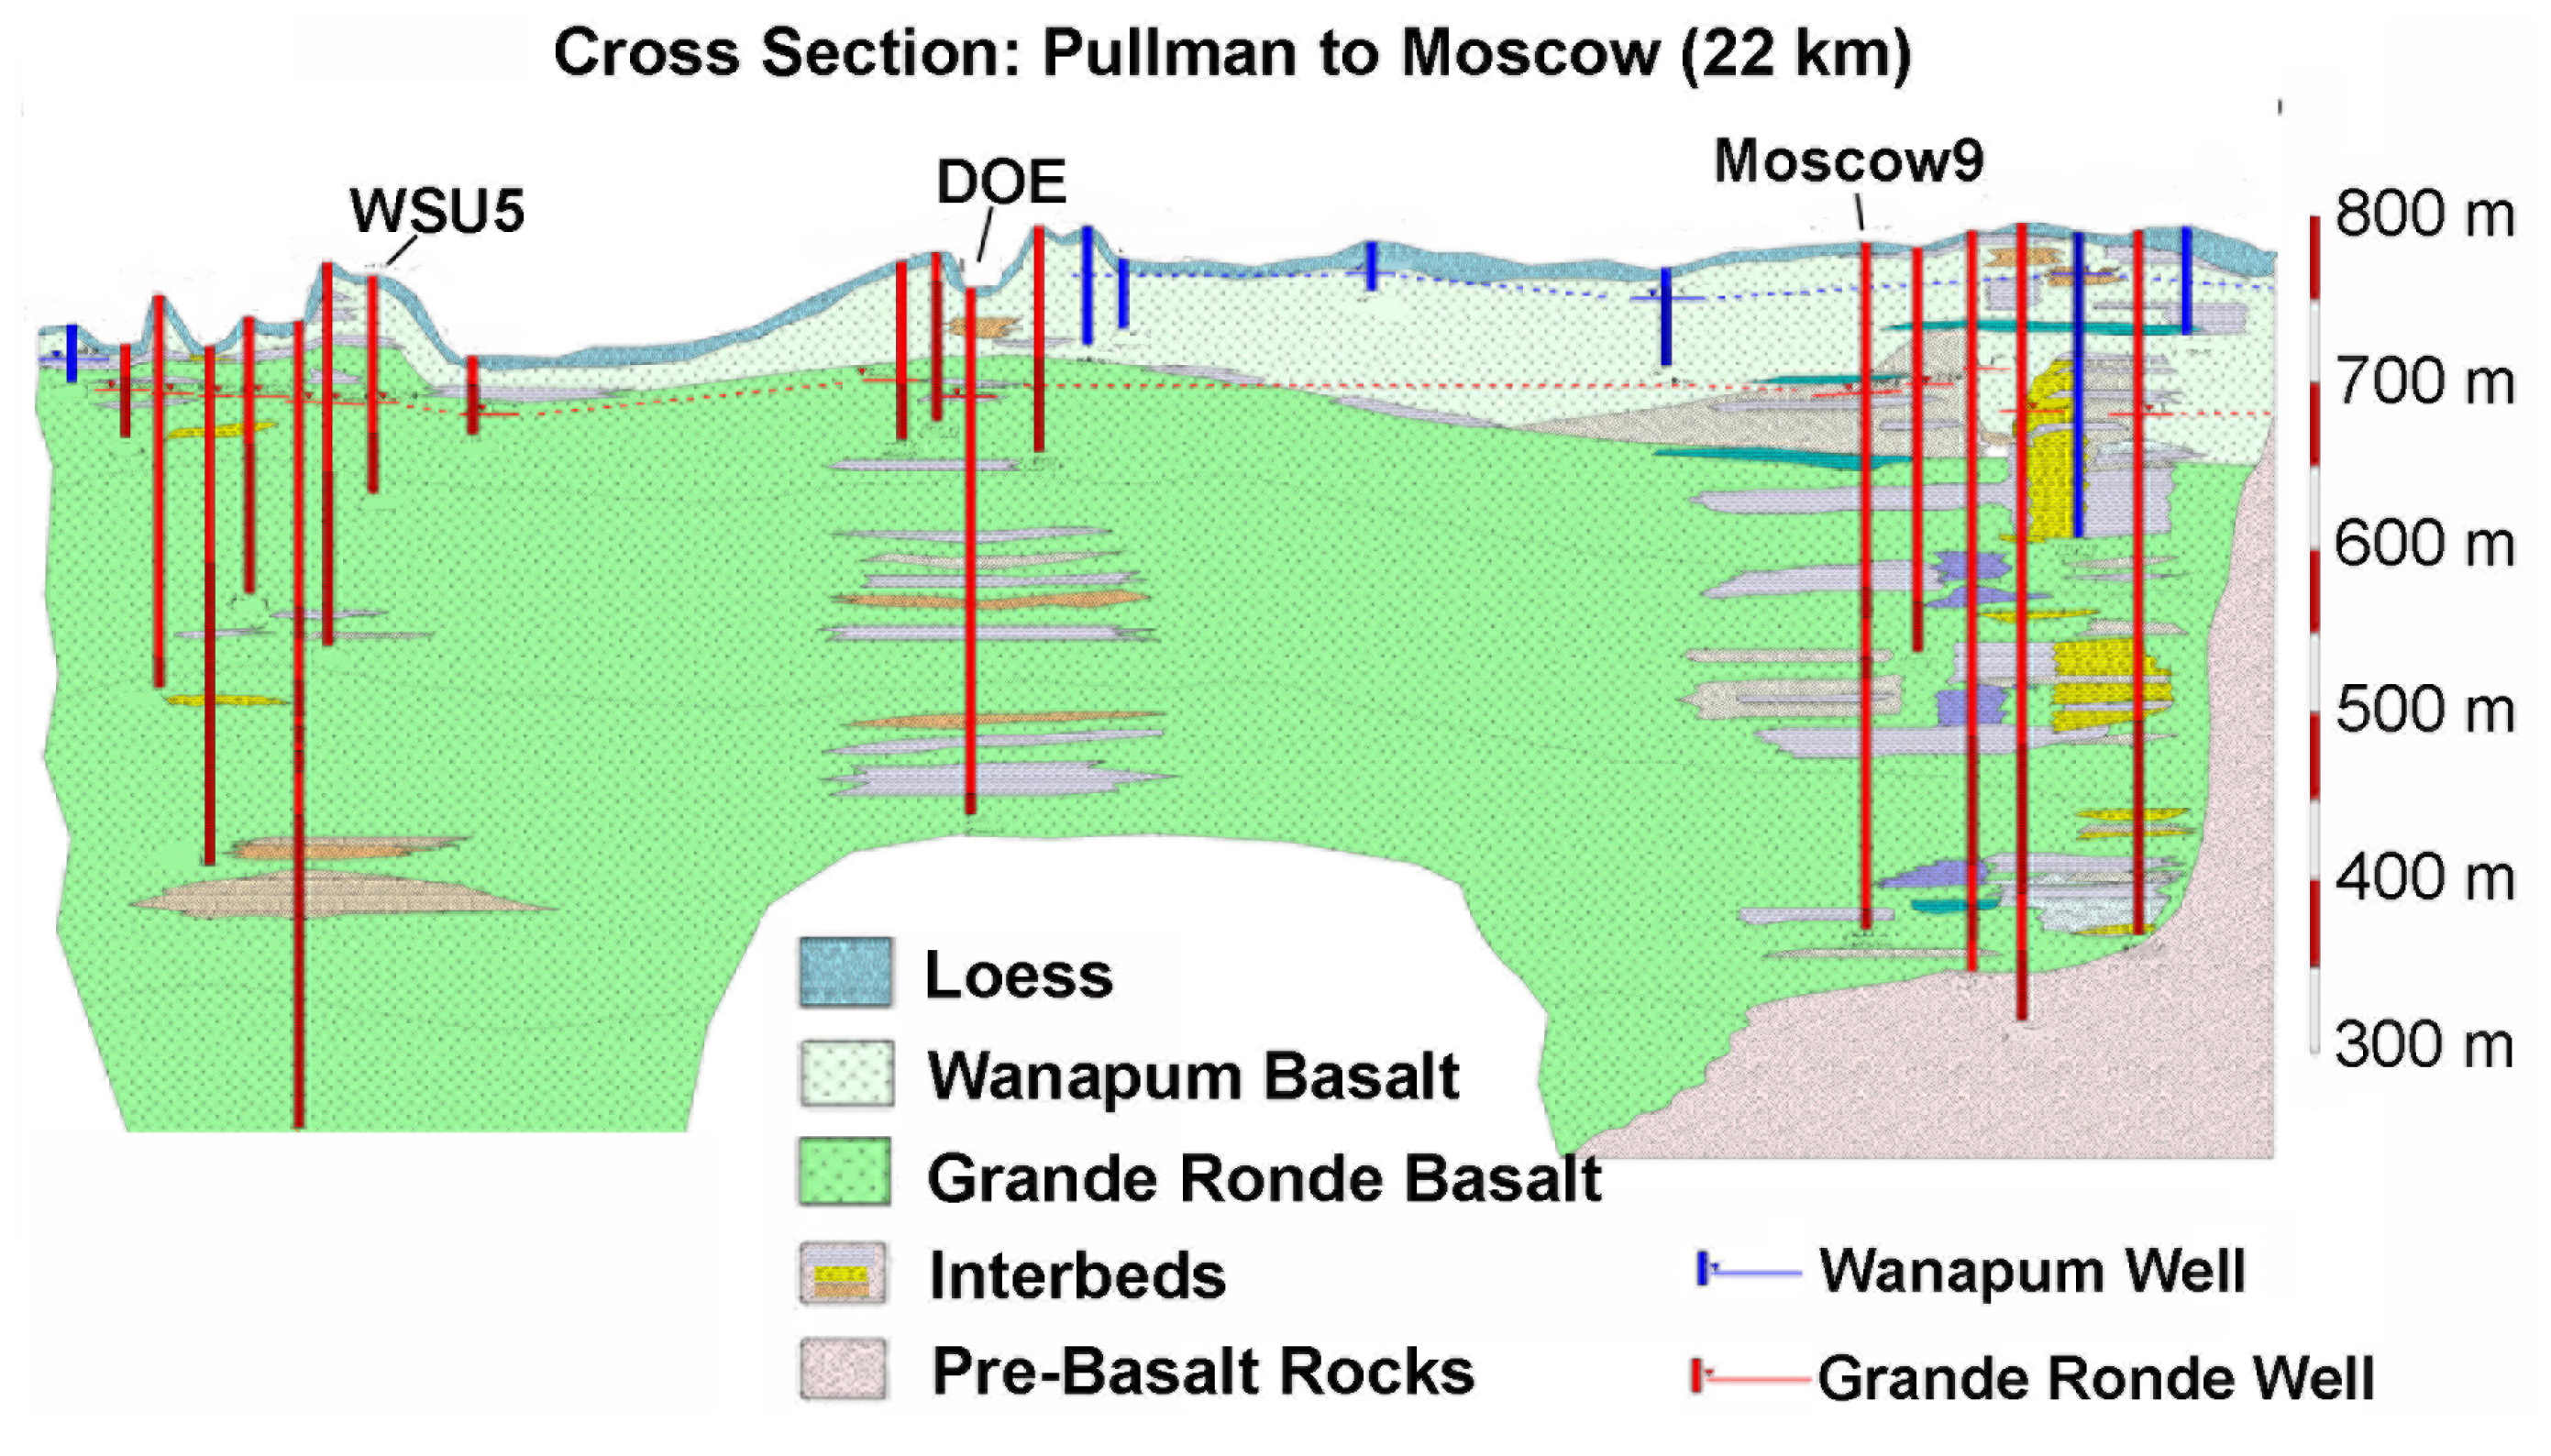
A geological section (Figure 3) through Moscow and Pullman illustrates the general stratigraphy in the Moscow-Pullman basin. Beneath a loess soil cover are the Saddle Mountain, Wanapum, Grande Ronde, and Imnaha basalt formations of the Miocene CRBG, each of which is composed of multiple flows. Interspersed between flows are sedimentary interbeds collectively called the Latah Formation. The pre-basalt rocks are Cretaceous granites and Precambrian crystalline metasediments.
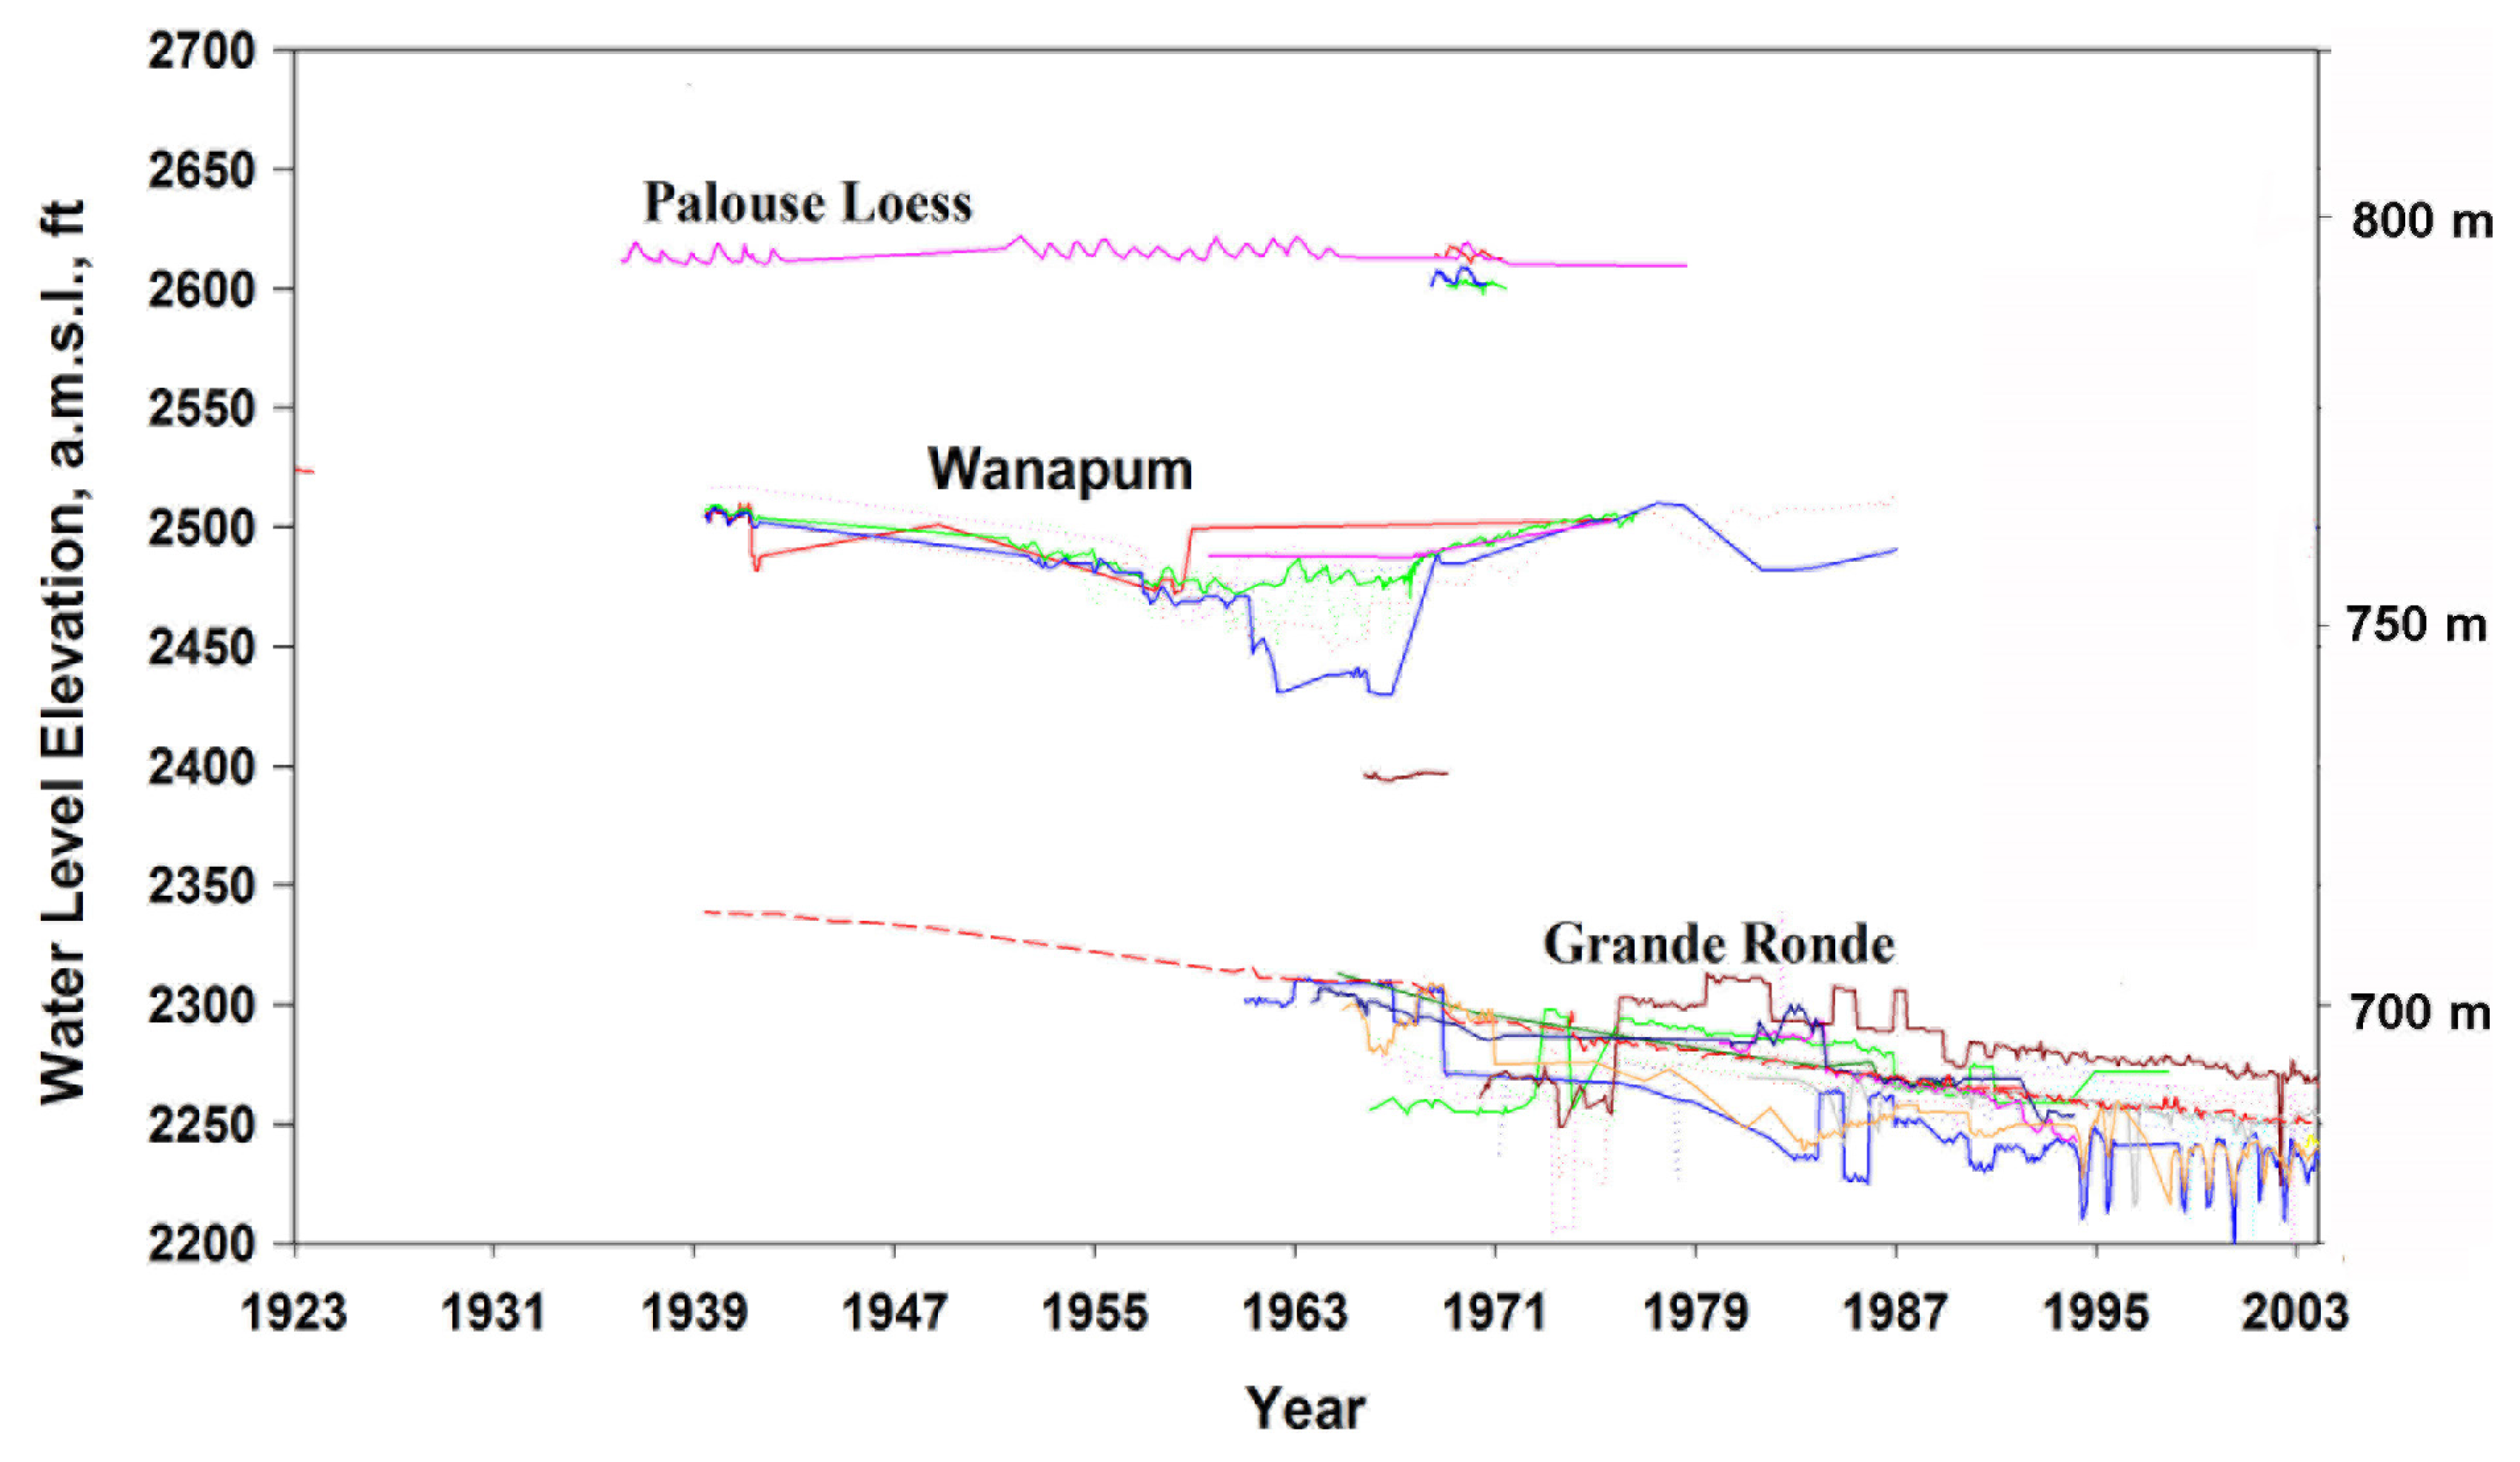
As shown in Figure 4, hydrographs are available for about 30 wells in the Moscow-Pullman basin. Fairly common are wells 30–40 m deep, hosted in the Wanapum Formation. These wells account for 10% of the water produced in the basin. The primary aquifer system (known locally as the “lower” or “Grande Ronde” aquifer system) is completely contained within the Grande Ronde Formation. The high yield municipal and university wells tap the Grande Ronde Formation typically at depths of 90–120 m. The Grande Ronde Formation accounts for 90% of the 2.45 billion gallons (62.4 × 10⁶ m3) pumped annually in the Palouse basin [6].
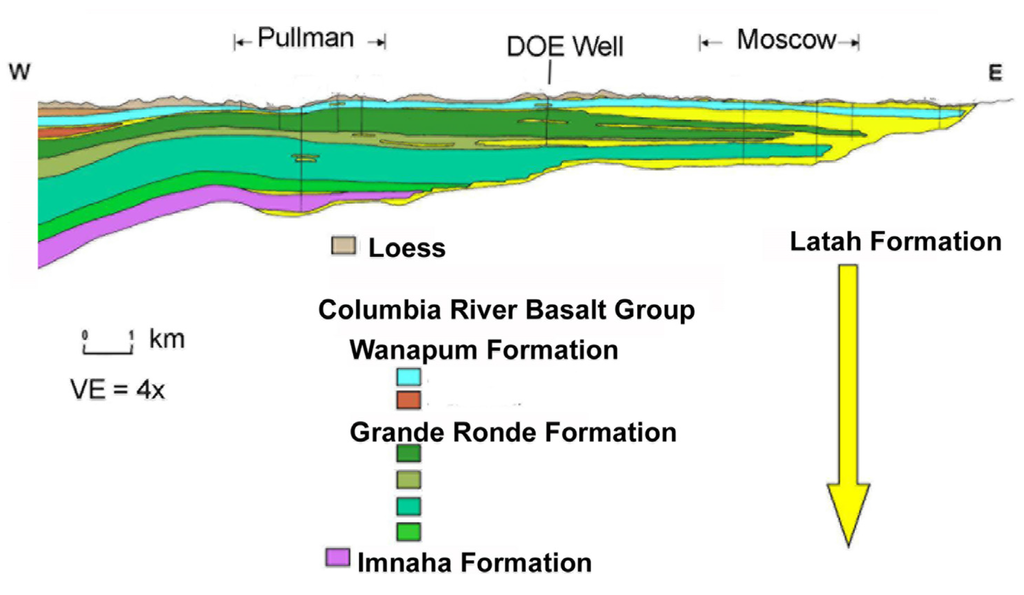
Figure 3.
Diagrammatic west to east geological cross section through Pullman to Moscow showing the basalt stratigraphy of the study area.
Figure 3.
Diagrammatic west to east geological cross section through Pullman to Moscow showing the basalt stratigraphy of the study area.
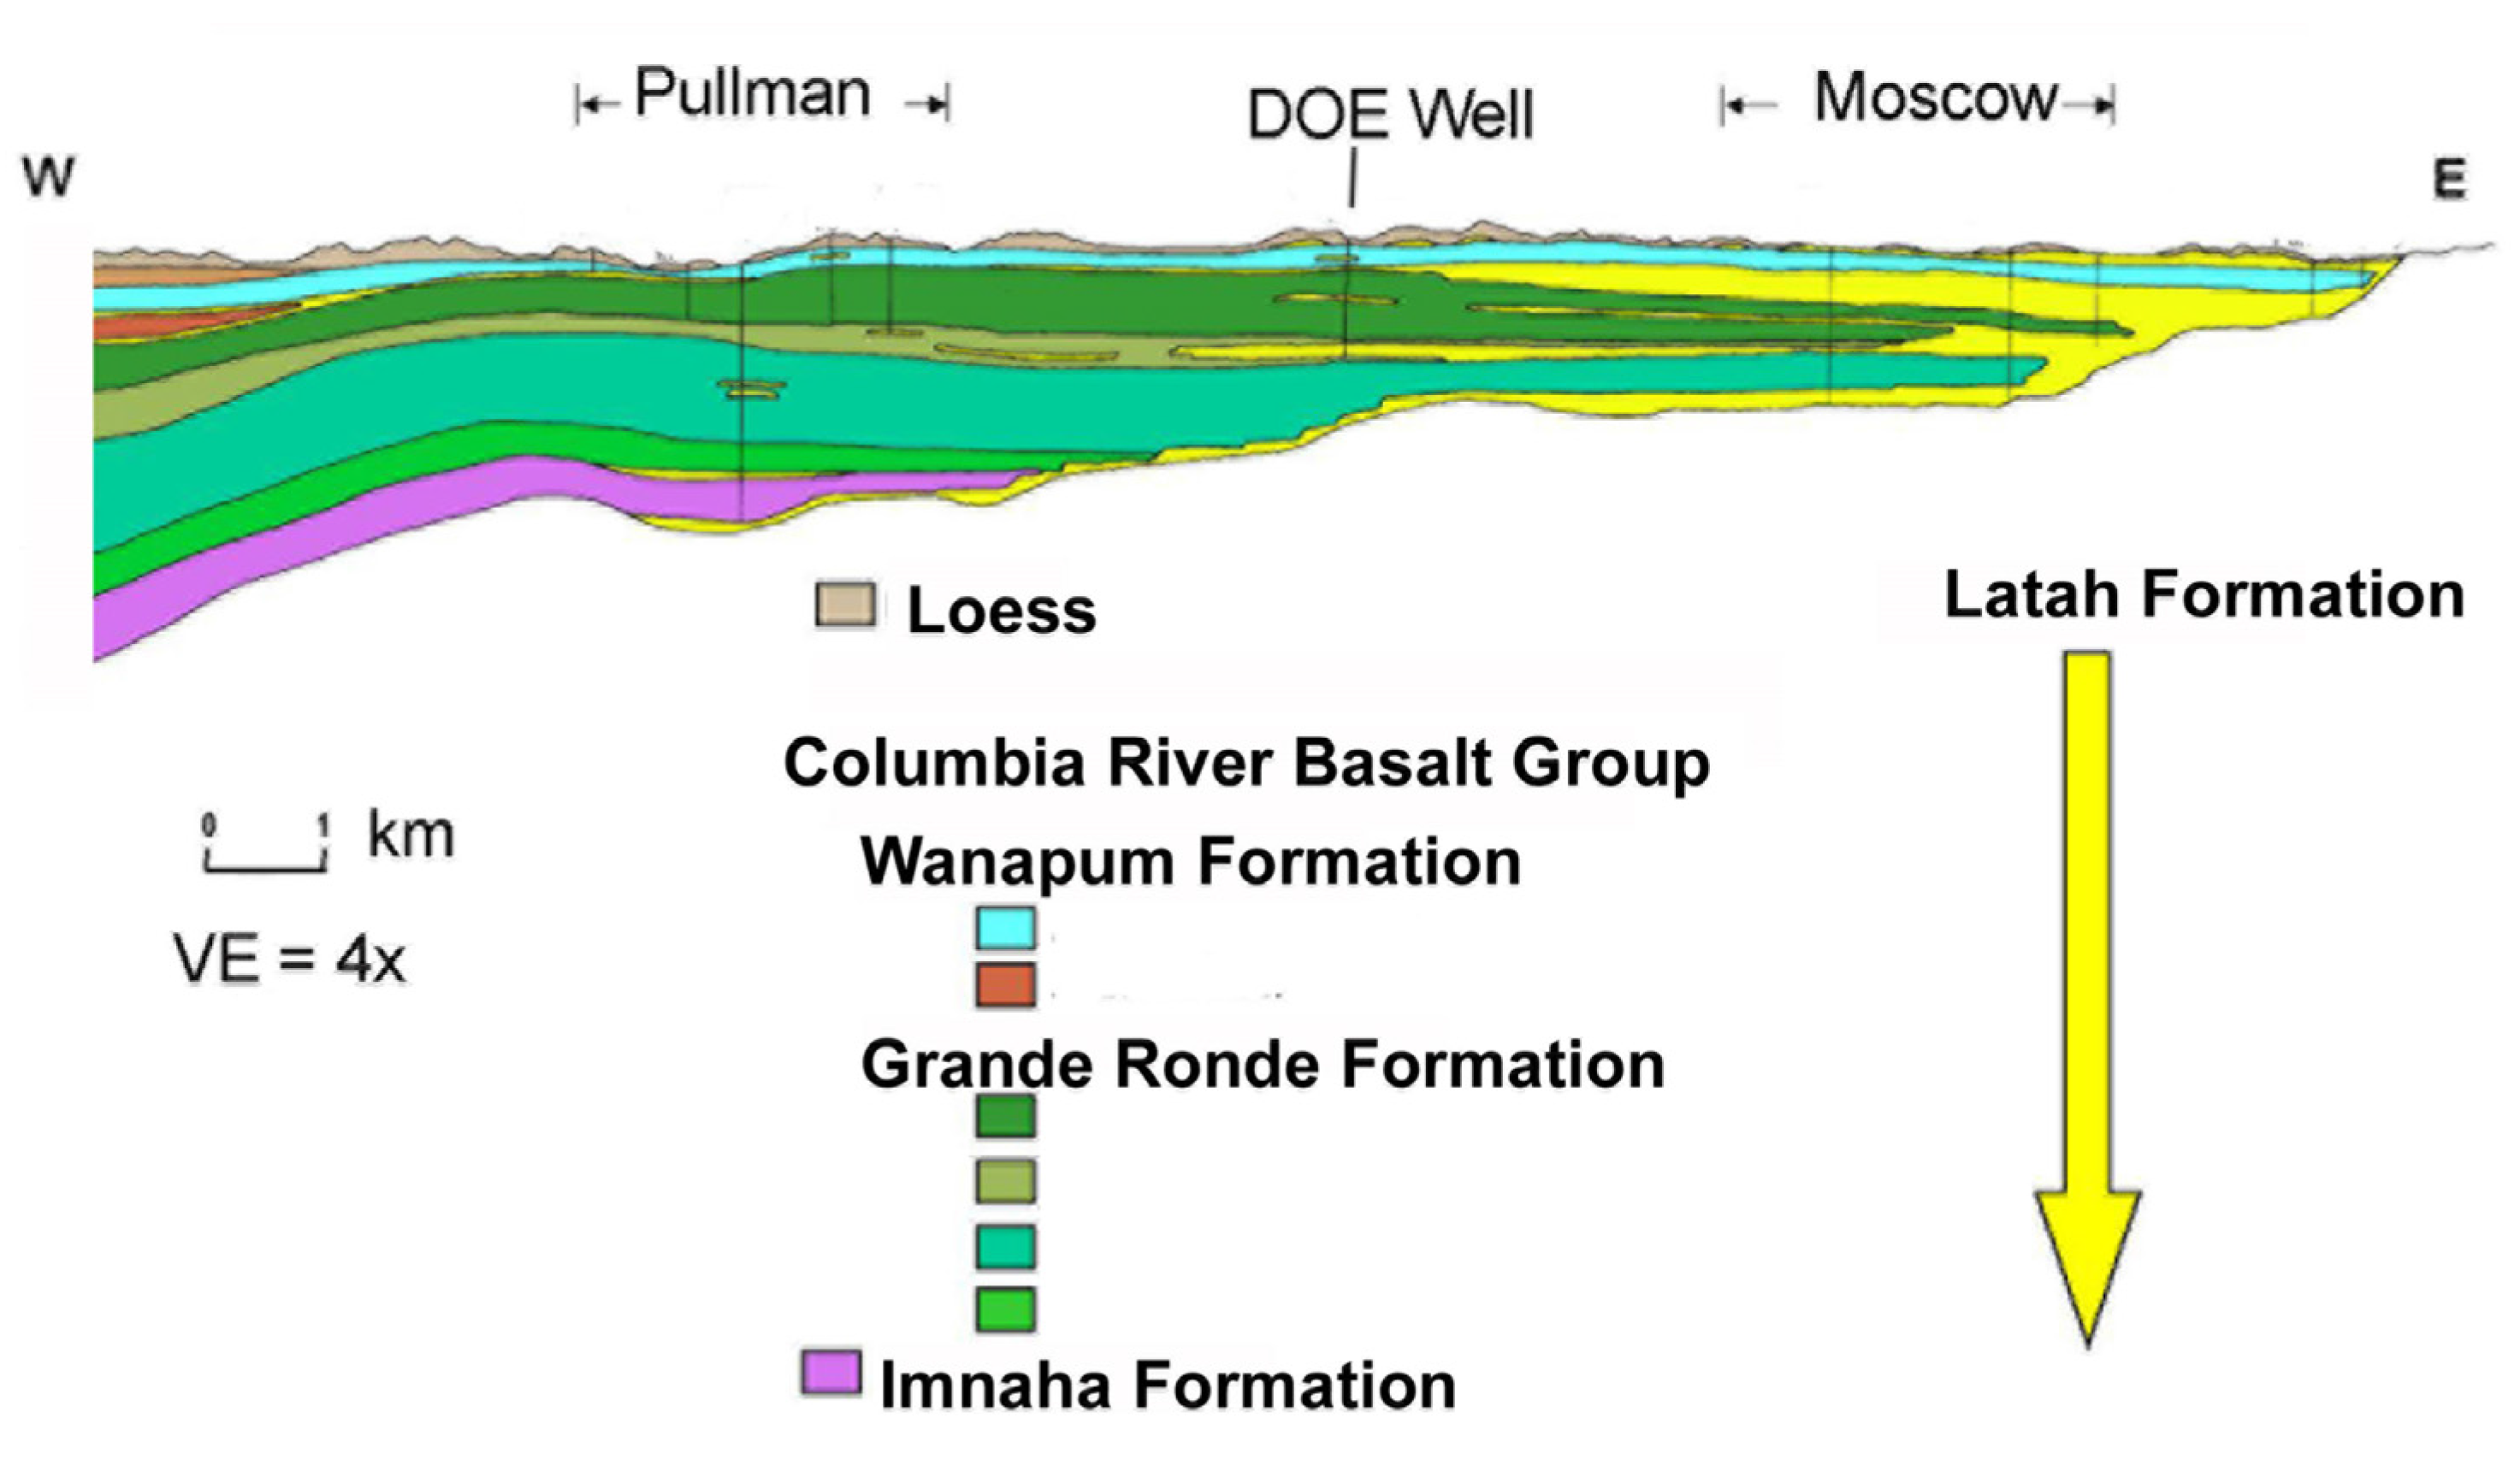
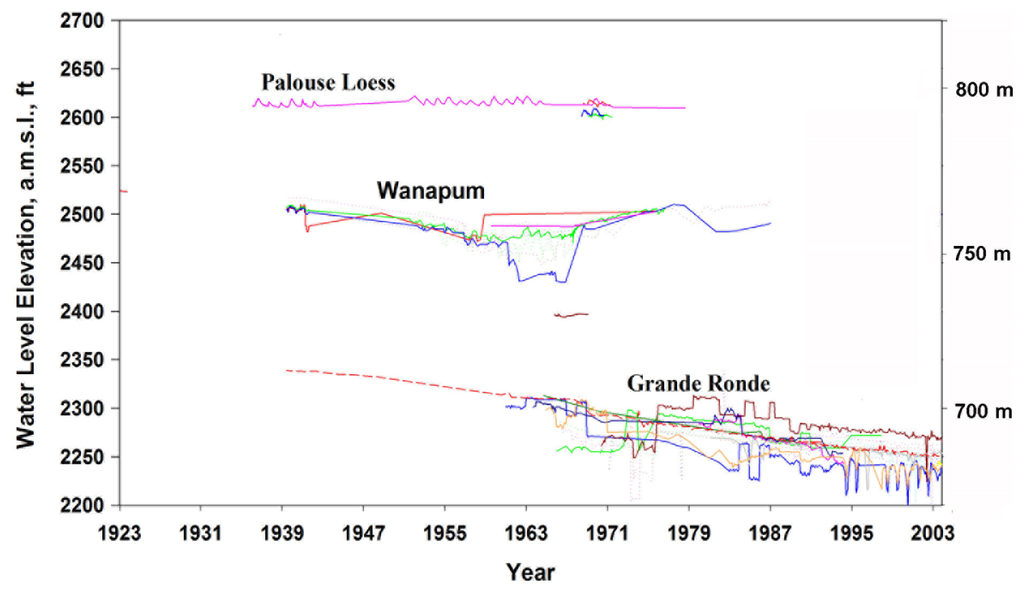
Figure 4.
Composite hydrograph of 30 water wells in the Palouse basin. Modified from [20].
Figure 4.
Composite hydrograph of 30 water wells in the Palouse basin. Modified from [20].
Except at the entrance to the basin, the aquifer system is largely bounded by crystalline rocks of the surrounding highlands. The entrance to the Moscow-Pullman basin near Pullman coincides with a ground water divide apparent on the piezometric surface of the primary aquifer system (Figure 5).
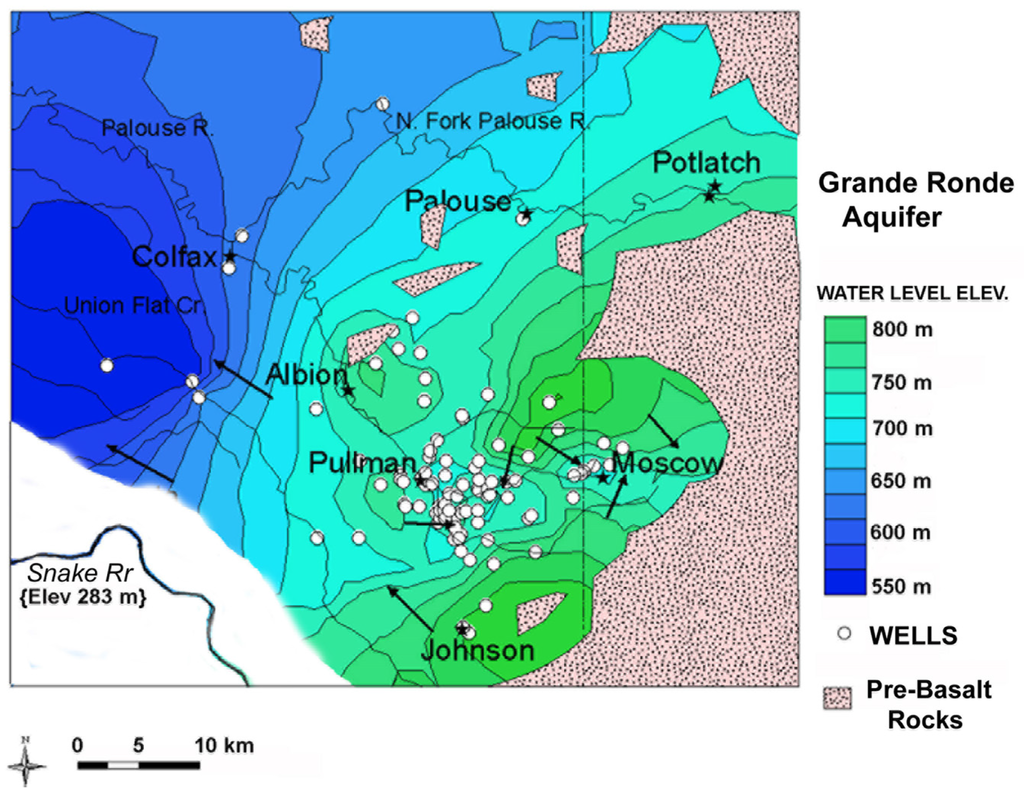
Figure 5.
Piezometric map of the primary aquifer. Arrows indicate postulated flow directions of groundwater.
Figure 5.
Piezometric map of the primary aquifer. Arrows indicate postulated flow directions of groundwater.

To the southwest of Pullman, a poorly understood barrier to groundwater flow [7] prevents groundwater from flowing down the steep gradient to the elevation of the Snake River, lying in a deep canyon some 500 m in elevation below the Moscow-Pullman basin (Figure 5). Geochemical observations [21] have shown that groundwater does not seep into the Snake Canyon. It has also been noted that there is a conspicuous lack of large springs on the walls of the Snake River canyon [22]. Generally to the west of the Moscow-Pullman basin piezometric elevations fall off more moderately toward Colfax, dropping some 135 m. As shown in the stratigraphic and hydrogeological cross-section (Figure 3 and Figure 6), the top of the Grande Ronde drops in elevation east towards Moscow and west and northwest away from Pullman.
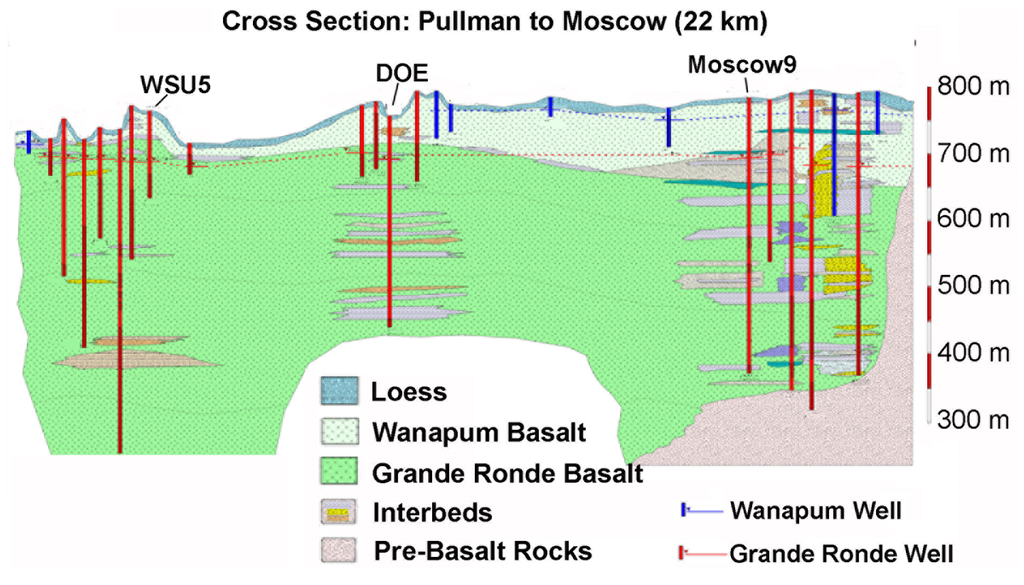
Figure 6.
Diagrammatic hydrogeological cross-section from the Pullman wells on the left (west) to the Moscow wells on the right (east).
Figure 6.
Diagrammatic hydrogeological cross-section from the Pullman wells on the left (west) to the Moscow wells on the right (east).
1.4. The Primary Aquifer System
At Pullman, the top of the Grande Ronde Formation is at a relatively high elevation; the depth to the Grande Ronde Formation top is less than 15 m in places (Figure 6). Here, water-level elevations are essentially the same in wells completed deep in the aquifer system and in more shallow open wells. At Moscow and Palouse, however, the primary aquifer system is definitely confined. The Grande Ronde Formation is more than 130 m deep at Moscow, yet the piezometric surface rises to the same level as at Pullman. Wells completed in the overlying Wanapum aquifer system have higher ground-water levels as compared to wells completed in the primary aquifer system (Figure 4 and Figure 6). This strong downward hydraulic gradient suggests that the Wanapum aquifer system, might leak into the primary aquifer system. However, no hydraulic connection has ever been observed between the Wanapum aquifer system and the Grande Ronde aquifer system in the Moscow area.
Four predominant studies using isotopic concentrations in groundwater have been completed in the Moscow-Pullman basin [23,24,25,26]. The apparent radiocarbon ages of water in the Pullman-Moscow area range from 11,000 to 26,000 year in the primary aquifer and from modern to 10,000 year in the overlying units [25,26]. For stable oxygen isotopes, the δ18O values range from −16% to −17.5% in the primary aquifer and from −16% to −14.8% in the overlying units [24,26]. These numbers suggest that the majority of the water in the Grande Ronde was recharged during ice age conditions in the Pleistocene. On the other hand, tritium concentrations, no older than 60 years, have been detected in the upper part of primary aquifer indicating that modern recharge is mixing with the Pleistocene water in the Grande Ronde [26].
In the Moscow-Pullman basin, recharge, if any, to the primary aquifer system comes from either the mountains on edges of the basin where the basalt flows pinch out against the crystalline rocks of the highlands or from vertical leakage from overlying more shallow aquifers perched between flows above the regional aquifer system [27]. It is of critical importance for future management of the aquifer system to determine if there is any recharge to the primary aquifer system and whether it is generated in the surrounding highlands at flow pinchouts or by vertical leakage throughout the basin. If there is no recharge, then new sources of water need to be found for future development, such as a pipeline to the Snake River, some 20 km south and 500 m in elevation below the study area. If there is recharge, then the optimum locations of recharge galleries need to be determined.
The rational approach to understanding the nature of recharge is to develop a ground water model based on a sound hydrogeological conceptual model consistent with pumpage records and the history of water level declines. Previous groundwater models [7,8] of the study area have failed in all these regards. Below we show how geophysical methods have provided better parameters for future groundwater models.
2. Methods
Groundwater models depend in part on the porosity, area, thickness, storativity, and nature of confinement of the aquifer. These parameters, in the Moscow-Pullman basin, are poorly constrained by existing well information and previous stress tests. We have made use of geophysical measurements, including surface gravity measurements, borehole gravity measurements, barometric efficiency estimates, earth tidal response, and earthquake seismology observations to constrain these parameters.
2.1. Porosity of the Aquifer System
The porosity of the CRBG strata exhibits a bimodal distribution due to the difference between the dense, massive interiors of flows (aquitards) and the intraflow structures (aquifers). To better quantify this porosity difference, we made use of extraordinarily detailed borehole gravity data that have been carried out in CRBG strata in three wells at the Hanford site in central Washington State as part of the design process for a new waste treatment plant [28]. The Hanford Site is a mostly decommissioned nuclear production complex sitting on CRBG bedrock operated by the United States federal government on the Columbia River in the U.S. state of Washington. This borehole gravity survey is stated to include the longest section (approximately 1280 m in the three wells) of measurements data taken at such a small station spacing (3 m).
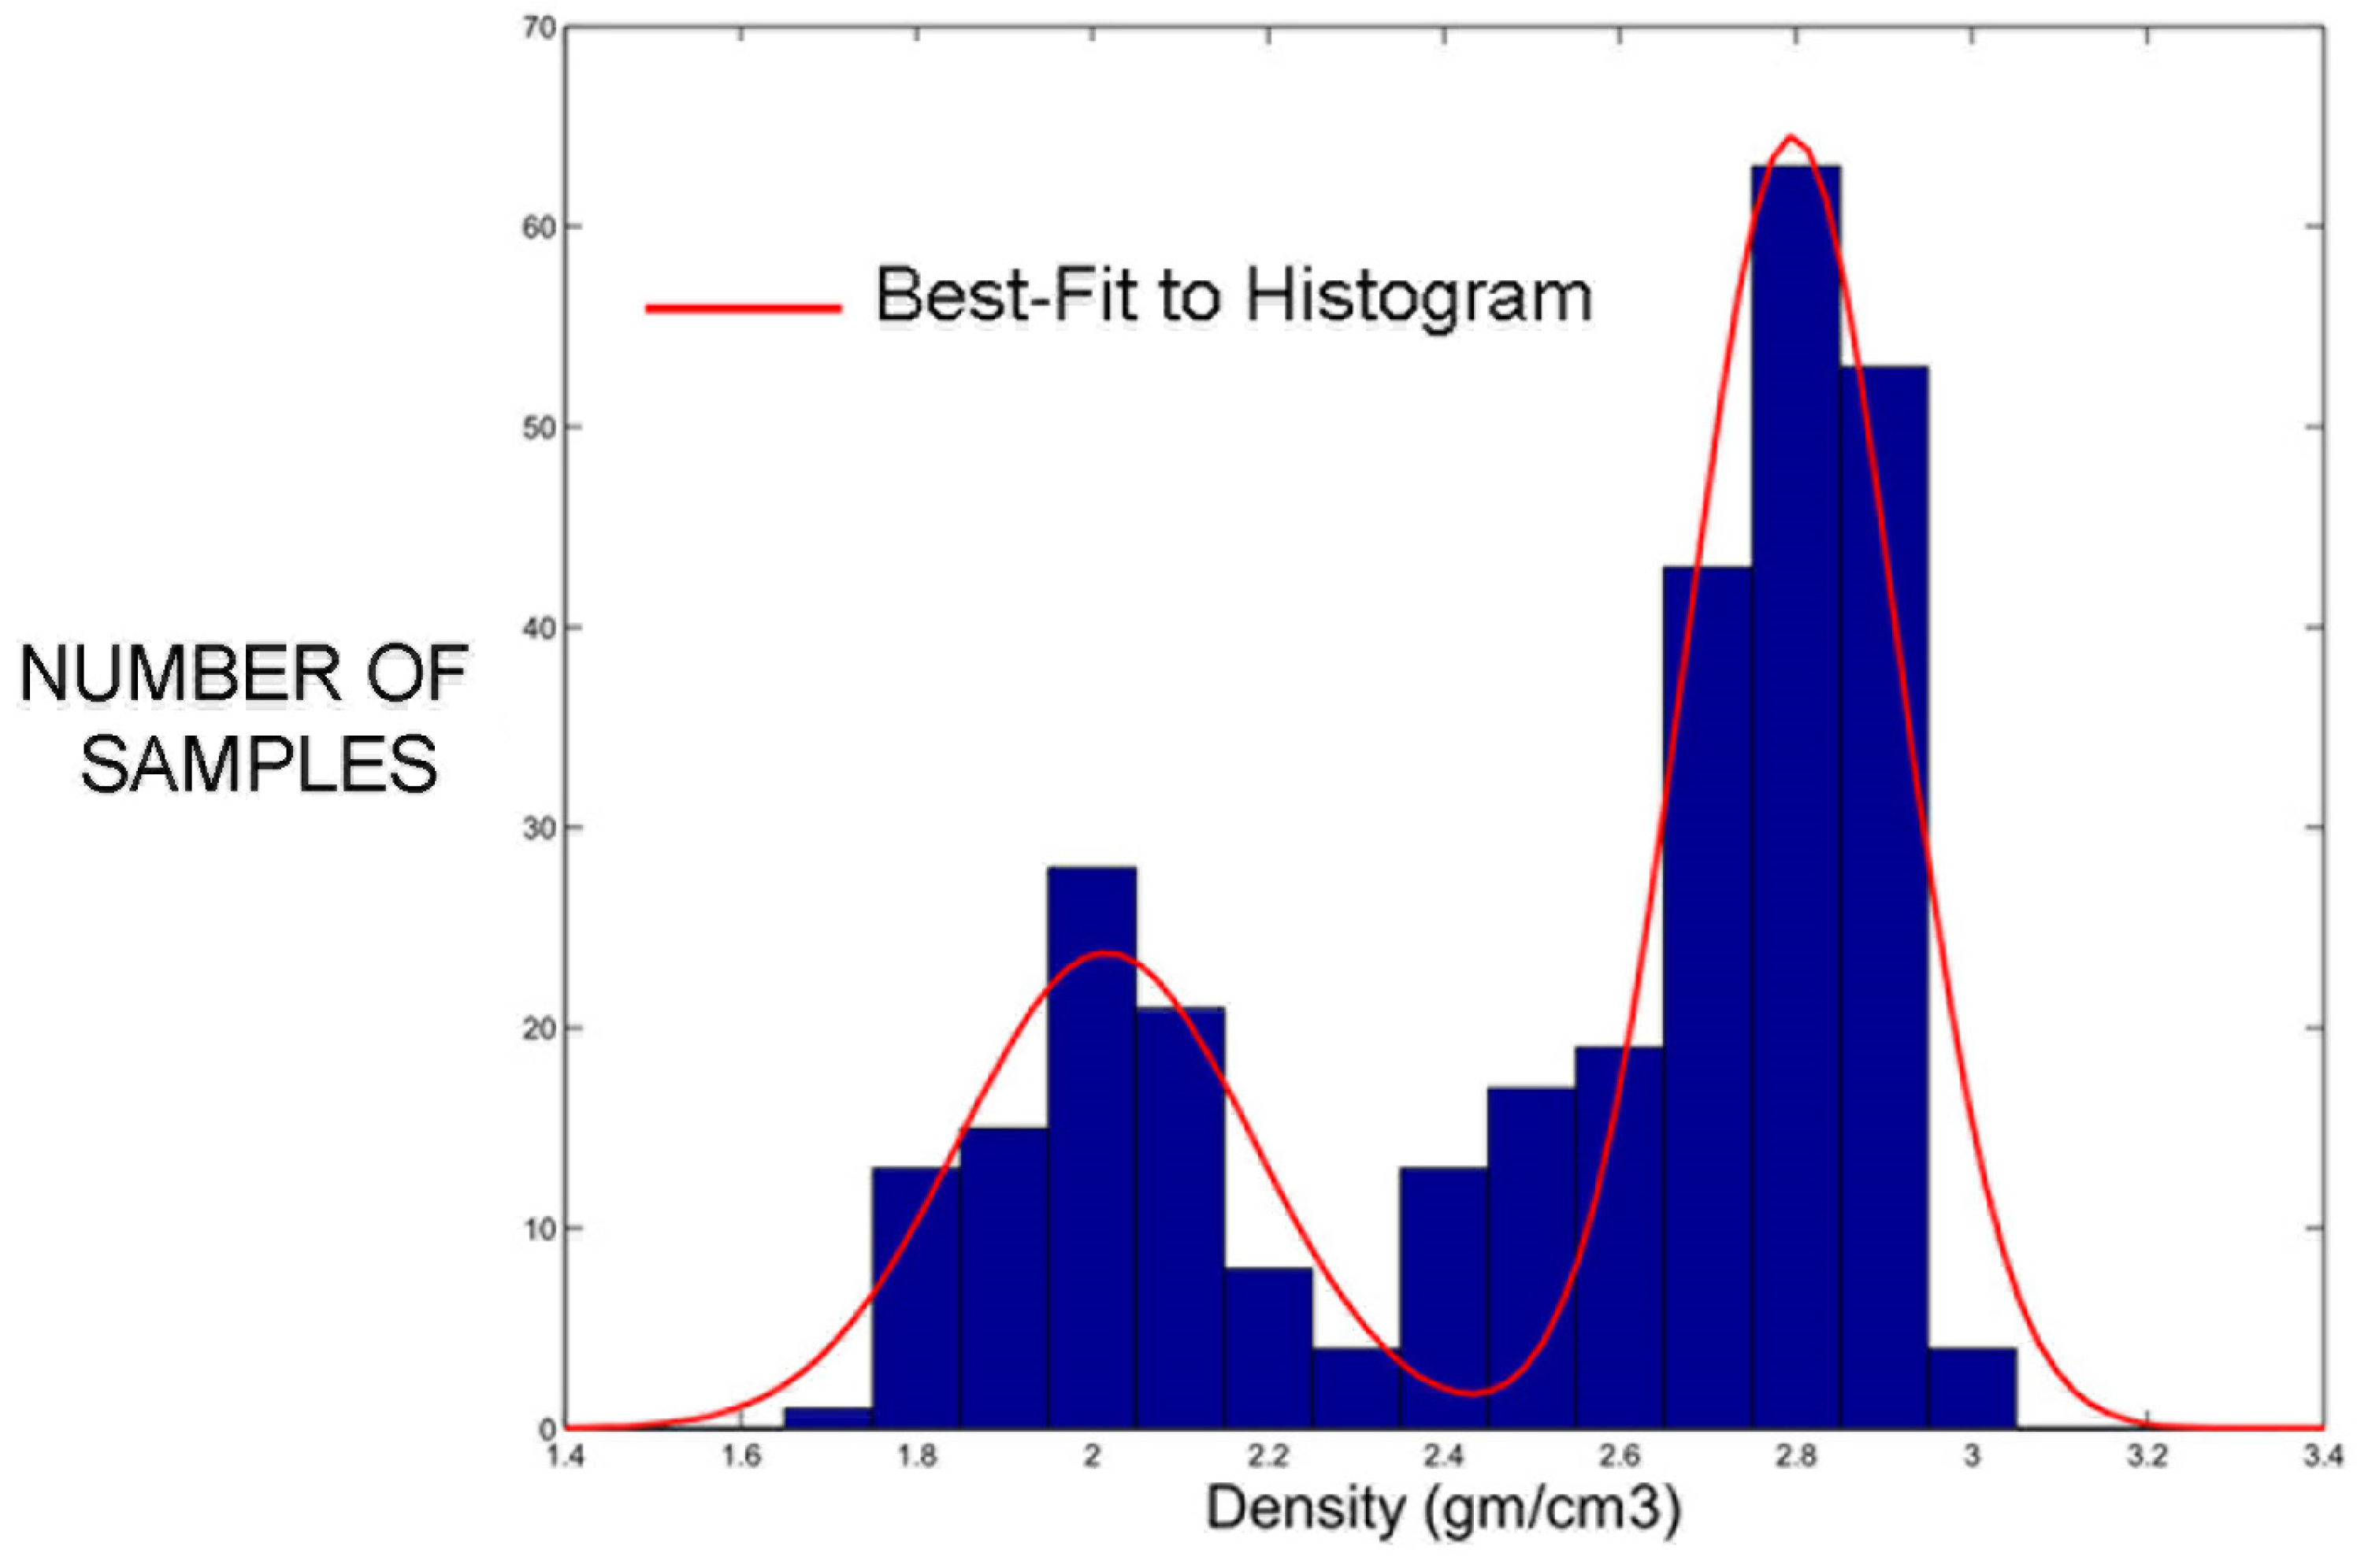
The borehole gravity meter tool has a very large horizontal depth of investigation so it is not influenced by washouts and borehole construction. The survey goal at Hanford was to provide CRBG rock densities with an estimated error of ±0.05 g/cm3 or less. We plotted the 302 CRBG basalt density determinations from the Hanford survey as a histogram in Figure 7. The distribution is clearly bimodal indicating the dichotomy between the massive flows and the porous intraflow zones encountered in the section of CRBG strata surveyed. As also shown in Figure 7, we fit the histogram with two Gaussian curves [29]. The higher peak is at a density 2.80 ± 0.12 mg/cm3 which we take as the mean density of the massive flows. The lower peak is at density 2.02 ± 0.17 g/cm3 which we interpret as the density of the intraflow zones. The density contrast between the massive flow zones and the intraflow units is 0.78 ± 0.20 g/cm3. If we treat the massive flows as having no effective porosity, but with an unconnected vesicle volume typical of basalt (7.8%) [30], we find the mean porosity of the intraflow zones is 0.355 ± 0.04.

Figure 7.
Histogram of basalt densities found from a borehole gravity survey [28]. The survey densities were binned in 0.1 g/cm3 increments and then fitted to a bimodal curve using the EzyFit toolbox [29]. The lower density peak is modeled as 2.02 ± 0.17 g/cm3 and the higher density peak as 2.80 ± 0.12 g/cm3.
2.2. Area of the Aquifer System
The area of the main Grande Ronde aquifer system that should be included in a groundwater model of the Moscow-Pullman basin is quite controversial. By area in this regard, we mean the areal extent to which aquifer parameters determined from well tests in the deep city wells should be applied. In some studies the southwest boundary of the Moscow-Pullman aquifer system is thought to be bounded by the Snake River [8,31], however, geochemical studies have shown that Moscow-Pullman basin ground water does not seep into the Snake River Canyon [21]. It appears likely that northwest trending folds paralleling the Union Flat Creek restrict groundwater movement towards the Snake River Canyon, instead channeling it northwest [7,20,32,33,34,35,36,37].
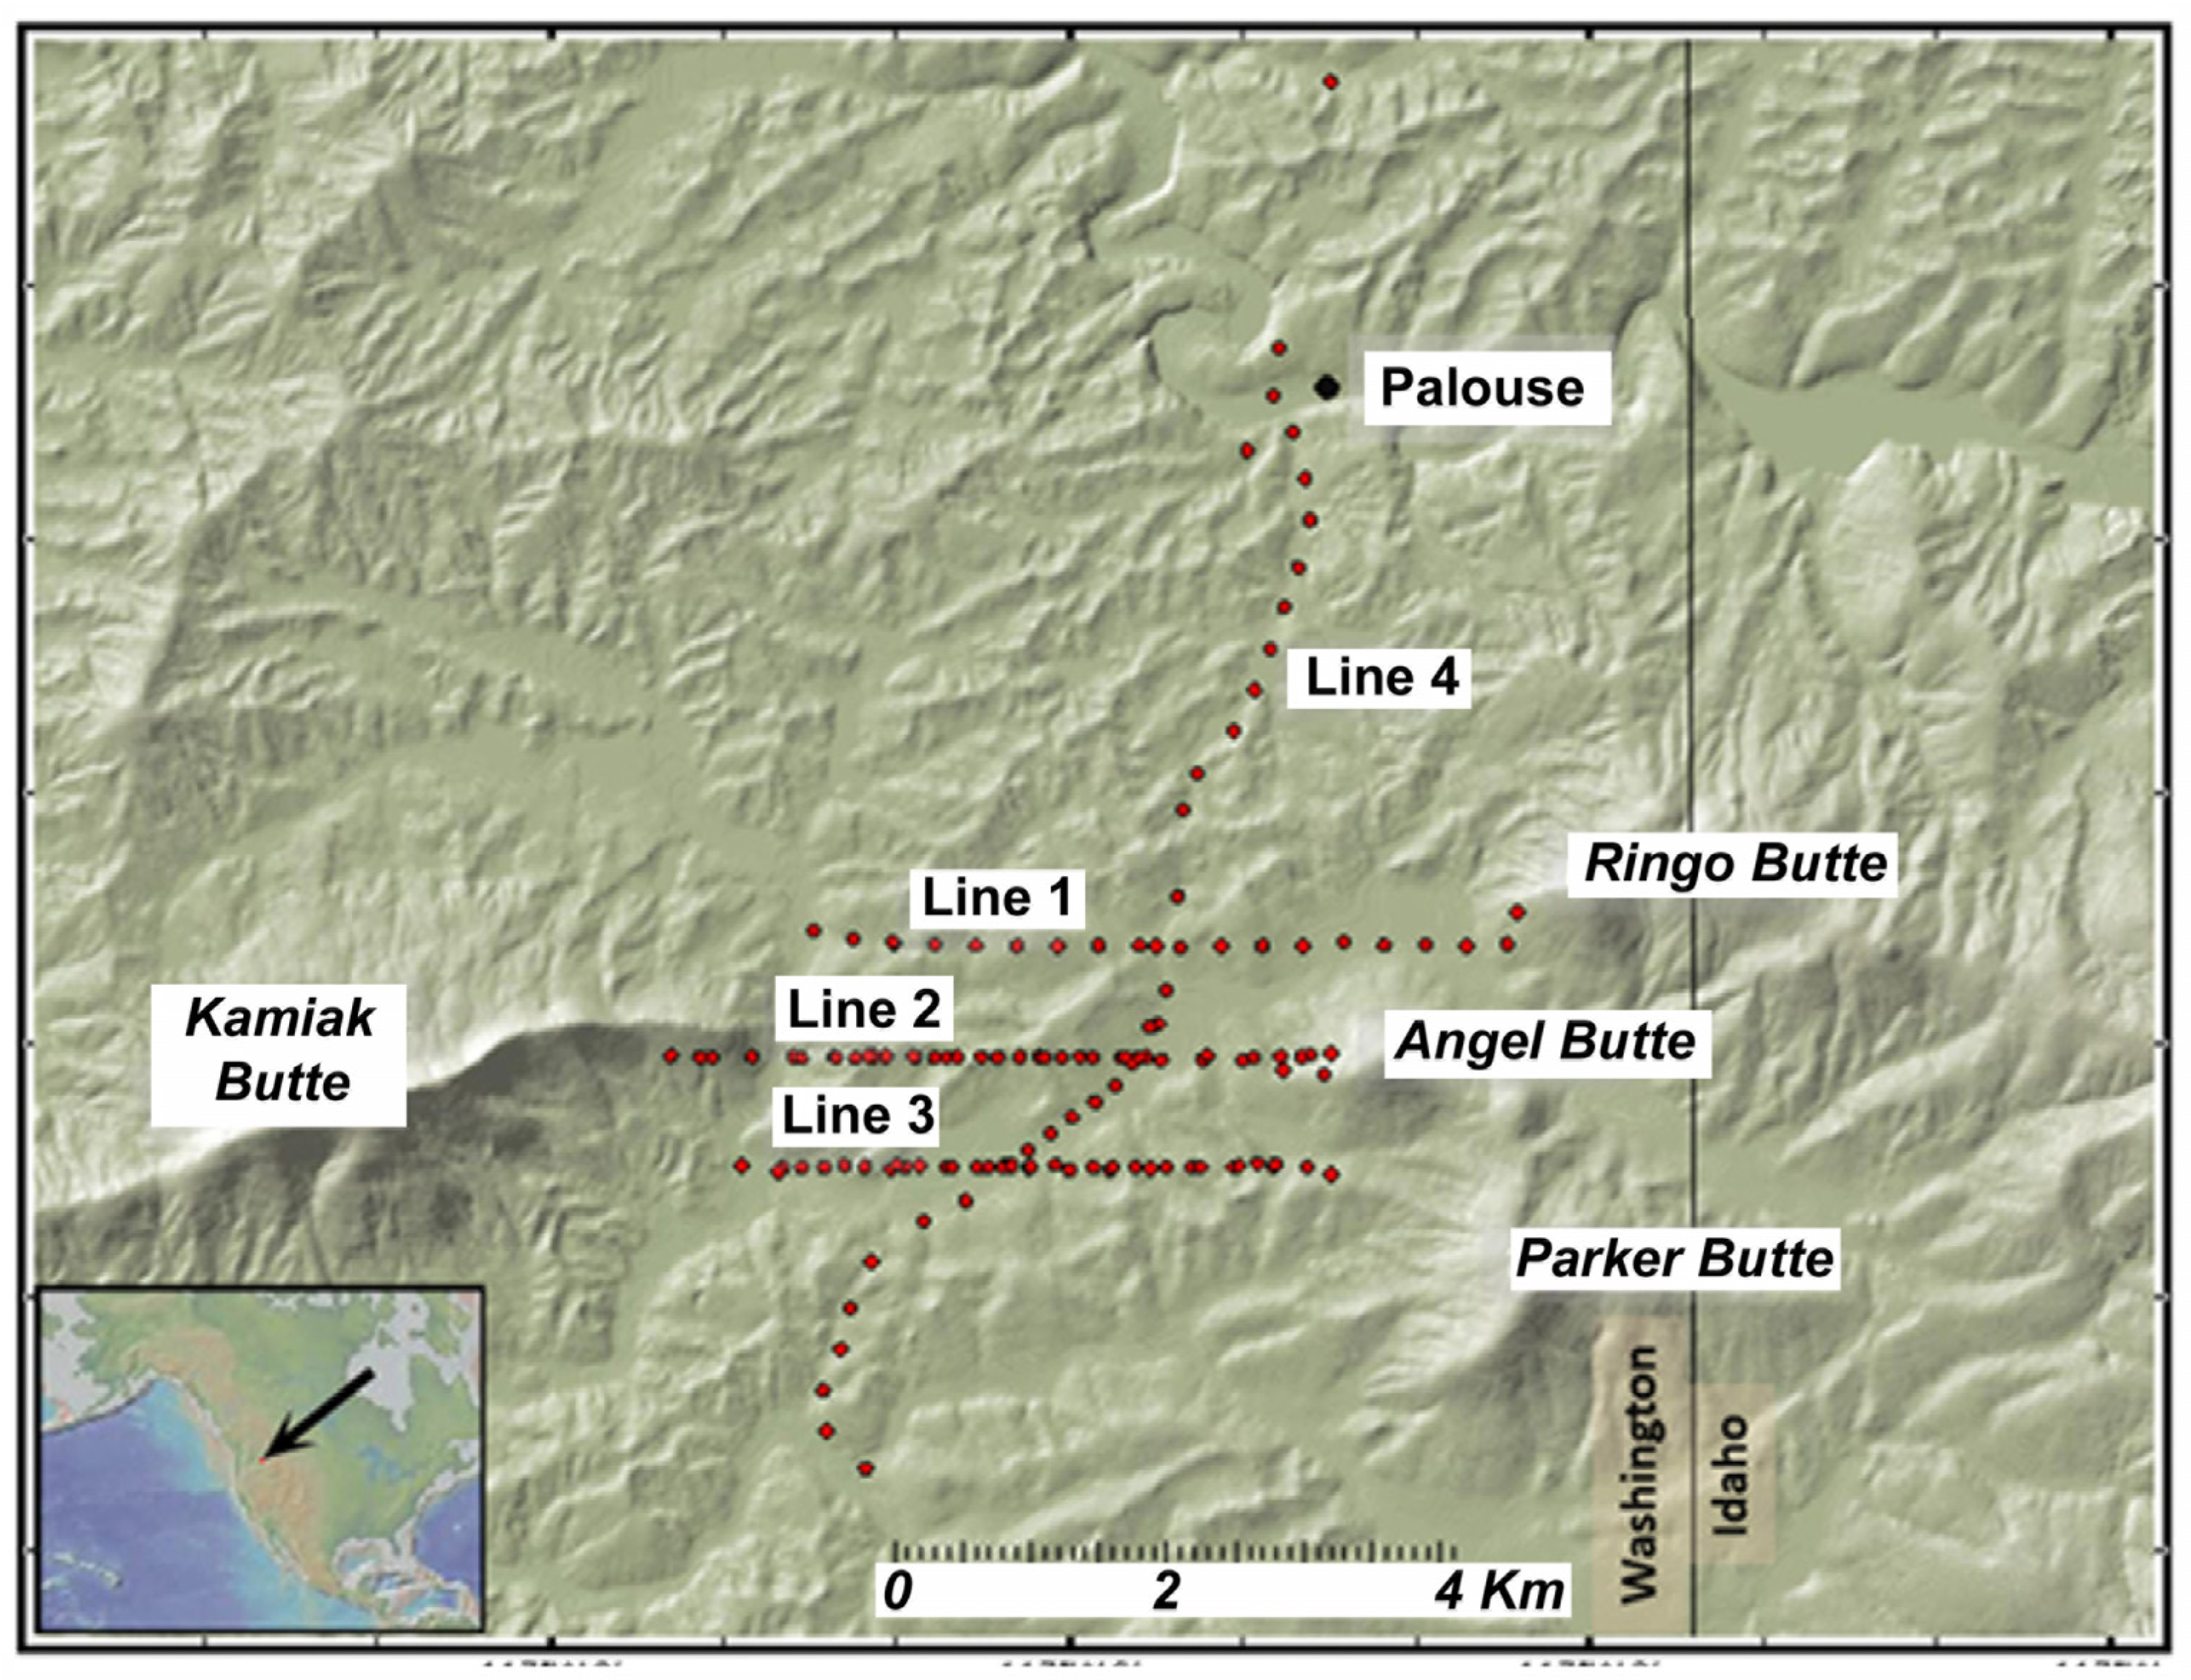
Another controversy concerns whether the Grande Ronde aquifer system hydrologically connects the southern cities of Pullman and Moscow to the northern city of Palouse. A break in the crystalline rocks within the basin, called the Kamiak Gap, occurs between Pullman and Palouse immediately east of Kamiak Butte (Figure 2). Hydraulic connection between Palouse and the rest of the basin through the Kamiak Gap has been investigated on a geophysical basis by several researchers [38,39]. A magnetotelluric study [38] suggested continuity of the Grande Ronde Formation through the gap. On the other hand, gravity methods [39] initially suggested that the Grande Ronde was interrupted by a saddle of crystalline basement rock obstructing aquifer conductivity south of Palouse. However, new test well data [40], providing much needed control on the elevations of formation tops, has allowed us to reinterpret these gravity data. Gravity readings were taken along four lines in the Kamiak Gap (Figure 8) [39].

Figure 8.
Gravity survey area in the Kamiak Gap [39]. See Figure 2 for location of Kamiak Butte within the study area. Lines 1, 2, and 3 are east-west transects of gravity stations across the gap and Line 4 meanders approximately north-south crossing the other three lines. Figure generated with GeoMapApp [41].
The stratigraphy of the DOE Butte Gap well, drilled at the latitude of the southernmost east-west transect, is remarkably similar to the stratigraphy of the Palouse City #3 well drilled to the north of the Kamiak Gap [40]. Using these constraints we propose a new geophysical model (Figure 9) suggesting that the Grande Ronde basalts are indeed continuous through the Kamiak Gap with a net thickness in excess of 100 m. Thus, Kamiak Gap should not create a hydraulic barrier to north-south groundwater flow.
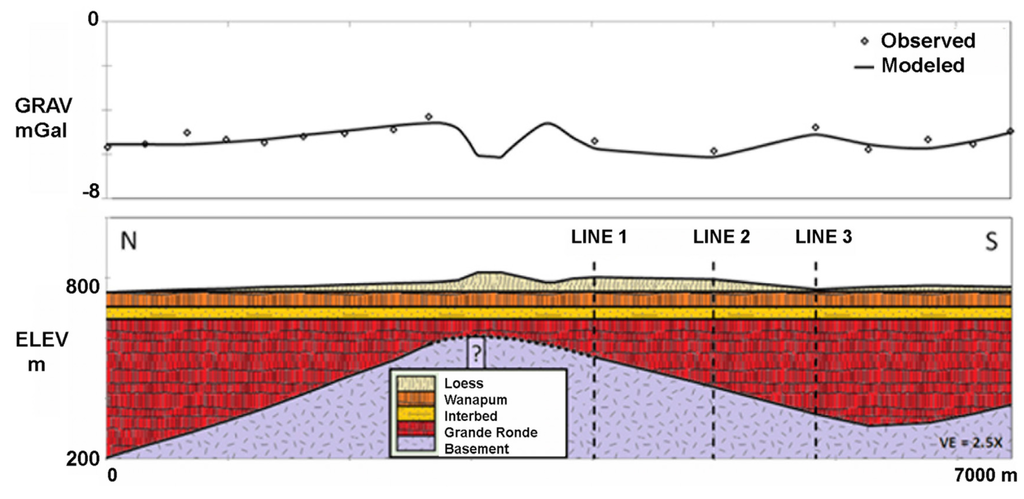
Figure 9.
Gravity model through the Kamiak Gap from north to south. Modeled thickness of Grande Ronde at intersection of Line 1 (Figure 8) is 125 m, at intersection of Line 2 is 224 m, and at intersection of Line 3 is 316 m. The dashed line between basement and Grande Ronde north of Line 1 below the topographic divide indicates uncertainty in the model as there is approximately 1.35 km between survey point locations.

Thus, for improved ground-water models, the total area of the primary aquifer system that directly affects the Moscow-Pullman basin should be about 620 km2, with 420 km2 south of Kamiak gap, and 200 km2 north of the gap.
2.3. Thickness of the Aquifer System
Comparing the areas of the two normal curves of the histogram of borehole gravity data from CRBG strata at the Hanford site (Figure 7), we find that 29% of the basalt section there is aquiferous intraflow units; the remainder is massive basalt with negligible effective porosity. Based on the logs from deep wells in the Moscow area (Figure 6), a previous study [42] estimates that 25% of the Grande Ronde section consists of intraflow zones. A well construction report [34] for the DOE well (Figure 6) logged where water was seen in the drill core. About 28% of the core length contained water. Producing zones from the Grande Ronde in the Moscow-Pullman basin lie between elevations of 350 m and 716 m above sea level (Figure 6), a net thickness of 365 m. Thus, we estimate the effective thickness of the primary aquifer to be 25% to 29% of 365 m or 100 ± 2 m.
2.4. Specific Storage from Barometric Efficiency
Specific storage can be estimated from barometric efficiency if the porosity of the aquifer is known.
where η is porosity; γw is the unit weight of water in N/m3; Ew is the elastic modulus of water (2.2 × 10⁹ Pa); BE is barometric efficiency; and SS is aquifer specific storage in m−1. The barometric efficiency of aquifers in the CRBG is high because of the strength of the massive nearly impermeable flow interiors that separate the confined intraflow aquiferous zones. In the Grande Ronde aquifer system of the Moscow-Pullman basin, previous studies [43,44] have shown that BE ranges from 0.9 to 1.0. As described above, we estimate the mean porosity of the intraflow zones to be 0.355 ± 0.04. Using this value in Equation (1) above, along with the known BE of 0.95 ± 0.05, we find that the specific storage Ss of the aquiferous intraflow zones is 1.67 × 10⁻⁶ ± 0.18 × 10⁻⁶ m−1.
2.5. Specific Storage from Earthquake Seismology
Seismological theory [45,46,47] predicts that Ss for a confined aquifer can be found by comparing, as the Rayleigh waves from distant large earthquakes roll by, earthquake seismograms to water level oscillations as illustrated in Figure 10. To determine specific storage, the borehole amplification factor has to be known for the well. This factor depends on oscillation frequency, the borehole radius, initial height of the water column, screened aquifer thickness, transmissivity of the aquifer, and, to a minor extent, Ss [46]. Because our quantity to be determined, Ss is involved in the calculation of the borehole amplification factor, the method requires an iterative procedure for its solution. An initial guess of Ss is used to generate successively better approximations. However, because Ss has only a minor effect on the borehole response, convergence is quickly obtained.

Figure 10.
Water level oscillations observed in a water well near Moscow, Idaho while seismic waves from the 2012 M7.8 Haida Gwaii Earthquake passed through the aquifer.
Figure 10.
Water level oscillations observed in a water well near Moscow, Idaho while seismic waves from the 2012 M7.8 Haida Gwaii Earthquake passed through the aquifer.
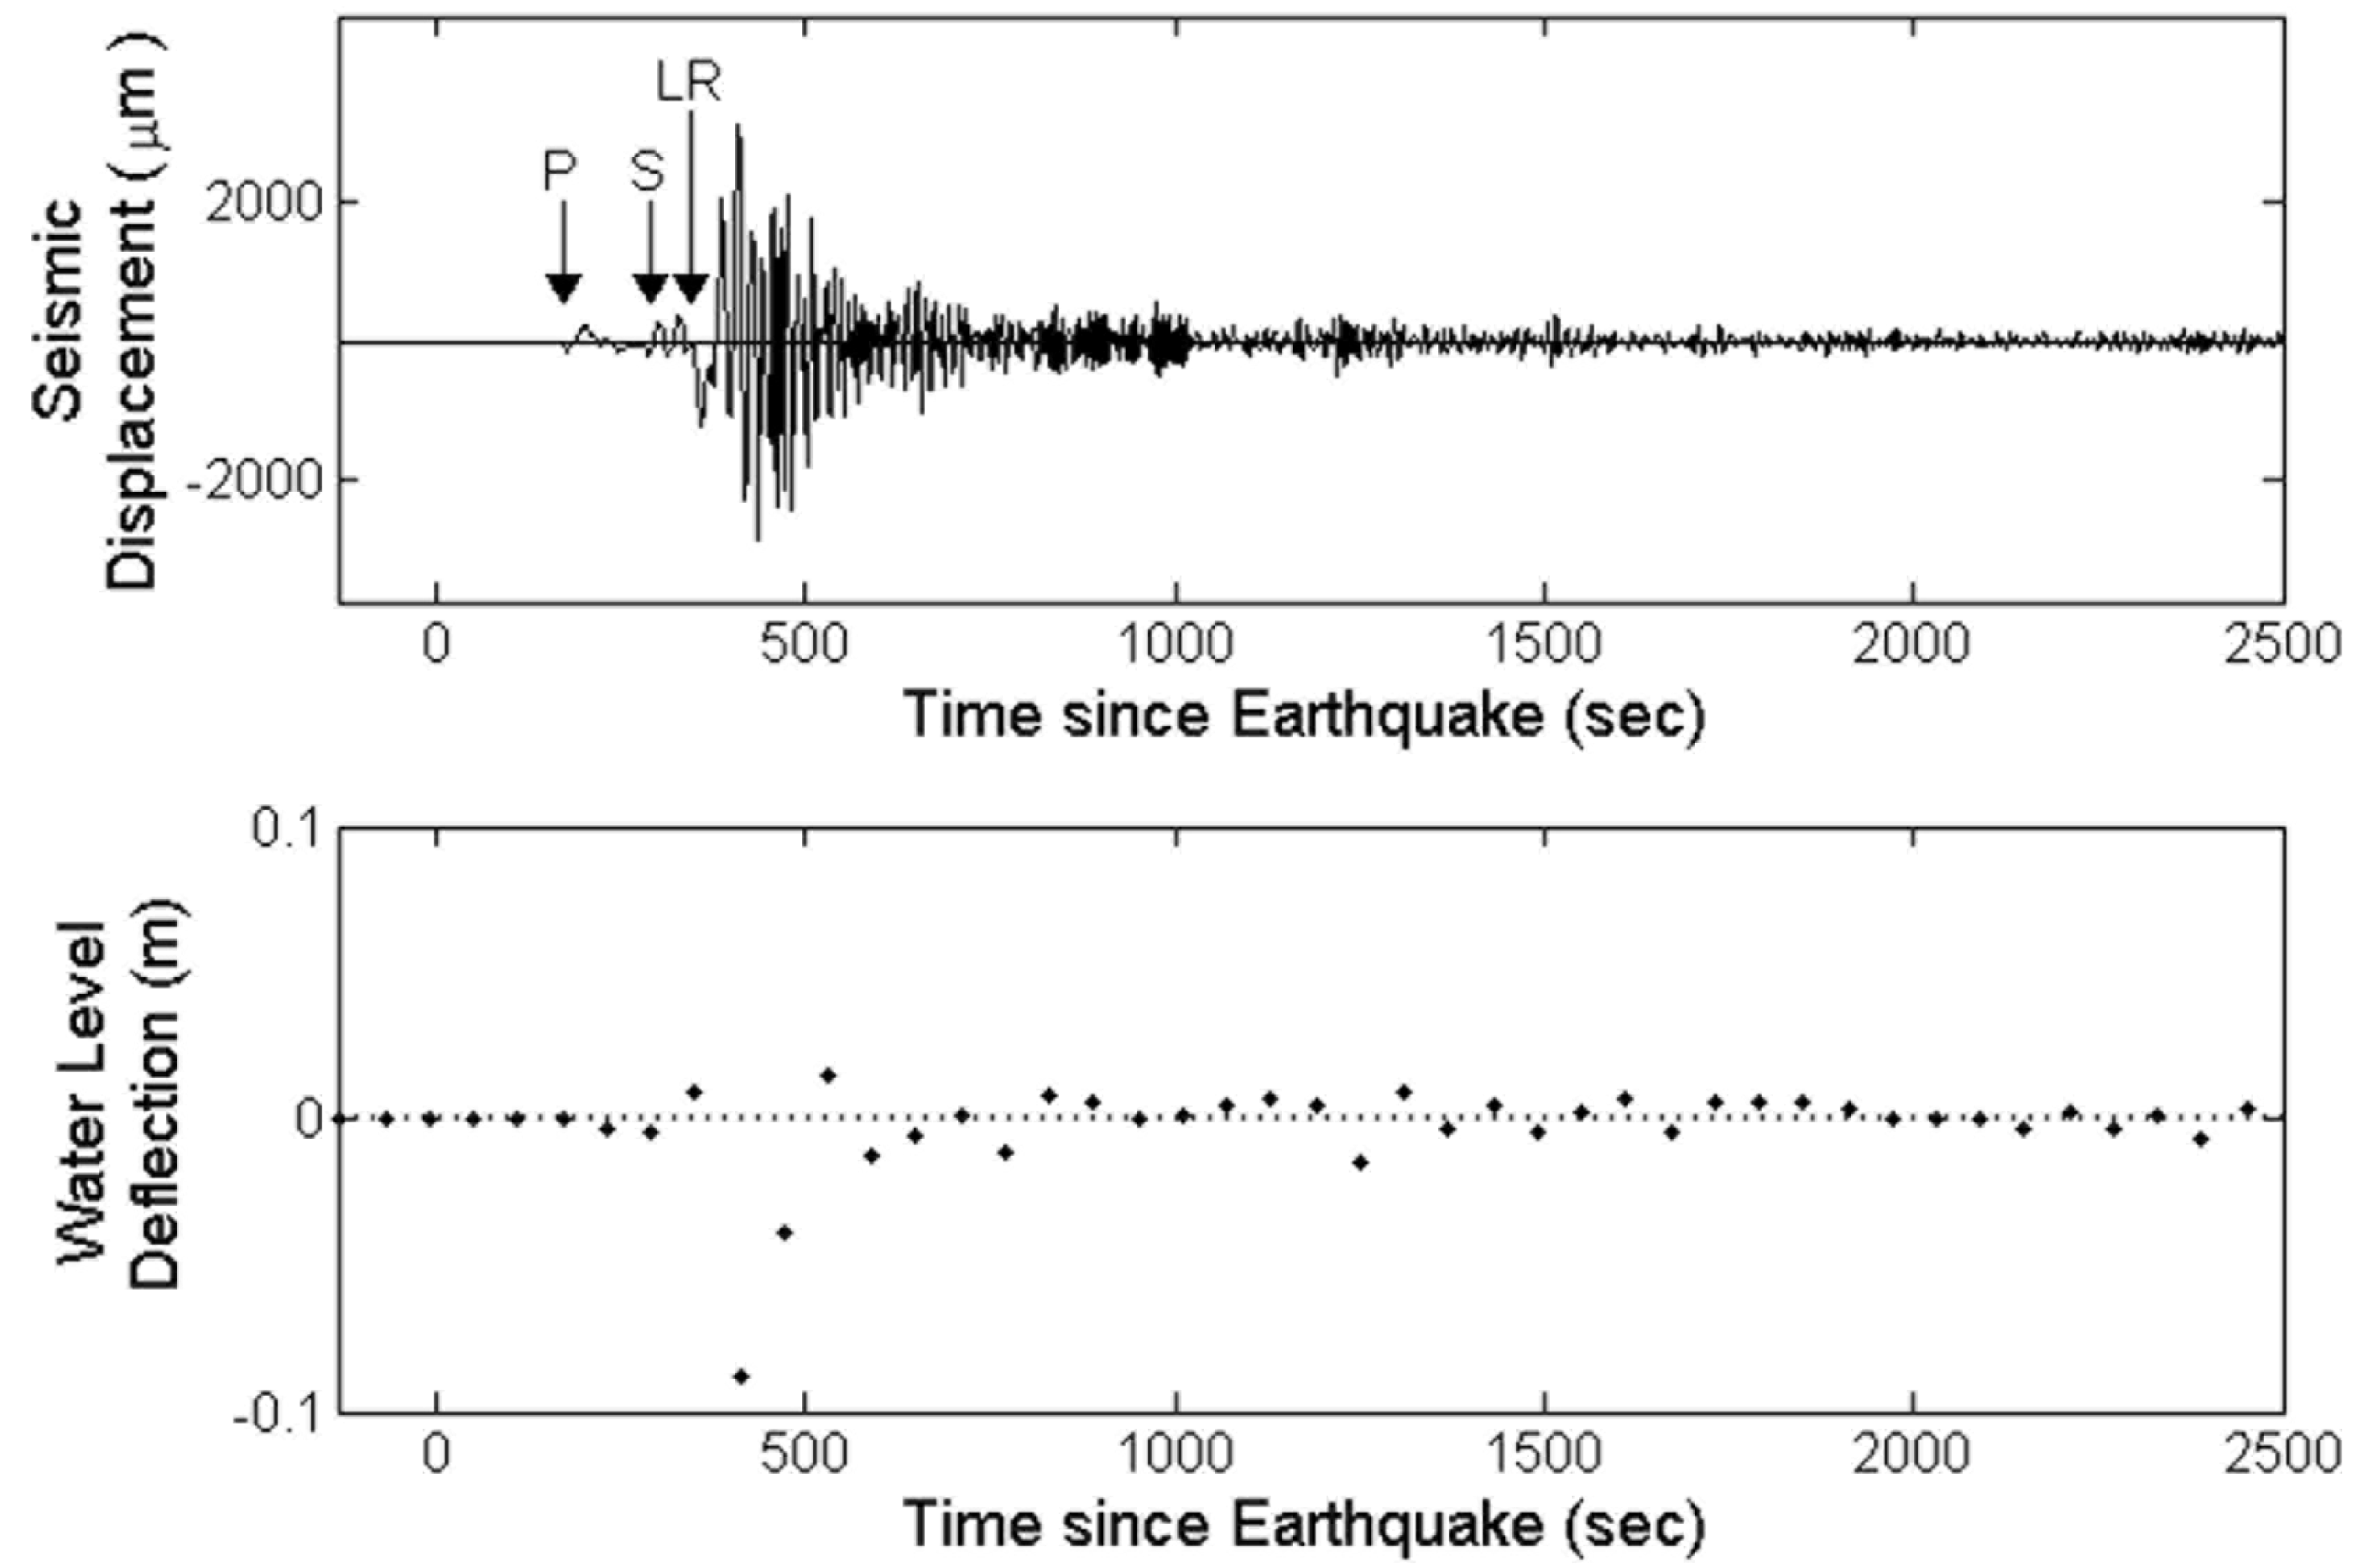
The seismic Rayleigh wave response of municipal well Moscow 9 (see Figure 6 for location) was evaluated. This important supply well was shut down temporarily for pump repair for several months in 2012, giving an opportunity for the installation of a data logger. The well is cased except for 27 m of screen adjacent to several interconnected highly permeable flow top units within the Grande Ronde aquifer. The top of the aquifer is at a depth of 198 m below land surface. The static level of the water rises to a height of 104 m above the top of this confined artesian aquifer. The borehole diameter above the screened intervals is 0.22 m. A transmissivity estimate from previous well tests was used [48]. Rayleigh waves from three moderately large 2012 earthquakes (magnitude >7.7) with epicenters in Haida Gwaii, Okhotsk, and the Philippines were observed. During the same time intervals as the Rayleigh wave were passing, the data logger in well Moscow 9 was collecting measurements at one minute intervals (Figure 10). Twenty water level measurements immediately after the Rayleigh wave first arrival for each of three separate earthquakes were used to find Ss.
Combining the data from the earthquakes, Ss was found to be 1.5 × 10⁻⁶ ± 0.2 × 10⁻⁶ m−1. However, this optimistic figure does not take into account sources of error that are difficult to quantify. The method assumes the aquifer is confined, uniformly porous, and free of heterogeneities.
2.6. Specific Storage from Earth Tides
Gravity theory predicts that earth tides (Figure 11) will result in harmonic subsurface dilatations within a few hundred meters of the earth’s surface [46,49]. At inland sites, the lunar diurnal (O1) and lunar semi-diurnal (M2) are the most affected by the local hydraulic characteristics of the formations open to the wells [46]. On the other hand, the solar harmonics, K1 and S2, at periods of 1.0 and 0.5 days, contain the influence of atmospheric-pressure oscillations. At latitude θ, the resulting water level deflections for the O1 and M2 earth tides in an open water well in a confined aquifer are given by
where AO1 and AM2 are the amplitudes at periods of 1.0758 and 0.5376 days [46,49].
AO1 = 1.56 × 10⁻⁸ sin(θ) cos(θ)/Ss and AM2 = 1.89 × 10⁻⁸ cos(θ) cos(θ)/Ss

Figure 11.
Water level deflections caused by earth tides in (a) DOE well and (b) WSU5 well. See Figure 6 for locations. The O1 and M2 harmonics have periods of 1.0758 and 0.5376 days. Note that the DOE tidal amplitudes are 50 times higher than those in Pullman well WSU5, suggesting that the primary aquifer system near Pullman is partially unconfined.
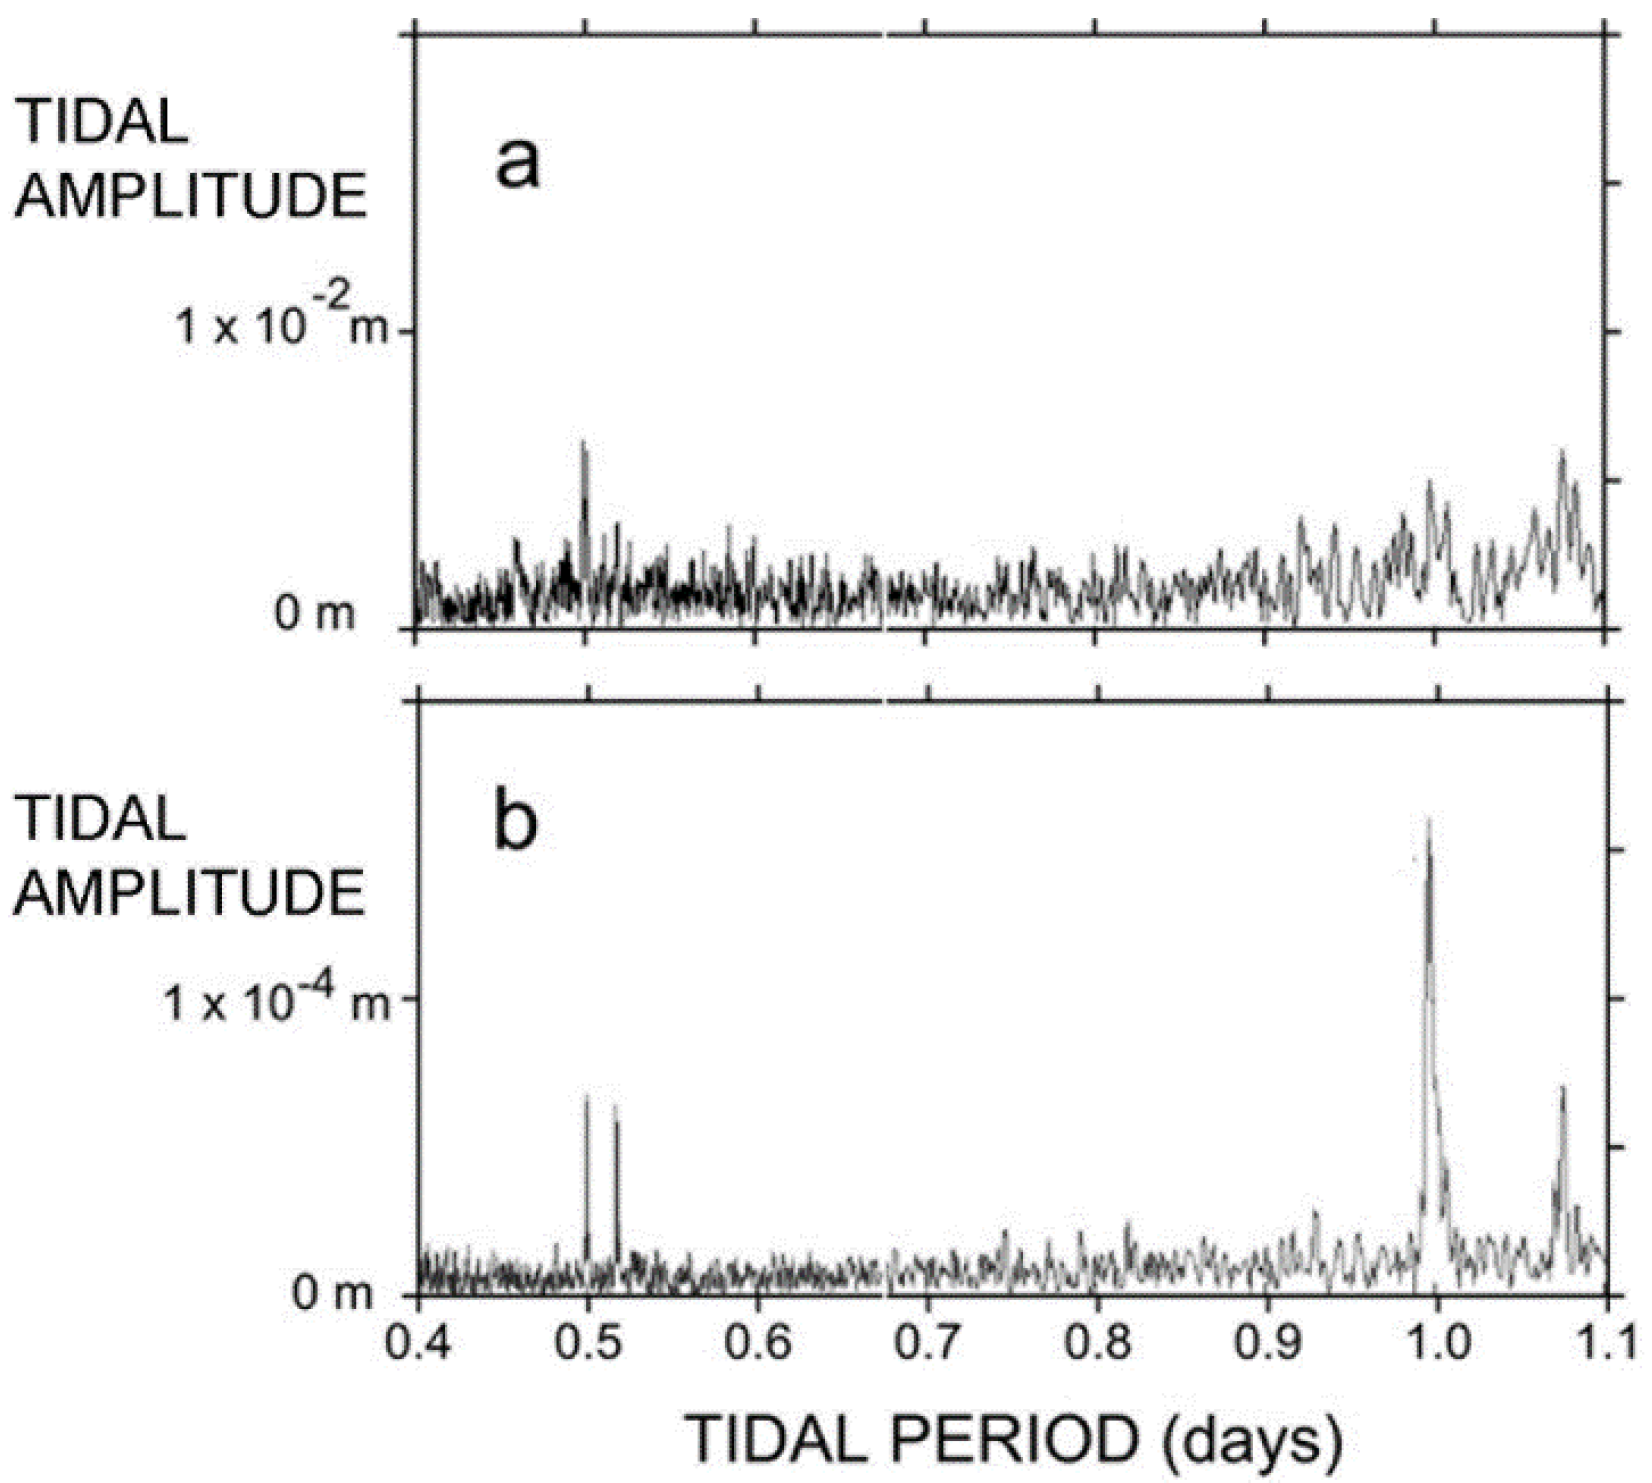
The DOE well, located midway between Moscow and Pullman (Figure 3), was the site of an experiment to measure earth tides in the study area. Groundwater levels were sampled at 10 min intervals for an entire year to produce the spectrum shown in Figure 11. The spectrum is noisy because of interference from nearby pumping wells. To agree with the Ss from barometric efficiency, the equations above predict that AM2 would be less than 0.001 m, an amplitude lost in the background noise apparent in Figure 11a On the other hand, we found AO1 at 0.0054 m to be five times above the background noise, resulting in a Ss of 1.44 × 10⁻⁶ ± 0.14 m−1, a value in agreement with our estimate from barometric efficiency.
2.7. Pressure State of the Aquifer System
Figure 11 also shows the earth tide response of well WSU5 (see Figure 6 for location) in Pullman. The amplitude of AO1 in this well was 7.0 × 10⁻⁵ m, 50 times smaller than the O1 amplitude in the DOE well. The amplitude AM2 was 6.4 × 10⁻⁵ m. The calculated Ss values from Equation (2) are 1.1 × 10⁻⁴ m−1 and 1.4 × 10⁻⁴ m−1 for the O1 and M2 harmonics respectively, far too large if the aquifer at this location is confined. Earth tides can occur in partially confined aquifers, and the strength of the response depends on the distance to the exposed phreatic water table [50]. The low tidal response of WSU5 compared to DOE is consistent with the idea that the primary aquifer system is unconfined at places near Pullman.
2.8. Storativity of the Aquifer System
Estimates of the storativity of the primary aquifer system based on previous well tests and ground water models in the Moscow-Pullman basin have ranged over six orders of magnitude (Figure 12). To better constrain this parameter, we made use of our estimates stated above of specific storage and effective thickness. In Moscow, where the aquifer system is clearly confined, these yield consistent values of specific storage of 1.5 × 10⁻⁶ ± 0.2 × 10⁻⁶ m−1. Multiplying the specific storage by the effective aquifer thickness of 100 m, we obtain a storativity of 1.5 × 10⁻⁴ ± 0.2 × 10⁻⁴, a value that falls in the range of previously determined storativity values from well tests (Figure 12).
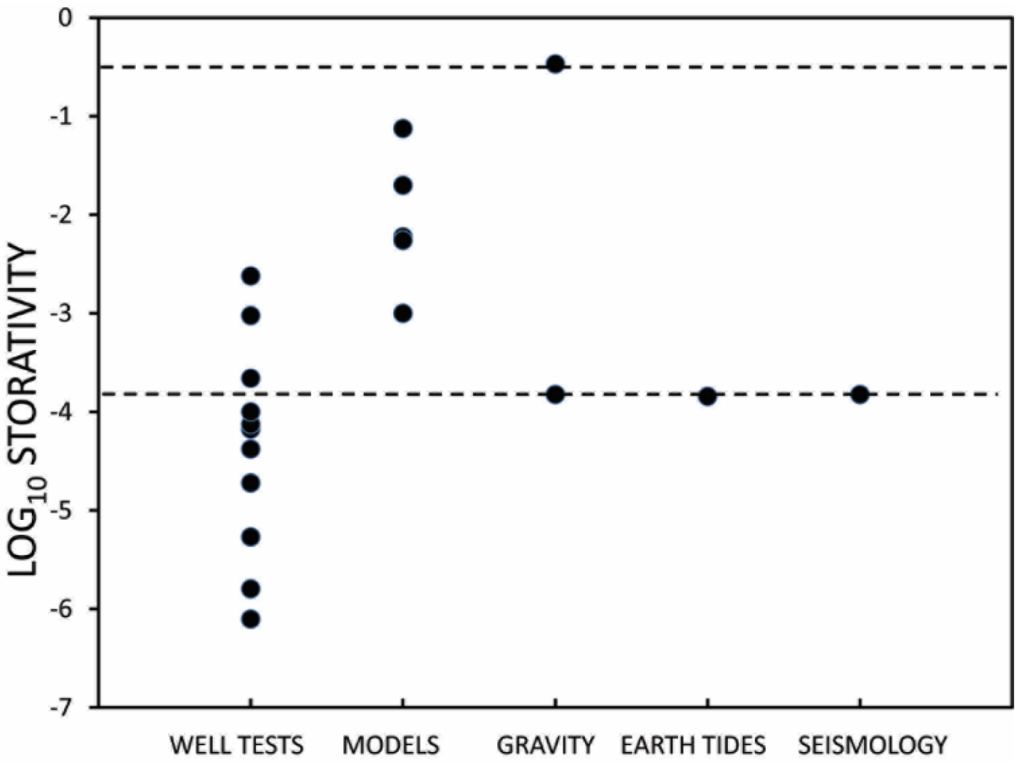
Figure 12.
Values of storativity found by previous well tests [43] and groundwater models [7,8,31,43] compared to the values found using three geophysical methods described in the text. The dashed lines show the preferred values for storativity found in this study. The upper line is for the unconfined areas of the aquifer system and the lower value is for the confined units.

In Pullman, where the aquifer system is apparently unconfined at places, we suggest that the annual decrease in water levels is the result of extraction of water from storage in the aquiferous intraflow units with a storativity equal to the specific yield, which would be about 0.35 based on the results above. As shown in Figure 12, this storativity for the unconfined areas is much higher than values used in previous groundwater models of the primary aquifer system.
In summary, where the aquifer is confined, the storativity was found to be near 1.5 × 10⁻⁴; where unconfined, 3.5 × 10⁻¹. Thus, for the same drop in hydraulic head, very little water is produced by water expansion from the confined units compared to the amount of water extracted from the unconfined area. For each m3 of water produced from the confined units by expansion, more than 350 m3 are extracted from storage in the uppermost unconfined aquiferous unit.
3. Synthesis with Pumpage and Records of Water Level Decline
3.1. Water Budget Model
The goal of this study was to employ geophysical methods to provide better estimates of certain parameters needed for future comprehensive groundwater models of the Moscow-Pullman basin. For the present study, however, we do employ a simple single cell model to test the sensitivity of the basin’s recharge budget to our parameters. Single cell models employ infinite transmissivity, but finite storativity, and are commonly used in economic hydrology [51]. On an annual basis, we treat the Moscow-Pullman basin as a single cell with boundary conditions such that:
where Vp in m3/year is the annual volume of water pumped; Vr in m3/year is the annual volume of water replenished from outside the cell; S is the dimensionless storativity of the cell; A is the area of the cell in m3; and Δh in m/year is the annual decline in water level. Two of the variables Vp and Δh in the above relation are well known from records kept by the Palouse Basin Aquifer Committee [6]. For the storativity and area of the cell, we use the estimates provided by the geophysical methods described above.
Vp = Vr + S A (Δh)
The annual volume of replenishment has two components: (1) that driven by Δh; and (2) that not directly associated with Δh [43]. In the first category are head-related changes in influx to the cell from the surrounding region. Also in this category are any changes in flux from overlying units due to the increased vertical hydraulic gradient. In the second category is decreased recharge due to depletion of the overlying hydraulically connected source (overlying leaky aquifers or surface streams). To better understand the effect a sustained drought may have on replenishment, it is useful to separate these two components. In our simple model, we employ a linear approximation such that:
where Sc in m2/year is an annual volume replenished per unit annual drop in head for head-related sources and V0 in m3/year is the volume of annual recharge not directly head-related. Combining the above two equations and taking into account the possibility that the aquifer is unconfined in places:
where S and Sy are the storativities and Ac and Au are the areas of the confined and unconfined portions, respectively. Thus, our simple model predicts a linear relationship between annual volume pumped and annual drop in water level, with an intercept equal to V0 and a slope associated with storativity, area, and head-related replenishment.
Vr = Sc Δh + V0
Vp = (Sc + S Ac + Sy Au) Δh + V0
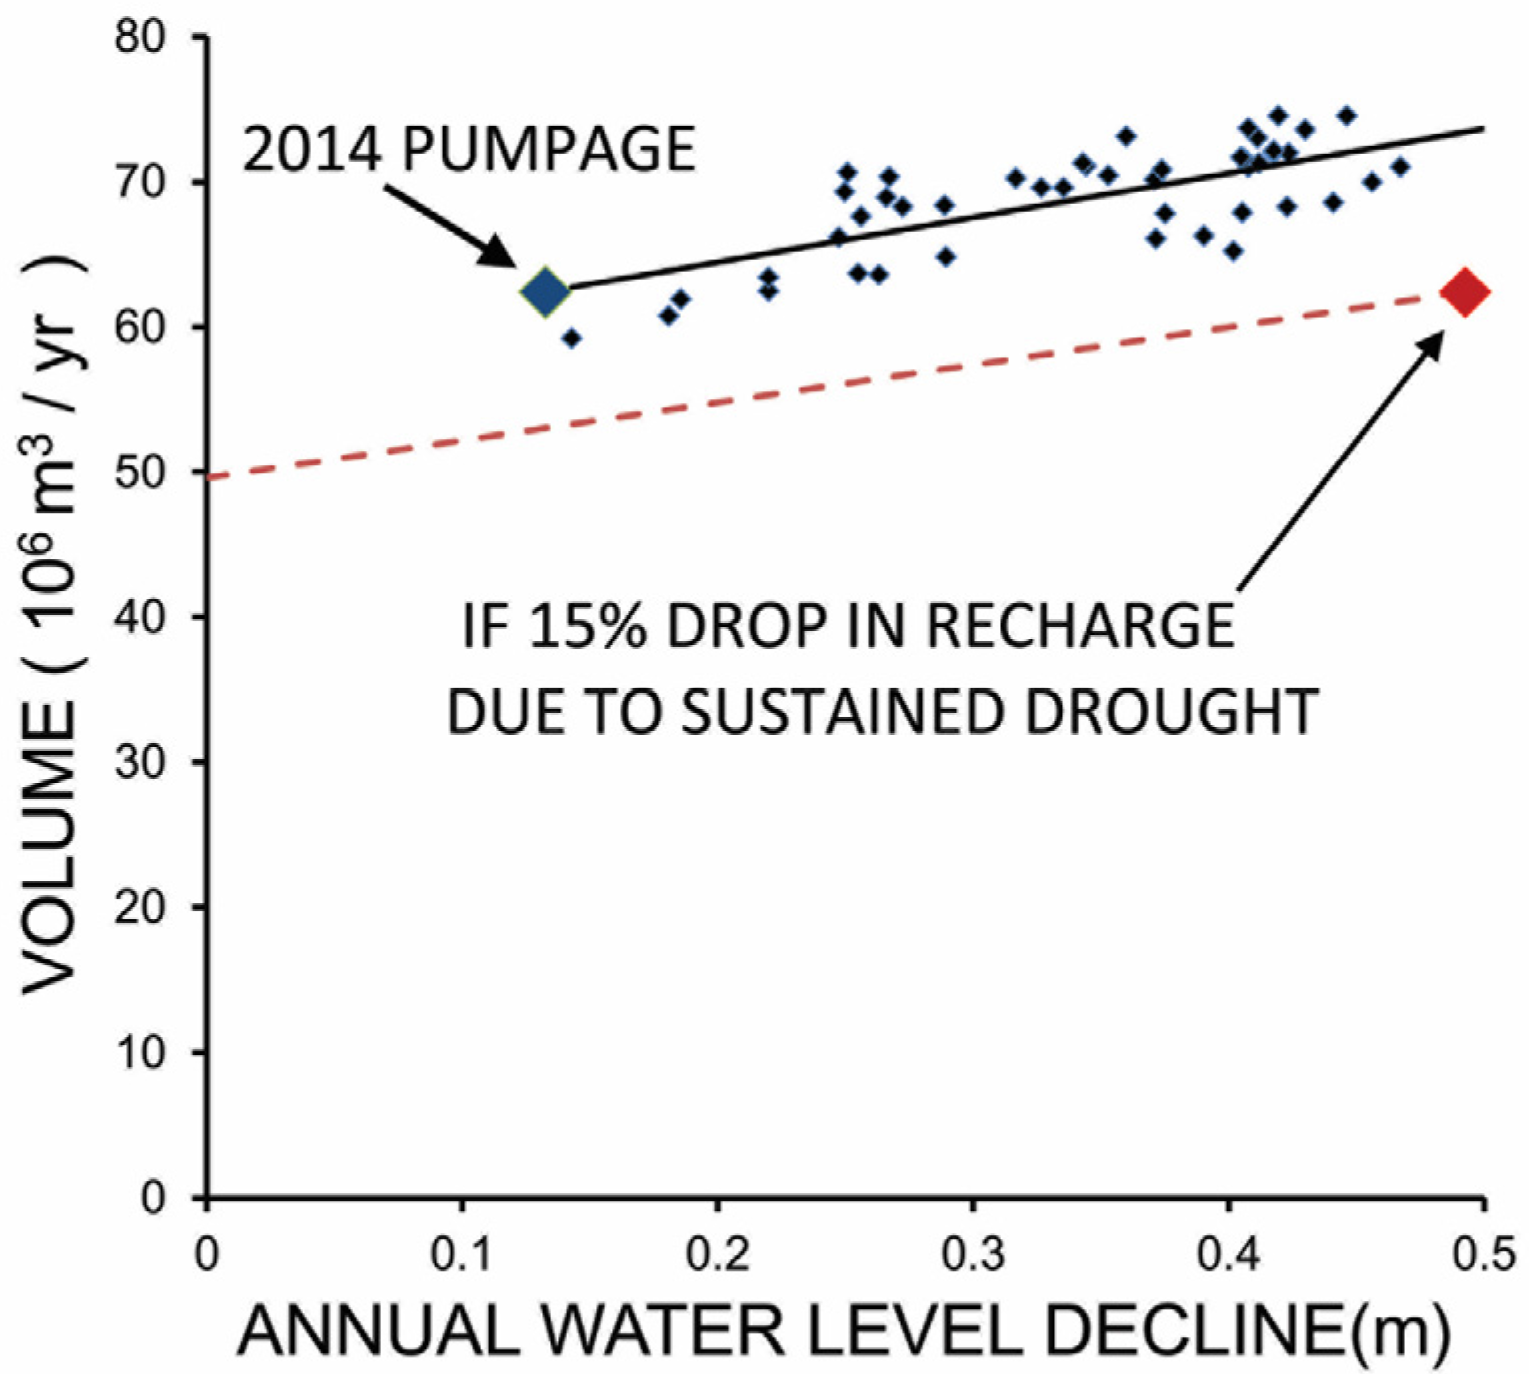
Figure 13 shows a cross-plot of annual water volume pumped as a function of annual drop in water level for the primary aquifer in the study area as provided by the Palouse basin Aquifer Committee [6]. The data points (modified from [32]) are for years 1968–2010. The solid line in the cross-plot is the best-fit line to the data. The correlation coefficient (r2) is 0.52, showing that the data can be reasonably fit by a straight line with slope of 30.6 × 10⁶ ± 4.4 × 10⁶ m and intercept of 58.34 × 10⁶ ± 1.55 × 10⁶ m3/year.

Figure 13.
Annual water level decline vs. pumped volume for the Grande Ronde aquifer system. The data points show the historic data since 1968 along with a best-fit line. The large blue diamond is the current state. The red dashed line is the predicted state of the aquifer system in the event of a sustained drought causing a 15% drop in recharge. The red diamond indicates the expected annual water level decline if the current pumpage is maintained during the drought.
3.2. Model Results
We can make several inferences from the simple model. All the parameters in Equation (5) controlling the slope of the best-fit line are not known, so we consider a number of possibilities.
First of all, we find that the water budget is relatively insensitive to the parameters which we have derived by the geophysical methods described above. Regardless of values used for storativity, aquifer area, or head-related replenishment, there is a large amount of annual recharge unrelated to head (V0 = 58.34 × 10⁶ ± 1.55 × 10⁶ m3/year), accounting for 93.5% ± 2.6% of the current pumped volume, but unfortunately not enough to stop long term-water level declines. It is clearly impossible to model the aquifer without invoking a considerable amount of annual recharge.
Second, if the primary aquifer is in fact confined everywhere, then, from our geophysical results above, we can set S = 1.5 × 10⁻⁴ ± 0.2 × 10⁻⁴ and Ac = 620 km2 in Equation (5), leading to Sc = 30.51 ± 0.01 m2/year, a result very insensitive to our uncertainty in storativity. In this scenario, only 0.02% of the current pumped volume of 62.4 m3/year, comes from storage. 6.5% comes from head-related replenishment, and the remainder from recharge. The relatively low percentage of head-related replenishment compared to recharge suggests that constant-head boundary conditions should be used with caution in future numerical models of the confined system. Also, the value of storativity in the confined system is unimportant and could be off by an order of magnitude without affecting the water balance by more than one per cent.
Third, if the primary aquifer is partly unconfined as the geophysical data suggest, we can estimate the maximum area of the phreatic water table. For this case, using our geophysical results, we can set S = 1.5 × 10⁻⁴ ± 0.2 × 10⁻⁴, Sy = 0.355 ± 0.04, Sc = 0, Ac = 620 km2 Au, leading to an Au of at most 86 ± 8 km2 or 14% of the area of the Moscow-Pullman basin. Under this scenario, 6.5% of the current water being pumped comes from storage. Recharge accounts for 58.3 × 10⁶ m3/year, independent of head; the remaining 3.1 × 10⁶ m3/year of the water pumped is produced from storage almost entirely by gravity drainage of the uppermost aquiferous unit. In future models involving a phreatic water table, specific yield does become a relevant parameter, but, nonetheless, a very small contributor compared to recharge.
Fourth, the actual situation could well be a combination of the previous two scenarios, with a phreatic water surface over a smaller area releasing water from storage along with the drop in head inducing more recharge into the deeper aquifer systems from overlying units or decreasing the flux out of the study area to the west. However, these effects on a numerical model will all still be minor compared to head-unrelated recharge.
Finally, we can use our simple model to predict the response of the primary aquifer to a sustained drought (Figure 13). If we assume for example, that annual replenishment to the aquifer system is reduced by 15% as a result of an episode of continued low annual precipitation, the model shows that the annual water level decline would increase four-fold over the current value if current levels of pumpage were maintained.
4. Conclusions
This study clarifies a number of issues about the primary aquifer system within the Palouse basin and should lead to better numerical groundwater models, and more rational planning for the future not only for this aquifer system but for any CRBG aquifer should the 21st century prove to be as dry as predicted. The storativity of the deeper aquiferous basalt intraflow units is, in fact low, 1.5 × 10⁻⁴, a value within the range of the many well tests that have taken place, but an order of magnitude or more below the values used for these units in previous groundwater models of the aquifer system. While the primary aquifer system is generally confined, in the vicinity of Pullman it is apparently unconfined with a phreatic water table and a storativity of 0.35, a value far higher than that used in previous groundwater models. Thus, the water that is derived from storage throughout the basin is at a cost of the lowering of the phreatic water table near Pullman and a general depressurization of the primary aquifer system throughout the Moscow-Pullman basin.
The derived values of aquifer thickness, area, and storativity derived from geophysical methods in this study will improve future groundwater models of the primary aquifer, but they will have only a second-order effect. The first order unknown is recharge. Although the mechanism remains elusive, currently more than 90% of the water pumped annually is replenished by recharge unrelated to head. Should that replenishment be halted by a prolonged drought, water level decline would accelerate. Furthermore, if the aquifer system is in fact, partially unconfined, water level drops may be sudden as the phreatic table encounters different units at depth. There is no guarantee that the primary aquifer system would continue to operate as a unified system as horizontal intraflow pathways get cut off as water levels decline.
Current studies of possible recharge galleries for the Moscow-Pullman basin are focused on the eastern side of the basin in hopes of recharging, not the primary aquifer system, but the overlying Wanapum system [27]. But this system provides only 10% of the net water supply, mostly in Moscow, and it is not clear that replenishing the Wanapum in Moscow will affect the primary aquifer. The geophysical results presented here suggest that the most logical location for future recharge galleries may be in the Pullman vicinity where the primary aquifer system appears to be unconfined and where its phreatic groundwater table is shallow. Two tributaries of the Palouse River have a confluence at Pullman. Redirecting the spring runoff in those tributaries into the aquifer system could restore historical water levels at Pullman and re-pressurize the confined units throughout the Moscow-Pullman basin.
Acknowledgments
We thank Steve Robischon and the Palouse Basin Aquifer Committee for providing much of the hydrological data used in this paper; and John Bush, Dean Garwood, and the Idaho Geological survey for providing geological data. Comments by three anonymous reviewers have greatly improved this manuscript.
Conflicts of Interest
The authors declare no conflict of interest.
References
- U.S. Geological Survey. Ground-Water Availability Assessment for the Columbia Plateau Regional Aquifer System, Washington, Oregon, and Idaho; 2008. Available online: http://pubs.usgs.gov/fs/2008/3086/ (accessed on 22 July 2015).
- Cook, B.I.; Ault, T.R.; Smerdon, J.E. Unprecedented 21st century drought risk in the American Southwest and Central Plains. Sci. Adv. 2015, 1. [Google Scholar] [CrossRef]
- Woodhouse, C.A.; Meko, D.M.; MacDonald, G.M.; Stahle, D.W.; Cook, E.R.A. 1200-year perspective of 21st century drought in southwestern North America. Proc. Natl. Acad. Sci. USA 2010, 107, 21283–21288. [Google Scholar] [CrossRef] [PubMed]
- Pederson, G.T.; Gray, S.T.; Woodhouse, C.A.; Betancourt, J.L.; Fagre, D.B.; Littell, J.S.; Graumlich, L.J. The unusual nature of recent snowpack declines in the North American Cordillera. Science 2011, 333, 332–335. [Google Scholar] [CrossRef] [PubMed]
- Vaccaro, J.J. Potential impacts of climate change on groundwater resources of the Columbia River basin. In Proceedings of the Pacific Northwest Science Conference, Portland, OR, USA, 16 June 2010; pp. 1–18.
- Palouse Basin Aquifer Committee, 2013. Available online: http://www.webpages.uidaho.edu/pbac/ (accessed on 27 February 2015).
- Barker, R.A. Computer simulation and geohydrology of a basalt aquifer system in the Pullman-Moscow basin, Washington and Idaho. Available online: https://fortress.wa.gov/ecy/publications/documents/wsb48 (accessed on 22 July 2015).
- Lum, W.E.; Smoot, J.L.; Ralston, D.R. Geohydrology and numerical model analysis of ground-water flow in the Pullman-Moscow area, Washington and Idaho. Available online: http://pubs.usgs.gov/wri/1989/4103/report.pdf (accessed on 22 July 2015).
- Bauer, H.H.; Hansen, A.J. Hydrogeology of the Columbia Plateau regional aquifer system, Washington, Oregon, and Idaho. Available online: http://pubs.usgs.gov/wri/1996/4106/report.pdf (accessed on 22 July 2015).
- Kahle, S.C.; Olsen, T.D.; Morgan, D.S. Geologic setting and hydrogeologic units of the Columbia Plateau Regional Aquifer System, Washington, Oregon, and Idaho. Available online: http://pubs.usgs.gov/sim/3088/pdf/sim3088.pdf (accessed on 22 July 2015).
- Burns, E.R.; Snyder, D.T.; Haynes, J.V.; Waibel, M.S. Groundwater status and trends for the Columbia Plateau Regional Aquifer System, Washington, Oregon, and Idaho. Available online: http://pubs.er.usgs.gov/publication/sir20125261 (accessed on 22 July 2015).
- U.S. Department of Energy. Site characterization plan, Reference Repository Location, Hanford Site, Washington-consultation draft; Office of Civilian Radioactive Waste Management: Washington, DC, USA, 1988.
- Reidel, S.P.; Fecht, K.R.; Hagood, M.C.; Tolan, T.L. The geologic evolution of the central Columbia Plateau. In Volcanism and Tectonism in the Columbia River flood-Basalt Province; Reidel, S.P., Hooper, P.R., Eds.; Geological Society of America: Washington, DC, USA, 1989. [Google Scholar]
- Drost, B.W.; Whiteman, K.J. Surficial geology, structure, and thickness of selected geohydrologic units in the Columbia Plateau, Washington. Available online: http://pubs.usgs.gov/wri/1984/4326/report.pdf (accessed on 22 July 2015).
- Drost, B.W.; Whiteman, K.J.; Gonthier, J.B. Geologic Framework of the Columbia Plateau Aquifer System, Washington, Oregon, and Idaho. Available online: http://pubs.usgs.gov/wri/1987/4238/report.pdf (accessed on 22 July 2015).
- Steinkampf, W.C.; Hearn, P.P., Jr. Ground-Water Geochemistry of the Columbia Plateau Aquifer System, Washington, Oregon, and Idaho. Available online: http://pubs.usgs.gov/of/1995/0467/report.pdf (accessed on 22 July 2015).
- Vaccaro, J.J. Summary of the Columbia Plateau Regional Aquifer-System Analysis, Washington, Oregon, Idaho. Available online: http://pubs.usgs.gov/pp/1413a/report.pdf (accessed on 22 July 2015).
- Tolan, T.; Lindsey, K.; Porcello, J. A Summary of Columbia River Basalt Group Physical Geology and its Influence on the Hydrogeology of the Columbia River Basalt Aquifer System: Columbia Basin Ground Water Management Area of Adams, Franklin, Grant, and Lincoln Counties, 2009. Available online: http://www.cbgwma.org/pdf/GWMA_Geology-Hydrogeology%20of%20CRBG_TEXT_June%202009.pdf (accessed on 27 February 2015).
- McNab, W.H.; Avers, P.E. Ecological Subregions of the United States. 1996. Available online: http://www.fs.fed.us/land/pubs/ecoregions/ (accessed on 22 July 2015).
- Leek, F. Hydrogeological Characterization of the Palouse Basin Basalt Aquifer System, Washington and Idaho; Washington State University: Pullman, WA, USA, 2006. [Google Scholar]
- Hopster, D. A Recession Analysis of Springs and Streams in the Moscow-Pullman Basin; University of Idaho: Moscow, ID, USA, 2003. [Google Scholar]
- Walters, K.L.; Glancy, P.A. Reconnaissance of Geology and of Ground-Water Occurrences and Development in Whitman County, Washington. Water-Supply Bulletin 26; 1969. Available online: https://fortress.wa.gov/ecy/publications/documents/wsb26.pdf (accessed on 22 July 2015). [Google Scholar]
- Crosby, J.W., III; Chatters, R.M. Water Dating Techniques as Applied to the Pullman-Moscow Ground-Water Basin; Washington State University: Pullman, WA, USA, 1965. [Google Scholar]
- Larson, K.R. Stable Isotopes in the Pullman-Moscow Basin, Eastern Washington and North Idaho: Implications for the Timing, Magnitude, and Distribution of Groundwater Recharge; Washington State University: Pullman, WA, USA, 1997. [Google Scholar]
- Douglas, A.A. Radiocarbon Dating as a Tool for Hydrogeological Investigations in the Palouse Basin; University of Idaho: Moscow, ID, USA, 2004; Available online: http://www.webpages.uidaho.edu/pbac/Theses/Douglas_Thesis_Age_Dating_2004.pdf (accessed on 22 July 2015).
- Carey, L.R. Evaluation of Oxygen and Hydrogen Isotopes in Groundwater of the Palouse Basin and Moscow Sub-Basin; University of Idaho: Moscow, ID, USA, 2011. [Google Scholar]
- Fairley, J.P.; Solomon, M.D.; Hinds, J.J.; Grader, G.W.; Bush, J.H.; Rand, A.L. Latah County Hydrologic Characterization Report. Available online: http://www.researchgate.net/publication/262260160_Latah_County_Hydrogeological_Characterization (accessed on 22 July 2015).
- MacQueen, J.D.; Mann, E. Borehole Gravity Meter Surveys at the Waste Treatment Plant, Hanford, Washington. Available online: http://www.pnl.gov/main/publications/external/technical_reports/PNNL-16490.pdf (accessed on 22 July 2015).
- Moisy, F. Discover Ezyfit: A Free Curve Fitting Toolbox for Matlab. Available online: http://www.mathworks.com/matlabcentral/fileexchange/10176-ezyfit-2-40/content/ezyfit/demo/html/efdemo.html#1 (accessed on 27 February 2015).
- Hyndman, R.D.; Drury, M.J. Physical properties of basalts, gabbros, and ultramafic rocks from DSDP Leg 37. DSDP 1977, 37, 395–401. [Google Scholar]
- Smoot, J.L.; Ralston, D.R. Hydrogeology and Mathematical Model of Ground-Water Flow in the Pullman-Moscow Region, Washington and Idaho; Idaho Water Resources Research Institute, University of Idaho: Moscow, ID, USA, 1987; Available online: http://digital.lib.uidaho.edu/cdm/ref/collection/idahowater/id/310 (accessed on 22 July 2015).
- Moran, K. Evaluation of the relationship between pumping and water level declines in the Grande Ronde Aquifer of the Palouse Basin. Available online: http://www.webpages.uidaho.edu/pbac/Presentations/2011/110915_Moran_WL_Pumping_Relationships_report.pdf (accessed on 22 July 2015).
- Foxworthy, B.L.; Washburn, R.L. Ground Water in the Pullman Area, Whitman County, Washington; Geological Survey Water-Supply Paper 1655; 1963. Available online: http://pubs.usgs.gov/wsp/1655/report.pdf (accessed on 22 July 2015).
- Brown, J.C. Well Construction and Stratigraphic Information: Pullman Test and Observation Well, Pullman, Washington; Washington State University: Pullman, WA, USA, 1976; pp. 1–35. [Google Scholar]
- Teasdale, E.W. Hydrogeologic Basins in the Palouse Area of Idaho and Washington; University of Idaho: Moscow, ID, USA, 2002. [Google Scholar]
- Bush, J.H.; Garwood, D.L. Interpretation and use of well data in the Columbia River Basalt Group, Pullman, Washington. In Proceedings of 2003 Seattle Annual Meeting, Seattle, WA, USA, 2–5 November 2003.
- Bush, J.H. The Columbia River Basalt Group of the Palouse Basin with Hydrological Interpretations, western Latah County, Idaho and eastern Whitman County, Washington; Report to Palouse Basin Aquifer Committee: Moscow, ID, USA, 2005. [Google Scholar]
- Klein, D.P.; Sneddon, R.A.; Smoot, J.L. Magnetotelluric study of the thickness of volcanic and sedimentary rock in the Pullman-Moscow Basin of eastern Washington. Available online: http://pubs.usgs.gov/of/1987/0140/report.pdf (accessed on 22 July 2015).
- Holom, D. Ground Water Flow Conditions Related to the Pre-Basalt Basement Geometry Delineated by Gravity Measurements near Kamiak Butte, Eastern Washington; University of Idaho: Moscow, ID, USA, 2006. [Google Scholar]
- Conrey, R.; Beard, C.; Wolff, J. Columbia River Basalt flow stratigraphy in the Palouse Basin Department of Ecology test wells. Available online: http://www.webpages.uidaho.edu/pbac/pubs/2013_Conrey_Beard_Stratigraphy_in_Palouse_Basin_DOE_test_Wells.pdf (accessed on 22 July 2015).
- Ryan, W.B.F.; Carbotte, S.M.; Coplan, J.O.; O’Hara, S.; Melkonian, A.; Arko, R.; Weissel, R.A.; Ferrini, V.; Goodwillie, A.; Nitsche, F.; et al. Global Multi-Resolution Topography synthesis. Geochem. Geophys. Geosyst. 2009, 10. [Google Scholar] [CrossRef]
- Ducar, S. Properties of the Grande Ronde Aquifer in the Vicinity of Moscow, Idaho from the Synthesis of Aquifer Test Results with Seismic Groundwater Response; Department of Geological Science, University of Idaho: Moscow, ID, USA, 2014. [Google Scholar]
- Moran, K. Interpretation of Long-Term Grande Ronde Aquifer Testing in the Palouse Basin of Idaho and Washington; University of Idaho: Moscow, ID, USA, 2011. [Google Scholar]
- Sokol, D. Interpretation of short term water level fluctuations in the Moscow Basin, Latah County, Idaho. Pamphlet No. 137. 1966. Available online: http://www.idahogeology.org/PDF/Pamphlets_(P)/P-137.pdf (accessed on 22 July 2015).
- Cooper, H.H.; Bredehoeft, J.D.; Papadopulos, I.S.; Bennett, R.R. The response of well-aquifer systems to seismic waves. J. Geophys. Res. 1965, 70, 3915–3926. [Google Scholar] [CrossRef]
- Bredehoeft, J.D. Response of well-aquifer systems to earth tides. J. Geophys. Res. 1967, 72, 3075–3087. [Google Scholar] [CrossRef]
- Shih, D.C.F. Storage in confined aquifer: Spectral analysis of groundwater responses to seismic Rayleigh waves. J. Hydrol. 2009, 374, 83–91. [Google Scholar] [CrossRef]
- Folnagy, A.J.; Osiensky, J.L.; Kobayashi, D.; Sprenke, K.F. Specific storage from sparse records of groundwater response to seismic waves. J. Hydrol. 2013, 503, 22–28. [Google Scholar] [CrossRef]
- Merritt, M.L. Estimating Hydraulic Properties of the Floridan Aquifer System by Analysis of Earth-Tide, Ocean-Tide, and Barometric Effects, Collier and Hendry Counties, Florida. Available online: http://pubs.usgs.gov/wri/wri034267/wri03_4267.pdf (accessed on 22 July 2015).
- Rojstaczer, S.; Riley, F.S. Response of the water level in a well to earth tides and atmospheric loading under unconfined conditions. Water Resour. Res. 1990, 26, 1803–1817. [Google Scholar] [CrossRef]
- Brown, G.; Deacon, R. Economic optimization of a single-cell aquifer. Water Resour. Res. 1972, 8, 557–564. [Google Scholar] [CrossRef]
© 2015 by the authors; licensee MDPI, Basel, Switzerland. This article is an open access article distributed under the terms and conditions of the Creative Commons Attribution license (http://creativecommons.org/licenses/by/4.0/).