


Highlights
- Spatial–temporal LULC change causes a 46% decline in ecosystem services values (ESVs) in critical watersheds.
- Spatial Benefit Transfer (SBT), which integrates biophysical and socio-economic indicators, improves multi-scale ESV estimation accuracy.
- The SBT method demonstrates a strong capability for capturing the spatial heterogeneity of ESVs across multiple scales.
- Multi-scenario modelling provides evidence-based guidance for ecosystem-based watershed planning and management.
Abstract
Rapid land use and land cover (LULC) changes in densely populated watersheds pose serious challenges to the sustainability of ecosystem services (ES), yet their spatially explicit economic consequences remain insufficiently understood. This study analyzes the spatio-temporal dynamics of LULC and ecosystem service values (ESVs) in the Citarum Watershed, Indonesia, one of the country’s most critical and intensively transformed watersheds. Multi-temporal Landsat imagery from 2003, 2013, and 2023 was classified using a Random Forest algorithm, while future LULC conditions for 2043 were projected using a Multi-layer Perceptron–Markov Chain (MLP–MC) model under three scenarios: Business-as-Usual (BAU), Protecting Paddy Field (PPF), and Protecting Forest Area (PFA). ESVs were quantified at multiple spatial scales (county, 250 m grids, and 100 m grids) using both the Traditional Benefit Transfer (TBT) method and a Spatial Benefit Transfer (SBT) approach that integrates biophysical indicators with socio-economic variables. The contribution of LULC transitions to ESV dynamics was further assessed using the Ecosystem Service Change Intensity (ESCI) index. The results reveal substantial historical forest and shrubland losses, alongside rapid expansion of settlements and dryland agriculture, indicating intensifying anthropogenic pressure on watershed functions. Scenario analysis shows continued degradation under BAU, limited mitigation under PPF, and improved forest retention under PFA; although settlement expansion persists across all scenarios. Total ESV declined from USD 2641.33 million in 2003 to USD 1585.01 million in 2023, representing a cumulative loss of 46.13%. Projections indicate severe ESV losses under BAU and PPF by 2043, while PFA substantially reduces, but does not eliminate economic degradation. ESCI results identify forest and shrubland conversion to settlements and dryland agriculture as the dominant drivers of ESV decline. These findings demonstrate that integrating multi-scenario LULC modeling with spatially explicit ESV assessment provides a more robust basis for ecosystem-based spatial planning and supports sustainable watershed management under increasing development pressure.
1. Introduction
LULC is a critical component of environmental management, influencing human well-being, climate change, ecological processes, and ecosystem services. Changes in LULC often result from anthropogenic activities, industrial development, and agricultural expansions [1]. These changes can impact various environmental problems, such as habitat loss [2], decreasing ecosystem services [3,4], climate-regulating ecosystem service changes [5], land degradation [6], and increased vulnerability to disasters [7]. Thus, understanding LULC changes is essential for sustainable land management practice and predicting future scenarios in watershed environments.
Simulations of LULC change have evolved significantly, with widely used models being developed, such as Cellular Automata (CA), Markov [8], Land Change Modeler (LCM) [9], and System Dynamics (SD) [10]. These models have been employed to assess deforestation, food security [6], and ecosystem service values (ESVs) [11]. Predictive LULC modeling is particularly important in critical river basins such as the Citarum Watershed, where increasing land pressure threatens ecological sustainability.
Deep learning (DL) methods have developed rapidly and become a key tool for LULC mapping [12]. DL methods have emerged as the most advanced approaches and outperform traditional machine learning methods in handling complex spatial and spectral patterns in satellite imagery [13]. Unlike traditional machine learning algorithms such as Random Forests (RF) and Support Vector Machines (SVM), DL models (including convolutional neural networks, CNNs) can automatically extract hierarchical spatial–spectral features from remote sensing imagery, resulting in significant improvements in classification accuracy across diverse landscapes [14]. However, DL approaches require large training data volumes, substantial computational effort, and complex model calibration, which may limit their application in multi-temporal, watershed-scale, and scenario-based studies of imagery [13]. In this context, this study chose to use the RF model due to limitations in data availability, computational feasibility, and watershed-scale studies.
Valuing ESs in monetary terms can bridge economic and conservation perspectives, making it more accessible for decision-makers in planning, ecological control, and ecosystem restoration [15]. Spatial ESVs can describe the spatial and temporal evolution of ES, resulting in a more accurate assessment of ESV at each different location. The Benefit Transfer Method (BTM) is a common approach for assessing ESV, transferring economic values from a reference site to a study site [16]. The BTM has been used to estimate the value of ESs provided by wetlands [17]. This method assumes the uniformity of the ESV of the economy within an administrative area, as it primarily references global ecosystem characteristics represented by LULC. BTM is particularly useful when primary ES assessment studies are constrained by time or resources [18].
The Citarum Watershed plays a strategic role as a primary source of domestic water supply, irrigation, hydroelectric power generation, and industrial activities for millions of people in West Java and Jakarta [19]. Socio-economic development within the Jakarta–Bandung Mega Urban Region, which includes the Citarum Watershed, has accelerated urban expansion and reduced natural LULC areas, leading to environmental degradation and anthropogenic disasters [20]. The impacts of LULC change in the Citarum Watershed include flooding and sedimentation [21], as well as increased erosion and sedimentation rates that adversely affect hydroelectric power generation [22] and the watershed’s ecological carrying capacity [23]. As a result, the Citarum Watershed is classified as one of Indonesia’s 108 critical watersheds [23]. These cumulative pressures have driven pronounced land use/land cover transitions, making the basin particularly suitable for analyzing LULC-induced ecosystem service degradation and its associated trade-offs.
In contrast to earlier studies that primarily examined LULC extent or assessed ecosystem services from a purely economic perspective, this research advances an integrated framework by coupling MLP–Markov Chain (MLP–MC) scenarios to project future LULC dynamics while explicitly accounting for both biophysical and socio-economic heterogeneity. Furthermore, the impacts of LULC transitions on ESV are quantified using the Ecosystem Service Change Intensity (ESCI), enabling a more holistic valuation approach.
Despite growing interest in ecosystem service valuation, the spatial heterogeneity of economic ESV remains insufficiently explored and is often addressed in a fragmented manner. In particular, the development of equivalent coefficients that reflect local LULC characteristics and socio-economic conditions at the study-area scale is still limited. Most previous research has emphasized biophysical changes alone, with relatively few studies incorporating multi-scale spatial resolution and scenario-based projections of future ecosystem service trajectories [24,25]. Moreover, integrating key biophysical indicators—such as Normalized Difference Vegetation Index (NDVI), water yield (WY), carbon storage (CS), and soil conservation (SC)—together with socio-economic variables, including regional minimum wage (RMW) and gross regional domestic product (GRDP), is essential to more accurately capture real-world spatiotemporal variations in ESV. To address these gaps, this study applies a spatial modeling framework that jointly links LULC change prediction with multi-scale economic valuation of ecosystem services.
The assessment of ESV increasingly demands the integration of multiple spatial resolutions, as scale dependency profoundly shapes ecological analyses and can introduce the modifiable areal unit problem (MAUP) that distorts service availability and demand estimates [26]. Advances in remote sensing now enable high-resolution, multi-source mapping that captures the temporal dynamics of ESs. Even small LULC changes can significantly alter service provision [27]. High-resolution analyses have also revealed trade-offs and synergies among various urban services [28], whereas neglecting scale mismatches can undermine conservation efficacy [29]. The appropriate scaling is critical for accurate ESV mapping across diverse landscapes [30].
This study investigates the spatiotemporal dynamics of LULC change and the projected impacts of alternative future LULC scenarios on ESVs in the Citarum Watershed. Accordingly, the study addresses the following research questions:
- How have LULC patterns in the Citarum Watershed changed over the periods of 2003–2013 and 2013–2023, and what are the projected LULC configurations for 2043 under the Business-as-Usual (BAU), Protecting Paddy Field (PPF), and Protecting Forest Area (PFA) scenarios?
- What are the spatial and temporal variations in ESV under the observed LULC conditions and under each of the three future land-use scenarios?
- To what extent do historical and projected LULC changes influence the magnitude and spatial distribution of ESVs in the Citarum Watershed?
The answers to these questions are expected to provide an empirical basis for ecosystem service-based watershed management and to inform sustainable land-use planning in the Citarum Watershed and comparable watershed systems globally.
2. Materials and Methods
2.1. Study Area
The research was conducted in the Citarum watershed, Indonesia (Figure 1). The watershed is spread throughout eight regencies in West Java Province and covers approximately 690,916 ha. Geographically, the watershed is located between 7°15′3″ and 5°54′11″ S in latitude and between 106°56′31″ and 107°58′33″ E in longitude.
Figure 1.
Location and overview of the Citarum Watershed, West Java.
The Citarum Watershed is characterized by strong topographic and climatic gradients, with annual rainfall averaging approximately 2358 mm across the basin, while upstream mountainous areas receive up to 4000 mm per year. This pronounced rainfall heterogeneity influences hydrological processes, land use suitability, and ecosystem service provision across the watershed, particularly with respect to water regulation and erosion control services.
The Citarum Watershed is spatially classified into three segments according to geomorphological characteristics, namely the upstream, midstream, and downstream regions. The upstream area is located in a volcanic formation, which is a mountainous area (750–2600 m above sea level/m asl) [31]. This sub-watershed is dominated by Latosol, Andosol, and Regosol soil types [32], with an average annual rainfall of 4000 mm and a minimum temperature of 15.3 °C. The middle sub-watershed is located in a volcanic formation with an elevation ranging from 200 m to 800 m asl. This sub-watershed has a range of temperatures spanning from 15.3 °C to 27 °C, while yearly precipitation varies from 1000 mm to 4000 mm. The downstream sub-watershed is a flat and low area located at an altitude of 1 m to 200 m asl. This sub-watershed is located on Alluvial, Entisol, and Inceptisol soil types [31] with an average annual rainfall of 1000 mm and a minimum temperature of 27 °C.
2.2. Data Sources
This study integrates multi-source spatial and socio-economic data to analyze LULC dynamics and ESVs in the Citarum Watershed. Remote sensing data were used to derive multi-temporal LULC maps and biophysical indicators, ancillary geospatial datasets supported the identification of LULC driving factors and scenario-based projections, and socio-economic statistics were incorporated to refine ecosystem service valuation. Detailed information on data sources, temporal coverage, spatial resolution, and processing platforms is provided in Supplementary Table S1, while a summary is presented in Table 1. Various software tools were utilized for data processing in this study, including Google earth engine (GEE), ArcGIS 10.8 [33,34], and Terrset 2020.
Table 1.
Data sources and inputs used for LULC classification, scenario formulation, and ecosystem service value assessment.
2.3. Research Methodology
The research consists of three stages: (1) mapping multi-temporal LULC and generating predictions for 2043; (2) estimating ESV using traditional benefit transfer (TBT) and the spatial benefit transfer (SBT); and (3) assessing the contribution of LULC changes to ES economic value dynamics. A recapitulation of the research methods is displayed in Figure 2.
Figure 2.
Analysis of LULC change and ESV assessment.
2.3.1. Mapping of Multi-Year LULC Dynamic and Prediction 2043
The initial stage involved analyzing multi-temporal Landsat imagery for 2003, 2013, and 2023 to create LULC maps. The Google Earth Engine (GEE) platform was utilized to acquire cloud-free satellite imagery by compositing all images within a year, resulting in cleaner annual Landsat composites. The Landsat dataset consisted of surface reflectance that was atmospherically corrected using the Landsat Ecosystem Disturbance Adaptive Processing System (LEDAPS) algorithm [33]. Subsequently, pixels in the Landsat imagery were classified into LULC classes using a supervised classification approach with the Random Forest (RF) algorithm in GEE. LULC classification in this study adhered to standards issued by the Indonesian National Standardization Agency (2010). There are eight LULC classes analyzed in this study, i.e., (1) forest (FRT), (2) shrubland (SHB), (3) estate plantation (EP), (4) water body (WB), (5) dryland farming (DLF), (6) paddy field (PF), (7) fishpond (PND), and (8) settlement area (SA).
The identification of driving factors influencing LULC changes within the watershed was informed by previous studies. Commonly applied driving variables include slope, elevation, and distance to rivers, which have been shown to significantly affect LULC dynamics [35]. Similarly, [6,36] employed five driving factors: elevation, slope, aspect, distance to roads, and soil type in their LULC analysis. Based on insights from these studies and the specific characteristics of the study area, this research incorporates six driving factors in the LULC prediction model: elevation, slope, distance to roads, distance to rivers, distance to settlement areas, and population density. These variables are consistently applied in both the model implementation and the spatial layers presented in Supplementary Figure S1.
The topographic maps at a 1:25,000 scale [37], i.e., road networks and river networks, were incorporated into ArcGIS to generate a distance-from-roads map and a distance-from-rivers map through buffer analysis. The Indonesian Digital Elevation Model (DEM-NAS) was used to develop an elevation map and a slope map via surface analysis. Meanwhile, the distance-to-settlement map was computed using buffer analysis based on the distribution of settlement areas in the LULC map. The LULC classification results and six driving factors were then exported into the TerrSet software for LULC change prediction and simulation [4].
LULC classification was conducted using an RF classifier implemented in GEE. The RF model was configured with 500 decision trees, a setting chosen to ensure model stability while avoiding overfitting. Predictor variables included Landsat surface reflectance spectral bands 1 to 7, complemented by the NDVI and the Soil-Adjusted Vegetation Index (SAVI) to improve the differentiation of vegetated and semi-vegetated LULC classes. Training and validation samples were generated through stratified random sampling across all land cover classes, with reference labels derived from visual interpretation of high-resolution imagery in Google Earth Pro. Classification accuracy was assessed using standard confusion matrix metrics, including overall accuracy (OA), producer’s accuracy (PA), and user’s accuracy (UA) as presented in Table 2.
Table 2.
LULC classes used in the RF classification.
Future LULC projections were generated using the MLP-MC model implemented in TerrSet under three alternative scenarios representing distinct land management pathways. The Business-as-Usual (BAU) scenario applies Markov transition probabilities estimated from observed LULC changes from 2003 to 2023, assuming that historical transition dynamics continue unchanged into the future. Under this scenario, drivers are treated as static, and no additional spatial constraints or policy interventions are imposed beyond those implicit in the historical transition matrix.
The Protecting Paddy Field (PPF) scenario prioritizes the persistence of agricultural land by fixing forest extent at 111,240 ha and constraining conversions of paddy fields to non-agricultural uses. This scenario reflects agricultural land protection policies aimed at maintaining food production capacity while accommodating limited development elsewhere in the watershed. The Protecting Forest Area (PFA) scenario introduces a spatial constraint mask that restricts forest-to-nonforest transitions within designated protection zones. In this scenario, a forest protection area of 150,458 ha is enforced using a TerrSet constraint mask, effectively limiting deforestation in ecologically sensitive and upstream areas while allowing transitions to occur outside protected zones.
2.3.2. ESV Calculation Using Spatial Benefit Transfer Method
This research estimates the economic value of ESs by applying both the TBT method and the SBT method developed in this study. The estimation of ESV was based on previous research, utilizing reference annual ESV coefficients (VCij) for different ES functions associated with specific LULC categories (USD ha−1 year−1), which are summarized in Supplementary Table S2 [11]. In this case, each LULC type is considered an ecosystem type. Thus, there are seven ecosystem types and eight ES functions considered in this study. The TBT method calculates the total ESV using Equation (1) for three different spatial scales: (1) county level, (2) 250 m × 250 m, and (3) 100 m × 100 m.
where ESVtot_TBT is the total ESV based on the TBT method (USD year−1), Ai is the total area of each ecosystem (ha) according to LULC type i (i = 1, 2, 3, …, 7), and VCij is the reference annual ESV coefficient (USD ha−1 year−1) for ecosystem type i and ES function j (j = 1, 2, 3, …, 8).
In this study, the SBT framework was built upon the correction factor model proposed by [38,39] to refine the valuation of ESs. To address the spatial heterogeneity of ES functions across different LULC types and enhance the accuracy of ESV estimation, correction factors were applied based on regional conditions. The SBT method adjusts the baseline/reference annual ESV coefficient (VCij in Supplementary Table S2) by incorporating six correcting indicators (CI), i.e., four biophysical indicators (BI) and two socio-economic indicators (SI). The four BIs are (1) NDVI, (2) CS, (3) WY, and (4) SC, while the two SIs are (1) RMW and (2) GRDP [11,40]. The RMW and GRDP used are the standardized average RMW (2020–2024) and GRDP (2017–2022) of Bandung City. Based on the SBT method, the total ESV is then obtained by summing the corrected ESVs of the individual ES functions across the region. ESV calculation using the refined SBT method for the study area was conducted by following these six steps:
- (a)
- The research area was divided into three planning units (PUs), i.e., (1) county level, (2) 250 m × 250 m, and (3) 100 m × 100 m, using ArcGIS 10.8’s fishnet tool.
- (b)
- The correcting indicators (CI), both biophysical and socio-economic indicators, were incorporated into each PU using the zonal statistics tool in ArcGIS [41]. Subsequently, CI values for each PU were standardized using Equation (2).where is the standardized CI value of the type k indicator (k = 1, 2, 3, …, 6) for grid l, is the original CI value of the type k indicator for grid l, and and are the maximum and minimum CI values of the type k indicator for grid l.
- (c)
- The standardized ES/biophysical values were then classified into 5 classes and converted into equivalent values as presented in Table 3.Table 3. Equivalent factor for the standardized CI of biophysical indicators.
- (d)
- The standardized CI values for the socio-economic indicators (SIs) were also classified into five classes and converted into equivalent factor of SI (EFSI). The correction factor for the total ESV was determined based on the proportional contribution of RMW and GRDP, weighted at 40% and 60%, respectively, as shown in Table 4.Table 4. Equivalent factor for the standardized CI of socio-economic indicators.
- (e)
- Reference annual ESV coefficients (VCij) were corrected based on equivalent factors (EFBI dan EFSI) to obtain corrected annual ESV coefficients (VCij_corr) of the study area at each grid using Equation (3) [40,42].where is the corrected annual ESV coefficient for ecosystem type i and ES function class j in grid l; is the equivalent factor of BI based on the standardized NDVI indicator in grid l; is the BI equivalent factor derived from the standardized CS indicator in grid l; is the BI equivalent factor derived from the standardized WY indicator in grid l; is the BI equivalent factor derived from the standardized SC indicator in grid l; is the equivalent factor of SI based on the standardized RWM and GRDP indicators in grid l; is the reference annual ESV coefficient for ecosystem type i and ES function class j1 (j1 = FP (food production)) in grid l; is the reference annual ESV coefficient for ecosystem type i and ES function class j2 (j2 = RM (raw materials)) in grid l; is the reference annual ESV coefficient for ecosystem type i and ES function class j3 (j3 = CR (climate regulation)/WR (water regulation)) in grid l; is the reference annual ESV coefficient for ecosystem type i and ES function class j4 (j4 = SFR (soil formation and retention)/WT (waste treatment)/Bio (biodiversity)) in grid l; and is the reference annual ESV coefficient for ecosystem type i and ES function class j5 (j5 = RCT (recreation, culture, and tourism)) in grid l.
- (f)
- After determining the site-specific annual ESV coefficients, the total ESV based on the SBT method can be calculated using Equation (4) [43,44].where is the total ESV based on the SBT method (USD year−1), is the area (ha) of ecosystem type i (i = 1, 2, 3, …, 7) in grid l (l = 1, 2, 3, …, m); is the corrected annual ESV coefficient for ecosystem type i and ES function class j (j = 1, 2, 3, …, 8) in grid l (USD ha−1 year−1).
To evaluate the spatial and temporal dynamics of ESV over different periods, the value coefficients of each ES category and LULC were estimated using 2024 unit values (USD ha−1). The dynamics of ES economic value change were estimated by calculating the difference between the estimated values at each reference year using Equation 5.
where ESVcr represents the rate of change in the economic value of ecosystem services (ESV) from the beginning to the end of the study period. ESVt1 and ESVt2 denote the total economic value of ES at the start and end of the assessment period, respectively.
The calculation of predicted ESV was based on the BAU scenario, assuming no intervention, in which past LULC transition patterns continue. Meanwhile, LULC for 2023–2043 is calculated based on the transition probability shift in the Markov chain model for 2013–2023. ESV exploration in this study was conducted at three different scales, i.e., (1) county, (2) 250 m × 250 m, and (3) 100 m × 100 m.
The coefficient of sensitivity (CS) index was calculated by adjusting the equivalent value of each category up and down by 50% using Equation 6 [45].
If CS > 1, it means that the ESV is elastic to the land ES value coefficient in category k (VCk), and if CS < 1, it means that the ESV is inelastic to the ES value coefficient. ESV represents the total ecosystem service value; VCk is the economic ES value coefficient of land in category k; and j and i represent the ESV before and after the coefficient adjustment case, respectively.
2.3.3. Measuring the Impact of LULC Change on ES Economic Value Dynamics
The analysis of the contribution of LULC change to ES economic value change was performed by adopting the approach of [46]. This method allows for the identification of the extent to which specific LULC changes impact the total ESV change within a specific spatial unit. The contribution of LULC conversion to ESV change was calculated using Equation (7) [47].
where ESCIij is the contribution of LULC conversion to ESV change.
- ΔQij measures the amount of ESV change from LULC/ecosystem type i to LULC/ecosystem type j. ΔQij = ESVj (USD) − ESVi (USD)
- ΔSij is the area of LULC type i converted to LULC type j. Pij is the proportion of the area of LULC type i converted to LULC type j within the total converted area.
- ΔSij = LULCj (ha) − LULCi (ha).
An ESCI > 0 indicates that the LULC change contributes positively to an increase in ES economic value. Conversely, an ESCI < 0 indicates a negative contribution or a decrease in ES economic value due to LULC change. This calculation was performed for all combinations of LULC changes between the analyzed periods.
3. Results
3.1. LULC Dynamic (2003, 2013, 2023)
The classification of Landsat imagery using the RF method produced LULC maps for 2003, 2013, and 2023, which are illustrated in Supplementary Figure S2 and summarized in Table 5. The corresponding accuracy evaluation, including the observation sample point, the Kappa Coefficient and Overall Accuracy, is also presented in Supplementary Figure S3 and Supplementary Table S3.
Table 5.
Area change for various LULC types in the Citarum Watershed (2003–2023).
Table 5 presents LULC changes in the Citarum Watershed between 2003 and 2013, highlighting a pronounced deforestation trend. During this period, FRT declined (−34.47%), accompanied by a reduction in SHB (−42.80%) and PND (−2.81%). In contrast, SA expanded substantially (+51.790%), along with DLF (+30.01%), EP (+25.08%), WB (+12.38%), and PF (+5.20%). These shifts illustrate the strong pressures exerted by human activities, particularly the demand for SA and increased food production, which have driven the conversion of FRT into DLF and SA.
Between 2013 and 2023, LULC dynamics in the Citarum Watershed followed a pattern similar to the 2003–2013 trend, albeit with lower intensity. FRT cover and SHB were declined (−20.08%) and (−3.99%), respectively. The SA grew markedly by 13,690 ha (+24.82%), reflecting ongoing urbanization, while DLF expanded by 17,930 ha (+6.82%) and PF slightly increased by +1.0%. Differ from previous trend, EP in the 2013–2023 period declined by 4150 ha (−17.90%). Overall, the LULC of the study area was characterized by declining natural vegetation into built-up area due to intensifying human activities, particularly urban growth and agricultural expansion. This thereby heightening pressure on ecosystem service sustainability.
Overall (within 2003–2023 period), the FRT experienced the most substantial decline (−47.63%) and followed by SHB (−45.08%). In contrast, SA expanded rapidly (+89.46%), reflecting accelerated urbanization. The DLF was increased significantly (+38.88%), which indicated the expansion of cultivation into hilly or marginal lands. Meanwhile, PF recorded a moderate growth (+6.25%). These LULC dynamics have led to a reduced capacity of ecosystems to deliver environmental services, particularly regulating and buffering functions, with direct implications for the sustainability of watershed management.
The model validation results indicate strong predictive performance, with Kappa statistics exceeding 0.88 across all indices (K-standard = 88.60%, Kno = 91.90%, K-location = 91.10%, and K-location strata = 91.10%). These values exceed commonly accepted thresholds (>0.70), confirming that the Land Change Modeler (LCM) reliably reproduced the 2023 LULC pattern and is suitable for projecting future land-use scenarios to 2043. The results are consistent with previous studies in North Sumatra (0.75–0.83) [36] and Bekasi City [48], supporting the applicability of the model for sustainable land-use and urban planning analyses.
3.2. Predicted LULC for 2043 Under Three Scenarios
The LULC projections for 2043, generated using the MLP-MC model, show substantial differences among the BAU, PPF, and PFA scenarios. Based on the 2023 LULC as the base map, potential transition maps and transition probability matrices for 2003–2013 were used to generate the future 2043 projections (Supplementary Figure S4 and Supplementary Table S4). The spatial extent of each LULC class is summarized in Table 6.
Table 6.
Predicted LULC for 2043 based on three different scenarios.
The projection of LULC change in the Citarum Watershed by 2043 under the BAU scenario indicates a continuing pattern of ecosystem degradation. FRT area is projected to decline significantly (−34.66%), while SHB and EPs are also expected to decrease considerably. In contrast, SA is anticipated to expand rapidly by +36.79%. The BAU scenario underscores a trajectory of exploitation without conservation intervention, leading to the loss of natural vegetation cover and greater pressure on ecosystem services.
PPF Scenario: This scenario predicts an increase in PFs by 5090 ha (+3.38%), aligning with food security objectives. However, the FRT area still decreases by 38,550 ha (−34.65%). Compared to the BAU scenario, there is reduced pressure on some other land categories. For instance, SA expansion is lower (+21,810 ha), while EPs and SHB continue to shrink significantly. This scenario suggests that spatial planning strategies can moderately curb settlement expansion and support the conservation of productive lands like PFs.
PFA Scenario: This scenario assumes full protection of conservation zones, particularly FRT, resulting in no reduction in FRT cover by 2043. While this demonstrates the effective preservation of forest ecosystem services, it simultaneously shifts LULC pressures onto other categories. SHB decreases by 12,140 ha (−48.02%), EPs by 8480 ha (−44.54%), and PFs by 1380 ha (−0.92%); these are largely converted into SA, which expands by 25,330 ha (+36.79%). These outcomes highlight that forest protection alone cannot curb urban expansion in the absence of urban growth control. Although PFA ensures the stability of natural vegetation, it generates trade-offs with productive land such as PFs and EPs, which also hold critical ecological and economic value. Thus, integrating forest conservation with strategic farmland protection is essential to managing future LULC dynamics effectively.
These three scenarios highlight a dilemma between environmental preservation and the demands of development. The BAU scenario indicates massive ecological damage due to uncontrolled settlement expansion, whereas PPF represents a moderate strategy that balances conservation and land utilization. PFA successfully maintains forest cover but puts pressure on converting other lands, such as SHBs, EPs, and PFs. In this context, the PPF approach stands out as a compromise solution that better curbs deforestation than BAU while also increasing PF areas. Therefore, integrated and adaptive landscape planning is needed to address sustainable development challenges that balance ecological, social, and economic dimensions.
3.3. Scale Effects on ESV and ESCI
The observed differences in ESV and ecosystem service change intensity across spatial scales are primarily attributable to the modifiable areal unit problem (MAUP). At finer spatial resolution (100 m), small and fragmented forest patches are explicitly represented, resulting in a higher baseline ESV and a more pronounced detection of localized ecosystem service losses. In contrast, county-level aggregation masks these small forest remnants by averaging heterogeneous land cover within administrative units, leading to lower baseline estimates and attenuated loss signals. Consequently, the steeper ESV decline observed at 100 m resolution does not indicate greater absolute degradation, but rather reflects enhanced spatial sensitivity to fine-scale land transitions that are systematically underrepresented at coarser scales.
The valuation of ES using both TBT and SBT approaches produced the ESV estimates that are presented in Supplementary Tables S5–S7. A summary of the total ESV is listed in Table 7 and illustrated in Figure 3.
Table 7.
Economic valuation of ecosystem services by scale and benefit transfer method in the Citarum Watershed (values in brackets indicate negative changes).
Figure 3.
Spatial distribution of total ecosystem service economic values in the Citarum Watershed at multiple spatial scales. (a) 2003 at county scale, (b) 2003 at scale 250 × 250 m, (c) 2003 at scale 100 × 100 m, (d) 2013 at county scale, (e) 2013 at scale 250 × 250 m, (f) 2013 at scale 100 × 100 m, (g) 2023 at county scale, (h) 2023 at scale 250 × 250 m, (i) 2023 at scale 100 × 100 m.
The assessment of ESV in the Citarum Watershed from 2003 to 2013 indicates a sustained decrease across the majority of valuation approaches. Under the TBT and SBT approach, ESV decreases by −4.66% to −11.11%, except for the TBT method at the county level (unchanged) and the SBT at 100 m × 100 m (+24.09%). The notable increase in ESV at 100 m × 100 m underscores the greater sensitivity of fine-resolution analyses in capturing land cover heterogeneity and spatial variations in ES distribution.
The subsequent decade (2013–2023) exhibits more dynamic patterns. ESV estimates derived from TBT decrease, most prominently at 100 m × 100 m, with a reduction of −USD 1884.01 million (−48.18%). A similar but smaller decline is observed in the SBT, 100 m × 100 m, reaching USD −925.01 million (−39.40%). Conversely, results at the county level of the SBT method show a slight increase in the ESV estimate, by +0.58%.
Over the full 2003–2023 period, however, both TBT and SBT reveal a general downward trajectory. TBT values decline by −6.34% to −35.70%, while SBT reports the steepest reduction at 100 m × 100 m (−46.13%). This long-term trend highlights the cumulative impacts of land-use change and ecosystem degradation, which weaken the watershed’s capacity to sustain ecosystem services. In monetary terms, when using the SBT method, the total ESV ranges from USD 1606.11 million to USD 2641.33 million in 2003, decreases to USD 1531.19 million to USD 2347.83 million in 2013, and further drops to USD 1276.17 million to USD 1585.01 million in 2023. Overall, these results demonstrate a persistent decline in the economic value of ecosystem services over two decades, reinforcing the urgency of conservation-oriented watershed management and spatial planning.
FRTs and PFs consistently experience the largest declines in ES economic value across all timeframes and scenarios, primarily due to land conversion into DLF and SA. Although some increases were observed in SA and DLF lands, these gains were insufficient to offset the losses from natural ecosystems. A high spatial resolution of 100 m × 100 m effectively depicts changes with more detail and accuracy. These results emphasize that the degradation of natural land cover is a key factor in the decline of an ecosystem’s capacity to provide ESs. Therefore, sustainable conservation strategies and effective land use management are crucial for maintaining the continuity of ES in the Citarum Watershed.
Taken together, the findings show that although the magnitude and percentage of change differ across the three spatial scales, a clear overarching pattern emerges, namely, a decline in ESV driven by the transformation of natural landscapes into built-up and cultivated areas. Finer spatial resolutions capture degradation processes more explicitly, highlighting the analytical value of a multi-scale framework for ESV assessment. Spatially, ESVs in the Citarum Watershed have exhibited a persistent downward trend over the past two decades, with intensity varying by scale. From a temporal perspective, the most pronounced reductions occurred during the second decade, from 2013 to 2023, at both the county scale and the 250 m grid scale, indicating escalating pressure on natural resources. Collectively, these results point to an urgent need to reinforce ecosystem conservation and restoration strategies, particularly targeting forested areas and agricultural land, to sustain ecosystem service provision in the future.
Figure 3 illustrates the distribution of ESV in the Citarum Watershed in 2003 using three different spatial scales: county (sub-district/administrative aggregate), 250 m × 250 m, and 100 m × 100 m. The decline in ESV from 2003 to 2023 exhibits a consistent pattern across scales, though with differing levels of detail. At the county scale, changes appear only as a general shift from high to medium–low value classes, providing a broad overview but failing to capture ecosystem fragmentation. At the 250 m grid scale, the decline is more pronounced, with medium-to-low values dominating by 2013 and intensifying in 2023, particularly in central and downstream areas of the watershed. This resolution strikes a balance between spatial detail and computational efficiency, making it suitable for long-term watershed monitoring.
At the 100 m scale, ESV dynamics are most pronounced. High-value areas dominated in 2003, but fragmentation emerged in 2013, and by 2023, high-value patches were increasingly isolated within low-value matrices. This scale is well-suited for detecting fine-scale degradation and identifying conservation spots, though it requires more accurate data and greater computational capacity. Hence, scale selection should align with purpose: county-level for macro policies, 250 m for watershed analyses, and 100 m for site-specific conservation planning.
The multi-scale analysis underscores the significant impact of spatial resolution on results and interpretation. County-level mapping produces homogeneous distributions, which are useful for administrative planning but are limited in capturing intra-watershed heterogeneity. The 250 m grid provides a practical compromise, offering sufficient spatial detail while remaining efficient for watershed-scale conservation planning. The 100 m grid reveals sharp land-cover variations, making it valuable for identifying priority protection or restoration zones. However, its high data demands and potential for excessive fragmentation constrain its application at the full watershed scale. Overall, the 250 m grid is most efficient for watershed assessments, while the 100 m grid is optimal for localized management.
Based on calculations using TBT and SBT methods, along with LULC types and a multi-scale approach, an equivalent factor was derived to represent the comparative ESV between the two methods, as shown in Supplementary Table S5. A summary of the equivalent factor values for the 2003–2023 period is presented in Figure 4.
Figure 4.
Equivalent factors based on LULC from the 2003 to 2023 period in the Citarum Watershed.
The analysis of the average equivalent factor of ESV across different LULC types in the Citarum Watershed from 2003 to 2023 reveals significant variability influenced by spatial scale. At the county level, the equivalent factors generally appear higher and more stable, whereas at finer resolutions, such as 250 m × 250 m and 100 m × 100 m, the values tend to decrease. This pattern indicates that the aggregation of spatial units at broader scales can mask local heterogeneity, leading to relatively high assessments compared to spatially based assessments that capture finer spatial details.
In terms of ecosystem contributions, PND, PF, and SHB consistently record the highest equivalent factors, ranging from 0.8 to 1.0 across scales. These land cover types demonstrate their dominant role in sustaining ecosystem services, particularly in regulating water balance, maintaining biodiversity, and supporting carbon sequestration. WBs also provide relatively high values at the county level, although their contribution declines substantially at finer resolutions, suggesting that local fragmentation or degradation processes may reduce their effectiveness at smaller scales. Conversely, DLF and EPs show the lowest equivalent factors, with values commonly below 0.6, especially at the base spatial scale. The declining trend across finer resolutions highlights the limited ecological contribution of intensively managed or disturbed landscapes relative to natural or semi-natural ecosystems. This contrast emphasizes the importance of preserving natural habitats within the watershed, as they provide disproportionately higher ES benefits compared to anthropogenic land uses. Moreover, the findings reinforce the need to consider scale sensitivity in ES valuation to avoid over- or underestimation in policy and management applications.
The valuation of ESs using both TBT and SBT approaches produced the ESV estimates presented in Supplementary Tables S5–S7. A summary of the total ESV is provided in Table 8 and illustrated in Figure 5.
Table 8.
Ecosystem service values (ESV) across multiple scales in the Citarum Watershed under different scenarios (USD ×106).
Figure 5.
Spatial distribution of total ecosystem service economic values in the Citarum Watershed under different scenarios in 2043. at multiple spatial. (a) 2043 BAU at county scale, (b) 2043 BAU at scale 250 × 250 m, (c) 2043 BAU at scale 100 × 100 m, (d) 2043 PPF at county scale, (e) 2043 PPF at scale 250 × 250 m, (f) 2043 PPF at scale 100 × 100 m, (g) 2043 PFA at county scale, (h) 2043 PFA at scale 250 × 250 m, (i) 2043 PFA at scale 100 × 100 m.
Across all spatial resolutions and future LULCs, the TBT method consistently produces higher total ESV estimates than the SBT approach (Table 8). This pattern is evident for all projections in 2043, reflecting the tendency of non-spatial valuation methods to yield higher aggregated ESV estimates compared to spatially explicit approaches.
Spatial resolution exerts a strong influence on estimated ESV magnitudes. Finer resolutions, particularly the 100 m scale, consistently report higher absolute ESVs and reveal stronger sensitivity to land-use change than county-level aggregation. This pattern holds across all scenarios under both TBT and SBT methods, highlighting the importance of high-resolution spatial valuation for capturing ecosystem service dynamics.
Using 2023 as the reference year, the BAU scenario indicates substantial declines in total ESV across all spatial resolutions. Under the SBT method, total ESV decreases from USD 1422.82 million in 2023 to USD 1105.40 million at the 100 m resolution in 2043, corresponding to a reduction of USD 317.42 million (−22.31%). At coarser resolutions, losses are more pronounced, reaching USD 648.31 million (−40.90%) at the county scale and USD 331.90 million (−26.01%) at the 250 m scale.
The PPF scenario exhibits a pattern of ESV decline comparable to BAU. At the 100 m resolution under SBT, total ESV decreases to USD 1070.17 million, representing the lowest ESV among the scenarios at this resolution and a reduction of USD 317.42 million (−22.31%) relative to 2023. Similar proportional declines are observed at the county (−40.90%) and 250 m (−26.01%) scales, indicating that agricultural-priority policies alone do not prevent significant ecosystem service losses. In contrast, the PFA scenario demonstrates the strongest capacity to mitigate ESV loss across all spatial resolutions. Under the SBT method, total ESV in 2043 reaches USD 1165.06 million at the county scale, USD 1373.45 million at the 250 m scale, and USD 1542.47 million at the 100 m scale. Relative to 2023, these values correspond to reductions of 42.90%, 28.53%, and 24.79%, respectively, which are consistently lower than those observed under BAU and PPF scenarios.
Although all future land-use scenarios result in net declines in total ESV relative to 2023, forest protection emerges as the most effective strategy for minimizing ecosystem service losses across the watershed. Moreover, high-resolution spatial valuation (100 m) reveals clearer contrasts among policy scenarios than coarser aggregation, underscoring its importance for ecosystem-based watershed planning and land-use decision-making.
The spatial distribution of ESV under the three 2043 scenarios, BAU, PPF, and PFA, reveals distinct patterns of ecosystem degradation and conservation, as illustrated in Figure 5. Under the BAU and PPF scenarios (Figure 5a–f), there is a widespread expansion of Low and Extremely Low value clusters (indicated in red and orange). At the 100 m resolution (SBT), the BAU scenario results in a significant ESV decline to USD 1105.40 million, a reduction of 58.15% from the 2003 baseline. The PPF scenario shows a similar trend, with a total ESV of USD 1070.17 million, reflecting the highest relative loss of 59.48% due to the conversion of natural landscapes into agricultural and urban areas.
In contrast, the PFA scenario (Figure 5g–i) effectively maintains High and Extremely High ESV clusters (indicated in green), particularly in upstream regions. At the finest resolution (100 m, SBT), the PFA scenario retains a total value of USD 1542.47 million. Although this represents a 41.60% decrease compared to the 2003 baseline (USD 2641.33 million), it demonstrates a substantial mitigation of losses compared to the development-heavy scenarios.
Furthermore, the visual comparison across scales confirms that while the County scale provides a generalized overview, the 100 m resolution captures critical spatial heterogeneity and identifies specific high-value hotspots that are essential for targeted conservation planning. These results underscore that prioritizing forest protection is the most effective strategy for sustaining ecosystem service provision within the Citarum Watershed.
The total ESV was calculated using both the TBT and SBT methods, and incorporating the 2043 LULC prediction with a multi-scale approach, and equivalent factors were derived to compare the ecosystem service values estimated by the two methods and detailed in Supplementary Table S5. The summarized results of the equivalent factor values for the 2043 LULC prediction across the three scenarios are presented in Figure 6.
Figure 6.
Equivalent factor based on predicted 2043 LULC using three scenarios (BAU, PPF, and PFA) at the Citarum Watershed.
The derivation of equivalent factors for the 2043 LULC predictions, utilizing both the TBT and SBT methods through a multiscale approach, reveals significant insights into the shifting ecological value of the Citarum Watershed. As presented in Figure 6, the average equivalent factors across various LULC types exhibit clear variation, reflecting the high degree of heterogeneity in ecological functions among different landscape units. Notably, semi-natural and forested landscapes, specifically PND and SHB, demonstrate consistently higher equivalent factors, exceeding 1.0. This underscores their disproportionate importance in providing critical regulating and supporting services, such as soil conservation, habitat maintenance, and hydrological regulation.
Conversely, cultivated landscapes, including DLF and EP, are characterized by moderate equivalent factors, generally ranging between 0.6 and 0.8. While these areas remain vital for provisioning services, their lower factors highlight a fundamental trade-off between intensive economic productivity and long-term ecological sustainability. Furthermore, aquatic systems (WB) exhibit average equivalent factors below 0.8, suggesting that terrestrial ecosystems currently provide a higher magnitude of ecosystem services relative to aquatic systems within this watershed context.
The multiscale visualization in Figure 6 further illustrates that the choice of spatial resolution, ranging from County to 100 m grids, directly influences the derived equivalent factors for each LULC category. These findings emphasize that conservation-oriented management must prioritize the protection and restoration of forested areas to enhance ecological resilience and ensure a sustainable supply of ecosystem services for the watershed’s future
3.4. The Impact of LULC Change on ES Economic Value Dynamics
Figure 7a shows that during the 2003–2023 period, the conversion of FRT to DLF had the largest negative contribution (−952.70), followed by conversions to SHB (−249.01) and PFs (−132.72). Conversely, conversion from DLF to FRTs contributed the largest positive increase to ESs (+794.32), indicating that revegetation or more managed land use can support ecosystem recovery. However, changes between other non-forest LULC types tended to contribute less and were neutral to ESV.
Figure 7.
Contribution of LULC changes to ESV based on three scenarios (2003–2023, 2023–2043).
Figure 7b shows that in the BAU scenario for the 2023–2043 period, the trend of ESV decline due to deforestation intensified. Conversion of FRT to DLF saw its negative contribution surge to −1834.04, almost double that of the previous period. Additionally, FRT conversion to SHB and PFs continued to contribute to a significant decline in ESV (−246.46 and −136.35, respectively). Other conversions, such as FRT to EPs and SA, also showed negative impacts, albeit smaller. Meanwhile, changes between non-forest lands had relatively minor impacts. This underscores the real threat to ecosystem sustainability if deforestation is not seriously controlled under the BAU scenario.
Figure 7c illustrates that in the PPF scenario, for the same period, despite PFs being protected, FRT conversion to DLF remained dominant and was the largest contributor to the decline in ESV (−1853.77), even exceeding the BAU scenario. FRT conversion to SHB and PFs contributed −249.19 and −138.07 to the decline, respectively. FRT changes to PNDs and WBs also contributed negatively, but relatively minorly. Under the PPF scenario, mitigating overall ecosystem degradation was limited because it was not accompanied by concrete efforts to protect forest areas. This result suggests that protecting only one type of land cover (such as PFs) is insufficient to sustain ESs if deforestation continues.
Figure 7d shows that the PFA scenario for the 2023–2043 period theoretically aims to conserve forests. However, the results indicate that FRT conversion to DLF remained the largest factor in ESV decline (−1053.26). Similarly to the PPF Scenario, this suggests that forest protection policies have not been implemented effectively. Changes to SHB, PFs, and EPs also exacerbated ecosystem degradation. Non-forest land conversions showed neutral or small positive impacts, such as conversion from DLF to FRT, which only contributed +86.99. Therefore, a more integrated land use approach and stricter conservation policies are needed to prevent deforestation and ensure the long-term sustainability of ecosystem services.
4. Discussion
4.1. LULC Change Dynamics
From 2003 to 2023, the Citarum Watershed experienced substantial LULC transformation. Natural ecosystems, particularly FRT and SHB, saw marked reductions, while SAs and DLF areas expanded significantly. These trends illustrate intensified human intervention, which is projected to continue under most future land use scenarios. These research findings are consistent with previous studies on land use change in watershed areas. Nahib’s research in the Citarum Watershed showed a decrease in PFs, primary FRTs, and EPs, and an increase in SAs and DLF during the 2006–2018 period [49]. Meanwhile, for the period from 2010 to 2020, PFs, FRT, SA, and SHB increased, while DLF, EPs, natural FRTs, and barren lands decreased [50].Beyond the observed areal changes, the spatiotemporal dynamics of LULC in the Citarum Watershed reflect the combined influence of topographic constraints, accessibility, and population pressure [51]. The pronounced conversion of FRT and SHB from 2003 to 2013 predominantly occurred in areas characterized by moderate slopes and proximity to existing settlement and road networks, indicating accessibility-driven land transformation. These patterns are consistent with the driving factors incorporated in the LULC prediction model, particularly distance to settlements and roads, which facilitate agricultural expansion and urban sprawl. In contrast, steeper and higher-elevation zones exhibited relatively lower conversion rates, highlighting the role of topographic limitation in moderating land-use change intensity [24].
The higher rate of FRT and SHB loss observed during the 2003–2013 period compared to 2013–2023 suggests a phase of accelerated land-use intensification coinciding with rapid socio-economic growth in the Jakarta–Bandung Mega Urban Region [20]. The subsequent deceleration in FRT loss during 2013–2023 may indicate partial saturation of easily accessible land and the increasing influence of regulatory constraints and conservation awareness. Nevertheless, the continued expansion of SA during the later period demonstrates that urban-driven land conversion remains the dominant force shaping the watershed landscape, rather than agricultural expansion alone [52].
Research in the Upper Citarum Watershed found significant deforestation and urbanization processes, leading to the shrinking of PFs and the expansion of SA [21]. Similarly, in the Cirasea Sub-Watershed (part of the Citarum Watershed) from 2009 to 2019, there was a decrease in FRT and PF areas, accompanied by an increase in open land and built-up areas [21]. Predicted LULC changes in the Citarum Watershed using the MLP-MC showed similar trends in the BAU and PPF scenarios. There was a decrease in FRT and EP areas and an increase in SAs and PF areas [25]. Conversely, the forest protection scenario maintained forest areas, although urban expansion was predicted to continue [6,53]. The forest protection scenario highlights the importance of forest preservation while also taking into account the social and economic aspects of the community, although urbanization challenges remain an unavoidable obstacle [54]. Meanwhile, the sustainable agriculture scenario, through the application of agroforestry and environmentally friendly techniques, is considered capable of reducing ecological impacts and supporting more efficient watershed management [55].
The LULC trajectories identified in the Citarum Watershed are broadly consistent with patterns reported in other rapidly urbanizing watersheds in Indonesia and Southeast Asia, where forest and semi-natural vegetation are progressively replaced by settlements and intensified agricultural land uses [55]. Comparable studies in the Brantas and Bengawan Solo Watersheds have similarly documented urban expansion as a primary driver of ecosystem conversion [56], while international cases in South Asia report analogous trends under peri-urban growth pressures [57]. This convergence underscores that the Citarum Watershed represents not an isolated case, but a characteristic example of land-use transition in densely populated tropical watersheds.
Efforts to preserve forests often hinder the expansion of agricultural land. Agricultural expansion can threaten the ecological functions of forests. Therefore, wise land use management and increased agricultural productivity are needed [55]. Furthermore, ref. [58] highlights the trade-off between FRT preservation and PF protection. When food security is prioritized, forest areas can be marginalized, threatening their ecological functions. In contrast, preserving forest areas constrains the expansion of agricultural land. The evaluation of spatial planning implementation identifies mismatches between observed land-use patterns and officially designated plans, underscoring the need to enhance integrated, adaptive spatial planning and land management frameworks [55]. Strategic policies such as population control, reductions in rice consumption, increased crop yields, and land utilization based on land suitability and potential needs need to be implemented [58].
These LULC changes have direct implications for the watershed’s capacity to deliver ecosystem services. The systematic conversion of forests and shrublands into settlements and dryland agricultural areas reduces the availability of regulating and supporting services, including water regulation, soil conservation, and carbon storage, while increasing reliance on provisioning-oriented land uses [24,59]. Although agricultural expansion contributes to food production, the net effect of these transitions is a structural shift toward land uses with lower overall ecosystem service value [60]. Consequently, the documented LULC dynamics provide a critical explanatory basis for the observed decline and spatial redistribution of ecosystem service values analyzed in subsequent sections.
4.2. Impact of LULC Change on ES Value
In this study, ESs comprise three critical regional resources: freshwater supply, food production (through agricultural water and soil stability), and energy (via hydropower reliability). Together, these resources sustain millions of downstream users and form the backbone of regional economic and human well-being. Ecosystem services are therefore framed as natural infrastructure, in which LULC dynamics regulate hydrological, soil, flood, and microclimatic processes that determine the reliability, cost, and sustainability of resource provision. Forests, shrublands, and other natural covers perform key regulating and supporting functions, such as infiltration, runoff moderation, soil retention, and microclimate control, that govern the physical performance of watersheds as production and supply systems [61].
The analysis of ESV from 2003 to 2023 reveals a consistent downward trend across scenarios and spatial resolutions, with FRT and PFs experiencing the most significant losses. While some gains in ESV are observed in built-up and agricultural zones, these increases are insufficient to offset the degradation of natural ecosystems. Among the modeled scenarios, PFA proved the most effective in conserving ESV, particularly in areas with high ecological functionality [62]. The PFA scenario maintains watershed structure and preserves upstream–downstream functional linkages. By sustaining infiltration, regulating runoff, and reducing erosion, protected forests stabilize downstream water availability and reduce exposure to hydrological extremes. These effects directly support the long-term viability of agriculture, hydropower generation, and domestic water supply, particularly in densely populated and water-stressed regions [63].
Similar patterns have been reported in other regions: urban expansion consistently reduces ESV, whereas forests, grasslands, and water bodies provide the highest contributions to ecosystem services [40]. In the Huaihe River Basin, for example, urban growth between 2000 and 2020 led to declining ESV, with projections for 2030 suggesting further losses unless agricultural land was converted to WB, which would substantially increase ESV [47]. These findings underscore that land-use change, particularly forest conversion to agriculture, remains a principal driver of ESV loss, requiring integrated, cross-land-type management approaches for sustainable mitigation.
Under BAU and partial protection scenarios, continued conversion of forests and shrublands weakens these functions. Declining water regulation and soil conservation increase sedimentation, destabilize baseflow, and amplify variability in the water supply, particularly during extreme rainfall and drought. As natural regulation deteriorates, water, food, and energy systems become increasingly dependent on engineered substitutes, including sediment dredging, flood-control infrastructure, and expanded water-treatment capacity. These substitutions raise financial costs, energy and material demand, and greenhouse gas emissions, thereby increasing the environmental footprint of development [64]. As shown by the water yield and sediment retention outputs, conservation scenarios deliver measurably more stable and lower-cost resource provision than land-conversion trajectories.
The importance of spatial scale in ES assessments is widely recognized. Scale affects both the relationships among drivers and the distribution of ESV. For instance, socio-economic drivers dominate at finer scales, while biophysical drivers are more influential at broader scales; moreover, the larger the spatial unit, the more clustered and uniform ESV patterns become [65]. In the Citarum Watershed, micro-scale analyses at 100 m × 100 m and 250 m × 250 m resolutions provide valuable insights into land cover, vegetation, and hydrological processes, while macro-scale assessments are better suited for identifying broad regional trade-offs and synergies between ESs [47].
Comparative results across scales further highlight these dynamics. At the county level, declines appear as broad shifts from high-value to medium- and low-value classes, offering a macro-view that is useful for policy but that masks fine-scale heterogeneity in the literature [30,66]. At 250 m resolution, degradation patterns are more evident, particularly in central and downstream sections of the watershed, striking a balance between ecological detail and computational efficiency that supports long-term monitoring testing [67]. At 100 m resolution, declines are most pronounced, with high-value patches increasingly fragmented, thus revealing conservation spots that are critical for site-specific interventions [66]. However, this fine resolution requires high-quality data, significant storage and computing power, and risks generating outputs that are too fragmented for basin-scale management [68]. A multiscale approach, county level for policy, 250 m for watershed management, and 100 m for local conservation, balances ecological relevance with analytic feasibility [67].
Although the numerical difference between the 100 m and 250 m grid resolutions may appear limited, their analytical behavior differs substantially in heterogeneous landscapes. The finer resolution reveals fragmentation and localized ecosystem service dynamics that are aggregated at coarser scales.
Methodological refinements in valuation also shape outcomes. Spatial benefit transfer methods that account for local heterogeneity outperform traditional approaches by reducing overestimation and aligning more closely with ecological realities [69]. Raster-based GIS frameworks, such as those applied in the Yunnan–Guizhou Plateau, further improve accuracy by aggregating the pixel-level values of carbon storage, water yield, soil conservation, and habitat quality [70]. In the Tibet Autonomous Region, incorporating spatial heterogeneity corrections reduced generalization errors and produced more consistent valuations across administrative units, thereby strengthening the reliability of planning [71]. Collectively, these approaches show that explicitly accounting for heterogeneity enhances the robustness of ESV estimates for ecological regulation and conservation decision-making.
Regional variation further complicates ES patterns. Aggregating local units into broader scales accentuates heterogeneity and hierarchical variability, as the distribution of ES is inherently uneven and shaped by both natural and anthropogenic factors. Studies in the Three Gorges Reservoir Area demonstrate how mismatches between ES supply and demand necessitate balancing ecological protection with economic development, with local geography playing a decisive role [70]. Incorporating local biophysical and socio-economic contexts into benefit transfer enhances accuracy, smooths interregional fluctuations, and improves policy relevance applications [72]. Although both traditional and heterogeneity-based approaches produce similar land-cover ranking patterns, the latter captures regional variations more effectively and reduces errors [73]. Multiscale frameworks that integrate vegetation-based LULC types are therefore critical to balancing operational detail with strategic planning [74].
The results confirm that ESV is strongly scale-dependent, reflecting the role of spatial resolution in shaping how landscape heterogeneity and ecosystem service processes are represented. Coarser spatial resolutions (e.g., 250 m) emphasize watershed-scale gradients and long-term regional trends, making them suitable for strategic assessments, but they inherently smooth spatial variability and underestimate localized ecosystem service dynamics. In contrast, finer resolutions (e.g., 100 m) reveal land-use fragmentation and localized ecosystem service gains and losses that remain undetected at coarser scales, particularly under alternative land-use scenarios, thereby providing a more nuanced basis for policy-relevant interpretation [30].
These scale effects are compounded by the modifiable areal unit problem (MAUP), which means that spatial aggregation alters both the magnitude and the spatial configuration of ESV estimates. Aggregation to coarser grids or administrative units averages heterogeneous land-use patterns, systematically masking ecosystem service hotspots and dampening spatial contrasts. Empirical evidence indicates that ESV estimates are especially sensitive at grid sizes below approximately 600 m, where finer resolutions preserve spatial heterogeneity, whereas coarser resolutions introduce bias through smoothing and non-linear aggregation processes [75].
For structurally heterogeneous watersheds such as the Citarum, these findings highlight the methodological necessity of a multi-scale analytical framework. While coarser resolutions (250 m) provide an effective overview for regional prioritization and comparative assessment, finer resolutions (100 m) are essential for validating spatial patterns and identifying localized hotspots of ecosystem service change. Moreover, the presence of non-linear aggregation effects associated with edge influences and service clustering reinforces the need for systematic multi-scale testing [76] when applying spatial decision-support tools such as InVEST or Marxan, particularly in scenario-based ecosystem service assessments.
Protecting these high-value ecological assets through targeted zoning can yield disproportionate benefits for local resource security, highlighting the need for spatially explicit conservation planning to optimize both ecological and socio-economic outcomes. ESs contribute to resource provision in a scale-dependent manner, where high-resolution analysis uncovers benefits hidden at broader scales. Small forest patches, riparian zones, and upland areas often yield outsized gains in flow stabilization, sediment reduction, and climate buffering, aggregating to enhance watershed reliability [77].
Finally, cultural ecosystem services also exhibit scale dependency. Broader-scale assessments, such as those in Norway, aggregate data in ways that still reflect measurable local contributions [78]. This evidence aligns with the broader consensus: finer resolutions capture precise ES distributions, which are essential for site-level conservation, while coarser scales highlight aggregate patterns that are better suited for regional and policy-level decision-making. From an economic perspective, these biophysical functions translate into substantial avoided costs. Conservation-oriented land-use patterns reduce the need for capital-intensive infrastructure and recurrent expenditures for flood control, sediment management, and water treatment. In fiscally constrained regions, these avoided costs improve the affordability and resilience of water, food, and energy provision under both development pressure and climate uncertainty. Thus, ES functions as a cost-stabilizing infrastructure that directly enhances resource access, lowers unit supply costs, and reduces the environmental footprint of regional development [79].
4.3. Sensitivity Analysis of ESV Coefficients
To capture the spatial heterogeneity of ESV, ESV was analyzed at multiple spatial resolutions, including administrative units, 250 m grids, and 100 m grids. Differences in resolution affect the representation of landscape fragmentation, edge effects, and localized land-use transitions, which in turn influence the spatial distribution of ESV. Coarser resolutions tend to smooth spatial variability, emphasizing watershed-scale trends, whereas finer resolutions reveal localized hotspots of ecosystem service loss and gain that are obscured at broader scales. Thus, scale is not merely a technical parameter but a critical determinant of how ecosystem service dynamics are interpreted [52,80].
Unlike biomass, which cannot be used as a comprehensive proxy, LULC has proven to be an effective indicator in estimating ES values. The relationship between biomass and ES is highly dependent on local ecological conditions. Thus, it cannot always be used as a reliable basis for accurate assessment. This inconsistency makes the use of biomass as an estimation approach less reliable compared to land cover data [81]. Conversely, land cover data and LULC metrics provide a more consistent and measurable proxy for ES estimation across various landscapes. Land cover data can be effectively used to model and predict ES distribution patterns, as they reflect habitat suitability [82].
The sensitivity coefficient value of less than reflects the resilience of ES value estimates to fluctuations. This is consistent with various previous studies in Central Asia, the Yellow River Basin, the southwest coast of Bangladesh, and the Cisadane Watershed, which also show sensitivity coefficient values below 1 [11,83,84]. The Citarum Watershed shows characteristics similar to those of the Cisadane Watershed, namely, its inelasticity to environmental changes. This indicates the ecosystem’s limited resilience and its potential vulnerability to disturbances such as floods. erosion. and ecological degradation. Factors such as habitat fragmentation. declining water quality. and biodiversity loss also worsens these [11].
Akber’s study also confirmed that ES values remained stable despite coefficient variations of up to ±50%, with a change in impact of less than 2% [83]. This shows that although ES values are quite robust, accuracy in coefficient determination remains important so that estimates do not deviate. To improve the accuracy of ESV calculations, especially in the context of the Citarum Watershed, we propose a strategy that involves refining coefficient values by obtaining high-resolution data.
4.4. Policy Implications and Strategic Recommendations
The scenario-based results align closely with existing land-use governance instruments in Indonesia. The PFA is conceptually consistent with the Forest Moratorium policy introduced in 2023, which restricts the conversion of primary forests and peatlands while indirectly safeguarding adjacent agricultural landscapes from uncontrolled expansion. By constraining forest loss and stabilizing agricultural land, the PFA scenario reflects a pragmatic balance between ecological protection and food security objectives.
In parallel, the PPF closely corresponds to the spatial logic of Sustainable Food Agricultural Land Protection (LPPB) zoning, where forest conservation and agricultural land designation are treated as complementary rather than competing land-use priorities. The dominance of reduced forest-to-settlement transitions under the PFA scenario highlights the effectiveness of zoning-based constraints in mitigating ecosystem service degradation at the watershed scale. Together, these findings suggest that scenario-informed land planning can reinforce existing regulatory frameworks when spatial enforcement is explicitly incorporated into land transition models.
The findings support integrating scenario-based spatial planning into watershed policy. The PFA scenario is effective ecologically, but requires complementary controls on settlement expansion. The PPF alone cannot prevent ES degradation if forest loss continues. Hence, policy synergy between forest conservation, food security, and urban regulation is critical. Multi-scale spatial analysis also helps identify local priority areas for conservation interventions, making the approach suitable for other complex watersheds.
Institutionalizing ESV within land-use governance frameworks is crucial for promoting sustainable development and preserving ecological integrity. In Indonesia, integrating ESV assessments into formal instruments such as Regional Spatial Plans (RTRW) and Environmental Impact Assessments (AMDAL) is a vital step toward embedding ecosystem service considerations into policy and planning. This institutionalization directly supports national commitments to the Sustainable Development Goals (SDGs), particularly those related to climate resilience (SDG 13), biodiversity conservation (SDG 14 and SDG 15), and water security (SDG 6) [85].
Accurately capturing spatial variations in ESV also requires incorporating socioeconomic variables, such as Gross Domestic Product (GDP), labor income, and community livelihood data, into biophysical evaluations. This multidimensional approach enables policymakers to assess ES in ways that reflect both environmental and social realities. Consequently, effective land-use governance must include inclusive planning mechanisms, engaging stakeholders such as local communities, farmers, and indigenous groups in participatory decision-making processes. Furthermore, cross-sectoral coordination between environmental authorities, agricultural departments, and urban planners is critical to ensuring policy coherence [86].
To operationalize ESV in regional planning, several policy interventions are recommended. First, there is a need to strengthen legal protections and enforcement mechanisms for remaining natural ecosystems, particularly in the designated ESV spots. Second, the use of high-resolution remote sensing and participatory monitoring tools should be institutionalized to regularly update ESV data and support adaptive management strategies for security [85].
Third, embedding multi-scale ESV assessments into provincial and district spatial plans will help prioritize high-value ecological areas in land allocation decisions. Lastly, Payments for Ecosystem Services programs should be developed and expanded to incentivize conservation practices on privately and communally managed lands, fostering both ecological sustainability and socio-economic benefits [86].
5. Conclusions
This study presents an integrated evaluation of LULC dynamics and ESV changes in the Citarum Watershed through a multi-scale and multi-scenario analytical framework. The results demonstrate that the Protecting Forest Area (PFA) scenario most effectively preserves ESV, particularly forest-related (FRT) and paddy field (PF) services. Fine-resolution spatial analysis enhances the identification of critical conservation areas, offering actionable insights for sustainable watershed planning.
Over the past two decades, the Citarum Watershed has experienced extensive deforestation and intensified anthropogenic activities. FRT declined by 101,161 ha (−47.63%) and SHB by 20,750 ha (−45.08%), while SA and DLF expanded by 32,510 ha (+89.46%) and 78,650 ha (+38.88%), respectively. PFs expanded moderately (+6.25%), whereas PNDs slightly declined (−4.91%). These trends indicate a pronounced shift from natural land cover toward built-up and cultivated areas. Under the BAU scenario, degradation persists, characterized by continued forest loss, rapid urban expansion, and further growth of dryland agriculture. The PPF scenario maintains and slightly expands rice fields (+3.38%); however, this is insufficient to offset forest loss without effective urban growth control. In contrast, the PFA scenario sustains forest cover at or above the targeted threshold (≥30% of the watershed), although conversion pressure shifts to other land-use classes (SHB, DLF, and PFs), and SA continues to expand. This highlights the need to integrate forest conservation with settlement control policies.
Methodologically, the SBT approach, which integrates biophysical and socio-economic indicators, captures spatial heterogeneity in ESVs more effectively than the TBT method across multiple spatial scales. The derived equivalent factors (0.6–0.8) highlight the importance of accounting for spatial variability when valuing ecosystem services. From 2003 to 2023, total ESV exhibited a consistent decline across all scales. At the 100 m resolution, ESV decreased from USD 2641.33 million in 2003 to USD 1422.82 million in 2023, representing cumulative reductions of −11.11% (2003–2013), −39.40% (2013–2023), and −46.13% over the entire study period. Projections for 2043 indicate substantial ESV losses under both the BAU and PPF scenarios (−58.15% and −59.48%, respectively), whereas the PFA best preserves ESV, with much smaller losses (−41.60%), at the 100 m grid level.
ESCI analysis further identifies forest and shrubland conversion to settlements and dryland agriculture as the dominant drivers of ESV decline, emphasizing critical pathways of ecosystem degradation. The most effective strategy to sustain ecosystem service capacity and support ecosystem-based spatial planning in the Citarum Watershed is a combined approach of “forest conservation + paddy field protection + settlement expansion control”, implemented at a fine operational resolution (100 m) and supported by regular assessments using the SBT method.
6. Limitations and Future Directions
This study offers a multi-scale, scenario-based evaluation of land use and land cover dynamics and ecosystem service value changes in the Citarum Watershed, although several limitations require consideration. First, ecosystem service valuation relied on benefit transfer approaches, which are subject to uncertainty and may introduce errors of up to ±30%, particularly in the absence of local biophysical calibration. Second, the MLP-MC projections assume static drivers, limiting the ability to capture feedback from future socio-economic or climatic changes.
Future research should address these limitations by integrating dynamic ecosystem service modeling frameworks, such as InVEST-based net primary productivity (NPP) and water yield (WY) modules, to enable biophysically grounded validation of ecosystem service dynamics. Incorporating time-varying drivers and coupling scenario modeling with process-based ecosystem service simulations would further enhance the robustness and policy relevance of watershed-scale land-use planning.
Future research should focus on developing fully spatialized ESCI mapping frameworks that integrate pixel-level LULC transitions with spatial benefit transfer coefficients. Such developments would allow a more refined representation of ecosystem service dynamics, enhance comparability across spatial scales, and reinforce the use of ESCI outputs in spatial planning and watershed management decisions.
Supplementary Materials
The following supporting information can be downloaded at: https://www.mdpi.com/article/10.3390/resources15020024/s1, Figure S1: Variables of land cover change: (a) elevation, (b) slope, (c) population, (d) distance from road, (e) distance from river, and (f) distance from settlement.; Figure S2: Citarum Watershed Land Use/Land Cover Observation Sample Points; Figure S3: LULC of the Citarum Watershed: (a) actual 2003, (b) actual 2013, (c) actual 2023, and (d) predicted 2023.; Figure S4: Spatial distribution of LULC of the Citarum Watershed for 2043 based on three different scenarios: (a) BAU, (b) Protecting Paddy Field (PPF), and (c) Protecting Forest Area (PFA).; Table S1: The dataset, processing, and source for LULC and ESV; Table S2: Reference Annual Ecosystem Service Functions’ Value Coefficients based on LULC (USD ha−1 year−1) ([11] modified); Table S3: Accuracy assessment (percentage) of LULC 2003, 2013, and 2023; Table S4: Transition matrix under three scenarios; Table S5: ESV (in million USD) Based on LULC/Ecosystem Type, Multi-Scale, and Multi-Scenario (County Scale); Table S6: ESV (in million USD) Based on LULC/Ecosystem Type, Multi-Scale, and Multi-Scenario (Grid 250 m Scale); Table S7: ESV (in million USD) Based on LULC/Ecosystem Type, Multi-Scale, and Multi-Scenario (Grid 100 m Scale).
Author Contributions
Conceptualization: I.N., W.W., S.D.T., W.A., M.D., and T.T.; methodology (Land Use and Land Cover Change): I.N., Y.W., T.T., and W.W.; methodology (Ecosystem Service Value Assessment): W.A., B.P., F.R., M.D., N.P.N., S.D.T., and S.S.; validation: F.R., S.S., and B.W.; formal analysis: T.T., J.S., and D.L.C.; data curation: I.N., N.P.N., B.W., and B.P.; writing—original draft preparation: B.P., D.L.C., T.T., S.S., and F.R.; writing—review and editing: I.N., Y.W., W.A., N.P.N., M.D., J.S., and S.S., visualization: F.R., B.W., and T.T.; supervision: Y.W., W.W., S.D.T., and M.D. All authors have read and agreed to the published version of the manuscript.
Funding
This paper forms part of a doctoral dissertation entitled “Spatial Modeling of Sustainable Watershed Planning Based on Ecosystem Services: A Case Study of the Citarum Watershed, West Java Province.” The research was conducted by Irmadi Nahib under the supervision of Widiatmaka, Suria Darma Tarigan, and Wiwin Ambarwulan. This study was funded by the Directorate General of Higher Education, Research, and Technology, Ministry of Education, Culture, Research, and Technology, Indonesia, under the 2024 Research Implementation Contract No. 027/E5/PG.02.00.PL/2024, dated 11 June 2024. The research funding did not cover the Article Processing Charges (APCs).
Data Availability Statement
The original contributions presented in this study are included in the article. Further inquiries can be directed to the corresponding author.
Acknowledgments
We would like to express our deepest gratitude to the Head of the Research Center for Limnology and Water Resources for facilitating the researchers in conducting their work at the Limnology Research Laboratory.
Conflicts of Interest
The authors declare no conflicts of interest.
Abbreviations
| BAU | Business-as-Usual |
| Bio | Biodiversity |
| CR | Climate regulation |
| DEM | Digital Elevation Model |
| DLF | Dryland Farming |
| EP | Estate Plantation |
| ESCI | Ecosystem Service Change Intensity |
| ESV | Ecosystem Service Values |
| FP | Food production |
| FRT | Forest |
| GRDP | Gross Regional Domestic Product |
| LULC | Land Use Land Cover |
| MLP-MC | Multi-Layer Perceptron–Markov Chain |
| NDVI | Normalized Difference Vegetation Index |
| PA | Productive Area |
| PF | Paddy Field |
| PPF | Protecting Paddy Field |
| PFA | Protecting Forest Area |
| PND | Fishpond |
| RF | Random Forest |
| RCT | Recreation, culture, and tourism |
| RM | Raw materials |
| RMW | Regional Minimum Wage |
| SA | Settlement Area |
| SAVI | Soil-Adjusted Vegetation Index |
| SBT | Spatial Benefit Transfer |
| SFR | Soil formation and retention |
| SHB | Shrubland |
| TBT | Traditional Benefit Transfer |
| UA | Unproductive Area |
| WB | Water Body |
| WR | Water regulation |
| WT | Waste treatment |
References
- Singh, V.; Sardar, P.; Samadder, S.R.; Kumar, D.; Villuri, V.G.K. Predicting the Future Landscape of Dhanbad District: An Analysis of Land-Use Change and Urban Sprawl through Cloud Computing and Neural Networks. Environ. Dev. Sustain. 2023, 26, 30749–30770. [Google Scholar] [CrossRef] [Scilit]
- Baisero, D.; Visconti, P.; Pacifici, M.; Cimatti, M.; Rondinini, C. Projected Global Loss of Mammal Habitat Due to Land-Use and Climate Change. One Earth 2020, 2, 578–585. [Google Scholar] [CrossRef] [Scilit]
- Munajati, S.L.; Kartodihardjo, H.; Saleh, M.B.; Nurwadjedi, N. Ecosystem Services Dynamics in Bogor Regency. Indones. J. Geogr. 2021, 53, 265–273. [Google Scholar] [CrossRef] [Scilit]
- Nahib, I.; Widiatmaka, W.; Tarigan, S.; Ambarwulan, W.; Ramadhani, F. Exploring Ecosystem Service Trade-Offs and Synergies for Sustainable Urban Watershed Management in Indonesia—A Case Study of the Citarum River Basin, West Java, Indonesia. Ecol. Eng. Environ. Technol. (EEET) 2024, 25, 315–332. [Google Scholar] [CrossRef] [Scilit]
- Hasibuan, M.A.S.; Widiatmaka, W.; Tarigan, S.D.; Ambarwulan, W. Potential Changes in Climate Regulating Ecosystem Services from Anthropogenic Activities in the Cisadane Watershed, Indonesia. South East. Eur. J. Public Health 2024, XXV, 2583–2602. [Google Scholar]
- Ambarwulan, W.; Yulianto, F.; Widiatmaka, W.; Rahadiati, A.; Tarigan, S.D.; Firmansyah, I.; Hasibuan, M.A.S. Modelling Land Use/Land Cover Projection Using Different Scenarios in the Cisadane Watershed, Indonesia: Implication on Deforestation and Food Security. Egypt. J. Remote Sens. Space Sci. 2023, 26, 273–283. [Google Scholar] [CrossRef] [Scilit]
- Kato, S.; Huang, W. Land Use Management Recommendations for Reducing the Risk of Downstream Flooding Based on a Land Use Change Analysis and the Concept of Ecosystem-Based Disaster Risk Reduction. J. Environ. Manag. 2021, 287, 112341. [Google Scholar] [CrossRef] [Scilit]
- Guzman, L.A.; Escobar, F.; Peña, J.; Cardona, R. A Cellular Automata-Based Land-Use Model as an Integrated Spatial Decision Support System for Urban Planning in Developing Cities: The Case of the Bogotá Region. Land Use Policy 2020, 92, 104445. [Google Scholar] [CrossRef] [Scilit]
- Eastman, R. IDRISI for Windows: IDRISI Selva Manual; Clark University: New York, NY, USA, 2012. [Google Scholar]
- Geng, B.; Zheng, X.; Fu, M. Scenario Analysis of Sustainable Intensive Land Use Based on SD Model. Sustain. Cities Soc. 2017, 29, 193–202. [Google Scholar] [CrossRef] [Scilit]
- Nahib, I.; Wahyudin, Y.; Widiatmaka, W.; Ambarwulan, W.; Amhar, F.; Suwedi, N.; Darmawan, M.; Suryanta, J.; Pranoto, B.; Ramadhani, F. Evaluating the Effects of Changes in Land Use and Assessing the Value of Ecosystem Services in the Cisadane Watershed, Banten Province, Indonesia. J. Infrastruct. Policy Dev. 2024, 8, 3788. [Google Scholar] [CrossRef] [Scilit]
- Schmitt, M.; Hughes, L.H.; Qiu, C.; Zhu, X.X. SEN12MS—A Curated Dataset of Georeferenced Multi-Spectral Sentinel-1/2 Imagery for Deep Learning And Data Fusion. ISPRS Ann. Photogramm. Remote Sens. Spat. Inf. Sci. 2019, IV-2/W7, 153–160. [Google Scholar] [CrossRef] [Scilit]
- Zhao, S.; Tu, K.; Ye, S.; Tang, H.; Hu, Y.; Xie, C. Land Use and Land Cover Classification Meets Deep Learning: A Review. Sensors 2023, 23, 8966. [Google Scholar] [CrossRef] [Scilit] [PubMed]
- Xie, C.; Zhu, H.; Fei, Y. Deep Coordinate Attention Network for Single Image Super-resolution. IET Image Process. 2022, 16, 273–284. [Google Scholar] [CrossRef] [Scilit]
- De Groot, R.; Brander, L.; Van Der Ploeg, S.; Costanza, R.; Bernard, F.; Braat, L.; Christie, M.; Crossman, N.; Ghermandi, A.; Hein, L.; et al. Global Estimates of the Value of Ecosystems and Their Services in Monetary Units. Ecosyst. Serv. 2012, 1, 50–61. [Google Scholar] [CrossRef] [Scilit]
- Costanza, R.; de Groot, R.; Farber, S.; Grasso, M.; Hannon, B.; Limburg, K.; Naeem, S.; Paruelo, J.; Raskin, R.; Sutton, P. The Value of the World’s Ecosystem Services and Natural Capital. Ecol. Econ. 1998, 25, 3–15. [Google Scholar] [CrossRef] [Scilit]
- Badamfirooz, J.; Mousazadeh, R.; Sarkheil, H. A Proposed Framework for Economic Valuation and Assessment of Damages Cost to National Wetlands Ecosystem Services Using the Benefit-Transfer Approach. Environ. Chall. 2021, 5, 100303. [Google Scholar] [CrossRef] [Scilit]
- Richardson, L.; Loomis, J.; Kroeger, T.; Casey, F. The Role of Benefit Transfer in Ecosystem Service Valuation. Ecol. Econ. 2015, 115, 51–58. [Google Scholar] [CrossRef] [Scilit]
- Boer, R.; Dasanto, B.D.; Perdinan; Marthinus, D. Hydrologic Balance of Citarum Watershed under Current and Future Climate. In Climate Change and the Sustainable Use of Water Resources; Leal Filho, W., Ed.; Climate Change Management; Springer: Berlin/Heidelberg, Germany, 2012; pp. 43–59. [Google Scholar]
- Pravitasari, A.E.; Rustiadi, E.; Mulya, S.P.; Setiawan, Y.; Fuadina, L.N.; Murtadho, A. Identifying the Driving Forces of Urban Expansion and Its Environmental Impact in Jakarta-Bandung Mega Urban Region. IOP Conf. Ser. Earth Environ. Sci. 2018, 149, 012044. [Google Scholar] [CrossRef] [Scilit]
- Siswanto, S.Y.; Francés, F. How Land Use/Land Cover Changes Can Affect Water, Flooding and Sedimentation in a Tropical Watershed: A Case Study Using Distributed Modeling in the Upper Citarum Watershed, Indonesia. Env. Earth Sci. 2019, 78, 550. [Google Scholar] [CrossRef] [Scilit]
- Pranoto, B.; Hartulistiyoso, E.; Aidi, M.N.; Sutrisno, D.; Nahib, I.; Purwono, N.; Hudayat, N.; Rais, A.F.; Rahmila, Y.I. Assessing the Sustainability of Small Hydropower Sites in the Citarum Watershed, Indonesia Employing CA-Markov and SWAT Models. Water Supply 2024, 24, 3253–3268. [Google Scholar] [CrossRef] [Scilit]
- DISLHK KABUPATEN BANDUNG. KLHK Siapkan Masterplan Selesaikan Rehabilitasi Lahan Kritis Pada 2030 SIARAN PERS Nomor: SP.635/HUMAS/PP/HMS.3/11/2018. 2018. Available online: https://dislhk.badungkab.go.id/artikel/18234-klhk-siapkan-masterplan-selesaikan-rehabiliasi-lahan-kritis-pada-2030 (accessed on 12 January 2024).
- Nahib, I.; Widiatmaka, W.; Tarigan, S.D.; Ambarwulam, W.; Ramadhani, F. Assessing Land Use Intensity and Ecosystem Service Dynamics in Citarum Watershed, Indonesia. Caraka Tani J. Sustain. Agric. 2025, 40, 209–230. [Google Scholar] [CrossRef] [Scilit]
- Yulianto, F.; Maulana, T.; Khomarudin, M.R. Analysis of the Dynamics of Land Use Change and Its Prediction Based on the Integration of Remotely Sensed Data and CA-Markov Model, in the Upstream Citarum Watershed, West Java, Indonesia. Int. J. Digit. Earth 2019, 12, 1151–1176. [Google Scholar] [CrossRef] [Scilit]
- Lechner, A.M.; Rhodes, J.R. Recent Progress on Spatial and Thematic Resolution in Landscape Ecology. Curr. Landsc. Ecol. Rep. 2016, 1, 98–105. [Google Scholar] [CrossRef] [Scilit]
- Sun, Z.; Xue, W.; Kang, D.; Peng, Z. Assessment of Ecosystem Service Values of Urban Wetland: Taking East Lake Scenic Area in Wuhan as an Example. Land 2024, 13, 1013. [Google Scholar] [CrossRef] [Scilit]
- Karimi, J.D.; Corstanje, R.; Harris, J.A. Bundling Ecosystem Services at a High Resolution in the UK: Trade-Offs and Synergies in Urban Landscapes. Landsc. Ecol. 2021, 36, 1817–1835. [Google Scholar] [CrossRef] [Scilit]
- Lagabrielle, E.; Lombard, A.T.; Harris, J.M.; Livingstone, T.-C. Multi-Scale Multi-Level Marine Spatial Planning: A Novel Methodological Approach Applied in South Africa. PLoS ONE 2018, 13, e0192582. [Google Scholar] [CrossRef] [Scilit]
- Grêt-Regamey, A.; Weibel, B.; Bagstad, K.J.; Ferrari, M.; Geneletti, D.; Klug, H.; Schirpke, U.; Tappeiner, U. On the Effects of Scale for Ecosystem Services Mapping. PLoS ONE 2014, 9, e112601. [Google Scholar] [CrossRef] [Scilit]
- Sholeh, M.; Pranoto, P.; Budiastuti, S.; Sutarno, S. Analysis of Citarum River Pollution Indicator Using Chemical, Physical, and Bacteriological Methods; AIP Publishing LLC: Melville, NY, USA, 2018; Volume 2049, p. 020068. [Google Scholar] [CrossRef] [Scilit]
- Khairunnisa, F.; Tambunan, M.P.; Marko, K. Estimation of Soil Erosion by USLE Model Using GIS Technique (A Case Study of Upper Citarum Watershed). IOP Conf. Ser. Earth Environ. Sci. 2020, 561, 012038. [Google Scholar] [CrossRef] [Scilit]
- Sharp, R.; Tallis, H.T.; Ricketts, T.; Guerry, A.D.; Wood, S.A.; Chaplin-Kramer, R.; Nelson, E.; Ennaanay, D.; Wolny, S.; Olwero, N.; et al. InVEST User’s Guide: Integrated Valuation of Ecosystem Services and Tradeoffs, Version 3.10; Natural Capital Project; Stanford University: Stanford, CA, USA, 2020. [Google Scholar]
- Qiao, P.; Yang, S.; Lei, M.; Chen, T.; Dong, N. Quantitative Analysis of the Factors Influencing Spatial Distribution of Soil Heavy Metals Based on Geographical Detector. Sci. Total Environ. 2019, 664, 392–413. [Google Scholar] [CrossRef] [Scilit]
- Kim, Y.; Newman, G.; Güneralp, B. A Review of Driving Factors, Scenarios, and Topics in Urban Land Change Models. Land 2020, 9, 246. [Google Scholar] [CrossRef] [Scilit]
- Saputra, M.H.; Lee, H.S. Prediction of Land Use and Land Cover Changes for North Sumatra, Indonesia, Using an Artificial-Neural-Network-Based Cellular Automaton. Sustainability 2019, 11, 3024. [Google Scholar] [CrossRef] [Scilit]
- BIG. Badan informasi Geospatial Peta Rupa Bumi Indonesia Wilayah Pronsi Jawa Barat. 2017. Available online: https://tanahair.indonesia.go.id/portal-web/unduh (accessed on 22 March 2024).
- Xie, G.; Zhang, C.; Zhang, L.; Chen, W.; LI, S. Improvement of the Evaluation Method for Ecosystem Service Value Based on per Unit Area. J. Nat. Resour. 2015, 30, 1243–1254. [Google Scholar]
- Costanza, R.; De Groot, R.; Braat, L.; Kubiszewski, I.; Fioramonti, L.; Sutton, P.; Farber, S.; Grasso, M. Twenty Years of Ecosystem Services: How Far Have We Come and How Far Do We Still Need to Go? Ecosyst. Serv. 2017, 28, 1–16. [Google Scholar] [CrossRef] [Scilit]
- Bao, J.; Wang, W.; Zhao, T. Spatiotemporal Changes of Ecosystem Service Values in Response to Land Cover Dynamics in China from 1992 to 2020. Sustainability 2023, 15, 7210. [Google Scholar] [CrossRef] [Scilit]
- Fabbrizzi, E.; Giakoumi, S.; De Leo, F.; Tamburello, L.; Chiarore, A.; Colletti, A.; Coppola, M.; Munari, M.; Musco, L.; Rindi, F.; et al. The Challenge of Setting Restoration Targets for Macroalgal Forests under Climate Changes. J. Environ. Manag. 2023, 326, 116834. [Google Scholar] [CrossRef] [Scilit]
- Huang, H.; Lei, M.; Kong, X.; Wen, L. Spatial Pattern Change of Cultivated Land and Response of Ecosystem Service Value in China. Res. Soil. Water Conserv. 2022, 29, 339–348. [Google Scholar]
- Gashaw, T.; Tulu, T.; Argaw, M.; Worqlul, A.W.; Tolessa, T.; Kindu, M. Estimating the Impacts of Land Use/Land Cover Changes on Ecosystem Service Values: The Case of the Andassa Watershed in the Upper Blue Nile Basin of Ethiopia. Ecosyst. Serv. 2018, 31, 219–228. [Google Scholar] [CrossRef] [Scilit]
- Kindu, M.; Schneider, T.; Teketay, D.; Knoke, T. Changes of Ecosystem Service Values in Response to Land Use/Land Cover Dynamics in Munessa–Shashemene Landscape of the Ethiopian Highlands. Sci. Total Environ. 2016, 547, 137–147. [Google Scholar] [CrossRef] [Scilit]
- Pan, N.; Guan, Q.; Wang, Q.; Sun, Y.; Li, H.; Ma, Y. Spatial Differentiation and Driving Mechanisms in Ecosystem Service Value of Arid Region: A Case Study in the Middle and Lower Reaches of Shule River Basin, NW China. J. Clean. Prod. 2021, 319, 128718. [Google Scholar] [CrossRef] [Scilit]
- Zhang, Z.; Liu, Y.; Wang, Y.; Liu, Y.; Zhang, Y.; Zhang, Y. What Factors Affect the Synergy and Tradeoff between Ecosystem Services, and How, from a Geospatial Perspective? J. Clean. Prod. 2020, 257, 120454. [Google Scholar] [CrossRef] [Scilit]
- Zhang, X.; Zhou, Y.; Long, L.; Hu, P.; Huang, M.; Xie, W.; Chen, Y.; Chen, X. Simulation of Land Use Trends and Assessment of Scale Effects on Ecosystem Service Values in the Huaihe River Basin, China. Environ. Sci. Pollut. Res. 2023, 30, 58630–58653. [Google Scholar] [CrossRef] [Scilit]
- Fitriyati, N.; Arifin, H.S.; Kaswanto, R.L. Marimin Enhancing Land Use Planning through Integrating Landscape Analysis and Flood Inundation Prediction Bekasi City’s in 2030. Geomat. Nat. Hazards Risk 2024, 15, 2360623. [Google Scholar] [CrossRef] [Scilit]
- Nahib, I.; Ambarwulan, W.; Rahadiati, A.; Munajati, S.L.; Prihanto, Y.; Suryanta, J.; Turmudi, T.; Nuswantoro, A.C. Assessment of the Impacts of Climate and LULC Changes on the Water Yield in the Citarum River Basin, West Java Province, Indonesia. Sustainability 2021, 13, 3919. [Google Scholar] [CrossRef] [Scilit]
- Nahib, I.; Amhar, F.; Wahyudin, Y.; Ambarwulan, W.; Suwarno, Y.; Suwedi, N.; Turmudi, T.; Cahyana, D.; Nugroho, N.P.; Ramadhani, F.; et al. Spatial-Temporal Changes in Water Supply and Demand in the Citarum Watershed, West Java, Indonesia Using a Geospatial Approach. Sustainability 2022, 15, 562. [Google Scholar] [CrossRef] [Scilit]
- Yulianto, F.; Khomarudin, M.R.; Hermawan, E.; Nugroho, N.P.; Chulafak, G.A.; Nugroho, G.; Nugroho, U.C.; Suwarsono, S.; Fitriana, H.L.; Priyanto, E. Spatial and Temporal Distribution of Estimated Surface Runoff Caused by Land Use/Land Cover Changes in the Upstream Citarum Watershed, West Java, Indonesia. J. Degrad. Min. Lands Manag. 2022, 9, 3293–3305. [Google Scholar] [CrossRef] [Scilit]
- Dede, M.; Sunardi, S.; Lam, K.-C.; Withaningsih, S.; Hendarmawan, H.; Husodo, T. Landscape Dynamics and Its Related Factors in the Citarum River Basin: A Comparison of Three Algorithms with Multivariate Analysis. Geocarto Int. 2024, 39, 2329665. [Google Scholar] [CrossRef] [Scilit]
- Yusuf, S.M.; Murtilaksono, K.; Hidayat, Y.; Suharnoto, Y. Analysis and Prediction of Land Cover Change in Upstream Citarum Watershed. J. Nat. Resour. Environ. Manag. 2018, 8, 365–375. [Google Scholar] [CrossRef] [Scilit]
- Tarigan, H.; Erwidodo, E.; Perkasa, H.W.; Widhiantini, W. Sustainable Agricultural Systems Upstream of the Citarum Watershed: Social, Economic and Environmental Implications. KnE Life Sci. 2022, 2024, 228–239. [Google Scholar] [CrossRef] [Scilit]
- Mukhoriyah, M.; Arifin, S.; Kushardono, D.; Ardha, M.; Yulianto, F. Analysis of Land Use and Spatial Planning in the Upstream Citarum Watershed of West Java Based on Remote Sensing Data. J. Degrad. Min. Land Manag. 2023, 10, 4315. [Google Scholar] [CrossRef] [Scilit]
- Wiwoho, B.S.; Phinn, S.; McIntyre, N. Two Decades of Land-Use Dynamics in an Urbanizing Tropical Watershed: Understanding the Patterns and Drivers. ISPRS Int. J. Geo-Inf. 2023, 12, 92. [Google Scholar] [CrossRef] [Scilit]
- Christiawan, P.I.; Nguyen, T.P.L. Peri-Urbanization in Populous Developing Asian Countries: A Systematic Review. Int. J. Sustain. Dev. Plan. 2024, 19, 949–962. [Google Scholar] [CrossRef] [Scilit]
- Widiatmaka, W. Integrated Use of GIS, AHP and Remote Sensing in Land Use Planning for Tropical High Altitude Vegetable Crops; Society for the Advancement of Horticulture: Leuven, Belgium, 2016. [Google Scholar]
- Atharinafi, Z.; Wijaya, N. Land Use Change and Its Impacts on Surface Runoff in Rural Areas of the Upper Citarum Watershed (Case Study: Cirasea Sub-Watershed). J. Reg. City Plan. 2021, 32, 36–55. [Google Scholar] [CrossRef] [Scilit]
- Jia, Y.; Liu, Y.; Zhang, S. Evaluation of Agricultural Ecosystem Service Value in Arid and Semiarid Regions of Northwest China Based on the Equivalent Factor Method. Environ. Process. 2021, 8, 713–727. [Google Scholar] [CrossRef] [Scilit]
- Vincent, J.R. Ecosystem Services and Green Growth. In World Bank Policy Research Working Paper; World Bank: Washington, DC, USA, 2012. [Google Scholar]
- Gu, R.; Yu, H.; Duo, L. Exploring the Pattern and Influencing Factors of Ecosystem Services under Multiscale Perspective: Implications for Ecosystem Services Management. Hum. Ecol. Risk Assess. Int. J. 2024, 30, 615–640. [Google Scholar] [CrossRef] [Scilit]
- Rogers, B.M.; Mackey, B.; Shestakova, T.A.; Keith, H.; Young, V.; Kormos, C.F.; DellaSala, D.A.; Dean, J.; Birdsey, R.; Bush, G.; et al. Using Ecosystem Integrity to Maximize Climate Mitigation and Minimize Risk in International Forest Policy. Front. For. Glob. Change 2022, 5, 929281. [Google Scholar] [CrossRef] [Scilit]
- Parmesan, C.; Morecroft, M.D.; Trisurat, Y.; Adrian, R.; Anshari, G.Z.; Arneth, A.; Gao, Q.; Gonzalez, P.; Harris, R.; Price, J. Terrestrial and Freshwater Ecosystems and Their Services. In Climate Change 2022: Impacts, Adaptation and Vulnerability: Working Group II Contribution to the Sixth Assessment Report of the Intergovernmental Panel on Climate Change; Cambridge University Press: Cambridge, UK, 2023; pp. 197–378. [Google Scholar]
- Liu, Y.; Bi, J.; Lv, J.; Ma, Z.; Wang, C. Spatial Multi-Scale Relationships of Ecosystem Services: A Case Study Using a Geostatistical Methodology. Sci. Rep. 2017, 7, 9486. [Google Scholar] [CrossRef] [Scilit]
- Wilhelmsson, P. Forest Planning Utilizing High Spatial Resolution Data. Acta Univ. Agric. Sueciae 2023, 2023, 6. [Google Scholar]
- Zhang, J.; Xiang, H.; Hashimoto, S.; Okuro, T. Observational Scale Matters for Ecosystem Services Interactions and Spatial Distributions: A Case Study of the Ussuri Watershed, China. Sustainability 2021, 13, 10649. [Google Scholar] [CrossRef] [Scilit]
- Tomscha, S.; Deslippe, J.; De Róiste, M.; Hartley, S.; Jackson, B. Uncovering the Ecosystem Service Legacies of Wetland Loss Using High-resolution Models. Ecosphere 2019, 10, e02888. [Google Scholar] [CrossRef] [Scilit]
- Liu, M.; Fan, J.; Wang, Y.; Hu, C. Study on Ecosystem Service Value (ESV) Spatial Transfer in the Central Plains Urban Agglomeration in the Yellow River Basin, China. Int. J. Environ. Res. Public Health 2021, 18, 9751. [Google Scholar] [CrossRef] [Scilit]
- Li, Y.; Peng, Y.-L.; Peng, H.-N.; Cheng, W.-Y. Assessment and Multi-Scenario Prediction of Ecosystem Services in the Yunnan-Guizhou Plateau Based on Machine Learning and the PLUS Model. Front. Ecol. Evol. 2025, 13, 1539547. [Google Scholar] [CrossRef] [Scilit]
- Zhou, L.; Zhang, H.; Bi, G.; Su, K.; Wang, L.; Chen, H.; Yang, Q. Multiscale Perspective Research on the Evolution Characteristics of the Ecosystem Services Supply-Demand Relationship in the Chongqing Section of the Three Gorges Reservoir Area. Ecol. Indic. 2022, 142, 109227. [Google Scholar] [CrossRef] [Scilit]
- Xiong, C.; Ren, H.; Xu, D.; Gao, Y. Spatial Scale Effects on the Value of Ecosystem Services in China’s Terrestrial Area. J. Environ. Manag. 2024, 366, 121745. [Google Scholar] [CrossRef] [Scilit] [PubMed]
- Shao, S.; Li, W.; Yan, Z.; Zhou, W. Spatial and Temporal Evolution of the Value of Ecosystem Services in Jiuquan, China, from 2005 to 2020. Sustainability 2025, 17, 507. [Google Scholar] [CrossRef] [Scilit]
- Liu, Y.; Jiang, Y.; Yang, C. Land Use Dynamics and Ecosystem Service Valuation in the Sanmenxia Reservoir Wetland of the Yellow River. Sci. Rep. 2024, 14, 23594. [Google Scholar] [CrossRef] [Scilit]
- Wu, Y.; Liu, X.; Zhao, Q.; Liu, H.; Qu, F.; Zhang, M. Study on the Scale Dependence of the Spatial Distribution Pattern of Ecosystem Service Value—A Case Study of Gangu County, China. Sci. Rep. 2025, 15, 18671. [Google Scholar] [CrossRef] [Scilit]
- Comber, A.; Harris, P. The Importance of Scale and the MAUP for Robust Ecosystem Service Evaluations and Landscape Decisions. Land 2022, 11, 399. [Google Scholar] [CrossRef] [Scilit]
- Han, X.; Gao, G.; Zhang, J.; Wang, Z.; Wu, X.; Lü, Y. Spatial Scale-Dependence and Controlling Factors of Ecosystem Service Supply-Demand Relationships in the Loess Plateau of China. Geogr. Sustain. 2025, 6, 100297. [Google Scholar] [CrossRef] [Scilit]
- Brown, G.; Pullar, D.; Hausner, V.H. An Empirical Evaluation of Spatial Value Transfer Methods for Identifying Cultural Ecosystem Services. Ecol. Indic. 2016, 69, 1–11. [Google Scholar] [CrossRef] [Scilit]
- Almeida, E.; Lagoa, D.; Vasudhevan, T. Hidden Harms: The Economic and Financial Consequences of Deforestation and Its Underlying Drivers; CETEx and Grantham Research Institute on Climate Change and the Environment: London, UK; London School of Economics and Political Science: London, UK, 2024. [Google Scholar]
- Kardhana, H.; Solehudin; Wijayasari, W.; Rohmat, F.I.W. Assessing Basin-Wide Soil Erosion in the Citarum Watershed Using USLE Method. Results Eng. 2024, 22, 102130. [Google Scholar] [CrossRef] [Scilit]
- Shao, Z.; Li, Y.; Huang, X.; Cai, B.; Ding, L.; Pan, W.; Zhang, Y. Monitoring Urban Ecosystem Service Value Using Dynamic Multi-Level Grids. arXiv 2021, arXiv:2104.09307. [Google Scholar] [CrossRef] [Scilit]
- Singh, P.; Misra, S. On An Improved Weighted and Standardized Fatality Index Used for Estimation of Casualities Among JE Cases. Int. J. Res. Rev. Appl. Sci. 2010, 5, 59–63. Available online: https://www.arpapress.com/files/volumes/vol5issue1/ijrras_5_1_08.pdf (accessed on 12 January 2024).
- Akber, A.; Khan, W.R.; Islam, A.; Rahman, M.; Rahman, M.R. Impact of Land Use Change on Ecosystem Services of Southwest Coastal Bangladesh. J. Land Use Sci. 2018, 13, 238–250. [Google Scholar] [CrossRef] [Scilit]
- Liu, H.; Wu, J.; Liao, M. Ecosystem Service Trade-Offs Upstream and Downstream of a Dam: A Case Study of the Danjiangkou Dam, China. Arab. J. Geosci. 2019, 12, 17. [Google Scholar] [CrossRef] [Scilit]
- Kettunen, M.; BRINK, P.; Mutafoglu, K.; Schweitzer, J.; Pantzar, M.; Claret, C.; Metzger, M.; Pavlova, D. Making Green Economy Happen: Integration of Ecosystem Services and Natural Capital into Sectoral Policies. Guidance for Policy-and Decision-Makers. 2017. Available online: https://oppla.eu/sites/default/files/old_files/uploads/kettunen-et-al-2017-guidance-ecosystem-service-policy-integration-final.pdf (accessed on 22 March 2024).
- Feng, D.; Wu, W.; Liang, L.; Li, L.; Zhao, G. Payments for Watershed Ecosystem Services: Mechanism, Progress and Challenges. Ecosyst. Health Sustain. 2018, 4, 13–28. [Google Scholar] [CrossRef] [Scilit]
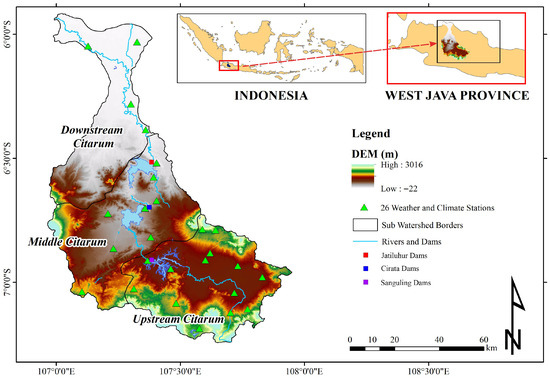
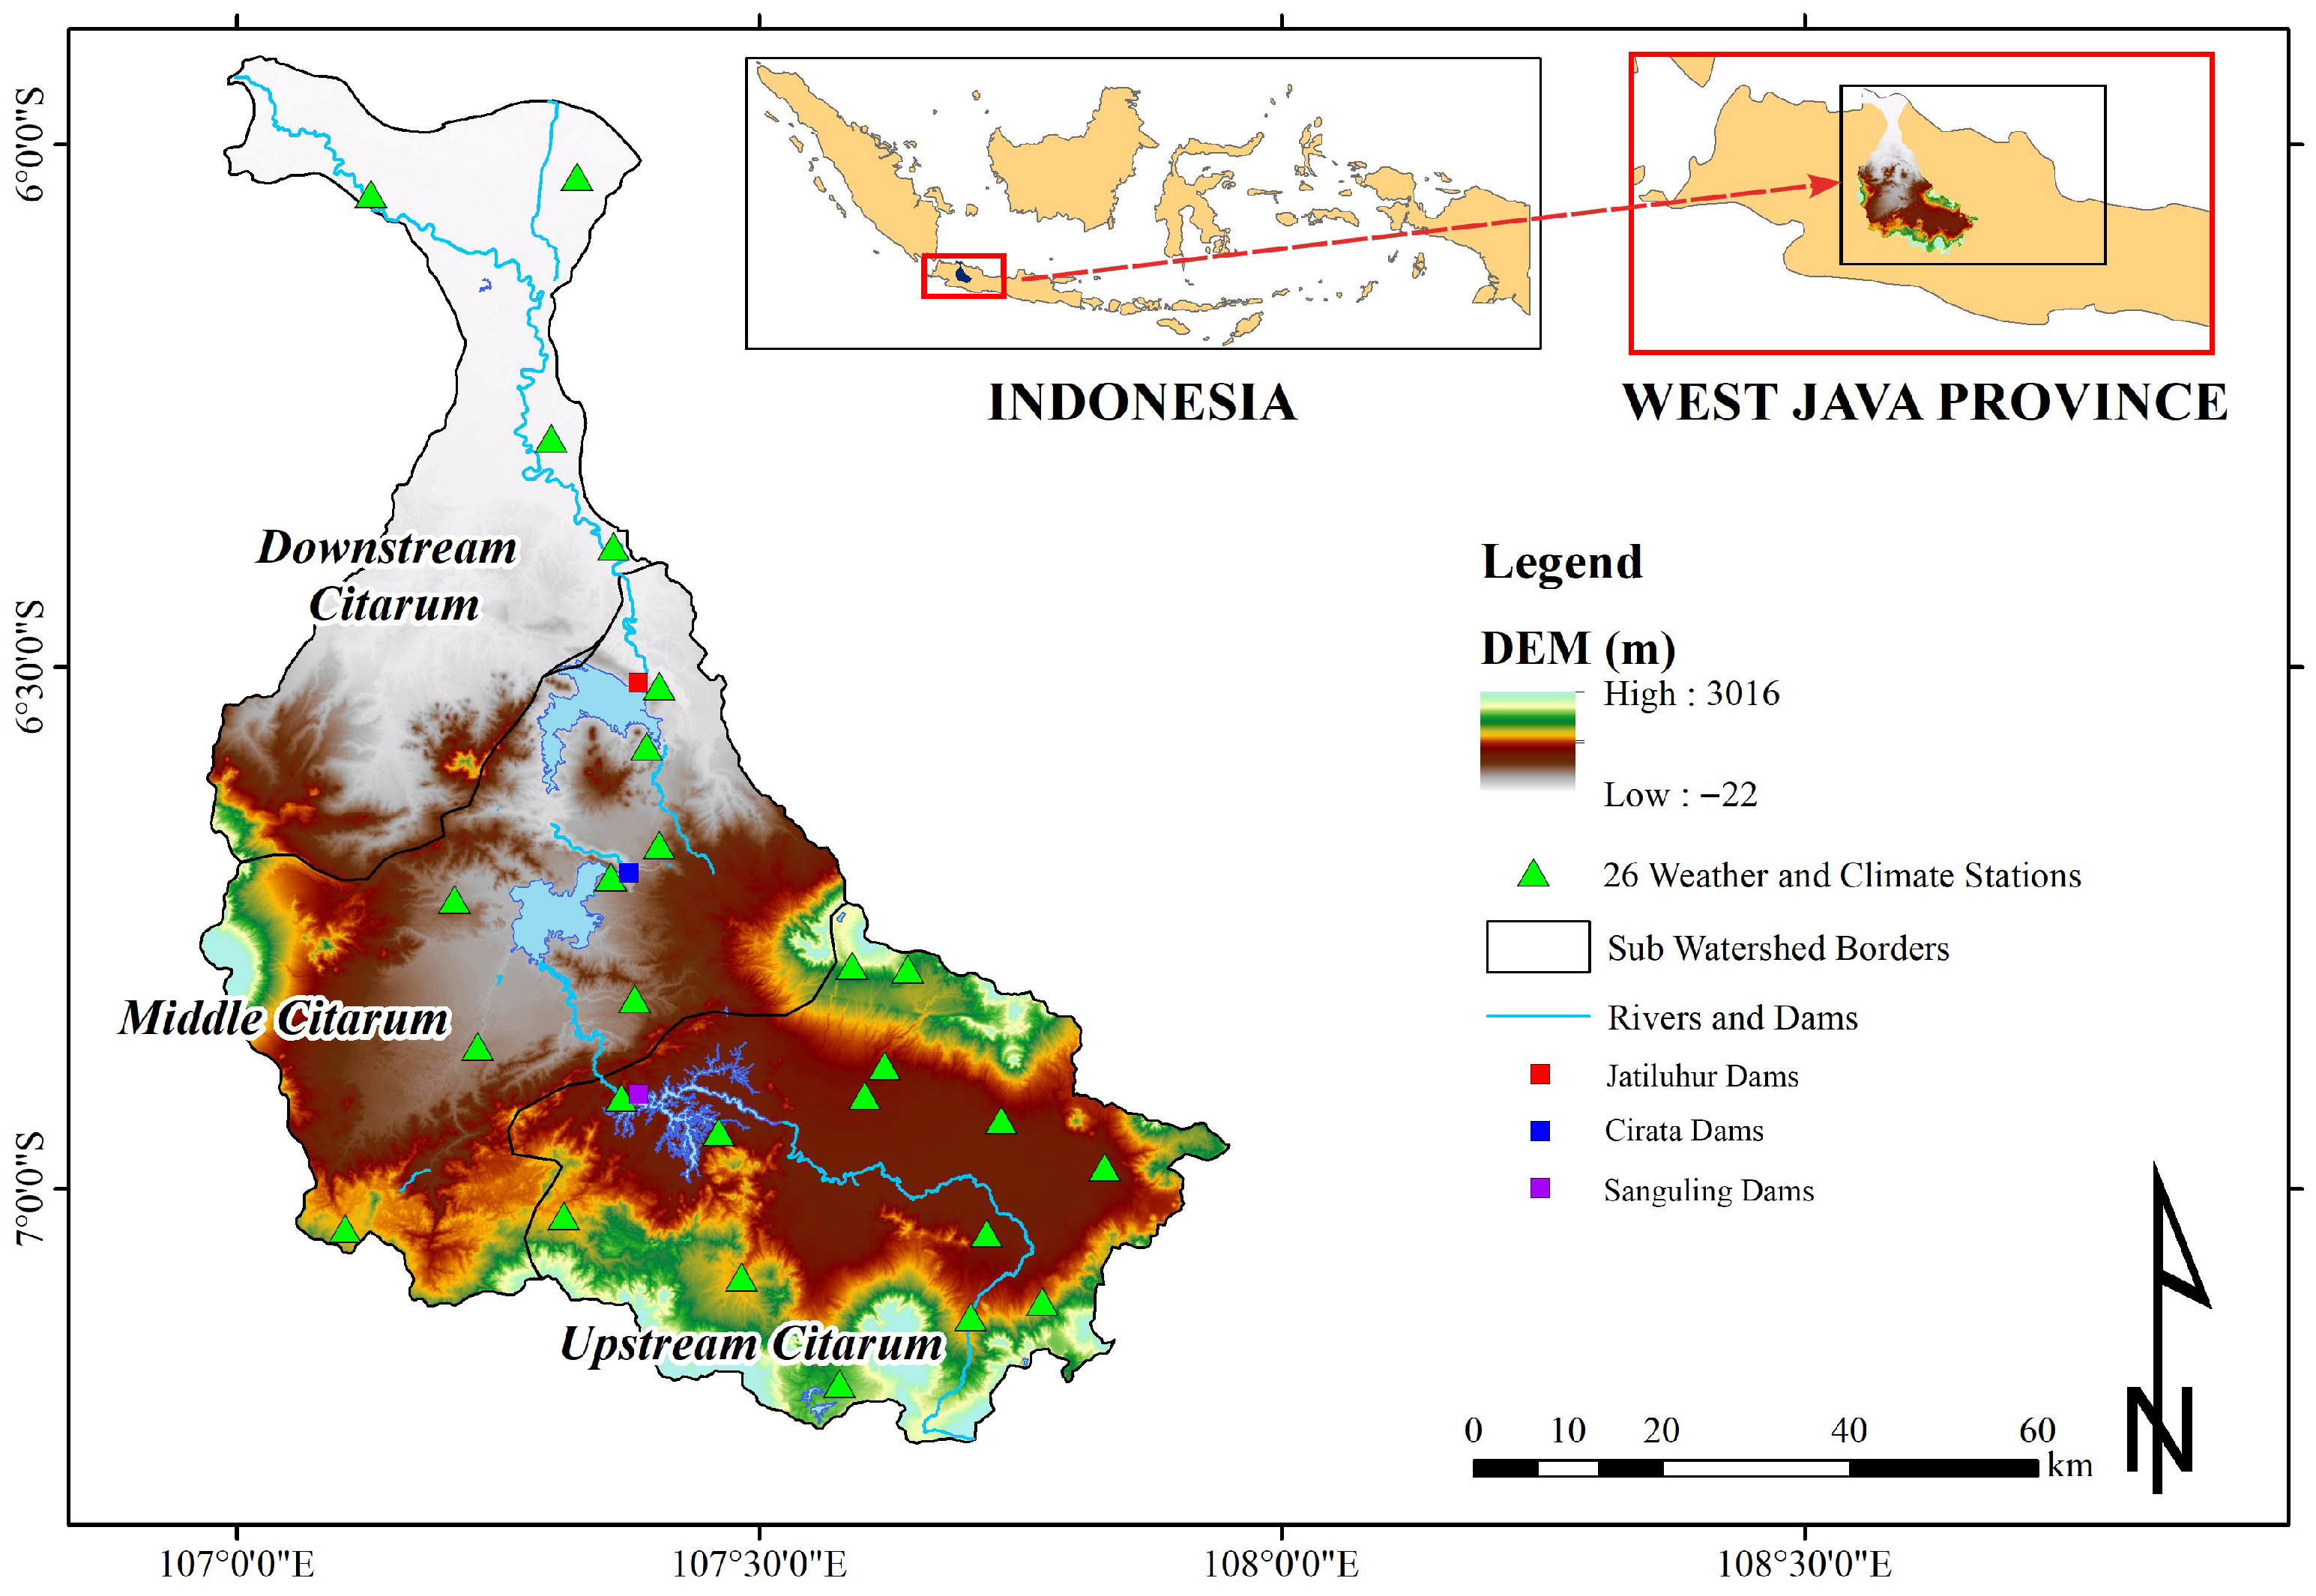
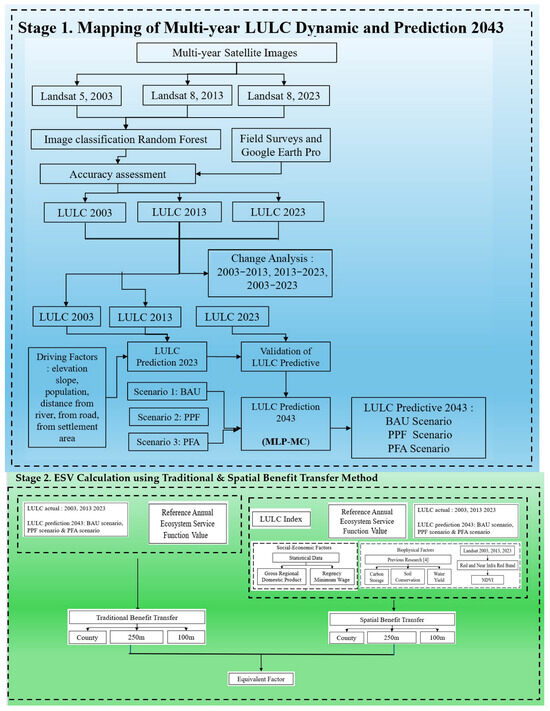
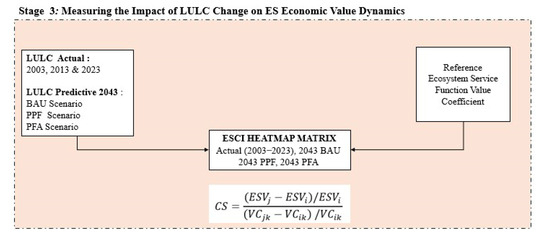
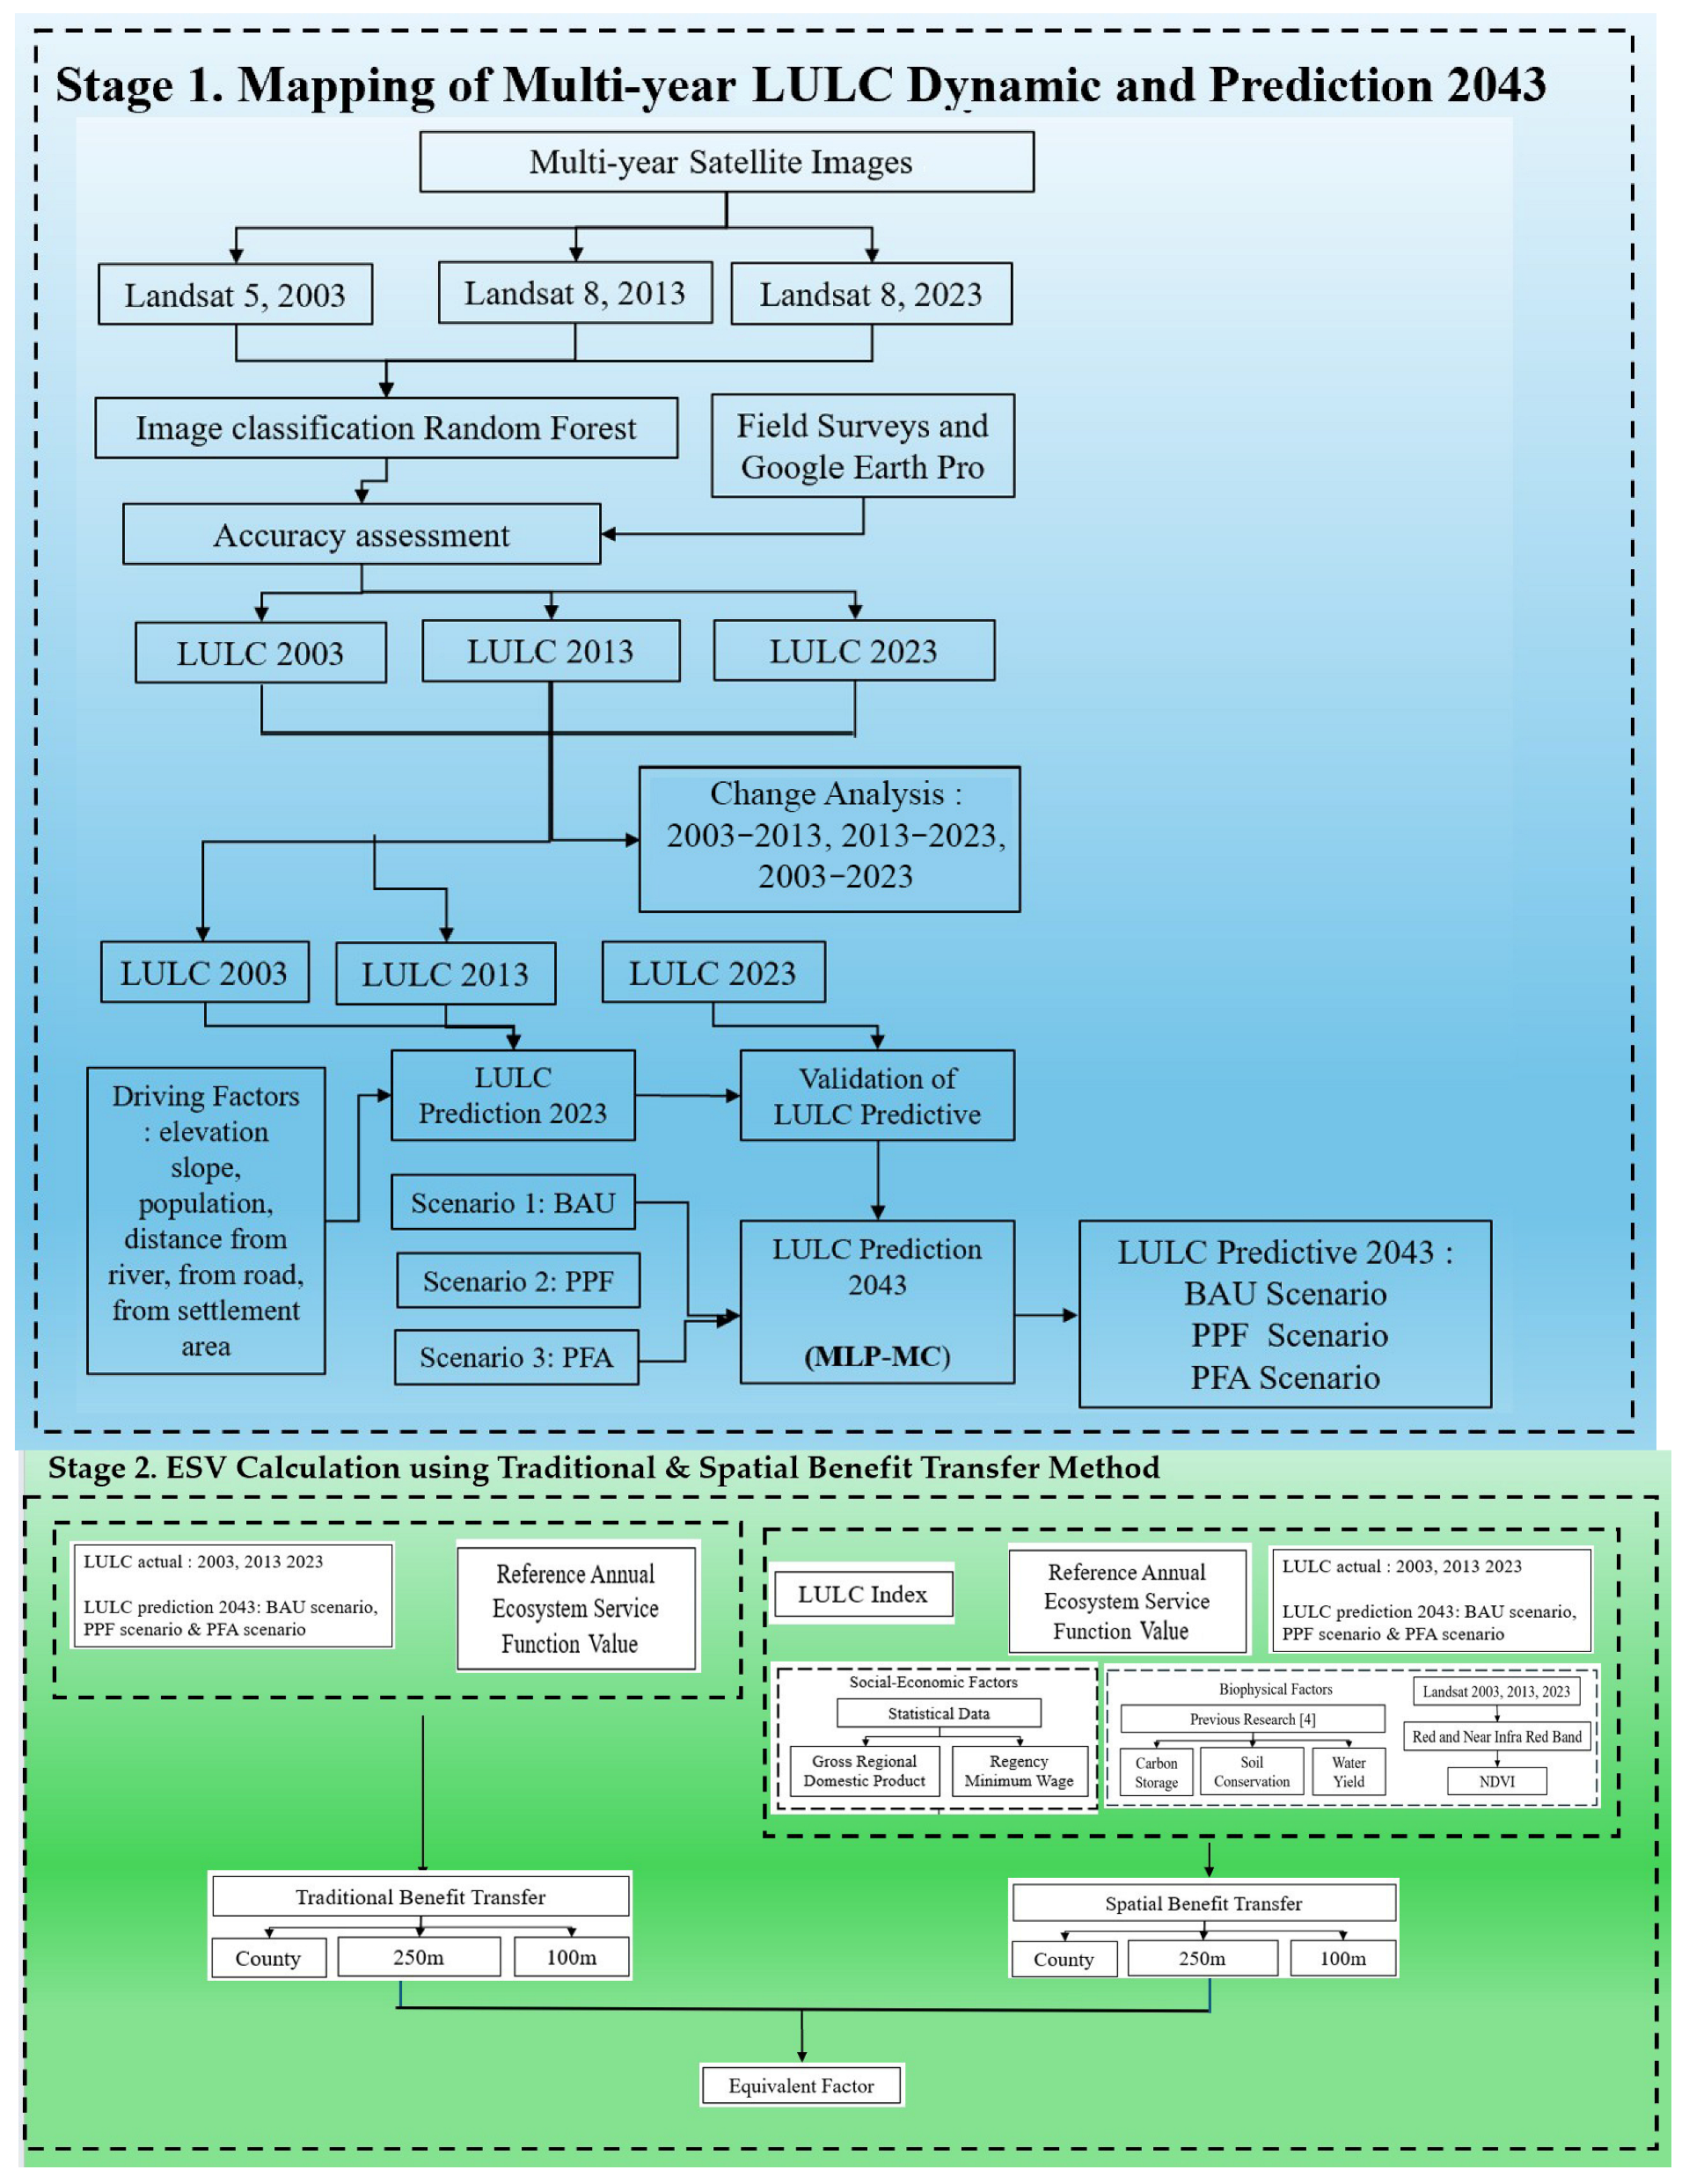
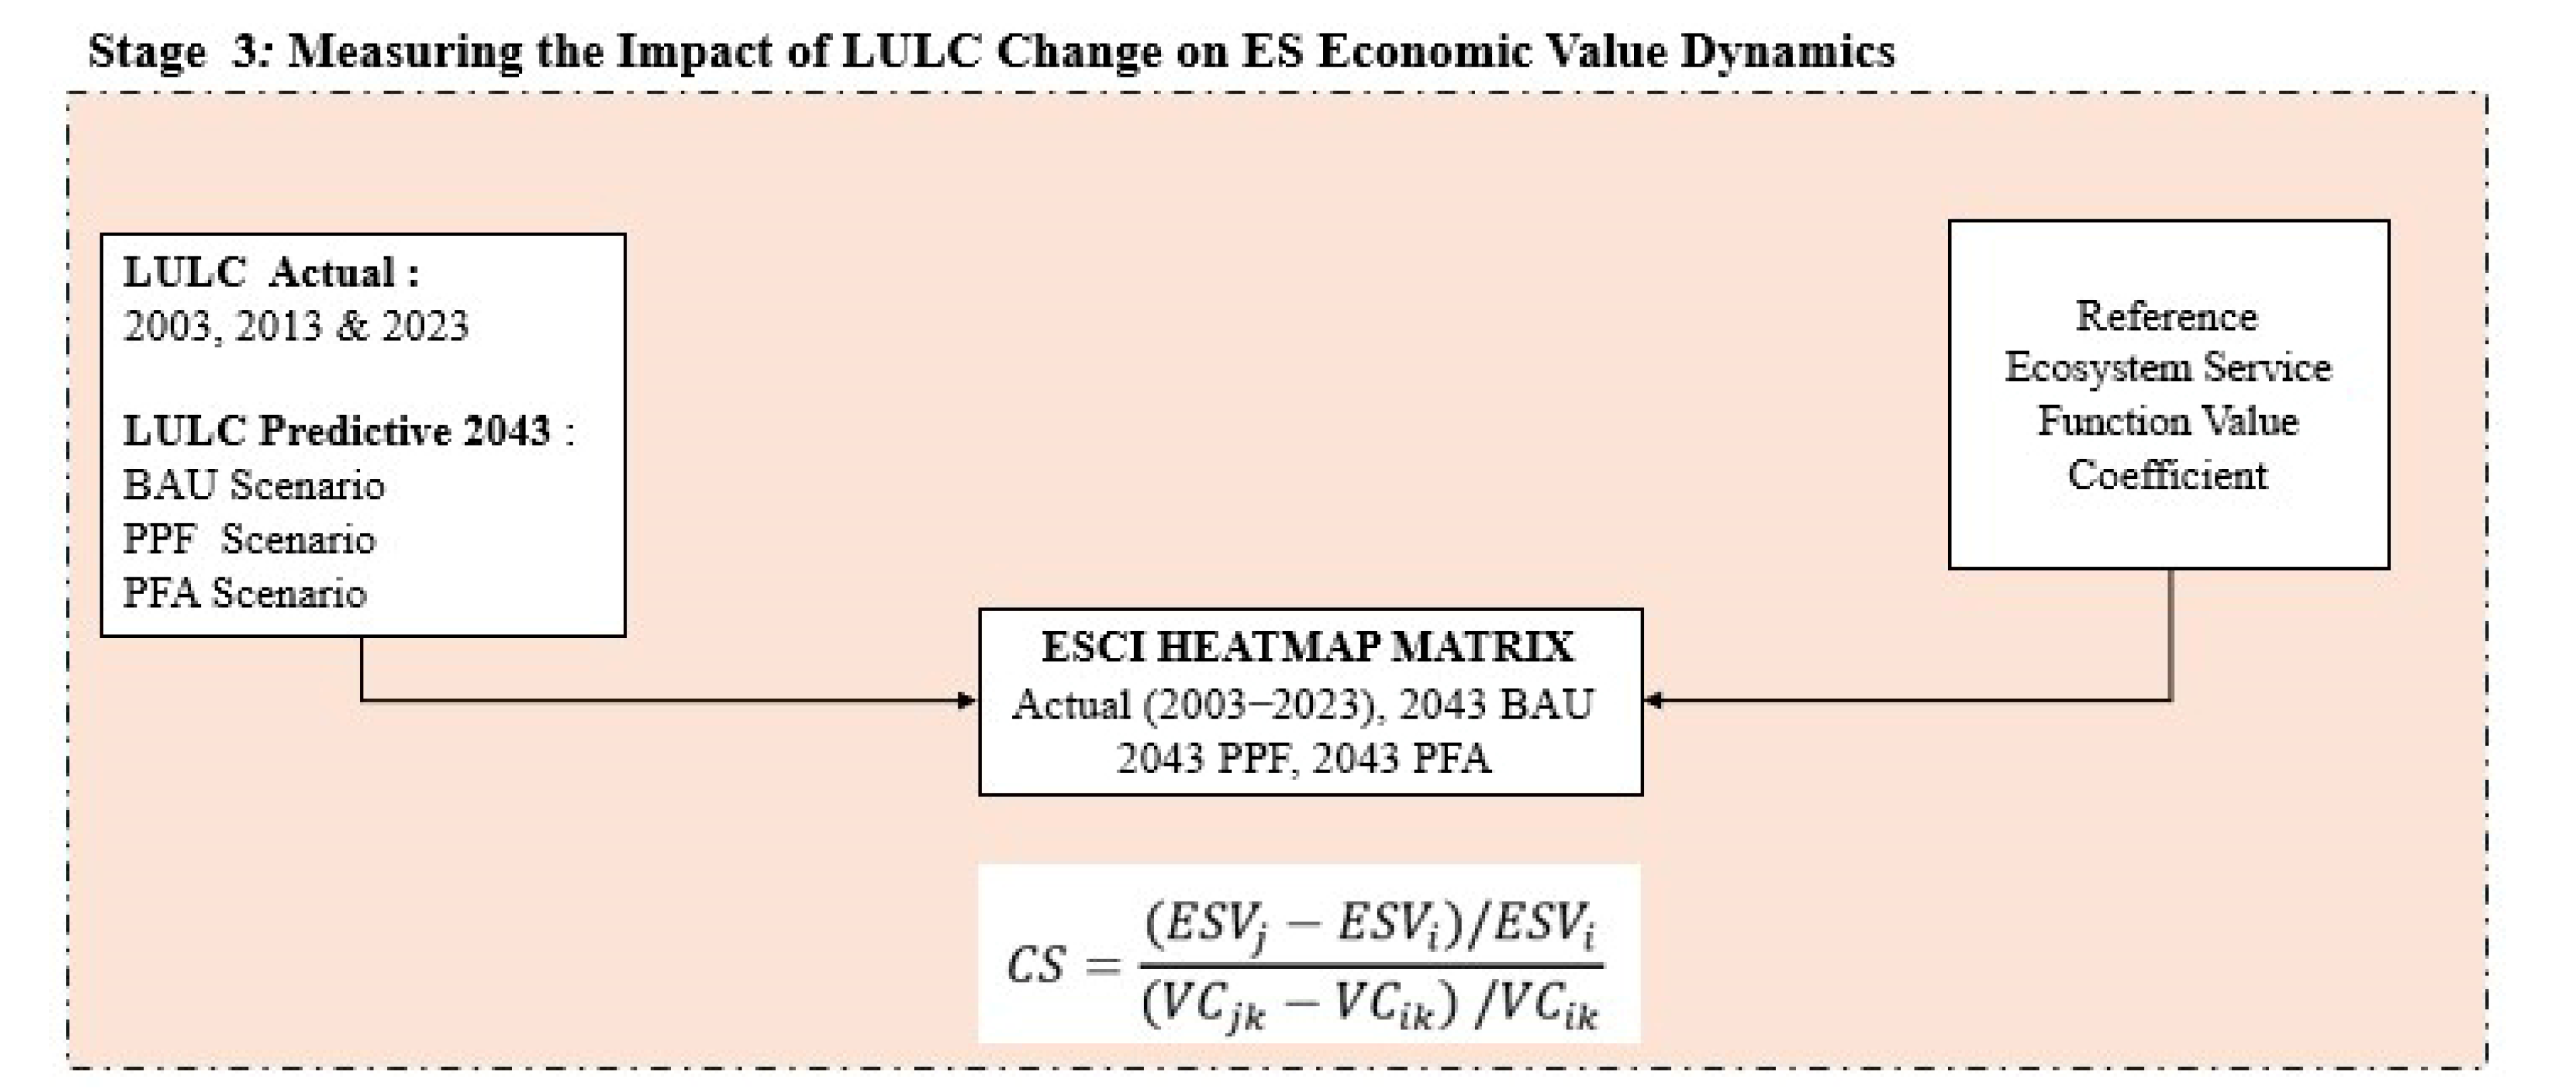
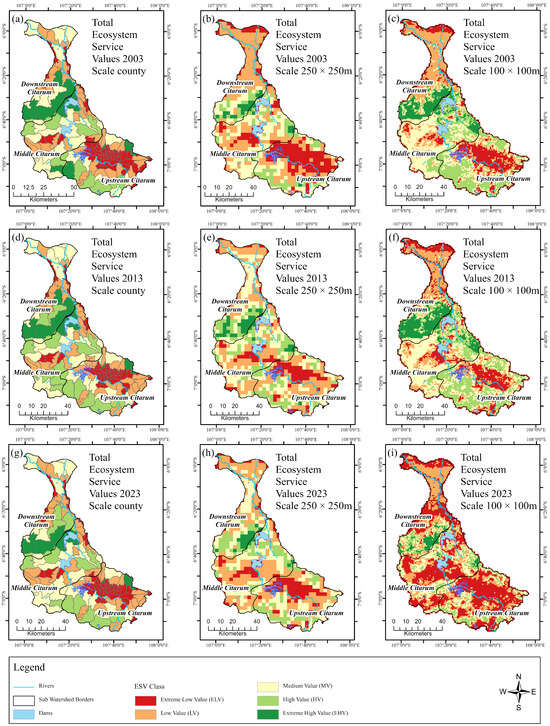
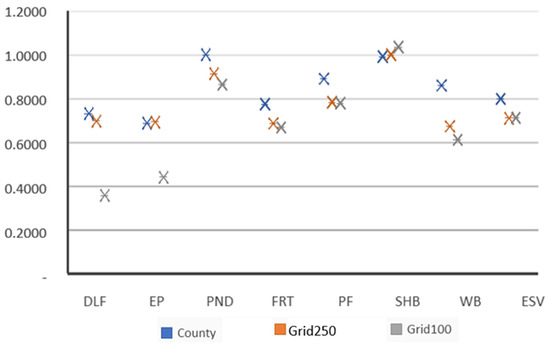
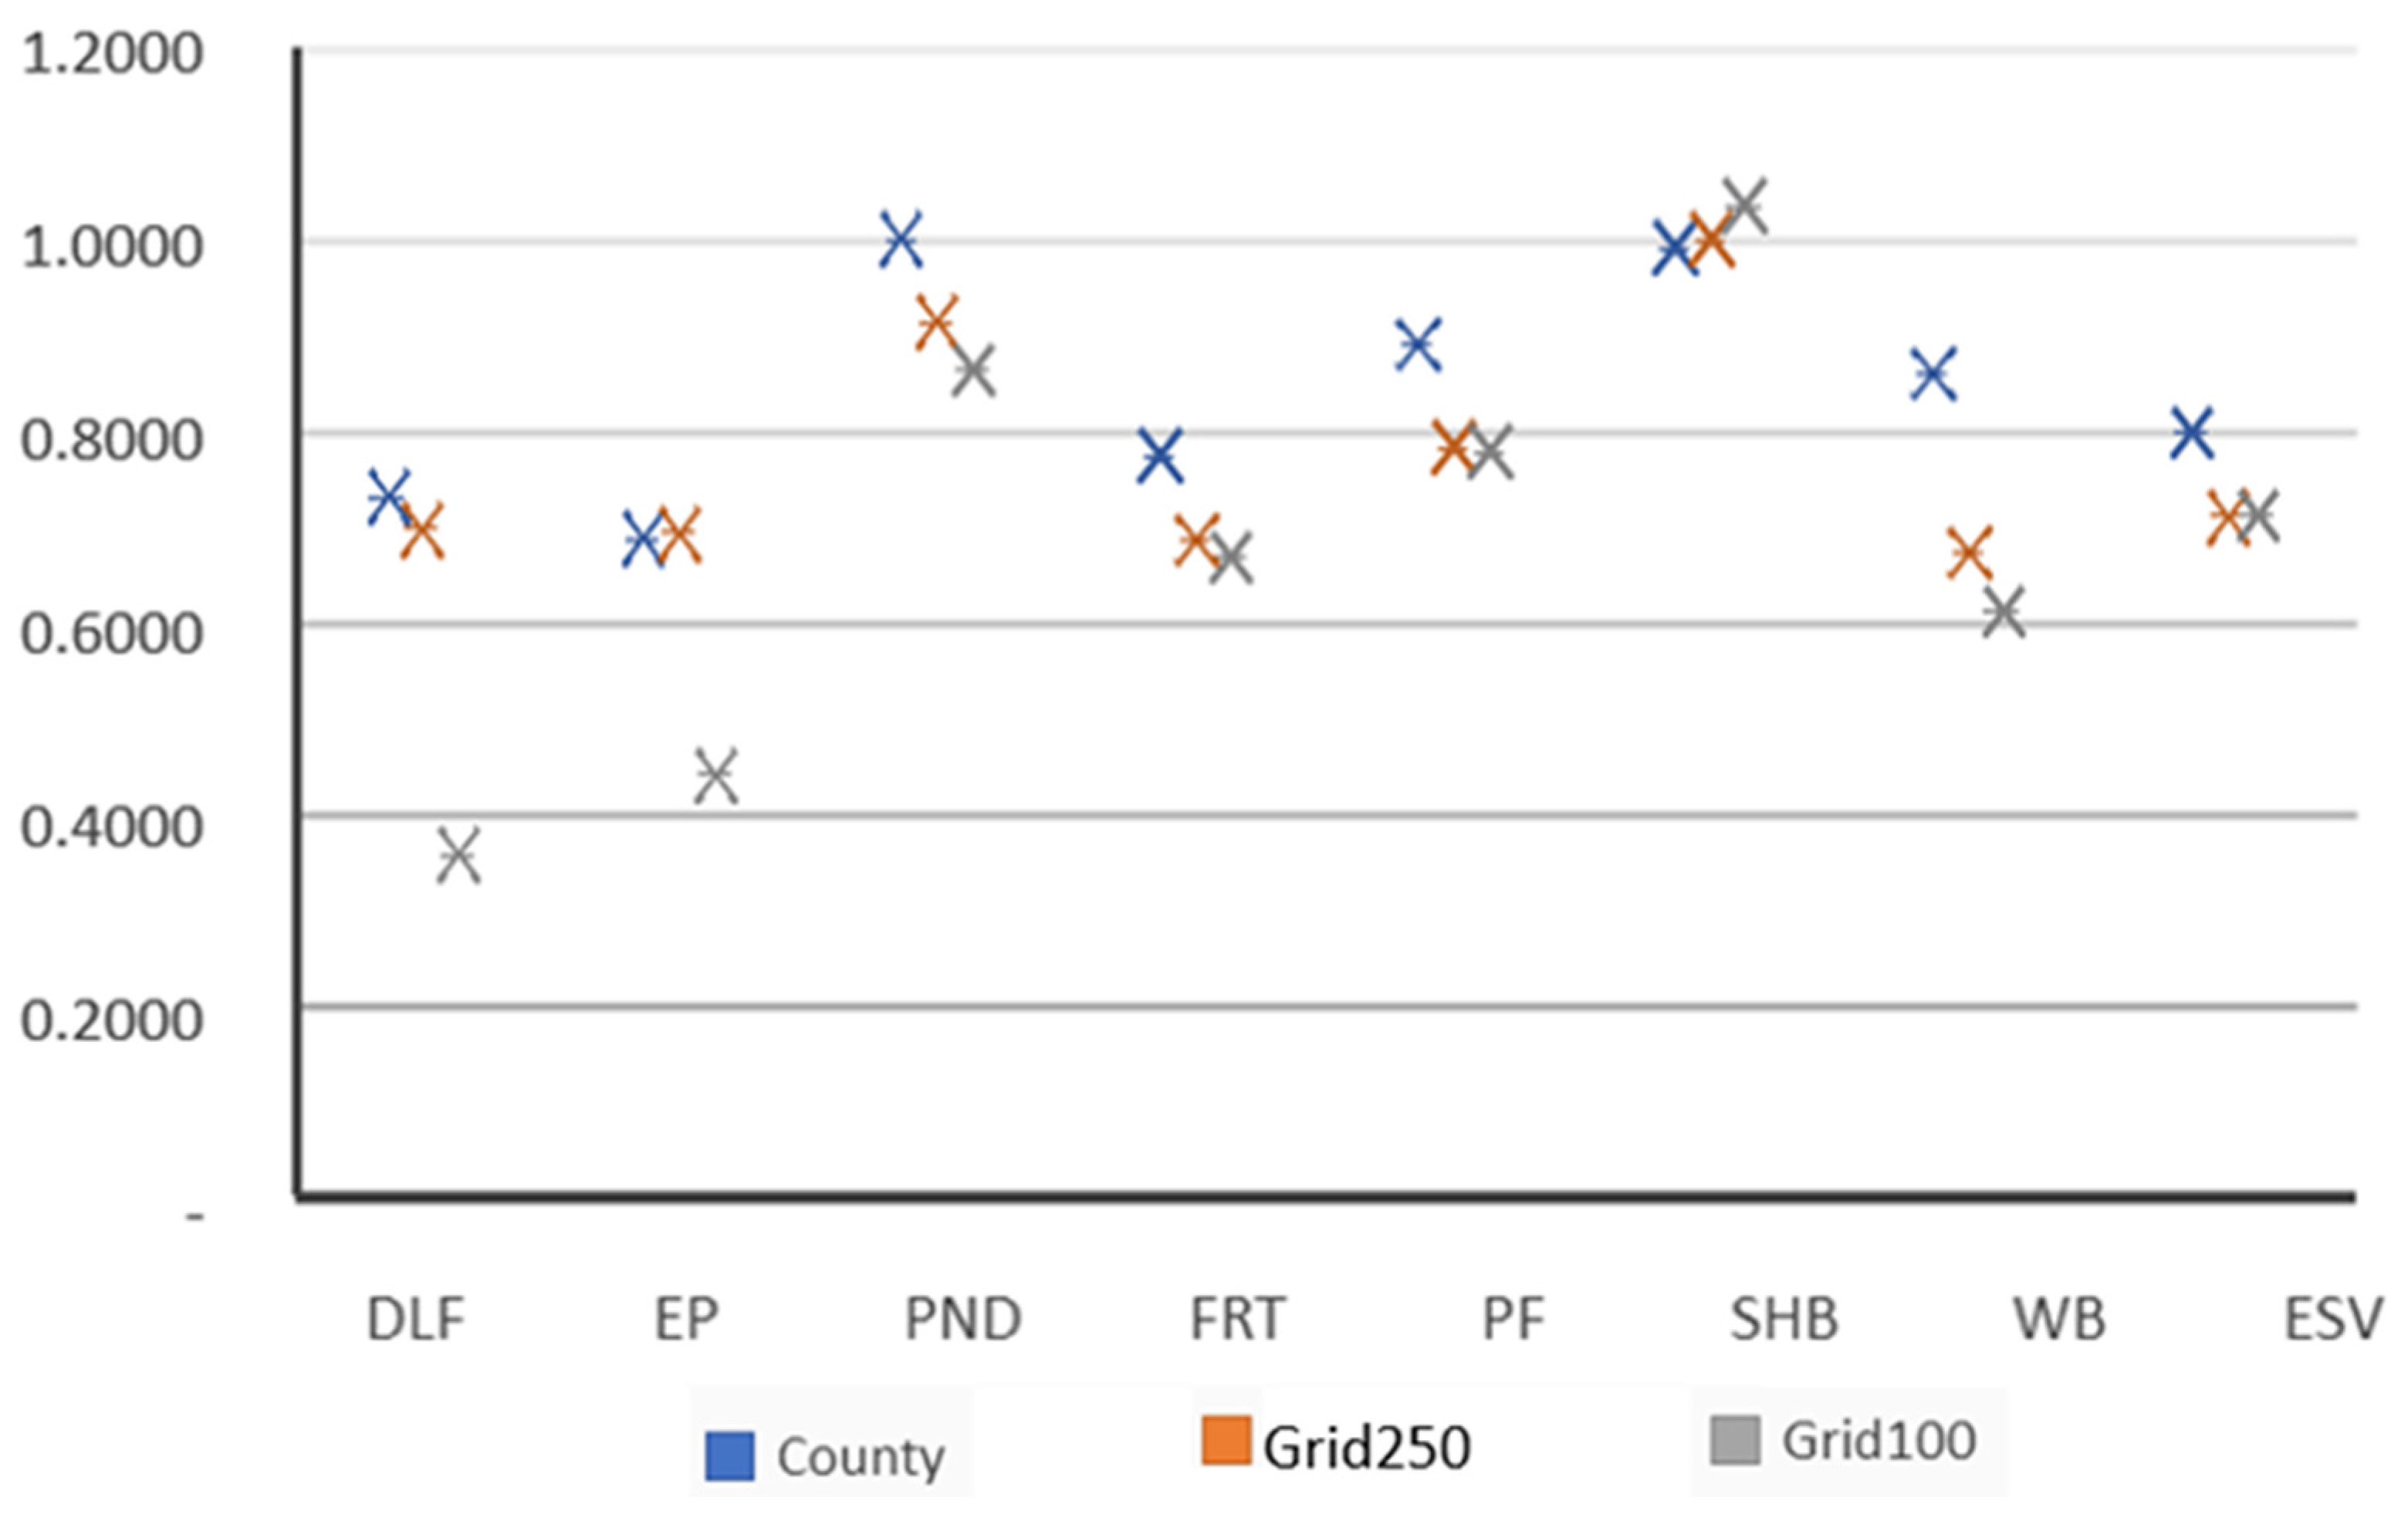
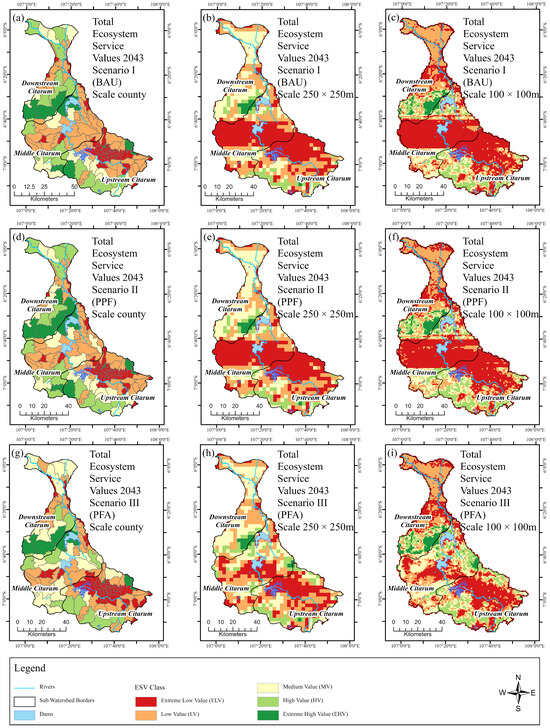
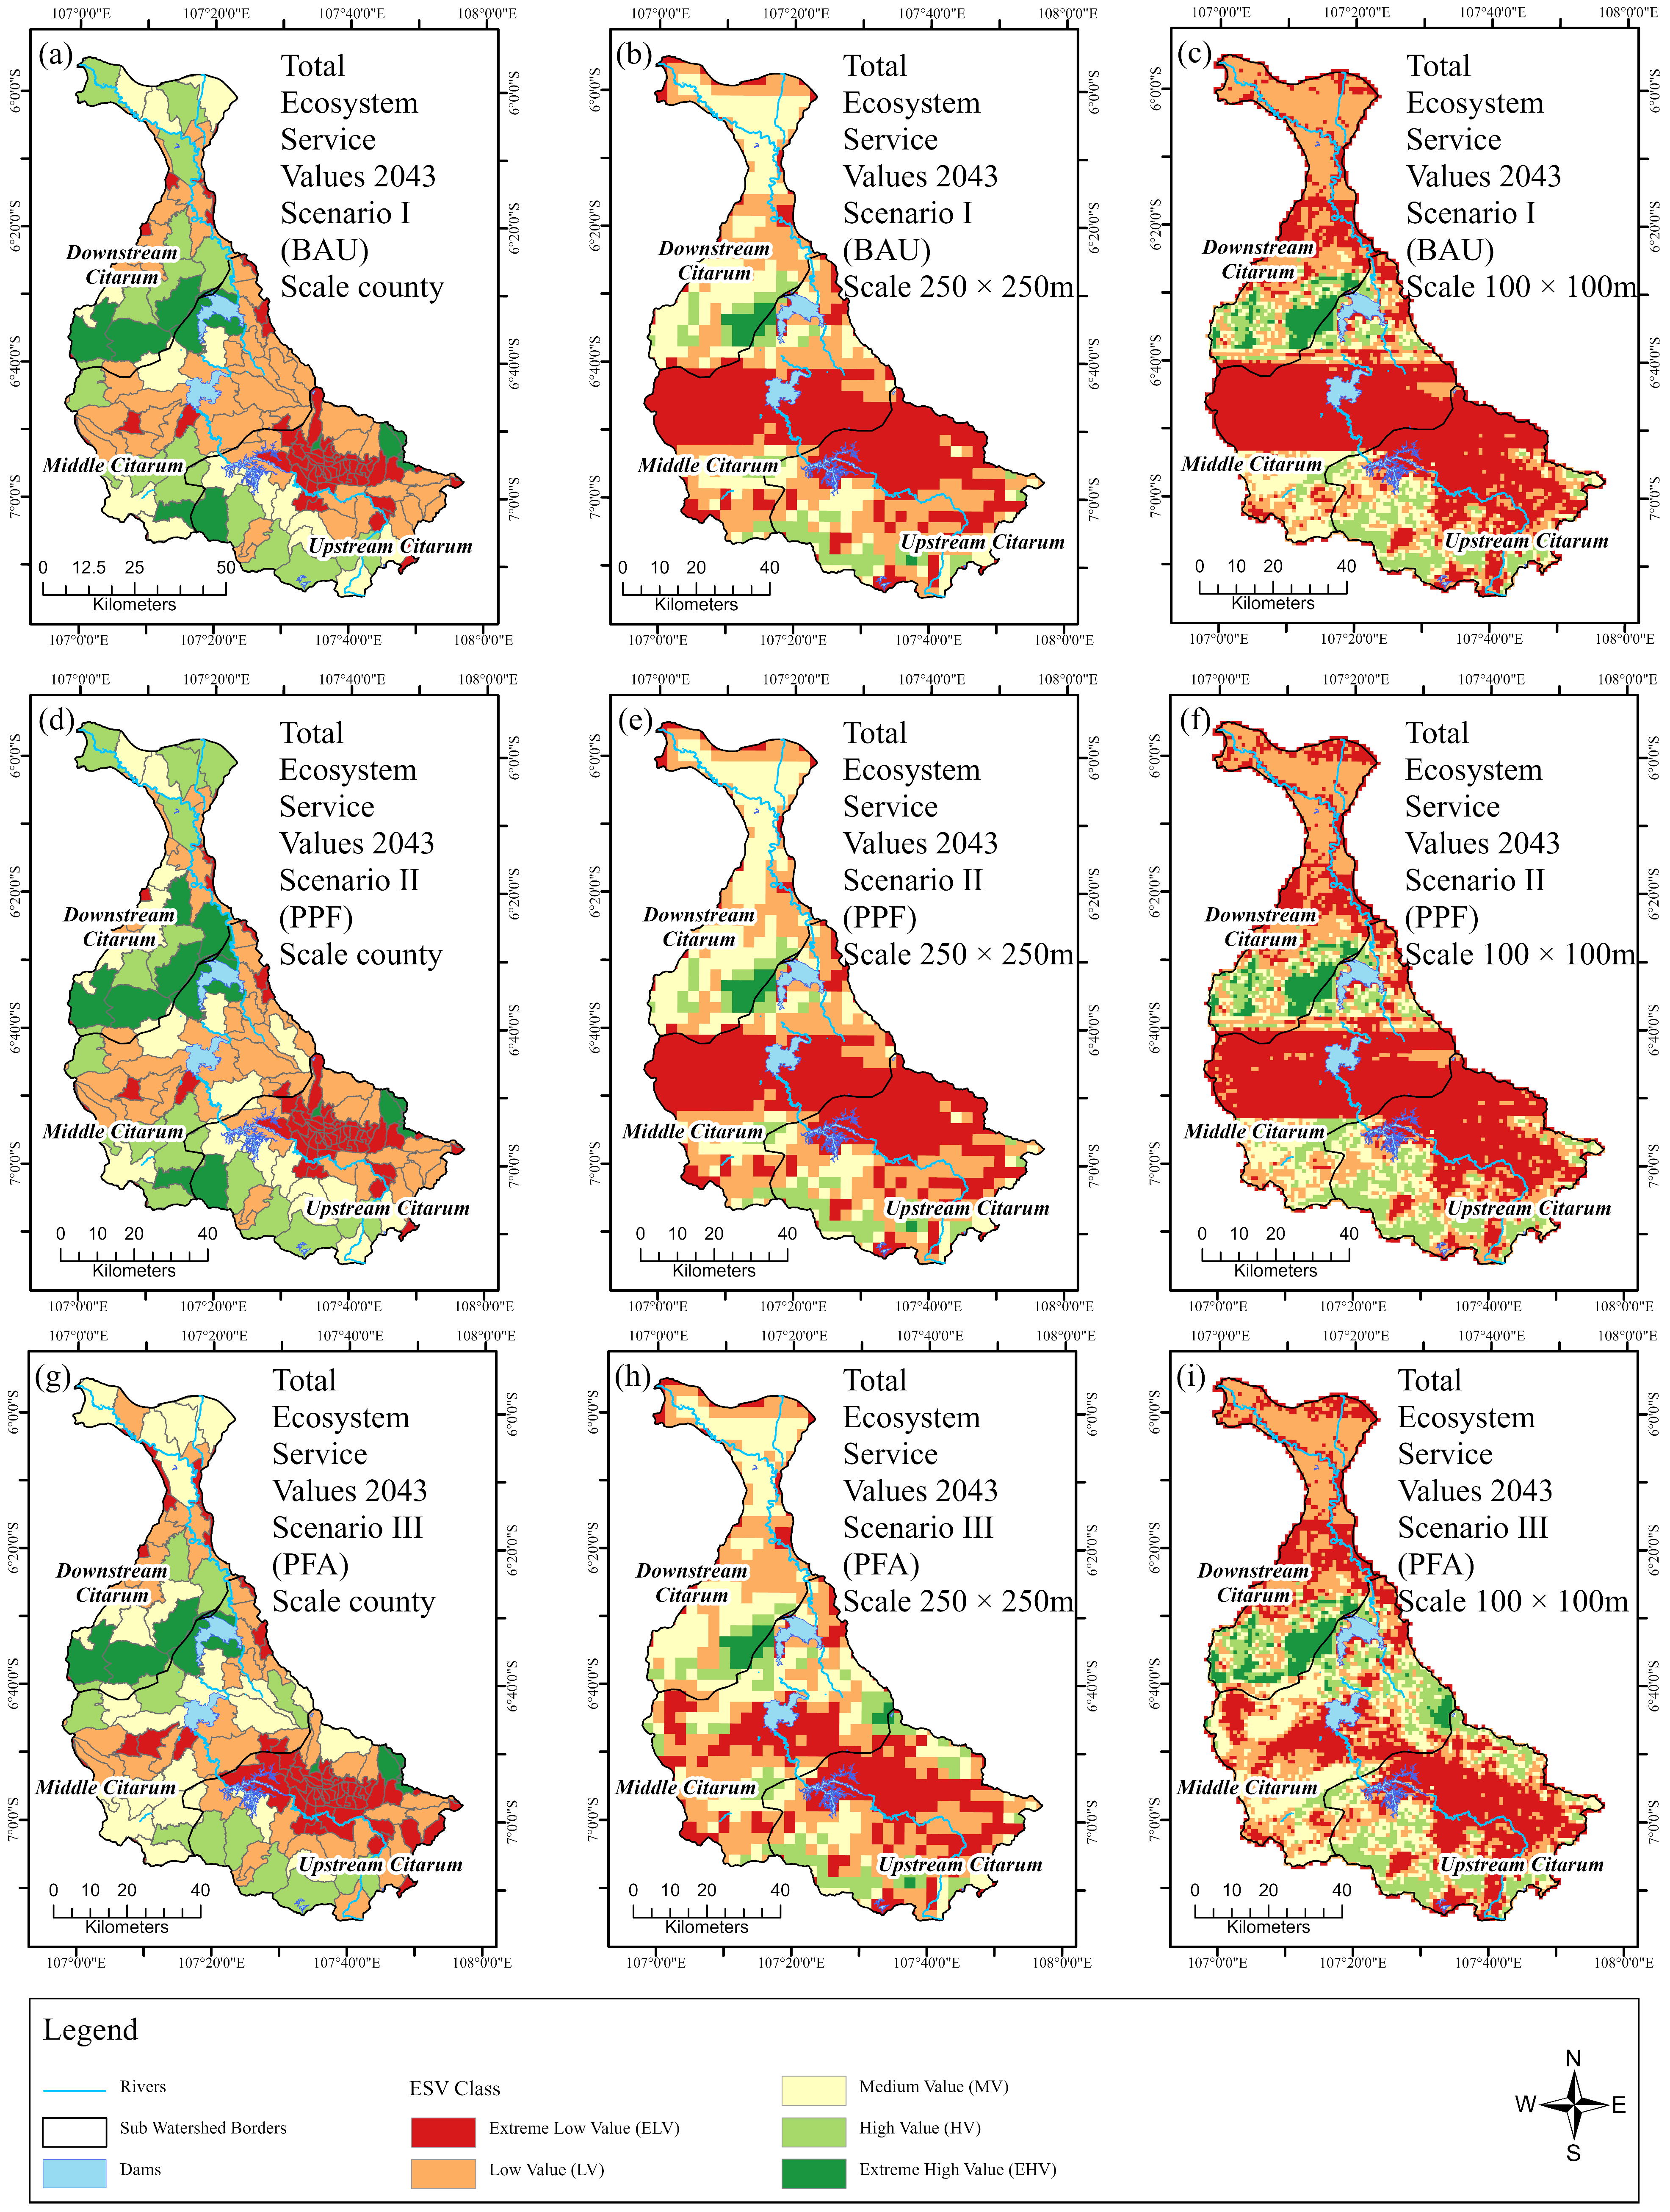
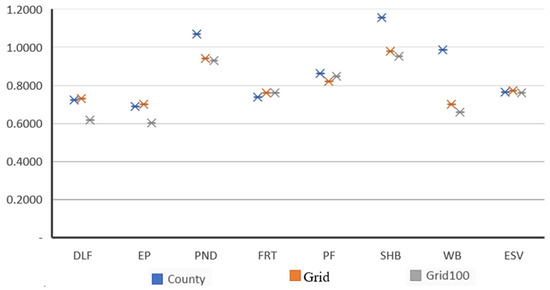
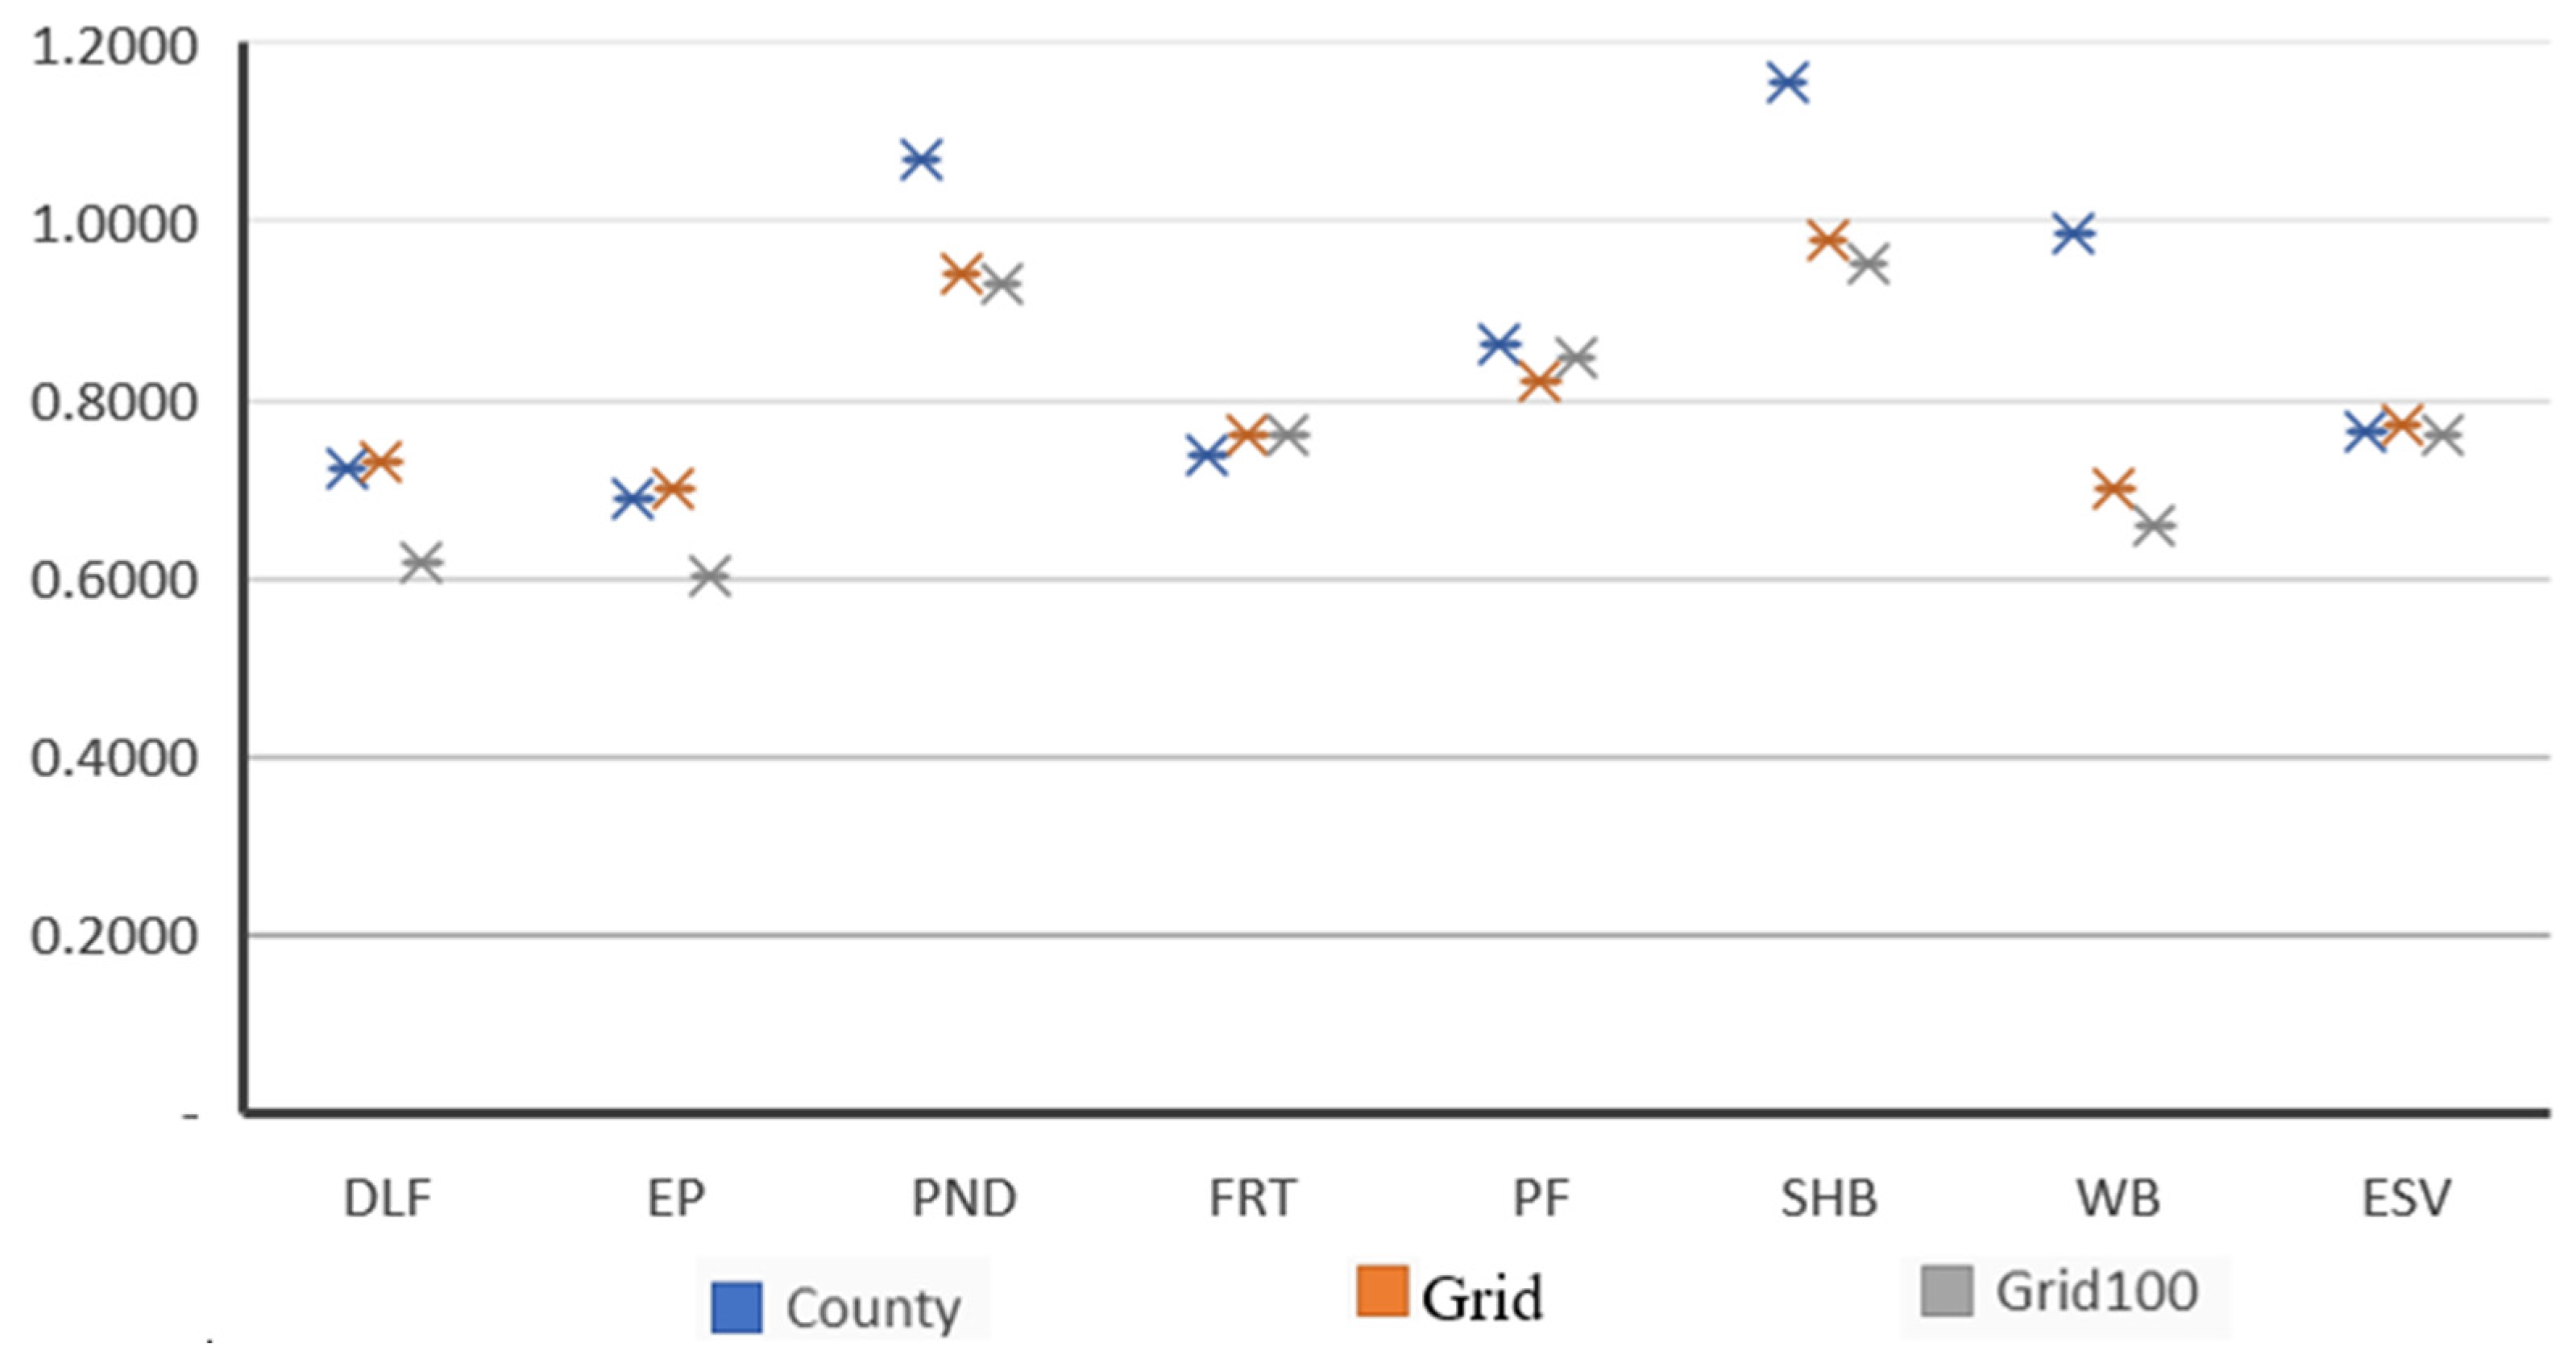
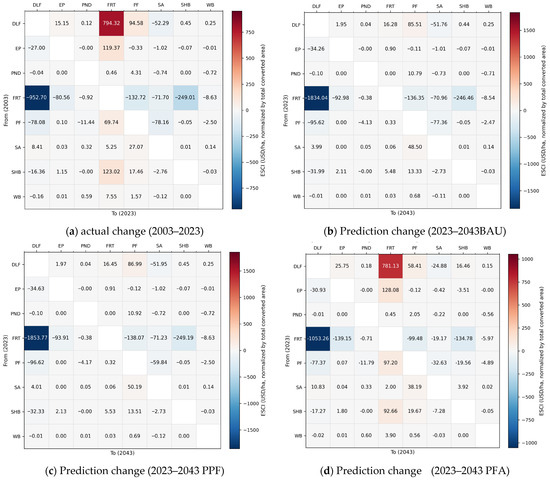
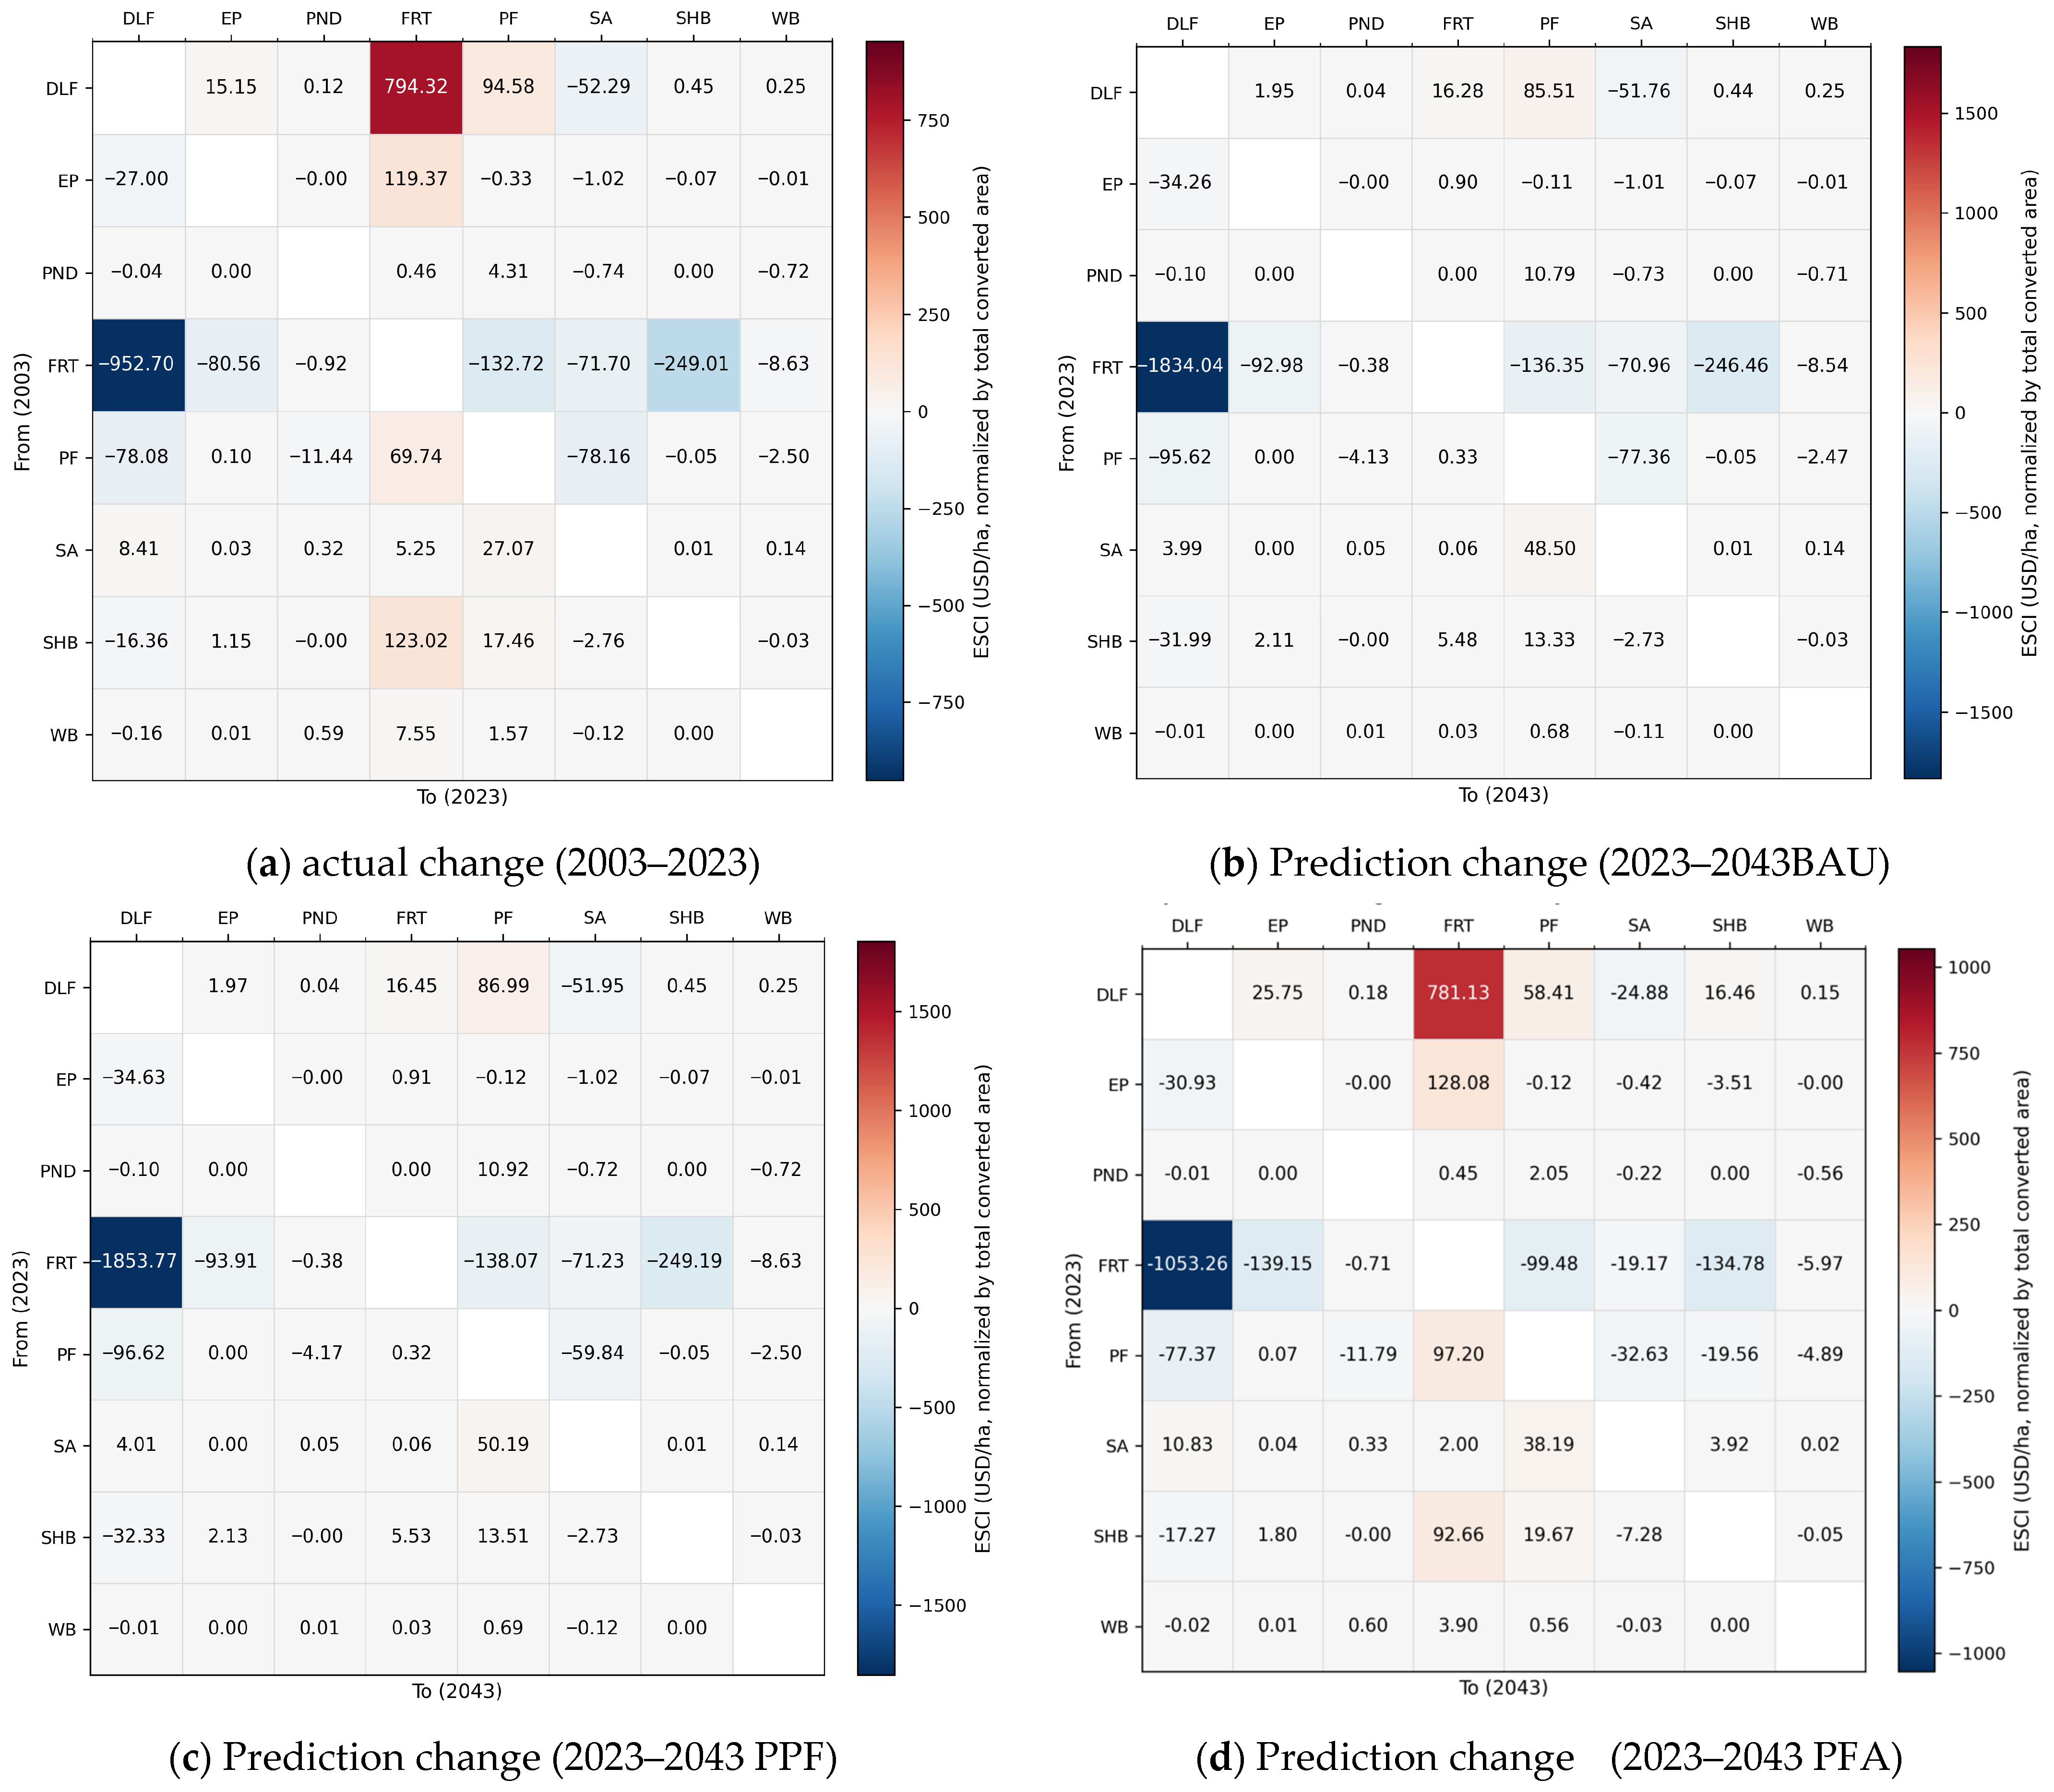

Disclaimer/Publisher’s Note: The statements, opinions and data contained in all publications are solely those of the individual author(s) and contributor(s) and not of MDPI and/or the editor(s). MDPI and/or the editor(s) disclaim responsibility for any injury to people or property resulting from any ideas, methods, instructions or products referred to in the content. |
© 2026 by the authors. Licensee MDPI, Basel, Switzerland. This article is an open access article distributed under the terms and conditions of the Creative Commons Attribution (CC BY) license.