Article

Data Systematization and Preliminary Analysis of Accidental Oil and Petroleum Product Spills in the Russian Arctic and Far North

by
Marina Nevskaya
1,*,
Victor Belyaev
2,
Sergey Aleshichev
3,
Victoriya Vinogradova
4 and
Dinara Shagidulina
1
1
Department of Organization and Management, Saint-Petersburg Mining University, 2, 21 Line, 199106 St. Petersburg, Russia
2
Department of Computer Science and Computer Technology, Saint-Petersburg Mining University, 2, 21 Line, 199106 St. Petersburg, Russia
3
Research and Education Center for the Analysis, Study, and Development of Russia’s National Security Issues, Baltic State Technical University (VOENMEH) Named After D. F. Ustinov, 1, 1st Krasnoarmeyskaya Street, 190005 St. Petersburg, Russia
4
Department of Economics, Saint-Petersburg Mining University, 2, 21 Line, 199106 St. Petersburg, Russia
*
Author to whom correspondence should be addressed.
Resources 2025, 14(9), 147; https://doi.org/10.3390/resources14090147
Submission received: 6 August 2025 / Revised: 9 September 2025 / Accepted: 16 September 2025 / Published: 19 September 2025

Abstract

The effects of climate change, such as melting ice and permafrost in northern and Arctic regions, raise serious concerns about the risk of accidents at oil production, transportation, and storage facilities. This risk is compounded by the lack of comprehensive statistical data on accidental spills, which complicates the development of effective preventive measures. This study introduces an innovative approach to systematizing and analyzing official data on accidental oil and petroleum product spills in the Russian Arctic and Far North. Using association analysis and multivariate methods, the research explores relationships between the causes and objects of accidents. The findings indicate no distinct patterns in the distribution of spill incidents across the Russian Arctic and Far North compared to other regions. However, a notable correlation between the causes of spills and their locations was identified, which may inform the development of targeted preventive measures.

1. Introduction

Accidental oil and petroleum product spills represent one of the most critical environmental and economic threats of our time, with severe consequences for ecosystems, biodiversity, and the socio-economic stability of affected regions [1]. Since the early 2000s and until 2025, global statistics have recorded hundreds of major hydrocarbon spills, underscoring the urgent need for in-depth analyses of their causes, consequences, and the development of effective prevention strategies [2,3,4,5,6]. These concerns have become increasingly relevant in the context of global climate change, rising oil and gas production, and the growing reliance on pipeline infrastructure, which is frequently operated beyond its intended design limits [7]. This section offers a comprehensive overview of global trends in oil pipeline accidents, including an analysis of key incidents, prevailing challenges, and the broader context for examining spill risks in the Russian Arctic and Far North. Special attention is given to the interplay between technological, natural, and anthropogenic factors influencing such accidents, as well as the importance of both international and national experiences in shaping risk mitigation approaches [8,9,10].
Strictly speaking, the Russian Arctic and the Russian Far North should be treated as distinct regions for data analysis, since they differ in natural, economic, and social characteristics that extend beyond the official administrative definitions established in Presidential Decree No. 296 of 2 May 2014 and Government Resolution No. 1946 of 16 November 2021. In the Arctic, natural and climatic factors tend to play a decisive role, whereas in the Far North, anthropogenic and operational factors are more critical. These differences may require distinct approaches to preventive measures. However, both regions serve as major centers of hydrocarbon production, processing, and transportation, which justifies their combined consideration for the analysis of accidental oil and petroleum product spills.
Globally, oil pipeline accidents are increasing, driven by a combination of infrastructure degradation, climate change, and the human factor [11]. According to a 2023 report by the International Energy Agency (IEA), more than 400 major oil spills are reported annually, with approximately 60% attributed to pipeline failures caused by corrosion, mechanical defects, or natural disasters such as floods and earthquakes [5]. A striking example is the Deepwater Horizon disaster in the Gulf of Mexico in April 2010, which released an estimated 4.9 million barrels of oil, marking the largest marine environmental catastrophe in U.S. history [1]. This event resulted in the death of thousands of marine species, widespread pollution of the Louisiana, Mississippi, and Alabama coastlines, and billions of dollars in economic losses to the fishing and tourism industries [12]. The spill’s long-term environmental and economic repercussions persisted for over a decade, prompting international regulatory reforms and the tightening of environmental standards [7]. A similar incident occurred in October 2021 off the coast of California, where approximately 5400 barrels of oil leaked from an undersea pipeline. The spill led to massive wildlife fatalities, beach closures, and the declaration of a state of emergency in Orange County, highlighting both the vulnerability of coastal systems and the inadequacy of emergency preparedness [7].
In addition to natural and technological causes, the human factor and geopolitical instability significantly exacerbate the risk of oil-related accidents [13]. For example, the 2023 Ogoniland oil spill in Nigeria, which contaminated over 40,000 square kilometers of aquatic ecosystems, was linked to poor maintenance practices and corruption in the energy sector. The spill—estimated at 200,000 barrels—disrupted water supplies, destroyed farmland, and affected over 100,000 people, prompting widespread criticism from international human rights organizations such as Amnesty International [14,15].
In the Middle East, the 2022 sabotage of pipeline infrastructure in Iraq exemplifies the rising risks posed by geopolitical conflicts, raising further alarm over the security of global energy systems [16].
Another example is the 2016 Husky Energy spill in Saskatchewan, Canada, which released 225,000 L of oil into the environment. The incident underscored the challenges of monitoring and responding to spills in extreme climates and challenging terrains [17]. Likewise, the 1983 Ixtoc 1 spill in Mexico, which discharged approximately 260,000 tons of oil, illustrated the catastrophic consequences of aging infrastructure and insufficient preventive measures, leaving long-lasting environmental damage in the Bay of Campeche [18].
The United States, with a pipeline network spanning over 720,000 km—including 90,000 km of oil pipelines and 340,000 km of gas pipelines—faces particularly complex challenges associated with the condition of the infrastructure. Between 2010 and 2020, spill incidents rose by 20%, with pipelines constructed before the 1970s accounting for half of the failures, partly due to increased corrosion driven by climate variability [19]. Although federal agencies such as the Pipeline and Hazardous Materials Safety Administration (PHMSA) have implemented stringent inspection protocols and monitoring technologies, underfunding remains a barrier to system modernization [20]. A 2022 report by the Pipeline Safety Trust emphasized that older pipelines, especially in harsh regions like Alaska, are particularly vulnerable to paraffin buildup, corrosion, and mechanical failures, highlighting the need for a global reassessment of pipeline management strategies [21]. In 2024, a 40,000 L spill in Alaska due to corrosion further brought these concerns to the forefront [22].
In the Russian context, the Arctic and Far North face similar but more complex challenges than other regions due to their unique environmental and climatic conditions [23]. One of the most notable incidents was the 1994 Kharyaga oil spill, which released over 100,000 tons of oil. According to data from Rosprirodnadzor, it resulted from inadequate maintenance. The spill severely contaminated tundra ecosystems in the Nenets Autonomous Okrug, affecting over 500 hectares of soil and water bodies [23]. The environmental damage, estimated at $127 million, was so extensive that the incident was listed in the Guinness Book of Records as the largest terrestrial oil spill in history. Remediation efforts continued for over fifteen years [24].
It is important to note that under Presidential Decree No. 296 (2 May 2014), the Russian Arctic was designated a priority region for economic development. However, extreme climatic conditions—such as thawing permafrost and icing—significantly increase the risk of accidents, particularly on major pipeline systems such as the Eastern Siberia–Pacific Ocean (ESPO) oil pipeline [25]. The Far North, defined more broadly in Government Resolution No. 1946 (16 November 2021), faces additional challenges due to rugged terrain, underdeveloped transport infrastructure, and low population density [26].
According to the Russian Ministry of Emergencies (2025) [27], technogenic safety in the Arctic is increasingly compromised by soil displacement due to climate change and the insufficient seismic resistance of critical infrastructure. Research by Tatar Scientific Research and Design Institute of Petroleum (TatNIPIneft) (Bugulma, Russia, 2020) identified paraffin deposition as a recurring problem, particularly in high-viscosity oil pipelines in Western Siberia, where such deposits contribute to up to 30% of recorded accidents [28].
According to the Central Dispatch Office of the Fuel and Energy Complex (CDU TEK), a division of the Russian Energy Agency (REA) under the Ministry of Energy of the Russian Federation, the number of oil spills in 2019 increased by nearly 30%, reaching 10,500 cases. The primary causes were metal corrosion and equipment deterioration, which resulted in corrosion-related damage. These findings highlight the need to introduce advanced technologies for pipeline protection against corrosion and deposits, as well as to adopt modern, high-precision diagnostic and inspection methods [29].
Climate change plays a key role in exacerbating the problem. The Arctic Monitoring and Assessment Programme (AMAP) 2024 report indicates that intensified economic activity—driven by over 300 companies, including approximately 120 engaged in hydrocarbon extraction and transport—is exerting immense pressure on the fragile ecosystems of the Arctic and Far North [30,31].
For instance, ongoing permafrost thaw, recorded since 2000 at a depth of 0.5–1.0 m per year, leads to the deformation of pipeline foundations and contributes to a 10–15% annual increase in pipeline accidents [32].
International studies, including the UN Environment Programme (United Nations Environment Programme, UNEP, 2022) report, estimate that 70% of oil spills globally are caused by corrosion, design flaws, or human error—factors particularly relevant in remote areas like the Russian North, where access to monitoring technologies is limited [7].
Russian researchers have similarly highlighted the environmental risks posed by the country’s aging pipeline infrastructure. In 2015, a study revealed that poor maintenance and regulatory violations contributed significantly to spill incidents [33]. These findings are consistent with observations from the 1980s and 1990s in the former USSR, which identified deteriorating equipment, chemically aggressive oil-water mixtures, high hydrogen sulfide content, and corrosive extraction techniques as leading causes of accidents [33,34].
Taken together, global and national evidence demonstrates that oil pipeline accidents remain a significant issue, exacerbated by climate change, infrastructure aging, and geopolitical tensions [5]. Within Russia, the Arctic and Far North are identified as high-risk zones for environmental disasters, making a detailed analysis of spill incidents, their causes, and consequences imperative [23]. This article seeks to systematize data on accidental oil and petroleum product spills in these vulnerable regions and to formulate recommendations for improving resource transportation safety. This includes drawing upon international best practices and national experience, promoting the use of innovative monitoring technologies, and reinforcing the legal and regulatory framework [27].
Over the past 25 years, Russia has developed a substantial economic and legal toolkit for regulating industrial activities in response to accidental oil spills. Legislative reforms now require oil and gas producers to implement preventive and remedial measures, enhance supervision, and adopt remote industrial safety monitoring systems.
Data on oil and gas facility accidents, published by Rostekhnadzor since 2014, show a declining number of major incidents requiring formal technical investigations [35]. However, previous studies [36] indicate that accidental spills are progressively impacting larger areas of land in Arctic regions, where oil extraction, processing, and transportation are most active.
One of the major challenges remains the lack of standardized statistical reporting, particularly regarding the causes and economic consequences of spills. This gap hinders the development of targeted, evidence-based prevention strategies. The reliability and availability of data on accidental oil spills continue to be a concern across all types of incidents, whether they occur in pipelines, wells, during loading or unloading operations, or at storage facilities.
Consequently, the systematization of information on emergency spills is essential for substantiating key preventive measures. This defines the purpose of the present study.
Objectives:
  • To establish criteria for the systematization of accidental oil and petroleum product spills.
  • To identify the primary causes of such spills in the Russian Arctic and Far North.

2. Materials and Methods

This study is based on secondary data sources, primarily the official reports of the Federal Service for Environmental, Technological, and Nuclear Supervision (Rostekhnadzor) [37], covering the period from 2014 to 2024. It is important to note that these reports reflect the limitations introduced by Government Resolution No. 1074-r (26 April 2023, as amended on 5 March 2024), which suspended the publication of certain official statistics on oil and gas production. The reports used in this study contain non-systematized information regarding the entities involved, the nature and causes of accidents, their consequences, and recommended preventive actions.
Over the 11-year study period, 174 accidents involving oil and petroleum products were recorded, of which 50 resulted in direct spills. The choice of this timeframe was determined by the availability of official data since 2014.
The research methodology consisted of four key stages:
  • Processing and systematizing secondary information on oil and petroleum product spills.
  • Data formalization.
  • Data structuring.
  • Comprehensive data analysis.
At the initial stage of the study, the criteria for grouping the information were established to enable systematic analysis. The primary classification features identified were object; type of accident; spill causes; consequences within Russia, including its Arctic and Far North regions.
At the second stage, the raw data were formalized. The objects and types of accidents were classified in accordance with the Safety Guide: Methodological Recommendations for the Classification of Technogenic Events in the Field of Industrial Safety at Hazardous Production Facilities in the Oil and Gas Sector, approved by the Federal Service for Environmental, Technological, and Nuclear Supervision (Order No. 29, dated 24 January 2018).
To classify the causes of accidental spills, standardized typologies from both official reports and academic literature were employed [38].
The severity of spills was categorized as local, regional, interregional, or federal, based on the volume of discharge (in tons), following the current Russian regulatory framework [39].
The technical causes of accidents included external mechanical damage, material defects, equipment defects, and weld seam failures.
Causes associated with physical and chemical processes were grouped separately and included: internal and external corrosion; increased vibration; accumulation of electrostatic charges, etc.
Organizational causes were subdivided into administrative factors (lack of or insufficient oversight, poor staff training, etc.) and operational factors (violations of standard operating procedures and regulations).
The consequences of accidents were classified into three categories: economic (including costs related to spill remediation and damage compensation); social (presence or absence of casualties, including fatalities); and technical.
Technical consequences were further broken down into temporary suspension of operations without significant damage, structural damage to the facility, and destruction of the facility. The last two outcomes imply that the production facility is taken permanently out of service.
At the third stage, a comprehensive statistical analysis was conducted to explore the relationships between the identified variables. This analysis utilized Tschuprow’s T and Pearson’s contingency coefficients, calculated using RStudio (Posit team, Boston, MA, USA), version 2025.5.0.496 [40].
The data describing spill accidents were considered as a dataset comprising 12 variables (features). Two of these variables—year and a conditional number—served to identify each accident, while the remaining features were categorical (qualitative). These qualitative variables were divided into two groups: ordinal (ordered) and nominal (non-ordered).
The analysis was performed in pairs, examining the relationship between each pair of categorical variables while considering their types (ordered or nominal). Since there are three possible combinations—nominal-nominal, ordinal-ordinal, and ordinal-nominal—different methods were employed to analyze these relationships [41].
For pairs of nominal variables, the strength of association was measured using the contingency coefficient.
The primary step in calculating this coefficient involved constructing a contingency table, where each cell contained the frequency of occurrences for a specific pair of feature levels.
The contingency coefficient was calculated using Tschuprow’s formula:
T = φ 2 m x 1 · m y 1
where mx is the number of categories for variable x, my is the number of categories for variable y, and φ2 is the measure of association.
This method is particularly suitable when variables have more than two levels, as was the case in this study. Unlike Pearson’s contingency coefficient, which is generally used for binary variables, Tschuprow’s T can effectively assess relationships between multi-level variables. The coefficient ranges from 0 to 1, with values closer to 1 indicating a stronger relationship. In this study, relationships were considered statistically significant when T > 0.3.
For ordered–ordered and nominal–ordered variable pairs, the linear-by-linear association test was employed. The null hypothesis for this test posits that there is no association between the two variables. A p-value greater than 0.05 indicates that the observed relationship is not statistically significant at the 95% confidence level.

3. Results

  • Table 1 presents the results of the classification of oil and petroleum product spills across Russia, as well as specifically within the Russian Arctic (RA), the Russian Far North (RFN), and their combined territories.
In this table, “levels” represent categorical values of each variable.
2.
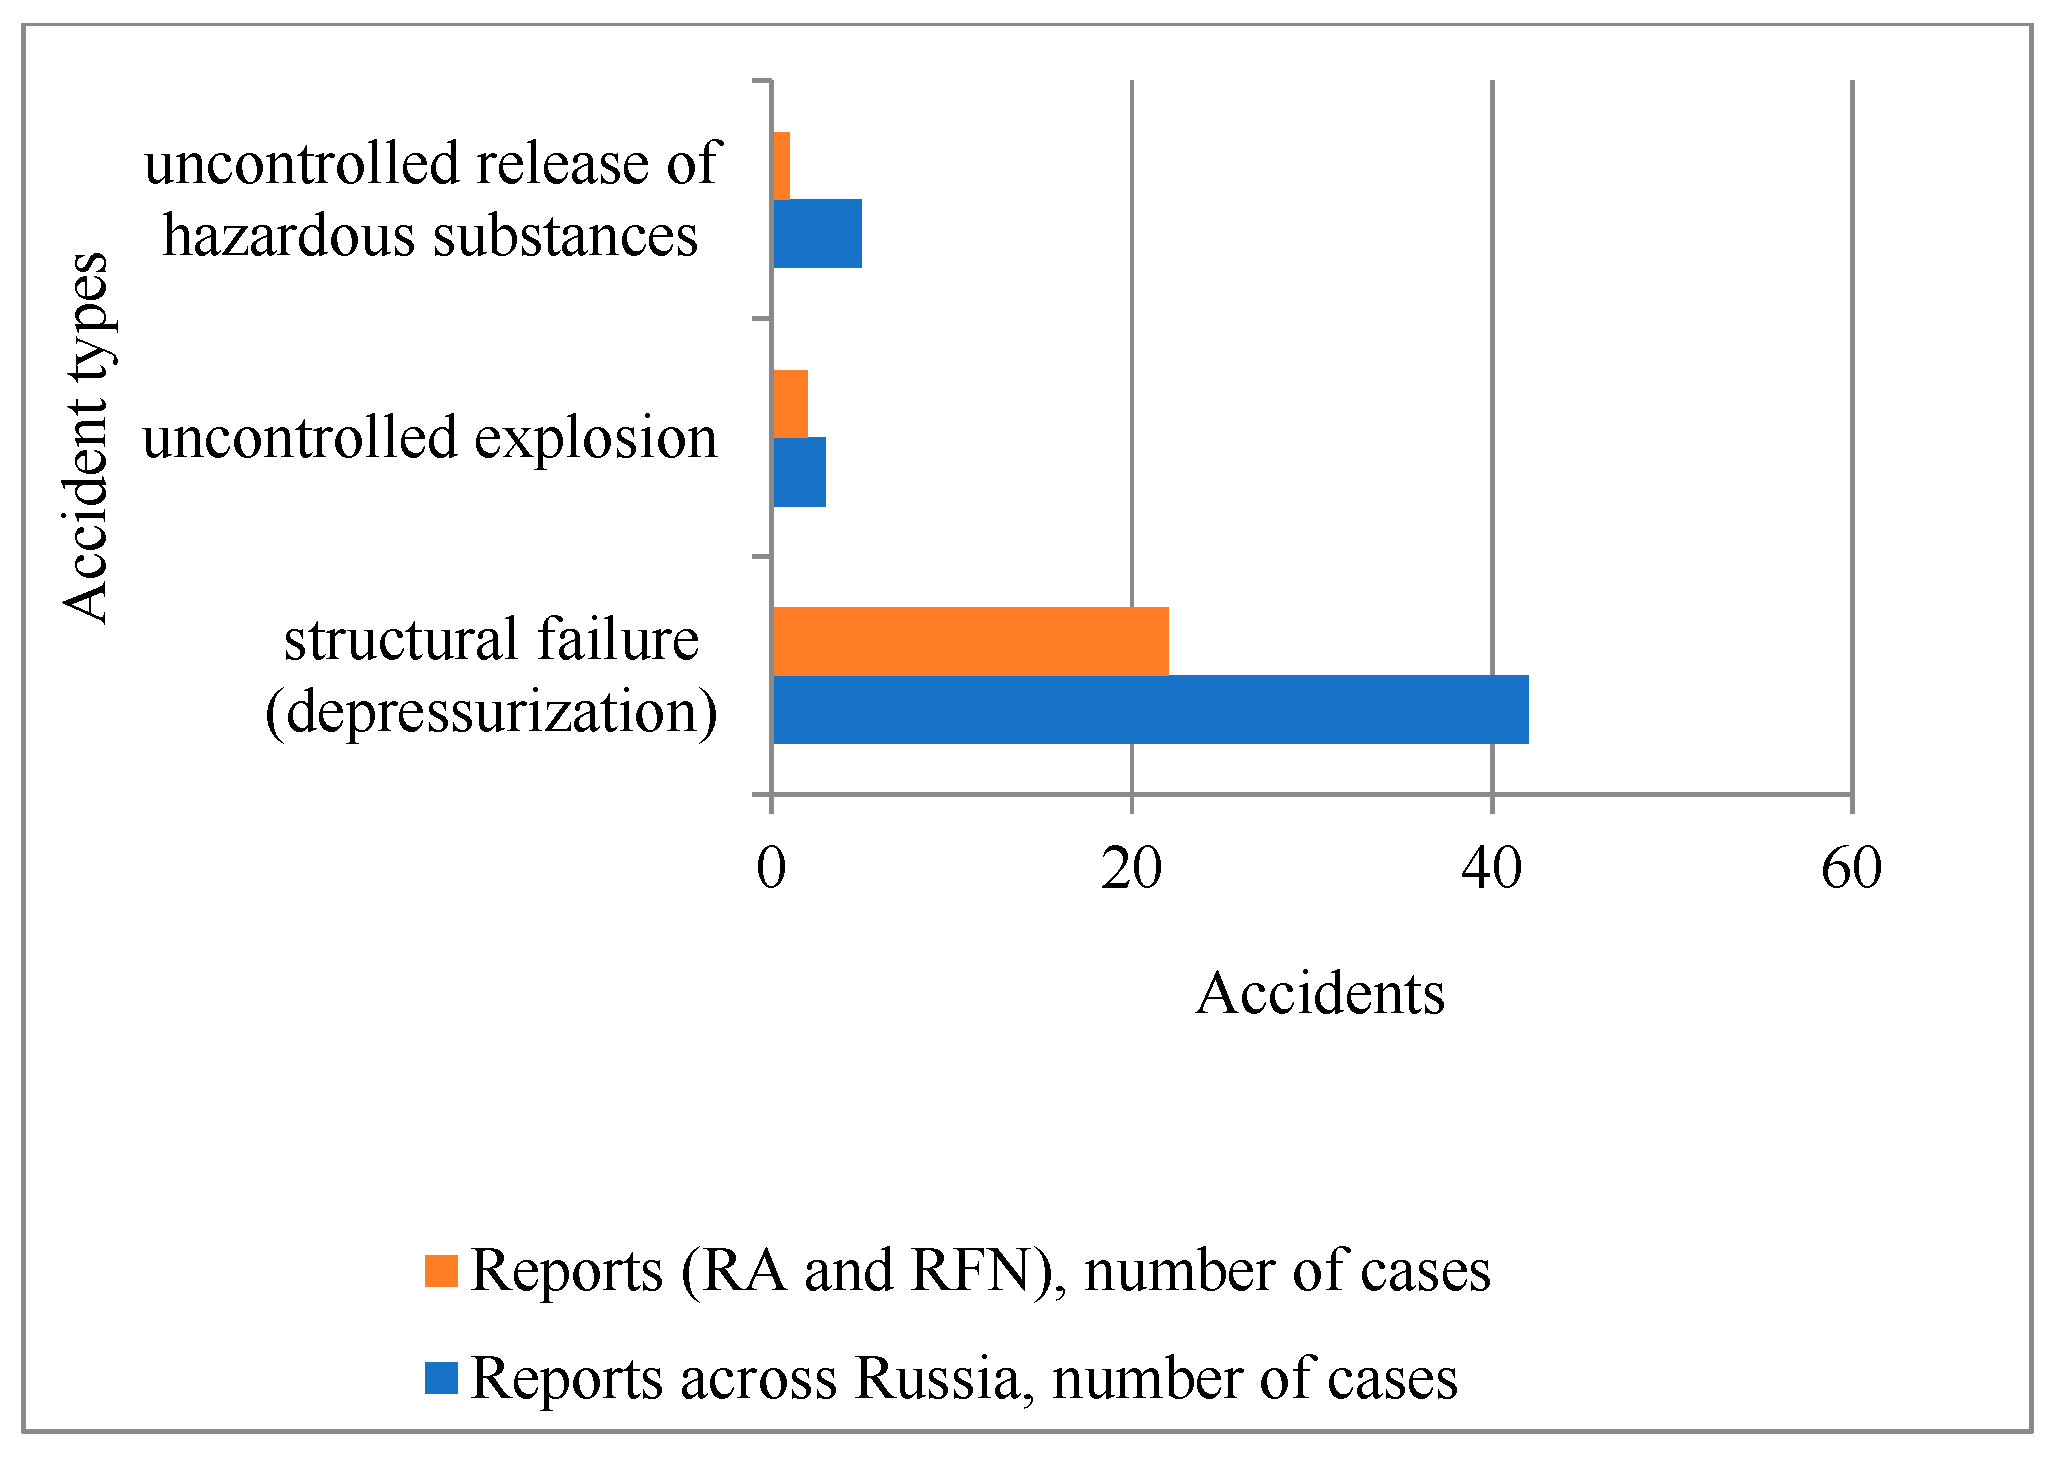
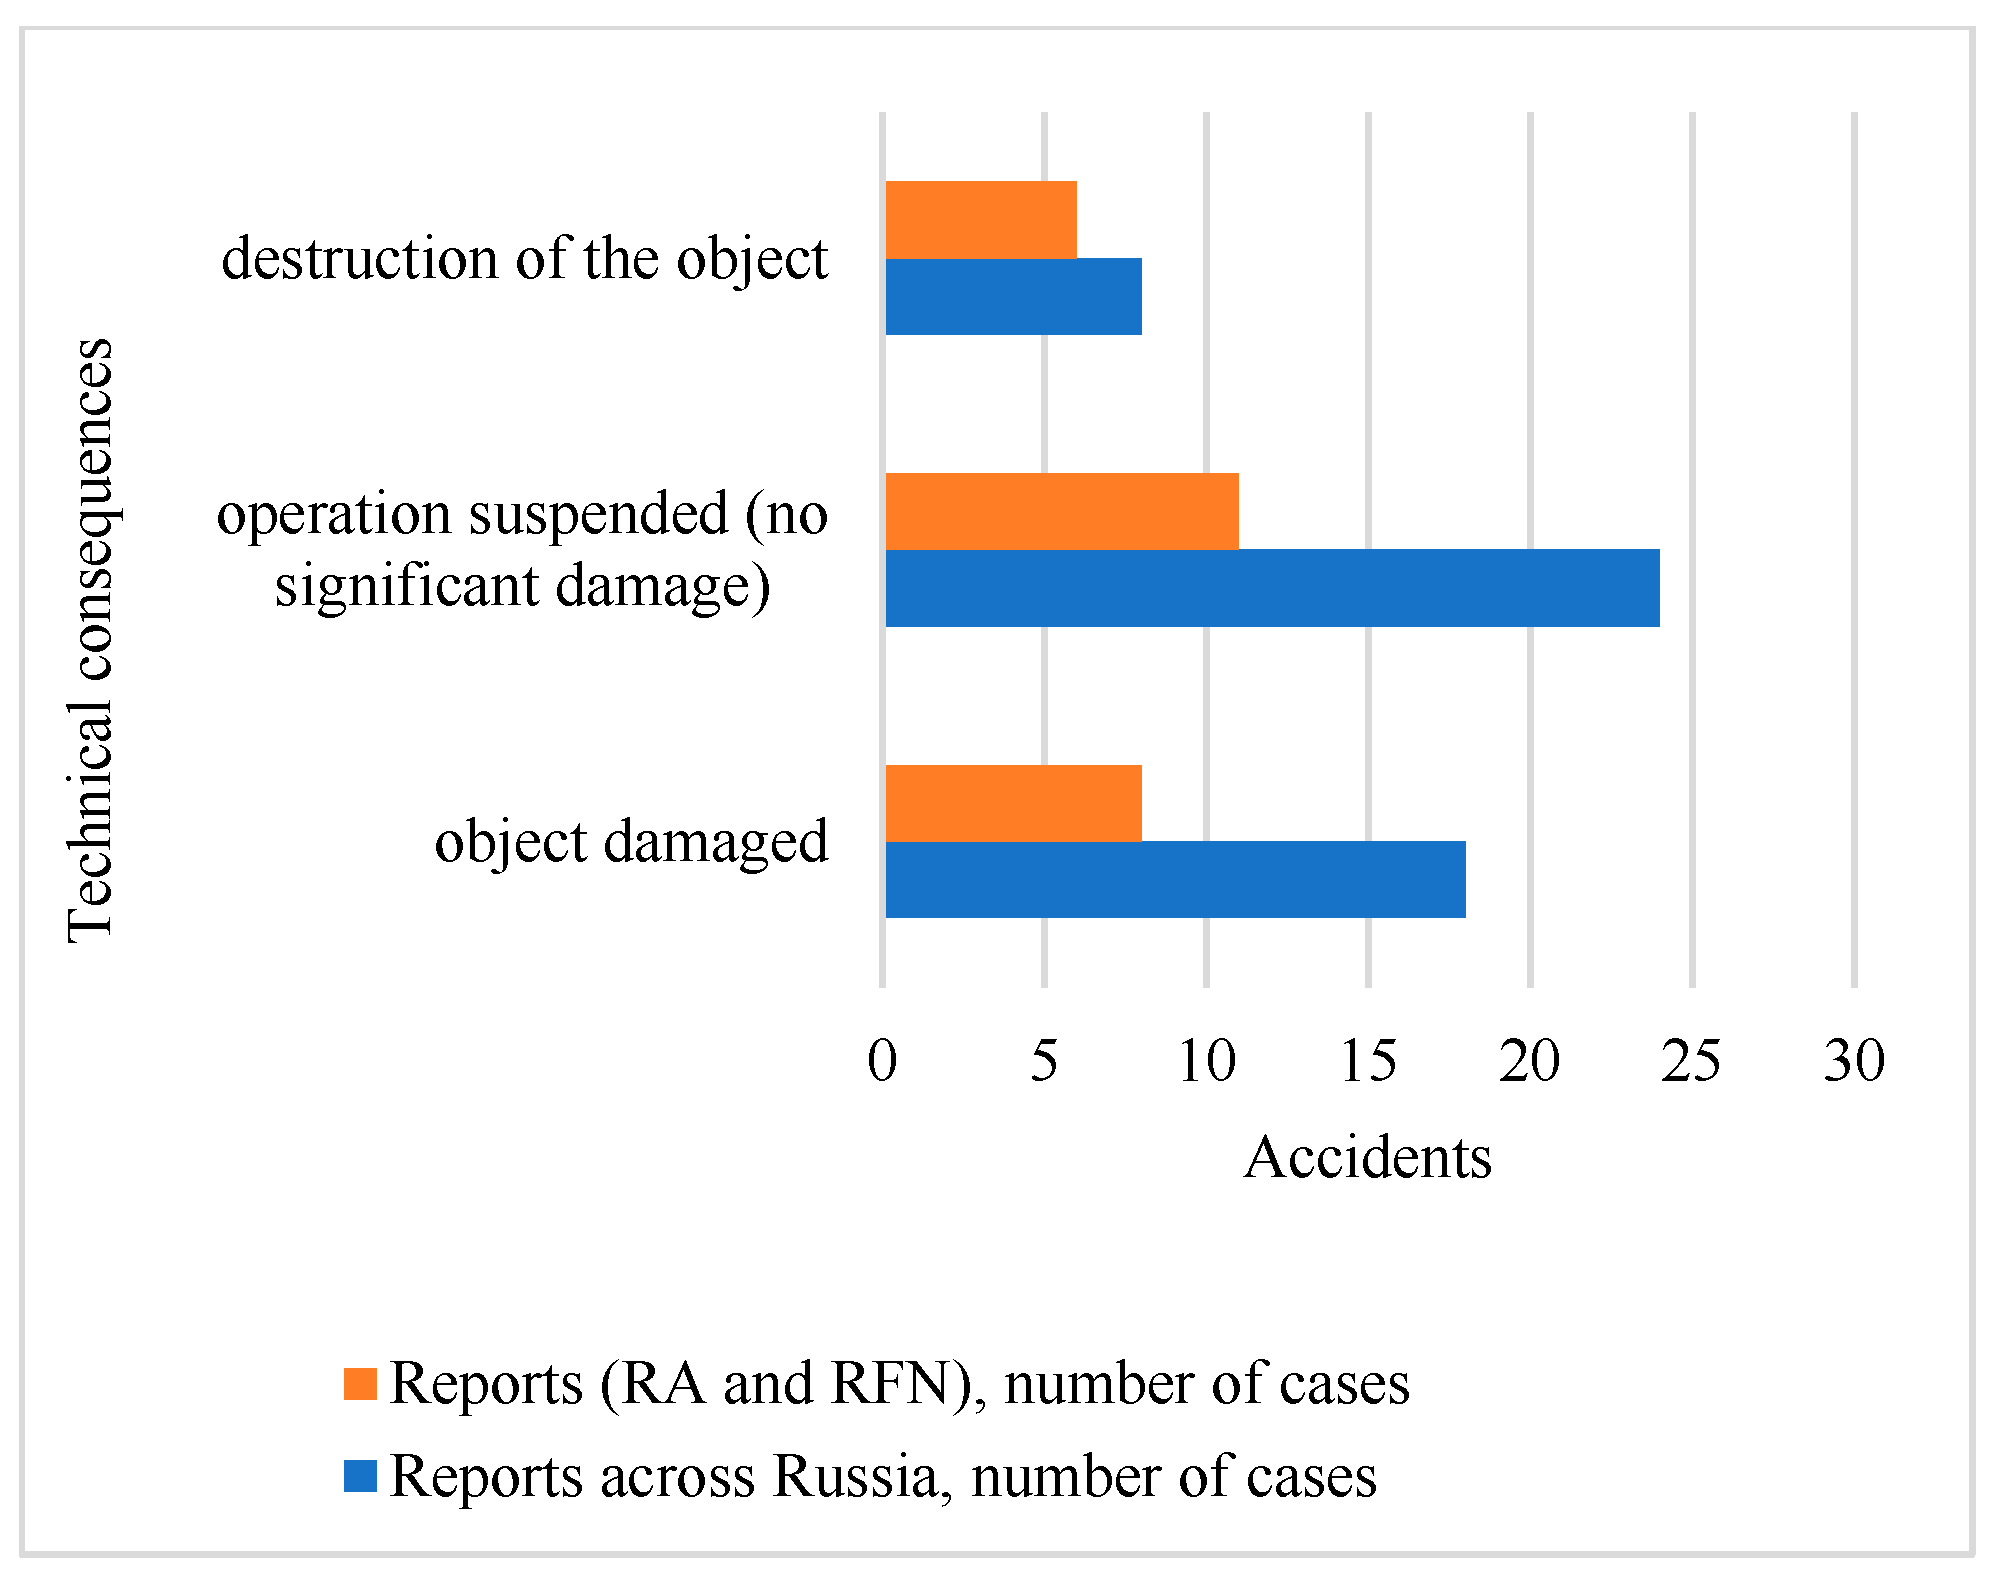
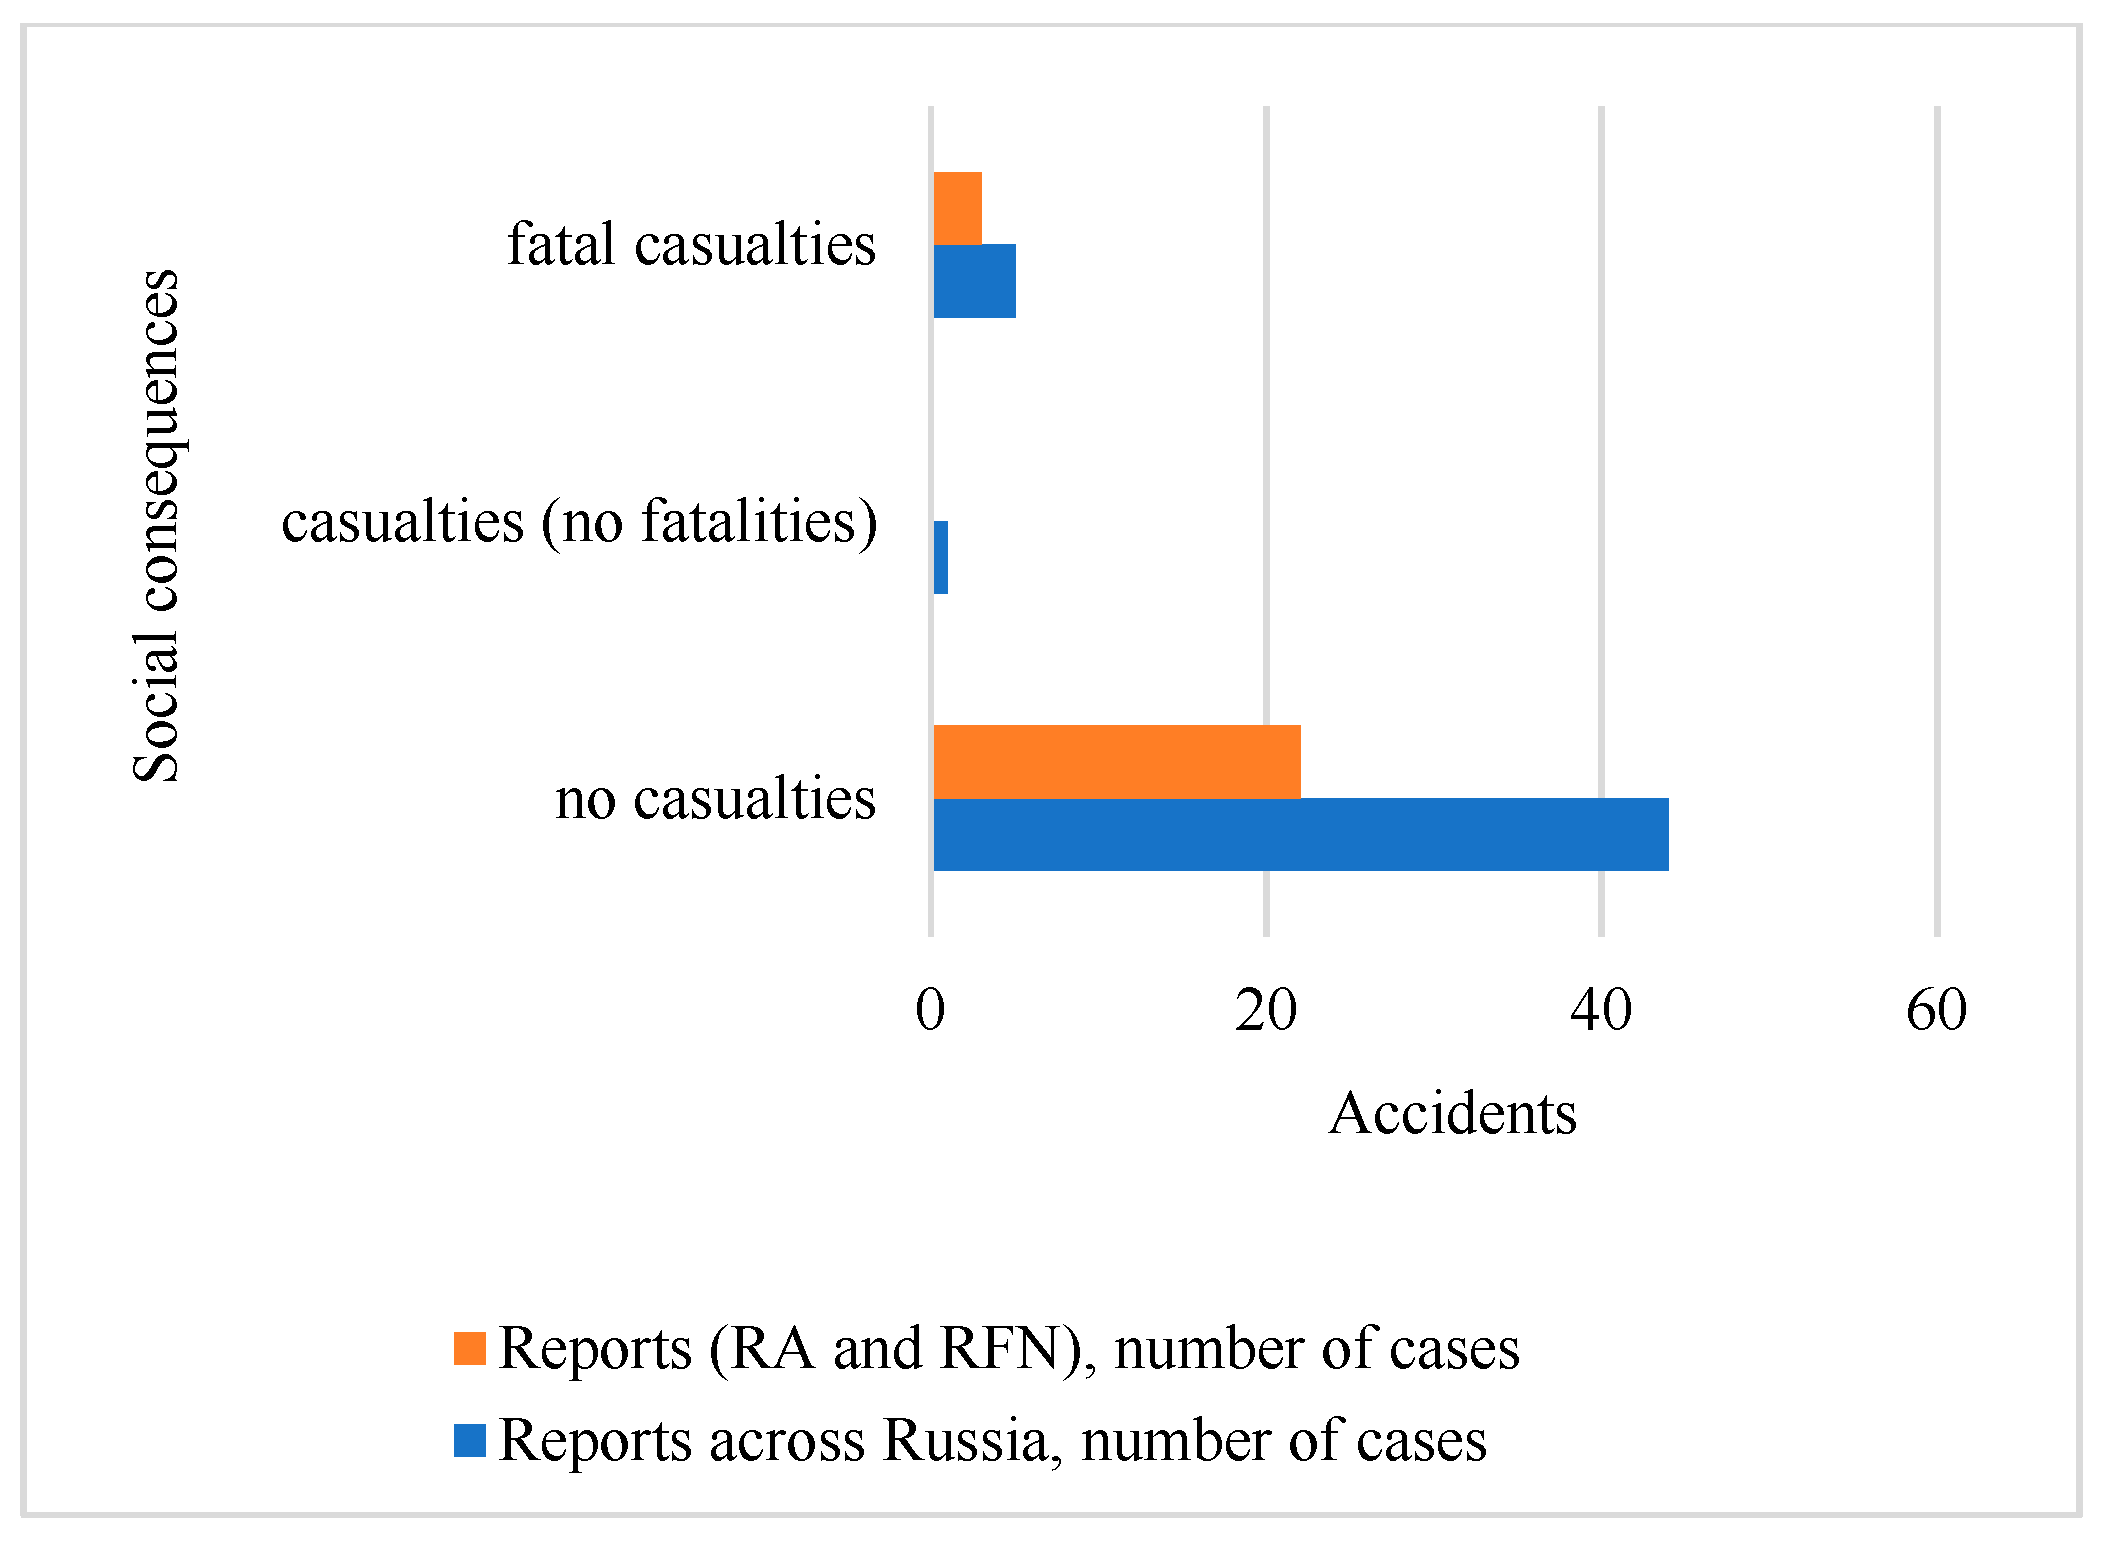
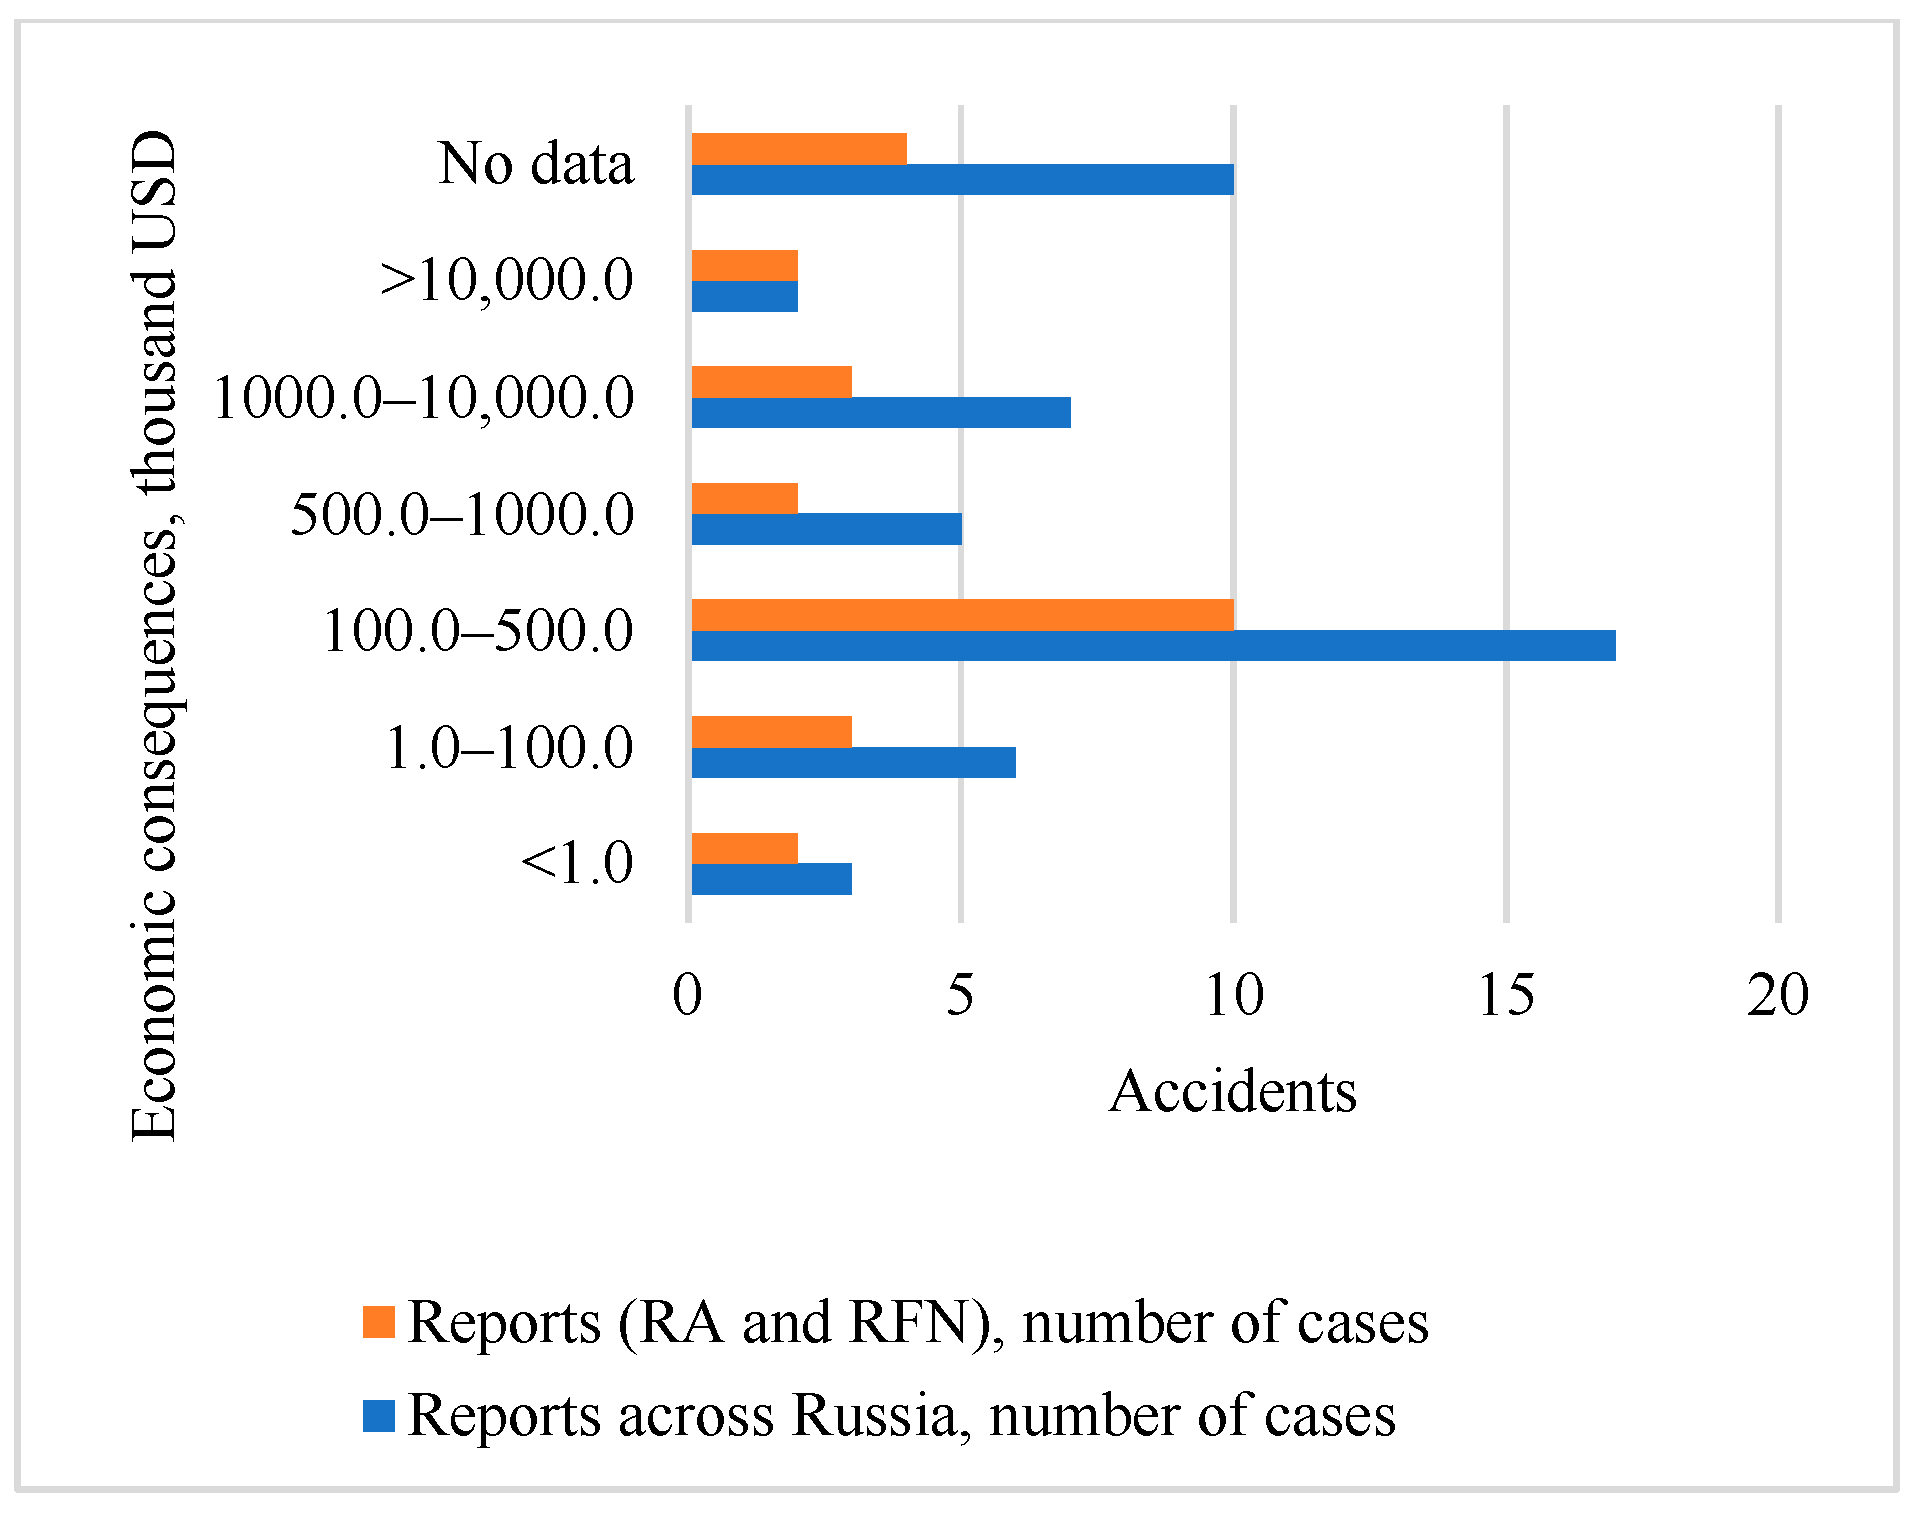
To better understand the distribution and dynamics of oil spills, a series of graphs were plotted (Figure 1, Figure 2, Figure 3, Figure 4, Figure 5 and Figure 6). These graphs display the distribution of accident frequencies by different categories.
3.
Based on the results in Table 1, a set of categorical variables was defined for statistical analysis. Their characteristics are presented in Table 2.
Table 3 is a contingency table for variables Object and Type of Accident. Symbols O1, O2, and O3 are used to designate three different objects (gathering station, field pipelines, and oil wells, respectively). A, B, and C are used to designate three different types of accidents (uncontrolled explosion, uncontrolled release of hazardous substances, and structural failure, respectively).
Each variable has three levels, so the table has a dimension of 3 × 3. Tables with a dimension of 2 × 2 are called fourfold, while tables with larger dimensions are called multi-field. Tschuprow’s T was calculated using the resulting table. Depending on the value of the coefficient, a conclusion was made about the presence of a relationship between the features.
For each pair of nominal variables (nominal–nominal), a contingency table was constructed, and the contingency coefficient was calculated. The results are presented in Table 4.
The table is symmetrical with respect to the main diagonal, always containing ones. Therefore, the table can contain 28 = (8 × 8 − 8)/2 elements of interest.
Visual analysis of the contingency coefficients shows that most values fall below the 0.3 threshold, indicating no significant relationships between the corresponding categorical variables. However, several variable pairs stand out (in bold), showing coefficients slightly above this threshold and thus suggesting potentially interesting interdependencies. The value of the coefficient that characterizes a pair of features is highlighted in bold italics. These include the following four pairs: Object–Type, Object–CausePhi, Object–CauseTech, and CauseTech–Social.
A fifth pair, CauseTech–CausePhi, exhibits the highest coefficient (0.4815), but its interpretation is less meaningful in this context, as these variables naturally complement each other (i.e., technical, physical, and chemical causes of accidents are inherently interconnected).
Let us now explore the relationships between the four variable pairs in more detail. Each pair was analyzed using the corresponding contingency table, and its structure is critical for understanding the observed associations.
For the Object–Type pair, the contingency coefficient is 0.3062, which marginally exceeds the 0.3 level. This indicates a weak relationship between the accident object and the type of accident.
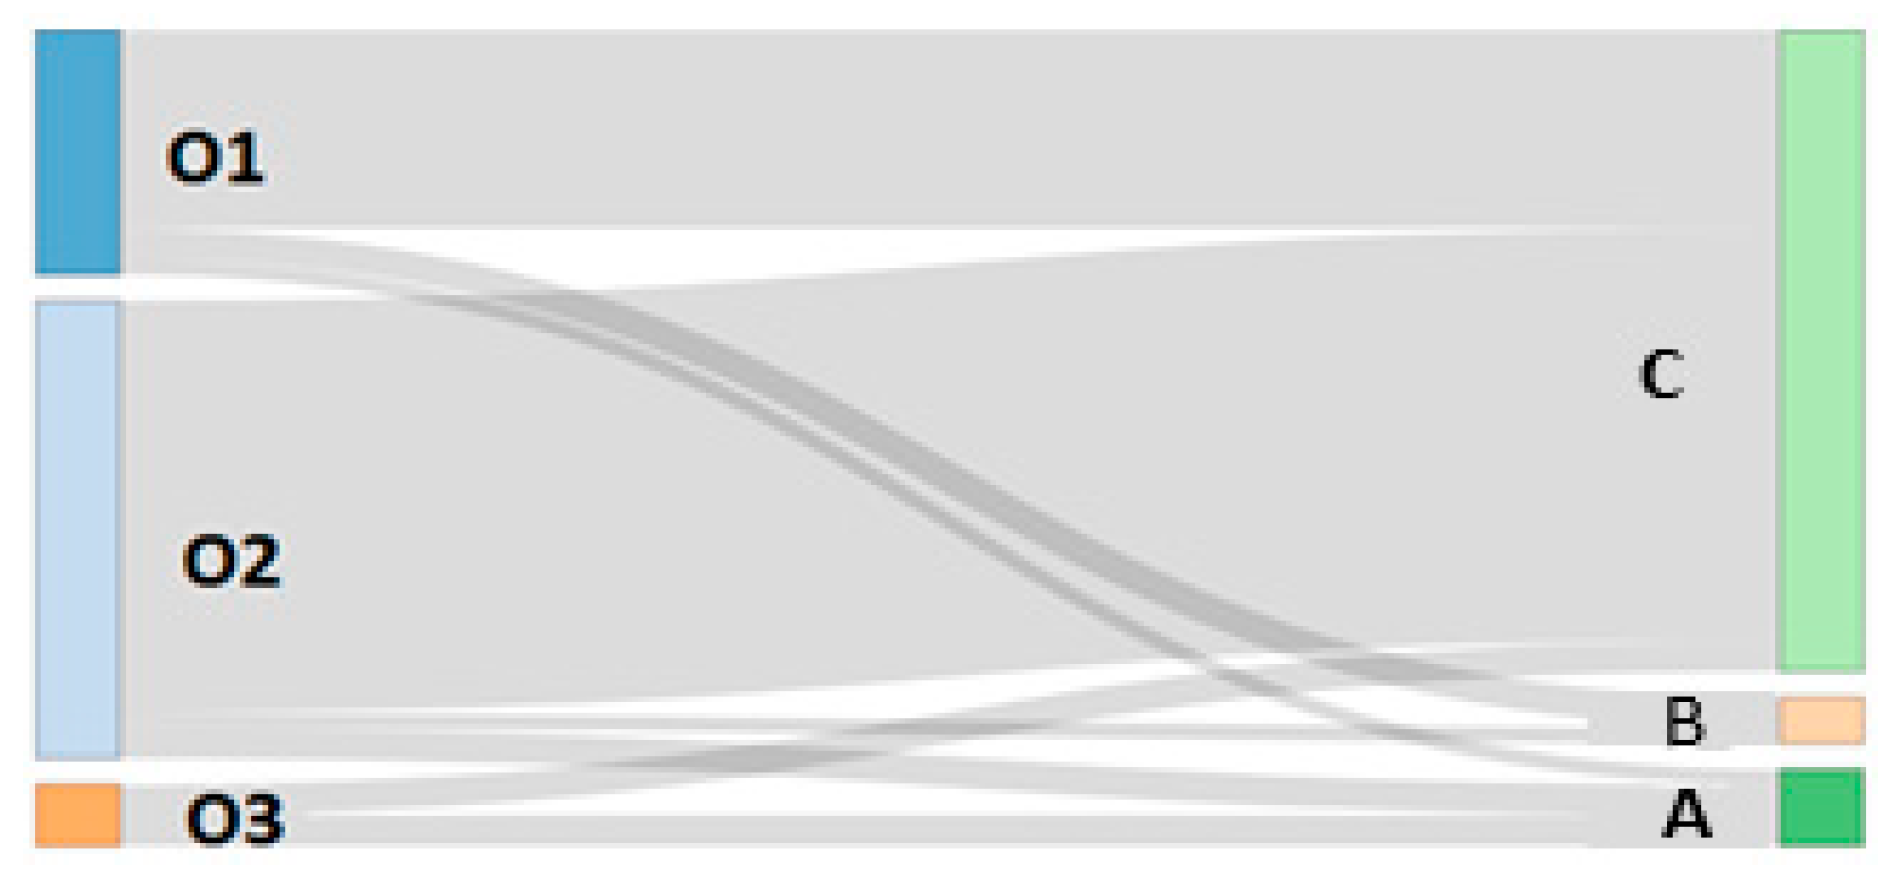
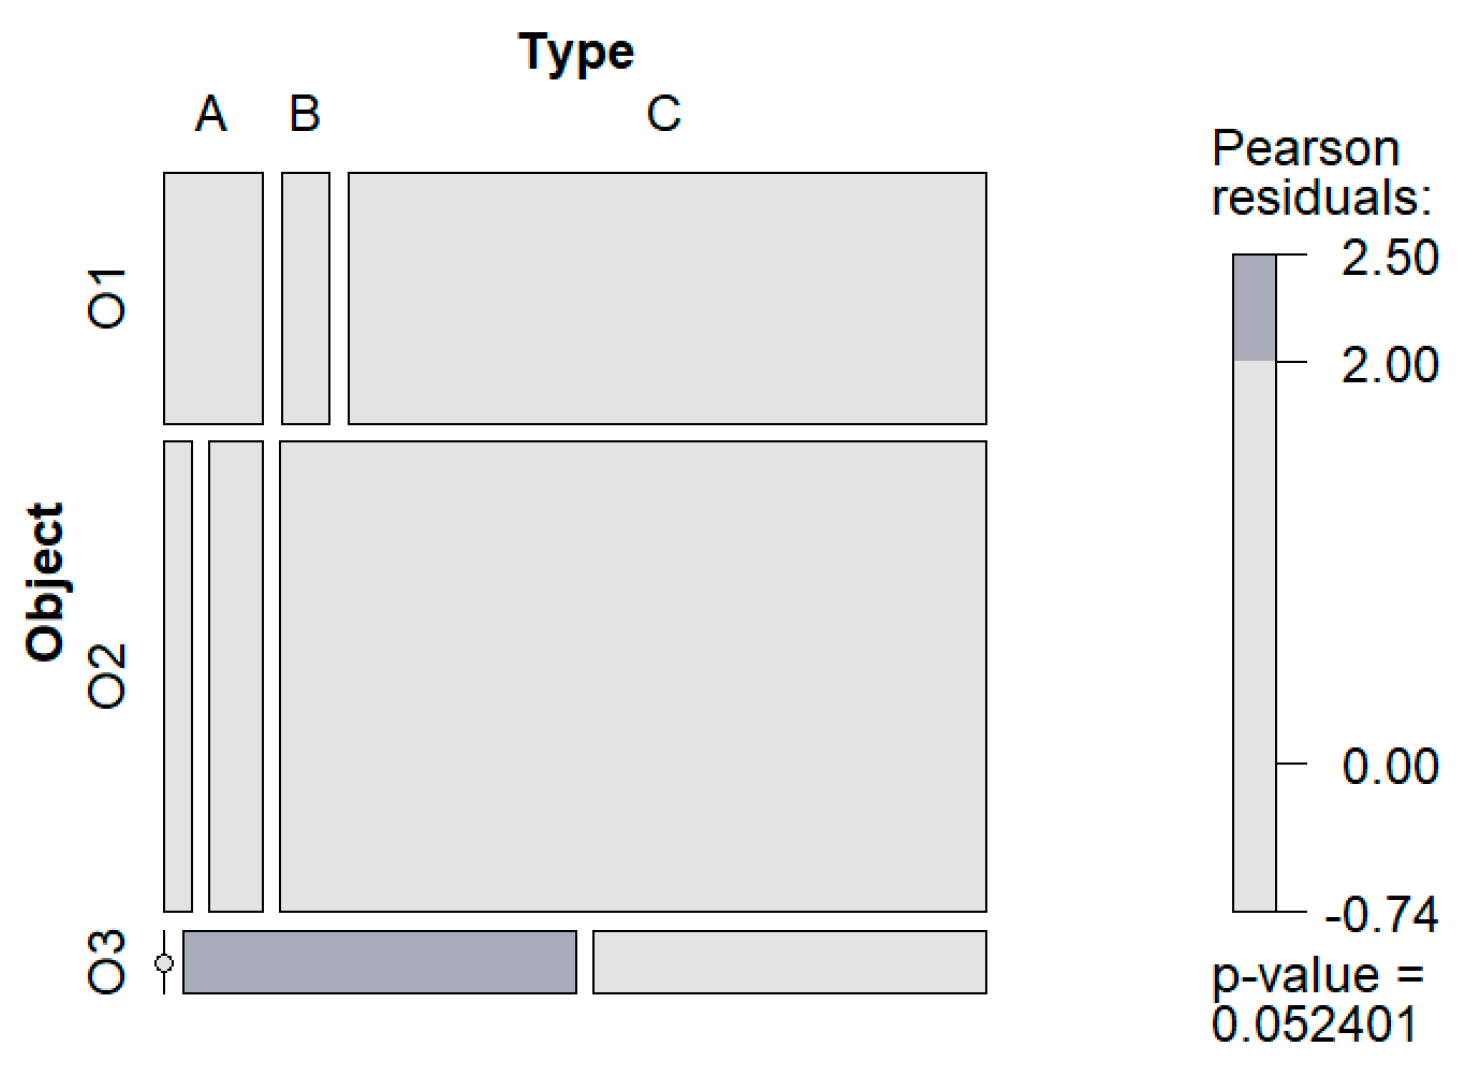
To better understand this relationship, we used two visual methods: Sankey diagrams (Figure 7) and mosaic plots (based on Table 3; Figure 8). In the Sankey diagram, the width of the flows reflects the frequency of each object-type combination. The mosaic plot also represents these frequencies, with shading indicating deviations from the expected (average) distribution.
For a more detailed interpretation, it is useful to consider the characteristics reflected in the diagram. Pearson residuals r i j represent the standardized deviation of the observed frequency n i j from the expected frequency n i j ^ and are calculated as follows Equation (2):
r i j = n i j n i j ^ n i j ^
These values can be:
1.
Small in absolute terms, when 2 < r i j < 2 , with the corresponding cell shown in gray.
2.
Significantly positive, r i j > 2 , with the cell shown in blue.
3.
Significantly negative, r i j < 2 , with the cell shown in red.
In the mosaic plot, r i j values are illustrated in the legend with an auxiliary bar plot. The color denotes the sign of the deviation, while the boundaries at approximately 2 and 2 correspond to a 0.05 confidence level [42]. The largest significant deviations are displayed with their numerical values.
The p-value in the legend is used to test the null hypothesis of independence between factors using Pearson’s chi-squared test. If the p-value exceeds the confidence level, the null hypothesis is accepted; otherwise, it is rejected. A significance level of 0.05 is commonly applied.
Figure 8 presents a mosaic plot showing the relationship between the object and the type of accident. The geometric dimensions of the objects (length and height) are proportional to the number of accidents observed.
In Figure 8, light gray rectangles represent the expected average distribution, while dark gray highlights areas where actual frequencies are slightly higher. Although the contingency coefficient—0.3062, which is slightly higher than 0.3—suggests a weak link, the p-value of 0.052 exceeds the typical confidence level (0.05). Thus, the deviation cannot be deemed statistically significant, and we cannot confidently conclude that the primary accident type for wells is the uncontrolled release of hazardous substances.
The contingency coefficient for the variables Object and Type is 0.3062, only slightly above the threshold of 0.3, suggesting a weak association. The analysis of group deviations, presented in the legend, yielded a p-value of 0.052. Although this value is relatively large, it only slightly exceeds the conventional significance threshold of 0.05, casting doubt on the statistical reliability of the deviation. Consequently, it is not possible to make a confident conclusion that “Wells” are predominantly associated with the accident type “Uncontrolled release of hazardous substances.”
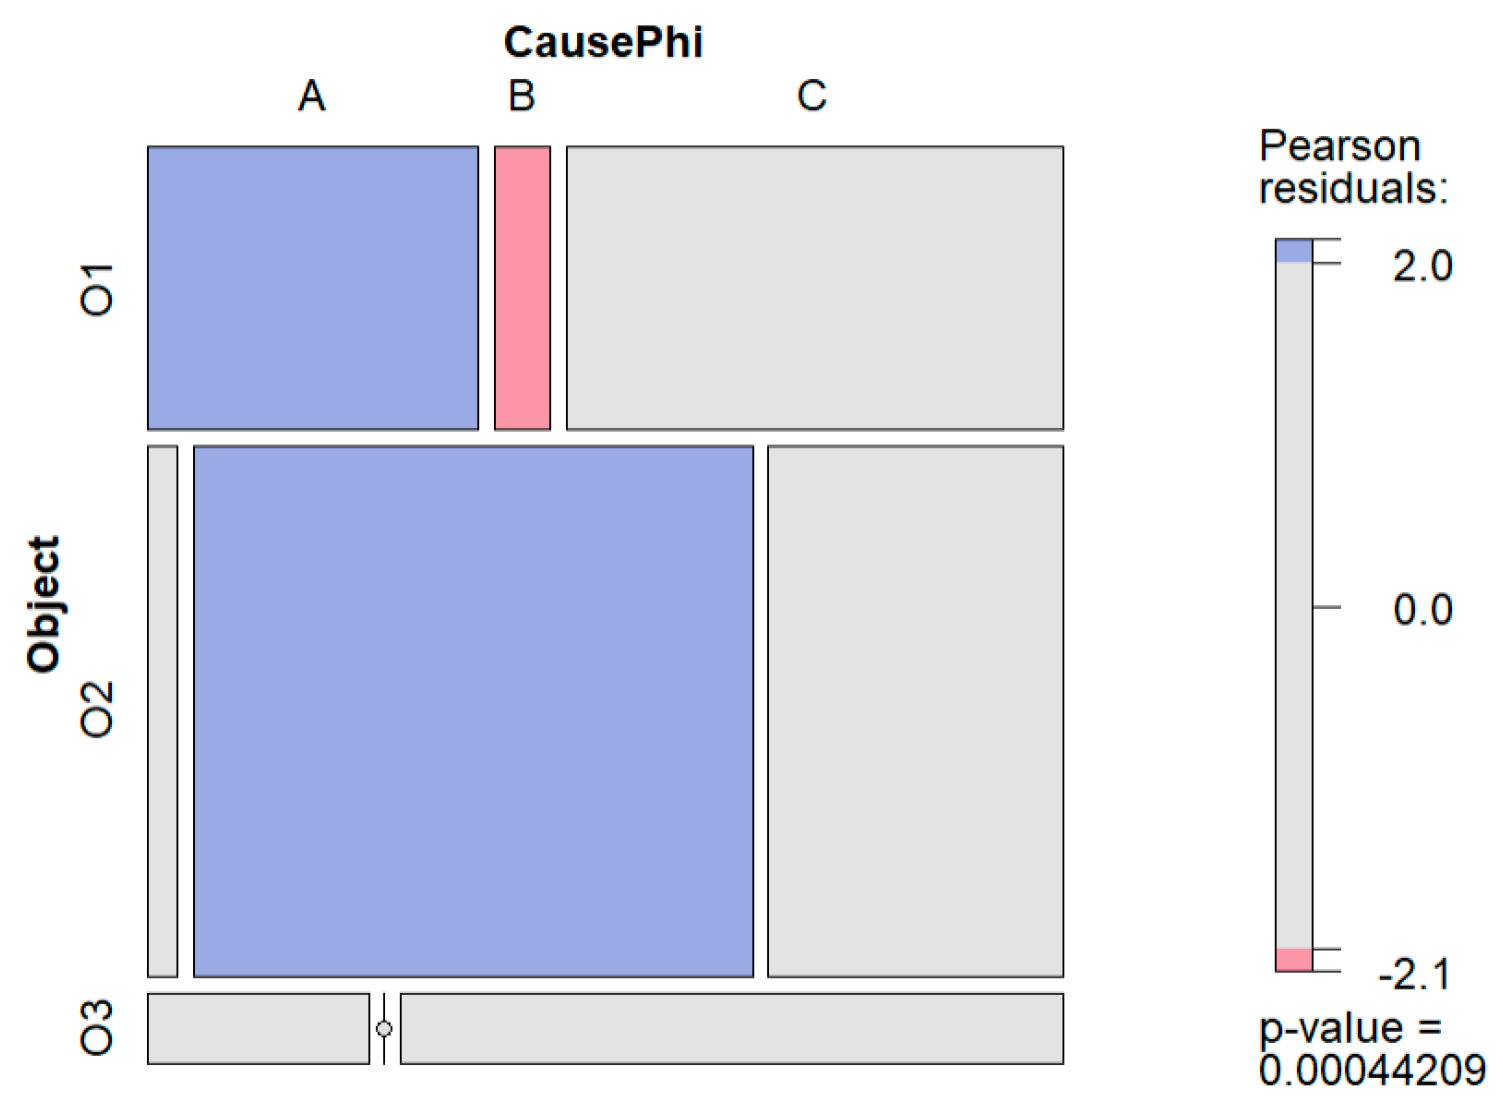
The mosaic plot in Figure 9 shows the relationship between the object and physical causes. This pair has the highest contingency coefficient, 0.4502. Gray rectangles represent the expected distribution. Blue areas indicate significant positive deviations from expected frequencies. Red areas indicate negative deviations. The p-value of 0.0004 confirms the statistical significance of these deviations.
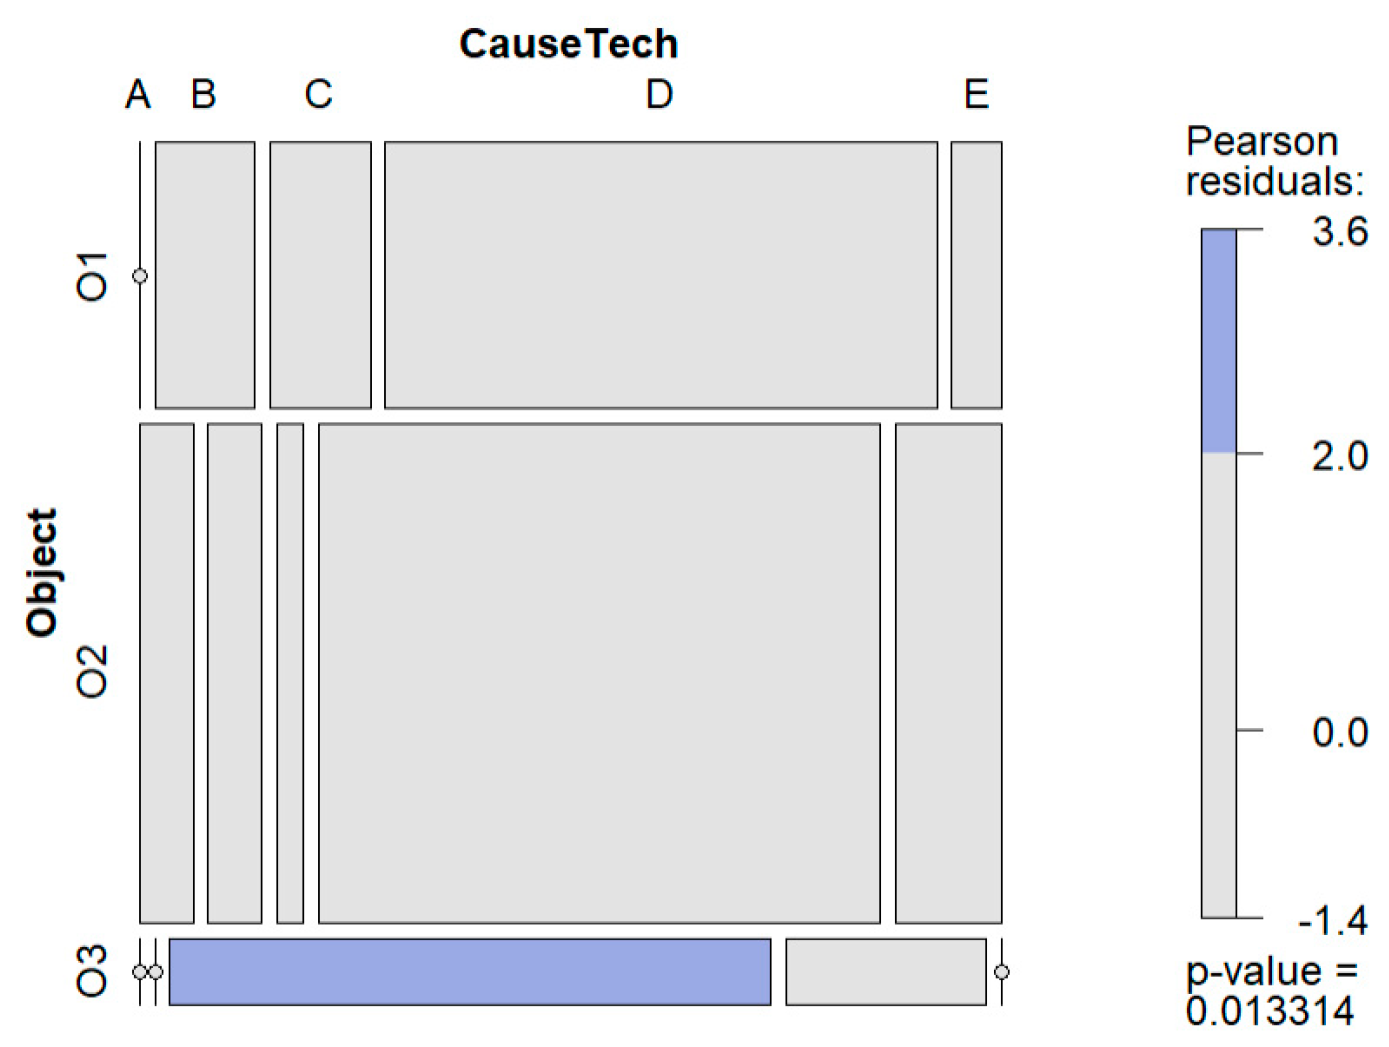
The mosaic plot in Figure 10 illustrates the relationship between the object and technical causes. The contingency coefficient here is 0.3695.
Technical causes are designated as follows: A—external mechanical damage; B—material defects; C—equipment defects; D—not identified; E—weld seam ruptures. Gray areas represent average expectations. Blue areas highlight positive deviations. The p-value of 0.013 indicates statistically significant deviations.
For other object categories, no notable predominance of any technical cause was found.
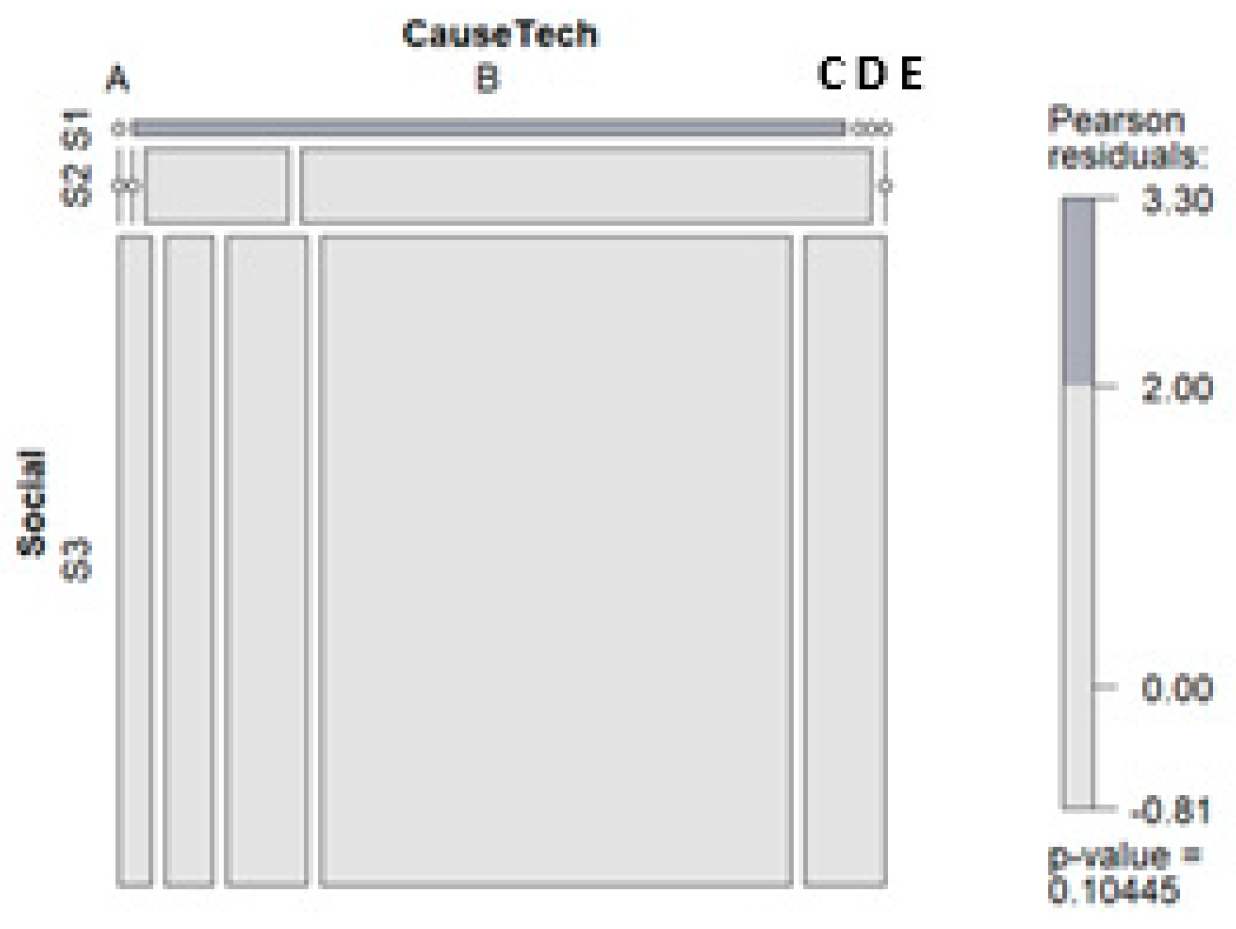
Figure 11 shows the mosaic plot for the relationship between technical causes and social consequences. Social consequences are designated as follows: S1—casualties (no fatalities); S2—fatal casualties; S3—no casualties. The contingency coefficient for this pair is 0.3058, suggesting a weak association. Gray areas represent average expectations. Dark gray areas represent slight positive deviations.
The contingency coefficient for the variables Social and CauseTech is 0.3058, slightly exceeding the threshold of 0.3. This suggests a weak relationship between these variables. The p-value is 0.10, which is relatively high since it exceeds the commonly accepted confidence level of 0.05. Therefore, we cannot conclude that this deviation is statistically significant. Consequently, we cannot confidently assert that, within the category of social consequences of accidents labeled “Casualties (no fatalities),” the primary type of accident is material defects. No significant predominance of any particular technical cause was identified for other types of social consequences.
In the studied dataset, two variables are ordered: TotalDamage (total damage in thousands of US dollars) and SpillType (type of spill). The p-value for their association is 8 × 10⁻³, which is significantly below the significance level, indicating a strong relationship between these variables.
To assess the strength of the relationship between pairs of variables—nominal and ordinal—the linear-by-linear association test was used.
All p-values are presented in Table 5; all exceed the significance level, leading to the conclusion that there is no statistically significant relationship between these features.

4. Discussion

The preliminary analysis did not reveal any distinct regional patterns in the distribution of accidental oil and petroleum product spills in the Russian Arctic and Far North compared to other regions of Russia. Notably, the majority of accidental spills occurred at field pipelines and were primarily associated with equipment depressurization, which often resulted in operational shutdowns without causing major infrastructure damage. Most of these spills were local in scale, with discharge volumes not exceeding 100 tons. The potential influence of external environmental factors—such as permafrost degradation, which can lead to aggressive soil environments and external corrosion—was not separately analyzed, as only one spill during the study period could be attributed to this cause. Additionally, no incidents were linked to extremely low temperatures.
The specific environmental consequences of spills could not be conclusively identified due to limited data. However, the spills were classified by their geographical and environmental impact into local, regional, interregional, and federal, based on the volume of discharged substances [39]. The economic consequences were reflected in the compensation amounts for environmental damage, categorized into groups by damage costs (in thousands of USD): less than 1, 1–100, 100–500, 500–1000, 1000–10,000, and more than 10,000.
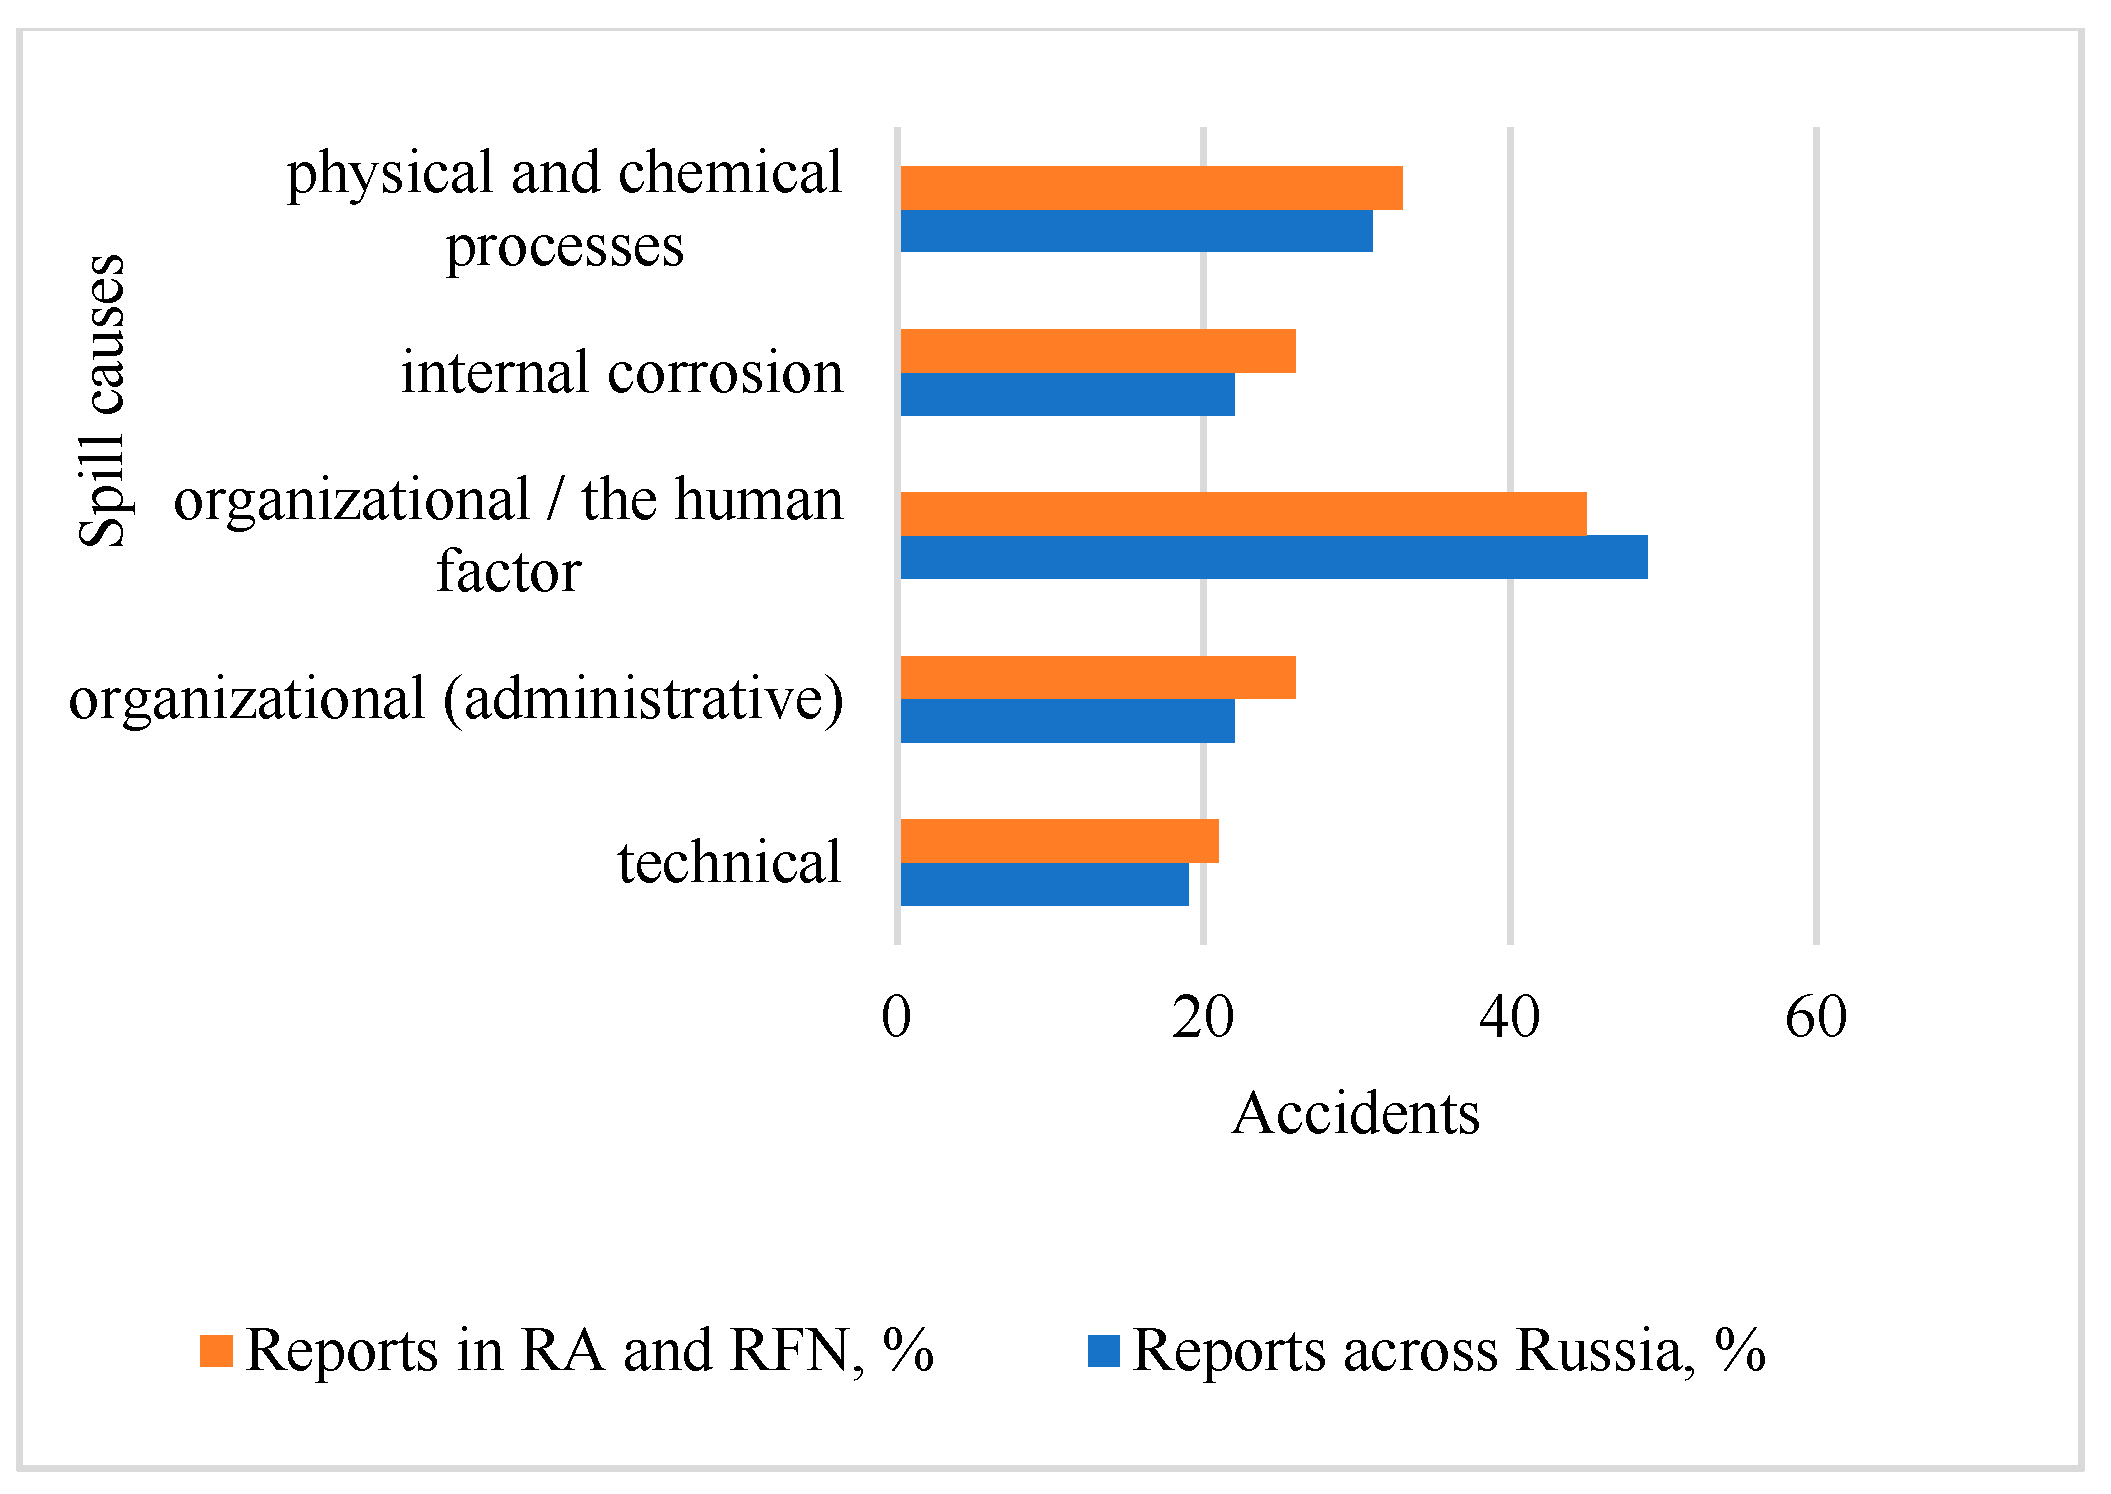
Although the organizational factor (the human factor) emerged as the most frequently reported cause of spills, statistically significant associations were identified only for three specific object-cause combinations:
-
at gathering stations, the main causes included external corrosion, pressure/temperature parameter fluctuations, electrostatic charge formation, and vibration-related failures, grouped collectively as “Other causes”.
-
for field pipelines, internal corrosion was the leading cause of accidents, aligning with findings from previous studies.
-
at well sites, the dominant cause was identified as equipment defects.
The interpretation of the “Object–Type” pair is somewhat ambiguous, as it represents a borderline case. If a confidence level of 0.05 is applied, the data suggest the existence of a relationship between these variables, implying that the “Wells” category is significantly associated with the accident type “Uncontrolled release of hazardous substances.” However, the choice of confidence level is not universally standardized and often depends on disciplinary conventions or researcher preference. Consequently, different interpretations are possible. At a confidence level of 0.1 (which can also be used), the opposite conclusion would follow—namely, that accident type is independent of the accident object. More definitive conclusions can be drawn as new data become available.
Across the dataset, social, financial, and organizational consequences of spills appeared relatively homogeneous.
This suggests a universal vulnerability of oil infrastructure, regardless of region, facility type, or accident cause.
The study underscores the growing importance of technical improvements, especially as many oil fields have entered late-stage development, where difficult production conditions prevail. This is particularly relevant for working with heavy oil and managing asphaltene–resin–paraffin (ARP) deposits [43,44,45].
The results can partly be explained by the evolution of regulatory oversight in the Russian Federation since the early 2000s, aimed at both preventing accidents and ensuring effective emergency response.

5. Conclusions

This analysis enabled the systematization of key risk factors and consequences associated with oil spills, thereby identifying priority areas for further research and the development of preventive measures within the oil and gas sector.
This study systematized data on 50 oil spills in Russia (2014–2024) using association analysis and identified a weak but statistically significant relationship between accident objects and causes. The analysis revealed a predominance of local spills on pipelines resulting from depressurization and corrosion. Furthermore, the homogeneity of social, financial, and organizational consequences across the dataset underscores the universal vulnerability of oil infrastructure facilities, regardless of their regional location.
Based on these findings, several recommendations can be made:
-
Modernizing infrastructure with corrosion-resistant materials and real-time monitoring systems (with a potential 30% risk reduction, according to the Ministry of Emergencies, 2025);
-
Developing adaptive technologies for Arctic conditions, particularly to address paraffin-related challenges (based on studies by TatNIPIneft, 2020);
-
Strengthening regulatory enforcement through stricter operational standards (as recommended by PHMSA, 2025) [11];
-
Implementing rapid response strategies informed by best practices, such as those developed in response to the Deepwater Horizon incident.
Implementing these measures will require coordinated efforts among government agencies, oil producers, and international organizations. In addition, there is a need to enhance the existing regulatory framework, including the refinement and enforcement of oil spill response plans currently implemented in Russia since 2021.
In summary, this study underscores the importance of a comprehensive and integrated approach to spill risk management—one that takes into account technological, environmental, and organizational factors. Future research should focus on improving the accuracy and completeness of statistical data and developing innovative technologies for heavy oil extraction under Arctic conditions. These efforts will be critical to securing the sustainable development of the region in the years ahead.

Author Contributions

Conceptualization, M.N. and V.V.; methodology, M.N.; software, V.B.; validation, V.B., M.N. and S.A.; formal analysis, D.S.; investigation, S.A.; resources, D.S.; data curation, V.V.; writing—original draft preparation, D.S.; writing—review and editing, M.N.; visualization, V.B.; supervision, V.V.; project administration, M.N.; funding acquisition, M.N. All authors have read and agreed to the published version of the manuscript.

Funding

This research received no external funding.

Data Availability Statement

The original contributions presented in this study are included in the article. Further inquiries can be directed to the corresponding author.

Conflicts of Interest

The authors declare no conflicts of interest.

Abbreviations

The following abbreviations are used in this manuscript:
PHMSAPipeline and Hazardous Materials Safety Administration
ESPOEastern Siberia–Pacific Ocean
TatNPIneftTatar Research and Design Institute of Oil
CDU TEKCentral Dispatch Office of the Fuel and Energy Complex
AMAPArctic Monitoring and Assessment Programme
RostekhnadzorFederal Service for Ecological, Technological and Nuclear Supervision

References

  1. Michel, J.; Owens, E.H.; Zengel, S.; Graham, A.; Nixon, Z.; Allard, T.; Holton, W.; Reimer, P.D.; Lamarche, A.; White, M.; et al. Extent and Degree of Shoreline Oiling: Deepwater Horizon Oil Spill, Gulf of Mexico, USA. PLoS ONE 2013, 8, e65087. [Google Scholar] [CrossRef] [PubMed]
  2. Pashkevich, M.A.; Bykova, M.V. Methodology for thermal desorption treatment of local soil pollution by oil products at the facilities of the mineral resource industry. J. Min. Inst. 2022, 253, 49–60. [Google Scholar] [CrossRef]
  3. Vasileva, Z.V.; Vasekha, M.V.; Tyulyaev, V.S. Evaluation of the efficiency of sorbents for accidental oil spill response in the Arctic waters. J. Min. Inst. 2023, 264, 856–864. [Google Scholar] [CrossRef]
  4. Sarapulova, G.I. Environmental Geochemical Assessment of Technogenic Soils. J. Min. Inst. 2018, 234, 658–662. [Google Scholar] [CrossRef]
  5. IEA. World Energy Outlook 2023—Analysis. Available online: https://www.iea.org/reports/world-energy-outlook-2023 (accessed on 14 July 2025).
  6. Sozina, I.D.; Danilov, A.S. Microbiological remediation of oil-contaminated soils. J. Min. Inst. 2023, 260, 297–312. [Google Scholar] [CrossRef]
  7. UNEP—UN Environment Programme. Annual Report 2022. Available online: https://www.unep.org/resources/annual-report-2022 (accessed on 14 July 2025).
  8. Reiersen, L.-O.; Guardans, R.; Sydnes, L.K. The Arctic Monitoring and Assessment Programme. Chem. Int. 2020, 42, 8–14. [Google Scholar] [CrossRef]
  9. Massanés, B.; Pera, L.S.; Semenova, T.; Sokolov, I. Theoretical Substantiation of Risk Assessment Directions in the Development of Fields with Hard-to-Recover Hydrocarbon Reserves. Resources 2025, 14, 64. [Google Scholar] [CrossRef]
  10. Massel, L.; Komendantova, N.; Massel, A.; Tsvetkova, A.; Zaikov, K.; Marinina, O. Resilience of socio-ecological and energy systems: Intelligent information technologies for risk assessment of natural and technogenic threats. J. Infrastruct. Policy Dev. 2024, 8, 4700. [Google Scholar] [CrossRef]
  11. PHMSA. HL IM Performance Measures. Available online: https://www.phmsa.dot.gov/pipeline/hazardous-liquid-integrity-management/hl-im-performance-measures (accessed on 17 July 2025).
  12. US EPA. Restoring the Gulf of America After the Deepwater Horizon Oil Spill. Available online: https://www.epa.gov/deepwaterhorizon (accessed on 14 July 2025).
  13. International Crisis Group. Iraq. Available online: https://www.crisisgroup.org/middle-east-north-africa/gulf-and-arabian-peninsula/iraq (accessed on 17 July 2025).
  14. Amnesty International Nigeria. Nigeria: Shell Must Clean Up Devastating Oil Spills in the Niger Delta. Available online: https://www.amnesty.org.ng/2023/02/02/nigeria-shell-must-clean-up-devastating-oil-spills-in-the-niger-delta/ (accessed on 17 July 2025).
  15. Zanoli, S.M.; Pepe, C.; Semenova, T.; Churrana, N. Assessment of the Projects’ Prospects in the Economic and Technological Development of the Oil and Gas Complex in the Republic of Mozambique. Resources 2025, 14, 106. [Google Scholar] [CrossRef]
  16. International Crisis Group. Iraq: Stabilising the Contested District of Sinjar. Available online: https://www.crisisgroup.org/middle-east-north-africa/gulf-and-arabian-peninsula/iraq/iraq-stabilising-contested-district-sinjar (accessed on 17 July 2025).
  17. UPI.com. Husky: ‘Anomalies’ Found Night Before Saskatchewan Oil Spill. Available online: https://www.upi.com/Energy-News/2016/07/27/Issues-reported-before-Saskatchewan-oil-spill/4241469619189/ (accessed on 17 July 2025).
  18. Soto, L.; Botello, A.; Licea, S.; Lizarra-Partida, M.; Yáñez-Arancibia, A. The environmental legacy of the Ixtoc 1 oil spill in Campeche Sound, southwestern Gulf of Mexico. Front. Mar. Sci. 2014, 1, 57. [Google Scholar] [CrossRef]
  19. US Department of Transportation. Pipeline Safety: Reviewing Implementation of the PIPES Act of 2020 and Examining Future Safety Needs. Available online: https://www.transportation.gov/pipeline-safety-reviewing-implementation-pipes-act-2020-and-examining-future-safety-needs (accessed on 18 July 2025).
  20. Congress.gov. Library of Congress. Pipeline Safety: Reviewing Implementation of the PIPES Act of 2020 and Examining Future Safety Needs. Available online: https://www.congress.gov/event/118th-congress/house-event/115415/text (accessed on 18 July 2025).
  21. FracTracker Alliance. 2022 Pipeline Incidents Update: Is Pipeline Safety Achievable? Available online: https://www.fractracker.org/2023/02/2022-pipeline-incidents-update-is-pipeline-safety-achievable/ (accessed on 18 July 2025).
  22. AK Dept. of Environmental Conservation. 2024 Point Thomson Export Pipeline Leak. Available online: https://dec.alaska.gov/spar/ppr/spill-information/response/2024/01-point-thomson-export-pipeline-leak/ (accessed on 19 July 2025).
  23. The Ussinskaya Disaster of 1994. Causes and Consequences. Available online: https://nashural.ru/dostoprimechatelnosti-urala/respublika-komi/usinskaya-katastrofa-1944-goda-prichiny-i-posledstviya/?ysclid=md7f93lvql101698981 (accessed on 19 July 2025).
  24. RIA Novosti. Major Oil and Oil Product Spills in Russia in 1994–2021. 11 August 2021. Available online: https://ria.ru/20210811/razliv-1745316414.html (accessed on 14 July 2025).
  25. Decree of the President of the Russian Federation Dated 05/02/2014 No. 296 ‘On the Land Territories of the Arctic Zone of the Russian Federation’. Available online: http://www.kremlin.ru/acts/bank/38377 (accessed on 18 July 2025).
  26. Decree of the Government of the Russian Federation No. 1946 Dated 11/16/2021 ‘On Approval of the List of Regions of the Far North and Localities Equated to the Regions of the Far North in Order to Provide State Guarantees and Compensations’. Available online: https://base.garant.ru/403069486/ (accessed on 18 July 2025).
  27. State Report on the State of Protection of the Population and Territories of the Russian Federation from Natural and Man-Made Emergencies in 2024. Available online: https://mchs.gov.ru/dokumenty/7807 (accessed on 18 July 2025).
  28. Khasanov, I.I.; Kashirina, D.A. Effect of the composition of asphaltene deposits on the process of waxing of main oil pipelines. Transp. Storage Oil Prod. Hydrocarb. 2022, 3–4, 26–31. [Google Scholar] [CrossRef]
  29. Delo—Truba. Fuel and Energy Complex of Russia. Available online: https://www.cdu.ru/tek_russia/issue/2021/4/890/?ysclid=md7kphiku8990243626 (accessed on 19 July 2025).
  30. Kuprikov, M.; Kuprikov, N.; Zaikov, K.; Zadorin, M.; Tsvetkova, A. Regional climate change adaptation plans in Russia: Legal political overview. J. Infrastruct. Policy Dev. 2024, 8, 5303. [Google Scholar] [CrossRef]
  31. Marinina, O.; Tsvetkova, A.; Vasilev, Y.; Komendantova, N.; Parfenova, A. Evaluating the Downstream Development Strategy of Oil Companies: The Case of Rosneft. Resources 2022, 11, 4. [Google Scholar] [CrossRef]
  32. AMAP. Socio-Economic Drivers of Change in the Arctic. Available online: https://www.amap.no/documents/doc/socio-economic-drivers-of-change-in-the-arctic/1115 (accessed on 19 July 2025).
  33. Kvasov, I.N.; Shendaleva, E.V.; Shtengauer, O.V.; Aleksandrov, M.A. Environmental risk analysis of accident on main and technological oil pipelines. Oil Gas Stud. 2020, 2, 107–119. [Google Scholar] [CrossRef]
  34. Gritsenko, A.I.; Akopova, G.S.; Maximov, V.M. Ecology. In Oil and Gas; Nauka: Moscow, Russia, 2020. [Google Scholar]
  35. Lessons Learned from Accidents. Available online: https://www.gosnadzor.ru/industrial/oil/lessons/ (accessed on 19 July 2025).
  36. Nevskaya, M.A.; Belyaev, V.V.; Pasternak, S.N.; Vinogradova, V.V.; Shagidulina, D.I. Accidental oil spills in the Arctic: An assessment of potential soil damage. Sev. I Rynok Form. Ekon. Porad. 2024, 27, 107–122. [Google Scholar] [CrossRef]
  37. Federal Service for Environmental, Technological and Nuclear Supervision Rostechnadzor. Available online: https://www.gosnadzor.ru/ (accessed on 19 July 2025).
  38. Vladimirov, V.A. Oil spills: Causes, scale, consequences. Civ. Prot. Strategy Probl. Res. 2014, 4, 217–229. [Google Scholar]
  39. Decree of the Government of the Russian Federation, No. 2451 Dated December 31, 2020 ‘On Approval of the Rules for Organizing Measures to Prevent and Eliminate Oil and Petroleum Product Spills in the Territory of the Russian Federation’. Available online: https://base.garant.ru/400170332/ (accessed on 19 July 2025).
  40. R Core Team. R A Language and Environment for Statistical Computing. R Foundation for Statistical Computing. 2024. Available online: https://www.scirp.org/reference/referencespapers?referenceid=3887298 (accessed on 14 July 2025).
  41. Mangiafico, S. Summary and Analysis of Extension Program Evaluation in R; Rutgers Cooperative Extension: New Brunswick, NJ, USA, 2016. [Google Scholar]
  42. Meyer, B.; Zeileis, A.; Hornik, K. Visualizing Independence Using Extended Association and Mosaic Plots. DSC 2003 Working Papers. 2003. Available online: https://www.researchgate.net/publication/2556711 (accessed on 2 September 2025).
  43. Shishlyannikov, D.I.; Zverev, V.Y.; Zvonareva, A.G.; Frolov, S.A.; Ivanchenko, A.A. Evaluation of the energy efficiency of functioning and increase in the operating time of hydraulic drives of sucker-rod pump units in difficult operating conditions. J. Min. Inst. 2023, 261, 349–362. Available online: https://pmi.spmi.ru/pmi/article/view/16187 (accessed on 2 September 2025).
  44. Tsiglianu, P.; Romasheva, N.; Nenko, A. Conceptual Management Framework for Oil and Gas Engineering Project Implementation. Resources 2023, 12, 64. [Google Scholar] [CrossRef]
  45. Litvinenko, V.S.; Dvoynikov, M.V.; Trushko, V.L. Elaboration of a conceptual solution for the development of the Arctic shelf from seasonally flooded coastal areas. Int. J. Min. Sci. Technol. 2022, 32, 113–119. [Google Scholar] [CrossRef]
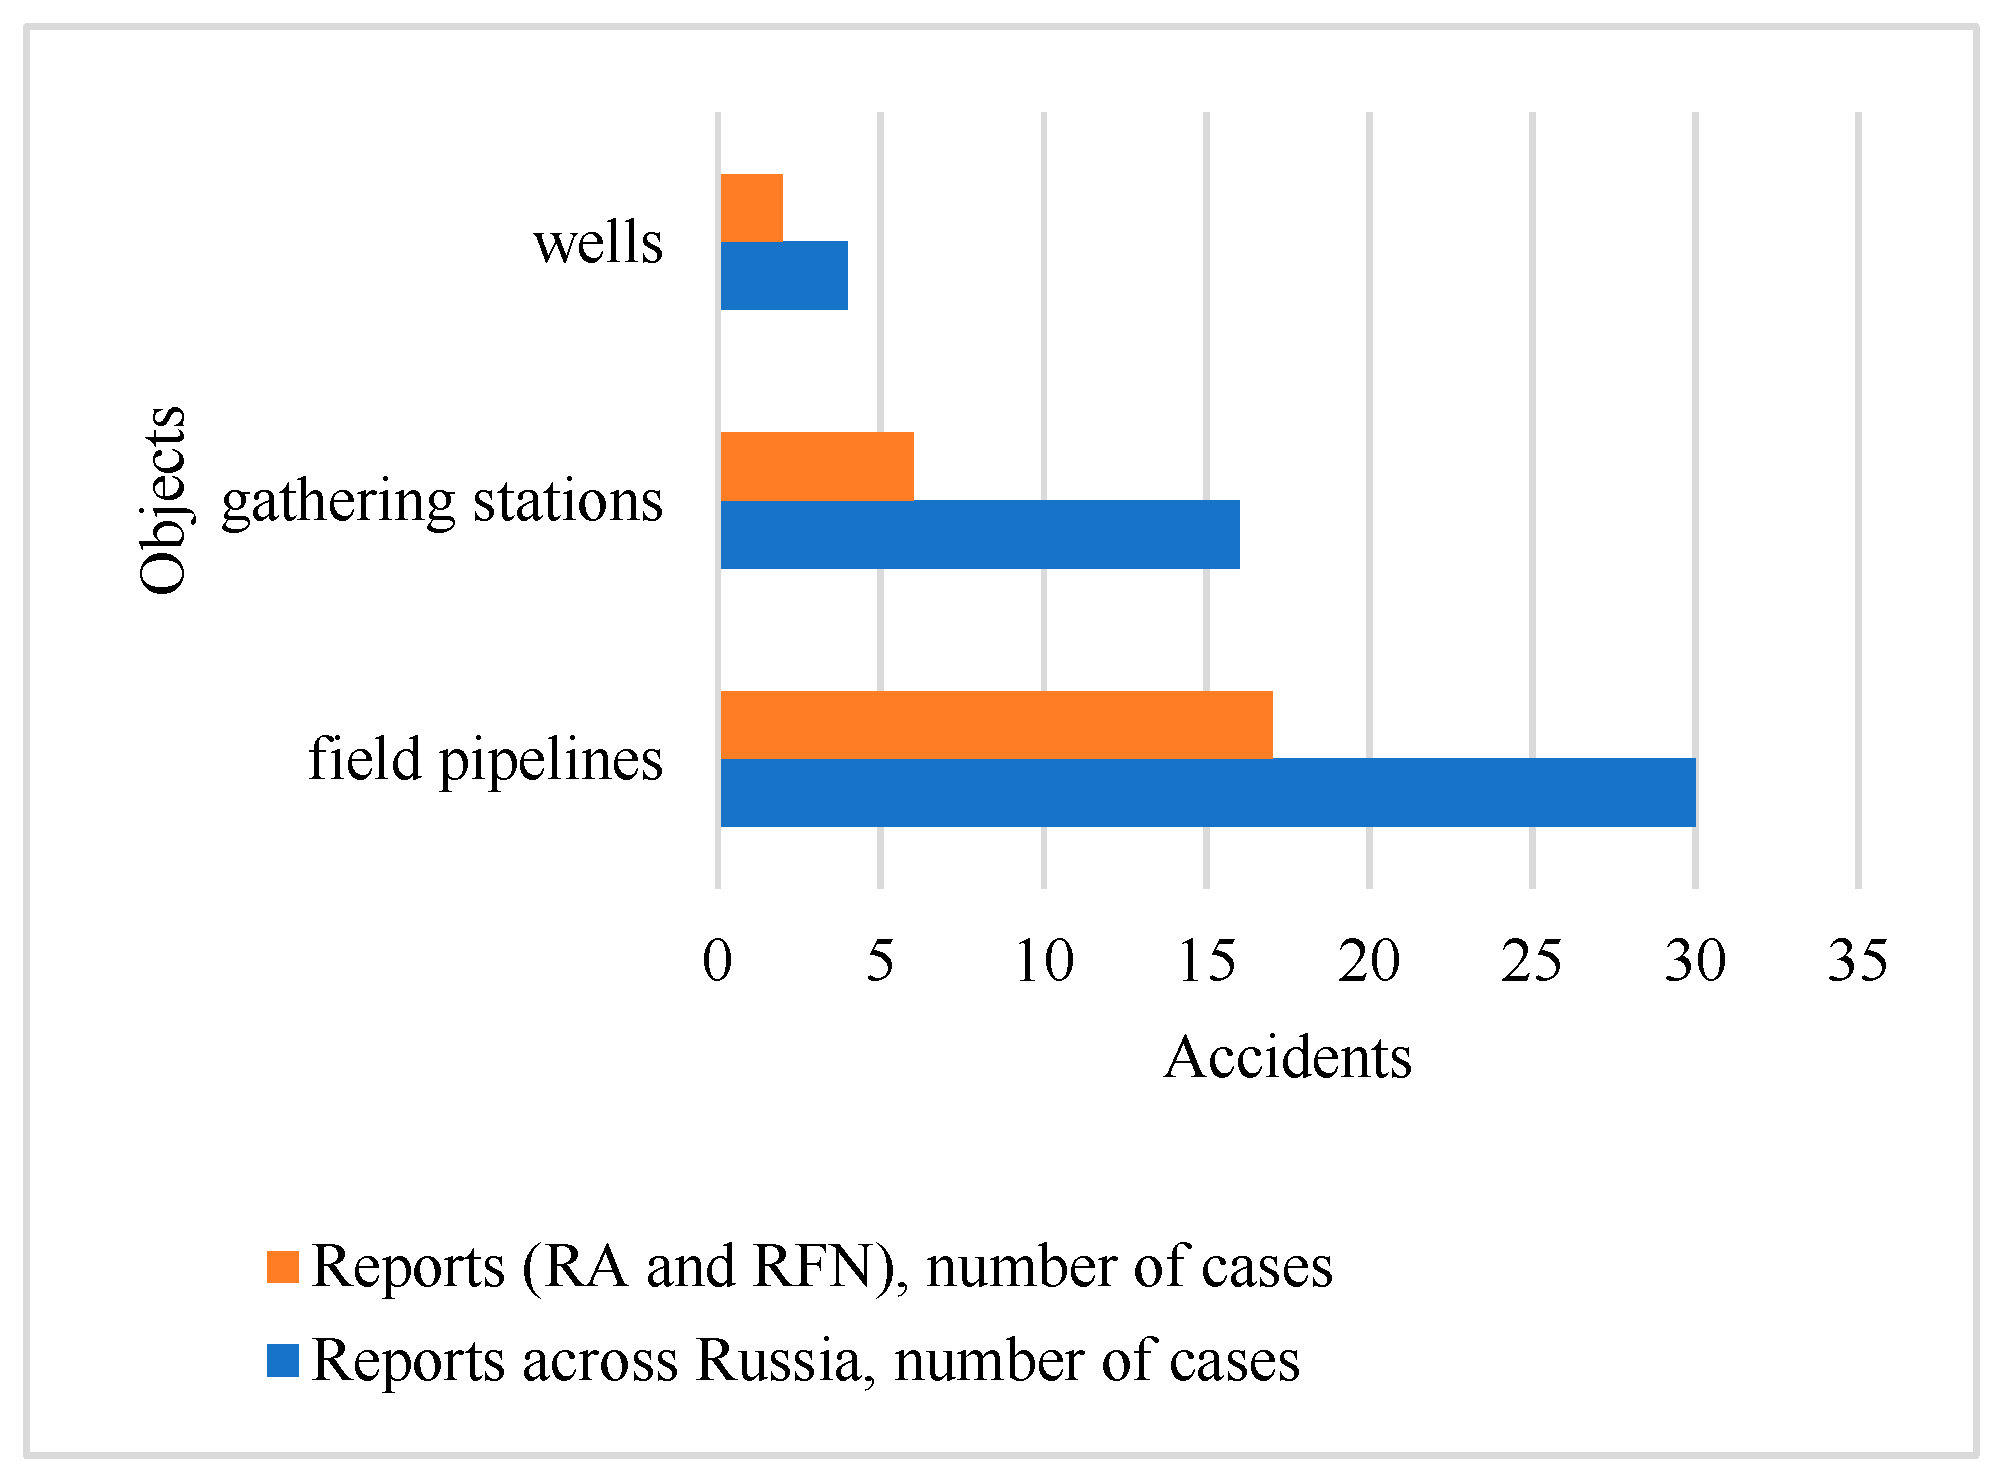
Figure 1. Distribution by object across Russia, RA, and RFN.
Resources 14 00147 g001
Figure 2. Distribution by accident type across the same territories.
Resources 14 00147 g002
Figure 3. Distribution by types of technical consequences.
Resources 14 00147 g003
Figure 4. Distribution by types of social consequences.
Resources 14 00147 g004
Figure 5. Distribution by total economic impact.
Resources 14 00147 g005
Figure 6. Distribution by cause groups.
Resources 14 00147 g006
Figure 7. Sankey diagram for the Object–Type pair.
Resources 14 00147 g007
Figure 8. Relationship between the object and the type of accident.
Resources 14 00147 g008
Figure 9. Relationship between the object and physical causes. Symbols O1, O2, and O3 are used to designate the accident objects "Point," "System," and "Fund." Symbols A, B, and C are used to designate the physical causes of the accident "Other," "External Corrosion," and "No Data".
Resources 14 00147 g009
Figure 10. Relationship between the object and technical causes.
Resources 14 00147 g010
Figure 11. Relationship between social consequences and technical causes.
Resources 14 00147 g011
Table 1. Distribution of oil and petroleum product spill accidents across Russia and specific regions.
VariableLevel/CategoryReports (2014–2024)
RussiaRARFNRA and RFN
1ObjectField pipelines3011617
Gathering stations16336
Wells4112
2Accident typeStructural failure (depressurization)4214822
Uncontrolled explosion3-22
Uncontrolled release of hazardous substances51-1
3Consequences (technical) Object damaged18538
Operation suspended (no significant damage)247411
Destruction of the object8336
4Consequences (social)No casualties4415722
Casualties (no fatalities)1---
Fatal casualties5-33
5Spill typeLocal274711
Regional 1---
Interregional11415
Federal21-1
No data9224
6Consequences (economic; total damage in thousand USD)<1.03112
1.0–100.06-33
100.0–500.0177310
500.0–1000.05112
1000.0–10,000.073-3
>10,000.021-2
No data10224
7Cause (technical) External mechanical damage21-1
Material defects42-2
Equipment defects6112
Weld seam rupture5224
Not identified339716
8Cause (organizational)Operational22469
Administrative227310
Not identified4414
9Cause (physical and chemical processes)Internal corrosion206511
Other causes (external corrosion, vibration, electrostatics)83-3
Not identified226511
10RegionRussian Arctic (RA)1515-15
Russian Far North (RFN)10-1010
Other regions25---
Table 2. Categorical variables.
VariableLabelLevelsType
1ObjectObject3nominal
2Type of accidentType3nominal
3Consequences (technical)Tech3nominal
4Consequences (social)Social3nominal
5Type of spillSpillType4ordered
6Total damage in thousand USDTotalDamage7ordered
7Cause (technical)CauseTech 5nominal
8Cause (organizational)CauseOrg3nominal
9Cause (physical and chemical processes)CausePhi3nominal
10RegionRegion3nominal
Table 3. Contingency table for variables Object and Type of Accident.
ObjectTypeTotals
ABC
O1211316
O2122730
O30224
Totals354250
Table 4. Tschuprow T values for nominal variables.
ObjectTypeTechSocialCauseTechCauseOrgCausePhiRegion
Object1.00000.30620.22510.20930.36950.25080.45020.1408
Type0.30621.00000.29340.16030.21980.14240.13000.2573
Tech0.22510.29341.00000.19780.26360.29010.19910.1685
Social0.20930.16030.19781.00000.30580.21270.15230.2686
CauseTech0.36950.21980.26360.30581.00000.26290.48150.1863
CauseOrg0.25080.14240.29010.21270.26291.00000.24330.2513
CausePhi0.45020.13000.19910.15230.48150.24331.00000.1577
Region0.14080.25730.16850.26860.18630.25130.15771.0000
Table 5. p-values for nominal and ordered variables.
ObjectTypeTechSocialCauseTechCauseOrgCausePhiRegion
TotalDamage0.57270.88910.13760.26450.71000.20170.82170.3818
SpillType0.86450.41960.42710.41180.88980.69930.60820.428
Disclaimer/Publisher’s Note: The statements, opinions and data contained in all publications are solely those of the individual author(s) and contributor(s) and not of MDPI and/or the editor(s). MDPI and/or the editor(s) disclaim responsibility for any injury to people or property resulting from any ideas, methods, instructions or products referred to in the content.