Abstract
The increasing complexity of Water Distribution Systems (WDSs), driven by urbanization, climate change, and aging infrastructure, necessitates robust methods for risk assessment and visualization. This study presents a practical methodology for mapping the risk of water supply disruption or reduction using five parameters: Probability (P), Consequences (C), Water Pipe category (WP), Inhabitants exposed (I), and response Efficiency (E). The approach enables comprehensive analysis of the risk associated with specific pipeline segments within an Analyzed Supply Area (ASA). The method integrates statistical and operational data, allowing utilities to evaluate vulnerability, identify Critical Infrastructure (CI), and prioritize maintenance. The investigation conducted during the study revealed that cast iron and steel pipes with large diameters (e.g., 400 mm) show the highest failure probability and impact. Despite a calculated risk value (rLW = 80), effective response measures—including specialized repair teams and equipment—kept the risk acceptable. The results demonstrate that historical failure and response data enhance risk identification and management. The generated risk maps facilitate spatial visualization of high-risk areas, supporting decision-making processes, renovation planning, and emergency preparedness. Integration with GIS tools, including GeoMedia and Google Earth programmes, enables dynamic map creation and simulation of response scenarios. The methodology is scalable and adaptable to any WDS, and potentially to other municipal systems such as wastewater and heating networks. By accounting for both technical and social dimensions of risk, the method supports improved water safety planning and infrastructure resilience. Future development should include real-time data integration and climate-related risk scenarios to increase predictive accuracy and system adaptability.
1. Introduction
Technological progress and ongoing civilizational development are driving increasingly stringent requirements for the reliability and safety of technical systems across all sectors of life [1]. The concept of reliability is defined in various ways in the literature, depending on the technical system under investigation [1,2,3,4,5,6,7,8].
The reliability and operational safety of technical systems have long been recognized as key engineering challenges across industries. Conventional reliability assessments typically emphasize technical performance and long-term functionality, often neglecting broader environmental, spatial, and societal risks. While such approaches provide valuable insights, they remain insufficient to capture the complex, multidimensional risks faced by modern technical systems [9,10,11,12,13,14,15,16,17,18]. In this paper, reliability concepts were transferred to the water supply sector by adapting general risk assessment principles to the specific characteristics of water supply networks. The borrowed methods utilized, among others, the probability–consequence matrix, component classification by criticality, and risk indicators used in mechanical engineering and energy. At the same time, the methodology was adapted to the operating conditions of water supply systems, taking into account the diversity of pipe materials, network types (main and distribution), water pressure, the impact of failures on consumers, and the availability of specialized repair crews. As a result, determining the risk for sections of the water supply network not only enables the identification of critical segments but also the planning of preventive and intervention measures tailored to operational realities.
In the environmental engineering literature, the reliability and operational safety of water supply systems have long been recognized as critical research areas [19,20,21,22,23,24,25,26]. The reliability and safety of water supply systems is typically assessed in terms of their long-term ability to fulfill designated technical functions, despite the presence of stochastic and degradative factors, such as material wear, operational errors, and external influences, including climatic conditions [27,28,29,30,31].
Given the escalating challenges posed by climate change, urbanization, intensified water resource consumption, and an increasing frequency of extreme events, there is a growing need for an integrated approach that combines technical reliability analysis with risk assessment related to the continuity and quality of water supply [32]. This approach enables the identification, spatial visualization, and evaluation of potential hazards and the vulnerability of water supply systems to various risk factors [33,34,35,36].
This article seeks to address a research gap by presenting the potential application of matrix-based methods for developing risk maps concerning water supply disruptions or limitations. The primary objective of these risk maps is to enable the integrated identification and visualization of hazards, such as failures of technical infrastructure. Simultaneously, the maps support the assessment of system vulnerability to specific threats by highlighting areas at elevated risk due to poor technical condition of the water supply network, lack of alternative supply sources, high population or industrial density, or underdeveloped crisis management mechanisms.
Despite the growing significance of water security, the existing literature still lacks integrated methodologies combining risk assessment with geospatial analysis for water supply systems. Risk mapping constitutes an innovative avenue in water security research, especially for public water utilities, providing substantial support for both operational and strategic decision-making. It represents a valuable tool for engineers, planners, and utility managers. Existing risk analysis methods for water supply systems focus primarily on the technical reliability of infrastructure and traditional safety procedures, limiting their ability to account for external factors such as climate change, urbanization pressures, and socioeconomic aspects. The lack of integration of spatial and multidimensional data hinders the identification of particularly vulnerable areas, and the assessment of the social and economic impacts of water supply disruptions remains fragmented. Furthermore, traditional approaches rarely offer tools that support both operational and strategic decisions, limiting their practical application in investment planning and crisis management.
The approach proposed in this research has broad practical applications, including guiding infrastructure investment decisions, enhancing emergency and crisis response and increasing public awareness of water access vulnerabilities. The primary objective is to present a coherent concept for risk map development, accompanied by a practical example, structured around hazard identification (water pipes failures), vulnerability evaluation, and impact assessment. This methodology also serves as a functional decision-support tool for water utility professionals, improving their capacity to anticipate threats and implement effective preventive and corrective measures.
2. Materials and Methods
2.1. Risk Analysis in Water Distribution Subsystems (WDSs)
A Collective Water Supply System (CWSS) is defined as a technical system—a configuration of engineering components and devices—designed to deliver potable water to points of consumption in specified quantities, with appropriate physicochemical quality and at the required hydraulic pressure, at any time convenient to the end user. For the system to fulfill its intended function, it must (i) supply the population with water as an essential resource for sustaining life; (ii) maintain sanitary and hygienic conditions necessary for public health; (iii) ensure adequate quality of life; and (iv) provide water to economic sectors (including industrial and service sectors).
Each water supply system possesses distinct structural and operational characteristics and consists of interdependent subsystems that form a cohesive functional unit. Among these, the Water Distribution Subsystem (WDS) is fundamental in maintaining the operational continuity, functional reliability, and hydraulic integrity of water delivery to users [19,20,24,26,31,36].
The WDS comprises a network of distribution mains and branch pipelines, supplemented with strategically located hydraulic structures such as booster pumping stations, hydrophore stations, and buffer storage reservoirs. These elements ensure the stabilization of pressure zones, compensate for demand fluctuations, and support the hydraulic resilience of the distribution network.
Given their status as key elements of critical infrastructure, modern water supply systems require advanced, systematic tools for risk identification, assessment, and mitigation, with the ultimate goal of securing the uninterrupted supply of microbiologically and chemically safe drinking water and preserving public health and safety. The contemporary body of literature provides a wide spectrum of analytical frameworks and Decision-Support Systems (DSSs) for the evaluation and management of risk in urban water distribution networks.
Risk analysis in water supply systems is aimed at quantifying potential threats by estimating the magnitude of risk parameters as defined by the selected analytical method. Classification criteria for these methods are primarily based on the nature and structure of system data and information sources. In the application of qualitative and quantitative risk assessment methods, the availability and granularity of statistical or operational data is a critical factor. On the other hand, methods relying on deductive or inductive logic may integrate fuzzy logic inference systems to account for uncertainty, imprecision, or incomplete datasets.
A general classification of methodologies employed in risk analysis can be outlined as follows:
- Quantitative methods—These approaches are designed for the analysis of undesirable events in which the risk outcome is expressed as a numerical (measurable) value. Typical examples include methods based on mathematical statistics, probability theory, Failure Mode and Effects Analysis (FMEA), and Failure Mode, Effects, and Criticality Analysis (FMECA).
- Qualitative methods—These are applied to assess hazardous events using linguistic descriptors instead of numerical output. Such methods are often used when precise data are unavailable or impractical to obtain. Representative examples include checklists, What-If analyses, and expert judgment-based assessments.
- Semi-quantitative (qualitative–quantitative) methods—These methods are used to reconstruct or identify the underlying causes and conditions contributing to undesired events, particularly in contexts with limited or insufficient data availability. They combine aspects of both qualitative reasoning and numerical modelling. Notable examples include matrix-based methods (Matrix methods—Multi-parameter techniques) that involve assigning weighted point values to various parameters under analysis, typically using a 3-point or 5-point scale. The most advanced matrix-based method currently in use evaluates five distinct risk parameters. These methods are applicable across all industrial sectors regardless of enterprise type [20,37]), Event Tree Analysis (ETA), Fault Tree Analysis (FTA), Fuzzy Risk Analysis (FRA), Genetic Algorithm-based Risk Analysis (GARA).
- Simulation-based methods—These tools are designed for control, simulation, processing, and recording of system data, supporting the broader risk analysis workflow. They provide an operational platform for risk modelling, scenario testing, and real-time monitoring. Key examples include Geographical Information Systems (GISs) for spatial risk mapping and data integration, Hydraulic modelling platforms, such as Supervisory Control and Data Acquisition (SCADA) systems.
In the present study, GIS applications were utilized as a core methodological tool for developing spatially explicit risk maps related to water supply system vulnerabilities.
Risk assessment is increasingly critical under global challenges such as urbanization, climate change, and aging infrastructure. Higher population density and urban expansion stress water distribution systems, raising the likelihood of overloads and failures. Extreme weather events—droughts, floods, and intense rainfall—further challenge operations and increase the risk of secondary contamination. Unplanned supply interruptions pose substantial public health and social risks, particularly in densely populated areas [19,20,23,31].
In this context, risk analysis transcends its role as a purely technical instrument, becoming a strategic pillar of water security planning. However, there remains a lack of standardized risk assessment frameworks that enable consistent and comparable evaluation across diverse hazard scenarios within water distribution systems.
Risk mapping emerges as a promising solution to this methodological gap. It not only enables spatial visualization of high-risk zones but can also account for the differential impact of environmental, demographic, and technical factors, which can serve as further research targets. The development of comprehensive spatiotemporal risk mapping tools represents a crucial research direction with substantial practical relevance for environmental engineering and urban water management.
2.2. Risk Maps—Main Assumptions
For the purposes of analyzing and assessing the operational safety of the water supply system and developing water supply disruption risk maps, the following definition of a risk map has been proposed:
“A water supply disruption or limitation risk map is a graphical representation of areas directly exposed to negative impacts associated with adverse events occurring in the Water Distribution Subsystem (WDS), based on risk analysis and assessment in accordance with the adopted methodology. This map represents the type of risk in a given water supply area”.
Before beginning risk mapping, the study area should be defined. The proposed study area consists of the following elements:
- (a)
- The adopted risk definition;
- (b)
- A defined Analyzed Supply Area (ASA);
- (c)
- A classification of adverse events that could result in a lack or limitation of water supply based on the operational database of pipe failure rates and their statistical analysis;
- (d)
- A defined water pipe constituting the subject of research and analysis (Considered Water Pipe—CWP);
- (e)
- A detailed description of the risk component parameters in accordance with the proposed methodology;
- (f)
- A paper or digital version of the map with the water pipe subject to analysis marked, along with the risk type and the potential area of lack or limitation in water supply.
Before developing risk maps, it is important to answer the following question: What will the maps be used for and who can use them? The operator is responsible for systematically ensuring the safe operation of the water supply system. Statistical data and literature indicate the problem of water losses and damage to water pipes, which are the main causes of lack or limitation of water supply to customers [23,30,31].
All actions taken to ensure water supply security should take the form of a safety management system. It is recommended that the development of such a system be preceded by an assessment and subsequent graphical presentation of the risk analysis results and the contributing factors in the Analyzed Supply Area (ASA), e.g., city or municipality. For the purposes of developing the proposed methodology, it was assumed that the analyzed supply area is the area under consideration for supplying the population with tap water. For practical reasons related to developing the risk map, it was also proposed to define/distinguish a water supply line as a hypothetical cause of a water supply outage. This line in the ASA was referred to as the Considered Water Pipe (CWP).
Risk maps for water supply outage or limitation can be developed based on an estimate of the risk level and its components, using statistical or probabilistic methods. When estimating risk, it is important to consider the types and sources of adverse events that significantly impact the safe operation of the CWSS in the ASA (causing negative consequences). For the purposes of developing the risk map methodology, threats related to the operation of the water supply network were assumed. Water supply line failures were proposed as adverse events resulting in a negative impact on the ASA.
The decision to select a CWP should be made by the user of the created maps, e.g., the entity managing the operational safety of the water supply network (operator). The following factors undoubtedly influence this decision:
- The recurrence of failures in specific water lines;
- The effects of Adverse Events (AEs), financial and social losses;
- The availability of financial resources and equipment to combat the AE.
By decision of the water supply network operator, for example, a main water pipe that fails several times a year may be accepted as a CWP.
Figure 1 and Figure 2 present the considered single pipe against the background of the analyzed supply area and a view of an example CWP with the number of water supply network failures marked.
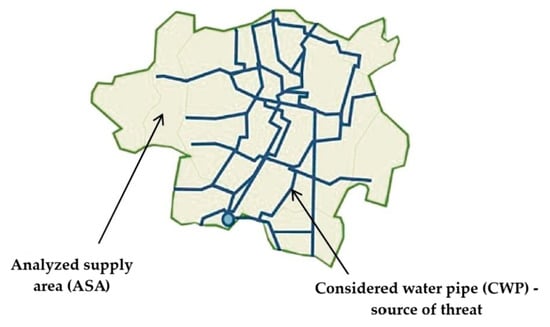
Figure 1.
Example scheme of the Analyzed Supply Area (ASA) and the Considered Water Pipe (CWP) with water treatment plant (WTP) (blue dot) (own work).
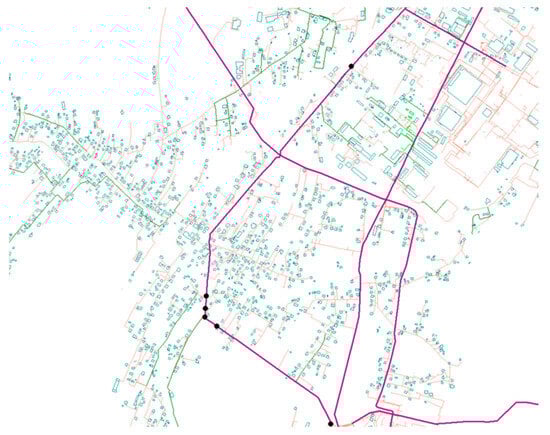
Figure 2.
An illustration of the CWP with marked water pipe failures (own work, view from the GeoMedia Professional—Intergraph Corporation).
The next step in risk mapping involves identifying Adverse Events (AEs).
A detailed AE analysis is the basis for creating risk maps for each AE. The risk of financial or health losses, or a lack or reduction in water supply within a year, is generally associated with the possibility of multiple AEs occurring.
A proposed classification of AEs (AE(k)) is as follows:
- AE(1)—water pipe burst;
- AE(2)—water pipe leak;
- AE(3)—water pipe fracture;
- AE(4)—water pipe corrosion;
- AE(5)—mechanical damage to the water pipe.
These events can be written as AE(k), where k = 1, 2, …, r is the event number, and r is the number of AEs determined during their identification. Identifying AEs is the most important step in risk assessment based on the ASA. It is difficult, especially when a sufficiently large and accurate statistical database of identified events is lacking. The most common method for identifying AEs involves utilizing employee knowledge, the experience and intuition of experts (specialists), as well as empirical knowledge gathered in the form of statistical data and reports on the causes and effects of AEs that have occurred in the water supply network over recent years. The next step in the risk mapping stage is identifying AEs based on the adopted ASA.
2.3. Mapping the Risk of Lack of Water Supply—A New Approach in CIs Risk Analysis
In the context of water supply system operation, the risk of water supply disruption or reduction due to an adverse event is inherent to both the producer and the consumer. For water producers, this risk entails financial costs incurred by the company when an adverse event occurs. For water consumers, the risk is related to the loss of water supply security due to inconveniences associated with interruptions in water supply, water shortages, and the potential loss of health or life resulting from consuming poor-quality water. Risk is therefore a measure of the loss of security and should be interpreted as the probability of an adverse event occurring and its associated consequences.
Before proceeding to the risk mapping stage, estimate the risk level using the author’s risk definition in accordance with Equation (1):
where
- rLW—risk of water supply interruption or limitation;
- Pi—point weight related to the probability of a specific AE occurring (e.g., corrosion of a water pipe);
- Ci—point weight related to the consequences of an AE causing an interruption or limitation of water supply, along with financial losses incurred during the removal of its negative consequences;
- WPi—point weight related to the water pipe category;
- Ii—point weight related to the estimated number of inhabitants exposed to an interruption or limitation of water supply due to the occurrence of an AE;
- Ei—efficiency of the service removing the effects of an AE, depending on the time of arrival at the site of the event and the equipment of repair/specialized teams with specialized equipment.
For individual risk parameters, the following descriptive point scale criteria were proposed (Table 1, Table 2, Table 3, Table 4 and Table 5). The presented criteria were developed based on own research, accident logs and literature studies [20].

Table 1.
Descriptive point scale criteria for parameter Pi; i = 1, 2, 3, 4, 5 (own work).
Table 2.
Descriptive point scale criteria for parameter Ci; i = 1, 2, 3, 4, 5 (own work).
Table 3.
Descriptive point scale criteria for parameter WPi; i = 1, 2, 3, 4, 5 (own work).
Table 4.
Descriptive point scale criteria for parameter Ii; i = 1, 2, 3, 4, 5 (own work).
Table 5.
Descriptive point scale criteria for parameter Ei; i = 1, 2, 3, 4, 5 (own work).
Using Equation (1), a five-parameter risk matrix was obtained in numerical form, which is the first step in creating a risk map. An example five-parameter matrix for the probability parameter P = 5 is presented in Table 6.
Table 6.
Five-parametric matrix for the probability parameter P = 5 (own work).
For individual risk values, point scales and corresponding risk levels are proposed in Table 7.
Table 7.
Proposed risk categories.
2.4. Risk Maps Stakeholders
The users of the developed risk maps may be different organizational units and different departments of the water supply company. The information presented on the maps should be adapted to the individual needs of the recipient. Potential users of risk maps are as follows:
- Water and sewage companies (water supply network operators)
Role: operation, maintenance, and modernization of water supply infrastructure.
Map applications: planning infrastructure investments in areas particularly vulnerable to water supply interruptions; supporting crisis management and preparing emergency plans; assessing operational and technical risks related to network failures and the quality of supplied water; optimizing maintenance activities based on high-risk zones.
- Local and regional government authorities
Role: overseeing the implementation of tasks related to water supply and crisis response.
Map applications: supporting the development of local climate change adaptation plans; establishing priorities for spatial policy and infrastructure development; inter-municipal coordination in the event of regional hydrological threats; planning sustainable urban development, taking into account areas with low infrastructure resilience.
- National-level decision-makers (ministries, government agencies, planning institutions)
Role: creating public policies, technical standards, and water resource management strategies.
Map applications: supporting the development of local climate change adaptation plans; prioritizing spatial policy and infrastructure development; and planning sustainable urban development, taking into account areas with low infrastructure resilience.
- Crisis management and civil protection services
Role: responding to emergencies (droughts, water supply failures, water contamination).
Map applications: rapidly locating areas at risk of water supply disruptions; creating crisis scenarios and evacuation plans for public institutions; coordinating activities with other services (fire brigade, military, healthcare), and improving operational preparedness in the event of natural disasters and cyberattacks on infrastructure.
- Public health and sanitary sector entities (e.g., sanitary inspectorates)
Role: supervising drinking water quality and counteracting health threats.
Map applications: early identification of areas at increased risk of drinking water supply disruptions; supporting preventive and intervention measures in the event of microbiological or chemical threats; informing the public about the potential health impacts of water supply disruptions; setting priorities for water testing in various risk zones.
- Scientific institutions and research centers
Role: conducting research on water security, climate change, and urbanization.
Map applications: analyzing long-term water hazard trends; supporting predictive models and simulations of the impact of climate change; developing GIS tools and integrated spatial information systems; developing recommendations for public policy and technical standards.
- Critical users and institutions
Role: consumers of large volumes of water—hospitals, industrial plants, schools, public facilities.
Map applications: planning internal emergency procedures in the event of limited water access; implementing retention solutions and alternative power sources; assessing operational risks and potential production losses; collaborating with local authorities and suppliers to increase system resilience.
3. Results
3.1. Research Object
The study site is a voivodeship capital located in south-eastern Poland. This area lies in the Sandomierz Basin, in the basin of the Wisłok River—a left-bank tributary of the San River. The hydrographic and geomorphological conditions of this region, combined with dynamic urban development, constitute significant determinants of the design, operation, and modernization of water supply infrastructure. According to data from the Central Statistical Office, the city’s population in 2024 was 198,317 inhabitants, with a clear upward trend resulting from industrial development, internal migration, and the expansion of the city’s administrative boundaries. This growth generates increased water demand and the need to modernize and expand the water supply system. The water supply network administered by the water company covers a total of 1140.66 km (as of 31 December 2022), including 336.07 km of water service lines, 99.11 km of main lines, and 705.48 km of distribution lines. Water supply pipes are primarily made of plastic materials that meet the requirements of the Regulation of the Minister of Health of 7 December 2017, regarding the quality of materials in contact with drinking water (Journal of Laws of 2017, item 2294) [38,39]. Modern materials provide increased corrosion resistance, lower flow resistance, and longer service life. The distribution system is based on a zone system divided into several pressure zones, which are maintained by pump sets and retention reservoirs located throughout the city. This arrangement allows for effective management of pressure and supplies in various areas of the city, especially those with varying terrain and building heights.
The analyzed water supply network is an excellent example of a medium-sized system combining traditional infrastructure elements with modern operational solutions. Therefore, it is a valuable research site in the context of the following:
- Assessing the reliability of water distribution systems;
- Analyzing the risks of failures and their environmental and social impacts;
- Testing renovation methods (including trenchless technologies);
- Assessing the carbon footprint of water and sewage infrastructure modernization;
- Implementing decision-support tools, such as water supply risk maps.
In addition, the urban context, growing climatic threats, and increasing network load make the study site highly representative for research on sustainable water management in medium-sized cities in Central and Eastern Europe.
Figure 3 shows the location of the study area.
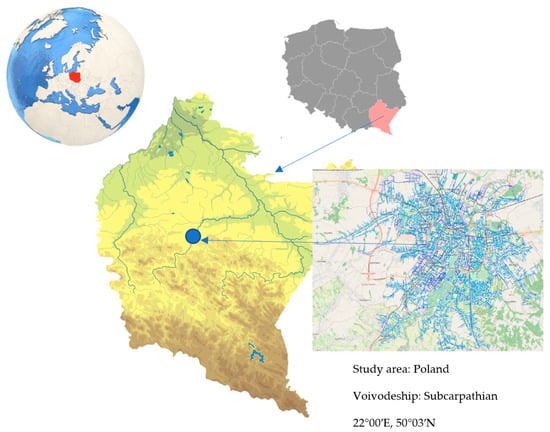
Figure 3.
Location map of analyzed study area and research object (own work).
3.2. Risk Maps of Lack of Water Supply: Case Study
In accordance with the proposed methodology for creating risk maps presented in Section 2 of this paper, the following research area and its components were adopted:
- (a)
- Risk definition as proposed in Risk definition as proposed in Section 2.2.
- (b)
- Defined ASA—Analyzed Supply Area. The structure of the ASA is shown in Figure 4. The main water network alignment is shown in purple, the distribution network is shown in green color, and surrounding urban structures are included as reference layers from the GIS.
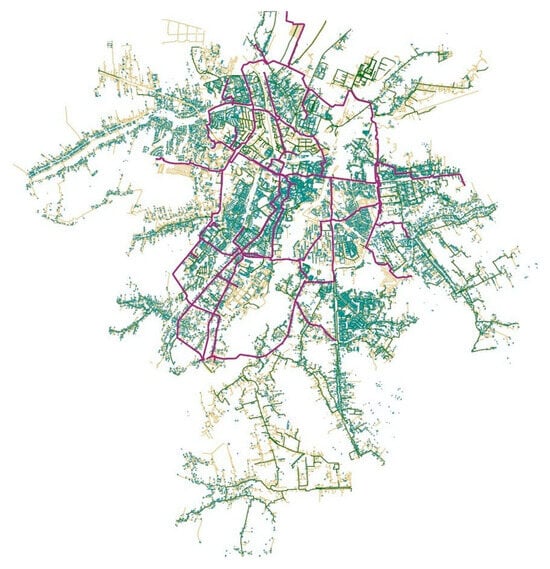 Figure 4. Defined Analyzed Supply Area (ASA)—the city being studied (own work, view from the GeoMedia Professional—Intergraph Corporation programme).
 - (c)
- Analysis of adverse events that could cause a water supply failure (analysis of water supply network failure rates, broken down by diameter, material, and cause). In accordance with the stages of identifying adverse events and based on research conducted at the water supply company, quantitative events related to water supply pipe failure rates were assumed, based on operational data and the results of analyses developed by the authors and presented, among others, in [20]. Linear sources of hazard (water supply pipes) were assumed. At this stage, a preliminary assessment of the negative effects resulting from the possibility of an AE was made. The expert team assumed that failures in the main water supply network cause the greatest negative effects, with the highest probability of failure of these pipes estimated for networks made of cast iron and steel, as evidenced by reports and failure logs owned by the water supply company.
- (d)
- Defined unit pipe under consideration (selected based on the results of failure analysis—CWP). At this stage, a water pipe is selected for analysis and risk assessment—CWP. Any water pipe can be subjected to analysis and risk assessment, depending on the needs of the map recipient. The pipe should be selected based on employee and expert knowledge and a database of failures. The decisive factors during the selection should be the number of failures over several years, the pipe’s age, material, diameter, pipe location, and an estimate of the number of residents who may experience the negative effects of its failure in the form of a lack of water. A 400 mm diameter main pipe made of cast iron was selected for the risk map, as it had the highest failure rate in the analyzed period.
Figure 5 shows the ASA water supply area under study. The main water supply network is highlighted in purple, and failure events recorded over the three years of operation are indicated by red dots.
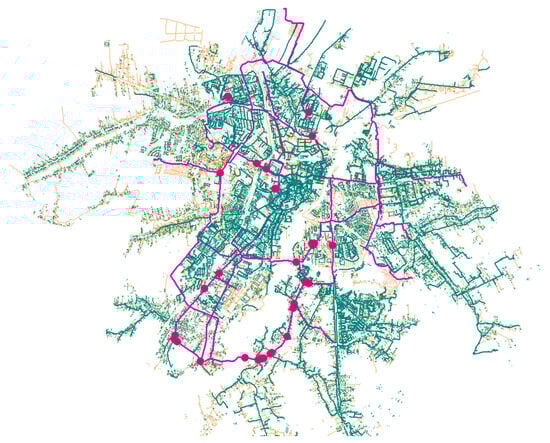
Figure 5.
Failures of the main network on ASA (own work, view from the GeoMedia Professional—Intergraph Corporation programme; main water network marked in purple color, dots represent failures).
Figure 6 illustrates a section of the main network with faults (marked with dots) that was analyzed in the case study.
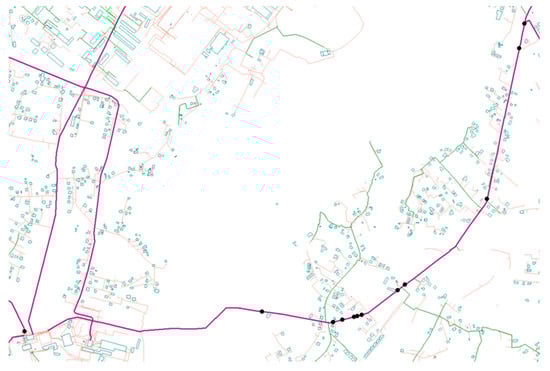
Figure 6.
Considered water pipe (CWP) (400 mm pipe, cast iron—marked in purple color) with failure rate (black dots) with ASA background (own work, view from the GeoMedia Professional―Intergraph Corporation programme).
Figure 7 shows a spatially analyzed fragment of the main water supply network (CWP) taking into account the failure rate in the analyzed ASA supply area, imported into Google Earth program.

Figure 7.
Considered (CWP) with failure rate (red dots) with ASA (own work, view from the Google Earth program level).
- (e)
- Description of the component parameters used to determine the risk value in accordance with the proposed five-parameter risk definition and the results of the water supply interruption risk analysis in accordance with the proposed methodology. In accordance with the proposed five-parameter risk matrix and the criteria for the descriptive-point scales for each parameter, the point weights assigned to each parameter were summarized:
- Point weight of the probability parameter of an undesirable event, determined based on the number of pipe failures—P = 5;
- Point weight of the loss parameter related to the cause of the water supply interruption or limitation—C = 4;
- Point weight of the parameter related to the water supply category—WP = 4;
- Point weight of the parameter related to the estimated number of residents exposed to water supply interruption or limitation due to the occurrence of a water supply interruption—I = 5;
- Point weight of the parameter related to the effectiveness of removing the effects of a water supply interruption, depending on the time of arrival at the site and the availability of specialized equipment—E = 5.
The matrix method, also known as the expert method, requires collaboration between designers, contractors, scientists, and water network operators. This collaboration allows for the pooling of knowledge and experience of experts in a given field, allowing for consideration of all factors influencing the risk of network damage. This, in turn, impacts the safety of water supply.
Based on Formula (1) and the risk matrix, the risk value was calculated:
According to the point scale and proposed risk levels (Table 7), a risk level (r = 80) was calculated, corresponding to acceptable risk. In this case, despite the high probability of failure and the negative consequences of the failure, significant importance should be attached to a specialized repair team equipped with specialized equipment and access to the incident site. It should be noted, however, that the results are sensitive to changes in individual parameters, such as the efficiency of repair crews or the availability of specialized equipment. The lower the efficiency or limited resources, the higher the risk of failures and interruptions in water supply to consumers. Therefore, it is recommended to periodically update input data and analyze the sensitivity of risk indicators, which allows for informed planning of preventive and intervention measures.
- (f)
- A water supply shortage or limitation risk map, showing the analyzed water supply line, along with the risk type and the potential water supply shortage or limitation area (GIS or Google Earth applications available). Such analyses and simulations can be performed for each water supply line/network section, depending on the individual needs of the map user.
Figure 8 presents the results of the risk analysis for the analyzed section of the main water supply network in the form of a risk map. According to the obtained result, rLW = 80, and Table 7, the determined risk corresponds to an acceptable level (colored in yellow).

Figure 8.
Results of risk map for the selected CWP; rLW = 80—acceptable level of risk (red dots—failures on water pipes), (own work, view from Google Earth program).
4. Discussion
The methodology developed for visualizing the risk of water supply disruption or reduction through risk maps offers a comprehensive and multi-dimensional framework for risk analysis and management in water utilities. By employing a five-parameter risk assessment approach (P, C, WP, I, E), the method integrates technical, operational, and social considerations, allowing for a nuanced evaluation of both the likelihood of failures and their potential consequences.
The resulting risk maps enable the identification and spatial visualization of critical network sections, with the analysis highlighting that main pipes made of cast iron and steel, particularly those with large diameters (e.g., 400 mm), exhibit the highest probability of failure alongside significant social and operational impacts (Figure 5 and Figure 6). The assessment of a specific water pipe, with an estimated risk value of rLW = 80, classified it as an acceptable risk, reflecting the effectiveness of existing emergency procedures, the rapid response of specialized repair teams, and the availability of appropriate equipment in mitigating the consequences of potential failures.
Integration with GIS platforms or tools such as Google Earth further enhances the methodology by enabling dynamic visualization of risk levels and the development of interactive response scenarios tailored to the needs of end users, including network operators, city administration, and emergency services (Figure 7 and Figure 8).
As a newly proposed methodology, there are currently no directly comparable studies in the existing literature, underscoring the novelty of this approach and its potential to advance water supply risk management research.
Nonetheless, the method presents several limitations that warrant consideration. Firstly, it relies extensively on historical failure and operational data, which may not fully capture emerging risks associated with climate change, urban expansion, or sudden infrastructure degradation. Secondly, the current framework does not incorporate real-time monitoring data, such as pressure, flow, or water quality measurements, which could enhance the responsiveness and accuracy of risk assessments. Thirdly, while the methodology incorporates social and operational parameters, it may underestimate complex interdependencies within the urban water network or the cascading effects of simultaneous failures in multiple system components. Furthermore, although the method evaluates technical and social risks, it does not explicitly account for long-term environmental stressors, including drought scenarios or climate-driven hydrological changes, which are increasingly relevant for water supply resilience planning.
Despite these limitations, the proposed methodology represents a significant advancement in water supply risk assessment. By integrating technical, operational, and social factors into a unified spatially explicit framework, it provides a structured, transparent, and adaptable tool for decision-makers, utility managers, and emergency planners. It supports both operational and strategic planning, including infrastructure investment decisions, emergency response preparation, and local climate adaptation strategies. As a result, through strategic management of high-risk sections of the water network and the development of response plans, the methodology contributes to increased resilience of critical infrastructure—both in terms of mitigating the impact of potential failures and increasing the system’s ability to quickly return to full functionality after an unforeseen event.
Overall, the methodology contributes a novel, practical decision-support tool that strengthens the capacity of water utilities to anticipate, prevent, and respond to disruptions in water supply, thereby improving infrastructure reliability and community resilience in the face of urbanization, climate change, and aging water networks.
5. Limitations and Further Research
The study is subject to several limitations that should be explicitly acknowledged.
First, due to the strategic location of the analyzed water supply system near the border with Ukraine, some technical and operational data (e.g., detailed hydraulic parameters such as pressures and flows, as well as the full network layout) could not be disclosed for security reasons. This constraint affects the level of detail presented but does not compromise the validity or internal consistency of the proposed methodology.
Second, the risk model relies on a set of selected parameters (failure probability, failure consequences, repair crew response time, availability of specialized equipment). However, a full sensitivity and uncertainty analysis has not yet been performed. Such analyses are critical for assessing the robustness of results against variability in input data. Future research should therefore include advanced approaches such as Monte Carlo simulations, scenario-based modelling, and stochastic methods to systematically evaluate parameter sensitivity.
Third, the case study presented in this paper concerns a medium-sized urban water distribution network. Although the methodology is designed to be generic, its application to large metropolitan systems requires further validation. Metropolitan networks are characterized by higher hydraulic complexity, multiple pressure zones, high redundancy, and strong interdependencies with other elements of critical infrastructure (e.g., energy, transportation). Extending the methodology to such contexts requires adapting it to large-scale system analysis and considering cascading failure effects.
Fourth, due to data availability constraints, the methodology does not currently include hidden leakages, which are often not recorded in operational databases. The analysis is based on failure logs that remain the only available source of data in the studied system. Future studies should therefore explore the integration of additional data sources, such as telemetry, acoustic monitoring, or numerical leakage modelling, to capture unrecorded water losses.
Based on these limitations, further research should focus on the following:
- –
- Extending validation of the methodology across a range of water distribution systems (from small municipal networks to large metropolitan agglomerations);
- –
- Conducting comprehensive sensitivity and uncertainty analyses to evaluate the stability of results against variations in input parameters;
- –
- Integrating advanced monitoring technologies (IoT sensors, SCADA telemetry, GIS-based platforms) to enable dynamic updating of risk maps;
- –
- Including external and cascading factors, such as power supply failures at pumping stations and potential cyber threats, which were not observed in the studied system but may become relevant in future applications;
- –
- Developing decision-support tools for emergency management, including scenario-based response plans directly linked to risk maps.
6. Conclusions
The developed methodology for visualizing the risk of disruptions or restrictions in water supply using risk maps represents a novel, integrated approach to risk management in the water distribution system. By considering five independent parameters encompassing technical, operational, and social dimensions, the method enables a comprehensive assessment of both the probability and impact of failures. The resulting risk maps enable spatial identification of critical network sections, support decision-making in planning network maintenance and rehabilitation, and facilitate prioritization of areas at risk of failure. The use of matrix techniques also enables the creation of a structured hierarchy of potential failure modes, integrating probabilistic and possibilistic approaches and providing a solid quantitative foundation for water security planning.
While the methodology offers a practical and utilitarian framework based on historical failure data, it is not comprehensive. Current limitations include the lack of real-time monitoring data, such as pressure, flow, and water quality measurements, which could facilitate dynamic updating of risk assessments. Furthermore, this method does not yet fully incorporate climate change projections, drought scenarios, or long-term infrastructure aging models, which are increasingly important in modern water management. These aspects offer opportunities to refine the methodology and expand the application of risk maps to other urban systems, including sewer systems, district heating systems, and integrated urban infrastructure networks.
The proposed approach also strengthens inter-structural coordination within water utilities by providing a common platform for risk visualization, and its integration with tools such as Google Earth improves accessibility for both technical staff and decision-makers. Beyond operational support, the methodology offers strategic value by enabling scenario-based planning, resilience assessment, and informed resource allocation. Future research should focus on integrating real-time sensor data, improving scenario modelling for environmental stressors, and exploring cross-sectoral applications to maximize the utility of risk maps. In summary, the methodology proposes a framework for risk assessment in water supply, combining technical rigor with practical usability, and lays the foundation for adaptive, resilient, and data-driven water management strategies that can respond to evolving urban and environmental challenges.
Author Contributions
Conceptualization, I.P.; methodology, I.P.; validation, I.P., K.B. and B.T.-C.; investigation, I.P.; resources, I.P.; data curation, I.P.; writing—original draft preparation, I.P.; writing—review and editing, B.T.-C., K.B. and M.E.; supervision, B.T.-C., K.B. and M.E. All authors have read and agreed to the published version of the manuscript.
Funding
This research received no external funding.
Data Availability Statement
The data presented in this study are available on request from the corresponding author.
Acknowledgments
We thank the reviewers for their feedback, which helped to improve the quality of the manuscript.
Conflicts of Interest
The authors declare no conflicts of interest.
References
- Breznická, A.; Kohutiar, M.; Krbat’a, M.; Eckert, M.; Mikuš, P. Reliability Analysis during the Life Cycle of a Technical System and the Monitoring of Reliability Properties. Systems 2023, 11, 556. [Google Scholar] [CrossRef]
- Mechri, W.; Simon, C. Improving the Reliability of Safety Instrumented Systems Under Degradation with an Alternating Testing Strategy. Machines 2025, 13, 619. [Google Scholar] [CrossRef]
- Antosz, K.; Machado, J.; Mazurkiewicz, D.; Antonelli, D.; Soares, F. Systems Engineering: Availability and Reliability. Appl. Sci. 2022, 12, 2504. [Google Scholar] [CrossRef]
- Tan, S.; Weinert, D.; Joseph, P.; Moinuddin, K. Impact of Technical, Human, and Organizational Risks on Reliability of Fire Safety Systems in High-Rise Residential Buildings—Applications of an Integrated Probabilistic Risk Assessment Model. Appl. Sci. 2020, 10, 8918. [Google Scholar] [CrossRef]
- Sharon, H.; Prasad, M.; Gowtham, L.; Gopal, P.V.; Aswin, S. Techno–Enviro–Economic Feasibility Assessment of Family-Scale Solar Still (F-SSS) Desalination Plant in Central American and Caribbean Sites for Sustainable Clean Water Supply. Energies 2025, 18, 1431. [Google Scholar] [CrossRef]
- Aggarwal, K.K. Maintainability and Availability, Topics in Safety Reliability and Quality; Springer: Dordrecht, The Netherlands, 1993. [Google Scholar]
- Kołowrocki, K.; Soszyńska-Budny, J. Reliability and Safety of Complex Technical Systems and Processes; Springer: London, UK, 2011. [Google Scholar]
- PN-80/N-04000; Niezawodność w Technice; Terminologia. Polski Komitet Normalizacyjny: Warsaw, Poland, 1980.
- Faber, M.H.; Steward, M.G. Risk assessment for Civil Engineering Facilities: Critical Overview and Discussion. Reliab. Eng. Syst. Saf. 2003, 80, 173–184. [Google Scholar] [CrossRef]
- Denyer, D.; Kutsch, E.; Lee-Kelley, E.; Hall, M. Exploring Reliability in Information Systems Programmes. Int. J. Proj. Manag. 2011, 29, 442–454. [Google Scholar] [CrossRef][Green Version]
- Friederich, J.; Lazarova-Molnar, S. Reliability assessment of manufacturing systems: A comprehensive overview, challenges and opportunities. J. Manuf. Syst. 2023, 72, 38–58. [Google Scholar] [CrossRef]
- Nowakowski, T. Reliability of Logistic Systems; Wroclaw University of Science and Technology Publishing House: Warsaw, Poland, 2011. [Google Scholar]
- Tubis, A.; Werbińska-Wojciechowska, S. Reliable and Resilient Logistic Systems; Elsevier: Amsterdam, The Netherlands, 2025. [Google Scholar]
- Żurek, J.; Małachowski, J.; Ziółkowski, J.; Szkutnik-Rogoż, J. Reliability Analysis of Technical Means of Transport. Appl. Sci. 2020, 10, 3016. [Google Scholar] [CrossRef]
- Corvaro, F.; Giacchetta, G.; Marchetti, B.; Recanati, M. Reliability, Availability, Maintainability (RAM) study, on reciprocating compressors API 618. Petroleum 2017, 3, 266–272. [Google Scholar] [CrossRef]
- Billinton, R.; Allan, R.N. Reliability Evaluation of Power Systems, 2nd ed.; Springer: Boston, MA, USA, 1996. [Google Scholar]
- Salomon, J.; Winnewisser, N.; Wei, P.; Broggi, M.; Beer, M. Efficient reliability analysis of complex systems in consideration of imprecision. Reliab. Eng. Syst. Saf. 2021, 216, 107972. [Google Scholar] [CrossRef]
- Zio, E. Reliability engineering: Old problems and new challenges. Reliab. Eng. Syst. Saf. 2009, 94, 125–141. [Google Scholar] [CrossRef]
- Kwietniewski, M. Reliability modeling of Water Distribution System for Operation and Maintenance Needs. Arch. Hydro-Eng. Environ. Mech. 2004, 51, 85–92. [Google Scholar]
- Rak, J.; Tchórzewska-Cieślak, B. Ryzyko w Eksploatacji Systemów Zbiorowego Zaopatrzenia w Wodę; Wydawnictwo Seidel-Przywecki Sp. z o.o.: Warsaw, Poland, 2013. [Google Scholar]
- Martínez-Rodríguez, J.B.; Montalvo, I.; Izquierdo, J.; Pérez-García, R. Reliability and Tolerance Comparison in Water Supply Networks. Water Resour. Manag. 2011, 25, 1437–1448. [Google Scholar] [CrossRef]
- Lindhe, A.; Rosen, L.; Norberg, T.; Bergstedt, O. Fault tree analysis for integrated and probabilistic risk analysis of drinking water systems. Water Res. 2009, 43, 1641–1653. [Google Scholar] [CrossRef]
- Szpak, D. Method for determining the probability of a lack of water supply to consumers. Energies 2020, 13, 5361. [Google Scholar] [CrossRef]
- Shuang, Q.; Liu, H.J.; Porse, E. Review of the Quantitative Resilience Methods in Water Distribution Networks. Water 2019, 11, 1189. [Google Scholar] [CrossRef]
- Hopkins, E.G.; Sowby, R.B. A Qualitative Definition of Reliable Water supply for Public Water Systems. Water 2024, 16, 3359. [Google Scholar] [CrossRef]
- Carneiro, J.; Loureiro, D.; Cabral, M.; Covas, D. Comprehensive Resilience Assessment Framework for Water Distribution Networks. Water 2024, 16, 2611. [Google Scholar] [CrossRef]
- Ren, K.; Huang, S.; Huang, Q.; Wang, H.; Leng, G.; Fang, W.; Li, P. Assessing the Reliability, Resilience and Vulnerability of Water Supply System Under Multiple Uncertain Sources. J. Clean. Prod. 2020, 252, 119806. [Google Scholar] [CrossRef]
- Migdał, K.; Operacz, A.; Vaskina, I.; Śliz, P.; Tavares, J.; Almeida, A.; Migdał, M. Assessment of the Reliability of the Operation of a Sewage Treatment Plant Using Monte Carlo Simulation. J. Water Land Dev. Special Issue 2022, 80–90. [Google Scholar] [CrossRef]
- Brito, R.S.; Almeida, M.; Do, C.; Ribeiro, A.S. Enhancing Hydraulic Data Reliability in Sewers. Water Pract. Technol. 2021, 17, 431–444. [Google Scholar] [CrossRef]
- Żywiec, J.; Szpak, D.; Wartalska, K.; Grzegorzek, K. The Impact of Climate Change on the Failure of Water Supply Infrastructure: A Bibliometric Analysis of the Current State of Knowledge. Water 2024, 16, 1043. [Google Scholar] [CrossRef]
- Tchórzewska-Cieślak, B.; Szpak, D.; Żywiec, J.; Rożnowski, M. The Concept of Estimating the risk of water losses in the water supply network. J. Environ. Manag. 2024, 359, 120965. [Google Scholar] [CrossRef] [PubMed]
- Xie, J.; Qu, S.; Xu, M. Mapping water scarcity risks in global supply chain networks. Intern. J. Logist. Res. Appl. 2024, 27, 2541–2555. [Google Scholar] [CrossRef]
- Cordão, M.J.; Rufino, I.A.A.; Alves, P.B.R.; Filho, M.N.M.B. Water shortage risk mapping: A GIS-MCDA approach for a medium-sized city in the Brazilian semi-arid region. Urban Water J. 2020, 17, 642–655. [Google Scholar] [CrossRef]
- Diao, K.; Sitzenfrei, R.; Rauch, W. The impacts of spatially variable demand patterns on water distribution system design and operation. Water 2019, 11, 567. [Google Scholar] [CrossRef]
- Chen, X.; Li, F.; Li, X.; Hu, Y.; Hu, P. Evaluating and Mapping Water Supply and Demand for Sustainable Urban Ecosystem Management in Shenzhen, China. J. Clean. Prod. 2020, 251, 119754. [Google Scholar] [CrossRef]
- Piegdoń, I. A New Concept of Crisis Water Management in Urban Areas Based on the Risk Maps of Lack of Water Supply in Response to European Law. Resources 2022, 11, 17. [Google Scholar] [CrossRef]
- ISO/IEC 31010:2009; Risk Management—Risk Assessment Techniques. ISO: Geneva, Switzerland; IEC: Geneva, Switzerland, 2009.
- Directive (EU) 2020/2184 of The European Parliament and of the Council of 16 December 2020 on the Quality of Water Intended for Human Consumption (European Union Directive). Available online: https://eur-lex.europa.eu/legal-content/EN/TXT/PDF/?uri=CELEX:32020L2184&from=EN (accessed on 15 July 2025).
- Polish Legal Act of 7 June 2001 on Collective Water Supply and Collective Sewage Disposal (Dz.U. z 2001 r. nr 72, poz. 747) with Subsequent Changes. Available online: https://isap.sejm.gov.pl/isap.nsf/DocDetails.xsp?id=WDU20010720747.pdf (accessed on 15 July 2025).


Disclaimer/Publisher’s Note: The statements, opinions and data contained in all publications are solely those of the individual author(s) and contributor(s) and not of MDPI and/or the editor(s). MDPI and/or the editor(s) disclaim responsibility for any injury to people or property resulting from any ideas, methods, instructions or products referred to in the content. |
© 2025 by the authors. Licensee MDPI, Basel, Switzerland. This article is an open access article distributed under the terms and conditions of the Creative Commons Attribution (CC BY) license (https://creativecommons.org/licenses/by/4.0/).