Article

Spatial Optimization of Bioenergy Production by Introducing a Cooperative Manure Management System in Bangladesh

1
Doctoral Program in Environmental Studies, Degree Programs in Life and Earth Sciences, Graduate School of Science and Technology, University of Tsukuba, Tsukuba 305-8577, Japan
2
Faculty of Life and Environmental Sciences, University of Tsukuba, Tsukuba 305-8577, Japan
*
Author to whom correspondence should be addressed.
Resources 2025, 14(7), 111; https://doi.org/10.3390/resources14070111
Submission received: 20 May 2025 / Revised: 7 July 2025 / Accepted: 8 July 2025 / Published: 10 July 2025

Abstract

This study anticipates cooperative manure management as a process for generating bioenergy from livestock manure, thereby reducing greenhouse gas (GHG) emissions in Bangladesh. Therefore, this study’s main objective was to identify clusters for cooperative society development and optimize suitable locations for biogas plant establishment within a cooperative system. Scenarios were explored based on manure types using cluster and network analyses of geographic information systems (GIS). The study observed 13 clusters, which have the potential to produce 6045 million m3 of biogas that can be converted to 9068.64 GWh of electricity yearly. Biogas plants additionally produced 5491.04 kilotons of biofertilizer by reducing GHG emissions estimated to be 10.16 million tons of CO2eq in 2024. This study also optimized 10, 6, and 8 optimum locations for biogas plants according to the scenarios. To implement the findings, this study recommended a coordinated action plan based on the circular economy, which helps to obtain both environmental and economic benefits for a cooperative society. These cooperatives can be implemented for renewable energy production from livestock manure at the community level for sustainable energy generation in Bangladesh.

1. Introduction

In Bangladesh, approximately 432.38 million farm animals produce substantial amounts of manure [1], which significantly impacts the environment due to poor manure management [2]. However, livestock manure cannot be managed effectively because of its scattered production across the country. There is a lack of collaboration among farmers, farm owners, government and non-government agencies, private companies, and volunteers to manage manure efficiently to achieve socio-economic benefits and reduce the environmental impacts of livestock manure.
Cooperative management is a system of managing any common business logically by its members to generate economic profits and social benefits [3]. It includes unique challenges while managing resources and business operations to achieve a set goal within the cooperative’s structure [4]. This study introduced cooperative manure management involving all stakeholders to improve economic and social conditions for the development of a modern agricultural society in the future. Livestock is reared in every village, even in each rural house in Bangladesh, where livestock manure is managed mostly in conventional ways, such as keeping it as storage (30–40%), burning dry manure (37–45%), direct application onto land (26%), sometimes directly discharging farm effluents toward water sources, etc. [2,5]. However, the village farmers are not only unaware of the environmental impacts of improper manure management but also lack knowledge regarding the economic benefits of manure. Burning manure causes environmental problems by increasing GHG emissions and the release of harmful substances such as methane, nitrous oxide, carbon dioxide, particulate matter, etc. [6,7], whereas random landfills require large amounts of land for treatment and generate social nuisance [8,9]. Direct application of manure onto land may cause leaching of nutrients into nearby water bodies and lead to eutrophication [10]. In a cooperative system, livestock farmers and farm owners can work together with private and public organizations to establish a manure management facility for a sustainable society.
Several policies, laws, and regulations in Bangladesh aim to protect the environment by encouraging the recovery of valuable resources from waste. The National Environment Policy, 2018, encourages introducing green technologies to improve the environment by properly using natural resources [11]. The Renewable Energy Policy seeks to make the energy sector secure and sustainable by utilizing natural resources and reducing carbon emissions [12]. Anaerobic digestion is considered an effective technique for converting waste into bioenergy and biogas digestate into organic fertilizer for enriching soil conditions [13,14,15]. Therefore, biogas plant location optimization is needed for bioenergy production within cooperative structures for sustainable livestock manure management in Bangladesh and bioenergy generation, which assures energy security in the future.
This study primarily focused on identifying cooperative societies and determining the optimal locations for cooperative livestock manure management in Bangladesh, highlighting how societies and communities access services through cooperatives. A cluster analysis was used to identify clusters or cooperative societies based on manure distribution intensity throughout the country. Suitable locations for establishing biogas plants for each cluster were then determined using location allocation tools available in GIS network analysis software. The study has implemented the circular economic concept for manure to establish a cooperative action plan involving all stakeholders of manure management.
From the review of scientific articles, much literature has focused on livestock and poultry manure management through statistical estimations and life cycle assessments in Bangladesh [6,16], biogas generation scenarios from animal waste using various technologies [17,18,19,20,21], bioenergy production at the community level [19], etc. However, a cooperative manure management study based on GIS cluster and network analysis will be a new observation for reducing environmental impacts and obtaining socio-economic benefits at the community level in Bangladesh. The speculative implementation action plan for cooperative manure management serves as a guide for developing strategies to promote renewable bioenergy production in Bangladesh. However, this research concept is very innovative, and it needs detailed investigation for the sustainability of the system in the future.

2. Materials and Methods

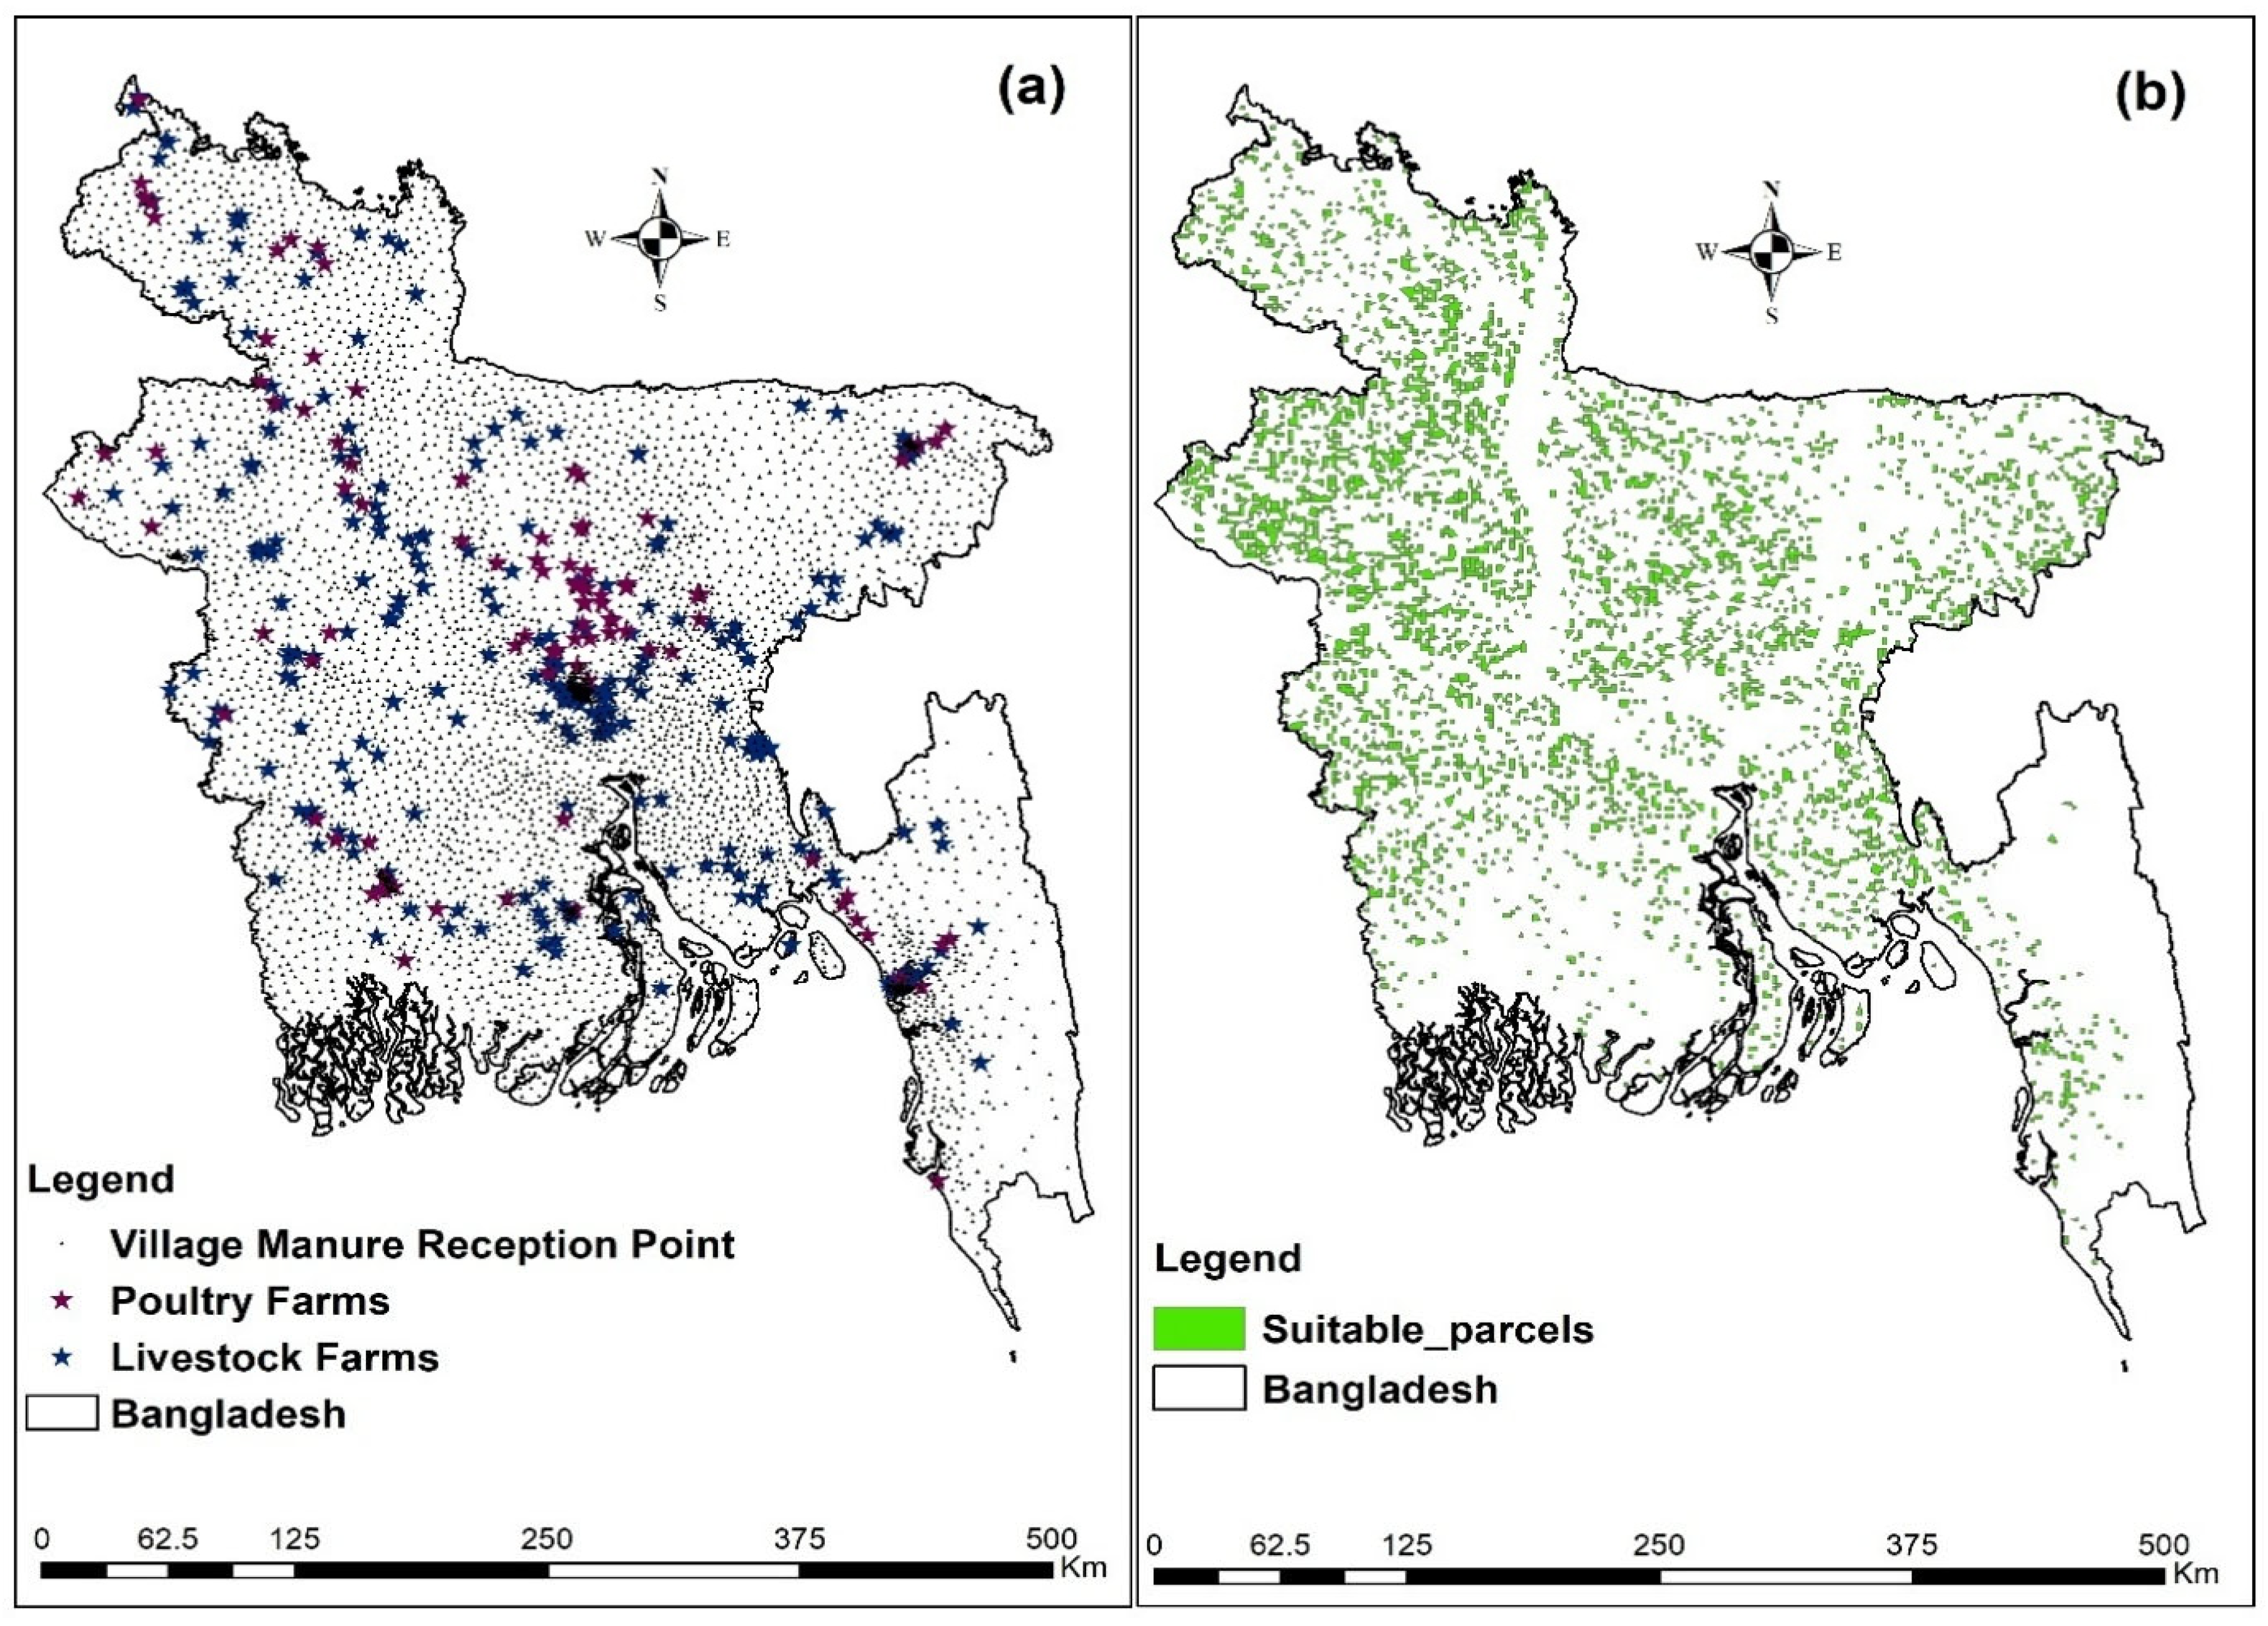
2.1. Data Management

The number of different livestock populations according to the types was collected from an inspection report conducted by DLS (Department of Livestock Services) in 2024 [1]. This survey data was converted to shapefile data using ArcGIS software, version 10.8, for spatial analysis. The locations of livestock and poultry farms were collected from Google Earth Pro (Version: 7.3.6) [22] and also made into shapefiles using the same software. The locations of village central points and administrative boundaries were collected from the BBS (Bangladesh Bureau of Statistics) [23] and ArcGIS Online [24], respectively. These spatial databases were used to interpret scenarios using cluster and network analysis in GIS software. Some data on manure generation, biogas, electricity potential, environmental benefits, and related topics were obtained through mathematical analysis, as discussed in specific sections. The methodological steps are shown in Figure 1.

2.2. Scenario Analysis

This study examined three scenarios (Scenario-1, Scenario-2, Scenario-3) for establishing cooperative manure management in Bangladesh (Table 1). The scenarios were designed considering the manure from various livestock groups, such as large-animal, small-animal, and poultry manure. The scenarios were analyzed in two steps: identifying different clusters or cooperatives using cluster analysis and optimizing suitable locations for cooperative manure management facilities using network analysis.

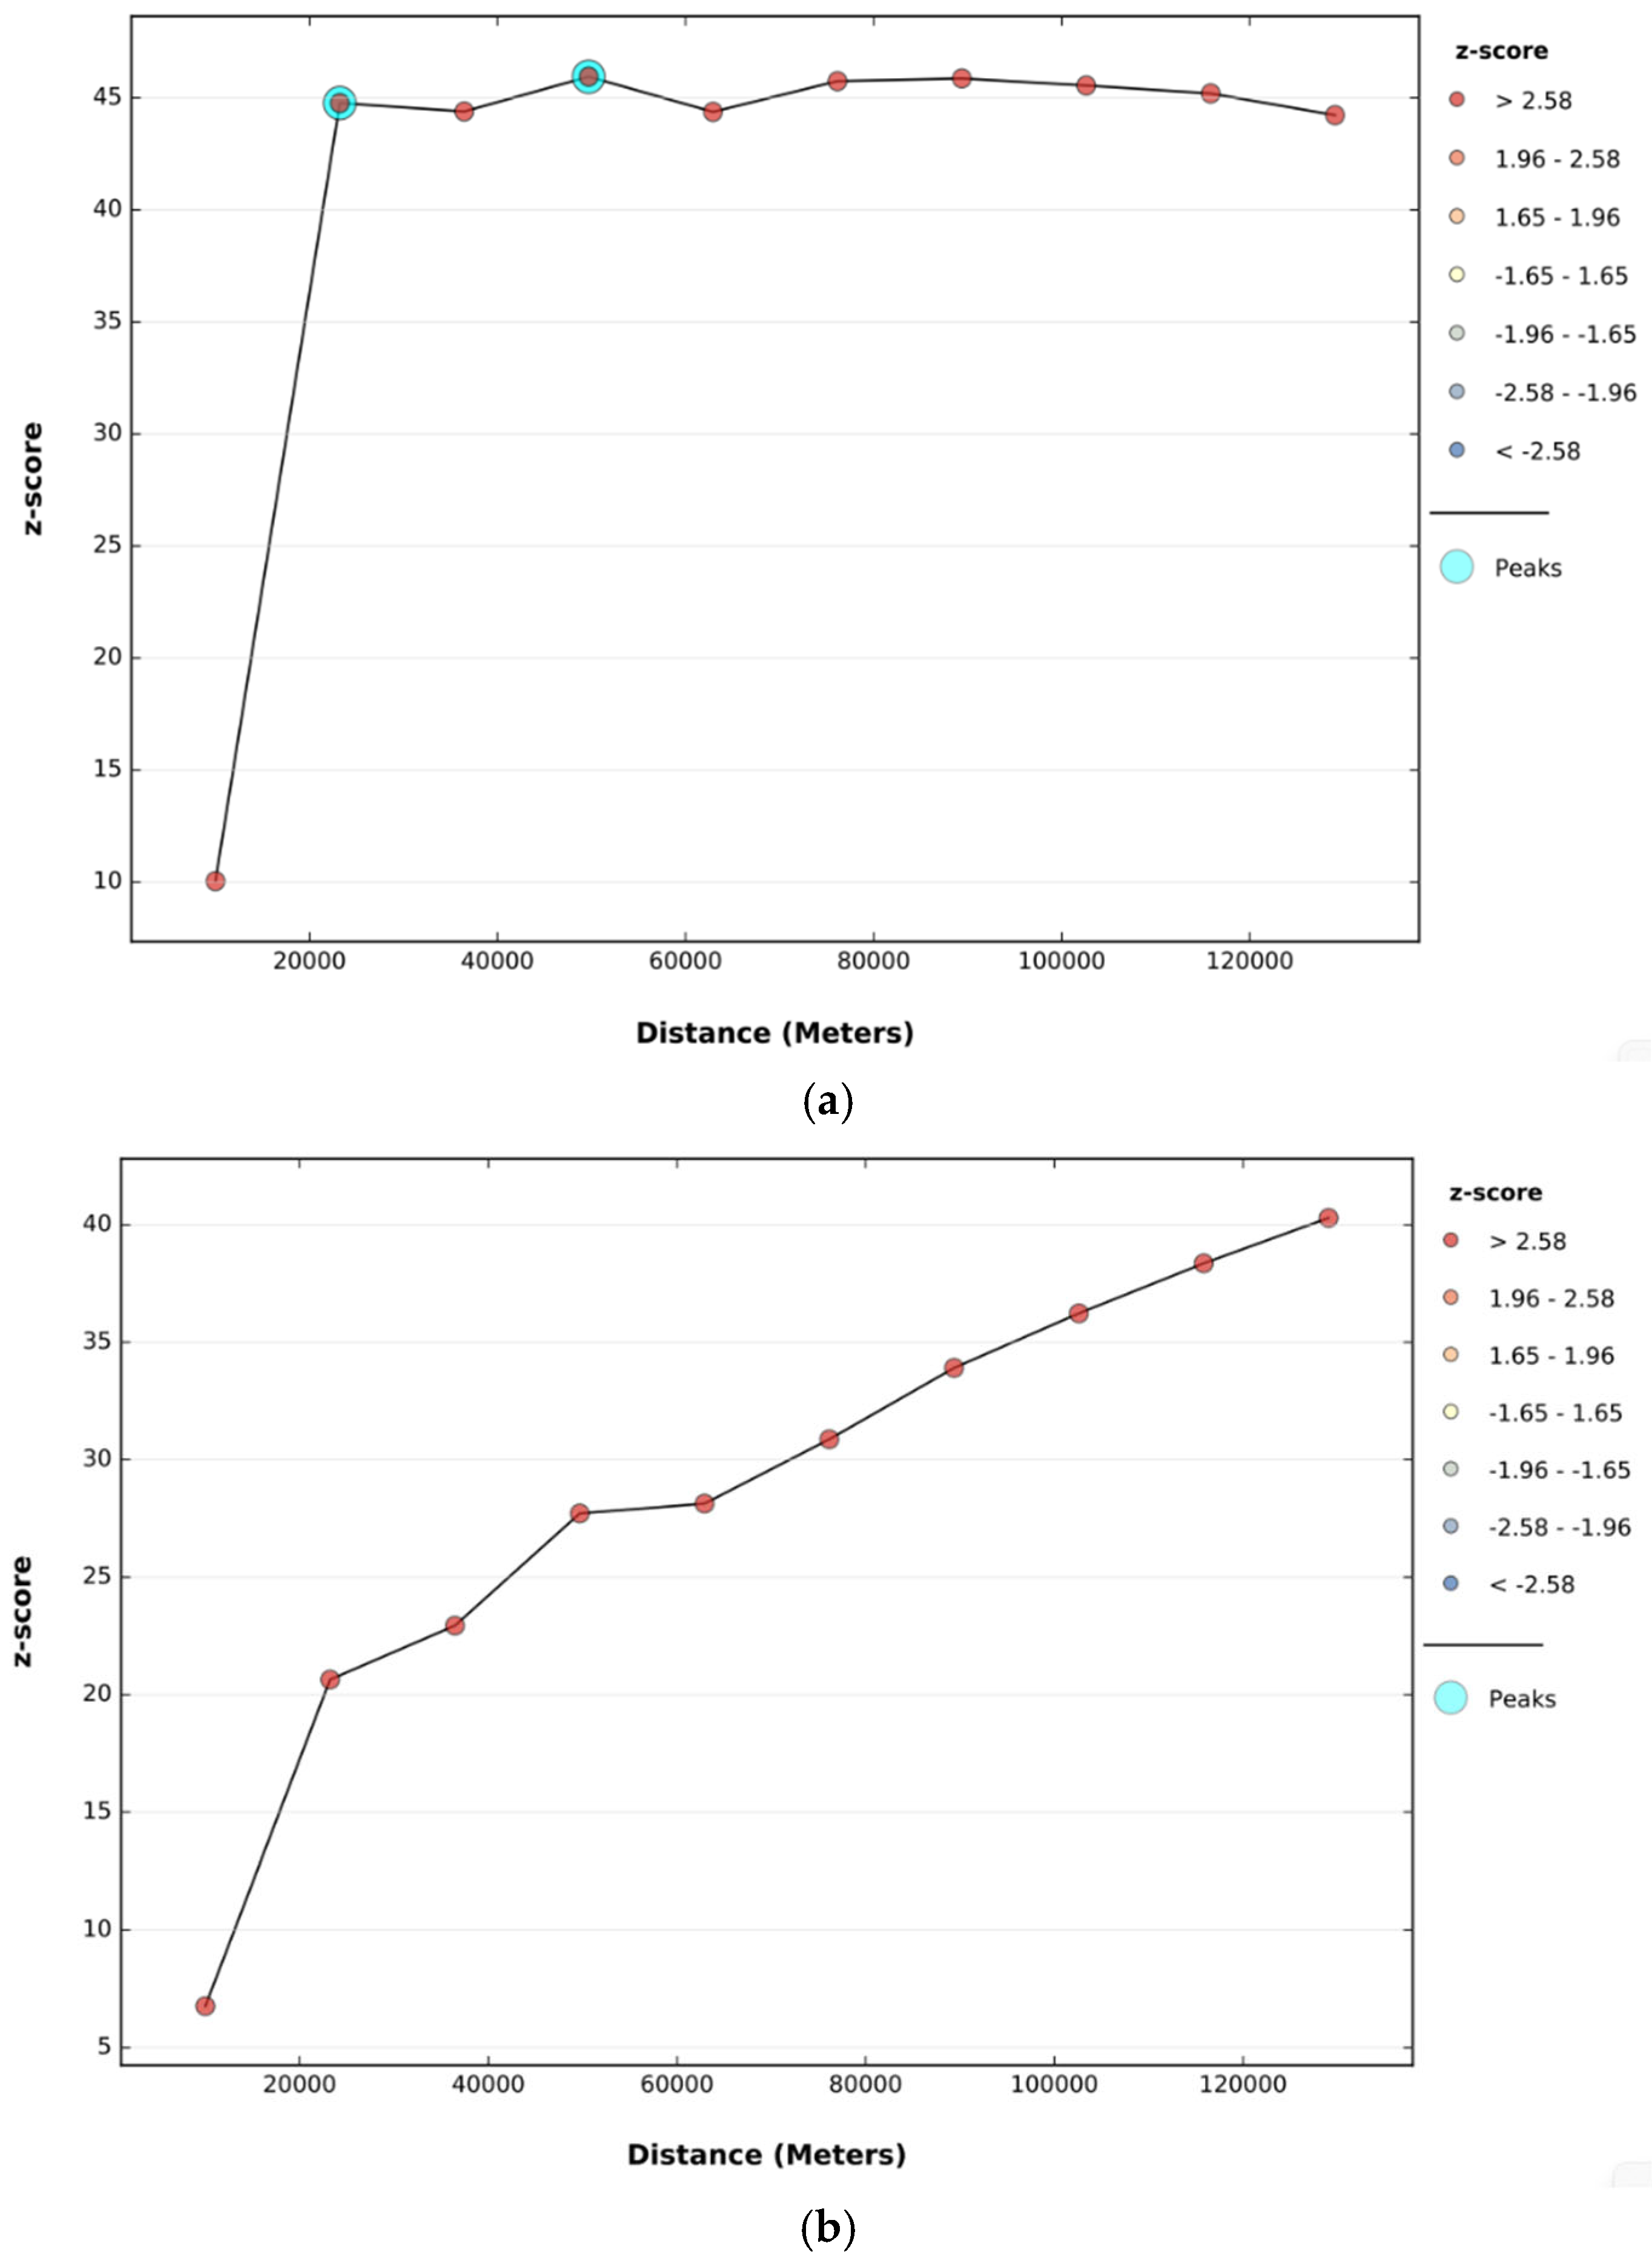
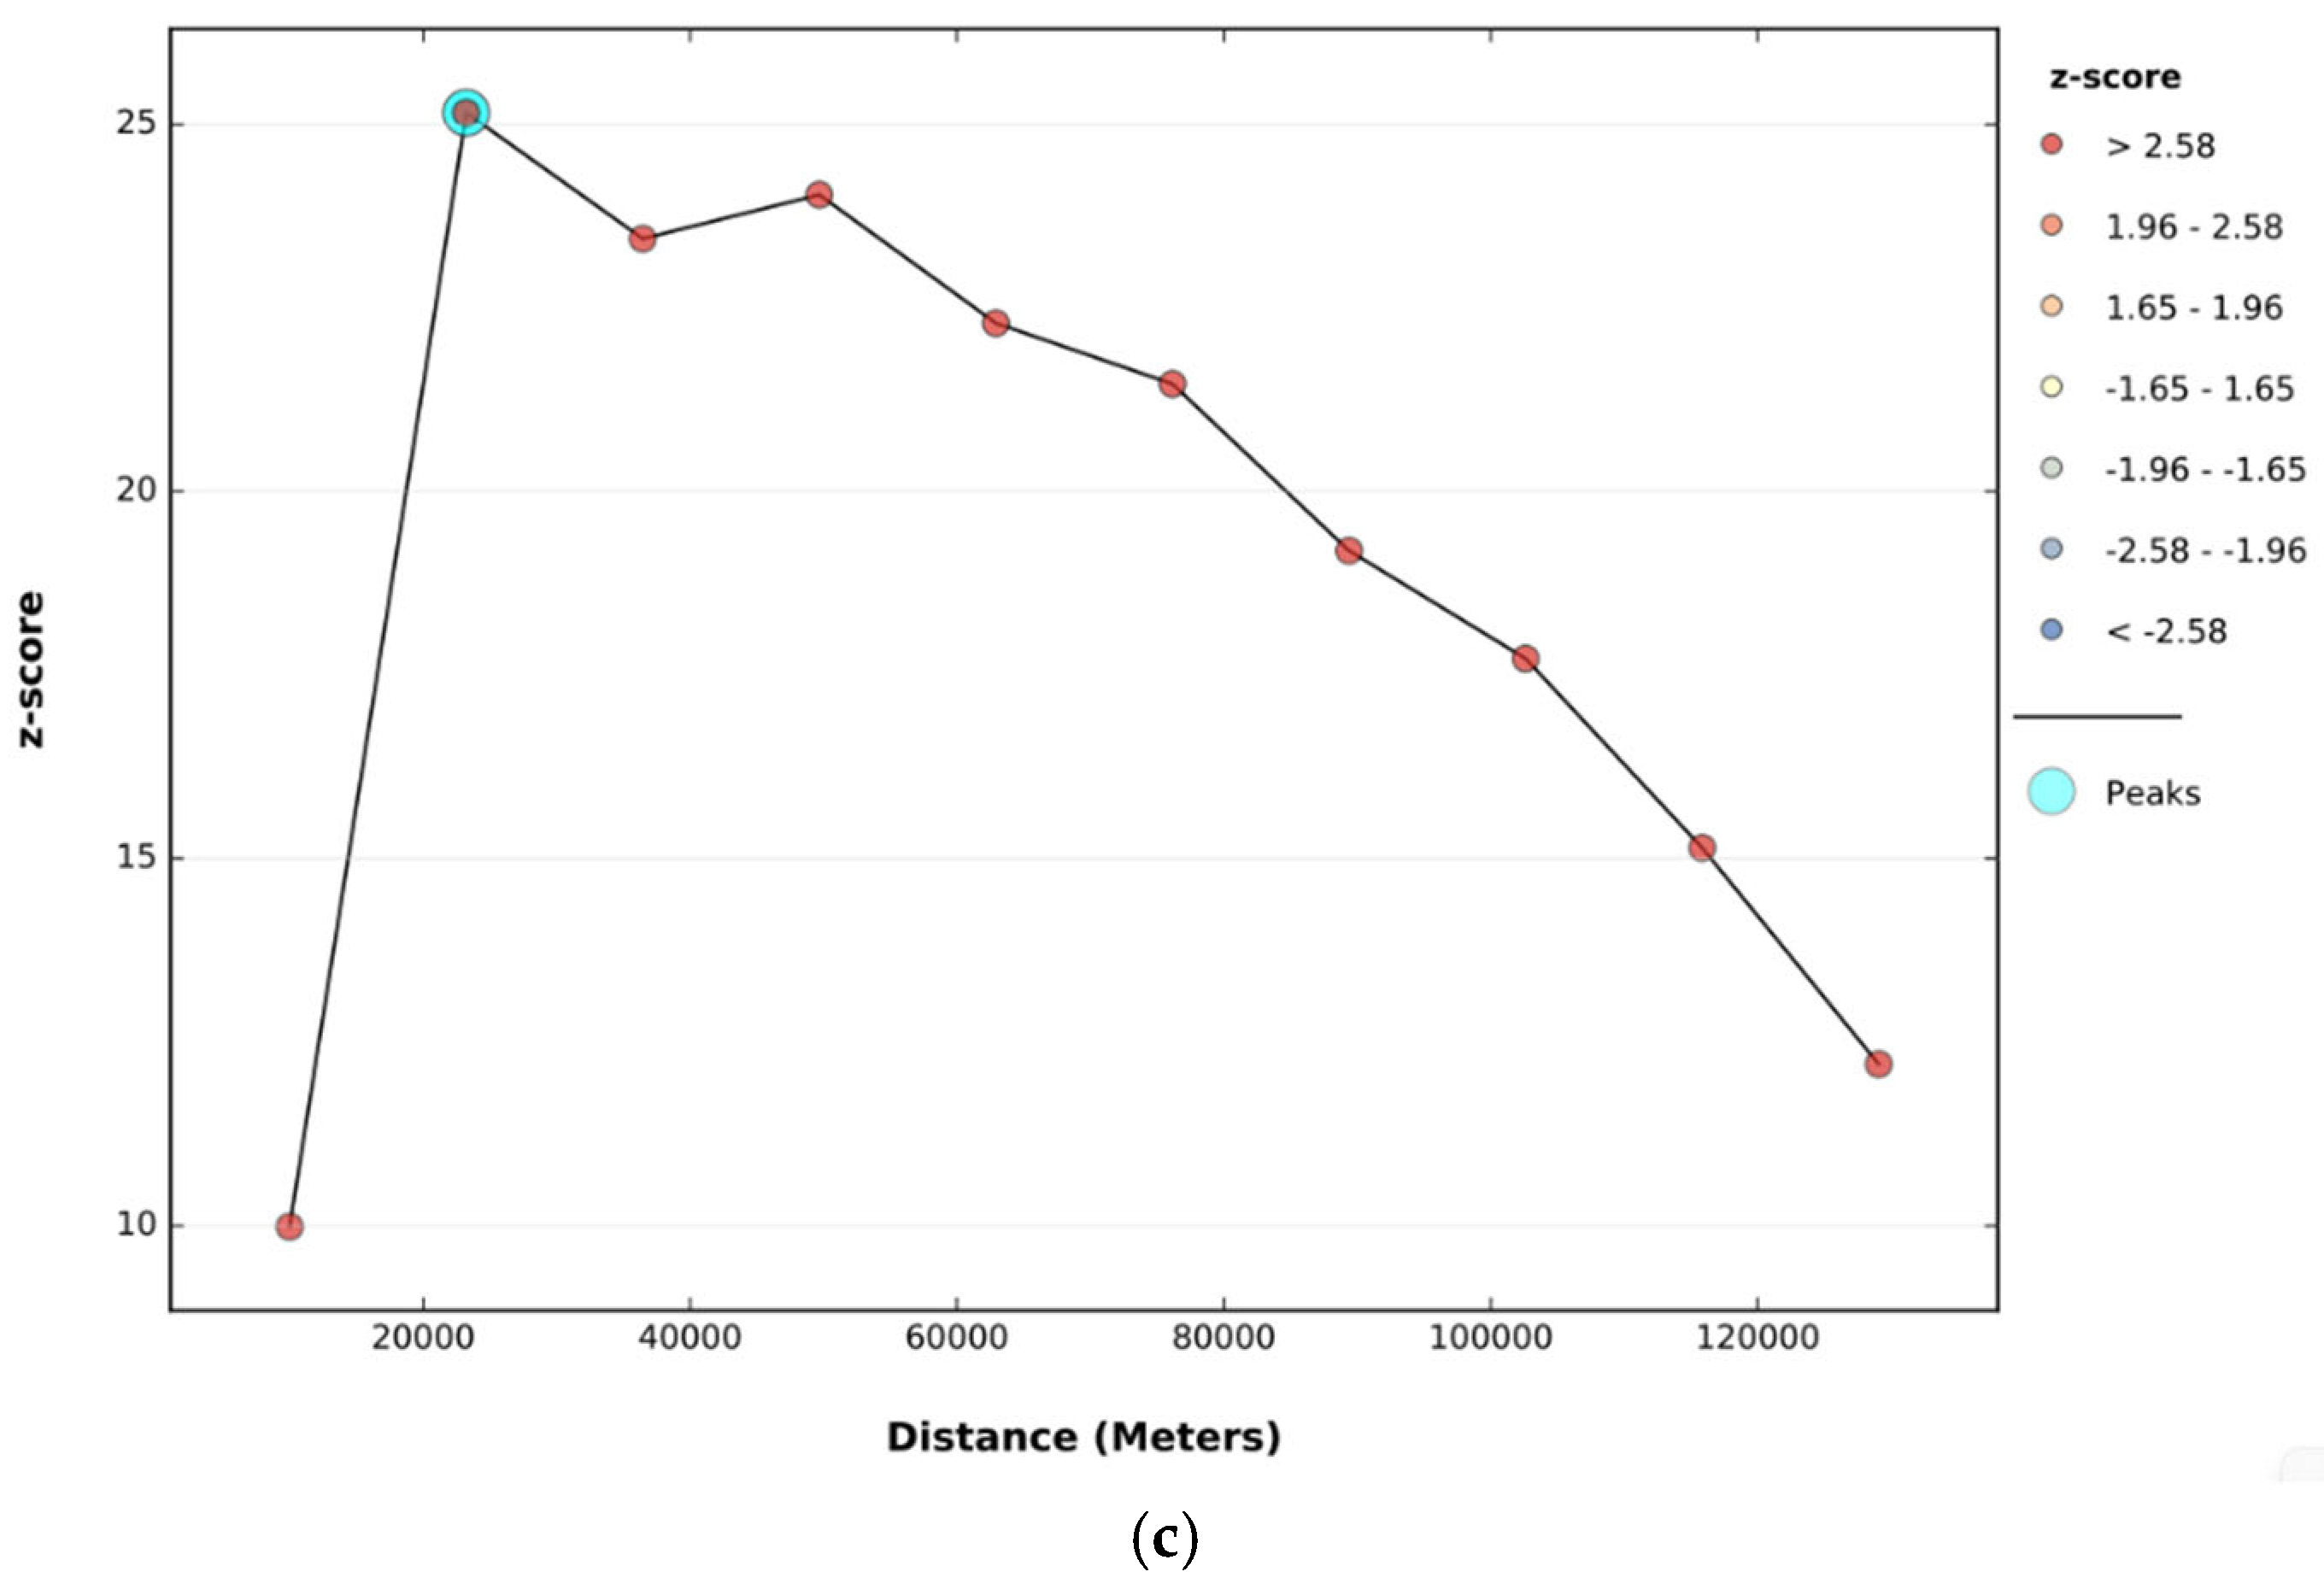
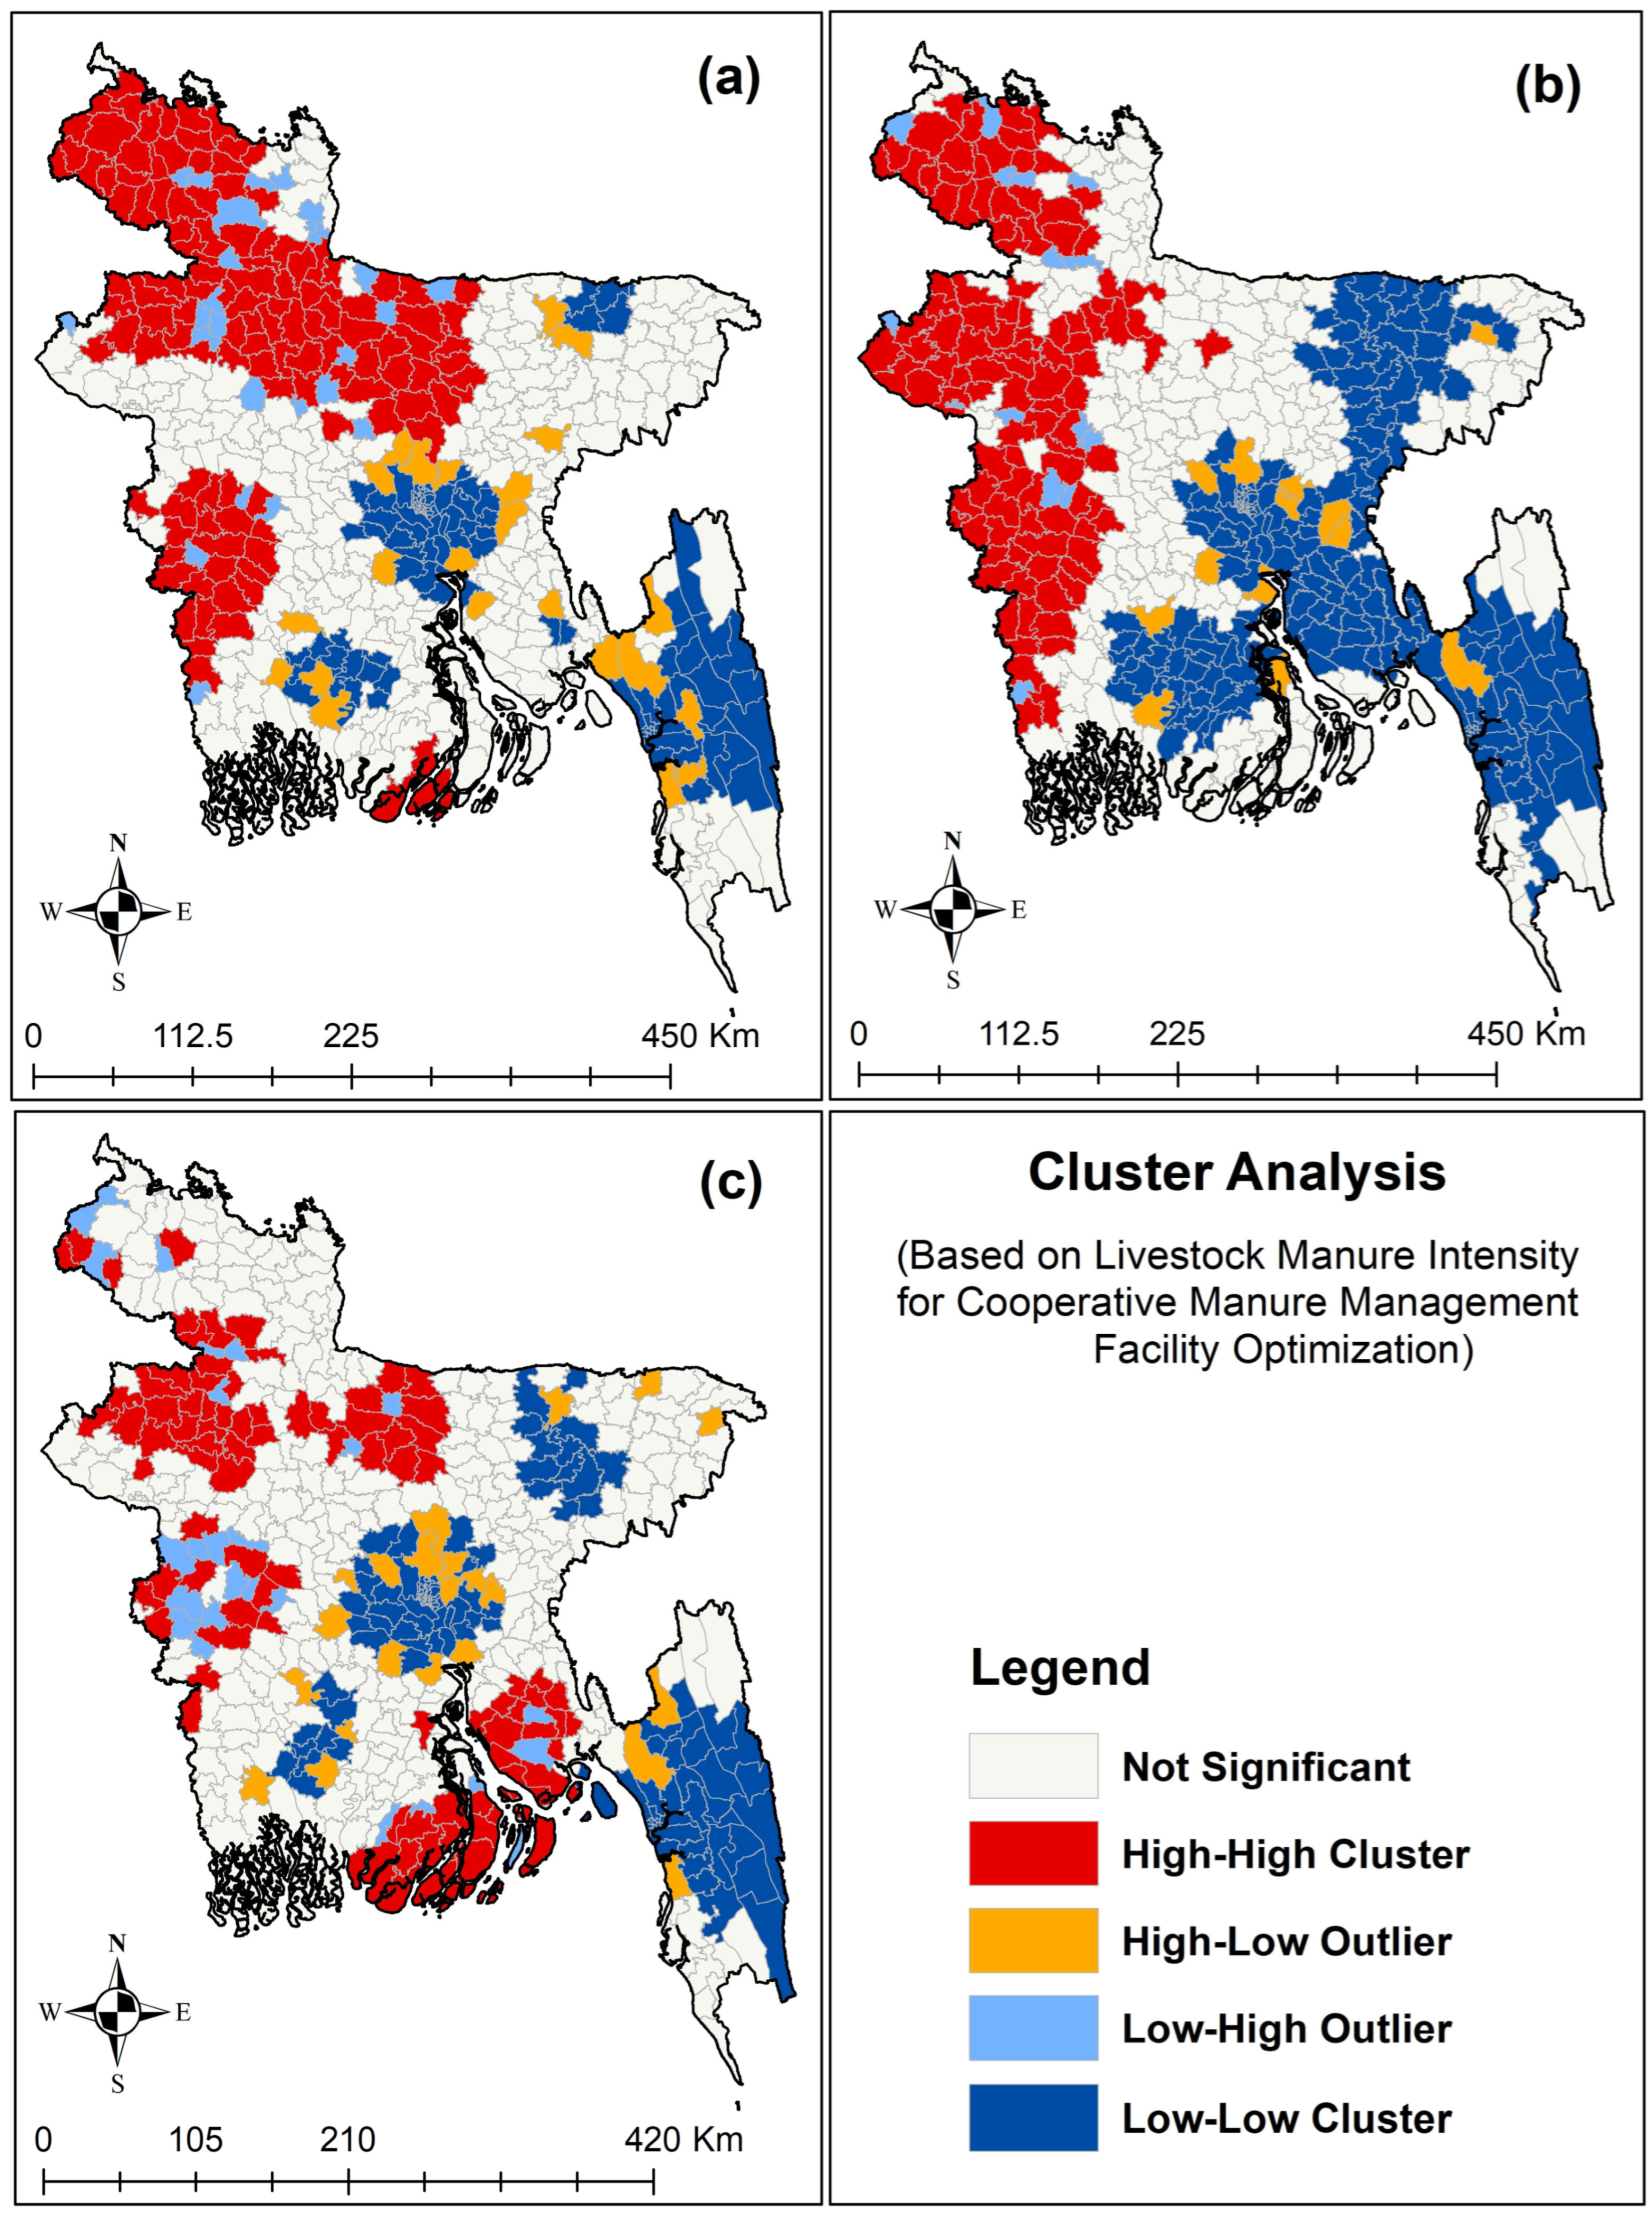
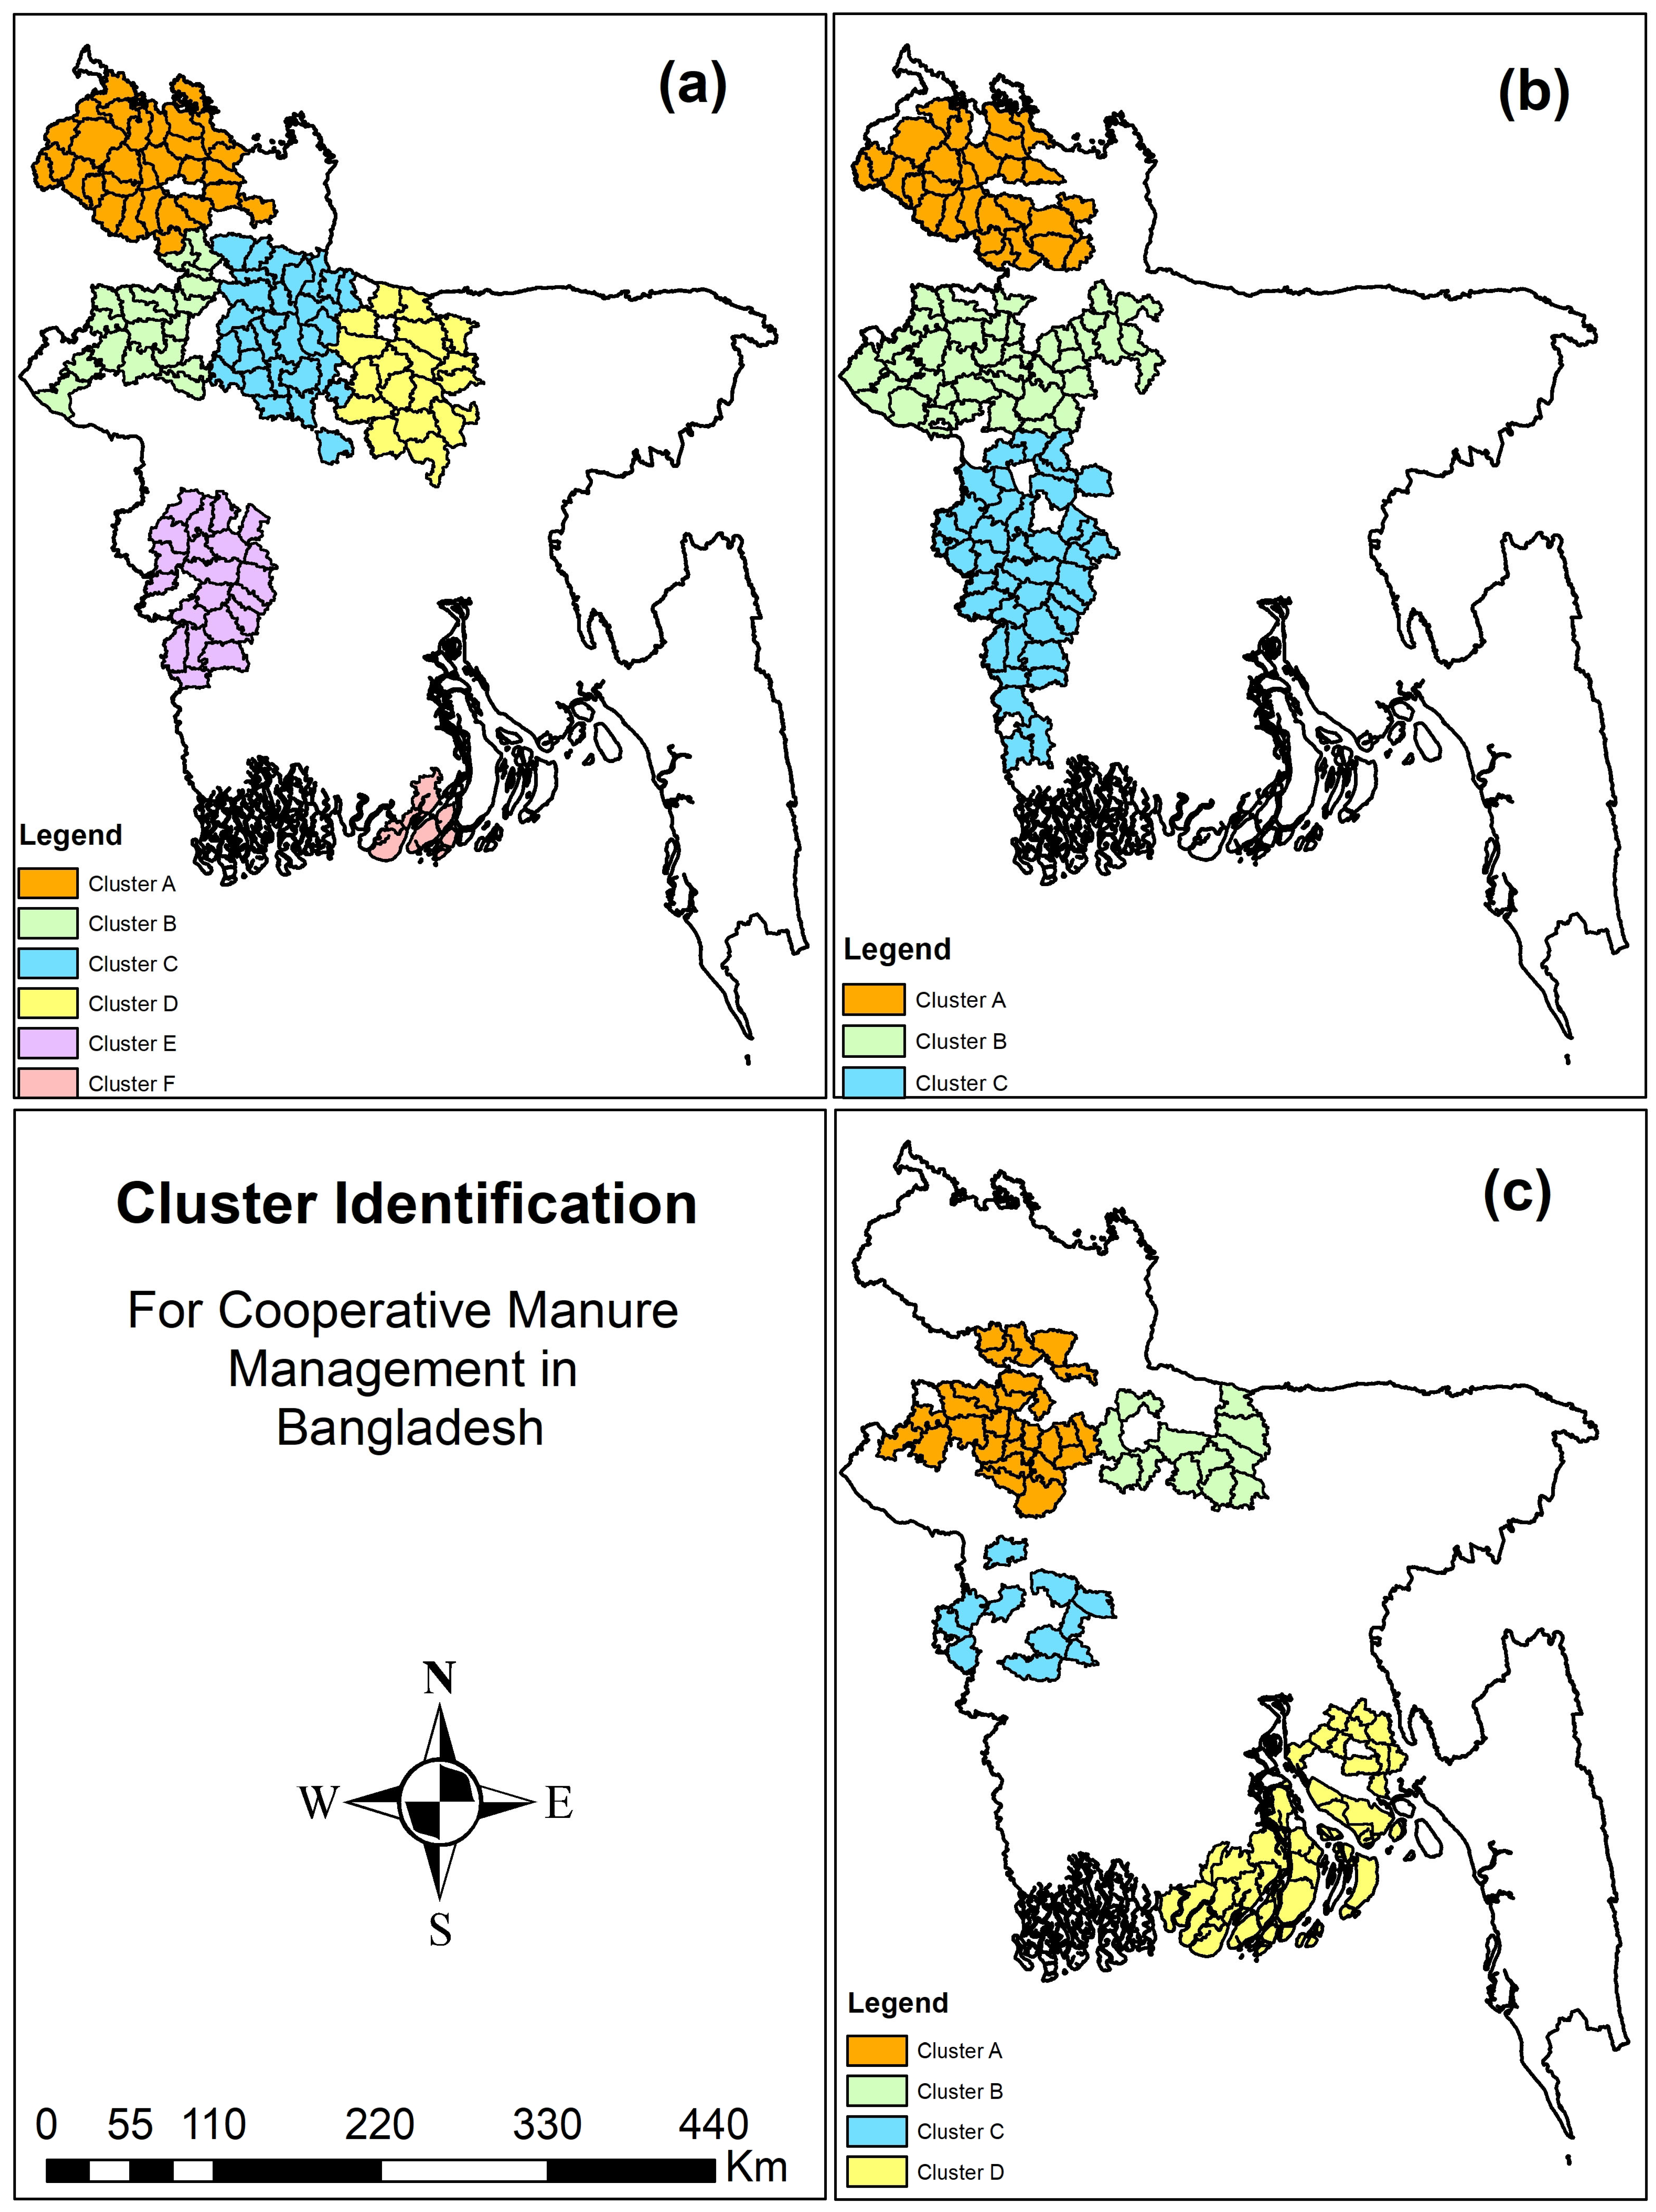
2.2.1. Cluster Analysis

Cluster analysis is a statistical method used to identify pattern groupings and can be performed using the spatial statistics tools and spatial autocorrelation functions available in ArcMap. These tools help determine whether the features form clusters, are dispersed, or are randomly distributed, based on a set of features and their associated attributes [25]. A positive Moran’s I value suggests a tendency toward clustering, while a negative value indicates dispersion. The z-score or p-value assesses the statistical significance of these patterns. The nearest neighbor index was calculated by measuring the average distance from each feature to its closest neighboring feature. A line graph was then created to display these distances and their corresponding z-scores for different distances in livestock manure distribution data. Peaks in z-scores highlight distances between sub-districts where clustering is the most significant, revealing the spatial processes at work [26]. Therefore, these peak distances were used in the mapping cluster and outlier analysis to identify statistically significant spatial outliers for a high density of manure intensity at a 95% confidence level. During cluster analysis, the distance band was 55,000 m, 50,000 m, and 25,000 m for large-animal, small-animal, and poultry manure intensity, respectively (Figure A1). The distance band determined the maximum distance at which any sub-district had at least one neighbor.
This application produced new output feature classes where HH and LL refer to statistically significant clusters of high values and low values, respectively. The HL class signifies outliers with high values that are encircled by low values, while the LH class indicates low-value outliers that are surrounded by high values. In this study, only the HH clusters were considered spatially significant manure intensity clusters of sub-districts, which acted primarily as cooperative societies in further scenario analysis.

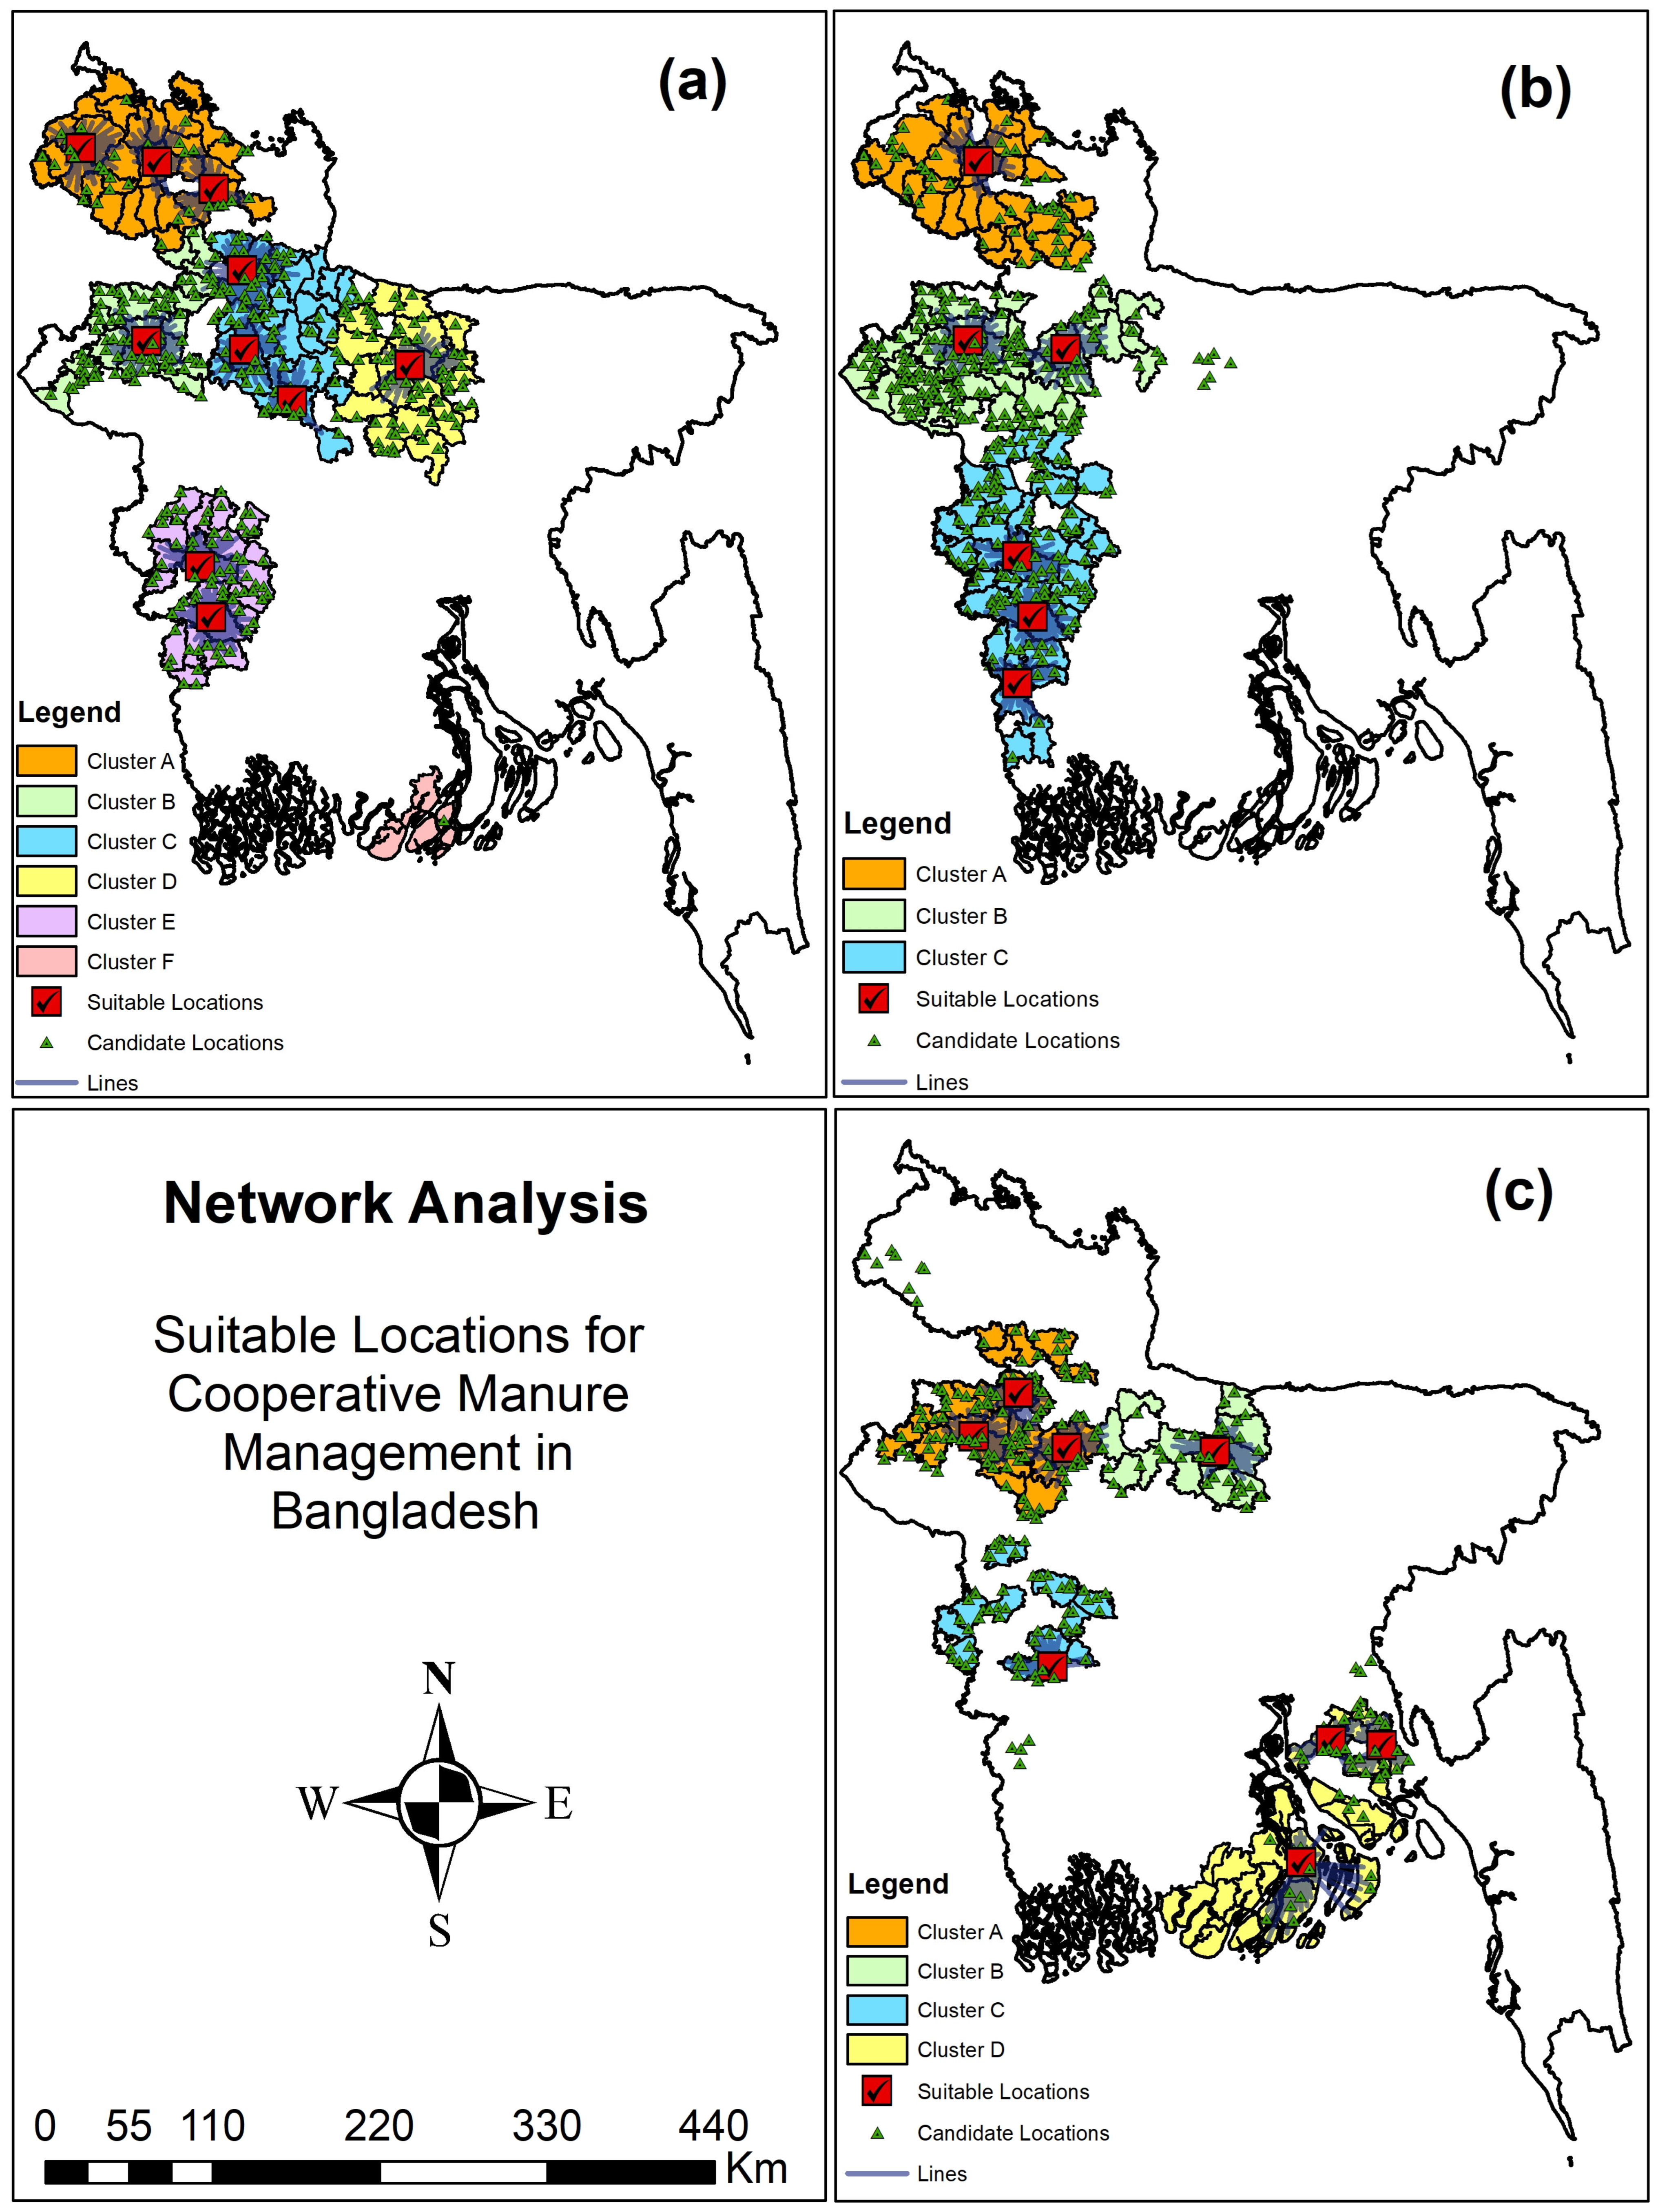
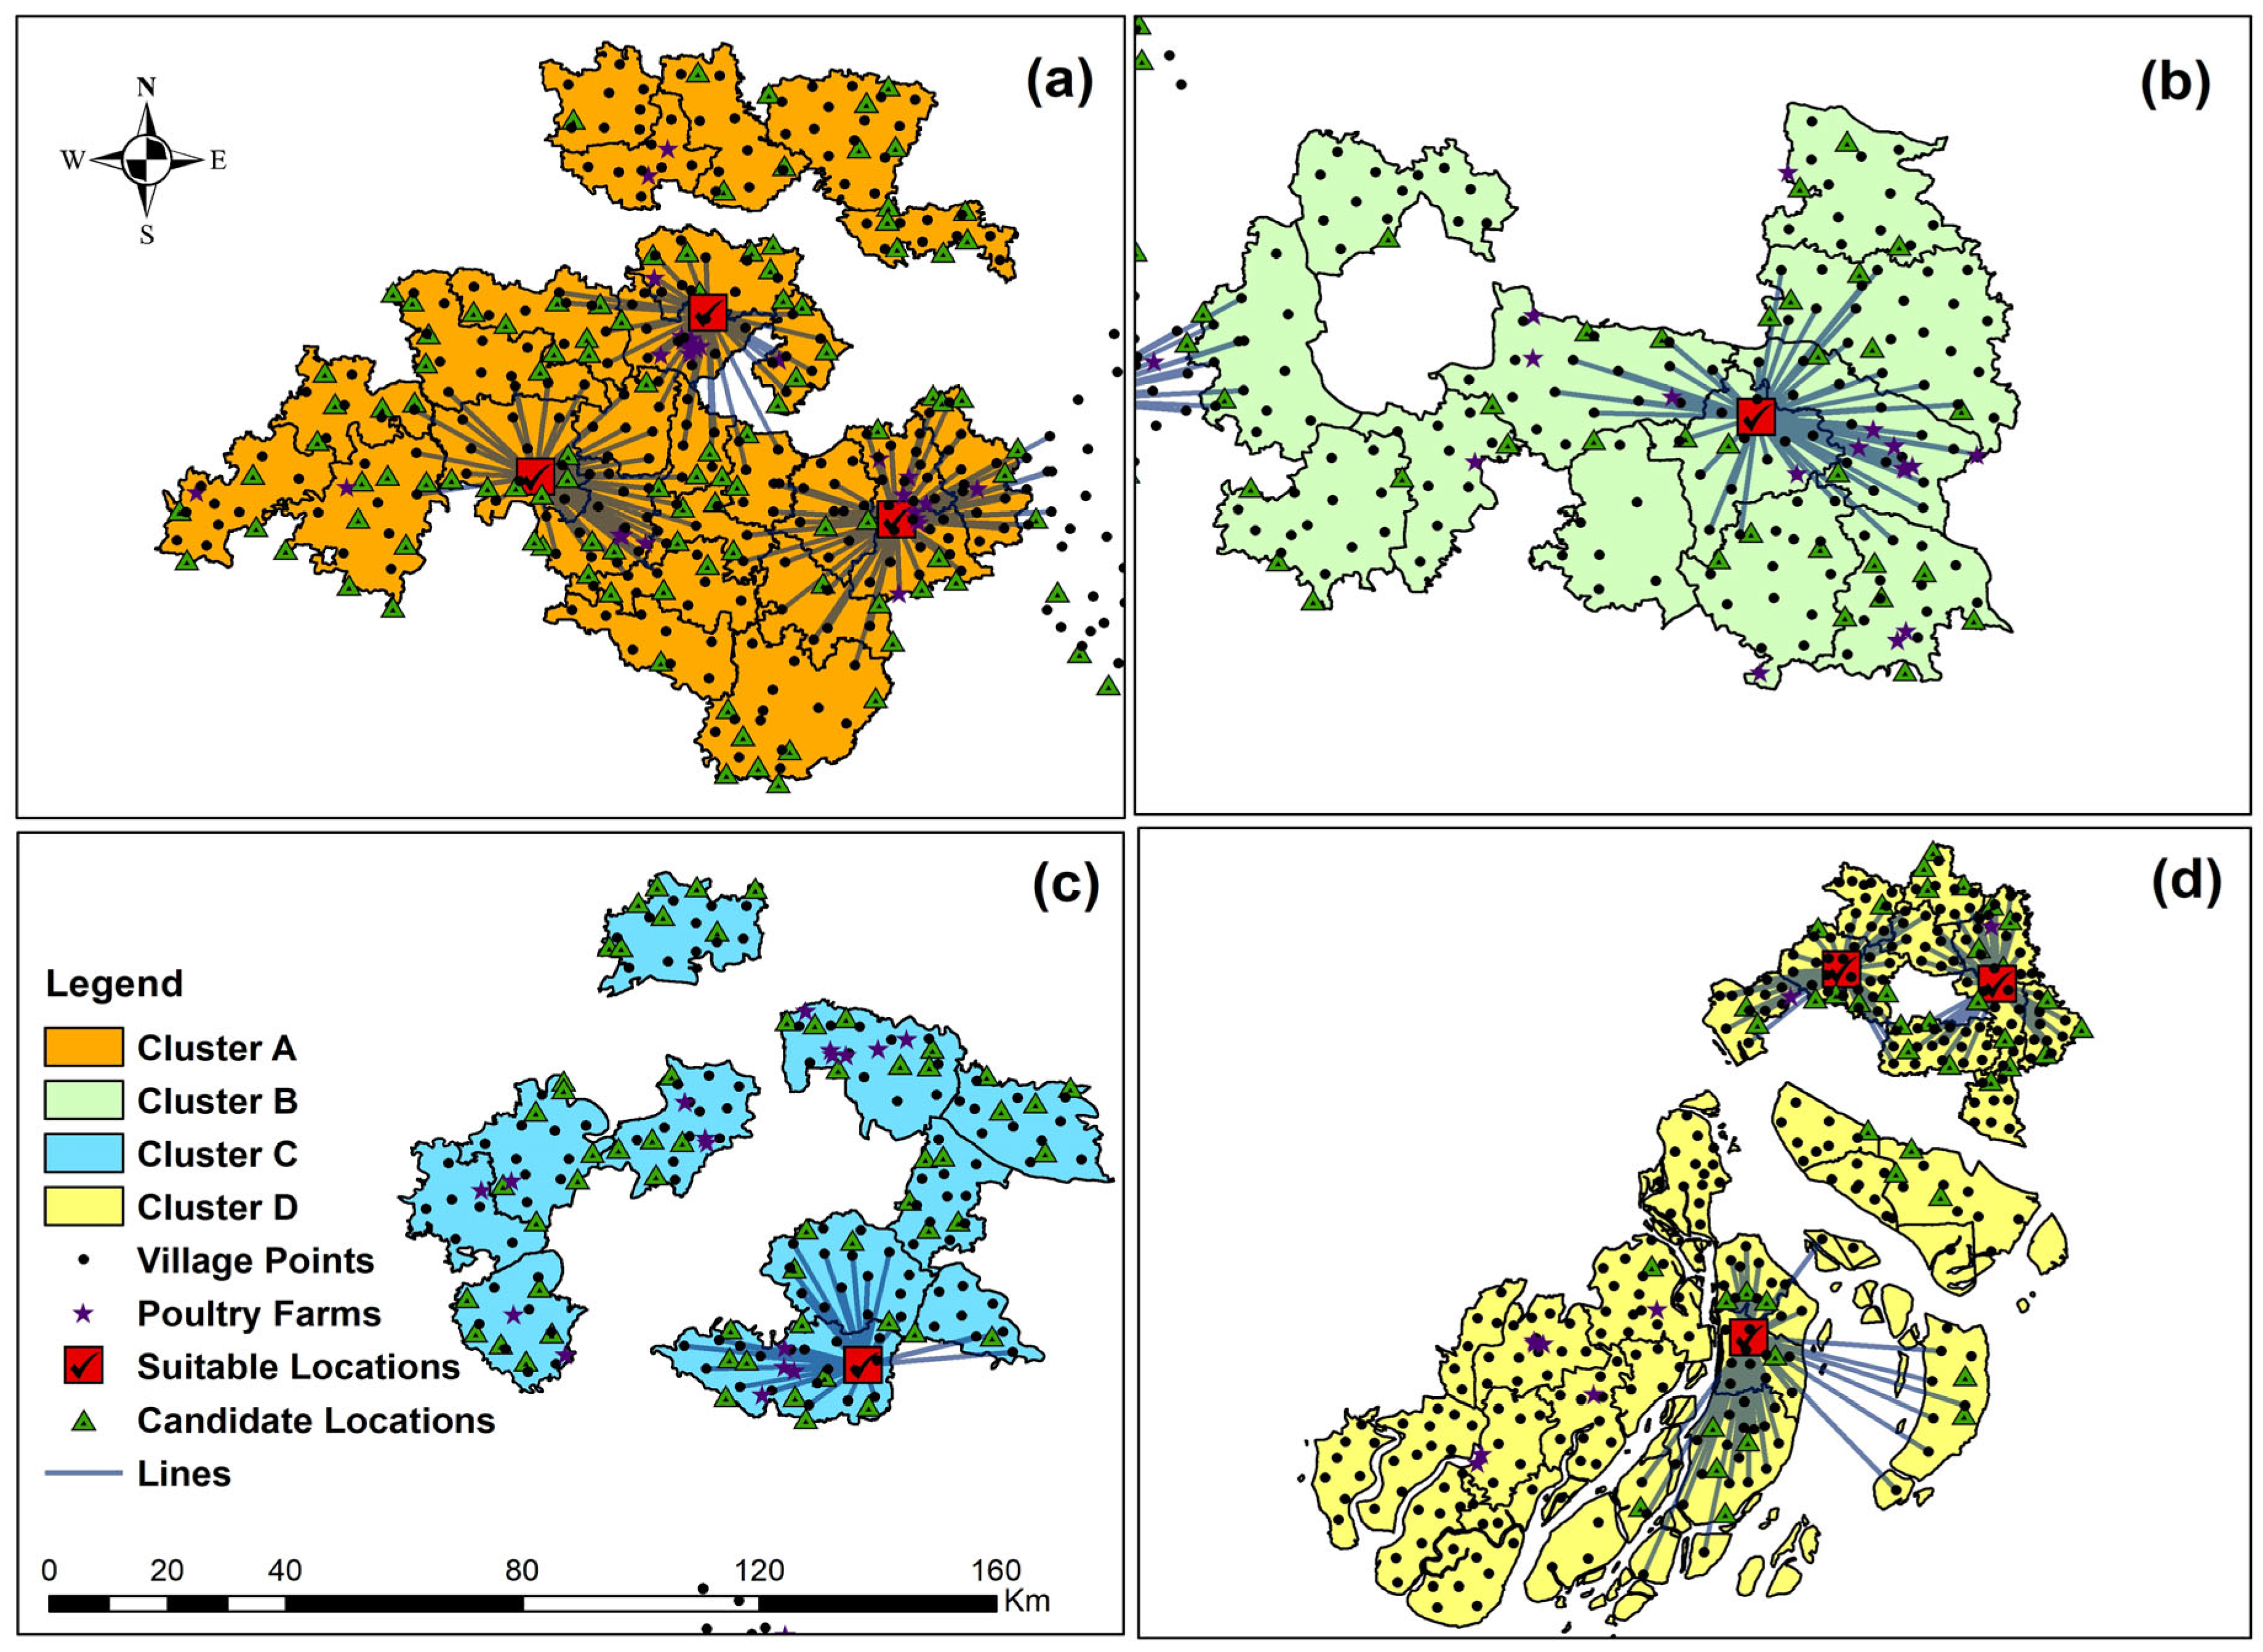
2.2.2. Network Analysis

Network analysis guides the selection of exact services among several criteria of demand locations, based on preset features and favored collaboration [27]. The location-allocation tool of network analysis was used to finalize the suitable locations for cooperative manure management facilities among many candidate locations. Therefore, suitable locations were optimized considering the manure availability from the village manure reception point and livestock and poultry farms as the demand points (Figure 2a) with maximum coverage within a precise road network distance (the travel distance was assumed to be less than 30 km). However, maintaining an optimal cost for manure transportation depends on many factors, such as travel distance, mode of transportation, fuel cost, labor and vehicle availability, places of travel, types of goods, etc. The travel distance of feedstock to waste treatment plants varies widely, ranging from 3 to over 145 km, depending on various factors [28]. This study considered a maximum travel distance of 30 km, which is feasible in the context of Bangladesh [29,30].
Therefore, the suitable parcels identified through land suitability analysis [20] were used as facility points for optimizing the locations of cooperative biogas plants (Figure 2b). Additionally, the demand for bioenergy or electricity in those areas is a critical issue, and there is a scarcity of electricity in rural areas of Bangladesh. The range of electricity coverage averages 20 to 95% in different sub-districts in Bangladesh [31]. This study considered the suitable parcels placed within those sub-districts that have less than 50% electricity coverage for further analysis.
However, the suitable parcels, livestock and poultry farms, and manure reception points located within the clusters were considered only during network analysis to minimize the risks associated with manpower, equipment, and cost for manure transportation. The present road network was transformed into a network dataset using the network analysis extension tools of the ArcMap (10.8) software.

2.3. Theoretical Assessments

2.3.1. Assessment of Livestock Manure Generation

The amount of manure generated from livestock species depends on many factors, including animal types, farming systems, diet composition, feeding methods, body size, climate conditions, etc. [32,33]. In Bangladesh, most livestock (>85% of total livestock) are reared at the household level and in small-scale farms (about 5 to 8 cattle or 100 to 200 poultry) in a semi-intensive way in rural areas [34,35,36]. It is estimated that large ruminants produce 10–22.5 kg/day, while small ruminants produce 1.6–2 kg/day, and poultry generates 0.08–0.1 kg/day of manure [20,36,37,38,39]. For manure yield generation, this study considered the types and body sizes of livestock. Hence, it measured cattle and buffalo as large animals, goats and sheep as small animals, and poultry accounts for both the chicken and duck populations. These six species of livestock are commonly reared throughout the country [40]. In the case of body weight of livestock, large animals are about 170–250 kg/head and small animals are 15–25 kg/head, whereas the body weight of poultry is only 1.2–1.5 kg/head [5,41], which is comparatively lower than the average animal body weight in other countries due to the indigenous breeds of Bangladesh. Based on the body size, the average manure generation has been assessed as 9%, 4%, and 3% for large animals, small animals, and poultry, respectively [37,39,42].
However, not all produced manure can be collected due to its wide dispersion in the pastureland. Thus, collection efficiency is an important issue, which is assumed to be 50% for large ruminants, 13% for small ruminants, and about 80–99% for poultry manure [37,39,43,44]. The collection efficiency for small animal manure is relatively low, as sheep and goats are mostly reared in an extensive system, while the collection of poultry manure is high due to the increase in intensive commercial poultry farms recently. All the values of various factors used for manure generation are shown in Table 2, and a detailed calculation is given in Table A1. The available manure was estimated by considering the number and types of livestock in each sub-district by using Equation (1). Livestock and poultry manure intensity was assessed by dividing the accessible manure by the total area of that sub-district.
ALi = N × YL × CL
where ALi is the total available manure from livestock, i is the different types of livestock, N is the number of livestock in each sub-district, YL is the manure generation rate, and CL is the collection efficiency.

2.3.2. Biogas Generation

Among many issues (such as livestock species and types, body size, body weight, etc.), total solids (TS) content in manure is a significant factor that influences the total biogas generation from livestock manure [44]. The TS content in manure is widely varied, specifically 25–30% for large livestock, 18–25% for small livestock, and 10–29% for poultry [43,44]. Therefore, biogas yield also differed based on TS content in different livestock, and it is found that the biogas yield from large animals is 0.6–0.8 m3 kg−1 TS, while 0.3–0.4 m3 kg−1 TS biogas is generated from small animals, and poultry produces about 0.3–0.8 m3 kg−1 TS in manure [37,39,43,44,45]. The average values for TS content and biogas yield from different animals are used in Equation (2) to calculate biogas in this study [7,36,42].
Biogas potential (m3/year) = Total manure (kg/year) × TS in manure
× Collection efficiency × Biogas yield (m3/kg TS)

2.3.3. Electricity Generation from Biogas

Electricity generation from livestock manure-based biogas was estimated using Equation (3) [42].
Electricity generation from biogas = Quantity of biogas produced × Energy content in biogas × η
Here, η denotes the competence of electricity generation from biogas. However, different power plant generators influence this competence value. Large plant generators can convert about 35% to 42% of biogas to electricity, and small generators have a 25% electricity conversion efficiency from biogas [42,46]. This study presumed a 30% efficiency of the biogas plants. The energy content in biogas was calculated as 6 kWh m−3 (based on a 21.8 MJ/m3 biogas calorific value and 1 kWh = 3.6 MJ) [42,47].

2.3.4. Biofertilizer Production from Biogas

During biogas production from animal manure, the digestate produced from the biogas plant can be used as a biofertilizer for agricultural crop production [48,49,50].
Biofertilizer potential = (DM − VS) + 40% of vs.
Here, DM indicates the dry mass in manure, while VS represents volatile solids in DM. The values used in this study for DM and VS are percentages for biogas generation [51,52].

2.3.5. GHG Emissions Reduction Potential of Biogas After Replacing Natural Gas

The GHG emissions reduction potential in biogas was measured considering the effects of electricity production from fossil fuels (natural gas). Equation (4) [53,54] was used to estimate the CO2eq emissions reduction potential by replacing natural gas with biogas.
Avoided CO2eq emission = Quantity of natural gas equivalent to CH4
in liter × SEF
Here, SEF denotes the specific emission factor (2.75 kg CO2/liter of natural gas) [53]. CH4 is the main substance in natural gas, accounting for about 90% [55,56]. The natural gas corresponding to the CH4 content in one liter is 1.11 L. Thus, the quantity of natural gas equivalent to CH4 in liters = total amount of CH4 in biogas × equivalent factor (1.11). The study considered the CH4 value to be 60%, 45%, and 60% of biogas for large-animal, small-animal, and poultry manure, respectively [57,58].

3. Results

3.1. Cluster and Outlier Analysis for Livestock Manure Intensity

A cluster analysis was performed to identify the cooperative societies based on the distribution of available manure intensity in separate livestock groups. The spatial distribution of manure was classified into five groups (very high to very low) using GIS symbology analysis (Figure 3). Some sub-districts (blue-colored) have less livestock manure generation, whereas a few sub-districts (red-colored) have a very high concentration of available livestock manure generation. Very high manure generation groups range from 808.21 to 2104.69 tons/day for large animal manure (Figure 3a), 10.80 to 147.24 tons/day for small animal manure (Figure 3b), and 44.61 to 464.36 tons/day for poultry manure (Figure 3c). Overall, the northern part of the study area has higher manure intensity from large animals, while manure intensity from small animals shows a greater concentration in the western part of the country. The Mymensingh, Dhaka, and Barisal divisions have higher poultry manure intensity compared to other parts of the country. After that, cluster analysis of each livestock group was performed. The cluster analysis maps were justified with the symbology of livestock manure intensity, which had similar results to the symbology maps.
The cluster analysis maps for all scenarios are shown in Figure 4, where red, orange, light blue, and dark blue colored areas indicate the HH, HL, LH, and LL clusters, respectively. From this map, it was found that only the HH cluster is significant for manure generation. After cluster analysis, about 119, 107, and 79 sub-districts were revealed as potential sub-districts that exhibited strong spatial correlation from the total sub-districts of scenarios for large animal, small animal, and poultry manure, respectively. Ultimately, the nearby upazilas (administrative sub-districts) were organized into six, three, and four clusters or cooperative societies for Scenario-1, Scenario-2, and Scenario-3, considering a 1 km buffer zone. The specific clusters or cooperative societies were marked by different colors and alphabetical numbers in Figure 5.
Following cluster analysis, this study estimated that 43,785 kilotons/year of available manure is produced from all clusters, which has a potential of about 6045 million m3 of biogas and 5491.04 kilotons of biofertilizer in a year. Biogas can produce 9068 GWh/year of electricity or bioenergy generation for rural and city areas within cooperative societies. The detailed biogas and electricity potential according to the clusters based on large-animal, small-animal, and poultry manure in different scenarios are shown in Table 3.
The GHG emissions reduction potential was compared among different clusters for biogas production, illustrated in Figure 6. Scenario-1 had significant GHG emissions reduction potential (87% of the total GHG emissions reduction potential) compared to the other two scenarios. The total GHG emissions reduction potential was estimated to be 9223.56 million kg CO2eq annually by replacing natural gas for power generation.

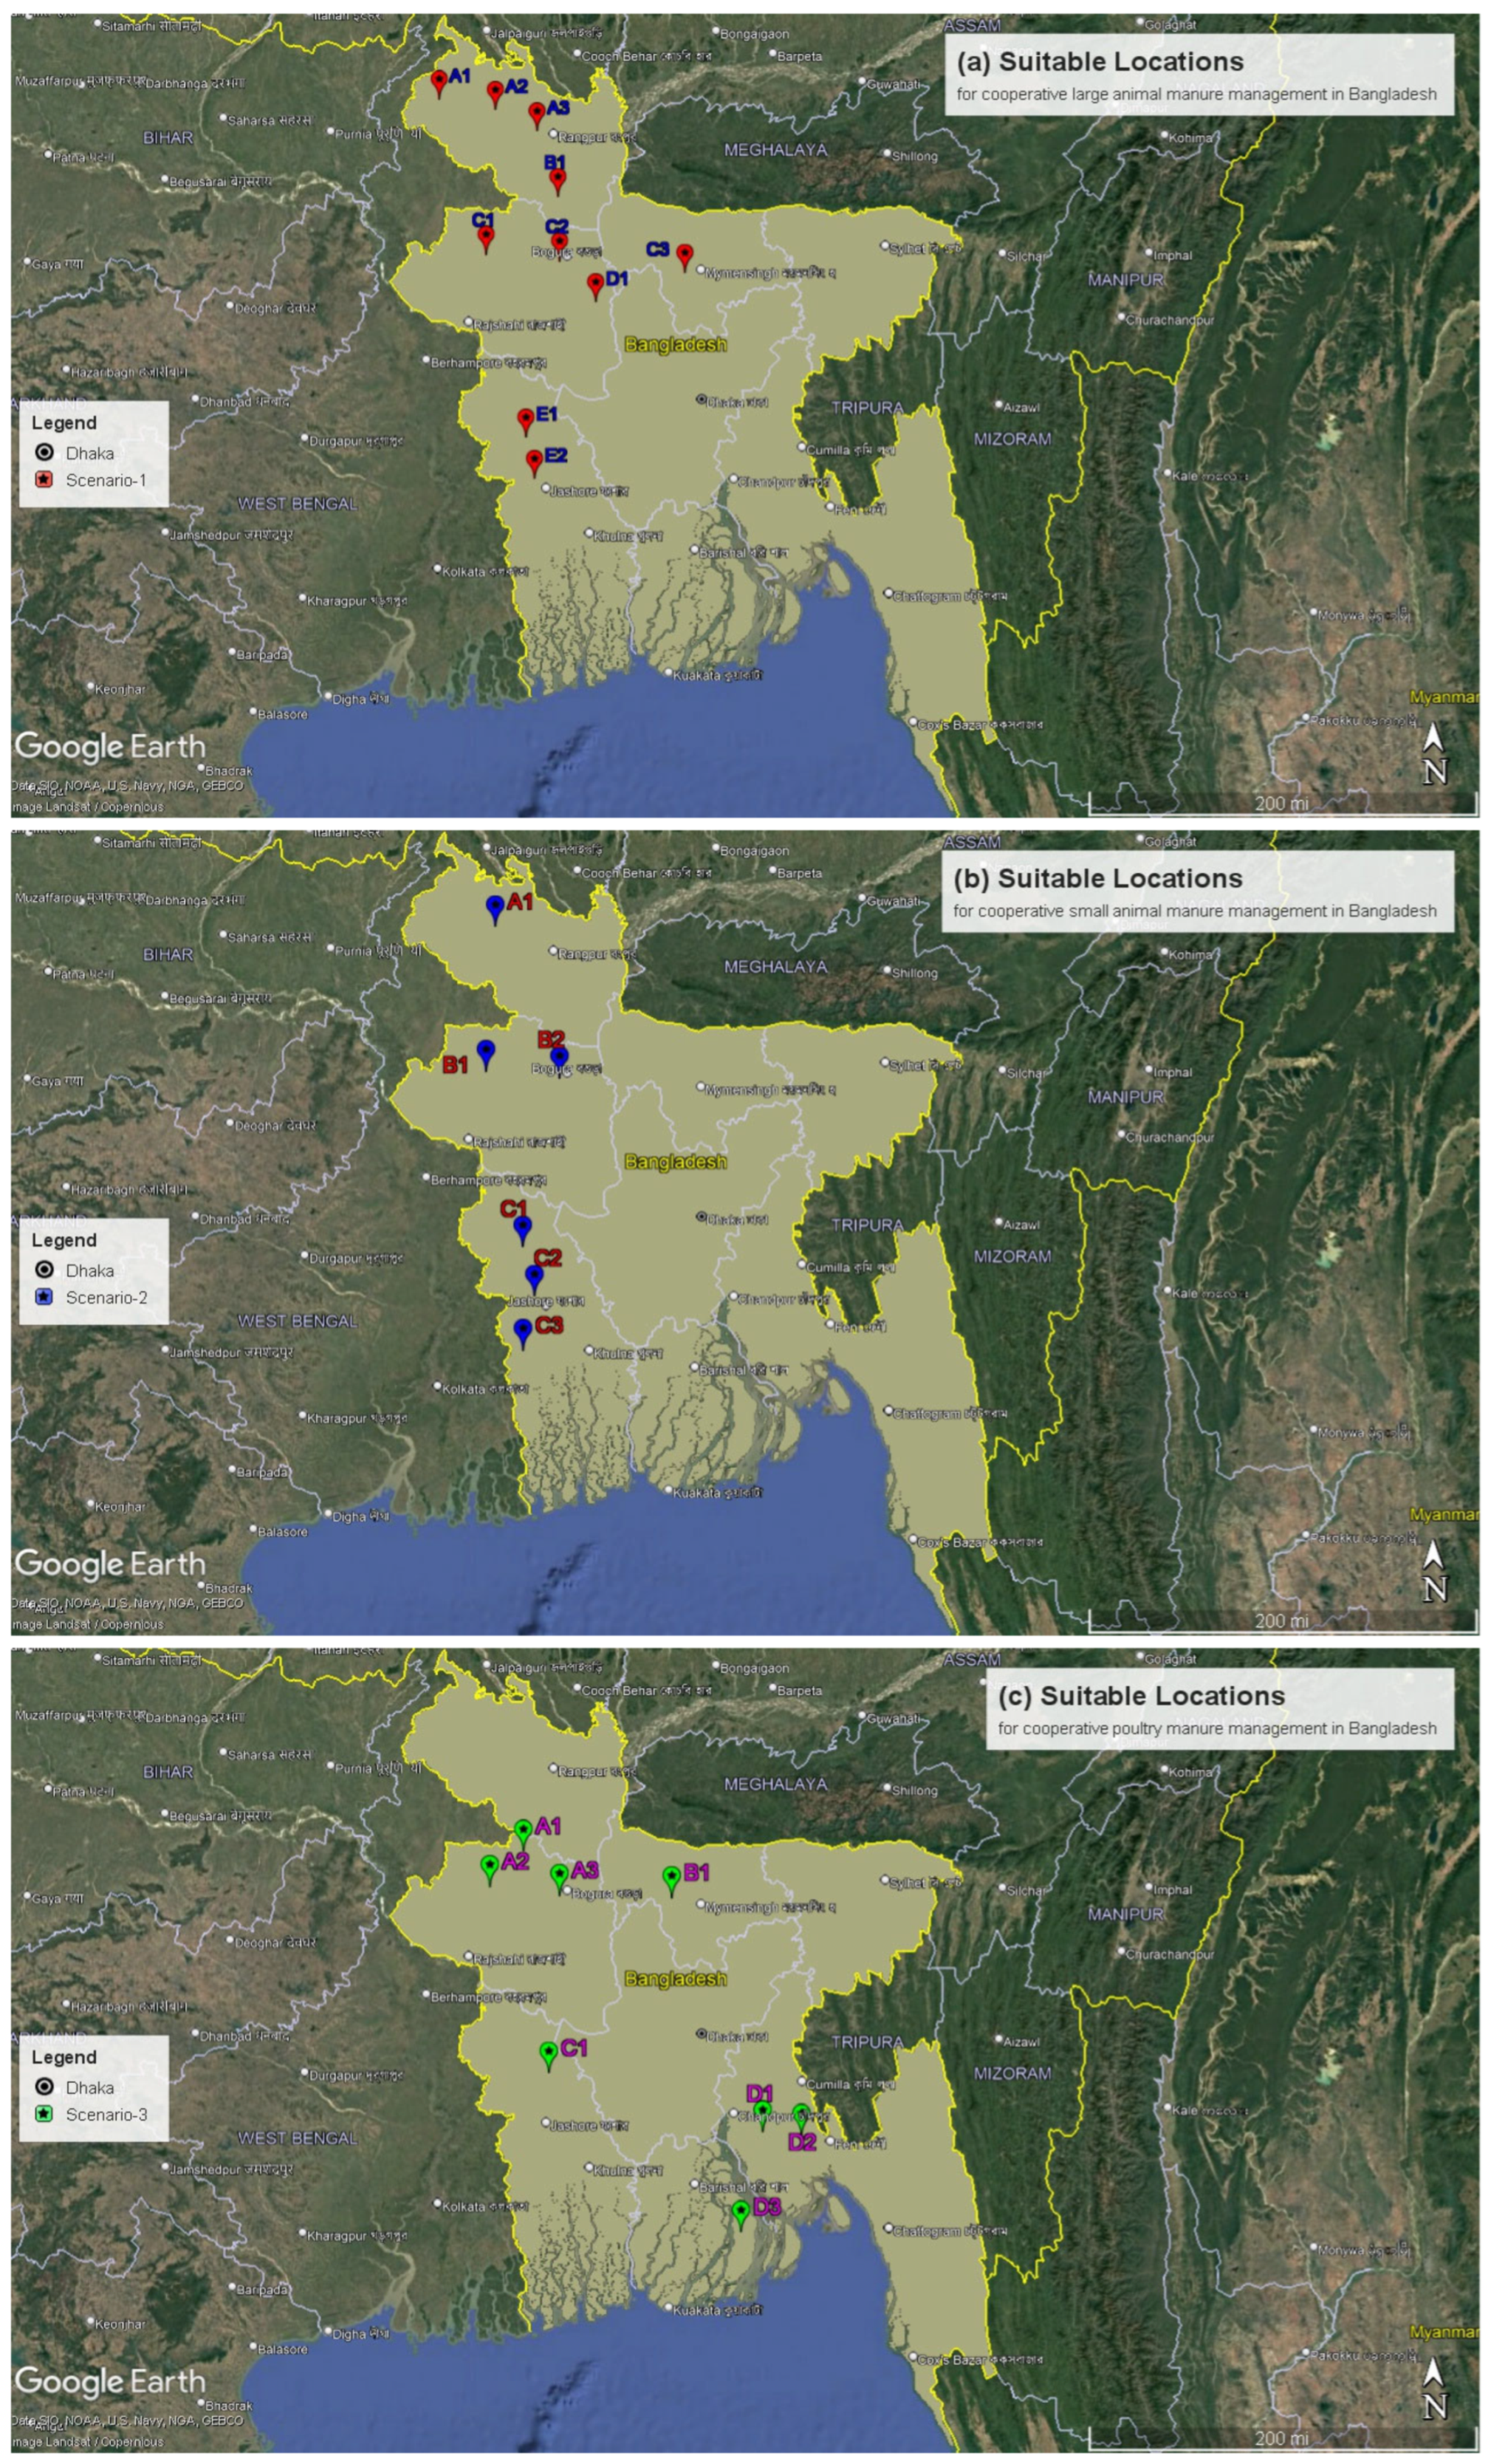
3.2. Suitable Locations Optimization

This study assessed 10, 6, and 8 suitable locations within clusters for manure-based biogas plants from the scenarios, respectively. Firstly, this study assumed two suitable preliminary locations for each cluster. However, after network analysis, it was found that each cluster did not identify two optimal locations due to a lack of suitable parcels within the cluster and few network connections between demand points and facility points. Moreover, a few clusters found more than two optimal locations, and a few clusters found only one optimal location for cooperative manure management in Bangladesh. After network analysis, six clusters were identified in the case of Scenario-1, but only ten locations were optimized due to a lack of suitable parcels in Cluster F (Figure 7a). It was found that three suitable locations were optimized for Clusters A and C, whereas two locations were optimum for Cluster E, and only one location was identified for both Clusters B and D.
Similarly, after analysis of Scenario-2 and Scenario-3, six and eight suitable locations were selected among many candidate locations within cooperative societies, respectively (Figure 7b,c). In the case of Scenario-2, clusters had distinct locations due to manure source availability, where Clusters A, B, and C were reviewed as one, two, and three suitable locations, respectively, for cooperative biogas plant establishment. In Scenario-3, two clusters (B and C) suggested only one suitable location, where three biogas plants were technically possible to develop for both Clusters A and D. For better understanding, each cluster’s extended views were shown in Figure 8, Figure 9 and Figure 10. From this extended view, the lines relate the manure reception point at each village and livestock and poultry farms to the optimal locations. The chosen optimal locations are observed within the suitable parcels of all clusters. Finally, all the suitable locations for cooperative manure management in various scenarios were visualized in Google Earth (Figure 11). From these figures, the pinpoint locations, red, blue, and green colored points, are indicated as cooperative biogas plant locations for large animals, small animals, and poultry manure, respectively, in Bangladesh.

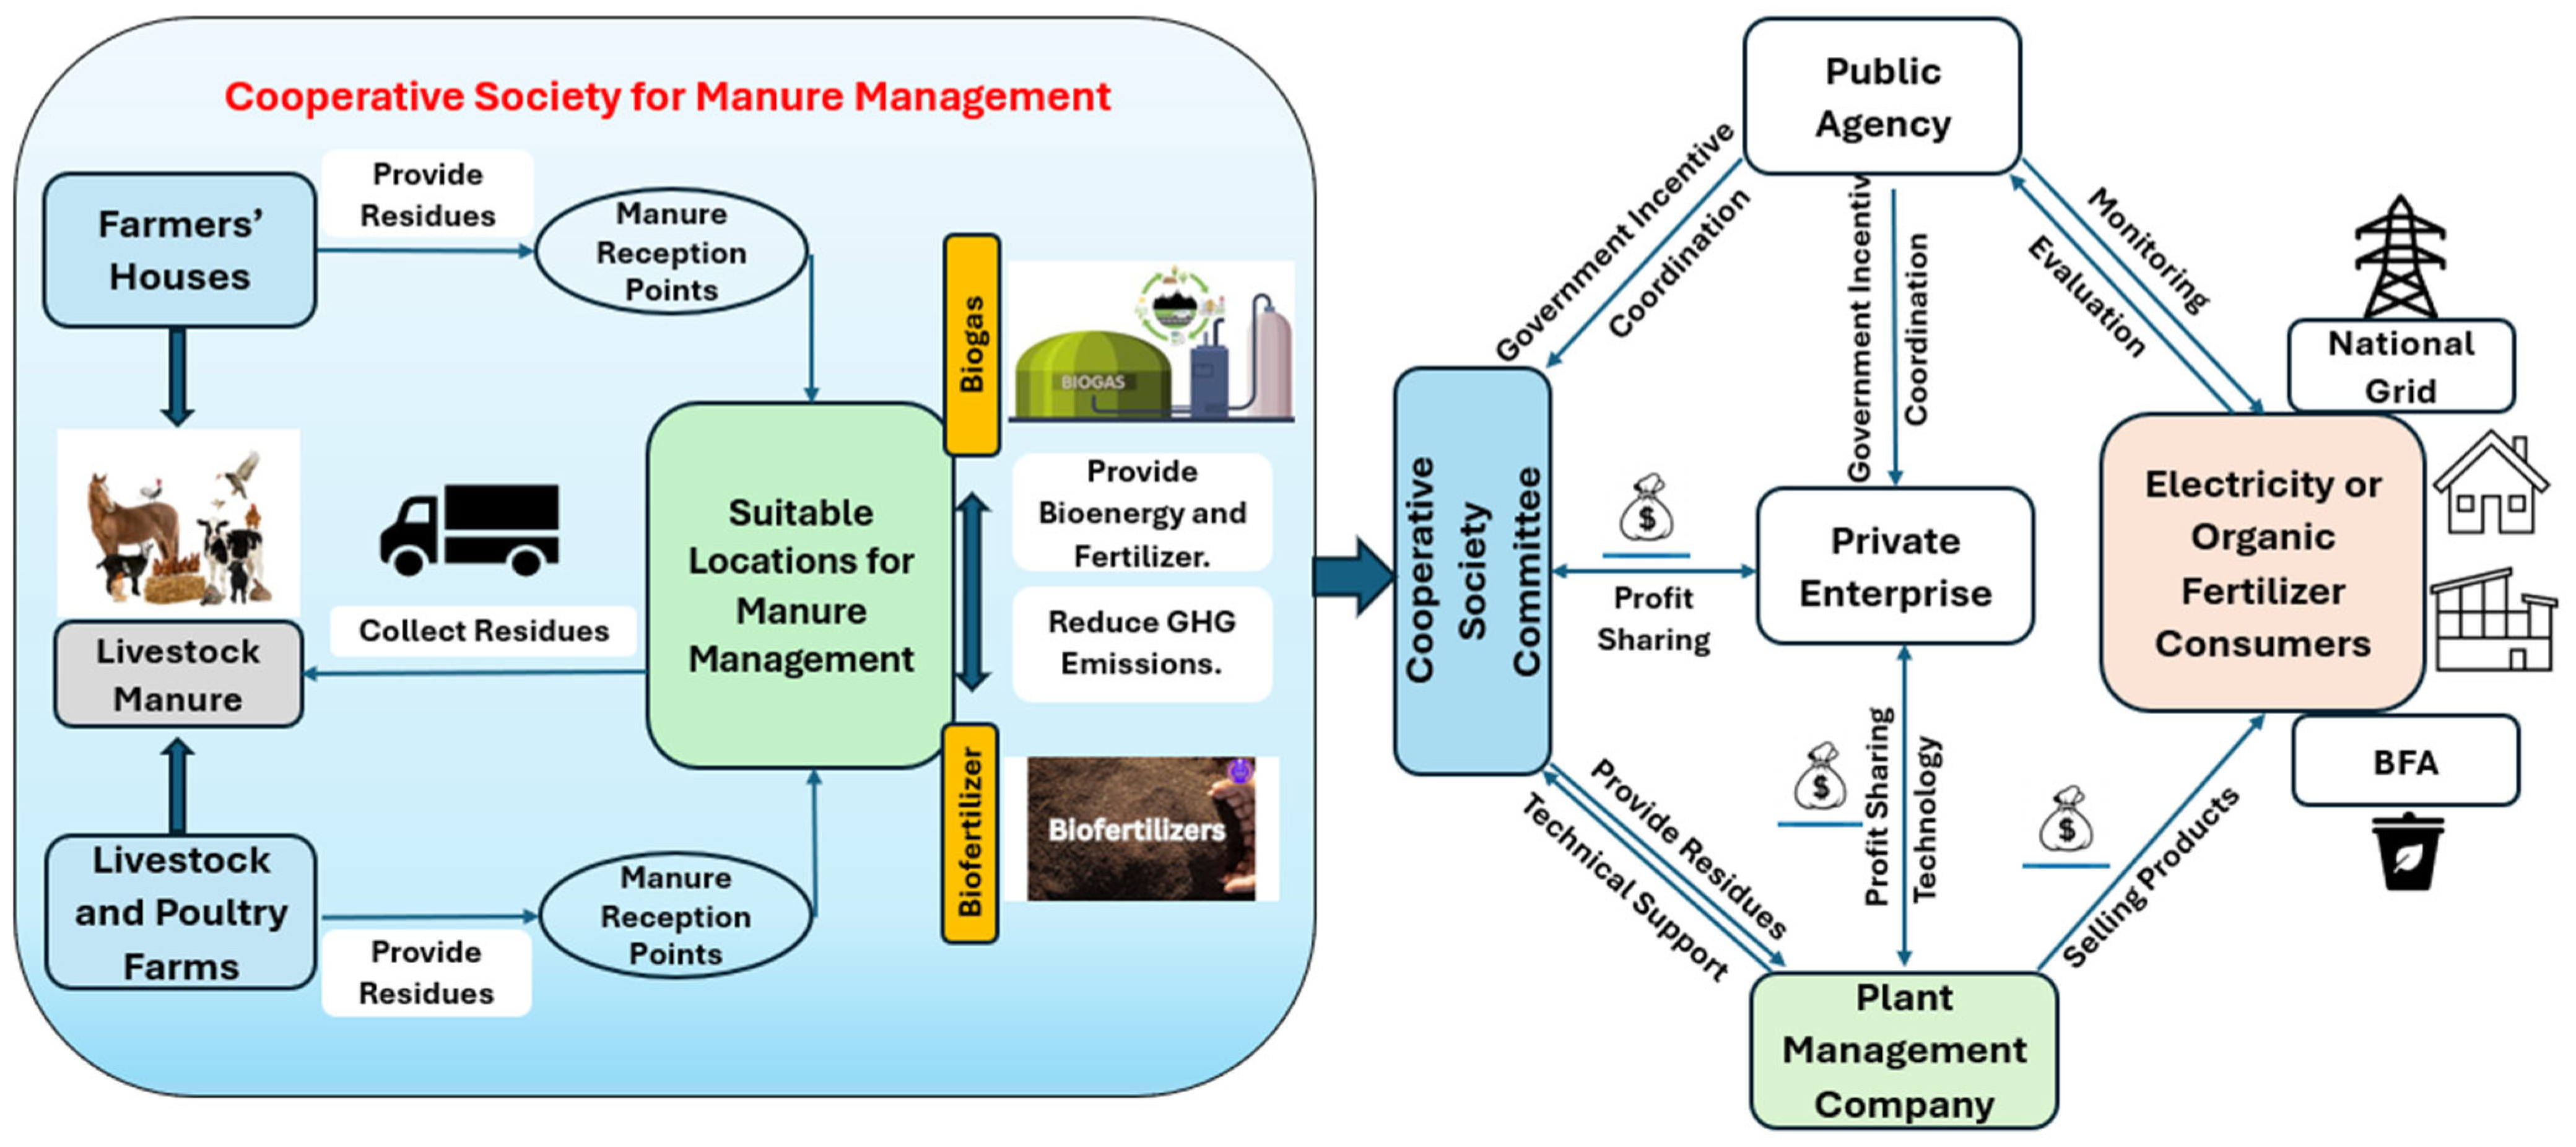
3.3. Cooperative Manure Management Action Plan

The cooperative manure management concept emphasizes livestock and poultry farmers’ access to available manure management services and ensures marketing facilities for selling bioenergy or organic fertilizer through a cooperative system with proper stakeholder negotiation. Stakeholder engagement is crucial in any cooperative system. The cooperatives gather manure from all members of each society and maintain essential marketing channels. However, since government agencies are mainly located at the district level, cooperative societies or communities can operate more effectively for sustainable manure management with collaboration from all stakeholders. This study proposed a model action plan for implementing this cooperative manure management system, shown in Figure 12. Stakeholder participation allows for the involvement of community members, local experts, and environmental organizations in the implementation and cooperation process of the plan. First, a primary cooperative society is formed, including farmers, livestock farm owners, and community members. The best locations within each cluster can be chosen to establish manure management facilities for the cooperative societies. These facilities collect manure either directly from farmers’ homes and farms or from manure reception points. Additionally, various government agencies, non-government organizations, volunteers, local representatives, and private companies are involved in performing specific roles. Technical support and construction, including operational costs of the facilities, are managed collaboratively by a plant management company and a private enterprise within the cooperative.
However, the cooperative system is an active process, and continuous supervision and assessment will be required to adjust to the varying local demand and marketing circumstances, which are performed by government agencies, such as the DLS, upazila parishad (sub-district councils), etc. Moreover, this government organization will arrange financial subsidies to the cooperative societies or farmers directly. Private enterprises can sell products to consumers, including to members of a cooperative society. Under these circumstances, these cooperative societies will play a vital role in managing the livestock manure of the small farmers and farm owners under the same cooperative umbrella. Finally, the cooperative society can receive the products (bioenergy and organic fertilizer) of manure management, and the environment can be improved by reducing GHG emissions from manure.

4. Discussion

Efficient manure management plans are essential for the sustainability of livestock production and the environment. Due to the lack of manure management facilities at the countryside level, such as scientific landfilling, composting, and bioenergy production, farmers are unable to manage manure effectively [2]. Additionally, due to the absence of proper collection techniques and disposal channels in rural areas, smallholder livestock farmers lack awareness of the environmental impacts and economic benefits of manure [59]. There is also a deficiency in training and technical knowledge on how to dispose of manure properly. Although government organizations focus on livestock product processing, such as milk, meat, and eggs, they tend to overlook manure management. This study proposes a cooperative manure management system to improve manure handling among individual small farmers in rural Bangladesh. By identifying a cluster that can serve as a community or cooperative society to collaboratively enhance manure management, optimized locations can be utilized to establish biogas plants to produce bioenergy.
Bangladesh is a developing country where energy requirements are very high due to economic development [34]. Bangladesh heavily relies on natural gas (about 48.32% of the total electricity generation) for power generation, which has a limited reservoir for future exploitation to meet increasing demand for natural gas use in other sectors, such as industrial and domestic purposes [34,60]. Moreover, about 17.41% of the total energy was imported power from neighboring countries in 2024. Therefore, new energy sources are crucial for mitigating the future energy crisis. The total energy generation was approximately 95,996 GWh/year in 2024, where the contribution of renewable energy was about 2.5% of the total energy [12]. This study presented clusters to develop cooperative manure management, which has the potential to produce bioenergy from livestock manure. The estimated electricity potential (9068.64 GWh/year) from all clusters or cooperatives of various scenarios can fulfill 9.45% of the total electricity demand in 2024, increasing the contribution of renewable energy and reducing the pressure on other fossil fuels for power generation. In particular, this bioenergy can save 19.57% of natural gas and 42.94% of furnace oil used for electricity generation and reduce about 44.78% of power imports from other countries in Bangladesh in 2024. Thus, bioenergy production from cooperative manure management ensures future energy security.
Among other renewable energy sources, such as solar and wind plants, biogas generation from livestock manure is feasible in terms of less area required and easy technology integration [59,61]. The electricity generation cost mainly depends on the sources of fossil fuels. Overall, electricity generation cost per kWh from biogas (6–8.5 BDT) is lower in Bangladesh than other types of fuel sources, such as coal (9.17 BDT), furnace oil (22.11 BDT), wind (47.13 BDT), and solar plants (15.56 BDT) [12,34]. Thus, bioenergy generation is economically viable for electricity production. There are more than 80,000 biogas plants that exist in Bangladesh, with more than 95% implemented at the small-scale or household level [61]. The identified clusters can establish all types of plants, including small, medium, and large-scale biogas plants, based on the biogas potential of those clusters. Furthermore, bioenergy generation is not yet widely commercialized, but it has significant potential for power generation in Bangladesh. This cooperative system of manure management could introduce commercial bioenergy production. This bioenergy can be utilized by the farms, cooperatives, and local areas and can even be supplied to the national grid. Additionally, these clusters could produce organic fertilizer from biogas digestate, which would decrease reliance on synthetic fertilizers for crop production, as supported by previous studies [48,50,52].
Bioenergy production from livestock manure significantly reduces GHG emissions compared to fossil fuels used for power generation, as agreed by the previous literature [5,36,38]. This study estimated the average emission rate from biogas-based electricity generation to be 298.21 g CO2eq/kWh, compared to 588 g CO2eq/kWh from fossil fuel-based electricity production in Bangladesh [62]. Therefore, the estimated manure-based biogas plants that generate electricity can reduce 4.78% of total GHG emissions from total energy production in 2024, which is supported by existing rules and policies in Bangladesh. Though economically viable solutions for renewable energy generation exist, such as hydro and other resources, manure-based bioenergy generation is feasible in terms of environmental benefits [61,63,64]. However, total GHG emissions in Bangladesh primarily arise from three sectors: energy, agriculture, and waste [65]. If anticipated levels of biogas can be generated through this cooperative manure management system, it will help to reduce environmental impacts across various sectors. At the same time, these green technologies will decrease the amount of manure openly dumped on land, thus limiting the spread of pathogens nearby. Additionally, this cooperative creates an opportunity to reduce the use of manure for cooking or heating by village people, which produces direct CO2 emissions and harmful substances [49,61] due to incomplete combustion.
However, before conducting spatial analysis and research, selecting a suitable location based on primary data from real situations is crucial for ensuring an accurate and sensitive analysis. It is important to understand the existing limitations and challenges of these areas and livestock farms that have affected the scope and results of this research. The quality of data collection from available sources is another main limitation of this study. Although efforts were made to collect accurate data, there may still be inconsistencies in the collected survey data. Additionally, a detailed comparative feasibility study of cooperative and non-cooperative manure management systems can be explored as a future direction.

5. Conclusions

While traditional manure management practices are well-established, developing a cooperative structure for managing manure is a newer and more complex concept that is difficult to establish thoroughly. This study, however, successfully identified specific clusters or communities among various livestock groups (large animals, small animals, and poultry) for the development of cooperative biogas plants from livestock manure in Bangladesh. The optimal locations within each cluster could be gradually prepared for biogas plants in the future, along with an action plan for how a cooperative structure can be developed. This plan proposes creating an effective cooperative framework and emphasizes the importance of stakeholder engagement and participation in the process. Involving different types of stakeholders and organizations in coordination or collaboration increases the acceptance and sustainability of this plan for effective city or rural livestock manure management at the community level. This initiative has the potential to improve manure management and generate green energy or organic fertilizers, benefiting both rural and urban areas in Bangladesh. Furthermore, this concept can be adapted to upgrade other types of waste, such as household and market waste, to support the development of local communities or societies in Bangladesh or any other country.

Author Contributions

Conceptualization, Z.M.; methodology, Z.M.; software, H.Y.; validation, H.Y.; formal analysis, Z.M.; investigation, H.Y.; resources, H.Y.; data curation, Z.M.; writing—original draft preparation, Z.M.; writing—review and editing, H.Y.; visualization, Z.M.; supervision, H.Y. All authors have read and agreed to the published version of the manuscript.

Funding

This research received no external funding.

Data Availability Statement

Data are contained within the article.

Acknowledgments

Authors gratefully acknowledge the support from the Graduate School of Environmental Sciences and Technology, University of Tsukuba, Japan.

Conflicts of Interest

The funders had no role in the design of the study; in the collection, analyses, or interpretation of data; in the writing of the manuscript; or in the decision to publish the results.

Appendix A

Table A1. Calculation of livestock manure generation in Bangladesh in 2024.
Livestock TypesLivestock Population
(in Million Heads)
Waste Generation
(Kilotons/Year)
Waste Availability
(Kilotons/Year)
Cattle24.69188,743.3694,371.68
Buffalo1.5111,543.235771.62
Goat2.68862.62112.14
Sheep3.751207.03156.91
Chicken311.815645.465080.91
Duck63.841155.851040.27
Total408.28209,157.57106,533.54
Figure A1. Incremental spatial autocorrelation by distance for available manure distribution: (a) large animal manure, (b) small animal manure, (c) poultry manure.
Resources 14 00111 g0a1aResources 14 00111 g0a1b

References

  1. DLS. Department of Livestock Services. Dhaka, Bangladesh. 2024. Available online: https://dls.gov.bd/ (accessed on 24 April 2024).
  2. ILMM. Draft National Integrated Livestock Manure Management (ILMM) Policy; Ministry of Fisheries and Livestock, Dhaka, The People’s Republic of Bangladesh. 2019. Available online: https://mofl.portal.gov.bd/sites/default/files/files/mofl.portal.gov.bd/page/221b5a19_4052_4486_ae71_18f1ff6863c1/ILMM%20Policy.pdf (accessed on 16 March 2025).
  3. Brandão, J.B.; Breitenbach, R. What are the main problems in the management of rural cooperatives in Southern Brazil? Land Use Policy 2019, 85, 121–129. [Google Scholar] [CrossRef]
  4. Sambuo, D. Co-operatology and the science of cooperative societies: A synthetic review of research on cooperative evolution. J. Co-Oper. Organ. Manag. 2023, 11, 100190. [Google Scholar] [CrossRef]
  5. Mahal, Z.; Yabar, H. Spatial Estimation of Biogas and Compost Potential for Sustainable Livestock Manure Management in Bangladesh. Appl. Sci. 2025, 15, 6753. [Google Scholar] [CrossRef]
  6. FAO. Livestock and Environment Statistics: Manure and Greenhouse Gas Emissions. Global, Regional and Country Trends, 1990–2018. Report No: FAOSTAT Analytical Brief Series No. 14; Rome. 2020. Available online: https://openknowledge.fao.org/server/api/core/bitstreams/f0cebfdd-725e-4d7a-8e14-3ba8fb1486a7/content (accessed on 26 January 2025).
  7. Afotey, B.; Sarpong, G.T. Estimation of biogas production potential and greenhouse gas emissions reduction for sustainable energy management using intelligent computing technique. Meas. Sens. 2023, 25, 100650. [Google Scholar] [CrossRef]
  8. Faaij, A.; Van Doorn, J.; Curvers, T.; Waldheim, L.; Olsson, E.; Van Wijk, A.; Daey-Ouwens, C. Characteristics and availability of biomass waste and residues in The Netherlands for gasification. Biomass Bioenergy 1997, 12, 225–240. [Google Scholar] [CrossRef]
  9. Kang, Y.O.; Yabar, H.; Mizunoya, T.; Higano, Y. Optimal landfill site selection using ArcGIS Multi-Criteria Decision-Making (MCDM) and Analytic Hierarchy Process (AHP) for Kinshasa City. Environ. Chall. 2024, 14, 100826. [Google Scholar] [CrossRef]
  10. Mahal, Z.; Yabar, H.; Mizunoya, T. Spatial Assessment of Greenhouse Gas Emissions and Eutrophication Potential from Livestock Manure in Bangladesh. Sustainability 2024, 16, 5479. [Google Scholar] [CrossRef]
  11. MoEF. The National Environment Policy, 2018; Ministry of Environment and Forest, The Government of Bangladesh. 2024. Available online: https://moef.gov.bd/site/page/1c05e31e-1bb0-46ce-95a3-6ee3c82b439f/%E0%A6%AA%E0%A6%B0%E0%A6%BF%E0%A6%AC%E0%A7%87%E0%A6%B6-%E0%A6%A8%E0%A7%80%E0%A6%A4%E0%A6%BF,%E0%A6%86%E0%A6%87%E0%A6%A8-%E0%A6%93-%E0%A6%AC%E0%A6%BF%E0%A6%A7%E0%A6%BF (accessed on 1 May 2024).
  12. BPDB. Bangladesh Power Development Board. Available online: http://www.bpdb.gov.bd/site/page/d2d5afd4-9f20-4c05-9102-a7c7de13798e/- (accessed on 12 November 2024).
  13. Ai, P.; Jin, K.; Alengebawy, A.; Elsayed, M.; Meng, L.; Chen, M.; Ran, Y. Effect of application of different biogas fertilizer on eggplant production: Analysis of fertilizer value and risk assessment. Environ. Technol. Innov. 2020, 19, 101019. [Google Scholar] [CrossRef]
  14. Li, J.; Wei, L.; Duan, Q.; Hu, G.; Zhang, G. Semi-continuous anaerobic co-digestion of dairy manure with three crop residues for biogas production. Bioresour. Technol. 2014, 156, 307–313. [Google Scholar] [CrossRef]
  15. Mathew, A.K.; Bhui, I.; Banerjee, S.N.; Goswami, R.; Chakraborty, A.K.; Shome, A.; Balachandran, S.; Chaudhury, S. Biogas production from locally available aquatic weeds of Santiniketan through anaerobic digestion. Clean Technol. Environ. Policy 2015, 17, 1681–1688. [Google Scholar] [CrossRef]
  16. Amon, B.; Kryvoruchko, V.; Amon, T.; Zechmeister-Boltenstern, S. Methane, nitrous oxide and ammonia emissions during storage and after application of dairy cattle slurry and influence of slurry treatment. Agric. Ecosyst. Environ. 2006, 112, 153–162. [Google Scholar] [CrossRef]
  17. Alengebawy, A.; Mohamed, B.A.; Ghimire, N.; Jin, K.; Liu, T.; Samer, M.; Ai, P. Understanding the environmental impacts of biogas utilization for energy production through life cycle assessment: An action towards reducing emissions. Environ. Res. 2022, 213, 113632. [Google Scholar] [CrossRef]
  18. Paolini, V.; Petracchini, F.; Segreto, M.; Tomassetti, L.; Naja, N.; Cecinato, A. Environmental impact of biogas: A short review of current knowledge. J. Environ. Sci. Health Part A 2018, 53, 899–906. [Google Scholar] [CrossRef] [PubMed]
  19. Aktar, K.; Yabar, H.; Mizunoya, T.; Islam, M.D.M. Application of GIS in Introducing Community-Based Biogas Plants from Dairy Farm Waste: Potential of Renewable Energy for Rural Areas in Bangladesh. Geomatics 2024, 4, 384–411. [Google Scholar] [CrossRef]
  20. Mahal, Z.; Yabar, H. A Spatial Modeling Approach for Optimizing the Locations of Large-Scale Biogas Plants from Livestock Manure in Bangladesh. Land 2025, 14, 79. [Google Scholar] [CrossRef]
  21. Venier, F.; Yabar, H. Renewable energy recovery potential towards sustainable cattle manure management in Buenos Aires Province: Site selection based on GIS spatial analysis and statistics. J. Clean. Prod. 2017, 162, 1317–1333. [Google Scholar] [CrossRef]
  22. Google Earth Pro Earth Versions. Google Earth. 2025. Available online: https://www.google.com/earth/about/versions/ (accessed on 16 January 2025).
  23. BBS. Bangladesh Bureau of Statistics. Government of the People’s Republic of Bangladesh. Available online: http://bbs.portal.gov.bd/site/page/6b4c2697-452b-4bc6-9ee2-1fb5e0fc66c0/- (accessed on 24 April 2024).
  24. ArcGIS Online. Available online: https://www.google.com/search?client=firefox-b-d&q=arcgis+online (accessed on 13 November 2024).
  25. ESRI. Spatial Autocorrelation (Global Moran’s I) (Spatial Statistics)—ArcGIS Pro|Documentation. Available online: https://pro.arcgis.com/en/pro-app/latest/tool-reference/spatial-statistics/spatial-autocorrelation.htm (accessed on 9 January 2025).
  26. ESRI. Incremental Spatial Autocorrelation (Spatial Statistics)—ArcMap|Documentation. ArcMap. 2025. Available online: https://desktop.arcgis.com/en/arcmap/latest/tools/spatial-statistics-toolbox/incremental-spatial-autocorrelation.htm (accessed on 9 January 2025).
  27. ESRI Environmental Research Systems Institute. Types of Network Analysis Layers—ArcMap|Documentation. 2024. Available online: https://desktop.arcgis.com/en/arcmap/latest/extensions/network-analyst/types-of-network-analyses.htm (accessed on 12 September 2024).
  28. Schnorf, V.; Trutnevyte, E.; Bowman, G.; Burg, V. Biomass transport for energy: Cost, energy and CO2 performance of forest wood and manure transport chains in Switzerland. J. Clean. Prod. 2021, 293, 125971. [Google Scholar] [CrossRef]
  29. Ashik-Ur-Rahman, M.D.; Waheduzzaman, M.D.; Waresul Hassan Nipun, M. Optimized municipal solid waste transportation with landfill requirement in a coastal city of Bangladesh. Environ. Qual. Mgmt. 2022, 31, 197–210. [Google Scholar] [CrossRef]
  30. Hasan, S. Problems of municipal waste management in Bangladesh: An inquiry into its nature. Habitat Int. 1998, 22, 191–202. [Google Scholar] [CrossRef]
  31. District Statistics. BBS. Bangladesh Bureau of Statistics. Government of the People’s Republic of Bangladesh. 2019. Available online: https://bbs.gov.bd/site/page/2888a55d-d686-4736-bad0-54b70462afda/District-Statistics (accessed on 12 September 2024).
  32. Rezapoor, P.; Rahimpour, M.R. Animal Waste to Energy, Technologies, Economics, and Challenges. In Encyclopedia of Renewable Energy, Sustainability and the Environment; Elsevier: Amsterdam, The Netherlands, 2024; pp. 61–70. Available online: https://linkinghub.elsevier.com/retrieve/pii/B9780323939409001481 (accessed on 27 June 2025).
  33. Dong, H.; Yang, M.; Hu, X.; Cui, C.; Liu, W. Biogas and nutrient recovery potential: A spatially explicit analysis of China’s county-level livestock and poultry manure. Waste Manag. 2025, 204, 114906. [Google Scholar] [CrossRef]
  34. Economic Review Finance Division, Ministry of Finance. 2024. Available online: https://mof.portal.gov.bd/site/page/28ba57f5-59ff-4426-970a-bf014242179e/Bangladesh-Economic-Review (accessed on 2 May 2024).
  35. Huque, K.; Khan, M. Socio-geographic distribution of livestock and poultry in Bangladesh-A review. Bang. J. Anim. Sci. 2017, 46, 65–81. [Google Scholar] [CrossRef]
  36. Islam, K.N.; Sarker, T.; Taghizadeh-Hesary, F.; Atri, A.C.; Alam, M.S. Renewable energy generation from livestock waste for a sustainable circular economy in Bangladesh. Renew. Sustain. Energy Rev. 2021, 139, 110695. [Google Scholar] [CrossRef]
  37. Siddiki, S.K.Y.A.; Uddin, M.N.; Mofijur, M.; Fattah, I.M.R.; Ong, H.C.; Lam, S.S.; Kumar, P.S.; Ahmed, S.F. Theoretical calculation of biogas production and greenhouse gas emission reduction potential of livestock, poultry and slaughterhouse waste in Bangladesh. J. Environ. Chem. Eng. 2021, 9, 105204. [Google Scholar] [CrossRef]
  38. Nehra, M.; Jain, S. Estimation of renewable biogas energy potential from livestock manure: A case study of India. Bioresour. Technol. Rep. 2023, 22, 101432. [Google Scholar] [CrossRef]
  39. Chowdhury, T.; Chowdhury, H.; Hossain, N.; Ahmed, A.; Hossen, M.S.; Chowdhury, P.; Thirugnanasambandam, M.; Saidur, R. Latest advancements on livestock waste management and biogas production: Bangladesh’s perspective. J. Clean. Prod. 2020, 272, 122818. [Google Scholar] [CrossRef]
  40. DLS. Livestock Economy at a Glance; Department of Livestock Services: Dhaka, Bangladesh, 2024. Available online: http://dls.portal.gov.bd/sites/default/files/files/dls.portal.gov.bd/page/ee5f4621_fa3a_40ac_8bd9_898fb8ee4700/2023-07-23-12-04-afbcccb96f8b27d4bab6501aa8c2c2ff.pdf (accessed on 20 April 2025).
  41. MoEFCC. Second National Communication of Bangladesh to the United Nations Framework on Convention on Climate Change; Ministry of Environment and Forest: Dhaka, Bangladesh, 2012.
  42. Abdeshahian, P.; Lim, J.S.; Ho, W.S.; Hashim, H.; Lee, C.T. Potential of biogas production from farm animal waste in Malaysia. Renew. Sustain. Energy Rev. 2016, 60, 714–723. [Google Scholar] [CrossRef]
  43. Afazeli, H.; Jafari, A.; Rafiee, S.; Nosrati, M. An investigation of biogas production potential from livestock and slaughterhouse wastes. Renew. Sustain. Energy Rev. 2014, 34, 380–386. [Google Scholar] [CrossRef]
  44. Avcioğlu, A.O.; Türker, U. Status and potential of biogas energy from animal wastes in Turkey. Renew. Sustain. Energy Rev. 2012, 16, 1557–1561. [Google Scholar] [CrossRef]
  45. Deublein, D.; Steinhauser, A. Biogas from Waste and Renewable Resources. In Biogas from Waste and Renewable Resources; John Wiley & Sons, Ltd.: Hoboken, NJ, USA, 2010; pp. 85–95. Available online: https://onlinelibrary.wiley.com/doi/abs/10.1002/9783527632794.ch8 (accessed on 24 May 2024).
  46. Benito, M.; Ortiz, I.; Rodríguez, L.; Muñoz, G. Ni–Co bimetallic catalyst for hydrogen production in sewage treatment plants: Biogas reforming and tars removal. Int. J. Hydrogen Energy 2015, 40, 14456–14468. [Google Scholar] [CrossRef]
  47. Garcia, A.P. Techno-Economic Feasibility Study of a Small-Scale Biogas Plant for Treating Market Waste in the City of El Alto, KTH School of Industrial Engineering and Management Energy Technology EGI-2014-083MSC Division of Energy and Climate SE-100 44 STOCKHOLM, 2014. Available online: http://kth.diva-portal.org/smash/get/diva2:741758/FULLTEXT01.pdf (accessed on 26 December 2024).
  48. Ioannou-Ttofa, L.; Foteinis, S.; Seifelnasr Moustafa, A.; Abdelsalam, E.; Samer, M.; Fatta-Kassinos, D. Life cycle assessment of household biogas production in Egypt: Influence of digester volume, biogas leakages, and digestate valorization as biofertilizer. J. Clean. Prod. 2021, 286, 125468. [Google Scholar] [CrossRef]
  49. Alfa, M.I.; Adie, D.B.; Igboro, S.B.; Oranusi, U.S.; Dahunsi, S.O.; Akali, D.M. Assessment of biofertilizer quality and health implications of anaerobic digestion effluent of cow dung and chicken droppings. Renew. Energy 2014, 63, 681–686. [Google Scholar] [CrossRef]
  50. Slepetiene, A.; Volungevicius, J.; Jurgutis, L.; Liaudanskiene, I.; Amaleviciute-Volunge, K.; Slepetys, J.; Ceseviciene, J. The potential of digestate as a biofertilizer in eroded soils of Lithuania. Waste Manag. 2020, 102, 441–451. [Google Scholar] [CrossRef] [PubMed]
  51. Ngumah, C.; Ogbulie, J.; Orji, J.; Amadi, E. Potential of Organic Waste for Biogas and Biofertilizer Production in Nigeria. Environ. Res. Eng. Manag. 2013, 63, 60–66. [Google Scholar] [CrossRef]
  52. Ezemagu, I.G.; Ejimofor, M.I.; Menkiti, M.C.; Diyoke, C. Biofertilizer production via composting of digestate obtained from anaerobic digestion of post biocoagulation sludge blended with saw dust: Physiochemical characterization and kinetic study. Environ. Chall. 2021, 5, 100288. [Google Scholar] [CrossRef]
  53. Ayodele, T.R.; Ogunjuyigbe, A.S.O.; Alao, M.A. Economic and environmental assessment of electricity generation using biogas from organic fraction of municipal solid waste for the city of Ibadan, Nigeria. J. Clean. Prod. 2018, 203, 718–735. [Google Scholar] [CrossRef]
  54. Kaygusuz, K. Renewable and sustainable energy use in Turkey: A review. Renew. Sustain. Energy Rev. 2002, 6, 339–366. [Google Scholar] [CrossRef]
  55. Viswanathan, B. Chapter 3—Natural Gas. In Energy Sources; Viswanathan, B., Ed.; Elsevier: Amsterdam, The Netherlands, 2017; pp. 59–79. Available online: https://www.sciencedirect.com/science/article/pii/B9780444563538000034 (accessed on 30 May 2024).
  56. Lebel, E.D.; Finnegan, C.J.; Ouyang, Z.; Jackson, R.B. Methane and NOx Emissions from Natural Gas Stoves, Cooktops, and Ovens in Residential Homes. Environ. Sci. Technol. 2022, 56, 2529–2539. [Google Scholar] [CrossRef]
  57. Nasir, I.M.; Mohd Ghazi, T.I.; Omar, R. Anaerobic digestion technology in livestock manure treatment for biogas production: A review. Eng. Life Sci. 2012, 12, 258–269. [Google Scholar] [CrossRef]
  58. Noorollahi, Y.; Kheirrouz, M.; Asl, H.F.; Yousefi, H.; Hajinezhad, A. Biogas production potential from livestock manure in Iran. Renew. Sustain. Energy Rev. 2015, 50, 748–754. [Google Scholar] [CrossRef]
  59. Saha, C.K.; Nandi, R.; Akter, S.; Hossain, S.; Kabir, K.B.; Kirtania, K.; Islam, M.T.; Guidugli, L.; Reza, M.T.; Alam, M.M. Technical prospects and challenges of anaerobic co-digestion in Bangladesh: A review. Renew. Sustain. Energy Rev. 2024, 197, 114412. [Google Scholar] [CrossRef]
  60. Akash, F.A.; Shovon, S.M.; Rahman, W.; Rahman, M.A.; Chakraborty, P.; Monir, M.U. Greening the grid: A comprehensive review of renewable energy in Bangladesh. Heliyon 2024, 10, e27477. [Google Scholar] [CrossRef] [PubMed]
  61. Abdullah-Al-Mahbub, M.D.; Islam, A.R.M.T. Current status of running renewable energy in Bangladesh and future prospect: A global comparison. Heliyon 2023, 9, e14308. [Google Scholar] [CrossRef] [PubMed]
  62. IEA. CO2 Emissions From Fuel Combustion Highlights 2013; International Energy Agency: Paris, France, 2013; p. 112. [Google Scholar]
  63. Benefits of a Biogas Plant. In Biogas from Waste and Renewable Resources; John Wiley & Sons, Ltd.: Hoboken, NJ, USA, 2010; pp. 353–356. Available online: https://onlinelibrary.wiley.com/doi/abs/10.1002/9783527632794.ch34 (accessed on 24 May 2024).
  64. Halder, P.K.; Paul, N.; Joardder, M.U.H.; Khan, M.Z.H.; Sarker, M. Feasibility analysis of implementing anaerobic digestion as a potential energy source in Bangladesh. Renew. Sustain. Energy Rev. 2016, 65, 124–134. [Google Scholar] [CrossRef]
  65. FAO. FAOSTAT. Food and Agriculture Organization of the United Nations. 2024. Available online: https://www.fao.org/faostat/en/#data/EK (accessed on 23 April 2024).
Figure 1. Process flow of the study.
Resources 14 00111 g001
Figure 2. Demand and facility points used in network analysis: (a) locations of farms and manure reception points, (b) suitable parcels [20].
Resources 14 00111 g002
Figure 3. Symbology of available livestock manure intensity in Bangladesh: (a) large-animal manure, (b) small-animal manure, (c) poultry manure.
Resources 14 00111 g003
Figure 4. The cluster and outlier analysis of available livestock manure intensity in Bangladesh: (a) large-animal manure, (b) small-animal manure, (c) poultry manure.
Resources 14 00111 g004
Figure 5. Identification of clusters for cooperative societies in Bangladesh: (a) large-animal manure, (b) small-animal manure, (c) poultry manure.
Resources 14 00111 g005
Figure 6. GHG emissions reduction potential (million kg CO2eq) as biogas and compost generation from different scenarios.
Resources 14 00111 g006
Figure 7. Network analysis for cooperative manure management: (a) Scenario-1, (b) Scenario-2, (c) Scenario-3.
Resources 14 00111 g007
Figure 8. Extended images of network analysis (Scenario-1): (a) Cluster A, (b) Cluster B, (c) Cluster C, (d) Cluster D, (e) Cluster E, (f) Cluster F.
Resources 14 00111 g008
Figure 9. Extended images of network analysis (Scenario-2): (a) Cluster A, (b) Cluster B, (c) Cluster C.
Resources 14 00111 g009
Figure 10. Extended images of network analysis (Scenario-3): (a) Cluster A, (b) Cluster B, (c) Cluster C, (d) Cluster D.
Resources 14 00111 g010
Figure 11. Suitable locations for cooperative manure management: (a) Scenario-1, (b) Scenario-2, (c) Scenario-3.
Resources 14 00111 g011
Figure 12. A cooperative manure management model.
Resources 14 00111 g012
Table 1. Scenarios for cooperative manure management.
ScenariosLivestock GroupsLivestock Types
Scenario-1Large-animalCattle, Buffalo
Scenario-2Small-animalSheep, Goat
Scenario-3PoultryChicken, Duck
Table 2. Factors to calculate the manure generation in this study.
Livestock GroupsLivestock TypesAverage Body Weight (kg/Head)Manure Generation Based on Body Size (%)Manure Generation Rate (kg/Head/Day)Collection Efficiency (%)
Large AnimalCattle, Buffalo21091950
Small AnimalSheep, Goat2040.813
PoultryChicken, Duck1.530.04590
Table 3. Potential of livestock manure in various clusters.
ScenariosClusters
(From Cluster Analysis)
Available Manure Kiloton/YearBiogas Potential: Million m3/YearElectricity Potential GWh/YearBiofertilizer Kiloton/Year
Scenario-1Cluster A11,189.891522.692284.041403.29
Cluster B6244.70849.771274.64783.13
Cluster C93,73.431275.521913.271175.49
Cluster D7249.91986.551479.82909.19
Cluster E6656.34905.771358.66834.75
Cluster F926.43126.06189.09116.18
Scenario-2Cluster A150.7313.6720.51118.90
Cluster B228.2920.7131.0628.63
Cluster C222.5720.1930.2827.91
Scenario-3Cluster A469.0198.71148.0658.82
Cluster B234.2749.3173.9629.38
Cluster C173.3536.4854.7421.74
Cluster D666.64140.31210.4683.60
total 43,785.576045.769068.645491.04
Disclaimer/Publisher’s Note: The statements, opinions and data contained in all publications are solely those of the individual author(s) and contributor(s) and not of MDPI and/or the editor(s). MDPI and/or the editor(s) disclaim responsibility for any injury to people or property resulting from any ideas, methods, instructions or products referred to in the content.

