Article

Is Everything Lost? Recreating the Surface Water Temperature of Unmonitored Lakes in Poland

by
Mariusz Ptak
1,*,
Mariusz Sojka
2,
Katarzyna Szyga-Pluta
3,
Muhammad Yousuf Jat Baloch
4 and
Teerachai Amnuaylojaroen
5,6,*
1
Department of Hydrology and Water Management, Adam Mickiewicz University, Krygowskiego 10, 61-680 Poznań, Poland
2
Department of Land Improvement, Environmental Development and Spatial Management, Poznań University of Life Sciences, Piątkowska 94E, 60-649 Poznań, Poland
3
Department of Meteorology and Climatology, Adam Mickiewicz University, Krygowskiego 10, 61-680 Poznań, Poland
4
School of Environmental Science and Engineering, Shandong University, Qingdao 266237, China
5
School of Energy and Environment, University of Phayao, Phayao 56000, Thailand
6
Atmospheric Pollution and Climate Research Unit, School of Energy and Environment, University of Phayao, Phayao 56000, Thailand
*
Authors to whom correspondence should be addressed.
Resources 2025, 14(4), 67; https://doi.org/10.3390/resources14040067
Submission received: 21 February 2025 / Revised: 13 April 2025 / Accepted: 16 April 2025 / Published: 18 April 2025

Abstract

:
One of the fundamental features of lakes is water temperature, which determines the functioning of lake ecosystems. However, the overall range of information related to the monitoring of this parameter is quite limited, both in terms of the number of lakes and the duration of measurements. This study addresses this gap by reconstructing the lake surface water temperature (LSWT) of six lakes in Poland from 1994 to 2023, where direct measurements were discontinued. The reconstruction is based on the Air2Water model, which establishes a statistical relationship between LSWT and air temperature. Model validation using historical observations demonstrated high predictive accuracy, with a Nash–Sutcliffe Efficiency exceeding 0.92 and root mean squared error ranging from 0.97 °C to 2.13 °C across the lakes. A trend analysis using the Mann–Kendall test and Sen’s slope estimator indicated a statistically significant warming trend in all lakes, with an average increase of 0.35 °C per decade. Monthly trends were most pronounced in June, September, and November, exceeding 0.50 °C per decade in some cases. The direction, pace, and scale of these changes are crucial for managing individual lakes, both from an ecological and economic perspective.

1. Introduction

Over the past few decades, climate change has played a key role, forming the basis for further interactions within the hydrosphere, confirmed by numerous studies related to the physical, chemical, and biological properties of water [1,2,3]. Undoubtedly, a key parameter of aquatic ecosystems is water temperature, which influences biotic processes related to phytoplankton and fish [4,5] and abiotic factors, including dissolved oxygen and water quality [6,7]. Water temperature is closely linked to air temperature [8], which affects its rise. For example, the annual average water temperature in Loch Leven increased by approximately 1 °C over 34 years [9]. The increase in temperature of several hundred lakes in Canada during the open water season was determined at a rate of 0.03 °C/year [10]. An analysis of surface temperature changes in lakes and reservoirs in Spain showed that 87% of them exhibit a warming trend, with an average increase of +0.037 °C per year [11]. Significant changes in water temperature occurred from the late 1980s as a result of the changing climate regime [12]. Therefore, a detailed understanding of the water temperature trends from this period is crucial for assessing the current response to rising air temperatures [13]. To understand the thermal regime and its proper interpretation, it is essential to have a dataset that includes appropriate quality and length of observations. Although having good temperature data is necessary, it is not an easy task for ecologists and managers, because these data are often short and incomplete [14]. Technological advancements, which facilitate extensive data collection, better data sharing, the creation of advanced methods, and the development of complex models, have brought hydrological research to a higher level [15]. Better data sharing is needed for hydrological research and water management, which require better integration of data, information, and models [16].
Hydrological data form the basis for further interpretation, and model tools are used to fill in the gaps. These models can establish a relationship between historical water temperatures and their driving factors, which are available through meteorological stations or remote sensing techniques [17,18]. Although water temperature plays a major role in lake ecosystems, there are only in situ temperature records for a small portion of lakes worldwide [19]. Therefore, where long-term, high-frequency data on surface water temperature exist, data-based models can effectively provide valuable insights into how a lake’s surface responds to a warming climate [20]. Reconstructing inland water temperatures relies on a variety of methodologies. In the case of reconstructing summer water temperatures for lakes on Baffin Island, it was determined that the temperature had increased by 2.0 °C over the past 150 years [21]. A retrospective forecast of surface water temperature conducted for Lake Chaohu revealed a recent increase of 0.05 °C per year [22]. Estimated surface temperatures of lakes in the USA, generated using deep learning, allowed for an expansion of information regarding daily temperature forecasts compared to existing datasets [23]. Dynamic monitoring of changes in lake surface water temperature (LSWT), predicting and quantitatively determining lake responses to sudden or gradual climate changes and human activities, can provide valuable information for ecosystem reaction modeling and management [24]. The morphometric diversity of lakes suggests that global patterns of surface water temperature will likely exhibit significant spatial and temporal variability [25].
One of the effective methodological approaches used in lake water temperature studies is the Air2water model, as demonstrated in research conducted in various parts of the world [26,27,28]. The Air2water model correlates LSWT only with air temperature (AT), which can accurately capture long-term historical trends and interannual fluctuations, creating opportunities for monitoring lakes in response to climate change [28].
Lakes in Poland are important in many sectors of the economy, such as flood protection, transport routes, and fisheries. As noted by Nowak and Dumienski [29], lakes are crucial as places for tourism and recreation. Stationary measurements of lake surface water temperature in Poland are systematically conducted for several dozen lakes. This is relatively few, considering that there are thousands of lakes in the country. Over the years, the number of monitored lakes has changed, with new observation posts opening and existing ones closing as part of the reorganization of the observation network of the Institute of Meteorology and Water Management. The goal of the article is to reconstruct the water temperature for six lakes where observations were discontinued and to analyze its changes over the past three decades, which have been crucial due to the climate regime shift [30]. This approach offers an opportunity to expand the knowledge of one of the key water parameters in lakes, temperature, which affects the overall processes occurring in these ecosystems.

2. Materials and Methods
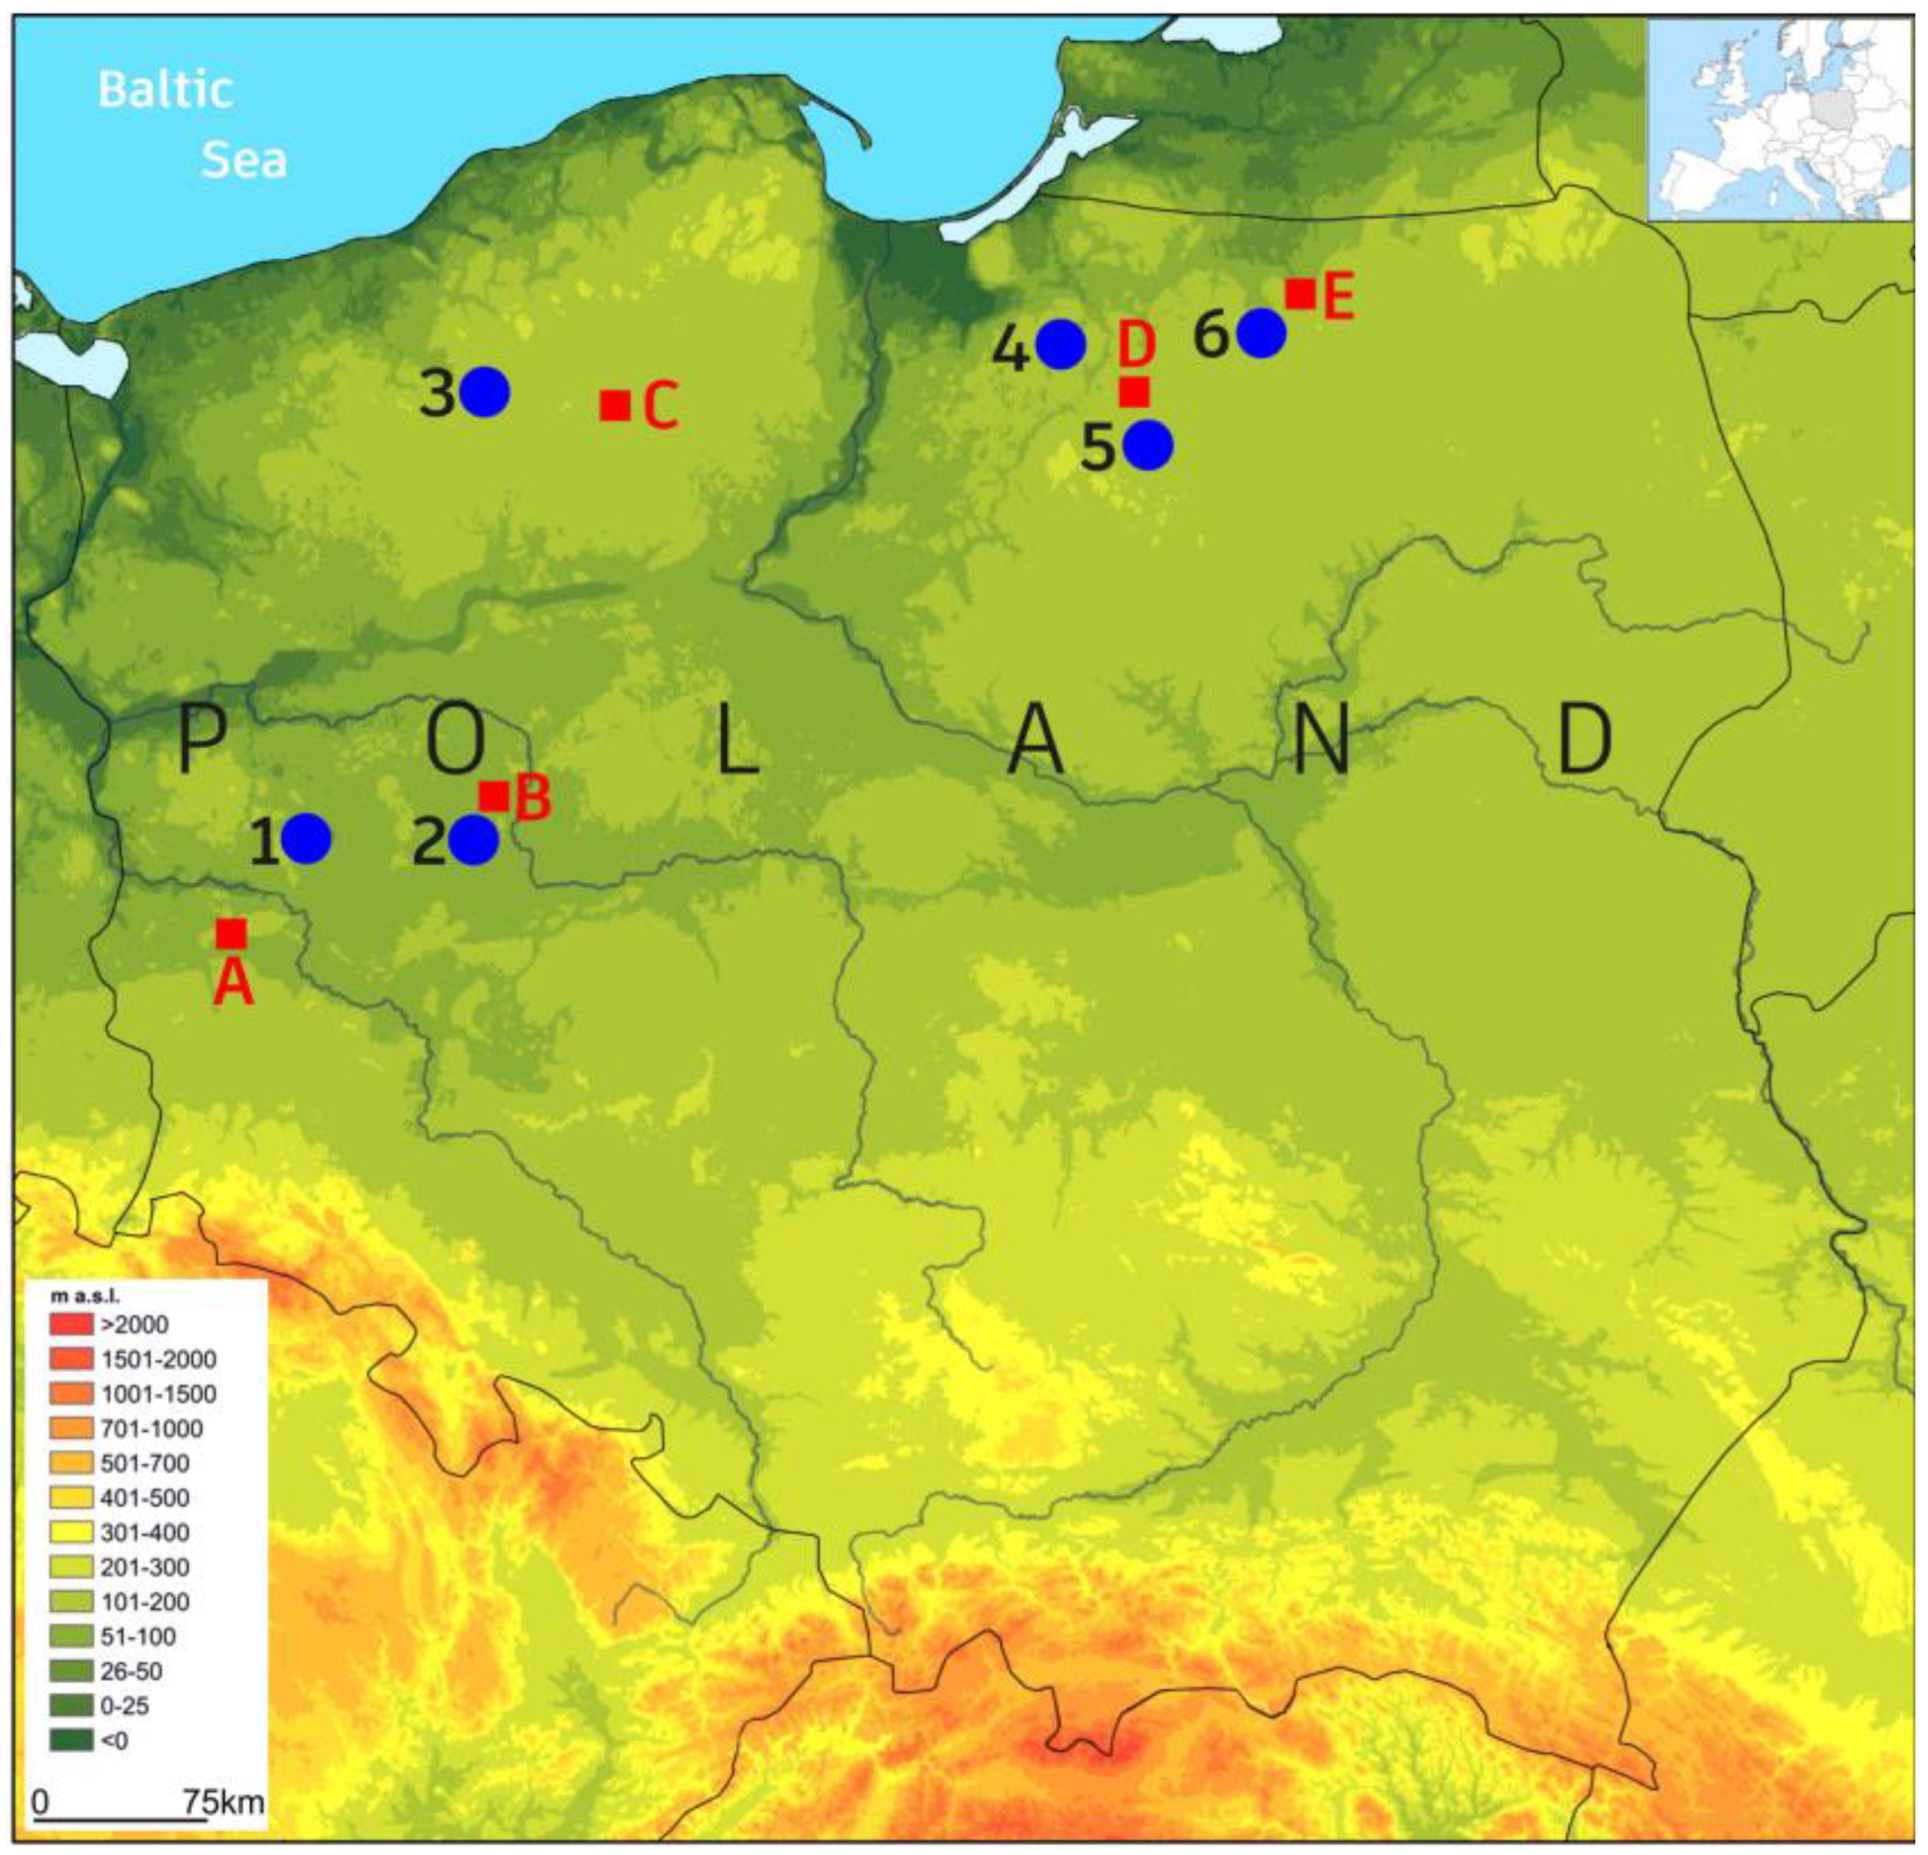
2.1. Study Objects

This study reconstructs the water temperature of six lakes, the field measurements of which had been completed earlier in different periods (Table 1). These lakes are located in different regions of northern Poland (Figure 1). All lakes are of glacial origin, which determines the different morphometric parameters. The surface area ranges from 32.3 to 1754.6 hectares, while the average depth varies from 2.2 to 10.5 m (Table 1).

2.2. Materials

This study utilizes water temperature data collected by the Institute of Meteorology and Water Management. This institution has been conducting systematic hydrological and meteorological measurements and observations in Poland for several decades. Over such a long period, the observational network has undergone changes and reorganizations, with new stations being opened and others closed. The analyzed lakes are an example of the latter situation, where water temperature measurements were discontinued. The measurements were routinely taken at 6 UTC, stationary at a single point. Water temperature was measured daily at a depth of 0.4 m below the surface with an accuracy of 0.1 °C. Additionally, data on air temperature, measured at five meteorological stations, come from the same institution (Figure 1).

2.3. Methods

2.3.1. Air2Water

The LSWT reconstruction covers six lakes for which field measurements were interrupted. The achieved goal was accomplished based on the Air2Water model, using a typical two-phase approach: (1) calibration and validation of the model using periods where LSWT and air temperatures were observed at the same time and (2) retrospective (reconstruction) of LSWT solely based on air temperature when water temperature data were missing. For each lake, the available dataset was divided into two subsets:
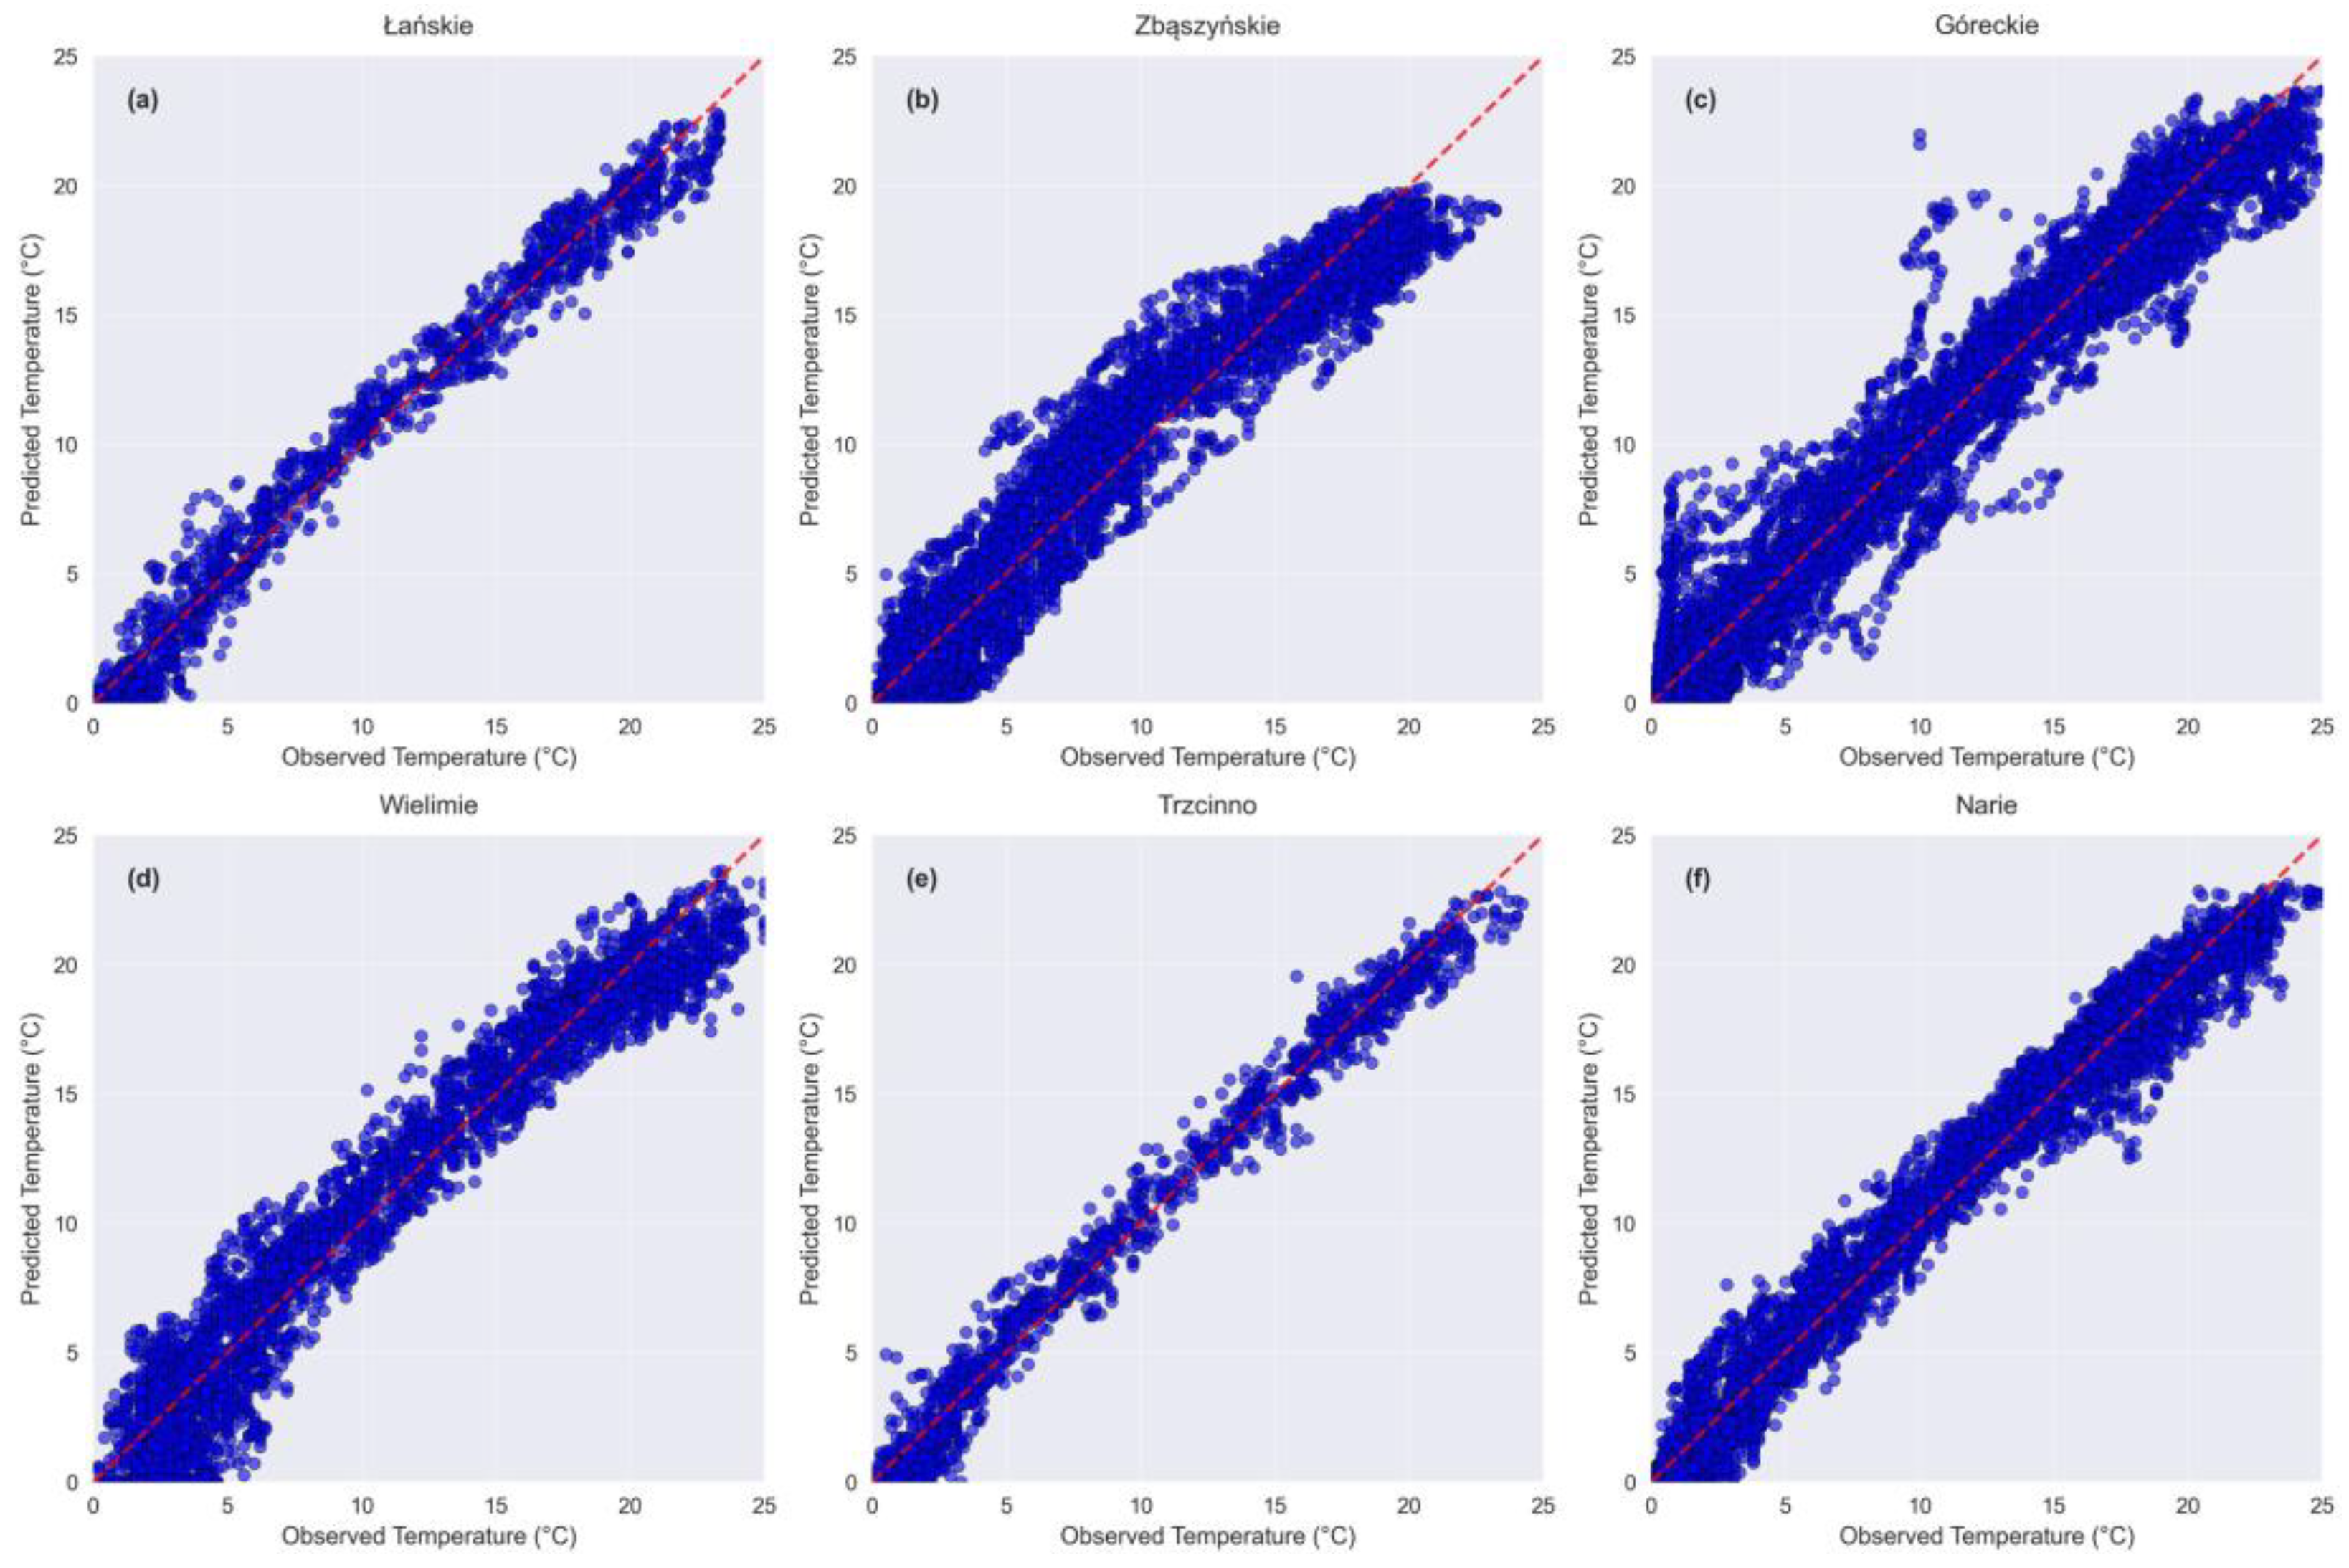
  • The calibration was carried out using data from the first 70% of the observation period.
  • The validation was carried out for the remaining 30% of the time series, where the observed LSWT was compared with the model’s predictions.
This split-sample approach is consistent with the methodology recommended in previous applications of Air2Water [32,33]. After validation, which confirmed the acceptable performance of the model for all lakes, the model was applied to reconstruct the LSWT for periods following the cessation of observations.
This study implements the model using air2waterpy, a Python (3.12) ackage available through PyPI and GitHub (0.03) [34]. The Air2Water model is a lumped-parameter model developed for predicting lake surface water temperature (LSWT) using air temperature and seasonal variations as primary inputs [32]. The implementation utilizes Python version 3.11.8 with essential scientific computing libraries: NumPy version 1.24.3 for numerical computations, SciPy version 1.11.3 for optimization routines, and PySwarms version 1.3.0 for parameter calibration. This model represents a sophisticated approach to simulating lake thermal dynamics, offering a balance between computational efficiency and the physical representation of heat exchange processes.
This lumped-parameter model has been implemented in two configurations, a 6-parameter (6p) and an 8-parameter (8p) version, each suited to different lake characteristics and thermal regimes. The model’s foundation lies in the heat exchange processes between air and water, incorporating seasonal effects and thermal stratification dynamics.
The core of the model is represented by a differential equation that describes the rate of change in water temperature ( T w ) over time. This equation, derived from fundamental heat exchange principles [35], takes the following form:
d T w d t = a 1 + a 2 T a a 3 T w + a 5 c o s ( 2 π ( T t y a 6 ) )
where T w is the water temperature (°C), T h represents the deep water temperature, typically set to 4 °C for deep lakes, T a is the air temperature (°C), T t y is the time of year normalized to a fraction (0 T t y 1), a 1 represents the baseline heat flux, a 2 controls air temperature influence, a 3 governs the system’s thermal inertia, a 4 and a 7 relate to thermal stratification, a 5 and a 6 control seasonal effect model parameters that govern the seasonal component of heat exchange, and a 8 influences winter conditions [33].
In the 8p model, the stability term Δ incorporates a sophisticated representation of thermal stratification [36]. This term varies based on the relationship between surface water temperature ( T w ) and deep water temperature ( T h , typically 4 °C):
= exp T w T h a 4 , T w     T h   exp T h T w a 7 + exp T w a 8   , T w < T h  
The model explicitly accounts for water’s unique density properties through a quadratic relationship centered at 4 °C [37]:
ρ = 1000 ( T w 4 ) 400 2
Parameter calibration employs Particle Swarm Optimization (PSO) [38], which minimizes the mean squared error (MSE) between observed and simulated temperatures.
M S E = 1 N i = 1 N ( T w o b s , i T w s i m , i ) 2
Additional performance metrics include Nash–Sutcliffe Efficiency (NSE) [26]. The optimization process respects physical constraints based on lake characteristics such as mean depth, latitude-dependent solar radiation, and albedo ranges.
The Nash–Sutcliffe Efficiency measures the model’s predictive skill relative to the mean of observed data:
N S E = 1 i = 1 N ( T w o b s , i T w s i m , i ) 2 i = 1 N ( T w o b s , i T w o b s ¯ ) 2
where T w o b s , i is the observed water temperature at time i, T w s i m , i is the simulated water temperature at time i, T w o b s ¯ is the mean of the observed water temperatures, and N is the number of observations. NSE values range from −∞ to 1. An NSE value of 1 indicates perfect agreement between the observed and simulated values, while values close to 0 or negative suggest poor model performance.
The numerical solution implements a fourth-order Runge–Kutta (RK4) method for time integration, ensuring stability and accuracy in temperature predictions. Physical constraints maintain realistic bounds: maximum daily temperature changes are limited to 1 °C [39], the water temperature cannot fall below freezing, and the surface water temperature cannot exceed the air temperature by more than 2 °C [32]. The RK4 steps compute intermediate slopes to estimate the temperature change ( d T w d t ):
k 1 = f T a , T w , T t y , T h , k 2 = f T a + T a 2 T w + k 1 2 , T t y + T t y 2 , T h ,
k 3 = f T a + T a 2 , T w + k 2 2 , T t y + T t y 2 , T h ,   k 4 = f T a , T w + k 3 , T w , T h
T w = k 1 + 2 k 2 + 2 k 3 + k 4 6
The 6p version, suitable for shallow lakes or those with less pronounced stratification, simplifies the stability function by considering only the warm surface water case. This version omits parameters a₇ and a₈, using a single exponential term for all conditions where Tw ≥ Th [40].

2.3.2. Statistical Metrics

To assess the performance of the Air2Water model in reconstructing LSWT, a set of commonly used statistical metrics was employed: mean absolute error (MAE), mean squared error (MSE), root mean squared error (RMSE), relative RMSE (rRMSE), r-squared (R2), the Pearson correlation coefficient, bias, Nash–Sutcliffe Efficiency (NSE), and the index of agreement (IOA). These metrics were selected to capture various aspects of model performance, from average prediction error (MAE and RMSE) to explained variance (R2) and model skill compared to a baseline (NSE). rRMSE and MAE quantify the average magnitude of prediction errors, offering an intuitive sense of how closely the model tracks observed data [32]. RMSE provides a standardized error measure that is useful for comparing across lakes with different temperature ranges. R2 and the correlation coefficient indicate how well the model captures temporal variability and overall trends. However, R2 alone can be misleading if systematic bias is present; therefore, bias and NSE are included to detect consistent under- or over-prediction and to evaluate the model’s skill relative to a naïve predictor (mean of observations) [23,41]. NSE, in particular, is commonly used in hydrology due to its ability to compare predictive power to a reference model that simply uses the observed mean [41]. The IOA complements NSE by offering a normalized measure of agreement that is sensitive to both systematic and random errors [42]. While the IOA has its critics, it remains widely used, particularly in studies where both magnitude and the direction of prediction error are relevant [43]. The combination of these metrics allows for a nuanced evaluation of model accuracy, bias, and robustness across lakes with diverse morphometric and climatic characteristics. This multi-metric approach aligns with best practices in hydrological and environmental modeling [32,43].

2.3.3. Trend Analysis

The analysis of long-term changes in mean monthly and annual lake water temperatures and air temperatures from the period 1994 to 2023 was performed using the non-parametric Mann–Kendall and Sen tests. The purpose of the Mann–Kendall (MK) test [44] was to assess statistically whether there was a monotonic trend in the mean monthly and annual water or air temperature over the period 1994–2023. The MK test is a non-parametric test that assumes the null hypothesis H0, which states that there is no monotonic trend, and the alternative hypothesis, HA, that a monotonic trend is present. If the Z-value is higher than 1.96, this indicates the presence of a significant increasing trend at the 0.05 significance level, while if the Z-value is lower than 1.96, then it is a decreasing trend at the 0.05 significance level. If a trend was significant, the values of the change in air or water temperature over the period 1994–2023 were calculated using Sen’s non-parametric test [45]. Sen’s slope is a non-parametric method used to estimate the slope of time series data, which is defined as the median of the slopes among all pairs of points. The Sen test, in contrast to least squares regression, is robust to outliers and can be used even when the residuals do not have a normal distribution, which is required in least squares regression. The Pettitt test was used to identify potential breakpoints in the mean monthly and mean annual water or air temperatures. The Pettitt test [46] is a non-parametric rank-based statistical test used to detect change points present in a data series. The Pettitt test becomes more advantageous because it can be used to identify the change point present in a data series without the need for prior identification. When a change point was identified in the data series, analysis using the Mann–Kendall and Sen tests was additionally performed for periods before and after the change point had occurred. The Mann–Kendall and Sen tests were performed using the modified mk package in R 3.5.1 developed by Patakamuri and O’Brien [47], while the Pettitt test was performed using the package trend in R 3.5.1 developed by Pohlert [48]. The Mann–Kendall and Pettitt tests were conducted at a significance level of 0.05.

3. Results

The performance of the Air2Water model in reproducing lake surface water temperature (LSWT) was evaluated using multiple statistical metrics, as summarized in Table 2. The results demonstrate consistently high model performance across the six studied lakes, with RMSE values ranging from 0.97 °C to 2.13 °C and Nash–Sutcliffe Efficiency (NSE) values exceeding 0.92 in all cases. The highest accuracy was observed in the Trzcinno and Łańskie lakes, both showing a low RMSE (<1.05 °C), a high R2 (>0.97), and an excellent index of agreement (IOA > 0.99).
Table 2 presents a comprehensive comparison of key validation statistics, including the MAE, RMSE, rRMSE, Bias, R2, correlation, NSE, and IOA for each lake. These results confirm the model’s robustness and suitability for reconstructing LSWT in the absence of in situ data.
The analysis of predicted and observed water temperatures across six Polish lakes demonstrates consistently strong model performance, with some notable variations among lakes. The Trzcinno and Łańskie lakes stand out for their exceptional prediction accuracy, with Trzcinno achieving the lowest RMSE of 0.971 °C and highest R2 value of 0.982, complemented by a high IOA of 0.995. Łańskie follows closely with an RMSE of 1.047 °C and the highest correlation coefficient of 0.990, further confirming the model’s reliability for these lakes. The model’s performance shows some variation across six lakes, with Narie exhibiting the highest prediction errors (RMSE of 2.132 °C and rRMSE of 22.51%). This increased deviation is clearly seen in Figure 2.
However, Narie’s strong R2 value of 0.922 indicates that despite these larger errors, the model accurately reproduces the overall water temperature patterns. A consistent pattern emerges in the bias analysis, revealing a slight underestimation trend across all lakes, with bias values ranging from −0.098 °C in Zbąszyńskie to −0.039 °C in Góreckie. This systematic negative bias suggests an inherent model characteristic rather than lake-specific issues.
The mean absolute error analysis provides further insight into the model’s accuracy, with values ranging from 0.763 °C for Trzcinno to 1.32 °C for Wielimie. These relatively low MAE values, considered within the context of the 0–25 °C temperature range, indicate strong model performance for practical applications. This is further supported by consistently high NSE values exceeding 0.92 across all lakes, with Trzcinno achieving the highest (0.982) and Narie the lowest (0.922).
Temperature dependence in model performance becomes apparent when examining the scatter plots in Figure 2. It generally shows tighter clustering at lower temperatures (0–10 °C) compared to higher temperatures (15–25 °C). This pattern is particularly evident in Góreckie (Figure 2), suggesting that model accuracy varies with temperature range. The IOA values, spanning from 0.980 for Narie to 0.995 for both Trzcinno and Łańskie, along with statistically significant correlations (p-values = 0.000) across all lakes, further confirm the model’s robust performance.
The rRMSE provides valuable insight into the standardized error distribution, ranging from 10.46% for Trzcinno to 22.51% for Narie, with most lakes falling between 15 and 20%. This metric reveals that while absolute errors may be similar, their relative significance varies among lakes, possibly due to differences in mean temperatures or seasonal patterns. The results of the statistical analysis confirm robust model performance across the studied lakes, with particular excellence in Trzcinno and Łańskie and acceptable performance in Narie despite its higher errors. While the consistent negative bias and increased scatter at higher temperatures suggest potential areas for model refinement, the current performance level demonstrates high reliability for practical applications in lake temperature prediction.
To determine the directions of long-term changes in water temperatures in lakes and air temperatures from 1994 to 2023, the Mann–Kendall test was used. The analysis of the average mean annual water temperature changes for each lake studied revealed the existence of an upward trend (Table 3). In all cases, the changes were significant at the 0.01 level.
When considering the monthly average temperatures, for each lake, increasing monotonic trends were confirmed in June and November. In September, increasing trends were identified in five lakes (excluding Lake Wielimie), in August in four lakes (excluding Lake Wielimie and Zbąszyńskie), and in July, the increasing trend of average water temperatures was identified in Lake Góreckie (Table 3). Changes in the average annual air temperatures showed a similar direction. Regarding annual values, all meteorological stations showed significant monotonic increasing trends at the 0.01 level. For monthly average air temperature changes, significant statistical changes were observed for June, September, and November at all stations; in March, they were significant at the Zielona Góra station; in August, at the Poznań and Olsztyn stations; and in December, at the Poznań and Zielona Góra stations. The magnitude of the changes in the average annual water temperatures, described by Sen’s estimator, ranged from 0.17 to 0.30 °C/decade, while the changes in average air temperatures ranged from 0.54 to 0.69 °C/decade (Figure 3). There is an obvious relationship between water temperatures in lakes and air temperatures, but it is modified by groundwater and surface water inflow into the lakes [37].
The trend analysis of annual average water temperatures for the periods 1994–2012 and 2013–2023, based on the identified breakpoints, revealed that significant changes occurred only in the 1994–2012 period for Lake Łańskie, Lake Narie, and Lake Trzcinno, with temperature increases ranging from 0.24 to 0.34 °C/decade (Table 4).
Changes in the average water temperatures in June, September, and November were higher than the changes in the average annual temperatures (Figure 4). In June, the changes ranged from 0.30 to 0.53 °C/decade, in September from 0.27 to 0.52°C/decade, and in November, they were the highest, ranging from 0.31 to 0.64 °C/decade. The changes in the average monthly air temperatures during the same periods were more than twice as high, ranging from 0.87 to 1.12 °C/decade (June), from 0.62 to 0.95 °C/decade (September), and from 0.81 to 1.01 °C/decade (November) (Figure 4). In Figure 4, the Z-values are presented along with the significance thresholds at the 0.05 level, and the Sen’s slope values in °C/decade are also shown. As can be seen in Figure 4, a greater rate of change in air temperatures is observed, as well as a greater variance (range of change) in the magnitude of changes in monthly and annual air temperatures than in water temperatures. The reason for this is the individual characteristics of the lakes, mainly the groundwater supply, which has limited contact with the atmosphere.
The analysis of the annual average air temperature series indicates the presence of a breakpoint in 2013 across all meteorological stations. This could suggest another shift in thermal conditions in Poland, but to confirm this hypothesis, future research should expand the scope to include additional meteorological stations. On the other hand, the analysis of the annual average water temperature series, using the Pettitt test, revealed breakpoints in 2013 for the Zbąszyńskie, Góreckie, and Wielimie lakes. No significant breakpoints were identified for the remaining lakes.

4. Discussion

Proper access to data enables an accurate interpretation of processes at the individual lake level. The problem of a lack of water temperature data in the hydrosphere is being addressed through a variety of methodologies [49,50,51]. The studies presented in this article align with this trend and refer to other studies aimed at obtaining inaccessible thermal data for lakes. In France, deficiencies in in situ water temperature measurements for several hundred lakes were supplemented by combining numerical modeling and satellite data, enriching the thermal data span by over 60 years [52]. Estimating daily average lake surface temperatures was based on air temperature, theoretical solar radiation, and lake size in southwestern Greenland [39]. For Lake Paldang (South Korea), daily average water temperature data were obtained through numerical modeling, analyzing the impact of air temperature changes on water temperature [53]. For the thermokarst lakes, data used for reconstructing water temperature covered the period from 1 January to 31 December 2021, while historical simulations of water temperature utilized air temperature from 1957 to 2022. Surface water warming during this period was 0.21 °C per decade [54]. The XGBoost model was used to reconstruct the historical and predict the future surface water temperature for several lakes in Southeast Asia. The historical analysis revealed warming trends in these lakes [55]. Using air temperature as an input parameter in the Air2Water model to estimate the surface water temperature of Lake Dianchi provided a historical reconstruction of water temperature changes and simulated future trends, offering essential data for ecological studies of the lake environment and water management [56]. The results from the Air2Water model showed good fit with conducted simulations, which formed the basis for determining the direction and trends of water temperature in the analyzed lakes. The analysis covered the last three decades, a period after the recorded changes in the thermal regime of lakes in this part of Europe [29]. The average annual water temperature increase for the lakes discussed in the article was 0.35 °C per decade, consistent with studies from other regions around the world. An analysis of over eighty lakes on the Tibetan Plateau showed a warming of 0.32 °C per decade between 1980 and 2018 [57]. For Vrana Lake (Croatia), the annual average temperature increased by 0.47 °C per decade [58]. The surface water temperature in summer in sub-arctic lakes in Finland rose by 0.41 °C per decade [17]. Annual water temperature trends in subtropical shallow lakes in Brazil were 0.3 °C per decade, in line with air temperature trends [59].
The results obtained indicate a transformation in the thermal regime of the analyzed lakes. Temperature changes, as a fundamental property of water, will determine the course of processes dependent on it. An increase in water temperature will reduce the solubility of gases, with the oxygen concentration being a key factor in both hydrobiological and chemical conditions. Therefore, worsening conditions for the survival of aerobic organisms and the self-purification potential of the water can be expected [60]. An increase in water temperature and nutrient concentrations impacts the growth of algae and water eutrophication [61]. This process poses a primary threat to lakes, and the issue of the reclamation of eutrophic waters is one of the greatest challenges in environmental technologies [62]. Lakes are subject to transformations of a various nature, both natural and man-made [63], and eutrophication threats were identified in all cases analyzed in [64]. Consequently, reducing the degree of degradation or undertaking reclamation efforts, based on the obtained results, should consider the significant increase in water temperature. Importantly, as studies on other lakes in Poland show, this increase is expected to continue in the future [65]. Another issue pertains to the thermal regime of lakes in the context of hydrobiological conditions, where changes may occur in the food web structure or in the course of life processes. Water temperature has an impact on the food web structure of Lake Maggiore (Italy). As the lake warms, the food web shifts toward a higher dominance of predators in the middle trophic positions [66]. The increase in water temperature is also crucial for the functioning of fish fauna [67,68]. The fastest response is expected in the case of shallow lakes, where fish cannot migrate to deeper (cooler) zones. Among the analyzed cases, Lake Wielimie and Lake Zbąszyńskie have an average depth of less than 10 m. Beyond the natural aspect, attention should also be paid to the economic dimension of these changes. As Kangur et al. [69] point out, with global warming, a greater dominance of warm-water fish species in fish communities is expected, which will be reflected in the catch rates. Therefore, the ongoing increase in water temperature will require the adoption of an appropriate strategy in the context of fisheries management. According to Wilkońska [70], the higher water temperature in the lakes had an impact on accelerated growth and maturation rates, non-predatory fish (e.g., roach), and the receding of more cold-hardy predatory species (e.g., pike).

5. Conclusions

One of the fundamental characteristics of lakes is water temperature, which determines the functioning of these ecosystems. However, the overall scope of information regarding this parameter is quite limited, as it pertains to the number of lakes covered by such monitoring, the small number of measurements, and the duration of monitoring. This article utilizes in situ water temperature data from six lakes in Poland, for which no current field measurements are conducted. The use of the Air2water model allowed for its reconstruction based on its correlation with air temperature, resulting in a good fit. Based on the obtained data, trends in water temperature changes were analyzed, revealing a gradual warming of the analyzed lakes, with an average rate of 0.35 °C/decade. The results of these studies should be considered in two stages: firstly, expanding the current knowledge regarding thermal conditions of lakes in Poland, and secondly, establishing a long-term trend of water temperature changes, which should be regarded as unfavorable in relation to the transformation of their properties. The direction, pace, and scale of these transformations are crucial for managing individual lakes, both from an ecological and economic perspective.

Author Contributions

Conceptualization, M.P.; methodology, M.P., T.A. and M.S.; software, T.A. and M.S.; validation, T.A. and M.S.; formal analysis, M.P., T.A. and M.S.; investigation, M.P., T.A. and M.S.; resources, M.P. and K.S.-P.; data curation, M.P. and K.S.-P.; writing—original draft preparation, M.P., T.A., M.S., K.S.-P. and M.Y.J.B.; writing—review and editing, M.P., T.A., M.S., K.S.-P. and M.Y.J.B.; visualization, M.P., T.A. and M.S.; supervision, M.P.; project administration, M.P.; funding acquisition, M.P. All authors have read and agreed to the published version of the manuscript.

Funding

This research received no external funding.

Data Availability Statement

Dataset available on request from the authors.

Conflicts of Interest

The authors declare no conflicts of interest.

References

  1. Huttula, T.; Peltonen, A.; Bilaletdin, Ä.; Saura, M. The effects of climatic change on lake ice and water temperature. Aqua Fenn. 1992, 22, 129–142. [Google Scholar]
  2. Koinig, K.; Schmidt, R.; Woegrath, S.; Tessadri, R.; Psenner, R. Climate Change as the primary cause for pH shifts in a high alpine lake. Water Air Soil Pollut. 1998, 104, 167–180. [Google Scholar] [CrossRef]
  3. Shcherbak, V.I.; Semenyuk, N.Y.; Yakushin, V.M. Phytoplankton structural and functional organization in a large lowland reservoir under conditions of global climate change (case-study of Kaniv Reservoir). Hydrobiol. J. 2022, 58, 3–27. [Google Scholar] [CrossRef]
  4. Salk, K.R.; Venkitswaran, J.J.; Couture, R.; Higgins, S.N.; Paterson, M.J.; Schiff, S.L. Warming combined with experimental eutrophication intensifies lake phytoplankton blooms. Limnol. Oceanogr. 2021, 67, 147–158. [Google Scholar] [CrossRef]
  5. Li, D.; Dorber, M.; Barbarossa, V.; Verones, F. Global characterization factors for quantifying the impacts of increasing water temperature on freshwater fish. Ecol. Indic. 2022, 142, 109201. [Google Scholar] [CrossRef]
  6. Ducharne, A. Importance of stream temperature to climate change impact on water quality. Hydrol. Earth Syst. Sci. 2008, 12, 797–810. [Google Scholar] [CrossRef]
  7. Detmer, T.M.; Parkos, J.J.; Wahl, D.H. Long-term data show effects of atmospheric temperature anomaly and reservoir size on water temperature, thermal structure, and dissolved oxygen. Aquat Sci. 2022, 84, 3. [Google Scholar] [CrossRef]
  8. Ptak, M.; Sojka, M.; Graf, R.; Choiński, A.; Zhu, S.; Nowak, B. Warming Vistula River—The effects of climate and local conditions on water temperature in one of the largest rivers in Europe. J. Hydrol. Hydromech. 2022, 1, 1–11. [Google Scholar] [CrossRef]
  9. Carvalho, L.; Kirika, A. Changes in shallow lake functioning: Response to climate change and nutrient reduction. Hydrobiologia 2003, 506, 789–796. [Google Scholar] [CrossRef]
  10. Attiah, G.; Kheyrollah Pour, H.K.; Scott, K.A. Four decades of lake surface temperature in the Northwest Territories, Canada, using a lake-specific satellite-derived dataset. J. Hydrol. Reg. Stud. 2023, 50, 101571. [Google Scholar] [CrossRef]
  11. Echavarría-Caballero, C.; Domínguez-Gómez, J.A.; González-García, C.; Domínguez-Perez, R.; García-García, M.J. Warming inland water in peninsular Spain revealed by landsat 5 analysis. Geocarto Int. 2024, 39, 2371923. [Google Scholar] [CrossRef]
  12. Woolway, R.I.; Dokulil, M.T.; Marszelewski, W.; Schmid, M.; Bouffard, D. Warming of Central European lakes and their response to the 1980s climate regime shift. Clim. Chang. 2017, 42, 505–520. [Google Scholar] [CrossRef]
  13. Ptak, M.; Sojka, M.; Nowak, B. Effect of climate warming on a change in thermal and ice conditions in the largest lake in Poland—Lake Śniardwy. J. Hydrol. Hydrodyn. 2020, 68, 260–270. [Google Scholar] [CrossRef]
  14. Bal, G.; de Eyto, E. Simple Bayesian reconstruction and forecasting of stream water temperature for ecologists—A tool using air temperature, optionally flow, in a time series decomposition approach. PLoS ONE 2023, 18, e0291239. [Google Scholar] [CrossRef]
  15. Sivakumar, B.; Jayawardena, A.W.; Li, W.K. Hydrologic complexity and classification: A simple data reconstruction approach. Hydrol. Process. 2007, 21, 2713–2728. [Google Scholar] [CrossRef]
  16. Lehmann, A.; Giuliani, G.; Ray, N.; Rahman, K.; Abbaspour, K.; Nativi, S.; Craglia, M.; Cripe, D.; Quevauviller, P.; Beniston, M. Reviewing innovative Earth observation solutions for filling science-policy gaps in hydrology. J. Hydrol. 2014, 518, 267–277. [Google Scholar] [CrossRef]
  17. Noori, R.; Woolway, R.I.; Jun, C.; Bateni, S.M.; Naderian, D.; Partani, S.; Maghrebi, M.; Pulkkanen, M. Multi-decadal change in summer mean water temperature in Lake Konnevesi, Finland (1984–2021). Ecol. Inform. 2023, 78, 102331. [Google Scholar] [CrossRef]
  18. Zhu, S.; Ptak, M.; Choiński, A.; Wu, S. Exploring and quantifying the impact of climate change on surface water temperature of a high mountain lake in Central Europe. Environ. Monit. Assess. 2020, 192, 7. [Google Scholar] [CrossRef]
  19. Herrick, C.; Steele, B.G.; Brentrup, J.A.; Cottingham, K.L.; Ducey, M.J.; Lutz, D.A.; Palace, M.W.; Thompson, M.C.; Trout-Haney, J.V.; Weathers, K.C. lakeCoSTR: A Tool to Facilitate Use of Landsat Collection 2 to Estimate Lake Surface Water Temperatures. Ecosphere 2023, 14, e4357. [Google Scholar] [CrossRef]
  20. Kim, H.I.; Kim, D.; Salamattalab, M.M.; Mahdian, M.; Bateni, S.M.; Noori, R. Machine learning-based modeling of surface water temperature dynamics in arctic lakes. Environ. Sci. Pollut. Res. 2024, 31, 59642–59655. [Google Scholar] [CrossRef]
  21. Joynt, E.H., III; Wolfe, A.P. Paleoenvironmental inference models from sediment diatom assemblages in Baffin Island lakes (Nunavut, Canada) and reconstruction ofsummer water temperatures. Can. J. Fish. Aquat. Sci. 2001, 58, 1222–1243. [Google Scholar] [CrossRef]
  22. Zhang, X.; Wang, K.; Frassl, M.A.; Boehrer, B. Reconstructing Six Decades of Surface Temperatures at a Shallow Lake. Water 2020, 12, 405. [Google Scholar] [CrossRef]
  23. Willard, J.D.; Read, J.S.; Topp, S.; Hansen, G.J.A.; Kumar, V. Daily surface temperatures for 185,549 lakes in the conterminous United States estimated using deep learning (1980–2020). Limnol. Oceanogr. Lett. 2022, 7, 287–301. [Google Scholar] [CrossRef]
  24. Jia, T.F.; Yang, K.; Peng, Z.Q.; Tang, L.F.; Duan, H.M.; Luo, Y. Review on the Change Trend, Attribution Analysis, Retrieval, Simulation, and Prediction of Lake Surface Water Temperature. IEEE J. Sel. Top. Appl. Earth Obs. Remote Sens. 2022, 15, 6324–6355. [Google Scholar] [CrossRef]
  25. Song, S.; Yang, J.; Liu, L.; Bai, G.; Zhou, J.; McKay, D. Lake surface water temperature in China from 2001 to 2021 based on GEE and HANTS. Ecol. Inform. 2024, 84, 102903. [Google Scholar] [CrossRef]
  26. Piccolroaz, S.; Healey, N.; Lenters, J.; Schladow, S.; Hook, S.; Sahoo, G.; Toffolon, M. On the predictability of lake surface temperature using air temperature in a changing climate: A case study for Lake Tahoe (USA). Limnol. Oceanogr. 2018, 63, 243–261. [Google Scholar] [CrossRef]
  27. Heddam, S.; Ptak, M.; Zhu, S. Modelling of Daily Lake Surface Water Temperature from Air Temperature: Extremely Randomized Trees (ERT) versus Air2Water, MARS, M5Tree, RF and MLPNN. J. Hydrol. 2020, 588, 125130. [Google Scholar] [CrossRef]
  28. Jia, T.; Luo, Y. Using Air2water Model to Predict the Water Temperature of Fuxian Lake. In Climate Change and Environmental Sustainability, Advances in Science, Technology & Innovation; He, B.J., Prasad, D., Pignatta, G., Jupesta, J., Eds.; Springer: Cham, Switzerland, 2022. [Google Scholar]
  29. Nowak, B.; Dumieński, G. Znaczenie jezior w gospodarce kraju. Gospod. Wodna 2020, 8, 8–14. [Google Scholar]
  30. Ptak, M.; Sojka, M.; Choiński, A.; Nowak, B. Effect of environmental conditions and morphometric parameters on surface water temperature in Polish lakes. Water 2018, 10, 580. [Google Scholar] [CrossRef]
  31. Choiński, A. Katalog Jezior Polski; Wydawnictwo Naukowe UAM: Poznań, Poland, 2006. [Google Scholar]
  32. Piccolroaz, S.; Toffolon, M.; Majone, B. A simple lumped model to convert air temperature into surface water temperature in lakes. Hydrol. Earth Syst. Sci. 2013, 17, 3323–3338. [Google Scholar] [CrossRef]
  33. Piccolroaz, S. Prediction of lake surface temperature using the air2water model: Guidelines, challenges, and future perspectives. Adv. Oceanogr. Limnol. 2016, 7, 36–50. [Google Scholar] [CrossRef]
  34. He, Y. Air2waterpy: Python Implementation of the Air2Water Model. GitHub. Available online: https://github.com/he134543/air2waterpy (accessed on 3 January 2025).
  35. Piccolroaz, S.; Toffolon, M.; Majone, B. The role of stratification on lakes’ thermal response: The case of L ake S uperior. Water Resour. Res. 2015, 51, 7878–7894. [Google Scholar] [CrossRef]
  36. Toffolon, M.; Piccolroaz, S.; Majone, B.; Soja, A.M.; Peeters, F.; Schmid, M.; Wüest, A. Prediction of surface temperature in lakes with different morphology using air temperature. Limnol. Oceanogr. 2014, 59, 2185–2202. [Google Scholar] [CrossRef]
  37. Thiery, W.; Stepanenko, V.M.; Fang, X.; Jöhnk, K.D.; Li, Z.; Martynov, A.; Perroud, M.; Subin, Z.M.; Darchambeau, F.; Mironov, D.; et al. LakeMIP Kivu: Evaluating the representation of a large, deep tropical lake by lake models. Tellus A Dyn. Meteorol. Oceanogr. 2014, 66, 21390. [Google Scholar] [CrossRef]
  38. Kennedy, J.; Eberhart, R. Particle swarm optimization. In Proceedings of the ICNN’95-International Conference on Neural Networks, Perth, Australia, 27 November–1 December 1995; Volume 4, pp. 1942–1948. [Google Scholar]
  39. Kettle, H.; Thompson, R.; Anderson, N.J.; Livingstone, D.M. Empirical modeling of summer lake surface temperatures in southwest Greenland. Limnol. Oceanogr. 2004, 49, 271–282. [Google Scholar] [CrossRef]
  40. Toffolon, M.; Piccolroaz, S. A hybrid model for river water temperature as a function of air temperature and discharge. Environ. Res. Lett. 2015, 10, 114011. [Google Scholar] [CrossRef]
  41. Nash, J.E.; Sutcliffe, J.V. River flow forecasting through conceptual models part I—A discussion of principles. J. Hydrol. 1970, 10, 282–290. [Google Scholar] [CrossRef]
  42. Legates, D.R.; McCabe, G.J., Jr. Evaluating the use of “goodness-of-fit” measures in hydrologic and hydroclimatic model validation. Water Resour. Res. 1999, 35, 233–241. [Google Scholar] [CrossRef]
  43. Willmott, C.J. On the validation of models. Phys. Geogr. 1981, 2, 184–194. [Google Scholar] [CrossRef]
  44. Kendall, M.G.; Stuart, A. The Advanced Theory of Statistics, 3rd ed.; Charles Griffin Ltd.: Cheshire, UK, 1968. [Google Scholar]
  45. Gilbert, R.O. Statistical Methods for Environmental Pollution Monitorin; Van Nos-trand Reinhold, Co.: New York, NY, USA,, 1987. [Google Scholar]
  46. Pettitt, A.N. A non-parametric approach to the changepoint problem. Appl. Stat. 1979, 28, 126–135. [Google Scholar] [CrossRef]
  47. Patakamuri, S.K.; O’Brien, N. Modified Versions of Mann Kendall and Spearman’s Rho Trend Tests, Version 1.6; 2022. Available online: https://cran.r-project.org/web/packages/modifiedmk/modifiedmk.pdf (accessed on 10 January 2025).
  48. Pohlert, T. Non-Parametric Trend Tests and Change-Point Detection, Version 1.1.6; 2023. Available online: https://cran.r-project.org/web/packages/trend/vignettes/trend.pdf (accessed on 10 January 2025).
  49. Yang, Y.-C.; Lu, C.-Y.; Huang, S.-J.; Yang, T.-Z.; Chang, Y.-C.; Ho, C.-R. On the Reconstruction of Missing Sea Surface Temperature Data from Himawari-8 in Adjacent Waters of Taiwan Using DINEOF Conducted with 25-h Data. Remote Sens. 2022, 14, 2818. [Google Scholar] [CrossRef]
  50. Huang, F.; Qian, B.; Ochoa, C.G. Long-term river water temperature reconstruction and investigation: A case study of the Dongting Lake Basin, China. J. Hydrol. 2023, 616, 128857. [Google Scholar] [CrossRef]
  51. Ptak, M.; Zhu, S.; Amnuaylojaroen, T.; Li, H.; Szyga-Pluta, K.; Jiang, S.; Wang, L.; Sojka, M. Utilizing Multi-Source datasets for the Reconstruction and Prediction of water temperature in Lake Miedwie (Poland). Remote Sens. 2024, 16, 2753. [Google Scholar] [CrossRef]
  52. Sharaf, N.; Prats, J.; Reynaud, N.; Tormos, T.; Bruel, R.; Peroux, T.; Danis, P.-A. A long-term dataset of simulated epilimnion and hypolimnion temperatures in 401 French lakes (1959–2020). Earth Syst. Sci. Data 2023, 15, 5631–5650. [Google Scholar] [CrossRef]
  53. Yu, S.J.; Ryu, I.G.; Park, M.J.; Im, J.K. Long-term relationship between air and water temperatures in Lake Paldang, South Korea. Environ. Eng. Res. 2021, 26, 200177. [Google Scholar] [CrossRef]
  54. Zhang, C.; Gao, Z.; Luo, J.; Liu, W.; Chen, M.; Niu, F.; Wang, Y.; Shang, Y. Simulation and Prediction of Thermokarst Lake Surface Temperature Changes on the Qinghai–Tibet Plateau. Remote Sens. 2024, 16, 4645. [Google Scholar] [CrossRef]
  55. Virdis, S.G.P.; Kongwarakom, S.; Juneng, L.; Padedda, B.M.; Shrestha, S. Historical and projected response of Southeast Asian lakes surface water temperature to warming climate. Environ. Res. 2024, 247, 118412. [Google Scholar] [CrossRef]
  56. Duan, H.; Shang, C.; Yang, K.; Luo, Y. Dynamic Response of Surface Water Temperature in Urban Lakes under Different Climate Scenarios—A Case Study in Dianchi Lake, China. Int. J. Environ. Res. Public Health 2022, 19, 12142. [Google Scholar] [CrossRef]
  57. Shi, Y.; Huang, A.; Wu, Y.; Lazhu Wen, L. Trends of Summer Lake Surface Water Temperature on the Tibetan Plateau and Their Response to Climate Change. Earth Space Sci. 2024, 11, e2024EA003910. [Google Scholar] [CrossRef]
  58. Brkić, Ž. Increasing water temperature of the largest freshwater lake on the Mediterranean islands as an indicator of global warming. Heliyon 2023, 9, e19248. [Google Scholar] [CrossRef]
  59. Tavares, M.H.; Cardoso, M.A.; Motta Marques, D.; Bonnet, M.-P.; Fragoso, C.R. High Spring Warming Rates in an Extensive Subtropical Shallow Lakes System Detected Using MODIS Imagery. ACS EST Water 2024, 4, 1518–1530. [Google Scholar] [CrossRef]
  60. Ptak, M.; Nowak, B. Variability of oxygen-thermal conditions in selected lakes in Poland. Ecol. Chem. Eng. S 2016, 23, 639–650. [Google Scholar] [CrossRef]
  61. Sharabian, M.N.; Ahmad, S.; Karakouzian, M. Climate Change and Eutrophication: A Short Review. Eng. Technol. Appl. Sci. Res. 2018, 8, 3668–3672. [Google Scholar] [CrossRef]
  62. Gajewska, M.; Plichta, K. Nowe metody rekultywacji wód powierzchniowychna przykładzie jezior w Polsce. Inżynieria Morska I Geotechnika 2009, 1, 1. [Google Scholar]
  63. Ptak, M.; Choiński, A.; Strzelczak, A.; Targosz, A. Disappearance of Lake Jelenino since the end of the XVIII century as an effect of anthropogenic transformations of the natural environment. Pol. J. Environ. Stud. 2013, 22, 191–196. [Google Scholar]
  64. Informatyczny System Osłony Kraju, Hydroportal. Available online: https://hydroportal.pl/ (accessed on 10 February 2025).
  65. Ptak, M.; Amnuaylojaroen, T.; Sojka, M. Seven decades of surface temperature changes in central European lakes. What’s next? Resources 2024, 13, 149. [Google Scholar] [CrossRef]
  66. Tanentzap, A.J.; Morabito, G.; Volta, P.; Rogora, M.; Yan, N.D.; Manca, M. Climate warming restructures an aquatic food web over 28 years. Glob. Chang. Biol. 2020, 26, 6852–6866. [Google Scholar] [CrossRef]
  67. Goyer, K.; Bertolo, A.; Pépino, M.; Magnan, P. Effects of lake warming on behavioural thermoregulatory tactics in a cold-water stenothermic fish. PLoS ONE 2014, 9, e92514. [Google Scholar] [CrossRef]
  68. Jabbari, A.; Boegman, L.; Molot, L.A. Modeling future dissolved oxygen and temperature profiles in small temperate lake trout lakes. Aquat. Sci. 2025, 87, 8. [Google Scholar] [CrossRef]
  69. Kangur, K.; Tammiksaar, E.; Pauly, D. Using the “mean temperature of the catch” to assess fish community responses to warming in a temperate lake. Environ. Biol. Fish. 2022, 105, 1405–1413. [Google Scholar] [CrossRef]
  70. Wilkońska, H. The effect of heated water discharge in the Konin lakes (Poland) on their ichtiofauna. Ekol. Pol. 1988, 36, 145–164. [Google Scholar]
Figure 1. Location of study objects: 1—Lake Zbąszyńskie, 2—Lake Góreckie, 3—Lake Wielimie, 4—Lake Narie, 5—Lake Łańskie, 6—Lake Trzcinno. Meteorological station: A—Zielona Góra, B—Poznań, C—Chojnice, D—Olsztyn, E—Kętrzyn.
Resources 14 00067 g001
Figure 2. Scatter plots of predicted and observed water temperatures lakes in Poland: Łańskie (a), Zbąszyńskie (b), Góreckie (c), Wielimie (d), Trzcinno (e), and Narie (f) (red color—line of perfect alignment of modeling results with in situ measurement results).
Resources 14 00067 g002
Figure 3. Changes in mean yearly water and air temperatures in the period of 1994–2023: (a) Lake Zbąszyńskie vs. Zielona Gora, (b) Lake Góreckie vs. Poznan, (c) Lake Wielimie vs. Chojnice, (d) Lake Narie vs. Olsztyn, (e) Lake Łańskie vs. Olsztyn, and (f) Lake Trzcinno vs. Ketrzyn.
Resources 14 00067 g003
Figure 4. Changes in mean monthly and mean annual water temperatures (a) and air temperatures (b) (when Z-values are higher than 1.96, it indicates a significant increasing trend).
Resources 14 00067 g004
Table 1. Morphometric parameters of the analyzed lakes [31]. Numbering of lakes according to Figure 1.
LakeArea [ha]Depth [m]Volume [Million m3]m a.s.l.In Situ Measurements LSWT
MaxMean
1Zbąszyńskie742.59.63.526.152.81973–1990
2Góreckie104.117.29.09.366.31972–1992
3Wielimie1754.65.52.240.1132.71973–1983
4Łańskie1042.053.016168.0134.71972–1976
5Narie1240.043.09.8124.0104.01972–1992
6Trzcinno32.332.210.53.0109.01972–1976
Table 2. Validation statistical analysis of predicted water temperature.
Lake
MetricZbąszyńskieGóreckieNarieTrzcinnoWielimieŁańskie
MAE1.2861.230.8460.7631.320.812
MSE2.6522.8384.5470.9432.7371.097
RMSE1.621.682.130.971.651.04
rRMSE (%)18.8315.8822.5110.4615.4611.21
R20.9410.9520.9220.9820.9440.979
Correlation0.9700.9760.9610.9910.9720.990
p-value0.0000.0000.0000.0000.0000.000
Bias−0.098−0.039−0.071−0.083−0.075−0.048
NSE 0.9520.9220.9820.9440.979
IOA 0.9880.980.9950.9860.995
Table 3. Results of the trend analysis of average monthly and annual water temperatures in lakes from 1994 to 2023 (significant changes are highlighted in bold black font and non-significant changes in grey font).
LakePeriodSTauZ-Valuep-ValueSen’s Slope
(°C.Decade−1)
LakePeriodSTauZ-Valuep-ValueSen’s Slope (°C.Decade−1)
ZbąszyńskieJan880.2171.630.1030.10GóreckieJan840.2071.560.1190.28
Feb250.0620.450.6530.04 Feb240.0590.430.6660.09
Mar980.2411.820.0690.18 Mar880.2171.630.1030.26
Apr280.0690.510.6130.10 Apr320.0790.580.5610.10
May−48−0.118−0.880.378−0.07 May−14−0.034−0.240.807−0.04
Jun1500.3692.790.0050.30 Jun1600.3942.980.0030.41
Jul1300.3202.420.0160.23 Jul1310.3232.440.0150.23
Aug660.1631.220.2230.13 Aug1180.2912.190.0280.26
Sep1320.3252.460.0140.27 Sep1460.3602.720.0070.32
Oct640.1581.180.2370.18 Oct1000.2461.860.0630.25
Nov1680.4143.130.0020.31 Nov1780.4383.320.0010.41
Dec900.2221.670.0950.16 Dec960.2361.780.0750.30
Yearly mean1820.4483.400.0010.17 Yearly mean2040.5023.810.0000.25
WielimieJan760.1871.410.1590.47NarieJan900.2221.670.0950.17
Feb320.0790.580.5610.16 Feb140.0340.240.8070.04
Mar870.2141.610.1070.39 Mar880.2171.630.1030.34
Apr420.1030.770.4420.12 Apr360.0890.660.5110.12
May−21−0.052−0.380.707−0.08 May−4−0.010−0.060.955−0.02
Jun1320.3252.460.0140.53 Jun1340.3302.490.0130.45
Jul570.1401.050.2930.18 Jul700.1721.290.1960.27
Aug520.1280.960.3390.23 Aug1260.3102.340.0190.37
Sep1000.2461.860.0630.38 Sep1180.2912.190.0280.45
Oct780.1921.440.1490.33 Oct760.1871.410.1590.28
Nov1760.4333.280.0010.64 Nov1580.3892.950.0030.50
Dec720.1771.330.1830.43 Dec620.1531.140.2530.30
Yearly mean1800.4433.360.0010.30 Yearly mean2060.5073.850.0000.26
ŁańskieJan700.1721.290.1960.23TrzcinnoJan750.1851.390.1650.22
Feb180.0440.320.7500.04 Feb380.0940.690.4880.13
Mar840.2071.560.1190.31 Mar920.2271.710.0880.42
Apr340.0840.620.5360.15 Apr280.0690.510.6130.09
May60.0150.090.9250.03 May−3−0.007−0.040.970−0.01
Jun1400.3452.610.0090.50 Jun1260.3102.340.0190.47
Jul620.1531.140.2530.24 Jul580.1431.070.2850.22
Aug1220.3002.270.0230.41 Aug1120.2762.080.0370.36
Sep1300.3202.420.0160.46 Sep1300.3202.420.0160.52
Oct760.1871.410.1590.30 Oct900.2221.670.0950.30
Nov1640.4043.060.0020.54 Nov1340.3302.490.0130.54
Dec720.1771.330.1830.35 Dec720.1771.330.1830.34
Yearly mean2120.5223.960.0000.30 Yearly mean2220.5474.150.0000.29
Table 4. Results of the trend analysis of mean annual water temperatures for the studied lakes in the periods 1994–2012 and 2013–2023.
NoLake1994–20122013–2023
Sen’s Slope
(°C per Decade)
p-ValueSen’s Slope
(°C per Decade)
p-Value
1Zbąszyńskie0.130.1980.050.858
2Góreckie0.200.0690.061.000
3Wielimie0.180.2250.030.858
4Łańskie0.240.0340.020.858
5Narie0.260.0340.001.000
6Trzcinno0.340.0090.200.721
Disclaimer/Publisher’s Note: The statements, opinions and data contained in all publications are solely those of the individual author(s) and contributor(s) and not of MDPI and/or the editor(s). MDPI and/or the editor(s) disclaim responsibility for any injury to people or property resulting from any ideas, methods, instructions or products referred to in the content.

