Article

A Decision Support System for Managed Aquifer Recharge Through Non-Conventional Waters in the South of the Mediterranean

1
Laboratoire d’Erémologie et de LCD (LR16IRA01), Institut des Régions Arides (IRA), Médenine 4119, Tunisia
2
Département Hydraulique, Ecole Supérieure d’Ingénieurs de Mjez el Beb (ESIM), Béja 9070, Tunisia
3
Dipartimento di Scienze e Tecnologie Agrarie, Alimentari, Ambientali e Forestali (DAGRI), Università degli Studi di Firenze (UNIFI), 50121 Firenze, Italy
4
Environmental Governance and Territorial Development Hub (GEDT), University of Geneva, 1205 Genève, Switzerland
5
UNESCO Chair in Hydropolitics, University of Geneva, 1205 Genève, Switzerland
6
Société Nationale d’Exploitation et de Distribution des Eaux (SONEDE), Médenine 4100, Tunisia
7
Commissariat Régional au Développement Agricole (CRDA), Médenine 4100, Tunisia
*
Author to whom correspondence should be addressed.
Resources 2025, 14(4), 63; https://doi.org/10.3390/resources14040063
Submission received: 24 January 2025 / Revised: 9 March 2025 / Accepted: 21 March 2025 / Published: 11 April 2025

Abstract

:
Water management in arid regions faces significant challenges due to limited water resources and increasing competition among sectors. Climate change (CC) exacerbates these issues, highlighting the need for advanced modeling tools to predict trends and guide sustainable resource management. This study employs Water Evaluation And Planning (WEAP) software to develop a Decision Support System (DSS) to evaluate the impact of climate change and water management strategies on the Triassic aquifer of “Sahel El Ababsa” in southeast Tunisia up to 2050. The reference scenario (SC0) assumes constant climatic and socio-economic conditions as of 2020. CC is modeled under RCP4.5 (SC1.0) and RCP8.5 (SC2.0). Additional scenarios include Seawater Desalination Plants (SDPs) (SC3.0 and SC4.0), water harvesting techniques (SC5.0) to highlight their impact on the recharge, and irrigation management strategies (SC6.0). All these scenarios were further developed under the “SC1.0” scenario to assess the impact of moderate CC. The initial aquifer storage is estimated at 100 Million cubic meters (Mm3). Under (SC0), storage would decrease by 76%, leaving only 23.7 Mm3 by 2050. CC scenarios (SC1.0, SC2.0) predict about a 98% reduction. The implementation of the Zarat SDP (SC3.0) would lead to a 45% improvement compared to reference conditions by the end of the simulation period, while its extension (SC4.0) would result in a 69.5% improvement. Under moderate CC, these improvements would be reduced, with SC3.1 showing a 59% decline and SC4.1 a 35% decline compared to the reference scenario. The WHT scenario (SC5.0) demonstrated a 104% improvement in Triassic aquifer storage by 2050 compared to the reference scenario. However, under CC (SC5.1), this improvement would be partially offset, leading to a 29% decline in aquifer storage. The scenario maintaining stable agricultural demand from the Triassic aquifer under CC (SC6.1) projected an 83% decrease in storage. Conversely, the total “Irrigation Cancellation” scenario (SC7.1) under CC showed a significant increase in aquifer storage, reaching 59.3 Mm3 by 2050—an improvement of 250% compared to the reference scenario. The study underscores the critical need for alternative water sources for irrigation and integrated management strategies to mitigate future water scarcity.

1. Introduction

At the beginning of this century, the Global Water Partnership (GWP) [1] put forward the concept of Integrated Water Resources Management (IWRM) as part of the sustainable development defined by the World Commission on Environment and Development. The GWP defined the IWRM as “a process that promotes the coordinated development and management of water, land, and related resources, in order to maximize the resultant economic and social welfare in an equitable manner without compromising the sustainability of vital ecosystems” [1,2,3]. IWRM considers the complex interactions among various physical, environmental, socio-economic, political, and legal components. It is essential for ensuring the sustainability of water resources and, consequently, the sustainability of national development.
Despite its widespread adoption, IWRM has faced criticism for being too broad and lacking clear implementation strategies. For instance, Falkenmark [4] emphasized the importance of integrating environmental considerations and ecosystem dynamics into water management strategies, while Biswas [5] critiqued the broadness of the IWRM concept, arguing that its implementation often lacks specific strategies tailored to local contexts. Similarly, Claassen [6] highlighted the need for adaptive approaches in IWRM to address dynamic socio-economic and environmental conditions. In response to these critiques, the recent literature emphasizes the importance of adopting a more adaptive approach to overcome the limitations of traditional IWRM frameworks [2]. Adaptive IWRM recognizes that rigid, one-size-fits-all frameworks may not be suitable for diverse water management contexts and instead promotes locally tailored strategies that evolve with changing conditions.
In regions characterized by semi-arid and arid climates, water management faces many challenges, mainly due to the inherent scarcity of water resources. The aridity of the landscape exacerbates pressure on already limited sources of fresh water, intensifying competition between different sectors for access to this precious resource. In these regions, surface water resources are typically scarce, making groundwater the primary water source [7,8]. The impacts of climate change on precipitation variability further exacerbate pressure on groundwater resources, particularly in these areas [9].
Climate change further compounds the pressure on groundwater resources by increasing precipitation variability, particularly in arid and semi-arid areas [9,10]. These changes highlight the urgent need for robust modeling tools to assess water availability, predict future trends, and inform sustainable resource allocation strategies.
Given these challenges, there is a growing need for sophisticated modeling tools to accurately assess water availability, predict future trends, inform about sustainable resource allocation strategies and manage groundwater sustainably in these regions. IWRM models offer valuable tools for understanding the complex interactions between surface water and groundwater systems, as well as the socio-economic factors influencing water use. By incorporating hydrological, environmental, and socio-economic data, IWRM models can assist policymakers and stakeholders in making informed decisions concerning water allocation, conservation measures, and risk mitigation strategies. Implementing these models can enhance the resilience of water management practices in semi-arid and arid climates, ensuring the long-term sustainability of groundwater resources for both current and future generations [11,12,13,14,15,16].
Various models have been developed to address these challenges. For example, MODFLOW, developed by the U.S. Geological Survey (USGS), is a widely used numerical model for simulating groundwater flow [17,18], while SWAT (Soil and Water Assessment Tool) [19] emphasizes watershed-scale hydrology and land-use impacts. However, for this study, the Water Evaluation And Planning System (WEAP) was chosen due to its comprehensive capabilities in integrating hydrological, environmental, and socio-economic data, as well as its ability to evaluate a wide range of water development and management options while accounting for multiple and competing uses of water systems [20]. Moreover, the region already features a decision support system (DSS) for another key water resource, Zeuss Koutine, making the use of WEAP a complementary approach that reinforces the previous study and provides a more integrated understanding of regional water dynamics.
The WEAP model has been applied in numerous studies across the world for many years. A. Al-Omari et al. [21] developed a water management support system for the Amman Zarqa Basin in Jordan using the WEAP model. The model was calibrated, validated, and run with four scenarios. Hollermann et al. [22] used WEAP to analyze Benin’s future water situation under different scenarios of socio-economic development and climate change. Mounir et al. [23] developed a WEAP model to assess future water demands in the Niger River (in the Niger Republic). Abera Abdi and Ayenew [24] studied the subbasin hydrologic behaviors of the Ketar subbasin in the main Ethiopian Rift Valley basin. Dimova et al. [25] applied two modern tools, the System of Economic and Environmental Accounts for Water (SEEAW) and the WEAP, to assess holistically the available water resources and the socio-economic water needs within the Vit River catchment in Bulgaria. Vonk et al. [26] studied an adapting multi-reservoir (dam) operation to reduce the potential impacts of climate change and regional socio-economic developments for the Xinanjiang-Fuchunjiang reservoir cascade, located in Hangzhou Region (China). Li et al. [27] analyzed the future water situation in the The Binhai New Area in China, by setting different scenarios of social development and urbanization, and used WEAP to evaluate the sustainability of limited water resources management strategies. Yaqob et al. [28] applied the WEAP model in evaluating and analyzing the existing balance and the role of treated wastewater. The model anticipated future scenarios for the management of water resources in the Nablus and Tulkarm watersheds in Palestine. Shahraki et al. [29] studied water resources management under environmental scenarios using the WEAP model in the Hirmand catchment in Iran. They applied dust stabilization and animal–plant sustainable ecosystem scenarios and their economic assessment. Al-Mukhtar and Mutar [30] used WEAP to identify the optimal water allocation among the domestic, agricultural, and industrial sectors of Baghdad city under present and potential future scenarios. Hadded et al. [31] developed a decision support system (DSS) for the groundwater management of the Zeuss Koutine aquifer in southeastern Tunisia using the WEAP-MODFLOW framework. The DSS was used to simulate the behavior of the studied aquifer and the hydraulic system of the governorate of Médenine under different water management scenarios. Hadded et al. [32] described the impact of different climate change scenarios on the Zeuss Koutine aquifer hydraulic heads and storage capacity. Lima-Quispe [33] developed an integrated modeling framework in WEAP to estimate the water balance of Lake Titicaca (South America), accurately simulating water levels by considering upstream inflows, precipitation, evaporation, and downstream outflows, showing that lake fluctuations are primarily driven by precipitation and evaporation rather than snow, ice, or irrigation withdrawals.
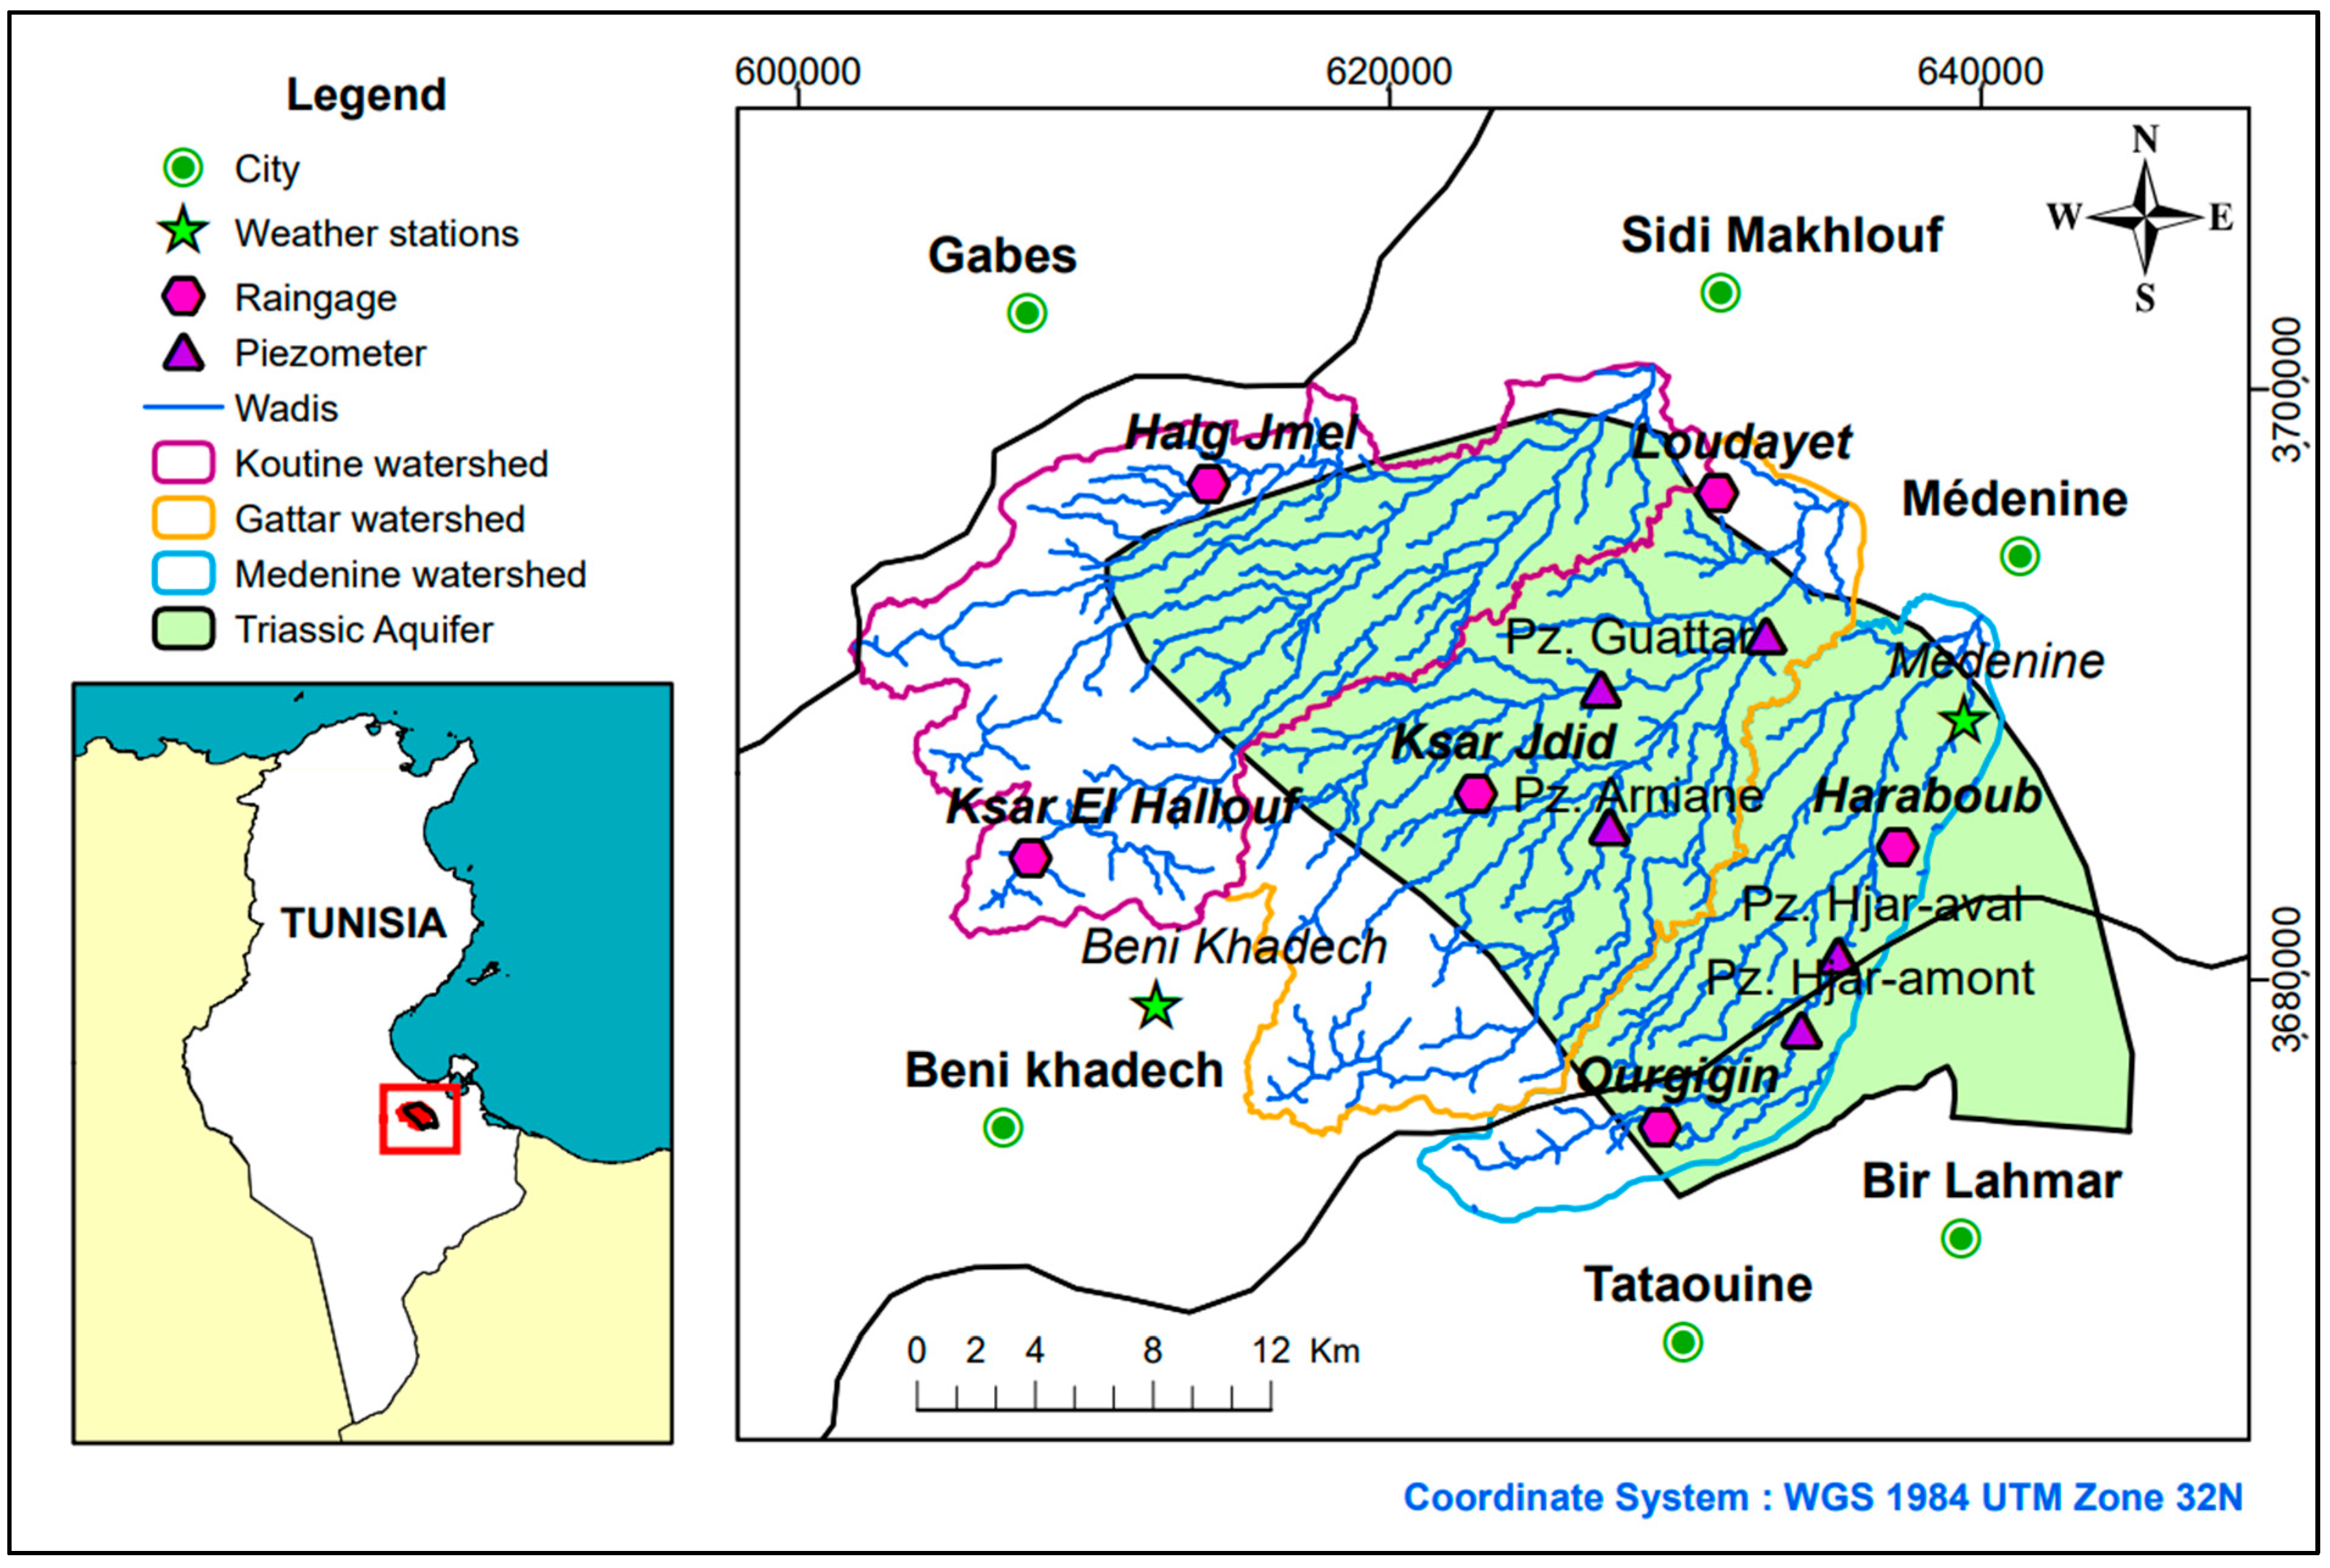
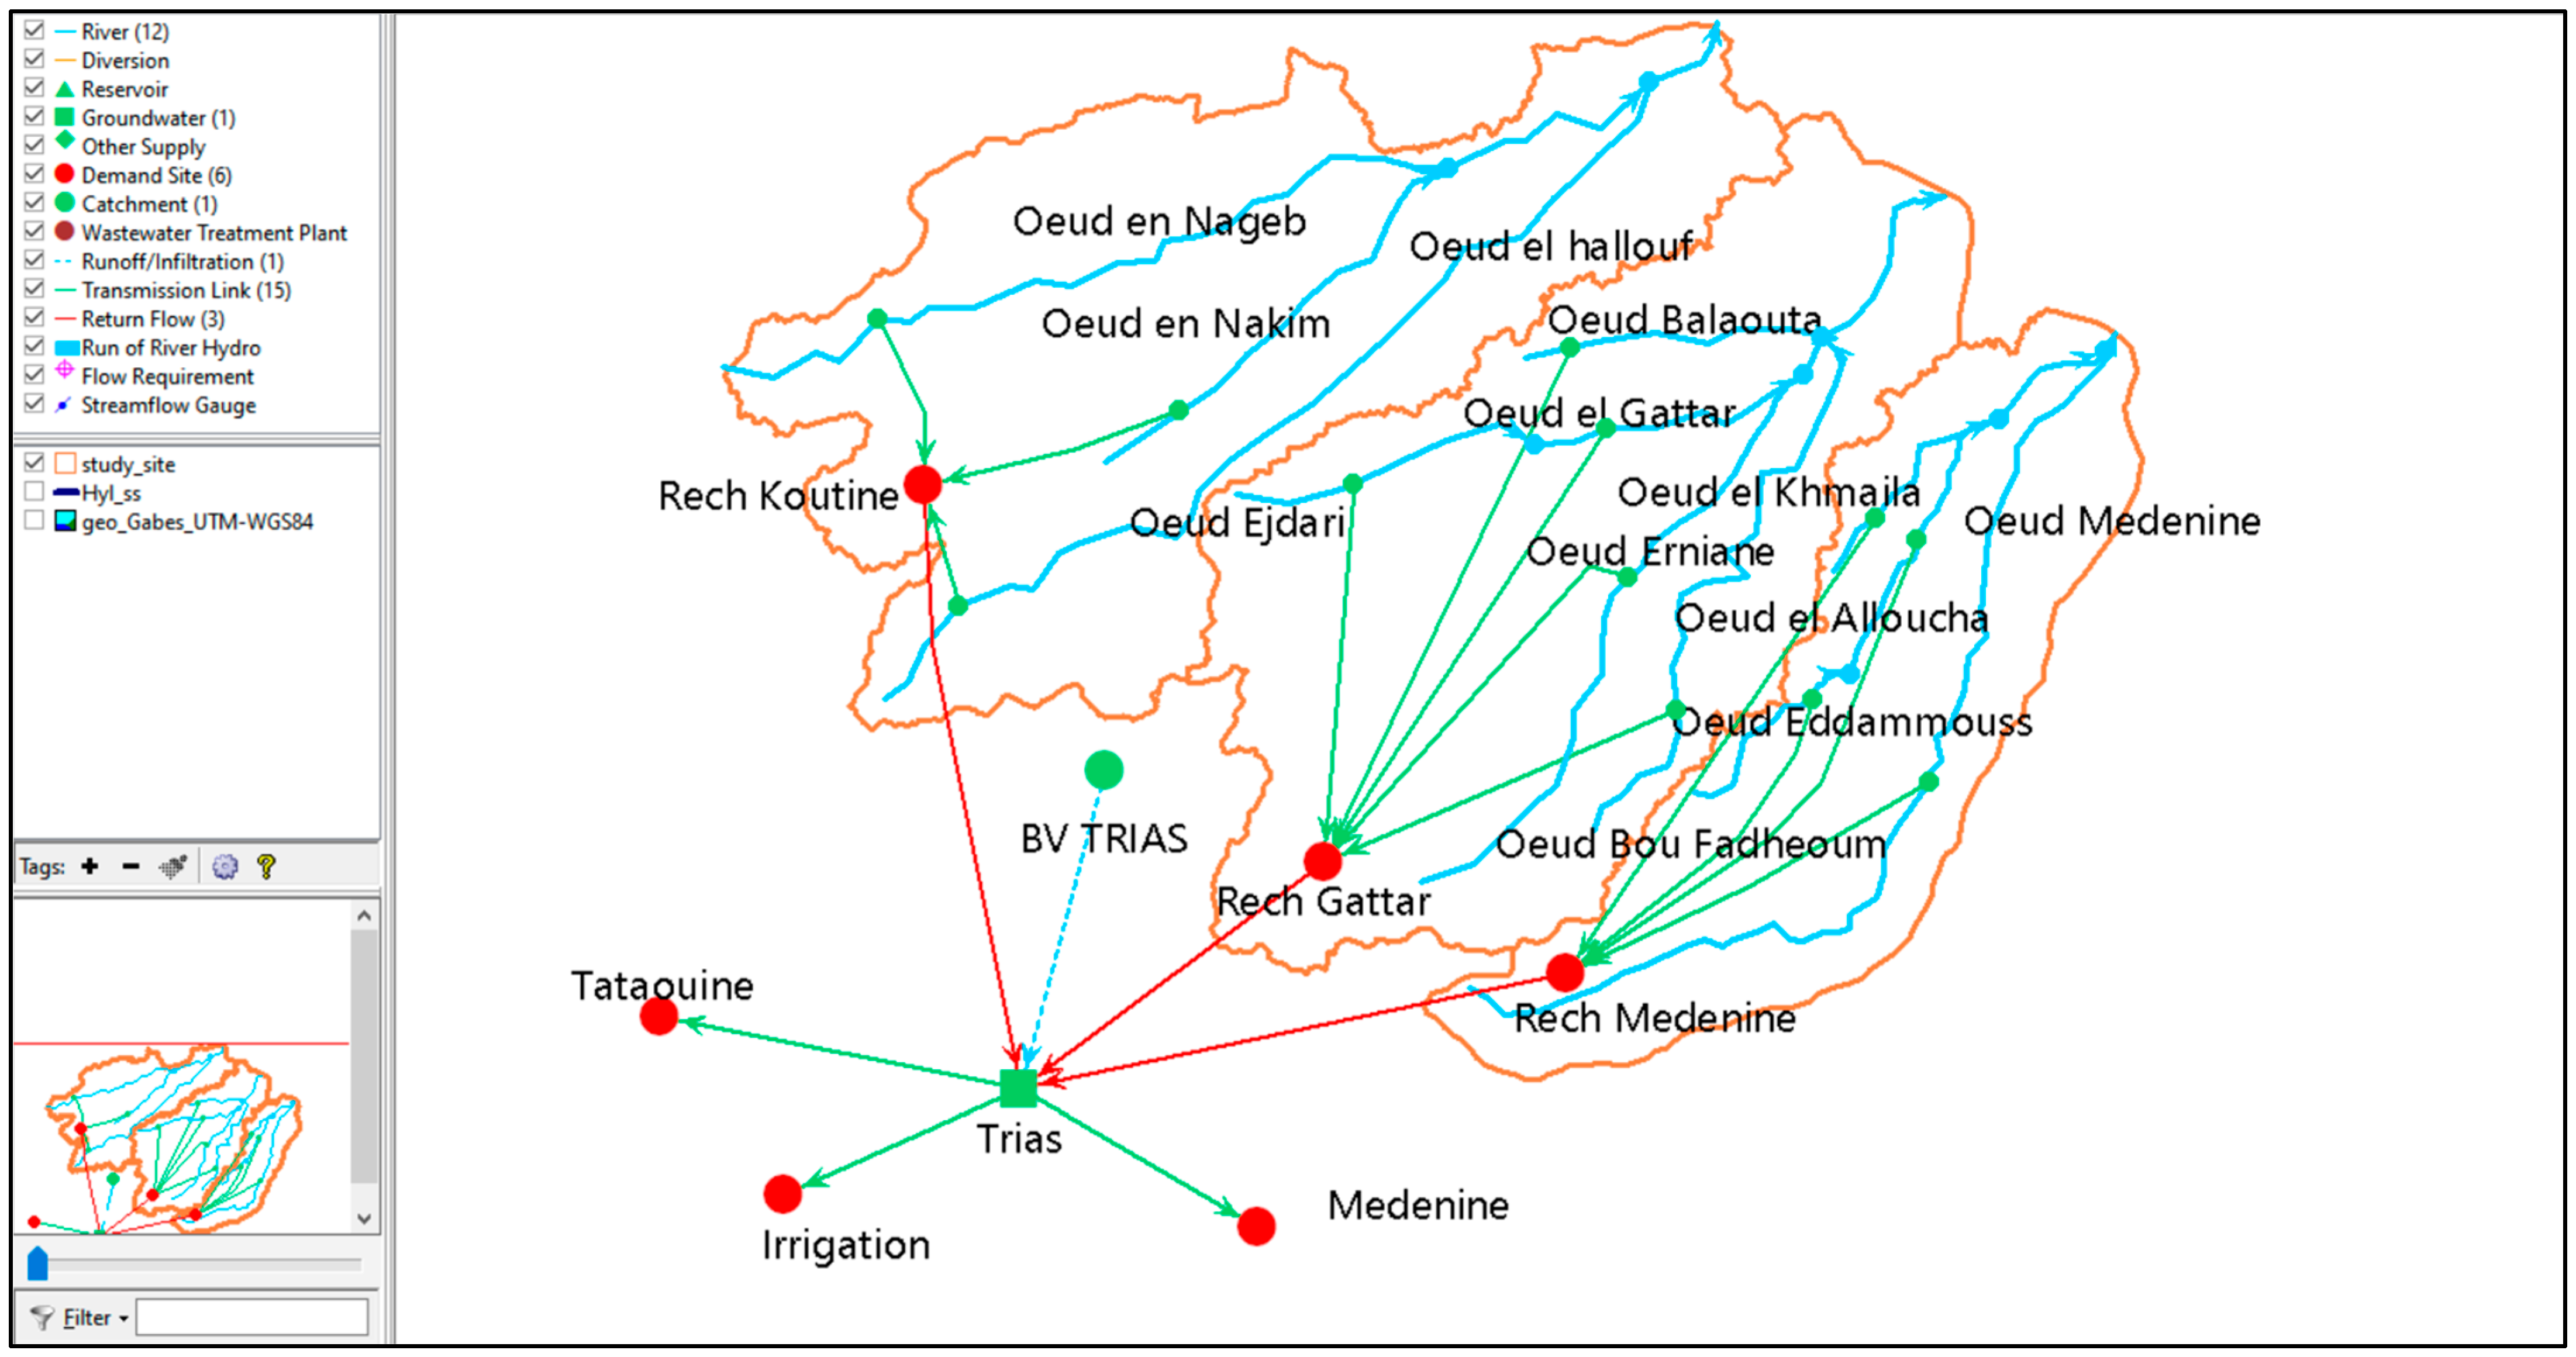
Recent decades, population growth, rapid urbanization, improved water supply, and the convergence of coastal zones to mainly tourist destinations have made the governorate of Médenine in southern Tunisia face great water management challenges, especially with the scarcity of water resources in such arid climate conditions. The improvement in water supply was accompanied by a gradual and unlimited increase in demand up to the present. The study site is the extent of the Triassic sandstone aquifer of Sahel El Ababsa, located in the west of Médenine city, which is part of the Tunisia southeastern region. The area of the aquifer is shared by three main watersheds: Koutine, Gattar, and Médenine (also called Hjar) watersheds. The study area belongs entirely to the coastal plain of Jeffara of Médenine. It is characterized by an arid climate. Given the scarcity of precipitation, groundwater resources represent the main water resource of the cities of the governorate of Médenine. The hydro-system of Médenine relies mainly on the Zeus-Koutine aquifer and secondly on the Triassic aquifer as groundwater resources. In order to solve the water scarcity in the study area, it is important to improve water use efficiency through optimizing water resource management.
Since 1990, the Tunisian government has launched a strategy for water and soil conservation. The main used structures in the study area are the traditional runoff water harvesting techniques (WHT) called Jessour and Tabias. The Jessour consists of a number of Jessr, which is a hydraulic unit installed at the talwegs of valleys, mountainous, and gentle slope areas. The Jessr is used not only to allow the retention of runoff water and sediments, but also to create rich agricultural areas, conserve the vegetation cover, and recharge the aquifer [34,35]. Tabias are similar to the jessour; they are essentially situated on gentle slopes, in the piedmont surfaces, and in the middle of the watershed [36,37].
Recharging aquifers by recharge wells is a technique used mainly for aquifers with calcareous structures presenting low permeability. They show a notable efficiency in recharge even with the naked eye during the observation visits. A recharge well consists of an inner long tube leading to the watertable or permeable layer and an outer tube at the surface fixing the gravel filter [37,38,39,40].
This paper describes the use of the WEAP software tool to develop a DSS to model the hydro-system of the Médenine governorate in southeast Tunisia and to simulate the climate change (CC) impact on the Triassic aquifer of Sahel El Ababsa, in order to help manage the region’s limited water resources and assess the impact of projected climate and planning scenarios.
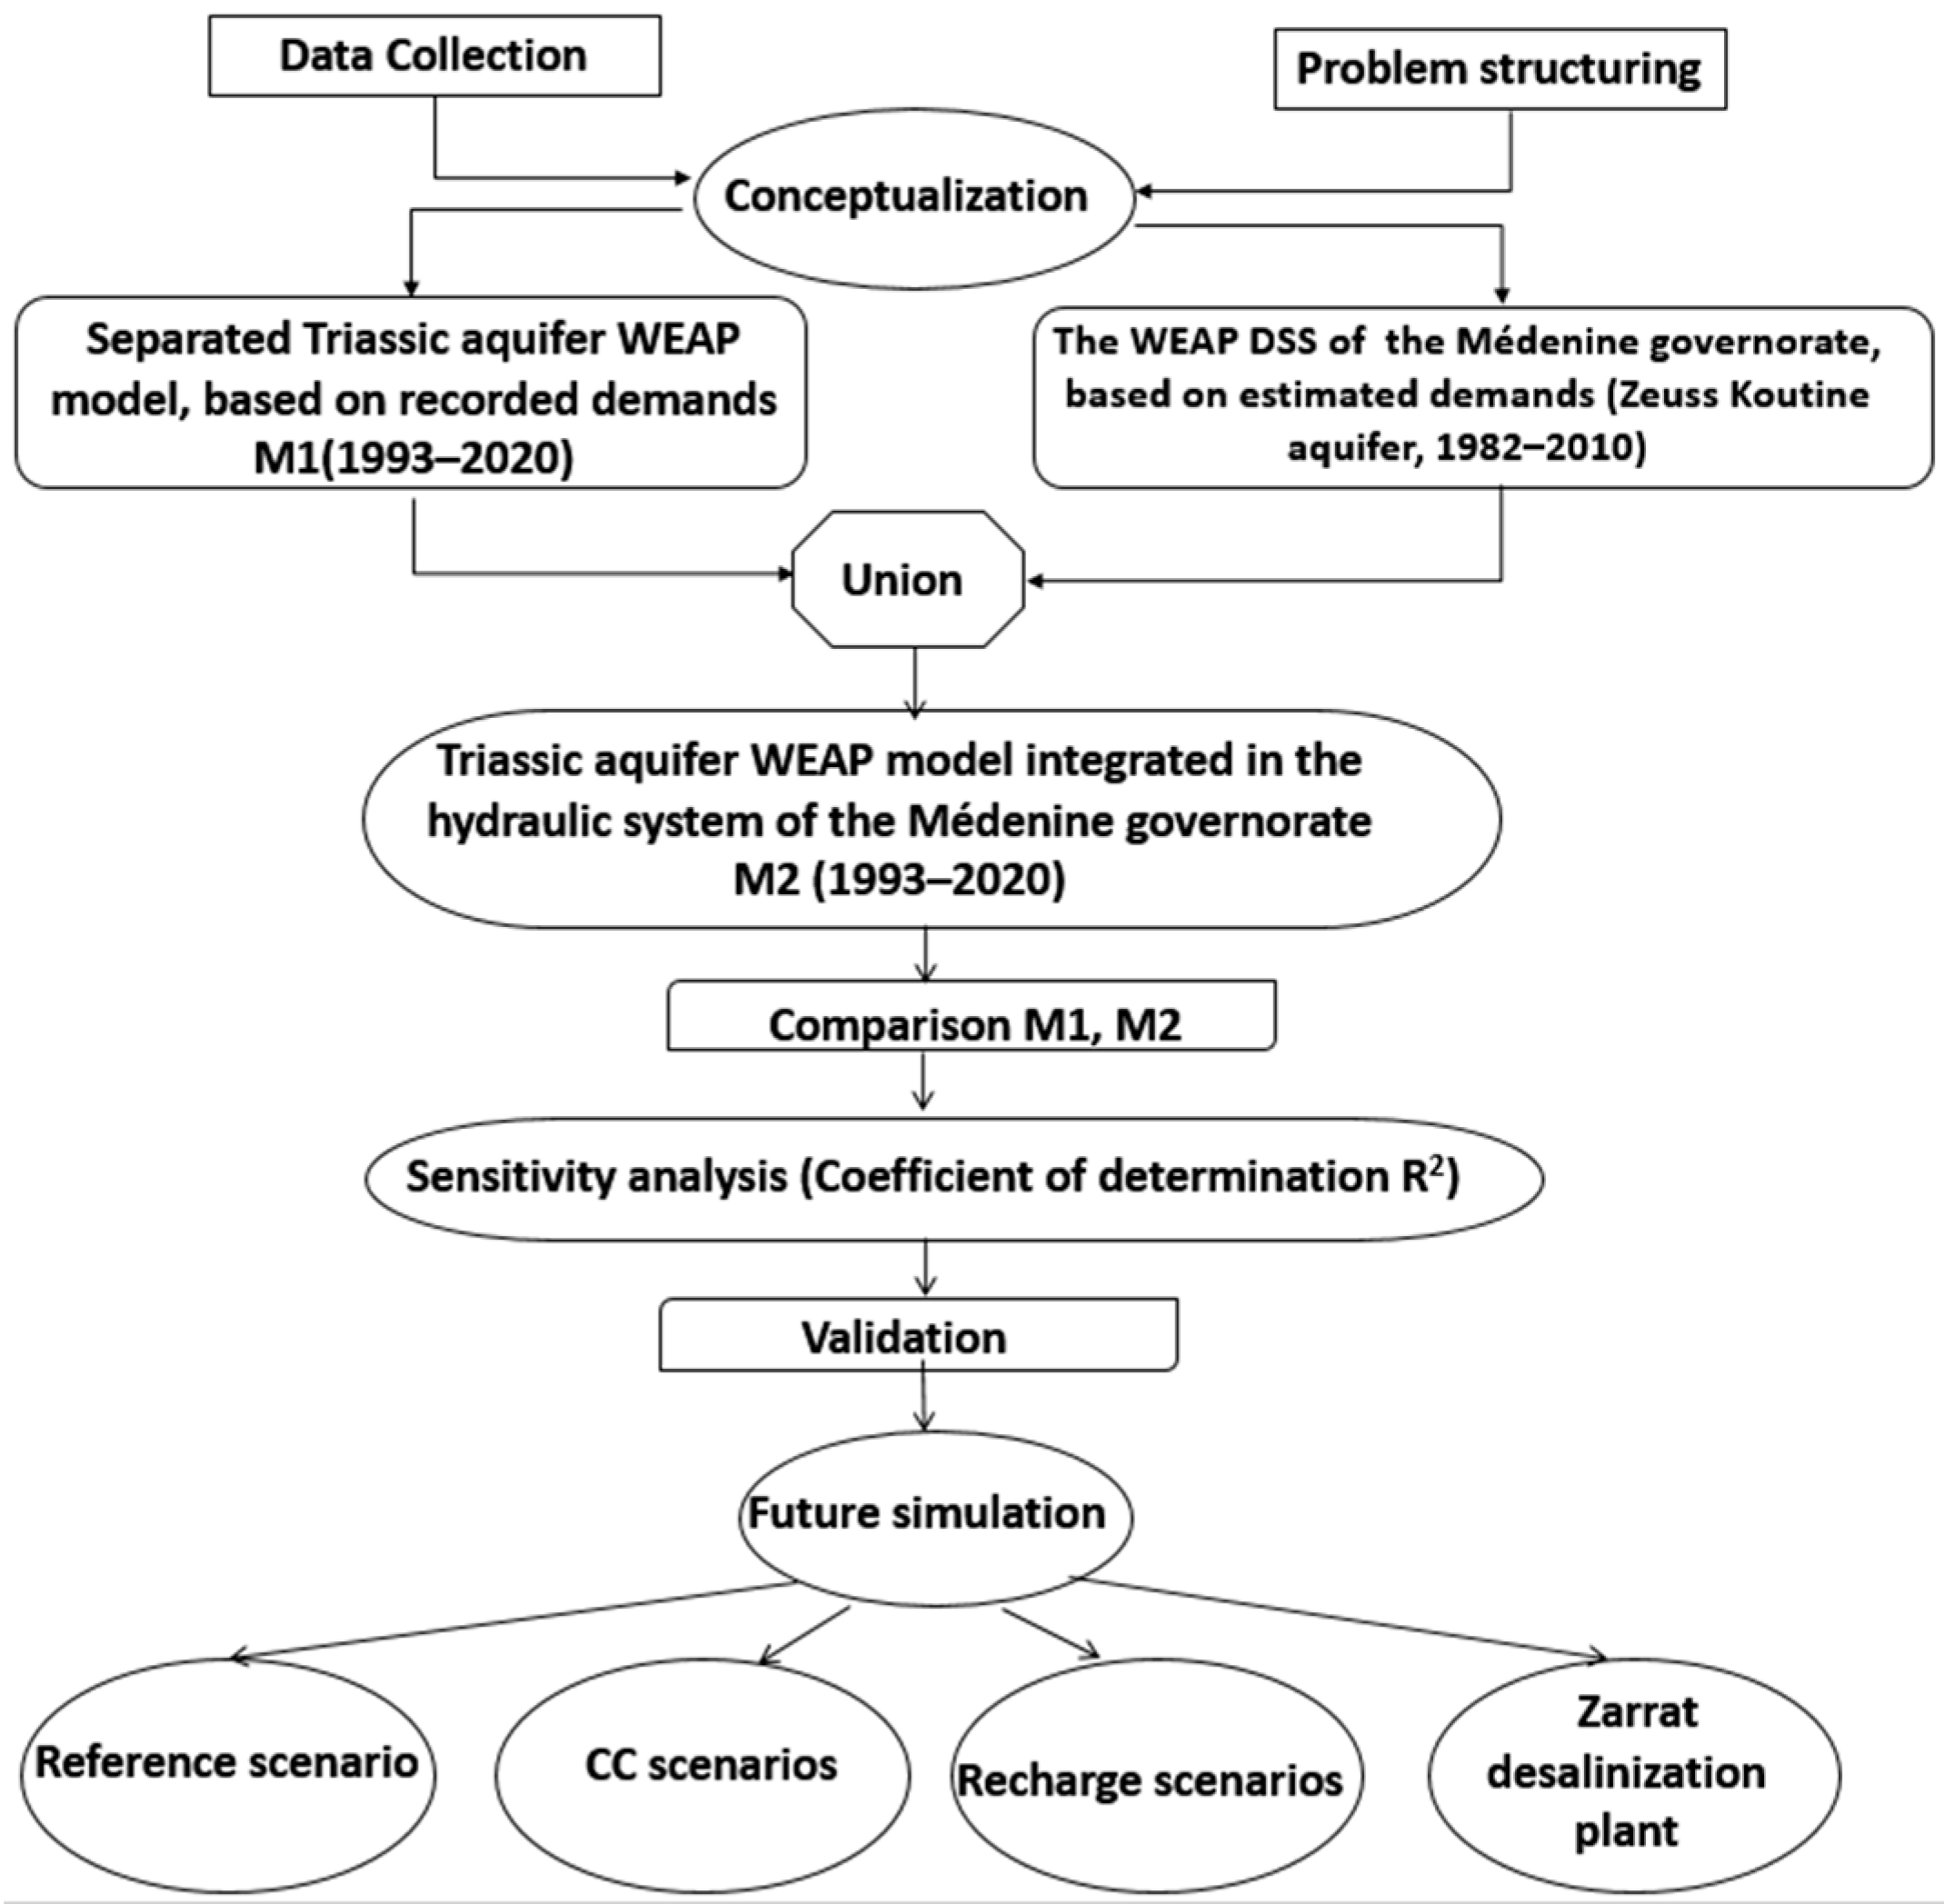
To achieve the present DSS, first, a database of climatic, geologic, hydro-geologic, hydraulic, and management information was created. In the second step, the WEAP software [20,41] was used to develop a conceptual model of the bio-hydro system of the Triassic aquifer using only the observed data for the different supplies and demands, then presenting the studied aquifer separated from the other components of the hydro-system in the region. In the last step, a union was made between the Triassic aquifer model and the developed WEAP DSS established already for the hydro-system of the Médenine governorate by the main author and describing all the water resources contributing to the water supply for the whole governorate [31,32]. The simulation period for the WEAP project is from 1993 to 2020 with a monthly time step. The forecast period is from 2020 to 2050. The reference scenario postulates maintaining the same climatic conditions, socio-economic activities, and WRM conditions as those of 2020.
Given its strategic importance for the region, this work aims to understand the behavior of the Triassic sandstone aquifer of Sahel El Ababsa and its interaction with the climate conditions and human activities and management during the forecast period from 2020 to 2050. The present DSS provides a forecast of future water demands based on the estimates of demographic development associated with the future evolution of specific daily consumption per person in the main cities of the study area, whether domestic or tourist consumption, such as in the major tourist centers of Djerba and Zarzis. It gives an idea of the evolution of irrigated areas under different rates of change, thus forming development scenarios for decision-makers.
The DSS was used to simulate the climatic scenarios in the forecast period. The future climatic data are given from the National Institute of Meteorology reports (INM) [42]. They were generated using a set of different RCMs (Regional Circulation Models). Two different RCPs (Representative Concentration Pathways) were used to forecast the precipitation: the RCP4.5 and the RCP8.5. The DSS emphasizes the importance of WHT to manage the aquifer recharge. The DSS is able to forecast the behavior of the studied aquifer and the response of various other conventional resources in the governorate of Médenine in the face of scenarios outlined within the strategy for mobilizing non-conventional water resources, through the establishment of desalination stations.

2. Materials and Methods

2.1. Study Area Overview

The governorate of Médenine occupies a strategic position in Tunisia with an area of 9167 km2. It is bordered by the governorate of Gabes and the Mediterranean Sea to the north and by Tataouine to the south, Libya and the Mediterranean Sea to the east, and Kebili to the west. It had a population of 479,520 at the 2014 census. The island of “Djerba”, which is one of the delegations of Médenine, made the region an internationally renowned tourist spot. The rate of electrification is 99.5% and the rate of access to drinking water is 100% [43,44,45]. The Triassic aquifer of “Sahel El Ababsa” is a part of the Jeffara plain in the Tunisia southeastern region. It is approximately between the latitude 33°10′ N and 33°26′ N and the longitude 10°05′ E and 10°30′ E. It covers an area of 650 km2. The majority of the extent of the aquifer belongs to the governorate of Médenine. A minor part of the aquifer belongs to the governorate of Tataouine, in the southern limit, with an area representing approximately 5% of the total area of the aquifer, as illustrated in Figure 1.
The main watersheds of the studied aquifer are Koutine, Gattar, and Hjar (also called the Médenine watershed). They contain the whole cities of Koutine, Metameur, and Médenine belonging to the governorate of Médenine [46]. The exploitable resources of the aquifer are estimated at 8.7 Mm3/year with an equivalent flow of 276 L/s and the total dissolved solids (TDS) vary between less than 1 g/L and 3 g/L [47].
The water exploitation index (WEI) illustrates the pressure of water abstraction on the available freshwater resources. It quantifies the level of water stress by comparing total water withdrawals to the renewable freshwater resources within a particular area. According to the literature, the threshold of water stress typically occurs when the water exploitation index (WEI) exceeds 20% [48,49,50]. Beyond this threshold, there is an increased risk of environmental degradation and social tensions due to unsustainable water consumption practices. Severe water stress can occur in regions with WEI over 40%. The Triassic aquifer presents a WEI that started with lower values (25%) in 1993, and it continues increasing to reach 78% in 2020. The study area has an arid climate where the average annual rainfall is about 180 mm with about 30 rainfall days per year. The annual thermal average is 22.9 °C and the reference evapotranspiration (ET0) is very high with a mean annual value of 1906 mm. The water balance of the region is deficient throughout the year. The rainfall in the study region is characterized by low averages and spatio-temporal irregularities [51,52,53,54].
In order to have a representative distribution of rainfall for the entire study area, nine raingages stations are considered: Beni khadech, Zammour, Halg Ejmel, Haraboub, Koutine, Loudayet, Ksar el Hallouf, Ksar Jedid, and Ourgigin. Figure 2 presents the annual average rainfall across the nine stations considered from 1970 to 2020. It shows a significant interannual variability. Figure 3 reflects the seasonal effect of rainfall. December is the rainiest month and May to August are dry months.
Figure 4 shows the variations in the mean, maximum, and minimum temperatures recorded at the Médenine meteorological station over the period from 1978 to 2021. The average annual temperature of the study area is 23 °C. The maximum temperature recorded is equal to 47.7 °C in 2021 and the minimum temperature is 2.8 °C in 2019. Figure 4 shows that there is a clear trend for an increase in the mean and maximum temperatures and a decrease in minimum temperatures, mainly from the year 2015. Using a linear regression model, the rate of change is defined by the slope of the regression line, which in this case is about 0.133 °C/year and 0.06 °C/year for maximum and mean temperatures, respectively. It is about −0.014 °C/year for minimum temperatures.
In Table 1, the average monthly potential evapotranspiration (ET0) and the average monthly precipitation measured during the available measurement period of 1975–2010 are shown. The climatic water balance of the region is negative throughout the year, which reflects the importance of climate impact on the WRM. Therefore, groundwater resources are the most used in the region.
Three main wadis that drain the surface rainwater from the upper zones (Dahar) to the sea or the lagoons (also called sebkha) are Koutine, Guattar, and Médenine wadis. As for the majority of the arid zones, the evaluation of the surface runoff is a very difficult task because of the rarity and the variability of precipitation, and mainly because of the lack of observations. The surface runoff in the Trias watersheds is evaluated by the Fersi (1979) empirical formula [55], adapted to the conditions of southern Tunisia as follows:
V = 16.39 × P × S × I 1 2
where ‘ V ’ is the computed surface runoff in each of the wadis in Million m3, ‘P’ is the rainfall (mm), ‘S’ is the area of the watershed (Km2), and ‘I’ is the average slope of the watershed (m/Km). Since the differences in precipitation values between stations are minimal and due to the small spatial extent of the study area, the arithmetic mean of the rainfall was used.
Table 2 details the characteristics of the principal watersheds and the computed surface runoff in each of the studied wadis. It should be noted that all these characteristics are computed in the frame of this work.
The Triassic sandstone aquifer of Sahel El Ababsa is, in reality, only the free part of a much larger aquifer extending over almost the entire southeast of Tunisia, which is the Triassic sandstone fossil aquifer of Médenine [53]. This aquifer is formed of two sandstone and clay-sandstone levels. It covers the central Djeffara plain, the southwestern part of that of El-Hamada, as well as the entire El Ouara plain [56].
The studied Triassic aquifer of Sahel El Ababsa is predominantly sandstone. It is limited to the north by the Upper Permian outcrops of the Djebel Tébaga of Médenine, to the south by the relief of Djebel Rahach in the Kirchaou region, to the west by the outcrops of Dahar and to the east by the Médenine fault, which brings this aquifer into contact with the adjacent aquifers of the Jeffara [51].
Figure 5 illustrates the geological cross-section in the study area, which crosses the Sahel El Ababsa plain, the Zeuss region, and the Médenine plain. It gives an idea of the depth of the Triassic aquifer of Sahel El Ababsa. For a surface of 650 km2 and an estimated mean depth less than 200 m, the initial storage capacity of the Triassic aquifer was estimated by the services responsible of the Regional Commission for Agricultural Development (Commissariat Régional au Développement Agricole, CRDA) at 100 Mm3. It represents the maximum theoretically accessible capacity of the aquifer.
The permeability values range from 1.48 × 10⁻⁶ to 4.25 × 10⁻⁴ m2/s, with the highest values measured in the Sahel el Ababsa region and the eastern foothills of Rehach-Sidi Toui. The storage coefficient varies between 1 × 10⁻³ and 5 × 10⁻² [56].
The Triassic sandstone outcrops in the Sahel El Ababsa region constitute the recharge areas by infiltration of rainfall into the aquifer. The general underground flow is from SW to NE. Furthermore, the presence of high piezometric levels in the SW of the basin indicates a supply of the aquifer coming from the Saharan basin. In the Ababsa Sahel region, the isopiezometric curves are well spaced with a low hydraulic gradient, which can be explained by the increase in permeability of the aquifer formation in this region [56]. Therefore, the piedmont area and the wadis are considered the preferential recharge areas [51].
The Triassic aquifer is exploited by several wells, providing water for drinking and agricultural uses. Since the beginning of the 1970s, it has contributed partly to the drinking water supply of the major cities of Tataouine and the Médenine governorates. Its pumping has kept a gradual increase up to the present. Figure 6 shows the total pumping volumes of the Triassic aquifer and the recorded piezometric levels. It shows that the total pumping volumes reached a peak of 9.5 Mm3 in 2017. The historical abstraction data for the last decades indicate that the average yearly water supply was about 6 million m3. The average daily supplied volume was about 16,351 m3/day [57].
Figure 6 illustrates the recorded piezometric levels in the four piezometers present on the surface of the Triassic sandstone aquifer of Sahel El Ababsa. The Hajer piezometer recorded a drawdown of 4.5 m during the period between the years 1997 and 2020. It was 6 m for the same period for the Guattar piezometer, 7 m for the Arniane piezometer, and 1.3 m for the Kmailia piezometer. The location of the piezometers is given in Figure 1.
As part of the strategy to improve the quality of distributed water, the National Water Exploitation and Distribution Company (Société Nationale d’Exploitation et de Distribution des Eaux, SONEDE) blends water from different sources in tanks and redistributes it. According to the services responsible of SONEDE, water is pumped from wells in the Triassic aquifer using booster stations and then mixed in the Tajra2 tank with a capacity of 2500 m3.
Initially, at the beginning of the Triassic aquifer’s exploitation, this reservoir primarily contained water from the Zeuss Koutine aquifer, with only a small contribution from the Triassic aquifer. However, this distribution has evolved over time, and currently, water pumped from the Triassic aquifer accounts for 30% of the total drinking water supply. From this reservoir, water is distributed in varying proportions to the different cities of Médenine and Tataouine (Figure 7).
In addition to drinking use, the Triassic water resources are used for agricultural uses, mainly irrigation. The irrigated areas from the Triassic aquifer are increasing progressively. They are estimated to be about 200 ha in the study area at the end of the simulation period in 2020. It is to note that irrigation accounts for about 25% of the total demand on the Triassic aquifer in Sahel El Ababsa.
The main crops in the region are olives—which require 560–670 mm of water per year—almonds (600–800 mm/year), and grapes (560 mm/year). Vegetable crops also have varying water requirements; potatoes need 249–300 mm/year, carrots need 324–416 mm/year, fava beans need 207–285 mm/year, and peppers need 618–631 mm/year [58].
The seasonal distribution of water needs varies for each crop. Olives require about 25% of their water in spring, 60% in summer, 10% in autumn, and 5% in winter. Almonds need 35% in spring, 55% in summer, 5% in autumn, and 5% in winter. Grapes follow a similar pattern, with 25% in spring, 60% in summer, 10% in autumn, and 5% in winter. Vegetable crops are seasonal.
Figure 8 shows the water distribution from the Triassic sandstone aquifer to the cities of Médenine and Tataouine as well as the water distribution to agricultural use.
The study area is characterized by diverse socio-economic aspects that influence water demand and resource management. To provide a clearer overview, Table 3 summarizes key indicators such as population size, population density, main economic activities, and water demand sectors. This information helps contextualize the interactions between human activities and water resources within the region.

2.2. WEAP Modeling

2.2.1. Initial WEAP Model M1 of the Triassic Aquifer of Sahel El Ababsa

In the present work, the Water Evaluation And Planning (WEAP) tool software (version 2022.0001 (Beta)) is applied to assess the hydrological behavior of the Triassic aquifer of Sahel El Ababsa as an element included in its extended environment, limited firstly by the watershed limits and then by the governorate of Médenine. The first step to model the Triassic aquifer of Sahel El Ababsa consists of collecting climatic, geological, and hydrogeological data that can influence the water balance of the aquifer as well as the history of its exploitation. It should be noted that the Triassic aquifer is one of the other resources supplying the governorate of Médenine, and that in the frame of the strategy of improving the distributed water quality, the SONEDE mixes the water coming from different sources in tanks to redistribute it later.
As a second step, an initial model called M1 of the Triassic aquifer has been developed through the WEAP tool software. It is a simplified model. It simulates the aquifer locally, the catchment contributing to its recharge and the different demands supplied by this aquifer. This model M1 is based on the estimation of the supplies by estimating the recharge following the previous studies on the region and on the records of the distributed volumes extracted from the Triassic aquifer.
The simulation period for the WEAP M1 project is from 1993 to 2050 with a monthly time step. The choice of the base year 1993 is justified by the availability of observed data. The study area is defined and delimited by the ArcGIS shapefiles in the “Schematic View” interface of the WEAP project. To this schematic view are added the main components necessary to model the Triassic aquifer: the Triassic aquifer is represented by a “Groundwater” node; the studied watersheds are represented by one “Catchment” node; the wadis are digitized by the “River” WEAP component, thus, only the main wadis are added; and finally, the demand site nodes are “MedenineTrias“, “Tataouine“, and “Irrigation“. Figure 9 shows the model structure of the initial Triassic aquifer, as shown in the WEAP schematic view.
All these components are represented and explained in Table 4. It should be noted that the same demand priority characterized all demand site nodes.
The “Key Assumptions” tool is used to add external parameters involved in the calculation and not defined in the schematic view, like the measurements of precipitation at the different rainfall stations in the study area. It is also used to define new hypotheses like recharge hypotheses, climate change hypotheses, and others.
WEAP simulates the aquifer node as a reservoir to which an initial volume “initial storage” and a maximum theoretically accessible volume “storage capacity” must be assigned. The storage parameter of the aquifer is estimated by the responsible services of CRDA per 100 Mm3 with a maximum monthly withdrawal estimated from historical withdrawals equivalent to 0.75 Mm3 [46]. The watersheds of the Triassic sandstone aquifer are represented in this model by one catchment node, to which it is assigned the total surface area of the watersheds feeding the aquifer, equal to 650 km2.
The total recharge of the groundwater is constituted by two main components: direct recharge and indirect recharge. The direct recharge occurs from rain through the soil profile; the indirect recharge occurs from runoff through joints or fissures, from flow into puddles, or from “transmission losses” during runoff in the river and the flooding [59,60,61]. In arid regions, the recharge is dominated by indirect recharge and the most important groundwater recharge mechanism is considered to be infiltration from floods through the alluvial beds of ephemeral streams in wadi channels [60,61,62].
Indeed, the Triassic sandstone aquifer can be fed directly by precipitation according to the adopted hypothesis, setting the direct recharge rate at 2.4% of the average precipitation in the region. This value is inspired by the SASS, Biskra, and Tunisian–Libyan Jeffara models [63] and it has also been used by previous studies [31,32,56,64,65].
To represent the indirect recharge induced by infiltration through runoff from wadi beds, the “River” component was used in WEAP. The “Headflow” parameter required in the “River” component was calculated using the Fersi formula (1). The “Rainfall Runoff Simplified Coefficient Method” is used in this WEAP project to simulate runoff and recharge. It is based on the calculation of runoff and recharge using simplified coefficients. The recharge from the infiltration of wadi floods is assimilated in this model as demand sites for each wadi, supplied by the monthly runoff volumes through transmission links, which contribute to the recharge of the aquifer via “Return Flow” links. Thus, all these links are assumed to conduct 100% of the quantities of water with a loss rate of 0%. This means that the quantities of recharge calculated according to the recharge hypotheses percolate entirely towards the aquifers without losses.
The indirect recharge rate from flood infiltration in the wadi beds was initially estimated at 50% of the runoff volume calculated using the Fersi formula (1). This value is expected to increase over time, given that the Tunisian government launched the first national strategy for water and soil conservation and the mobilization of water resources for the period of 1990–2004. As a result, water harvesting techniques (WHTs) have seen significant development in the study area and in Jeffara in general. The hypothesis of recharge by flood infiltration in the wadi beds was estimated by Mr. Yahyaoui, the former district head of water resources at the CRDA of Médenine, and was used in the previously cited studies [31,32,64].
For the demand site nodes “Médenine Trias”, “Tataouine”, and “Irrigation”, the actual recorded distributed volumes are attributed to the simulation period (1993–2020) in this initial WEAP project M1, representing only the Triassic aquifer separately from the other water resources of the Médenine governorate [46,57].

2.2.2. Final WEAP Model M2 of the Triassic Aquifer of Sahel ElAbabsa Integrated into the Hydraulic System of Médenine

In a previous study, a WEAP-based decision support system (DSS) was developed for the same hydraulic system in the Médenine governorate. This DSS focused on simulating the Zeuss Koutine aquifer over the period from 1982 to 2030. It was designed to estimate water supply and demand while incorporating all the region’s water resources during that timeframe. The DSS was well validated, with a determination coefficient (R2) of 0.86 and an agreement index (d) of 0.84, and it was also verified [31,32,64].
In the present study, all demand sites from the previously calibrated model, along with additional water resources, are fully integrated into the initial model (M1). Water demands are allocated by city and estimated based on population growth and specific water consumption, as detailed later [31,32,64]. The input data has been updated to reflect observations up to 2020, including parameters such as population demographics, per capita water consumption, monthly variations in water demand, and both operational and planned desalination plants.
Then, on a larger scale and based on the fundamental principle of water balance, the M2 WEAP model is capable of simulating the supply and demand of all water resources in the Médenine governorate. In the resulting WEAP project M2, in addition to the Triassic aquifer, the Zeuss Koutine aquifer is represented by a groundwater node with a storage capacity estimated at 250 Mm3. Desalination plants are also included in this model M2. Indeed, three brackish water desalination plants were built in the Médenine governorate: in Zarzis in 1999, with a production capacity of 15,000 m3/day; in Djerba in 2000, later expanded to 20,000 m3/day in 2008; and in Benguerdene in 2013, with a capacity of 1800 m3/day. Additionally, the Djerba Seawater Desalination Plant (SDP) was commissioned in May 2018 in Jerba City, with a capacity of 50,000 m3/day. These facilities have significantly improved water quality, with desalinated water achieving a salinity of 0.5 g/L. The Maouna aquifer, which supplies the city of Tataouine with a limited flow, is simulated using an “Other Supply” node named “Maouna-Tataouine”, which provides the Tataouine demand site with a mean flow estimated at 63 L/s.
On the other hand, the resulting WEAP project M2, presented in Figure 10, differs from the first one by the consideration of the demands. Model M1 is based on recorded local distribution from the Triassic aquifer, whereas model M2 estimates both demands and supplies for the entire Médenine governorate. In M2, domestic demand sites include “Médenine”, “Tataouine”, “Jerba”, “Zarzis”, and “Ben Guerdane”, representing the main cities of the governorate. The “Other” demand site accounts for small agglomerations, some industries, and ungrouped consumers supplied directly from the main pipelines. Only the cities of Médenine and Tataouine receive drinking water from both the Zeuss Koutine and Triassic aquifers, which are blended in the Tajra2 Tank, as previously mentioned.
To calculate demands, the “Specify yearly demand and monthly variation” method is chosen, which requires annual data such as “Annual Activity Level” and “Annual Water Use Rate”. The “Annual Activity Level” represents the population of the demand site benefiting from the water resources, while the “Annual Water Use Rate” corresponds to the specific annual consumption of the concerned population.
These annual data are assigned a “monthly variation in demand”, which reflects the seasonal effect on water consumption. Statistics on the demographic evolution of the various delegations in the governorate are sourced from the reports of the Southern Development Office [45]. The official population statistics from 1984, 1994, and 2004 constitute the observed data for the pre-existing annual activity levels. Demographic data have been updated using the statistics from 2014 and 2020.
The Annual Water Use Rate, or specific annual consumption for each demand site, is assigned to the population based on distribution records from SONEDE [57]. The specific consumption was estimated at 67 L/day per person in 1993 and increased to approximately 130 L/day per person by 2020. To project the future Annual Activity Level and Annual Water Use Rate, WEAP employs a set of interpolation functions to compute their evolution.
The cities of Jerba and Zarzis are among the most important tourist hubs in Tunisia. Due to their well-developed tourism sector, each city is divided into two demand sites based on water use: “Domestic” and “Tourism.” The Domestic site represents the water demand of the resident population, including both urban and rural localities, while the Tourism site accounts for tourist-related water consumption. This distinction is necessary due to the significant disparity in water consumption between the two sectors. It is worth noting that tourism-specific consumption is estimated to be six to ten times higher than domestic consumption based on observations over the past decades. The hotel capacity of Jerba, closest to the model simulation period, was recorded for the years 1989, 1994, 1998, 2004, 2005, 2007, and 2008, increasing from 10,007 beds to 45,311 beds [66]. However, in 2013 and 2014, the region’s touristic capacity experienced a decline of 13% and 15.8%, respectively [67].
After experiencing significant setbacks due to the Bardo National Museum attack and the Sousse attack in 2015, Tunisia’s tourism industry made a remarkable recovery. By 2018, it had not only regained its position as one of Africa’s and the Mediterranean’s leading destinations but had also surpassed its 2010 figures by 6%. In 2020, Jerba had a hotel capacity of 42,086 beds [45].
The specific consumption calculation for domestic use in the Jerba and Zarzis demand sites is based on historical water distribution data from SONEDE [57]. However, for touristic use, a growth rate of 0.5% is applied to the value estimated in 1993, which stood at 211 m3 per inhabitant.
The “Irrigation” node represents agricultural water distribution from the Triassic aquifer. The input data for this demand site consist of monthly pumping flows recorded for irrigation, as provided by the relevant services of CRDA. In the base year 1993, the irrigated areas were estimated at 30 ha, increasing to approximately 200 ha by 2020. The irrigation flow, as estimated by CRDA, is about 0.4 L/s/ha.
Table 5 complements Table 4, providing an overview of the demand sites adopted in the WEAP model M2 along with the main input parameters.

2.2.3. Model Calibration

In summary, two WEAP models of the Triassic aquifer were developed. The initial model, M1, includes only the Triassic aquifer, its catchment area, and associated water demands. It is based on observed demands for the simulation period from 1993 to 2020. The final model, M2, integrates the Triassic aquifer within the broader hydraulic system of the Médenine governorate. This integrated model builds upon the previously calibrated and validated Zeuss Koutine aquifer WEAP model developed by the lead author [31,32,64].
The classic tests for validating models, as recommended in the literature, include comparing model results with observed data or with other models, analyzing the model’s behavior under extreme conditions, and conducting sensitivity analyses on calibration parameters, among others [68,69,70,71].
In this case study, due to the lack of data on the observed distributed water volumes across the entire hydro-system of Médenine, and the complexity introduced by the strategy of mixing water from various sources in tanks before redistribution—making it difficult to determine which population benefits from which resource—the model validation was carried out by comparing the results of two WEAP models (M1 and M2). However, the only directly comparable parameter is the volume of water pumped from the Triassic aquifer before it reaches the reservoirs, along with the flow rates in the transport connections between the aquifer and the demand sites in Médenine.
The mathematical efficiency criterion chosen to evaluate the performance of the model, in this case, is the coefficient of determination R2 and the adjusted coefficient of determination R2.
The coefficient of determination R2 lies between 0 and 1. A value of zero means no correlation at all, whereas a value of 1 means that the dispersion of the prediction is equal to that of the observation [72].
The resulting updated model, referred to as M2, will be used after validation as a DSS enabling informed decision-making and optimized planning for future climate change (CC) and water resource management (WRM) scenarios, as illustrated in the following figure.
The DSS is supported by a comprehensive database, collected and integrated from diverse sources. It facilitates data visualization through interactive maps, graphs, and dashboards, enabling trend analysis and pattern recognition for a deeper understanding of water resource dynamics.
The system is capable of simulating hydrological processes, including river flow, groundwater recharge, and the evolution of aquifer storage over time. Additionally, it models the impacts of various scenarios, such as climate change, recharge changes, or infrastructure development. The DSS also provides tools for multi-criteria decision analysis, allowing stakeholders to balance trade-offs between objectives such as water supply, environmental protection, and economic growth. Furthermore, it assists in the development and comparison of future scenarios for water demand and supply under varying conditions, enhancing strategic planning and resource management. Figure 11 outlines the methodology employed in this study.

2.3. Future Scenarios

2.3.1. Reference Scenario

The reference scenario (SC0) supposes that climatic conditions and WRM are maintained as those of the year 2020. Population growth and demand evolution are considered in this scenario. In order to achieve good management of these resources in the study region, different future scenarios are developed and discussed in the next step of this work. The first scenarios are the climate change (CC) scenarios. Indeed, climatic observations and projections at regional, national, and even international scales confirm that water resources are vulnerable and could be seriously affected by the CC. These scenarios study the impact of CC on the Triassic aquifer. In fact, the National Institute of Meteorology (INM) as an institution responsible for the study of climate and the evaluation of the future climate based on the scenarios of the EURO-CORDEX Project, had retained a selection of 14 RCMs (Regional Circulation Models) for two parameters, the temperature and precipitation [42]. The main climatic factor influencing the groundwater resources in this work is the precipitation. Two different RCPs (Representative Concentration Pathways) were used to forecast the precipitation: the RCP4.5 and the RCP8.5.

2.3.2. Climate Change Scenarios

Representative Concentration Pathways (RCPs) are scenarios that describe alternative trajectories for carbon dioxide emissions and the resulting atmospheric concentration from 2000 to 2100 [73]. The RCPs are named according to the radiative forcing target level for 2100. The radiative forcing estimates are based on the forcing of greenhouse gases and other forcing agents. The four selected RCPs were considered to be representative of the literature, and included one mitigation scenario leading to a very low forcing level (RCP2.6), two medium stabilization scenarios (RCP4.5/RCP6), and one very high baseline emission scenario (RCP8.5) [74,75]. In fact, RCP 4.5 simulates that emissions peak around mid-century, then decline rapidly over 30 years to stabilize at half of 2000 levels. The RCP 8.5 is the most pessimistic scenario, in which a future with no policies to reduce emissions is applied and emissions continue to increase rapidly through the early and mid-parts of the century.
In this study, only the RCP4.5 and RCP8.5 scenarios were adopted because the RCP2.6 scenario is not applicable to Tunisia, as the region has already exceeded the conditions outlined in this scenario. The selection of RCP4.5, representing a moderate emissions pathway, and RCP8.5, which illustrates a more extreme future with high emissions, allows for a comparative analysis between the current state and probable future conditions. This approach provides a clearer understanding of potential precipitation changes under varying climate scenarios, highlighting the range of impacts that may be experienced in the region.
Referring to INM forecasts, simulations of all climatic models indicate a net decrease in average annual precipitation by the year 2050. This decrease is expected to be between 5% and 10% according to the RCP 4.5 scenario and between 1% and 14% according to the RCP 8.5 scenario. By 2100, a decrease in average annual precipitation of 5% to 20% is projected under the RCP 4.5 scenario, and a decrease of 18% to 27% is anticipated under the RCP 8.5 scenario. [42]. On the other hand, projected climate impacts in the Mediterranean region indicate reductions in renewable water resources, including aquifer recharge, of up to 70% in some areas by 2050. This situation is exacerbated by rising temperatures and decreased precipitation [73,76,77].
The current DSS was employed to simulate climate scenarios for the forecast period between 2020 and 2050. To assess the impact of these changes on aquifer recharge and its behavior, two scenarios were developed under the reference scenario framework. First, (i) Scenario “SC1.0”, this scenario incorporates projected precipitation changes for the year 2050 based on the RCP 4.5 pathway. Second, (ii) Scenario “SC2.0”, this scenario integrates projected precipitation changes for 2050 according to the RCP 8.5 pathway. Both scenarios indicate a significant reduction in aquifer recharge, with projections showing a 70% decrease in the study region by 2050.

2.3.3. Commissioning Seawater Desalination Plants Scenarios

With the increase in water demand, it has become necessary to consolidate the region’s water resources by constructing a new seawater desalination plant in Zarat city, located at the northern boundary of the Médenine governorate. This plant is expected to begin operations in 2024 with a capacity of 50,000 m3/day. It is intended to supply 60% of its production to the Médenine and Tataouine governorates, while the remainder will serve the Gabes governorate. The responsible services of the National Water Exploitation and Distribution Company (SONEDE) have expressed their intention to double the production capacity of this plant in the future.
For this reason, two scenarios were developed under the reference scenario “SC0”: “SC3.0” and “SC4.0”. The “SC3.0” scenario will study the impact of the implementation of the Zarat seawater desalination plant from 2024 with a capacity of 50,000 m3/d. The “SC4.0” scenario will study the impact of the extension of this station in a chosen year (2035) to achieve a production of 100,000 m3/d. The same scenarios were developed under the SC1.0 describing the CC under RCP 4.5, and they are “SC3.1” and “SC4.1”.
The desalination plant is simulated in this model by an aquifer node, whose initial storage capacity is estimated at 548 Mm3 in the year 2024 and remains constant until the year 2035; the maximum monthly water withdrawal from this station is estimated at 0.915 Mm3.

2.3.4. Enhancing Water Harvesting Techniques (WHTs) Scenarios

Indeed, the 1990s period represented the achievement period of the water harvesting techniques (WHTs) structures. Hadded et al. [31,32,64] demonstrated a substantial increase in groundwater recharge beginning in that period, reaching its peak between 1995 and 2010. However, starting in 2010, the induced recharge began to decline, likely due to poor maintenance or the aging of these structures [31,32].
In particular, inadequate maintenance is primarily reflected in the clogging of recharge wells, which are the most effective components of the WHT structures. Under the reference scenario, an evolution in recharge rates induced by runoff infiltration in wadi beds was considered. This evolution accounts for the additional recharge due to WHT from 1995 to 2010, followed by an approximate 75% reduction in these rates, which persisted until the end of the simulation under the same scenario [31,32,64].
To highlight the importance of WHT structures on groundwater recharge, a scenario was developed under reference conditions, designated as “SC0”. This scenario assumes that the WHT structures maintained their maximum efficiency throughout the simulation period, with recharge rates remaining at their peak values from 1995 to 2050. In the WEAP DSS, this scenario is referred to as “SC5.0”. A similar scenario was developed under medium climate change conditions (RCP4.5), referred to as “SC5.1” in the WEAP DSS. This allows for an analysis of the impact of climate change on the effectiveness of WHT structures in sustaining groundwater recharge.

2.3.5. Irrigation Scenarios

Other scenarios have been developed to study the impact of irrigation demands on the aquifer. The first scenario, referred to as “SC6.0”, assumes the stabilization of all agricultural water demands from the Triassic aquifer starting in 2027. This scenario is motivated by plans from the responsible services to install a treated wastewater plant in the study region for irrigation purposes in the near future. A similar scenario, developed under “SC1.0”, incorporates medium climate change conditions and is referred to as “SC6.1”.
The final irrigation scenario under the CC SC1.0 assumes that irrigation using water from the Triassic aquifer will cease starting in 2025. While this assumption may seem unrealistic, it is designed solely to assess the impact of irrigation on the aquifer’s groundwater resources. Despite its apparent impracticality, testing such scenarios is essential in DSS to evaluate key parameters influencing IWRM. This scenario is referred to as “SC7.1”.

2.3.6. Aquifer Recovery Scenario

To alleviate stress on the aquifer and restore its groundwater level by the end of the 642 simulation period, a combined scenario “SC8.1” was developed under the medium climate change scenario (SC1.0). This scenario incorporates the presence of the two SDP systems (SC3.1 and SC4.1), the total efficiency of WHT structures (SC5.1), and the stabilization of agricultural water demands (SC6.1). Additionally, it assumes a reduction in daily drinking water consumption from 130 to 110 L per person by 2050, as projected by SONEDE. This scenario estimates the water volume required to achieve these objectives under sustainable management strategies. Table 6 summarizes all the studied scenarios.

3. Results

3.1. Calibration and Validation

WEAP provides an extensive list of results concerning demand components, water supply and resources, catchment, water quality, financial, and other results. The main result that concerns the present study is the storage of the Triassic aquifer, which reflects the impact of the different management and development strategies of the region on the groundwater resources.
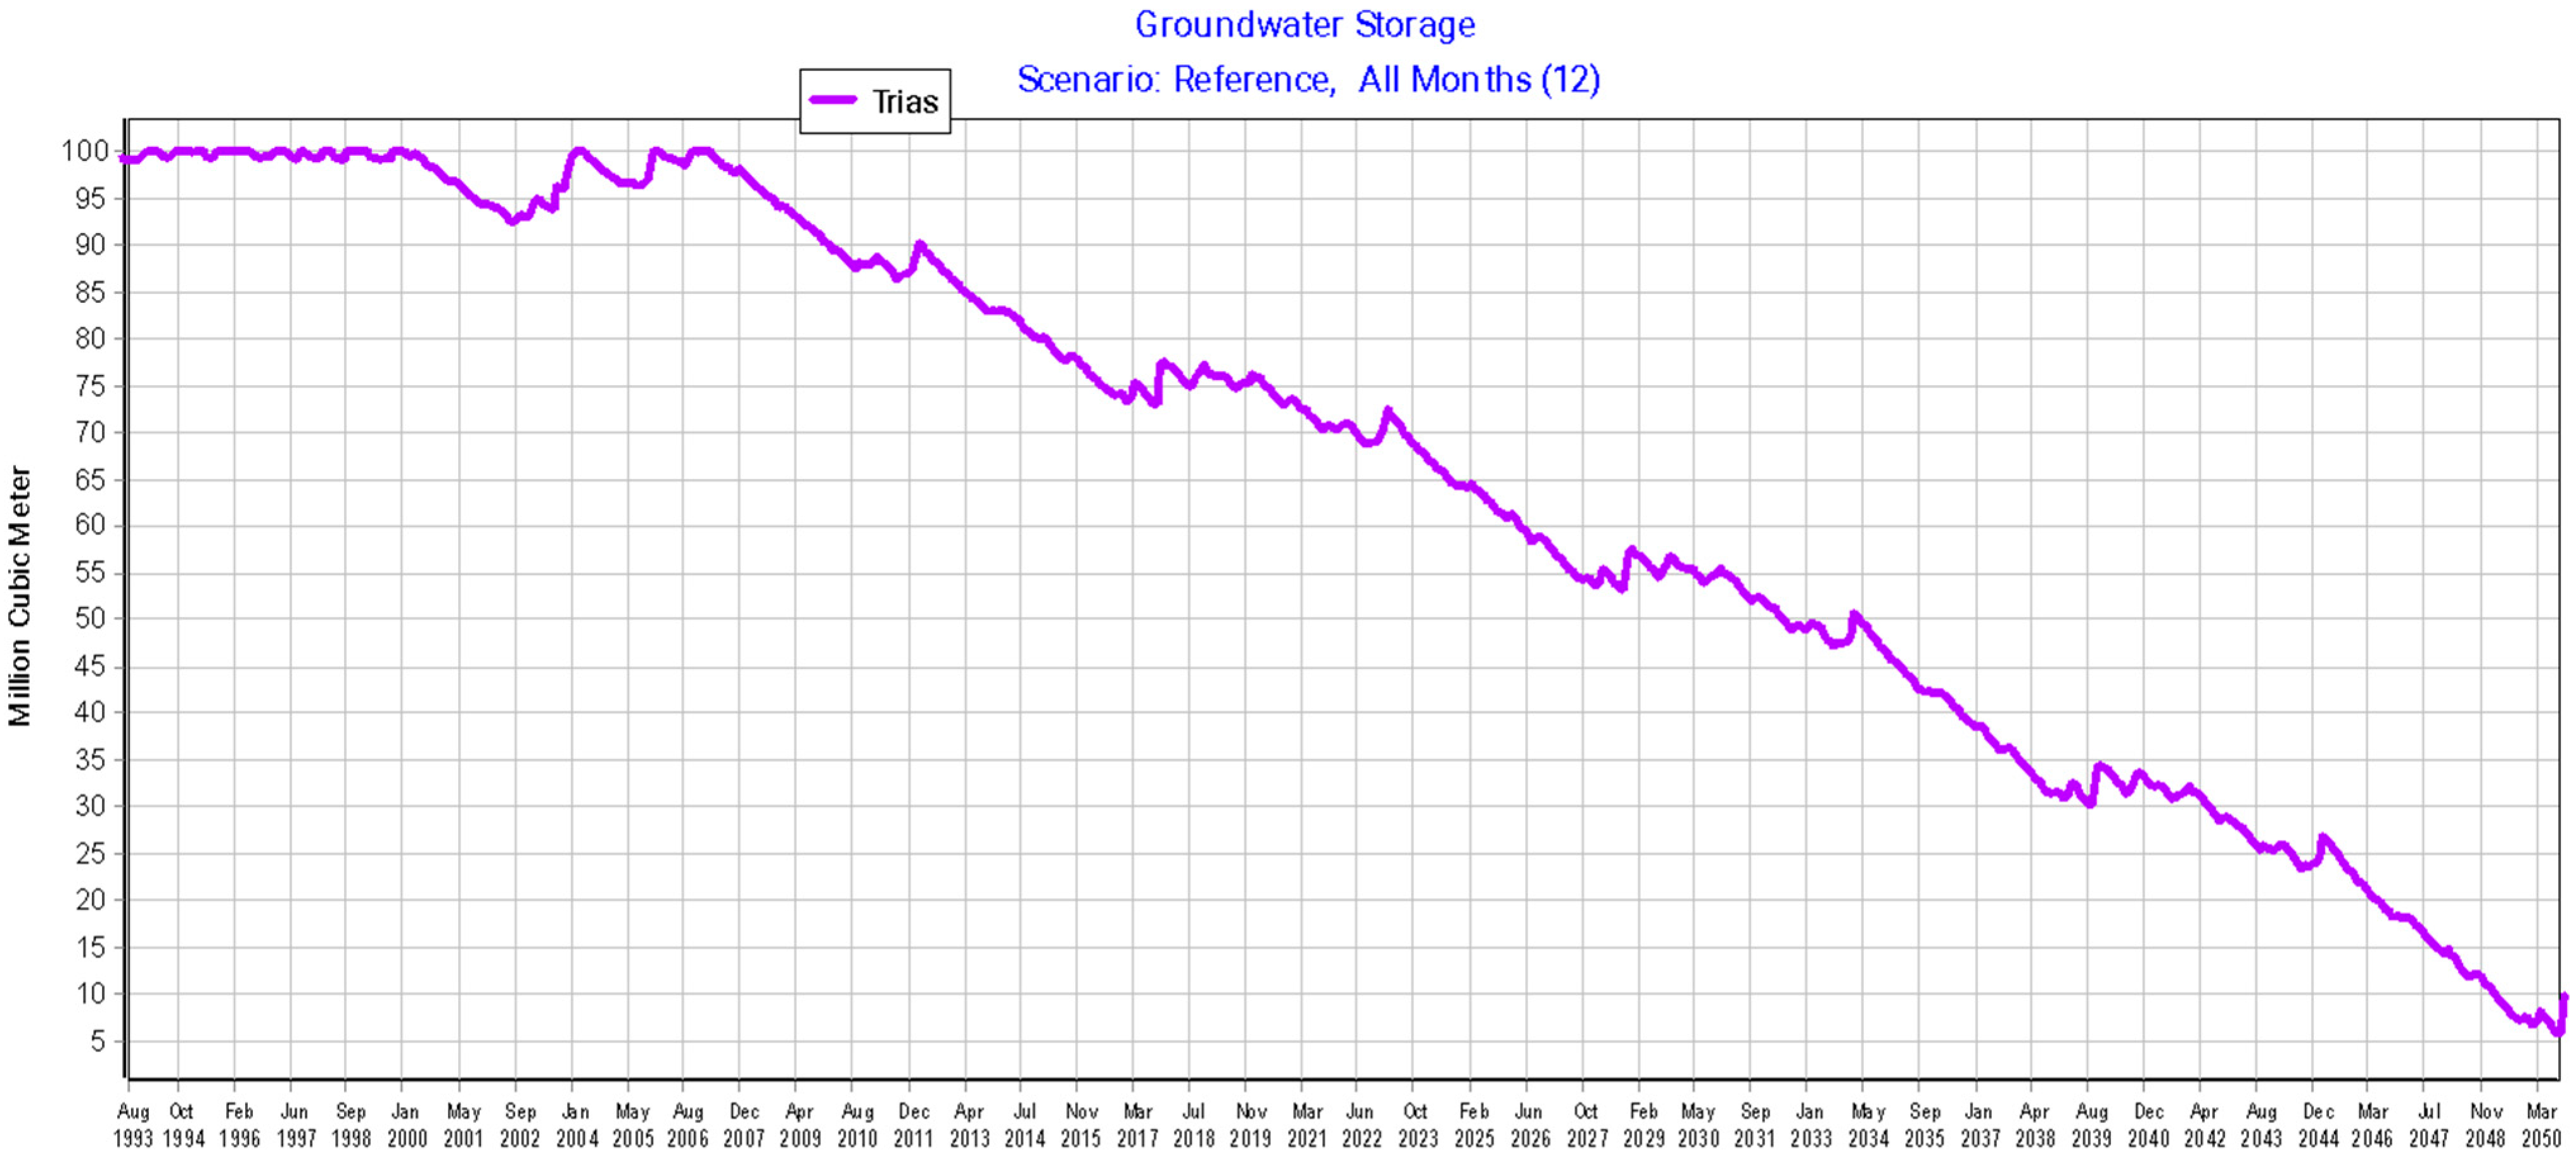
These results are given first, according to the reference scenario (SC0), which assumes continuing the same water resources management conditions in the future as those of the year 2020. The same resources from this year are considered; the projected resources are not affected by this scenario and the demands follow a calculated evolution. The recharge is assumed to have an increase in the indirect recharge rates from the year 1995 until the year 2010 to show the effect of the WHT and then a reduction in these rates until the end of the simulation period to show the real effect of the poor maintenance of these structures.
The initial storage of the Triassic sandstone aquifer was estimated by the CRDA at 100 Mm3. In the initial model of the Triassic aquifer (M1), the simulation reveals a continuous decline in groundwater storage beginning in 2007. By 2050, the aquifer’s storage is projected to decrease to 7.36 Mm3, representing a dramatic reduction of approximately 92% compared to its initial capacity.
This significant decline highlights the critical state of water resources in the Médenine region. Figure 12 illustrates the evolution of the Triassic aquifer’s storage throughout the simulation period using the M1 WEAP model.
The Triassic aquifer is modeled in a second step, integrated within its environmental context, based on the estimation of water supply and demand across all water resources utilized in the hydraulic system of the Médenine governorate (M2). The integrated model builds upon the Zeuss Koutine aquifer WEAP model, previously calibrated and validated by the lead author [31,32,64].
Starting with the same estimated initial storage capacity and initial groundwater storage, the aquifer is projected to experience a continuous decline, reaching 23.71 Mm3 by 2050. This represents a reduction of approximately 76.29%, as illustrated in Figure 13.
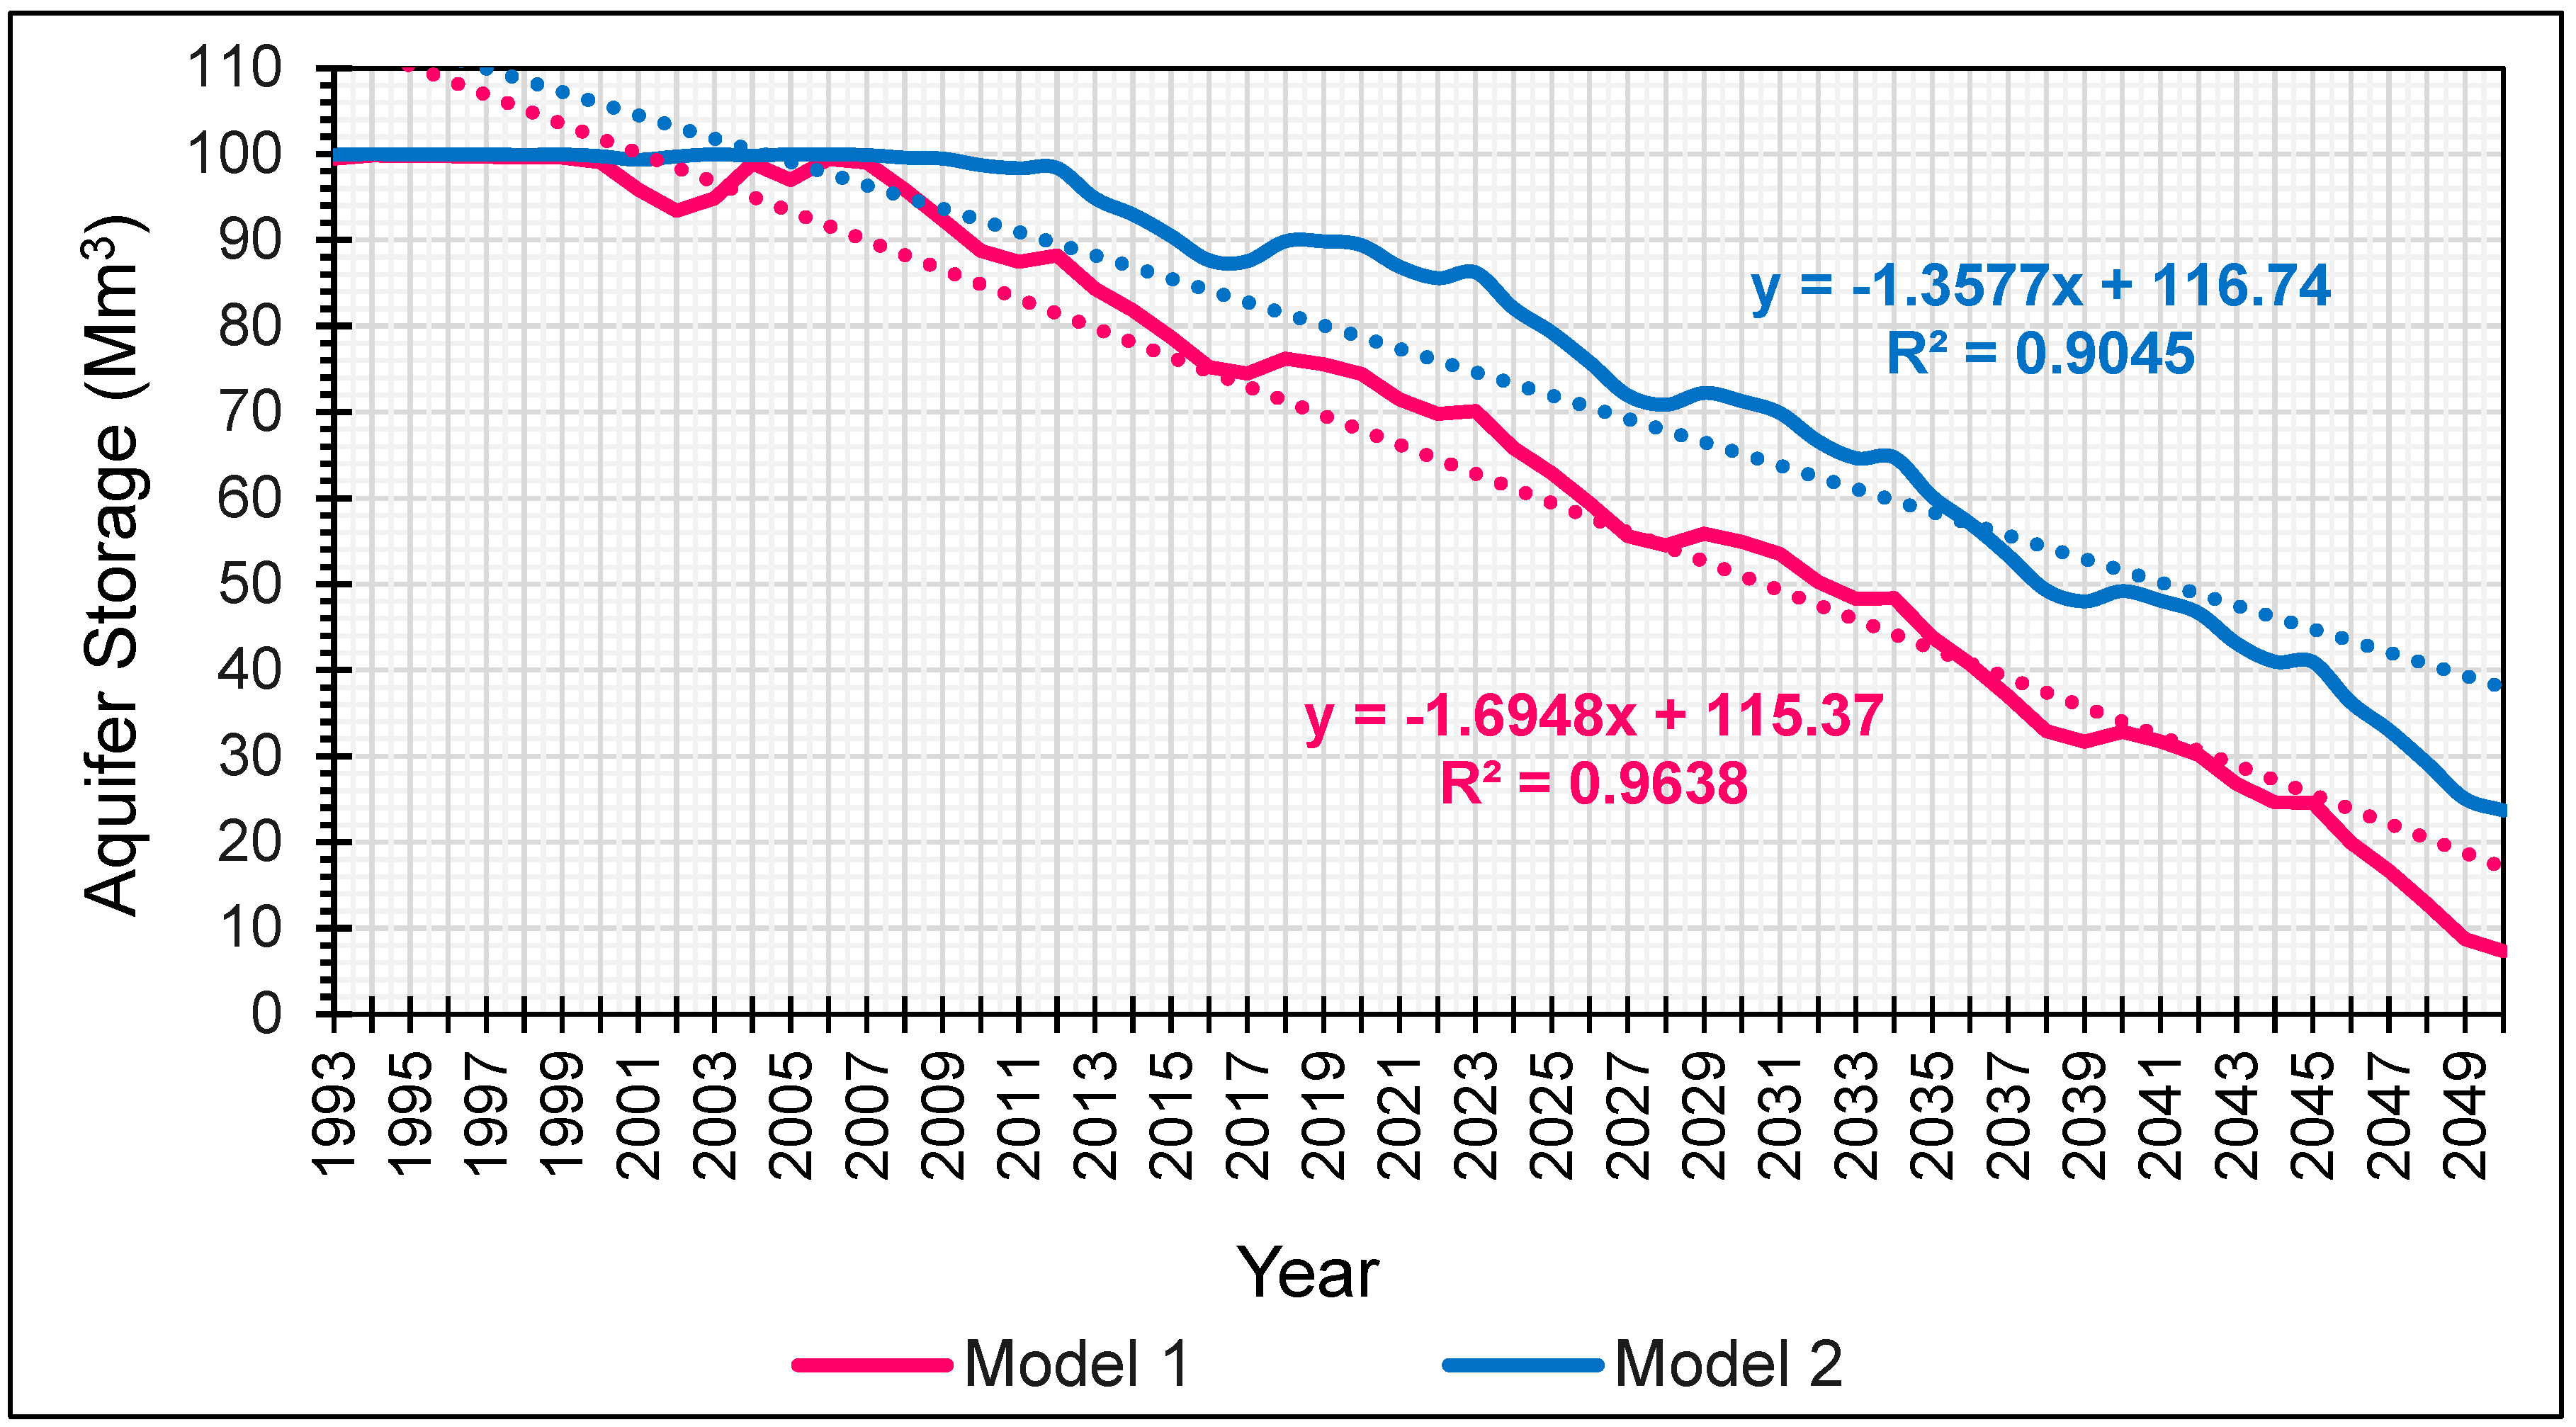
Figure 14 illustrates the linear regression curve of the storage variable of the Triassic sandstone aquifer, calculated in the two aforementioned models. This regression highlights the relationship and discrepancies between the two models, offering insights into how the aquifer’s storage dynamics differ under each modeling approach.
The coefficient of determination R2 lies between 0 and 1. In this case, the calculated coefficient of determination is equal to 0.98. Figure 15 illustrates the trends of the groundwater storage curves for the Triassic aquifer, as simulated by the two referenced models. Both curves exhibit a similar pattern, and their relationship is further analyzed through a linear regression. The linear regression highlights the trend of continuous depletion in groundwater storage over time, providing a simplified representation of the relationship between storage decline and the simulation period. The high adjusted coefficient of determination R2, exceeding 0.9, indicates a strong correlation between the two models. This suggests that despite some differences in approach, the models provide consistent projections of groundwater storage trends, reinforcing the reliability of the estimations and calculations adopted in model M2.
The hydraulic system model simulating the Zeuss Koutine aquifer [31,32,64] has been rigorously calibrated, validated, and tested post-validation. It provides a precise estimation of water demand. The calibration process was carried out not only based on the aquifer’s piezometric levels but also by comparing the volumes distributed to the main demand centers with those calculated by the model.
The calibration was carefully performed by adjusting several parameters, including population growth, its distribution across demand sites, and the specific water consumption per person. This initial calibration work was conducted on the hydraulic system model of Médenine [31,32,64], which at that time incorporated all the water resources of the governorate. The evolution of the key input parameters has since been tested and validated.
In the M2 model, these parameters were integrated while updating the necessary data, as explained in the methodology section. The comparison between the model based on observed data (M1) and the one based on estimations (M2) resulted in a determination coefficient of R2 = 0.9, confirming the consistency of the obtained results.
However, due to the water blending strategy adopted by SONEDE (where water from multiple sources is mixed in reservoirs before redistribution) it is challenging to calibrate the model using distributed volumes. Thus, the only directly comparable parameter is the volume of water pumped from the Triassic aquifer before reaching the reservoirs. This justifies our validation approach, which relies on the flow rates in the transmission links between the aquifer and the Médenine demand sites. Figure 16 provides a comparison between the recorded pumped volumes from the Triassic aquifer to the reservoirs and the calculated flow rate, which represents the water demand of the Médenine demand site from the Triassic aquifer. This figure shows an R2 = 0.86, which indicates a strong correlation between the observed and simulated volumes, suggesting a good model fit.
In summary, the results are highly satisfactory across the entire simulation period. Both models exhibit a similar trend in the storage parameter curve, with final results showing close alignment. The results confirm the robustness of the hydraulic system model in estimating water demand and groundwater storage evolution over time. Consequently, the final WEAP model of the Triassic aquifer (M2), integrated into the broader hydro-system of Médenine, is validated and will be used in subsequent analyses. The updated model, referred to as M2, will subsequently be used as a DSS to facilitate informed decision-making and optimized planning for future CC and WRM scenarios, aiding in making well-informed choices.

3.2. Reference Scenario

The final adopted model M2 provides results of the evolution over the time of the storage Triassic aquifer of Sahel EL Ababsa as given in Figure 13, marking a continuous regression to reach 23.71 Mm3 in the year 2050, giving a reduction of approximately 77%.
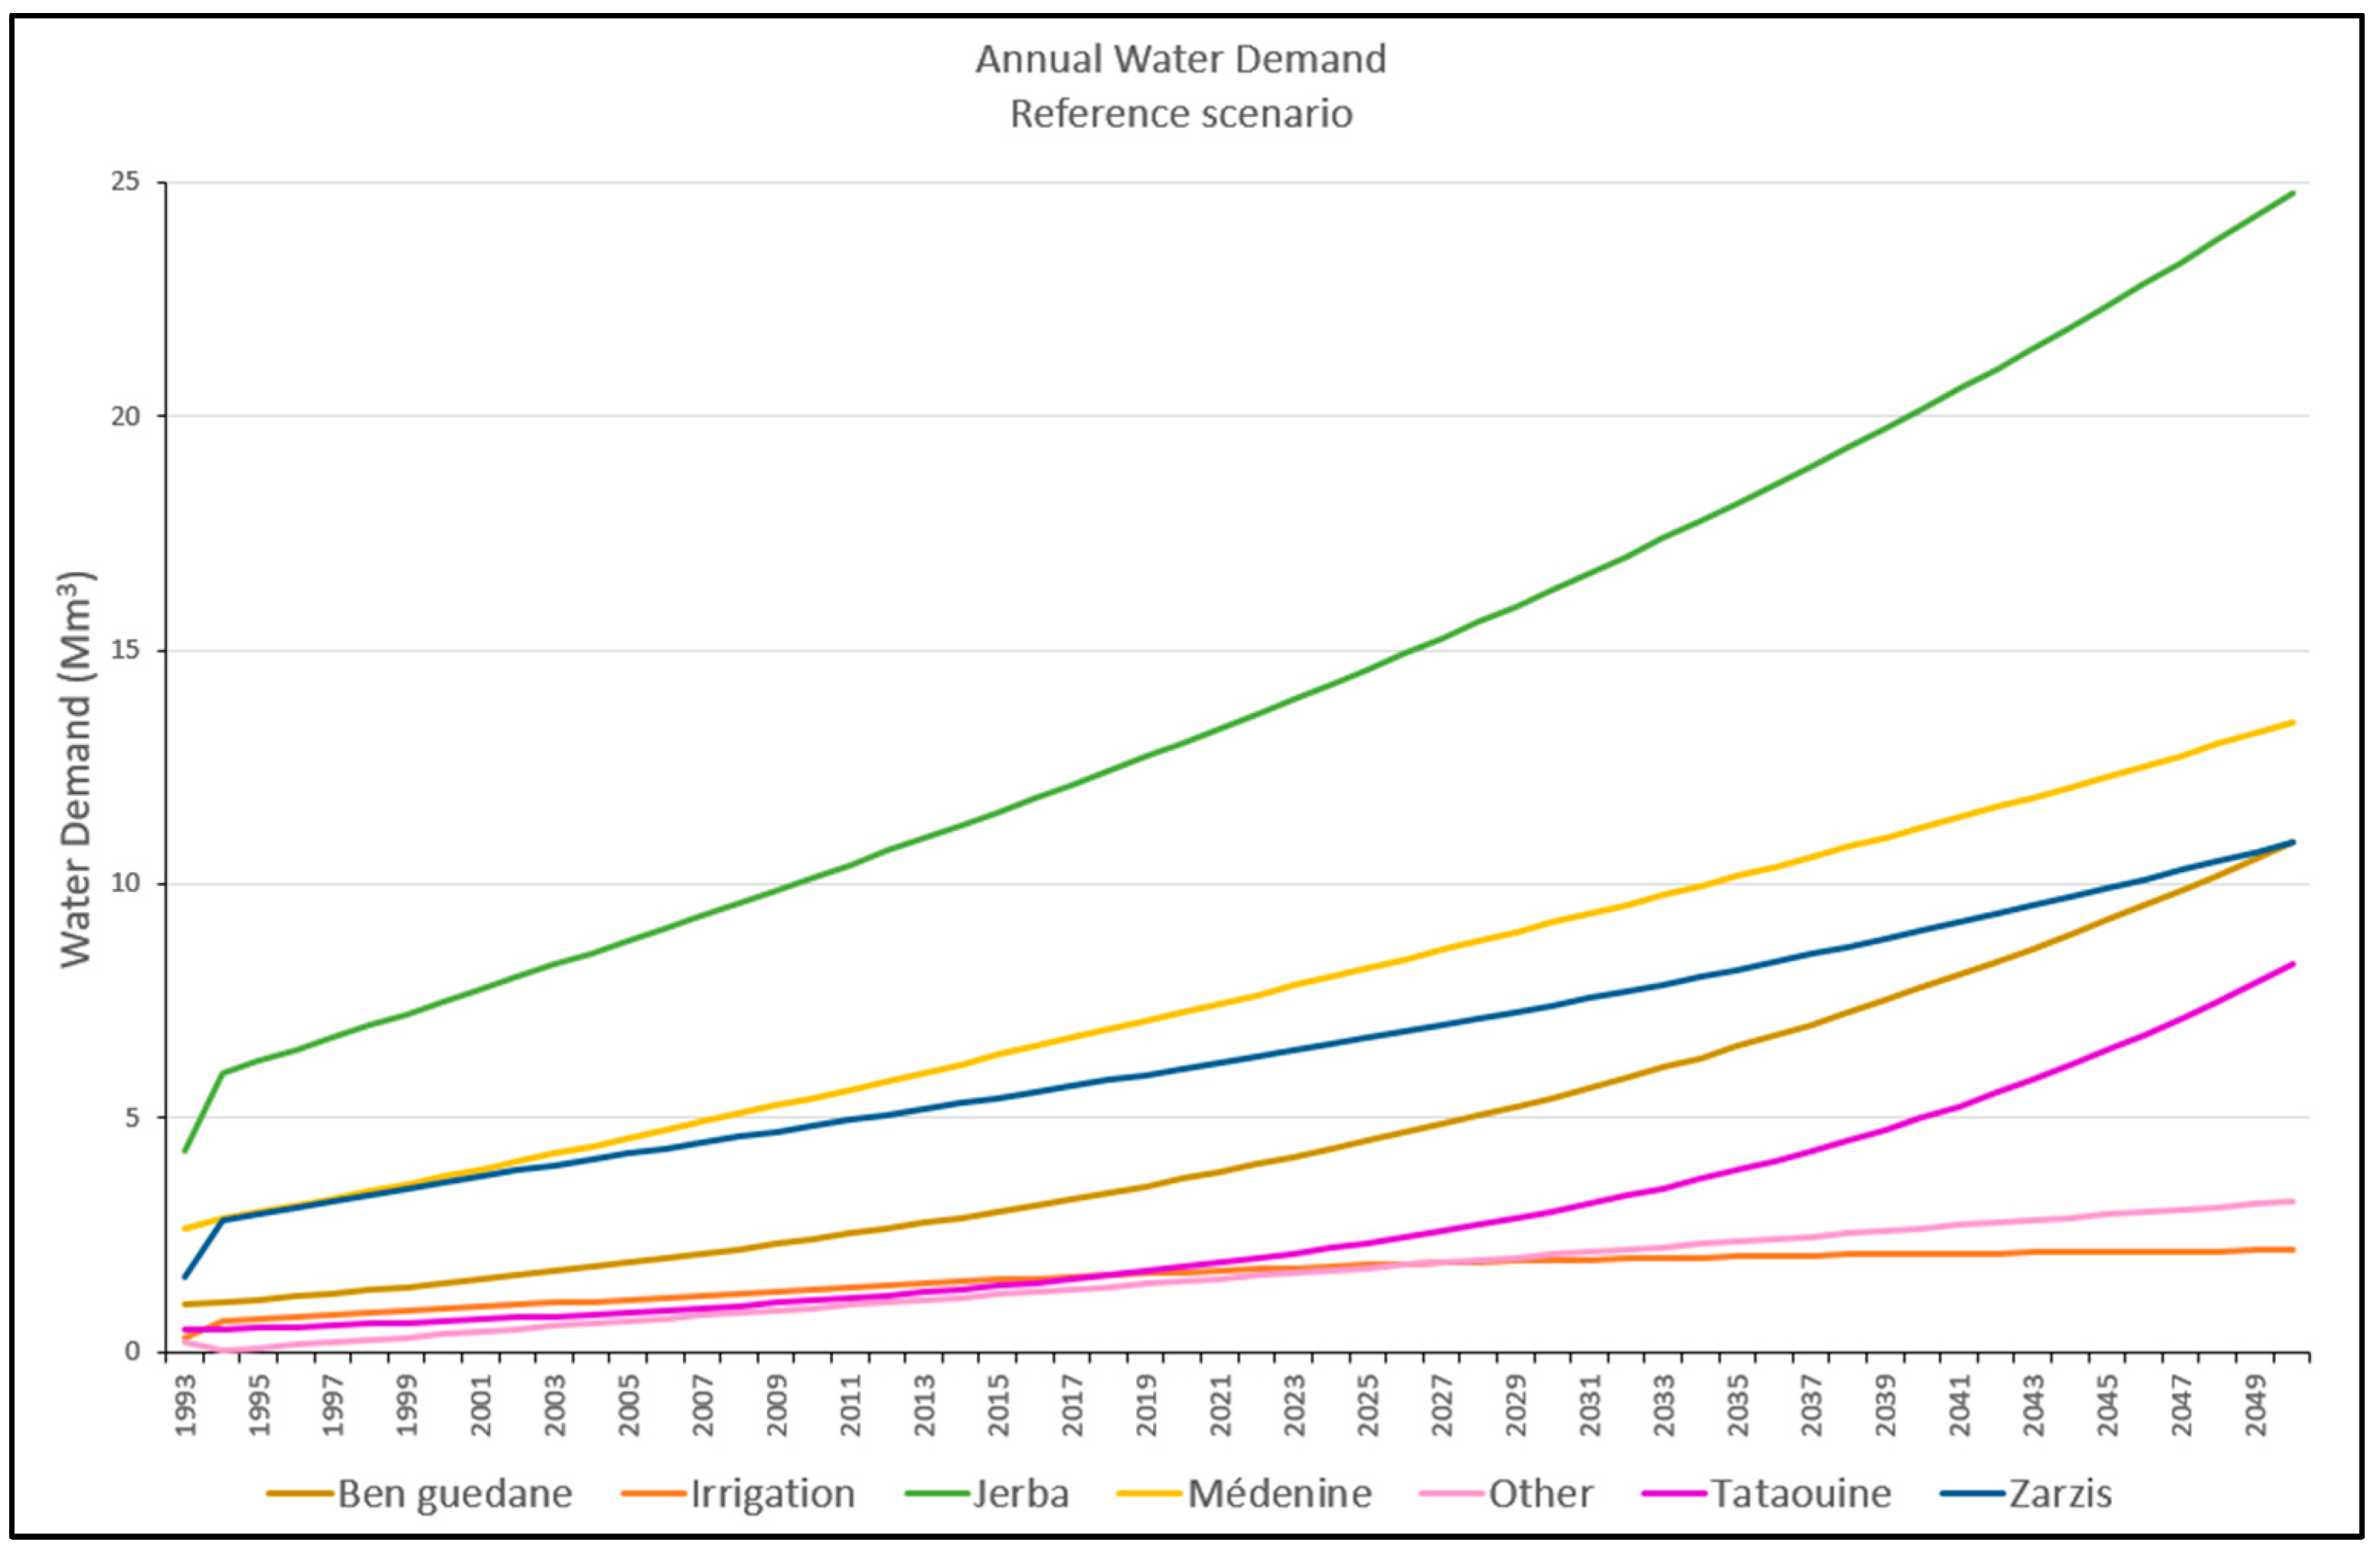
In addition to the storage parameter, the WEAP DSS provides the results of calculated demands based on the calculation of demographic development and the future evolution of specific daily consumption in the main cities of the study area. Figure 17 illustrates the different demands calculated by the WEAP DSS.
The DSS also provides the results of calculated supplies. Figure 18 illustrates the monthly direct recharge contributing to the Triassic aquifer through the soil profile, based on the adopted recharge hypothesis. Figure 19 provides, as an example, the estimated indirect recharge by infiltration in the wadi beds of the Koutine watershed following the adopted recharge hypotheses.

3.3. Climate Change Scenarios

Two climate change (CC) scenarios are developed in this study under the reference conditions: the RCP 4.5 scenario (SC1.0) and the RCP 8.5 scenario (SC2.0). According to SC1.0, the decline in the storage of the Triassic aquifer begins in 2021, with a total annual difference in storage from the reference SC0 of 16.16 thousand m3, which would reach 0.388 Mm3 by 2050. Similarly, under SC2.0, the total annual difference in storage from the reference is estimated at 18.05 thousand m3 in 2021, increasing to 0.414 Mm3 by 2050. In summary, the reduction in precipitation under future climate change scenarios by 2050 results in a significant decrease in the storage of the Triassic sandstone aquifer. However, the impacts are comparable between the two climate change scenarios. By 2050, the aquifer’s capacity is projected to be 23.71 Mm3 under the reference scenario. Under the climate change impact, it would lose more than 99% of its initial storage capacity under both CC scenarios SC1.0 and SC2.0, representing a decrease of approximately 98% compared to the reference scenario in 2050. Figure 20 illustrates the annual change in groundwater storage under the influence of the climate change scenarios, relative to the reference scenario SC0.
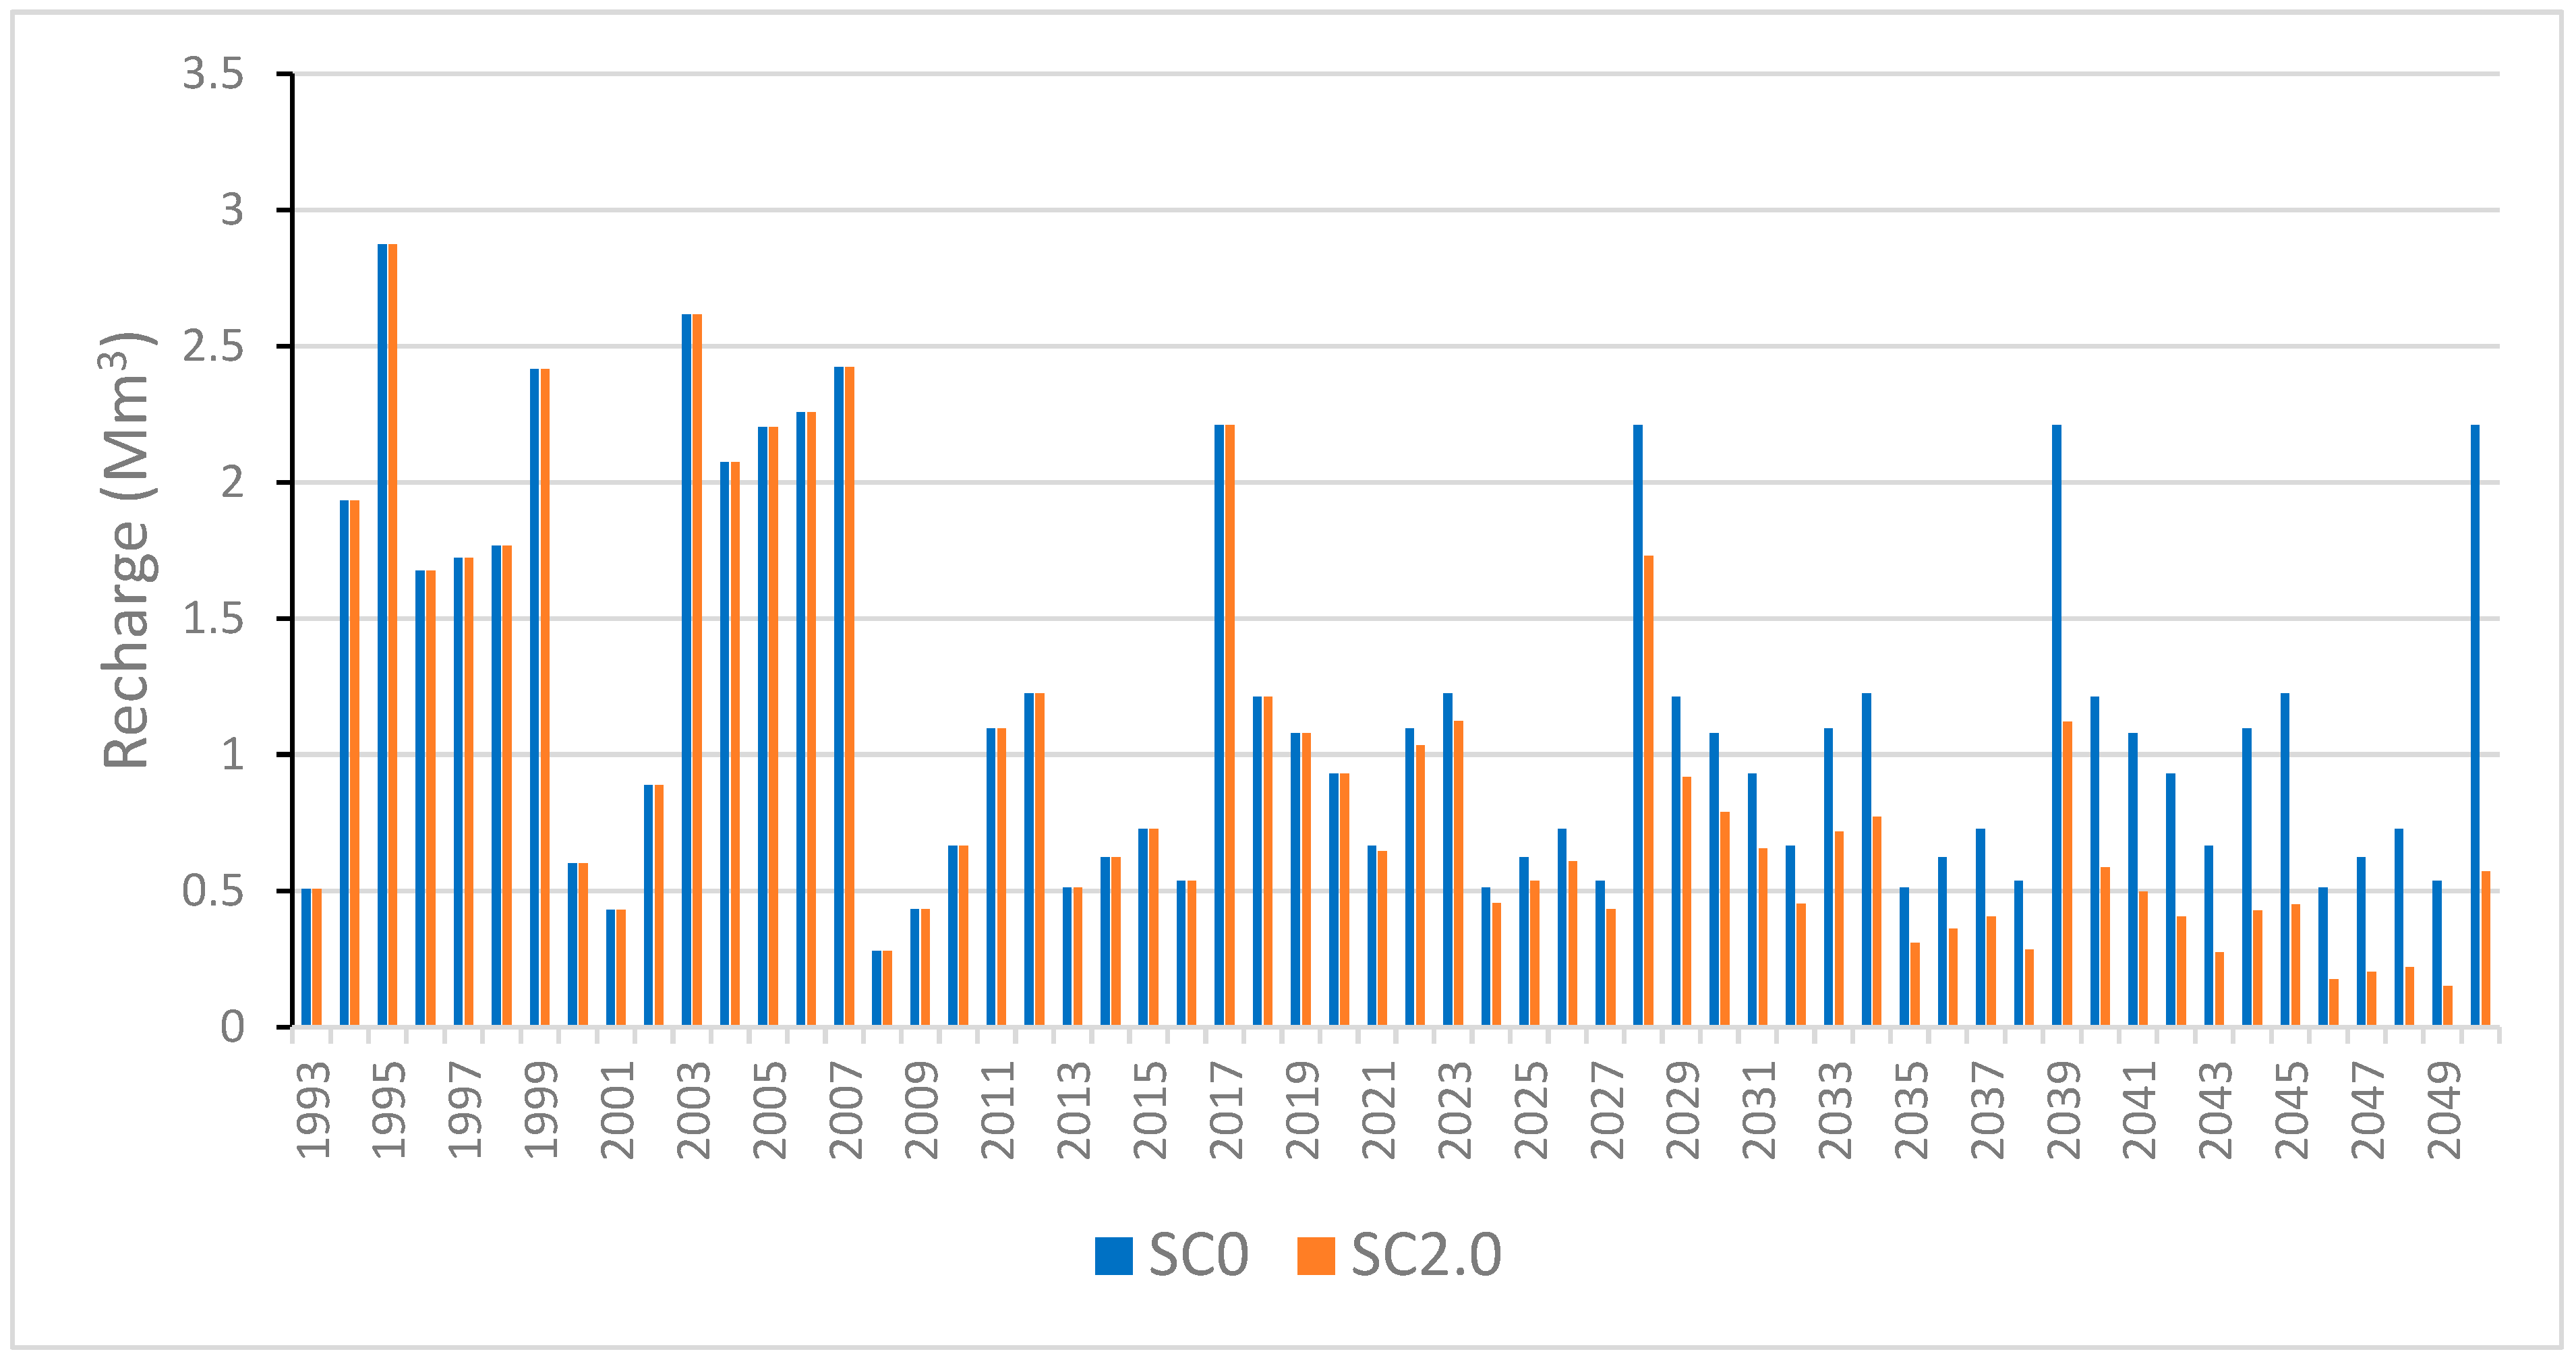
Owing to WEAP, we can also illustrate the impact of climate change on the estimated aquifer recharge. An example is provided in Figure 21, demonstrating the recharge through runoff infiltration in the Wadi El Hallouf (Koutine watershed). The effects begin to manifest slightly from 2028, with a gradual increase corresponding to the decline in precipitation under the SC2.0 scenario, particularly around 2050.

3.4. Zarat Seawater Desalination Plant Scenarios

The reference scenario integrates the used water resources up to the year 2020 in the Médenine governorate. The present scenario, called (SC3.0), contains the projected Zarat seawater desalination plant, coming into service in 2024. It will have a capacity of 50,000 m3/d, which would be doubled to 100,000 m3/d in the year 2035. The (SC4.0) scenario is describing the extension of this plant.
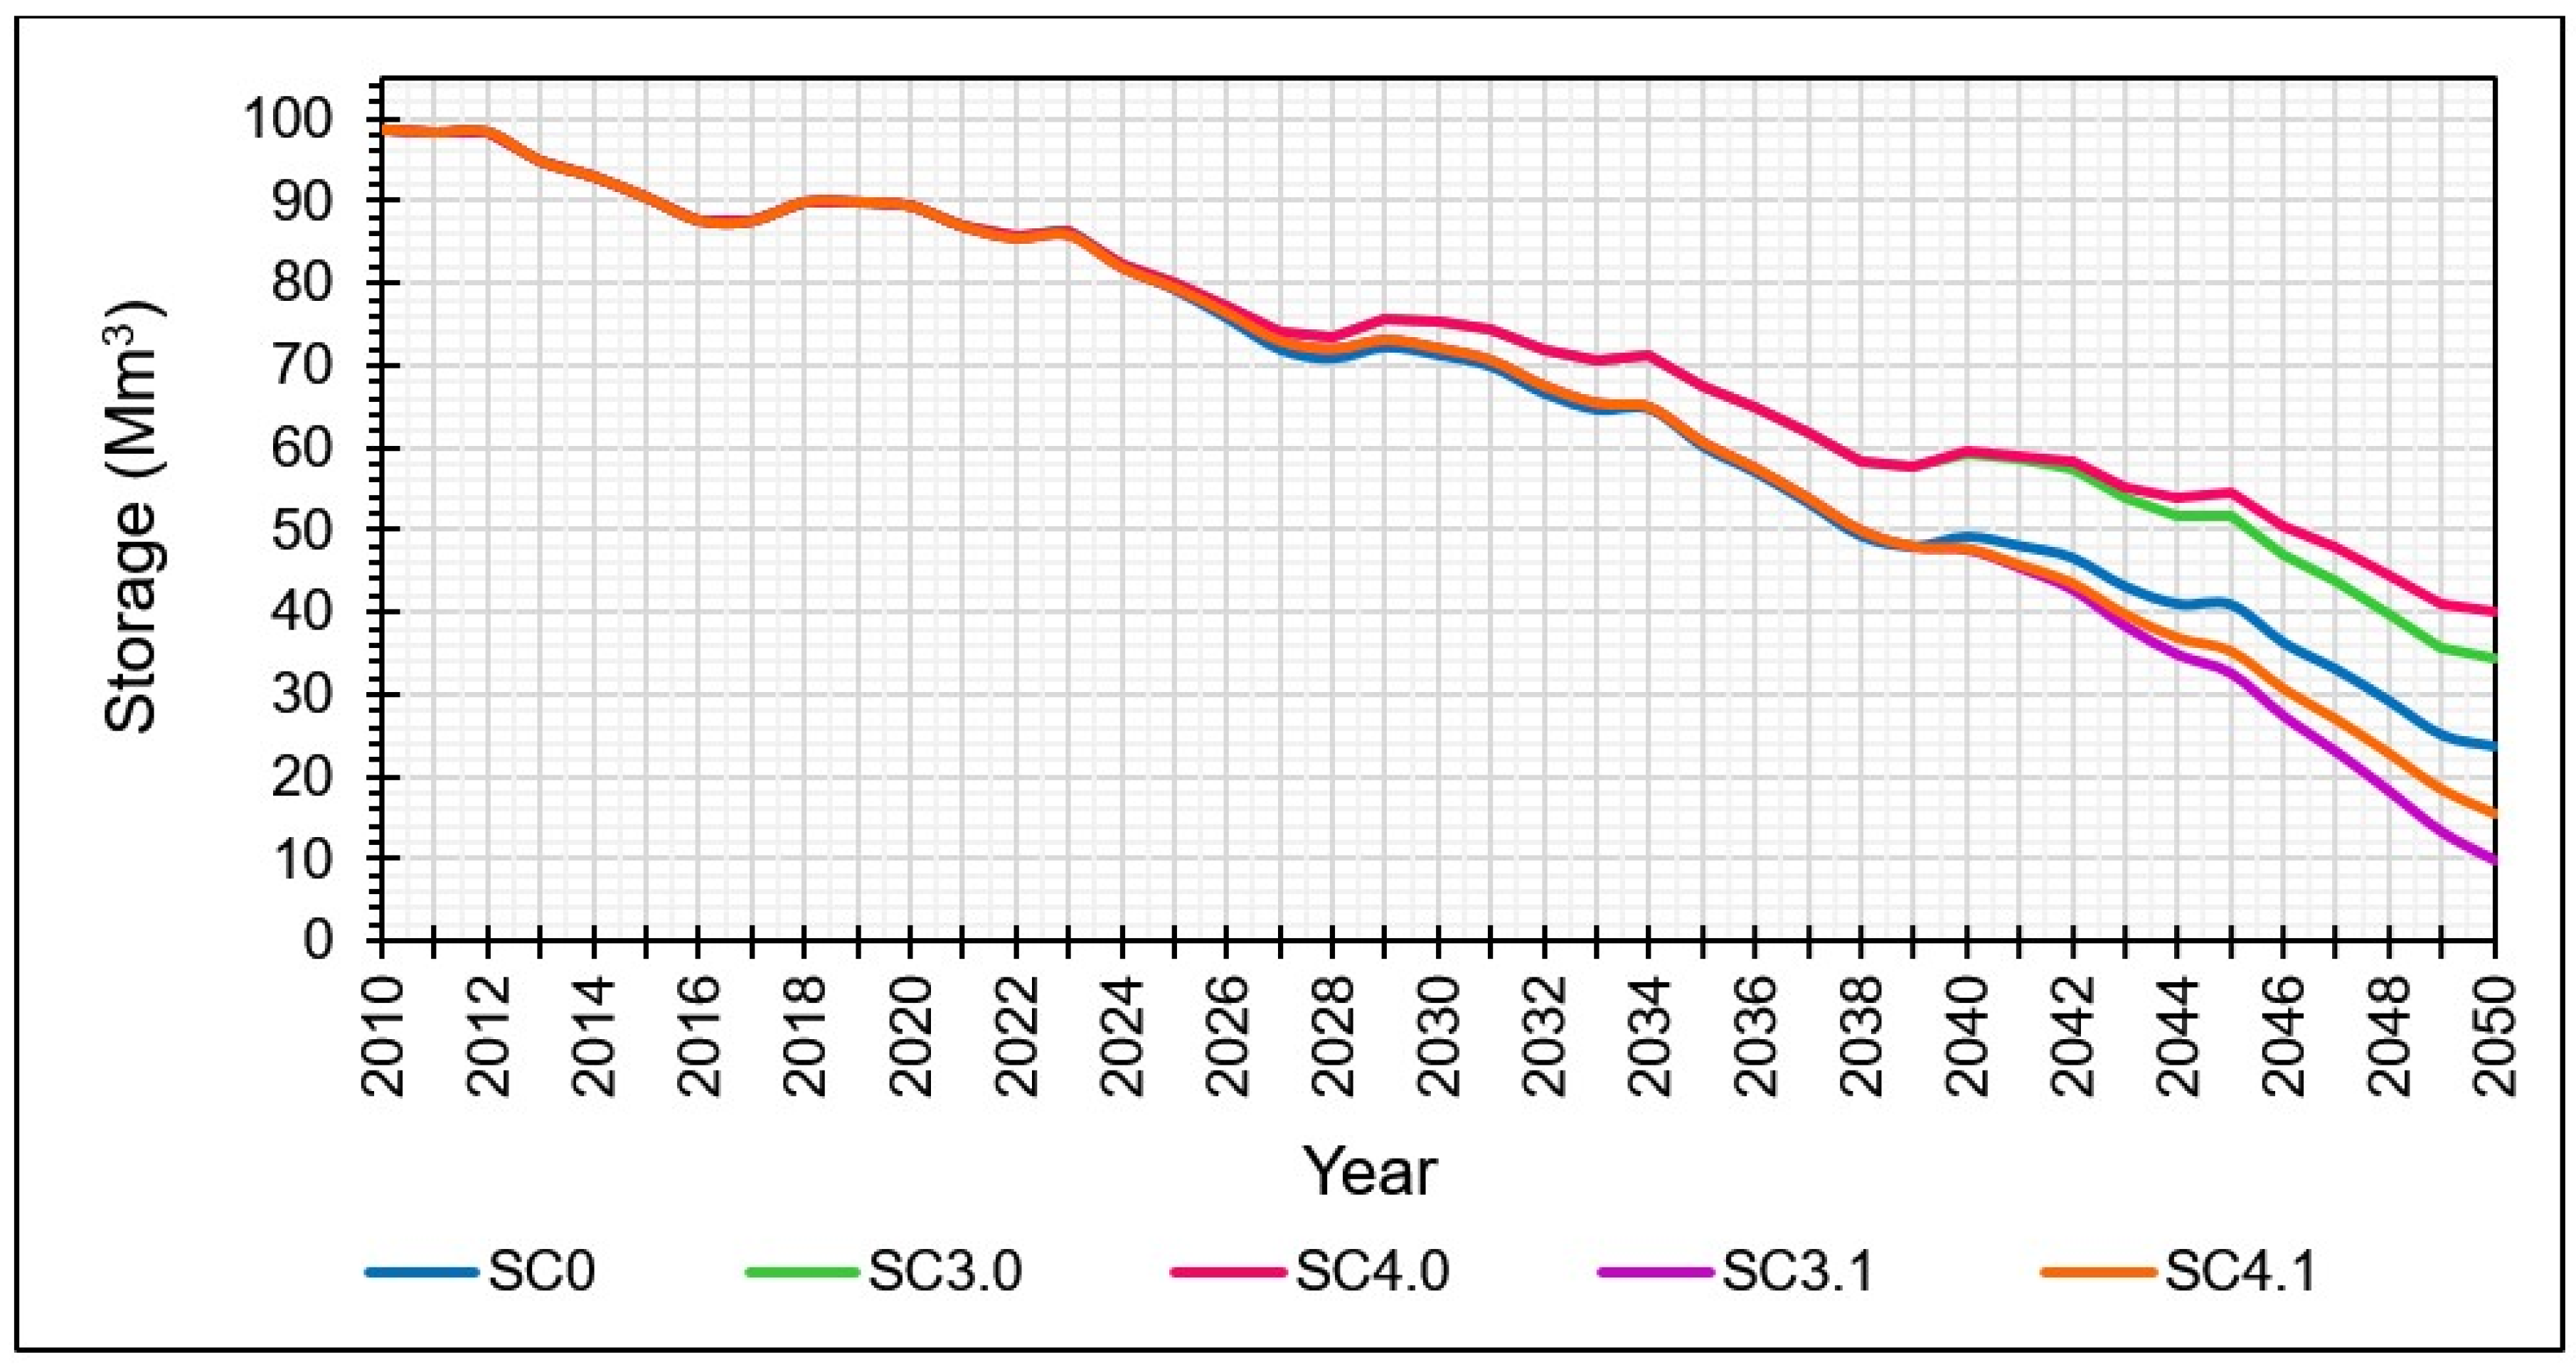
The implementation of the Zarat seawater desalination plant would cause an improvement in the water resources of the Triassic sandstone aquifer, as shown in Figure 22. The aquifer storage would increase from an estimated volume of 23.71 Mm3 in 2050 according to the reference scenario SC0 to 34.4 Mm3 according to the (SC3.0) scenario, marking an improvement of 45.1% at the end of the simulation period and according to SC0.
To highlight the CC impact on the groundwater resources, the same scenario was studied under the medium CC and with the same resources (SC3.1); the aquifer storage would reach only 9.85 Mm3, marking a decrease of 58.46% at the end of the simulation period according to the reference SC0.
Under the (SC4.0) scenario, which describes the extension of the Zarat station, the changes on the aquifer storage would start manifesting clearly from the year 2040. The storage of the Triassic sandstone aquifer would be estimated at 40.2 Mm3 for the year 2050 with an estimated improvement of 69.55%.
Unfortunately, under the medium CC and with the same resources (SC4.1), the storage would be estimated at 15.52 Mm3 for the year 2050 with an estimated decrease of 34.54% referring to SC0.
WEAP is able to give distributed volumes for each demand site. Figure 23 presents, as an example, the distributed volumes of drinking water to the Tataouine demand site under (SC3.0) and (SC4.0) scenarios. The same volumes are distributed for the scenarios (SC3.1) and (SC4.1). Thus, in 2050, the volume of water delivered to Tataouine would be estimated at 2.4 Mm3 under the reference scenario (SC0). It would be 5.6 Mm3 under the (SC3.0) scenario and about 8.3 Mm3 under the (SC4.0) scenario.

3.5. WHT Impact Scenarios

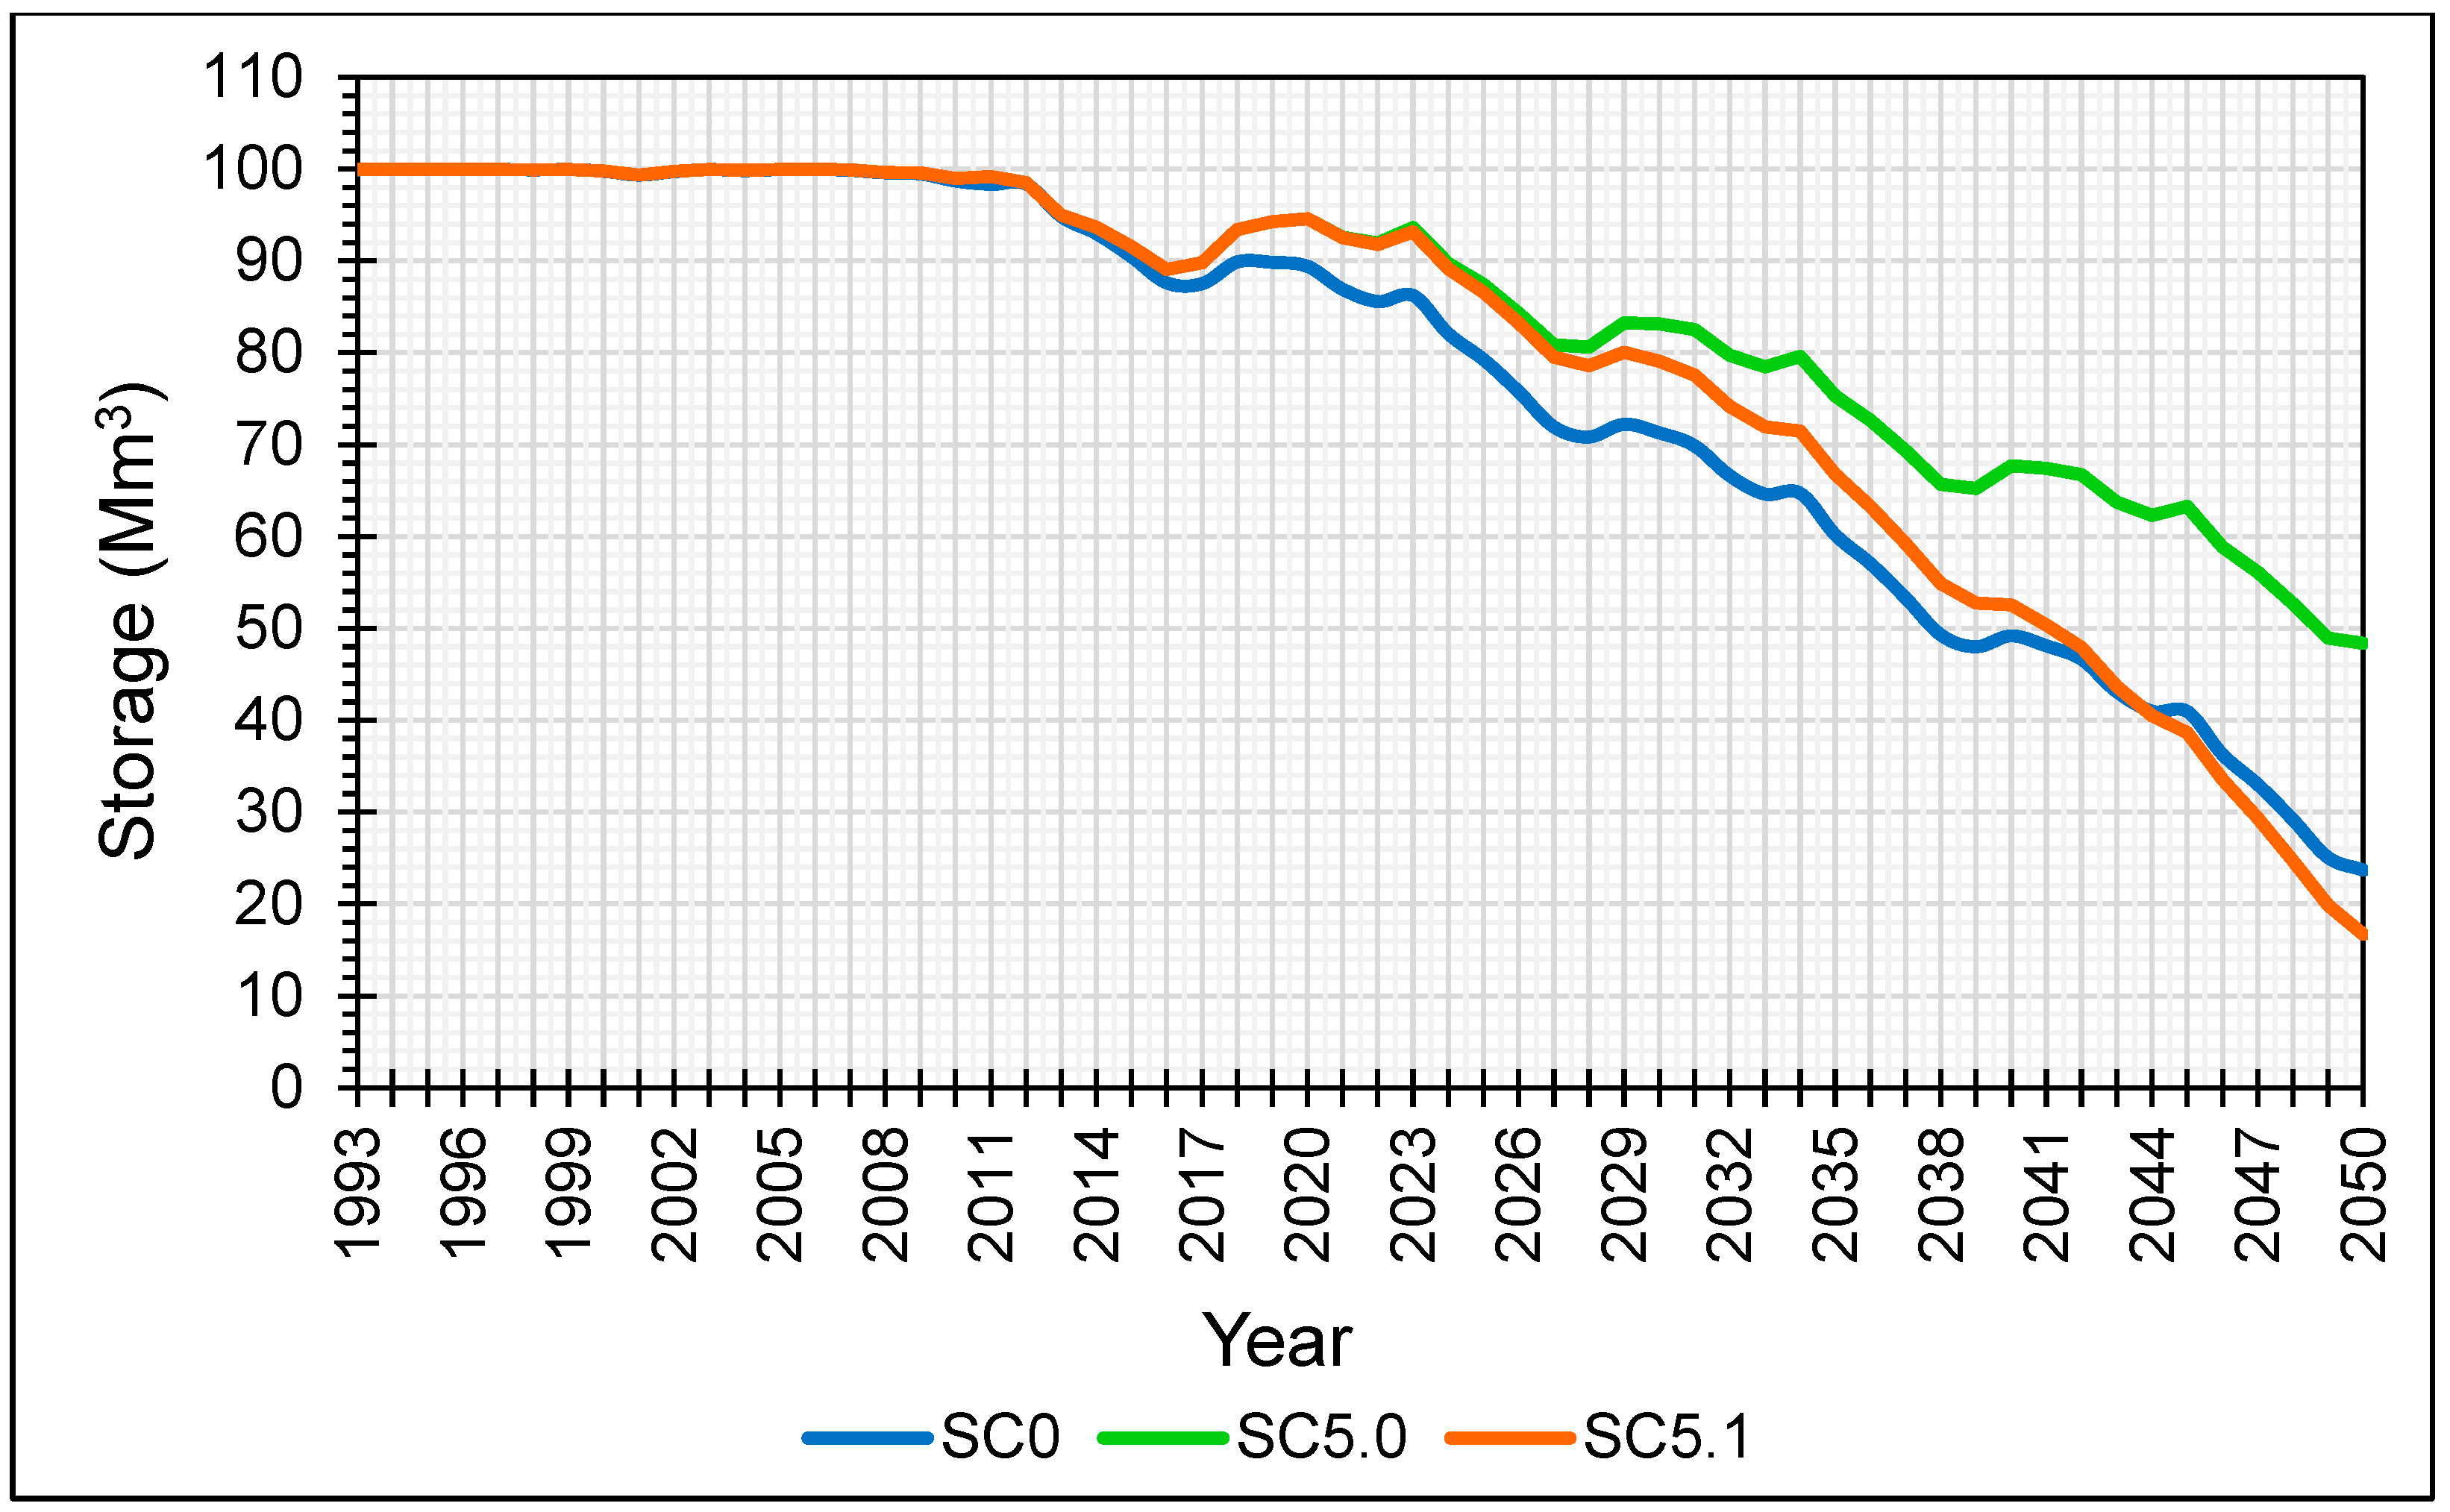
A maximum recharge rate from runoff in the wadi beds was attributed in the reference scenario (SC0) for the period from 1995 to 2010, which corresponds to the period of achievement of the water harvesting techniques (WHTs). From this date (2010), a reduction of 80% was assigned to these rates to show the effect of poor maintenance of these works. The present scenario (SC5.0) studies the case where these WHT structures would maintain their efficiency during the simulation period; this means that indirect recharge rates would remain maximum from 1995 until 2050.
Figure 24 shows the annual evolution of the Triassic aquifer storage under (SC0) and (SC5.0) scenarios. It shows that the difference began to appear in the year 2011, with low values (an improvement in storage of 0.81 Mm3 in 2011). The storage would pass from 23.71 Mm3 to 48.4 Mm3 for the year 2050, marking an extra accumulated storage at the end of the simulation period of 24.7 Mm3. This is expressed by an increase of 104% compared to the (SC0) scenario and for the same year 2050. This improvement represents approximately 25% of the initial storage capacity of the Triassic aquifer. This leads us to say that the WHT, in the case of their efficiency and their proper maintenance, is responsible for providing the quarter of its storage.
The same figure shows the evolution of the WHT scenario under the CC RCP 4.5 (SC5.1). The impact of CC on the WHT role is expressed by a decrease in the recharge and by a decrease in the storage aquifer by the year 2050. It would be 16.7 Mm3, showing a decrease of 29.56% compared to the (SC0) scenario.
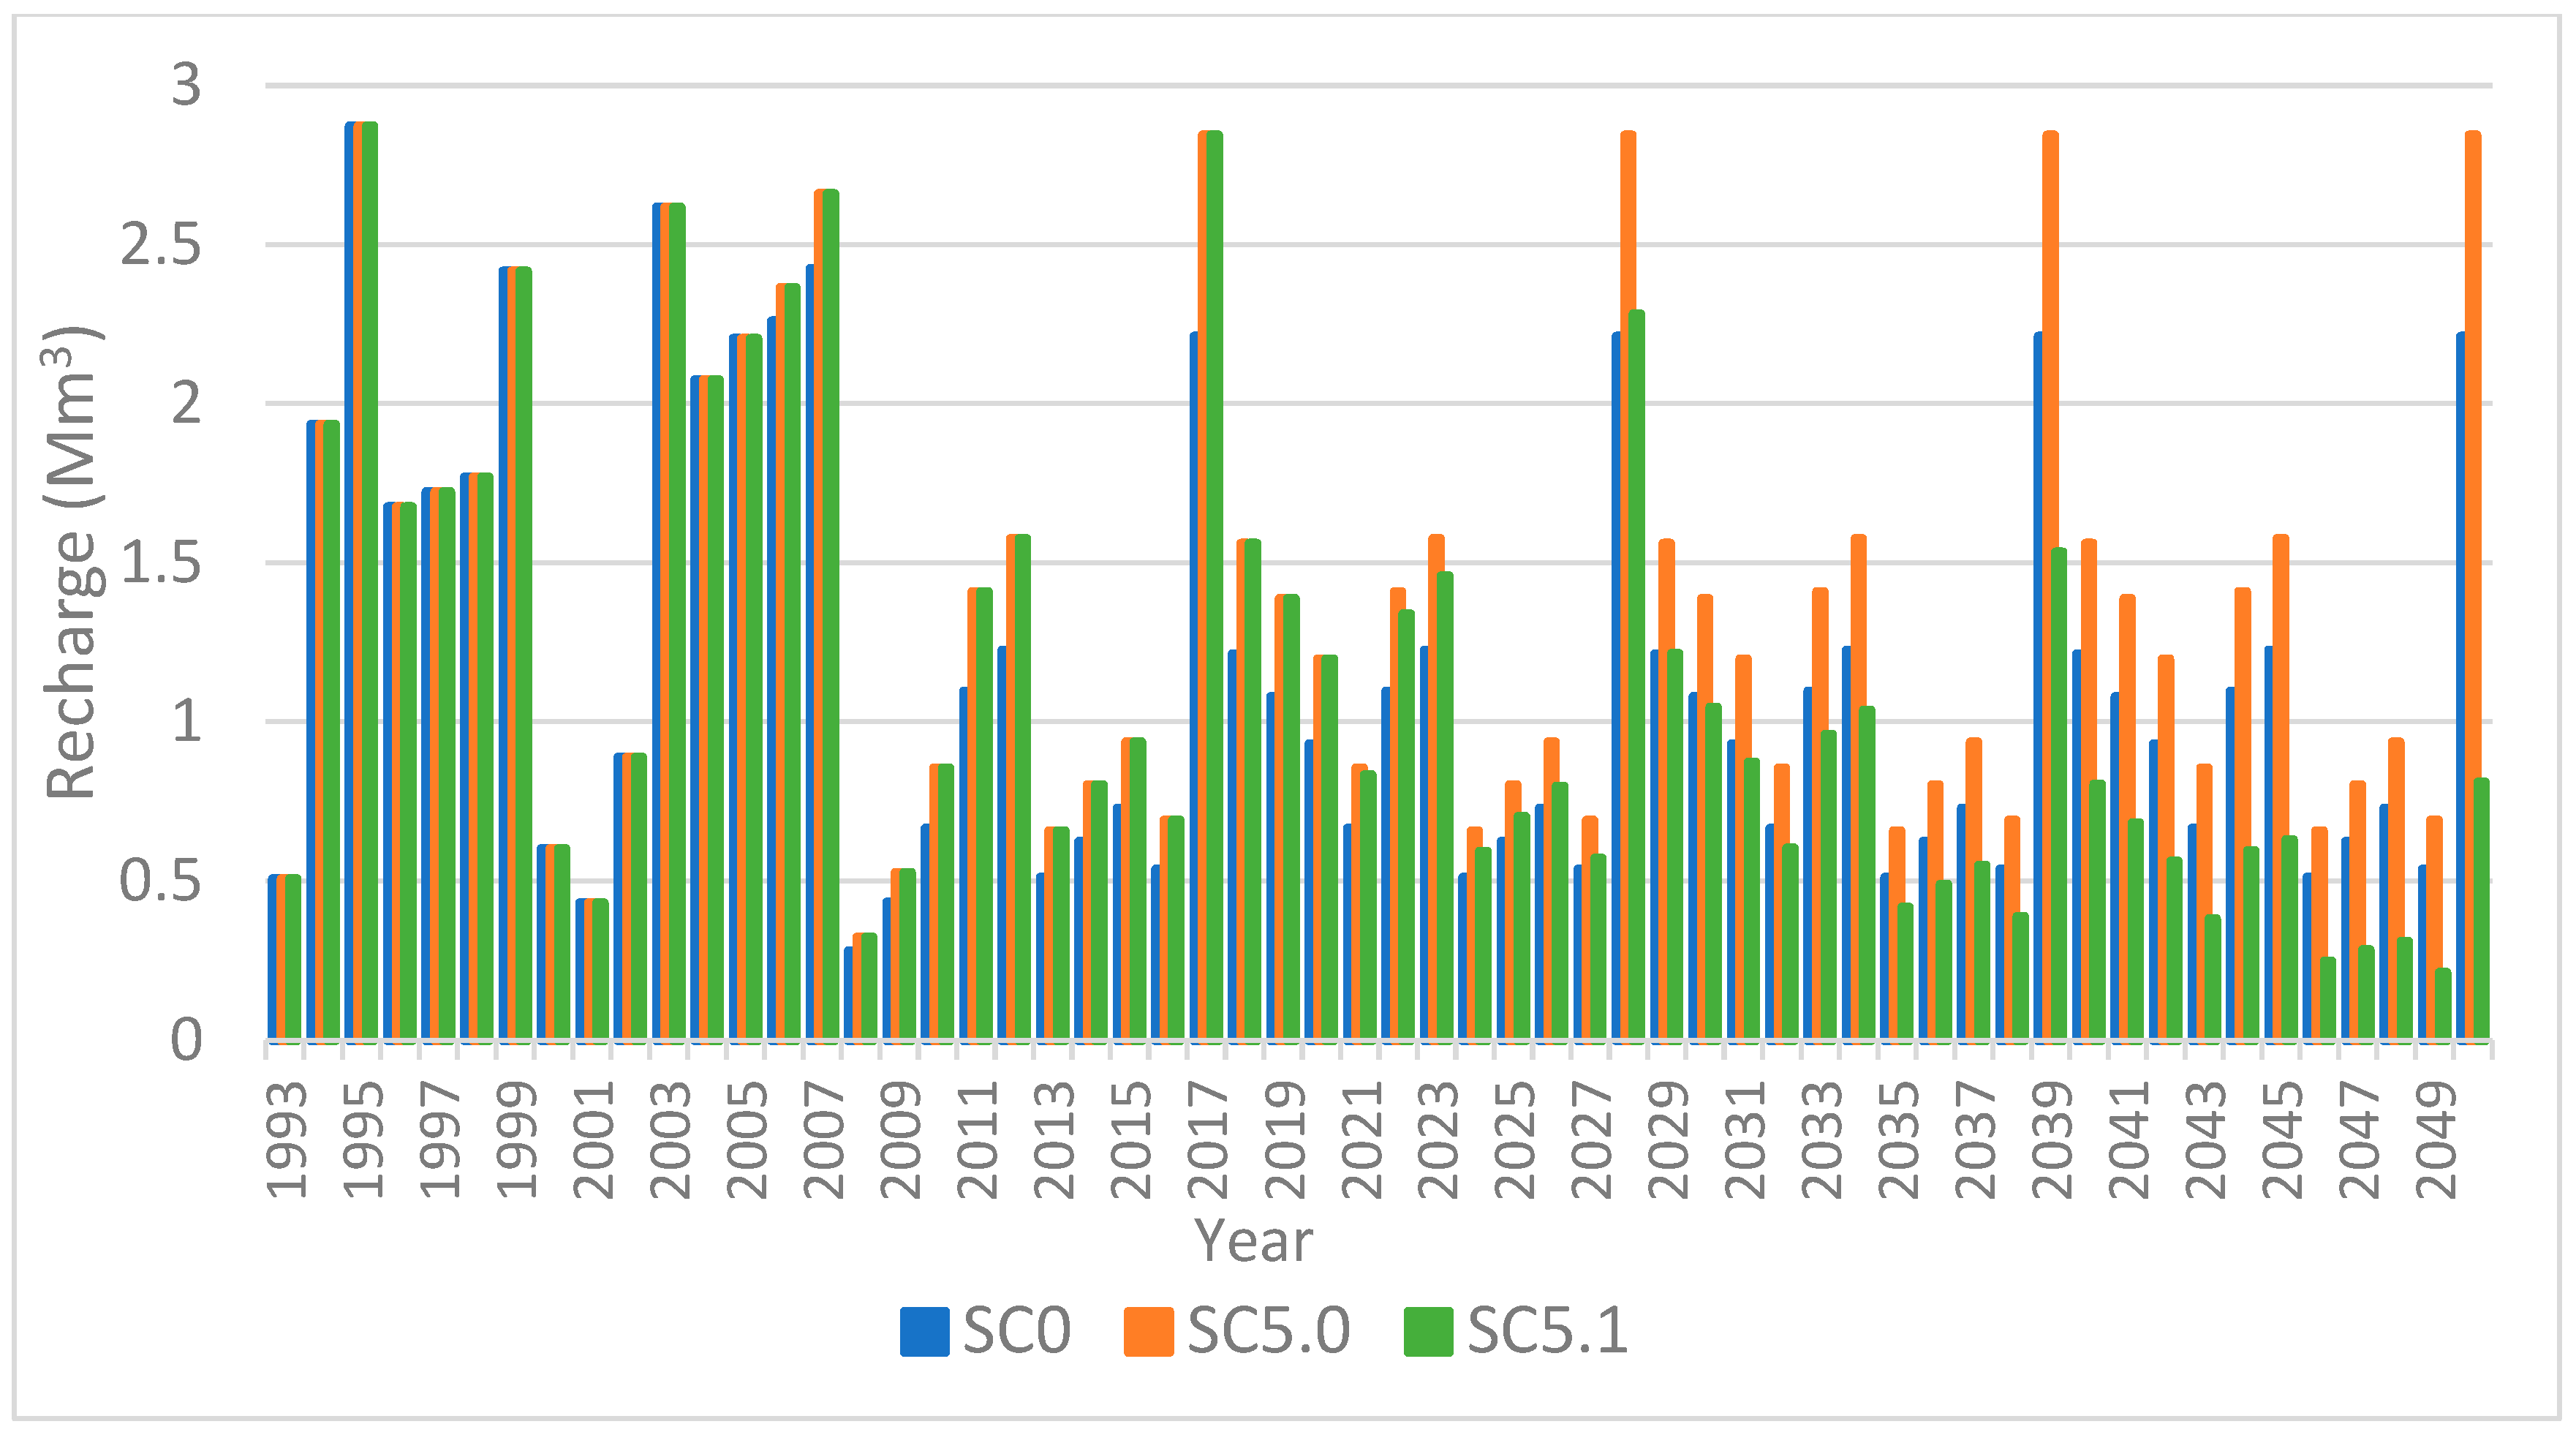
As an example, Figure 25 shows the difference in the recharge in the Wadi El Hallouf bed, representing the Koutine watershed in this WEAP project, between the reference, the SC5.0, and the SC5.1 scenario; it shows a decline in recharge linked to the CC. For the year 2050, the recharge in the Koutine watershed would decrease from 2.8 Mm3 under SC5.0 to 0.8 Mm3, as example.
These results highlight the crucial role of WHT in sustaining aquifer storage, as their proper maintenance ensures significant long-term benefits, while climate change under RCP 4.5 reduces their effectiveness, leading to a notable decline in storage.

3.6. Irrigation Scenarios

The “Irrigation” demand site, which represents the agricultural demands, consumes 1.7 Mm3 in 2020, which could reach 2.2 Mm3 by 2050 by increasing at the same rate, according to WEAP estimates. The present scenario assumes the stability of the Triassic aquifer water demand destined to agriculture since there is a serious motivation from the services responsible to install a treated wastewater station in the study region to use for the irrigation. This stability of agricultural consumption is assumed to start in the year 2027 and the scenario is called (SC6.0). 
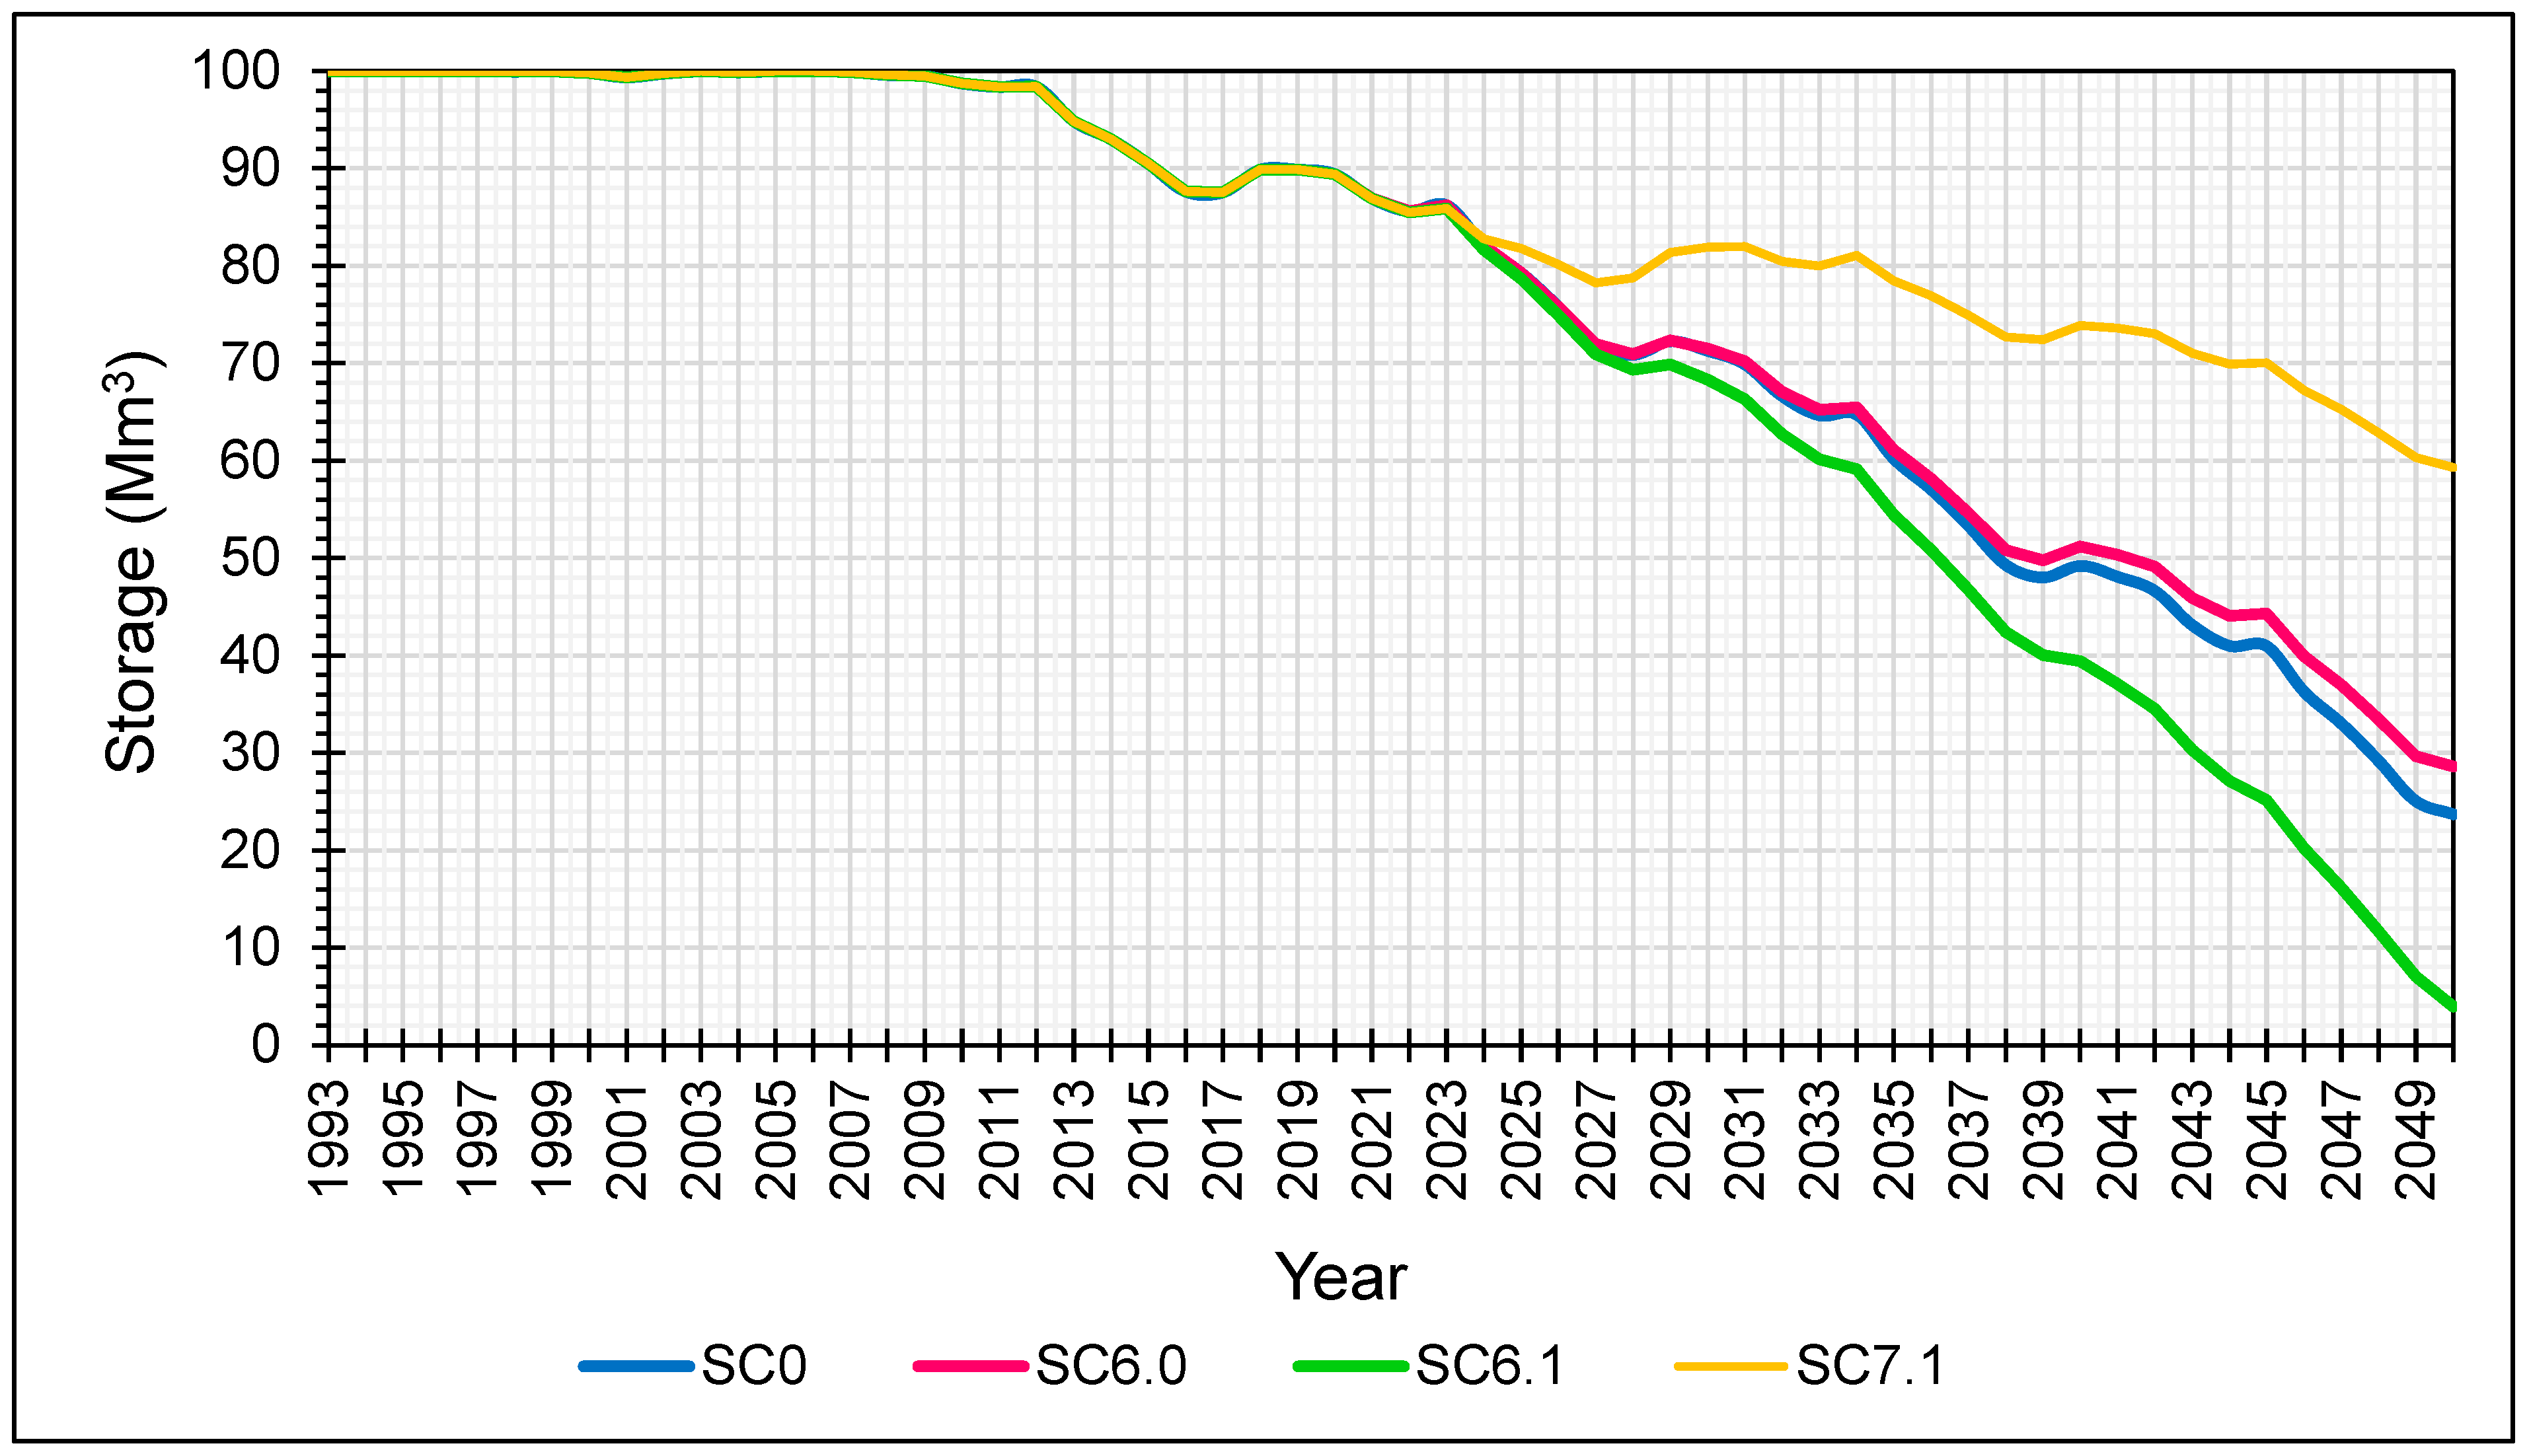
Figure 26 shows the evolution of the annual Triassic aquifer storage calculated by WEP DSS under the reference scenario SC0 and the (SC6.0) scenario. It shows an increase of 4.9 Mm3 of the Triassic storage aquifer, showing an improvement of 20.67%. Under the CC scenario, the present scenario called (SC6.1) would give a reduction of 24.66 Mm3 of the Triassic storage aquifer, showing a decline of 83% compared to the reference conditions.
While the SC7.1 scenario may appear unrealistic, it highlights the substantial impact of irrigation on the aquifer. This “Irrigation Cancellation” scenario reveals a significant influence on aquifer storage. As shown in Figure 26, the annual evolution of the Trias aquifer’s storage under SC7.1 becomes noticeably different starting in 2025, with an initial improvement of 1.1 Mm3. By 2050, the aquifer’s storage is projected to be 59.3 Mm3 under SC7.1 showing an improvement of 36 Mm3 (250%) compared to the reference scenario. This result reflects the heavy reliance of the aquifer on irrigation withdrawals and suggests that reducing or optimizing irrigation could significantly enhance groundwater storage, emphasizing the need for sustainable water management practices. It serves as a stark warning to policymakers about the detrimental effects of irrigation on groundwater resources in the Médenine region, highlighting the urgent need to adopt alternative water sources, such as treated wastewater from wastewater treatment plants, to ensure long-term water sustainability.

3.7. Aquifer Recovery Scenario

The studied scenario was developed by integrating SC1.0, SC3.1, SC4.1, SC5.1, and SC6.1 scenarios, along with a projected reduction in specific drinking water consumption from 130 L/d/person to 110 L/d/person by 2050, as estimated by SONEDE. Its objective is to determine the volume of water needed to restore the aquifer to its initial level. To achieve this, the WEAP DSS proposes supplementing the main demand sites of Médenine and Tataouine with an additional water supply. This supplementary supply starts at 0 in 2024 and gradually increases to fill the deficit by 2050. Calculations estimate this additional supply in 2050 at 165,041 m3/d.
This result illustrates, in Figure 27, the projected water deficit in the region by 2050 and proposes a supplementary water supply to restore the aquifer. To provide a practical comparison, the required additional supply of 165,041 m3/d in 2050 is roughly equivalent to the capacity of a new desalination plant (about 150,000 m3/d) or three smaller plants (50,000 m3/d each) as commonly used in Tunisia. These examples are meant to help interpret and visualize the volume of water needed to address the deficit. Table 7 summarizes the results of all the studied scenarios.

4. Discussion

Modeling is a powerful tool for understanding complex systems and predicting future scenarios. However, it is essential to recognize that all models are subject to uncertainties that can influence their outcomes. These uncertainties may arise from various sources, including data limitations, assumptions made during model development, and external factors that may change over time. Acknowledging these uncertainties is crucial for accurately interpreting model results and making informed decisions.
In particular, this study relies on empirical formulas and assumptions without sufficiently addressing their uncertainties. Conducting sensitivity analyses for these parameters would help better quantify their impact on the model’s reliability and improve the robustness of the conclusions. This aspect will be further investigated in future studies on the region to refine the analysis and enhance the understanding of these uncertainties.
Furthermore, while the study is well conducted regarding the estimation of demand evolution based on population growth and specific consumption, there are uncertainties in this evolution. Indeed, there is a commitment from the responsible services to enhance efforts to reduce current specific consumption, which poses a challenging yet achievable goal.
Additionally, although the simulation period considered the highs and lows of the tourism sector, this sector is generally projected to increase in the model. The agricultural sector also experiences a gradual and normal increase in irrigated areas and irrigation flows, considering the current situation and the available species in the region. It is worth noting that the introduction of irrigated olive varieties in the last decade has increased agricultural consumption. Therefore, the uncertainty in this sector lies in the types of crops that may be grown in the future, as well as any limitations that the responsible services at the governorate level might impose on agricultural usage.
Another source of uncertainty pertains to the daily output produced by desalination plants. In fact, the daily production capacity considered in the model is not always achieved, taking into account interruptions for maintenance, breakdowns, or other unforeseen events. This capacity is achieved about 85% of the time.
Furthermore, uncertainties related to climate change scenarios also play a significant role in the modeling process. These scenarios often involve shifts in precipitation patterns, and the frequency of extreme weather events, all of which can substantially affect water availability and demand. The manuscript adopts the RCP4.5 and RCP8.5 scenarios, which are widely recognized as standard and relevant for climate impact studies. While it is true that climate projections encompass a wide range of possible futures, the choice of these two scenarios is justified by their continued use in scientific assessments and policy recommendations, particularly in the study region, where RCP2.6 is no longer considered a realistic pathway.
Additionally, while uncertainties exist in regional climate models (RCMs) and their propagation into hydrological outcomes, the selected approach ensures a balance between model complexity and practical applicability. Downscaling techniques inevitably introduce some variability, but RCP4.5 and RCP8.5 provide a reasonable representation of likely climate futures, aligning with observed trends and policy-driven expectations. Moreover, the methodology already accounts for fluctuations in precipitation and their influence on aquifer recharge, considering both interannual variability and long-term trends.
The decrease in average annual precipitation by the year 2050 is expected to be between 5% and 10% according to the RCP 4.5 scenario and between 1% and 14% according to the RCP 8.5 scenario. Although a detailed confidence interval analysis for precipitation projections could further refine the results, the core objective of the study is to assess the relative impacts of climate scenarios on water resources rather than to quantify precise probabilities. Given the inherent uncertainties in all climate models, the emphasis remains on providing a robust yet interpretable framework for water resource planning.
As climate change progresses, the potential impacts on both the agricultural and tourism sectors may lead to unforeseen shifts in resource requirements and consumption patterns. However, by integrating well-established climate scenarios and reflecting observed trends, the model remains a valuable tool for guiding water management strategies. Future updates can incorporate evolving climate projections as more refined data become available, ensuring the continuous relevance of the approach.
In addition to the limitations related to data availability, a notable limitation is the exclusion of certain critical factors—such as water quality and ecological impacts—from the analysis. Water quality is essential for evaluating the sustainability of water resources, while understanding ecological impacts is vital for assessing the broader environmental consequences of water management practices. These important factors could be the focus of future research, allowing for a more in-depth analysis while maintaining the conciseness of this manuscript and preventing the results from becoming overly complicated.
In summary, while modeling serves as a vital instrument for analyzing complex systems and forecasting future scenarios, it is imperative to acknowledge the inherent uncertainties that accompany these models. These uncertainties must be considered in the future and updated as necessary to improve the model’s accuracy and reliability.
Adopting the above results, during the simulation period (1993–2020), the total recharge was varying from a minimum value of 1 Mm3/year to a maximum value of 7 Mm3/year, while the recorded total demands were varying from 4.5 to 7 Mm3/year for the same period. During the forecast period (2020–2050), total recharge of the Triassic aquifer would be varying from 0 Mm3/year as the minimum forecasted value to a maximum of 4 Mm3/year according to both RCPs (Representative Concentration Pathways): RCP4.5 and RCP8.5 CC scenarios. Thus, the total demands for the Médenine and Tataouine cities, which are supplied with about 30% from the Triassic aquifer, would be varying from 23 Mm3 in 2021 to a maximum forecasted demand of 74 Mm3 in 2050. These values translate the deficit report of the water supply and demand balance. In fact, the Tunisian population’s average specific consumption estimated for 2020 is about 130 L/day/inhabitant [57], which is comparable to some other European countries having abundant resources (130 to 160 L/day/inhabitant for Denmark and 140 to 160 L/day/inhabitant for France).
The lack of precipitation and the sharp increase in water demand compared to the recharge would cause an overexploitation of the Triassic aquifer water resources and the situation is estimated to get worse especially with future climate change.
There is a willingness from the responsible services to reduce consumption around 2050 to 110 L/day/inhabitant, which is introduced in the WEAP DSS as a scenario, considering all available and projected resources. The simulations illustrate that building and increasing desalination plant capacity can substantially improve the Triassic aquifer behavior. These findings highlight the importance of continued investment in desalination infrastructure to enhance water availability. Unfortunately, all these efforts are insufficient to relieve the aquifer and restore its initial level. To achieve this purpose, and to satisfy these growing demands without damaging only the Triassic aquifer, three seawater desalination plants (SDPs) are needed, like those often used in Tunisia in Jerba, Sfax, Sousse, and Zarat, with a capacity of 50,000 m3/d. It is to be noted that the Zarat SDP cost 371 million Tunisian dinars (118 million US dollars) [57]. These findings highlight the seriousness of water scarcity in Tunisia to act deeply within society to ensure the sustainability of these resources, through awareness-raising and prevention efforts.
While seawater desalination is often presented as a viable solution to water scarcity, it is essential to consider its potential environmental and economic impacts. The process requires significant energy input (2.6 kWh/m3) [57], often relying on fossil fuels, which can contribute to greenhouse gas emissions and climate change. Additionally, the disposal of concentrated brine (a byproduct of desalination) can harm marine ecosystems by increasing salinity levels and introducing chemical residues. In Jerba, the desalination plant alone discharges approximately 58 tons of saline solution per day. From an economic perspective, desalination infrastructure and operational costs can be substantial, making it a less feasible option for regions with limited financial resources. Therefore, while desalination can provide a reliable water source, a comprehensive assessment of its sustainability and long-term viability is crucial.
On the other hand, assuming that irrigation from the Trias aquifer ceases starting in 2025 would result in a 250% increase in aquifer storage compared to the reference scenario, with storage projected to reach 59.3 Mm3 by 2050. It is important to note that irrigation accounts for 25% of the total demand on the Triassic aquifer in Sahel El Ababsa. These findings underscore the urgent need to identify alternative water resources for irrigation, such as treated wastewater from wastewater treatment plants, to reduce reliance on the aquifer and promote sustainable water management.
The traditional water harvesting techniques (WHTs) in this region, including recharge wells, play a crucial role in sustaining water availability. However, poor maintenance has led to clogging and reduced efficiency, threatening their long-term effectiveness. To ensure sustainability, regular monitoring and community-based management strategies are essential. Implementing maintenance plans, training local stakeholders, and integrating modern filtration techniques, such as upstream filtration systems and sedimentation basins, can help preserve these structures and enhance groundwater recharge. Additionally, using vegetation to stabilize soil and reduce erosion can further minimize sediment transport to recharge wells. Proper management is key to maximizing the benefits of WHT and securing water resources for future generations.
In fact, the implementation of desalination and water harvesting technologies faces several socio-economic obstacles that can hinder their effectiveness and sustainability. One significant challenge is funding, as the initial capital investment required for these technologies can be substantial, often exceeding the budgets of local governments or organizations. Additionally, ongoing operational and maintenance costs can strain financial resources, particularly in regions with limited economic capacity. Furthermore, the necessity for community engagement cannot be overstated; local communities must be involved in the planning and decision-making processes to ensure that these technologies align with their needs and priorities. Without community support and understanding, there is a risk of resistance or lack of participation in water management initiatives, ultimately undermining the success of desalination and water harvesting projects. Addressing these socio-economic barriers through collaborative approaches, transparent funding mechanisms, and educational outreach is crucial for fostering the long-term viability of these water supply solutions.
In this context, the expansion of WHT policies in the region has demonstrated promising socio-economic benefits, particularly in creating rural employment opportunities and enhancing quality of life through increased agricultural land cultivation. Economically, WHT measures have positively influenced primary production and infrastructure development, although a transition from primary production to off-farm employment has not yet materialized [78]. On the other hand, the implementation of the seawater desalination plant in Djerba has improved the quality of drinking water on the island and reduced pressure on groundwater resources, particularly the Zeus Koutin aquifer. This has had positive effects not only on Djerba but also on neighboring areas such as Ben Guerden and Zarzis. Socio-economically, this improvement in the drinking water supply has helped meet the growing demands of the local population, particularly in response to the increased water demand [79].
Numerous studies have utilized WEAP to explore the dynamics of water supply and demand under various WRM scenarios. This paper represents one of the first studies on the management of aquifer recharge through non-conventional water using WHT. Yao et al. [80] applied WEAP to assess water availability in the Lobo watershed in central–western Cote d’Ivoire, for the years 2016–2040. Their findings indicate that rice irrigation accounts for 44% of total demand, followed by urban water supply at 30.8%. Demand projections suggest that water deficits observed in the baseline scenario will rise to 100.45 million m3 by 2040. Under the “climate change” scenario, unmet water demands are comparable to those of the baseline. To address these deficits, optimization scenarios were analyzed, showing that building dams to enhance urban water supply and reducing irrigation water consumption and losses could significantly alleviate shortages.
According to Al-Mukhtar and Mutar [30], Iraq faces severe water scarcity due to upstream water policies, population growth, economic expansion, and climate change. Their study focuses on optimizing water allocation for domestic, agricultural, and industrial sectors in Baghdad under current and future scenarios using the WEAP model. Future scenarios (2020–2040) included varying population growth rates, reduced river discharges, and combined stressors. Results showed unmet water demand and supply across all scenarios, highlighting the urgent need for sustainable water management strategies in Iraq [30].
Ayed et al. [81] developed a decision support framework for water resource modeling using WEAP to evaluate the following: (i) groundwater spatial management using GIS-based quality and vulnerability maps for the Maritime Djeffara, classifying the area into zones of good, moderate, and unsuitable water for human use, and (ii) groundwater quantity management by balancing reserves and demands and projecting future water scenarios using the WEAP21 model. Three scenarios—“Irrigation water needs”, “Population growth rate”, and “Industry growth rate”—were simulated. Results indicate significant water demand increases, with the “Irrigation water needs” scenario showing the greatest impact, reducing groundwater reserves from 10,760 Mm3 (2015) to 10,324.77 Mm3 (2065) due to overexploitation and limited recharge. Demand management policies are recommended to restore supply–demand balance.
Touré et al. [82] analyzed the future behavior of groundwater resources in the Klela Basin, Mali, a key water source for domestic use, irrigation, and livestock, as well as the city of Sikasso. Using the WEAP model, they assessed the impact of socio-economic and population growth scenarios alongside RCP4.5 and RCP8.5 climate projections. Their results indicate a significant decline in groundwater recharge (49%) and storage (24%) by 2050, with the most critical reductions occurring in the 2030s, potentially triggering severe agricultural droughts. These findings highlight the increasing vulnerability of groundwater resources under climate change and emphasize the need for proactive water management strategies to safeguard irrigation and freshwater supply.
Berredjem et al. [83] employ the Water Evaluation And Planning (WEAP) system to evaluate current and future water supply and demand under five scenarios: reference, climate change, desalination, leakage reduction, and water reuse. By 2070, water demand is projected to reach 148 Mm3, with climate change further increasing it by 8% to 151 Mm3. The industrial sector experiences the highest unmet demand, followed by domestic and agricultural sectors. Desalination and water efficiency measures show potential for fully meeting industrial needs, while managed aquifer recharge (Scenario 5) reduces industrial deficits by 36%, and leakage reduction with water reuse (Scenario 4) decreases unmet domestic demand to 24 Mm3. The findings highlight the urgent need for integrated water management strategies, including infrastructure investment, conservation efforts, and the adoption of efficient technologies across sectors.
The comparison of this study with other WEAP-based research in arid regions reveals common challenges and key differences in water management strategies. Similar to findings from Toure et al. [82] in Mali and Berredjem et al. [83] in Algeria, this study confirms the significant impact of climate change and increasing demand on groundwater depletion. However, while desalination and leakage reduction were effective mitigation measures in Algeria, water harvesting techniques showed a more substantial improvement in groundwater storage in Tunisia. Additionally, unlike Ayed et al. [81] in the Maritime Djeffara, where irrigation demand was the dominant driver of groundwater depletion, this study highlights the compounded effects of climate change on storage reduction. These findings underscore the need for region-specific strategies, integrating demand-side management, alternative water sources, and policy interventions to enhance resilience against future water scarcity.

5. Conclusions

The study area concerns the Triassic aquifer of Sahel El Ababsa in Médenine, southeast Tunisia. It is characterized by an arid climate with a deficient water balance throughout the year. The exploitable resources of the aquifer are estimated at 8.7 Mm3/year with an equivalent flow of 276 L/s [47]. The water exploitation index (WEI) started with lower values (25%) in 1993 and it continued increasing to reach 78% in 2020. The estimated initial storage capacity is 100 Mm3.
The aim of this study is to develop a DSS to help manage the Triassic aquifer using the WEAP model. Two Triassic aquifer WEAP models are built, the initial one, M1, containing only the Triassic aquifer, its catchment, and the demands. This model M1 is based on observed demands during the simulation period from 1993 to 2020. The final one, M2, is a Triassic aquifer model integrated in the Médenine governorate hydro-system WEAP model [31,32,64]. The test validation is made by comparing the two WEAP models results using the coefficient of determination R2. The calculated R2 is equal to 0.9.
However, due to the water blending strategy adopted by the National Water Exploitation and Distribution Company (SONEDE), where water from multiple sources is mixed in reservoirs before redistribution, it is challenging to calibrate the model using distributed volumes. Therefore, a comparison between the recorded pumped volumes from the Triassic aquifer to the reservoirs and the calculated flow rate, which represents the water demand of the Médenine demand site from the Triassic aquifer, shows an R2 value of 0.86.
Both results contribute to validate the final WEAP model of the Triassic aquifer based on the estimation by WEAP of the supply and demands. The resulting updated model will be used after validation as a decision support system (DSS) enabling informed decision-making and optimized planning for future climate change (CC) and water resources management (WRM) scenarios.
The model is a monthly time step, and the simulation period ranges from 1993 to 2020 and continues with a forecast period to 2050. The reference scenario supposes that climatic conditions and WRM are maintained as those of the year 2020.
Two CC scenarios are developed based on the RCP4.5 and RCP8.5 projections for the year 2050 (SC1.0, SC2.0). It shows that the aquifer would lose more than 98% of its initial storage under both CC scenarios. A new seawater desalination plant in Zarat city, in the northern limit of the governorate of Médenine, should start working in 2024 with a capacity of 50,000 m3/day. This plant is intended to supply partly the governorate of Médenine and the governorate of Tataouine. It would have double production in 2035. Two scenarios were developed describing the implementation of the plant and then its extension under the reference (SC3.0, SC4.0). The implementation of the Zarat seawater desalination plant (SC3.0) would cause an improvement in the water resources of the Triassic sandstone aquifer of Sahel El Ababsa. The aquifer storage would increase from 23 Mm3 in 2050 estimated according to the reference scenario to 34.4 Mm3, marking an improvement of 45% at the end of the simulation period. The storage of the Triassic sandstone aquifer under the extension of the plant scenario (SC4.0) would be estimated at 40.2 Mm3 for the year 2050 with an estimated improvement of 69.5% compared to reference conditions. According to the medium CC, these results would decrease, and they would be 9.8 (a decrease of 59% compared to the reference) and 15.5 Mm3 (a decrease of 35% compared to the reference), respectively, under SC3.1, SC4.1.
Two scenarios studied the importance of the water harvesting techniques (WHTs) on the groundwater recharge under reference and CC conditions (SC5.0, SC5.1). The SC5.0 showed an improvement of 104% compared to the reference scenario and the storage would increase from 23 Mm3 to 48.4 Mm3 for the year 2050. This improvement represents approximately 25% of the initial capacity of the Triassic aquifer. The CC, in the SC5.1 scenario and for the same year, is responsible for a decline of about 29% of the Triassic storage compared to the reference and the storage would be 16.7 Mm3.
The scenario describing the stability of all agricultural demands from the Triassic aquifer from the year 2027 showed an increase of 4.9 Mm3 of the Triassic storage aquifer, marking an improvement of 21.3%. The SC7.1 scenario, describing the “Irrigation Cancellation” from the Triassic aquifer demonstrates a significant influence on aquifer storage. The aquifer’s storage is projected to reach 59.3 Mm3 in 2050 with an improvement of 36 Mm3 (250%) compared to the reference scenario.
These results confirm the importance of both the WHT and the seawater desalination plant to face the increasing demands and the future CC conditions. Therefore, it is recommended to encourage the installation and the maintenance of WHT, which are considered an integral part of the country’s national heritage [84], in order to improve groundwater recharge during rainy years.
On the other hand, it is crucial to prioritize awareness campaigns aimed at reducing water consumption, which is escalating at an alarming rate. This increase is driven by significant population growth, urbanization, the expansion of the tourism sector in the study area, and, most critically, a lack of awareness about the severity of the water crisis. Additionally, these findings underscore the urgent need to implement alternative water resources for irrigation, such as treated wastewater from wastewater treatment plants, to promote sustainable water management and to safeguard the aquifer.

Author Contributions

Conceptualization, R.H. and F.E.; methodology, R.H., G.C., and E.B.; software, R.H. and F.E.; validation, R.H. and F.E.; data curation, M.B.Z., Z.K., and K.B.Z.; writing—original draft preparation, R.H.; writing—review and editing, R.H., G.C., E.B., M.B.Z., M.O., and F.A.; management project, M.O., F.A., and M.B.Z. All authors have read and agreed to the published version of the manuscript.

Funding

This study was jointly funded by PRIMA project (SALAM-MED) from the European Union’s Horizon 2020 Research and Innovation Program: no. 2131 and the Arid Regions Institute of Medenine (IRA, Tunisia) (Laboratory LR16IRA01).

Data Availability Statement

Data in the study area are available upon request from the corresponding author. The original time series meteorological data and water demands are not publicly available due to restrictions of the National Institute of Meteorology (INM) and regional department of the Ministry of Agriculture (CRDA).

Acknowledgments

We thank the officials of SONEDE and CRDA for providing the data necessary to complete this work. I also thank MBZ and MO for their valuable advice.

Conflicts of Interest

The authors declare no conflicts of interest.

Abbreviations

  • The following abbreviations are used in this manuscript:
DSSDecision Support System
CCClimate Change
WRMWater Resources Management
RCPRepresentative Concentration Pathway
SDPSeawater Desalination Plant
WEAPWater Evaluation And Planning System
WHTWater Harvesting Techniques
IWRMIntegrated Water Resources Management
INMNational Institute of Meteorology
WEIWater Exploitation Index
ET0Evapotranspiration
SONEDESociété Nationale d’Exploitation et de Distribution des Eaux
CRDACommissariat Régional au Développement Agricole

References

  1. GWP Global Water Partnership. Integrated Water Resources Management; Technical Advisory Committee, Global Water Partnership: Stockholm, Sweden, 2000. [Google Scholar]
  2. Pahl-Wostl, C. Adaptive and Sustainable Water Management: From Improved Conceptual Foundations to Transformative Change, 1st ed.; Routledge: London, UK, 2021. [Google Scholar]
  3. UNESCO. The United Nations World Water Development Report 2023: Partnerships and Cooperation for Water; UNESCO: Paris, France, 2023. [Google Scholar]
  4. Falkenmark, M. Freshwater as shared between society and ecosystems: From divided approaches to integrated challenges. Philos. Trans. R. Soc. Lond. Ser. B Biol. Sci. 2004, 358, 2037–2049. [Google Scholar] [CrossRef]
  5. Biswas, A.K. Integrated Water Resources Management: Is It Working? Int. J. Water Resour. Dev. 2008, 24, 5–22. [Google Scholar] [CrossRef]
  6. Claassen, M. Integrated Water Resource Management in South Africa. Int. J. Water Gov. 2013, 1, 323–338. [Google Scholar] [CrossRef]
  7. Scanlon, B.R.; Keese, K.E.; Flint, A.L.; Flint, L.E.; Gaye, C.B.; Edmunds, W.M.; Simmers, I. Global synthesis of groundwater recharge in semiarid and arid regions. Hydrol. Process. 2006, 20, 3335–3370. [Google Scholar] [CrossRef]
  8. Priyan, K. Issues and Challenges of Groundwater and Surface Water Management in Semi-Arid Regions. In Groundwater Resources Development and Planning in the Semi-Arid Region; Pande, C.B., Moharir, K.N., Eds.; Springer International Publishing: Cham, Switzerland, 2021; pp. 1–17. [Google Scholar]
  9. United Nations World Water Assessment Programme (UNWWAP). The United Nations World Water Development Report 2022: Groundwater, Making the Invisible Visible|UN World Water Development Report 2022; UNESCO: Paris, France, 2022. [Google Scholar]
  10. Granata, F.; Di Nunno, F. Pathways for Hydrological Resilience: Strategies for Adaptation in a Changing Climate. Earth Syst. Envron. 2025, 9. [Google Scholar] [CrossRef]
  11. Kunstmann, H.; Jung, G.; Wagner, S.; Clottey, H. Integration of atmospheric sciences and hydrology for the development of decision support systems in sustainable water management. Phys. Chem. Earth Parts A/B/C 2008, 33, 165–174. [Google Scholar] [CrossRef]
  12. Giupponi, C.; Sgobbi, A. Models and Decisions Support Systems for Participatory Decision Making in Integrated Water Resource Management. In Coping with Water Deficiency: From Research to Policymaking With Examples from Southern Europe, the Mediterranean and Developing Countries; Koundouri, P., Ed.; Springer Netherlands: Dordrecht, The Netherlands, 2008; pp. 165–186. [Google Scholar] [CrossRef]
  13. Jakeman, A.J.; Letcher, R.A.; Norton, J.P. Ten iterative steps in development and evaluation of environmental models. Environ. Model. Softw. 2006, 21, 602–614. [Google Scholar] [CrossRef]
  14. Badham, J.; Elsawah, S.; Guillaume, J.H.A.; Hamilton, S.H.; Hunt, R.J.; Jakeman, A.J.; Pierce, S.A.; Snow, V.O.; Babbar-Sebens, M.; Fu, B.; et al. Effective modeling for Integrated Water Resource Management: A guide to contextual practices by phases and steps and future opportunities. Environ. Model. Softw. 2019, 116, 40–56. [Google Scholar] [CrossRef]
  15. Loucks, D.P.; van Beek, E. Water Resource Systems Modeling: Its Role in Planning and Management. In Water Resource Systems Planning and Management: An Introduction to Methods, Models, and Applications; Loucks, D.P., van Beek, E., Eds.; Springer International Publishing: Cham, Switzerland, 2017; pp. 51–72. [Google Scholar] [CrossRef]
  16. Wang, K.; Davies, E.; Liu, J. Integrated water resources management and modeling: A case study of Bow river basin, Canada. J. Clean. Prod. 2019, 240, 118242. [Google Scholar] [CrossRef]
  17. Harbaugh, A.; McDonald, M. Programmer’s Documentation for MODFLOW-96, an Update to the U.S. Geological Survey Modular Finite-Difference Ground-Water Flow Model; Open-File Report 96-486; U.S. Geological Survey: Tallahassee, FL, USA, 1996; p. 228.
  18. Harbaugh, A.; Banta, E.; Hill, M.; McDonald, M. Modflow-2000, the U.S. Geological Survey Modular Ground-Water Modeluser Guide to Modularization Concepts and the Ground-Water Flow Process; U.S. Geological Survey: Tallahassee, FL, USA, 2000; p. 130.
  19. Arnold, J.; Srinivasan, R.; Muttiah, R.; Williams, J. Large area hydrologic modeling and asssement. PartI: Model development. J. Am. Water Resour. Assoc. 1998, 10, 73–89. [Google Scholar] [CrossRef]
  20. Yates, D.; Sieber, J.; Purkey, D.; Huber-Lee, A. A Demand-, Priority-, and Preference-Driven Water Planning Model: Part 1, Model Characteristics. Water Int. 2005, 30, 487–500. [Google Scholar] [CrossRef]
  21. Al-Omari, A.; Al-Quraan, S.; Al-Salihi, A.; Abdulla, F. A Water Management Support System for Amman Zarqa Basin in Jordan. Water Resour. Manag. 2009, 23, 3165–3189. [Google Scholar] [CrossRef]
  22. Höllermann, B.; Giertz, S.; Diekkrüger, B. Benin 2025—Balancing Future Water Availability and Demand Using the WEAP ‘Water Evaluation and Planning’ System. Water Resour. Manag. 2010, 24, 3591–3613. [Google Scholar] [CrossRef]
  23. Mounir, Z.; Ma, C.; Amadou, I. Application of Water Evaluation and Planning (WEAP): A Model to Assess Future Water Demands in the Niger River (In Niger Republic). Mod. Appl. Sci. 2011, 5, 38. [Google Scholar] [CrossRef]
  24. Abera Abdi, D.; Ayenew, T. Evaluation of the WEAP model in simulating subbasin hydrology in the Central Rift Valley basin, Ethiopia. Ecol. Process. 2021, 10, 41. [Google Scholar] [CrossRef]
  25. Dimova, G.; Tzanov, E.; Ninov, P.; Ribarova, I.; Kossida, M. Complementary Use of the WEAP Model to Underpin the Development of SEEAW Physical Water Use and Supply Tables. Procedia Eng. 2014, 70, 563–572. [Google Scholar] [CrossRef]
  26. Vonk, E.; Xu, Y.P.; Booij, M.J.; Zhang, X.; Augustijn, D.C.M. Adapting multireservoir operation to shifting patterns of water supply and demand. Water Resour. Manag. 2014, 28, 625–643. [Google Scholar] [CrossRef]
  27. Li, X.; Zhao, Y.; Shi, C.; Sha, J.; Wang, Z.-L.; Wang, Y. Application of Water Evaluation and Planning (WEAP) model for water resources management strategy estimation in coastal Binhai New Area, China. Ocean Coast. Manag. 2015, 106, 97–109. [Google Scholar] [CrossRef]
  28. Yaqob, E.; Al-Sa`ed, R.; Sorial, G.; Suidan, M. Simulation of trans boundary wastewater resource management scenarios in the Wadi Zomer watershed, using a WEAP model. Int. J. Basic Appl. Sci. 2015, 4, 27–35. [Google Scholar] [CrossRef]
  29. Shahraki, S.A.; Shahraki, J.; Hashemi Monfared, S.A.; Sardar Shahraki, A. An Application of WEAP Model in Water Resources Management Considering the Environmental Scenarios and Economic Assessment Case Study: Hirmand Catchment. Mod. Appl. Sci. 2016, 10, 49. [Google Scholar] [CrossRef]
  30. Al-Mukhtar, M.; Mutar, G. Modelling of Future Water Use Scenarios Using WEAP Model: A Case Study in Baghdad City, Iraq. Eng. Technol. J. 2021, 39, 488–503. [Google Scholar] [CrossRef]
  31. Hadded, R.; Nouiri, I.; Alshihabi, O.; Maßmann, J.; Huber, M.; Laghouane, A.; Yahiaoui, H.; Tarhouni, J. A Decision Support System to Manage the Groundwater of the Zeuss Koutine Aquifer Using the WEAP-MODFLOW Framework. Water Resour. Manag. 2013, 27, 1981–2000. [Google Scholar] [CrossRef]
  32. Hadded, R.; Nouiri, I.; Jamila, T. Assessment of climate change impact on the Zeuss–Koutine aquifer (Tunisia) using a WEAP-MODFLOW DSS. Arab. J. Geosci. 2022, 15, 757. [Google Scholar] [CrossRef]
  33. Lima-Quispe, N.; Ruelland, D.; Rabatel, A.; Lavado-Casimiro, W.; Condom, T. Modeling Lake Titicaca’s water balance: The dominant roles of precipitation and evaporation. Hydrol. Earth Syst. Sci. 2025, 29, 655–682. [Google Scholar] [CrossRef]
  34. El Amami, S. The Traditional Hydraulic Structures in the Maghreb; p 35 + Annexes; ACSAD: Damascus, Syria, 1982. [Google Scholar]
  35. El Amami, S. Les Aménagements Hydrauliques Traditionnels en Tunisie; Centre de Recherche en Génie Rural (CRGR): Ariana, Tunis, 1984; p. 69. [Google Scholar]
  36. Alaya, K.; Viertmann, W.; Waibel, T. Les Tabias; Imprimerie Arabe de Tunisie: Tunis, Tunisia, 1993; p. 192. [Google Scholar]
  37. Ouessar, M. Hydrological Impacts of Rainwater Harvesting in Wadi Oum Zessar Watershed (Southern Tunisia). Ph.D. Thesis, Faculty of Bioscience Engineering, Ghent University, Ghent, Belgium, 2007. [Google Scholar]
  38. Ouessar, M.; Yahyaoui, H. Abstraction and Recharge Impacts on the Ground Water in the Arid Regions of Tunisia: Case of Zeuss-Koutine Water Table; UNU Desertification Series N°2; Médenine, Tunisia, 2000; pp. 72–78. [Google Scholar]
  39. Yahyaoui, H.; Chaieb, H.; Ouessar, M. Impact des Travaux de Conservation des Eaux et des Sols Sur la Recharge de la Nappe de Zeuss-Koutine; TRMP Paper n°40; Wageningen University: Wageningen, The Netherlands, 2002; pp. 71–86. [Google Scholar]
  40. Ouessar, M.; Yahyaoui, H.; Maati, M.; Abdelli, F. Assessment of water harvesting techniques impacts on soil water and erosion in an arid catchment. Options Méditerranéennes 2004, 55–62. [Google Scholar]
  41. Sieber, J. WEAP (Water Evaluation and Planning). Available online: https://www.weap21.org (accessed on 23 February 2023).
  42. Institute National de Météorologie (INM). Available online: https://www.meteo.tn/fr/changement-climatique (accessed on 15 May 2023).
  43. ODS (Office de Développement de Sud). Gouvernorat de Médenine en Chiffres; Office de Développement de Sud (ODS): Médenine, Tunisie, 2016; p. 126. [Google Scholar]
  44. ODS (Office de Développement de Sud). Gouvernorat de Médenine en Chiffres; Office de Développement de Sud (ODS): Médenine, Tunisie, 2018; p. 55. [Google Scholar]
  45. ODS (Office de Développement de Sud). Gouvernorat de Médenine en Chiffres; Office de Développement de Sud (ODS): Médenine, Tunisie, 2021; p. 171. [Google Scholar]
  46. CRDA. Rapports CRDA; Commissariat Régional au Développement Agricole (CRDA): Médenine, Tunisia, 2023. [Google Scholar]
  47. CRDA; Médenine, M. Etude D’optimisation de L’exploitation des Ressources en Eaux des Nappes de Zeuss Koutine et des Grès du Trias de Sahel El Ababssa; MPS Company: Médenine, Tunisia, 2016. [Google Scholar]
  48. Alcamo, J.; Henrichs, T.; Roesch, T. Global modeling and scenario analysis for the World Commission on Water for the 21st Century. Kassel World Water Ser. 2000, 2, 48. [Google Scholar]
  49. Vorosmarty, C.; Green, P.; Salisbury, J.; Lammers, R. Global Water Resources: Vulnerability from Climate Change and Population Growth. Science 2000, 289, 284. [Google Scholar] [CrossRef]
  50. Vörösmarty, C.; McIntyre, P.; Gessner, M.; Dudgeon, D.; Proussevitch, A.; Green, P.; Glidden, S.; Bunn, S.; Sullivan, C.; Reidy Liermann, C.; et al. Global Threats to Human Water Security and River Biodiversity. Nature 2010, 468, 334. [Google Scholar] [CrossRef]
  51. Gaubi, E. Synthèse Hydrogéologique sur la Nappe des Grès du Trias; Médenine, Tunisia; Rapport Interne DGRE; Ministry of Agriculture: Tunis, Tunisia, 1995; 44p. [Google Scholar]
  52. Yahyaoui, H. Etude Hydrogéologique des Aquifères du Piémont Oriental et du Flanc Occidental du Dahar (Régions de Remada et de Déhibat). Ph.D. Thesis, Faculté de Science De Tunis, Tunis, Tunisia, 1996. [Google Scholar]
  53. Yahiaoui, H. Nappe des Grès du Trias du Sahel El Ababssa. Aspects Hydrogéologiques et Mobilisation des Ressources; Rapprt DGRE, DGRE; 2001. Ministry of Agriculture, Tunis, Tunisia.
  54. Yahiaoui, H. Nappe des Grès du Trias de Sahel el Ababsa de Médenine: Aspects Hydrogéologiques et Proposition D’une Gestion Durable; Rapprt DGRE, DGRE; 2007.
  55. Fersi, M. Estimation du Ruissellement Moyen Annuel sur les Bassins du Sud-Est, du Sud-Ouest et du Sahel Sud.; Direction Générale des Ressources en Eau: Tunis, Tunisia, 1979. [Google Scholar]
  56. Trabelsi, R. Caracterisation Hydrogeologique et Geochimique du Systeme Aquifere de la Djeffara (Sud-Est Tunisien): Modelisation et Intrusion Marine. Ph.D. Thesis, L’Ecole Nationale d’Ingénieurs de Sfax, Sfax, Tunisia, 2009. [Google Scholar]
  57. SONEDE. Rapports SONEDE; Société Nationale d’Exploitation et de Distribution des Eaux: Tunis, Tunisia, 2023. [Google Scholar]
  58. Nagaz, K.; El Mokh, F.; Masmoudi, M.; BenMechlia, N.; Baba Sy, M.; Ghiglieri, G. Economie et gestion de l’eau à l’échelle de la parcelle dans un environnement aride. In Proceedings of the Ressources en Eau & Changement Climatique Impacts Anthropiques et Climatiques sur la Variabilité des Ressources en Eau, Hammamet, Tunisia, 2–4 October 2017. [Google Scholar]
  59. Lerner, D.N.; Issar, A.; Simmers, I. Groundwater Recharge: A Guide to Understanding and Estimating Natural Recharge; Heise: Beverstedt, Germany, 1990. [Google Scholar]
  60. Baba, S.Y.M. Recharge et Paléo-Recharge du Système Aquifère du Sahara Septentrional. Ph.D. Thesis, Université de Tunis El Manar, Tunis, Tunisia, 2005. [Google Scholar]
  61. Maréchal, J.-C.; Murari, R.; Riotte, J.; Vouillamoz, J.-M.; Mohan Kumar, M.S.; Ruiz, L.; Sekhar, M.; Braun, J.-J. Indirect and direct recharges in a tropical forested watershed: Mule Hole, India. J. Hydrol. 2009, 364, 272–284. [Google Scholar] [CrossRef]
  62. Şorman, Ü.; Abdulrazzak, M.; Morel-Seytoux, H. Groundwater recharge estimation from ephemeral streams. Case study: Wadi Tabalah, Saudi Arabia. Hydrol. Process. 1997, 11, 1607–1619. [Google Scholar] [CrossRef]
  63. OSS. Système Aquifère du Sahara Septentrional: Volume 4 Modèle Mathématique; Rapport Interne et Annexes; Projet SASS: Tunis, Tunisie, 2003; p. 229. [Google Scholar]
  64. Hadded, R. Élaboration D’un Système D’aide a la Décision Pour Une Gestion Durable des Ressources en Eau Dans le Bassin Versant de Zeuss Koutine; Institut National Agronomique de Tunisie: Tunis, Tunisia, 2015. [Google Scholar] [CrossRef]
  65. Hamzaoui, F.; Zammouri, M.; Ameur, M.; Sy, M.; Moncef, G.; Bouhlila, R. Hydrogeochemical modeling for groundwater management in arid and semiarid regions using MODFLOW and MT3DMS: A case study of the Jeffara of Medenine coastal aquifer, South-Eastern Tunisia. Nat. Resour. Model. 2020, 33, e12282. [Google Scholar] [CrossRef]
  66. Chapoutot, L. Profil de Durabilité Dans Quelques Destinations Touristiques Méditerranéennes. La destination Jerba en Tunisie. Sophia Antipolis. Plan Bleu, Centre d’Activités Régionales PNUE/PAM. 2011. Available online: https://planbleu.org/ (accessed on 22 March 2023).
  67. Arif, S.; Doumani, F.; Abdeljaouad, I. Coût de la Dégradation de l’Environnement due aux Pratiques de Gestion des Séchets Solides: Cas de l’Île de Djerba; Programme SWEEP-Net Finance par la GIZ; Deutsche Gesellschaft für Internationale Zusammenarbeit (GIZ) GmbH: Bonn et Eschborn, Germany, 2014; Available online: https://www.retech-germany.net/fileadmin/retech/05_mediathek/laenderinformationen/Tunesien_COED_DJERBA_frz.pdf (accessed on 15 March 2023).
  68. Rykiel, E. Testing ecological models: The meaning of validation. Ecol. Model. 1996, 90, 229–244. [Google Scholar] [CrossRef]
  69. Mazzotti, F.J.; Vinci, J.J. Validation, Verification, and Calibration: Using Standardized Terminology When Describing Ecological Models: WEC216/UW256, 4/2007. EDIS 2007, 2007. [Google Scholar] [CrossRef]
  70. Salciccioli, J.D.; Crutain, Y.; Komorowski, M.; Marshall, D.C. Sensitivity Analysis and Model Validation. In Secondary Analysis of Electronic Health Records; Springer: Cham, Switzerland, 2016. [Google Scholar]
  71. del Barrio, E.; Inouzhe, H.; Matrán, C. On approximate validation of models: A Kolmogorov-Smirnov based approach. TEST 2020, 29, 938–965. [Google Scholar] [CrossRef]
  72. Krause, P.; Boyle, D.; Bäse, F. Comparison of Different Efficiency Criteria for Hydrologic Models. Adv. Geosci. 2005, 5, 89–97. [Google Scholar] [CrossRef]
  73. IPCC. AR5 Climate Change 2014: Impacts, Adaptation, and Vulnerability; IPCC: Geneva, Switzerland, 2014. [Google Scholar]
  74. Vuuren, D.; Edmonds, J.; Kainuma, M.; Riahi, K.; Thomson, A.; Hibbard, K.; Hurtt, G.; Kram, T.; Krey, V.; Lamarque, J.-F.; et al. The representative concentration pathways: An overview. Clim. Change 2011, 109, 5–31. [Google Scholar] [CrossRef]
  75. Moss, R.; Edmonds, J.; Hibbard, K.; Manning, M.; Rose, S.; Vuuren, D.; Carter, T.; Emori, S.; Kainuma, M.; Kram, T.; et al. The Next Generation of Scenarios for Climate Change Research and Assessment. Nature 2010, 463, 747–756. [Google Scholar] [CrossRef]
  76. Bates, B.; Kundzewicz, Z.W.; Wu, S.; Burkett, V.; Doell, P.; Gwary, D.; Hanson, C.; Heij, B.; Jiménez, B.; Kaser, G.; et al. Climate Change and Water. Technical Paper of the Intergovernmental Panel on Climate Change; IPCC: Geneva, Switzerland, 2008. [Google Scholar]
  77. Arias, P.; Bellouin, N.; Coppola, E.; Jones, C.; Krinner, G.; Marotzke, J.; Naik, V.; Plattner, G.-K.; Rojas, M.; Sillmann, J.; et al. Climate Change 2021: The Physical Science Basis. Contribution of Working Group I to the Sixth Assessment Report of the Intergovernmental Panel on Climate Change; Technical Summary; IPCC: Geneva, Switzerland; Cambridge University Press: Cambridge, UK; New York, NY, USA, 2021. [Google Scholar]
  78. König, H.J.; Sghaier, M.; Schuler, J.; Abdeladhim, M.; Helming, K.; Tonneau, J.-P.; Ounalli, N.; Imbernon, J.; Morris, J.; Wiggering, H. Participatory Impact Assessment of Soil and Water Conservation Scenarios in Oum Zessar Watershed, Tunisia. Environ. Manag. 2012, 50, 153–165. [Google Scholar] [CrossRef]
  79. Ajala, W.; Ben Ali, S.; Fetoui, M.; Abdeladhim, M. Sustainability impact assessment of seawater desalination plant of Djerba in the southeast of Tunisia. J. New Sci. 2022, 89, 5033–5039. [Google Scholar]
  80. Yao, A.; Mangoua, J.; Georges, E.; Kane, A.; Goula, A. Using “Water Evaluation and Planning” (WEAP) Model to Simulate Water Demand in Lobo Watershed (Central-Western Cote d’Ivoire). J. Water Resour. Prot. 2021, 13, 216–235. [Google Scholar] [CrossRef]
  81. Ayed, B.; Khlif, N.; Jmal, I.; Bouri, S. Integration of GIS and WEAP models for groundwater resource management in arid regions: Case of the Djeffara-Medenine shallow aquifer (Southeastern Tunisia). Arab. J. Geosci. 2022, 15. [Google Scholar] [CrossRef]
  82. Toure, A.; Diekkrüger, B.; Mariko, A.; Cissé, A.S. Assessment of Groundwater Resources in the Context of Climate Change and Population Growth: Case of the Klela Basin in Southern Mali. Climate 2017, 5, 45. [Google Scholar] [CrossRef]
  83. Berredjem, A.F.; Boumaiza, A.; Hani, A. Simulation of current and future water demands using the WEAP model in the Annaba province, Northeastern Algeria: A case study. AQUA—Water Infrastruct. Ecosyst. Soc. 2023, 72, 1815–1824. [Google Scholar] [CrossRef]
  84. Ouessar, M. Water Harvesting Impact Assessment in the Dry Areas of Tunisia: A Review. In Handbook of Water Harvesting and Conservation; John Wiley & Sons, Ltd.: Hoboken, NJ, USA, 2021; pp. 213–228. [Google Scholar] [CrossRef]
Figure 1. Location of the study area.
Resources 14 00063 g001
Figure 2. Average annual rainfall observed at all stations with error bars showing one standard deviation in the historical period from 1970 to 2021.
Resources 14 00063 g002
Figure 3. Average monthly rainfall with error bars showing one standard deviation in the historical period from 1970 to 2021.
Resources 14 00063 g003
Figure 4. Maximum, minimum, and average observed temperature from 1978 to 2021.
Resources 14 00063 g004
Figure 5. Geological cross-section in the study area where the Triassic aquifer is presented by the purplish red and black Triassic sandstone (pink) (adapted from [54]).
Resources 14 00063 g005
Figure 6. Piezometric history of the Triassic aquifer and pumping volumes [46,57].
Resources 14 00063 g006
Figure 7. Hydraulic system of the Médenine governorate used to manage the Zeuss Koutine and the Triassic Sahel El Ababsa aquifers [57].
Resources 14 00063 g007
Figure 8. Water distribution from the Triassic sandstone aquifer of Sahel El Ababsa [46,57].
Resources 14 00063 g008
Figure 9. WEAP schematic view of the Triassic aquifer of Sahel El Ababsa, model M1.
Resources 14 00063 g009
Figure 10. WEAP schematic view of the Triassic aquifer of Sahel El Ababsa, integrated into the hydraulic system of the governorate of Médenine, model M2.
Resources 14 00063 g010
Figure 11. Global methodological approach.
Resources 14 00063 g011
Figure 12. Evolution of the Triassic aquifer storage calculated by WEAP for the initial WEAP model M1.
Resources 14 00063 g012
Figure 13. Evolution of the Triassic aquifer storage calculated by WEAP for the final WEAP model M2.
Resources 14 00063 g013
Figure 14. Linear regression curve of the Triassic aquifer storage for the two developed WEAP models M1 and M2.
Resources 14 00063 g014
Figure 15. Variation in the Triassic aquifer storage trend in the two WEAP models (M1, M2).
Resources 14 00063 g015
Figure 16. Comparison between recorded pumped volumes from the Triassic aquifer and calculated delivered volumes from the Triassic aquifer to the Médenine demand site.
Resources 14 00063 g016
Figure 17. Evolution of demands in the WEAP demand sites calculated by the WEAP DSS.
Resources 14 00063 g017
Figure 18. Estimated recharge of the Triassic aquifer by direct infiltration through the soil profile and average precipitation calculated by the WEAP DSS.
Resources 14 00063 g018
Figure 19. Estimated indirect recharge by infiltration in the wadi beds of the Koutine watershed calculated by the WEAP DSS.
Resources 14 00063 g019
Figure 20. Evolution of the Triassic aquifer storage under the SC0 and the CC scenarios (SC1.0 and SC2.0) calculated by WEAP DSS.
Resources 14 00063 g020
Figure 21. Recharge in the Wadi El Hallouf bed (Koutine watershed) under the SC0 and SC2.0.
Resources 14 00063 g021
Figure 22. Evolution of the Triassic aquifer storage under the reference (SC0) and the Zarat seawater desalination plant scenarios under reference (SC3.0, SC4.0) and under CC (SC3.1, SC4.1) calculated by WEAP DSS.
Resources 14 00063 g022
Figure 23. Evolution of the distributed volumes of drinking water to the Tataouine demand site calculated by WEAP DSS under (SC0), (SC3.0), and (SC4.0) scenarios.
Resources 14 00063 g023
Figure 24. Evolution of the Triassic aquifer storage under SC0, SC5.0, and SC5.1 scenarios calculated by WEAP DSS.
Resources 14 00063 g024
Figure 25. Difference in the Koutine watershed recharge between the reference, SC5.0, and SC5.1 scenarios calculated by WEAP DSS.
Resources 14 00063 g025
Figure 26. Evolution of the Triassic aquifer storage under SC0, SC6.0, SC6.1, and SC7.1 scenarios calculated by WEAP DSS.
Resources 14 00063 g026
Figure 27. Evolution of the Triassic aquifer storage under SC0 and SC8.1 scenarios calculated by WEAP DSS.
Resources 14 00063 g027
Table 1. Average monthly ET0 (mm) and precipitations P (mm) in Médenine (1975–2010) [46].
JANFEBMARAPRMAYJUNJULAUGSEPOCTNOVDECTOT
ET0 (mm)901021351601982142432231661431211061906
P (mm)23212110610114222233175
Table 2. Characteristics of the watersheds of the Triassic aquifer of Sahel El Ababsa.
ParameterKoutineGuattarMédenine
S: Area (km2)267.00274.56157.12
P: Perimeter (km)114.0097.5074.61
KG: Gravelius’s index1.971.661.678
Hmax: Maximal altitude 666.00561.00481.00
Hmin: Minimal altitude 86.0063.0066.00
I: Average slope (m/km)0.040.030.03
Ig: Global slope index (%)10.318.766.59
Ds: The specific height difference (m)110.2586.4756.94
Table 3. Key socio-economic indicators for main demand pole [45].
MédenineJerbaZarzisBenguerdene
Population173,232182,91178,82687,404
Population growth rate *1.031.031.031.03
Population density (inhabitant/km2)50–200200–50026–5011–25
Education Enrollment Rates97.4497.3796.7796.03
Electrification rate *99.999.999.999.9
Drinking water supply rate *99.999.999.999.9
Economic activitiesServices
Buildings and public works
Agriculture
Tourism
Agriculture and fishing
Tourism
Agriculture and fishing
* Average rate of the governorate.
Table 4. Representation of real physical component by WEAP model M1 and main input parameters.
Physical ComponentWEAP Schematic ViewWEAP Input Parameters
1. The Triassic aquifer1.Groundwater node: “Trias”1. Storage Capacity, Initial Storage and Maximum Withdrawal.
2. The studied watersheds2. Catchment node: “BV Trias”2. Total surface area of the watersheds feeding the aquifer.
3. The main wadis in the area3. River: 3. Headflow/“Rainfall Runoff Simplified” Coefficient method
4. Water demand:
-
the population of the city of Médenine, supplied with drinking water by the Triassic aquifer
-
the population of the Tataouine city supplied with drinking water from the Triassic aquifer
-
the agricultural demands pumping from the Trias aquifer
4. Demand site nodes:
-
“MedenineTrias“
-
“Tataouine “
-
“Irrigation “
4. Recorded domestic and agricultural demands.
5. Pipes allowing the transmission of water from a source node to the demand site nodes5. Transmission links 5. Maximum flow Volume, Supply preference, percentage of losses.
6. Connection recharge/groundwater node6. Return flow links 6. Return flow routing, percentage of losses.
7. Direct recharge from the catchment7. Runoff/Infiltration link7. Runoff fraction
Table 5. WEAP demand sites and main input parameters for the M2 model.
WEAP Calculation Method for Demands: Specify Yearly Demand and Monthly Variation
WEAP component in M2: Demand site nodesWEAP Input parameters
MédenineAnnual Activity Level: Population
Annual Water Use Rate: Specific annual consumption
Tataouine
Jerba domestic
Zarzis domestic
Ben guerdane
Jerba touristicAnnual Activity Level: The hotel capacity
Annual Water Use Rate: Specific annual consumption
Zarzis touristic
IrrigationAnnual Activity Level: Irrigated areas
Annual Water Use Rate: Mean irrigation flow
Table 6. The studied scenarios and their nomenclature in WEAP DSS.
ScenarioKey AssumptionsCode
Reference scenario 2020 conditionsSC0
Scenario RCP 4.5 Precipitation/recharge/CC/RCP4.5SC1.0
Scenario RCP8.5Precipitation/recharge/CC/RCP8.5SC2.0
Zarat seawater desalination plant (SDP) under referenceadditional supply (SDP) 50,000 m3/dSC3.0
Extension of the Zarat seawater desalination plant under referenceadditional supply (SDP) 100,000 m3/dSC4.0
Zarat seawater desalination plant under RCP 4.5additional supply 50,000 m3/d (SDP)/RCP4.5SC3.1
Extension of the Zarat seawater desalination plant under RCP 4.5additional supply 100,000 m3/d (SDP)/RCP4.5SC4.1
WHT impact under reference Additional aquifer rechargeSC5.0
WHT impact under RCP 4.5Additional aquifer recharge/RCP4.5SC5.1
Stability of all agricultural demands under reference Stable Irrigation demandsSC6.0
Stability of all agricultural demands under RCP 4.5Stable Irrigation demands/RCP4.5SC6.1
Cancellation of all agricultural demands under RCP 4.5Canceled Irrigation demands/RCP 4.5SC7.1
Aquifer recovery under SC3.1, SC4.1, SC5.1, SC6.1[additional supply 100,000 m3/d (SDP); Additional aquifer recharge; Stable Irrigation demands]/RCP4.5SC8.1
Table 7. The studied scenarios and their results.
ScenarioResults in 2050
Storage Capacity (Mm3)% Comparing to Initial Storage% Comparing to Reference
Reference scenario SC023.71−76.29-
Scenario RCP 4.5 (SC1.0)0.41−99.58−98.25
Scenario RCP8.5 (SC2.0)0.38−99.62−98.36
Zarat SDP under reference (SC3.0)34.40−65.60+ 45.10
Extension of the Zarat SDP under reference (SC4.0)40.20−59.80+69.55
Zarat SDP under RCP 4.5 (SC3.1)9.85−90.15−58.46
Extension of the Zarat SDP under RCP 4.5 (SC4.1)15.52−84.48−34.54
WHT impact under reference (SC5.0)48.40−51.60+104.13
WHT impact under RCP 4.5 (SC5.1)16.70−83.3−29.56
Stability of agricultural demands under reference (SC6.0)28.61−71.39+20.67
Stability of agricultural demands under RCP 4.5 (SC6.1)3.95−96.05−83.34
Cancellation of all agricultural demands under RCP 4.5 (SC7.1)59.30−40.70+250.21
Aquifer recovery scenario (SC8.1)93.00−7.00+392.00
Disclaimer/Publisher’s Note: The statements, opinions and data contained in all publications are solely those of the individual author(s) and contributor(s) and not of MDPI and/or the editor(s). MDPI and/or the editor(s) disclaim responsibility for any injury to people or property resulting from any ideas, methods, instructions or products referred to in the content.

