Article

Struvite Precipitation from Centrate—Identifying the Best Balance Between Effectiveness and Resource Efficiency

Institute of Sanitary and Environmental Engineering, Technische Universität Braunschweig, Pockelsstraße 2a, 38106 Braunschweig, Germany
*
Author to whom correspondence should be addressed.
Resources 2025, 14(4), 56; https://doi.org/10.3390/resources14040056
Submission received: 14 January 2025 / Revised: 21 March 2025 / Accepted: 24 March 2025 / Published: 28 March 2025

Abstract

:
In the context of struvite precipitation, the most significant gap pertains to the transfer of knowledge from scientific research to practical applications. The primary objective of this study is twofold: firstly, to identify the most critical process parameters influencing struvite precipitation and, secondly, to translate these parameters into a pragmatic tool for real-world applications. This study investigates the precipitation of struvite from digestion centrate to obtain information on the appropriate precipitation conditions for different initial chemical compositions. We carried out 24 lab-scale experiments to investigate the effect of varying pH value (7.0–8.5), temperature (5 °C and 33 °C) and initial phosphate concentrations (353; 165; 68 mg/L) on struvite precipitation. Varying the pH had the strongest influence on precipitation efficiencies. Adjusting pH from 7 to 8.5 increased PO4-P removal from 1.4% to 98.8%, whereas temperature had little impact on PO4-P removal. Furthermore, we found that a saturation index of at least 1.7 is imperative to precipitate at least 90% of the available PO4-P. Based on the results, we developed a nomogram showing the resulting saturation index and the associated PO4-P removal efficiency for variable initial PO4-P and pH levels. The tool developed in this study enables users to directly identify the so-called ‘sweet spot’, which is the optimal balance between process effectiveness and resource efficiency, for each centrate.

1. Introduction

The European Union (EU) is dependent on phosphorous (P) rock imports to the extent of 84% of consumption, and as a result, has included P on the list of critical raw materials [1]. This fact illustrates the importance of closing nutrient cycles in general, and P recovery in particular, in order to reduce P import dependency and secure local food supply. As wastewater treatment plants (WWTPs) are relevant P sinks, it seems reasonable to recover P from them [2]. The precipitation of struvite is a technology that fits very well into the concept of circular economy, as it enables the recovery of not only P and nitrogen (N), but also the production of a valuable and plant-available fertilizer from WWTPs [3,4]. Struvite is a salt that precipitates in an alkaline environment with an equimolar ratio of Mg, N and P [5]. Centrate from anaerobic digestion is nutrient-rich and thus well-suited to this approach. While NH4-N in centrate is usually present in surplus, Mg is the limiting component and must be added to the process in order to precipitate struvite. Researchers investigating struvite precipitation have used different nutrient-rich streams, such as artificial liquids [6,7,8,9], animal manure [10,11], source-separated urine [12,13], or anaerobic digestion centrate from WWTPs [14,15]. This work focuses on anaerobic digestion centrate as matrix.
As with any precipitation, struvite precipitation is largely determined by the degree of supersaturation, expressed as the saturation index (SI). The SI represents the logarithm of the ratio between the ion activity product (IAP) and the thermodynamic solubility product (ksp) [16]. The mathematical expression for the SI is given in Equation (1) [16,17]. As the SI increases, a more saturated environment is created, leading to a faster and more complete precipitation process [5,18]. Increasing SI to enhance struvite precipitation can be achieved either by adding ions (NH4-N, PO4-P, Mg) or by increasing the pH.
SI = l o g 10 ( I A P K S P )
SI = saturation index
IAP = ion activity product
kSP = thermodynamic solubility product
The solubility product kSP depends on temperature. Researchers have reported slightly different kSP values across various temperature ranges [19,20,21,22]. However, they all agree on the tendency that kSP decreases with increasing temperature. The kSP is often represented as pkSP which is known as −log(kSP). The IAP is largely determined by the relevant dissolved ions for the reaction and is defined as the product of the ionic activities of magnesium, ammonium and phosphate according to Equation (2). The activity coefficient of a specific ion is expressed as alpha [23,24,25].
I A P = { a M g 2 + a N H 4 + a P O 4 3 }   [ mlo 3 / L 3 ]
aMg2+ = magnesium content [mol/L]
aNH4+ = ammonium content [mol/L]
aPO43− = phosphate content [mol/L]
The literature recommends maintaining a pH above 9 for precipitation; however, this can result in elevated levels of alkali consumption [17]. Moreover, researchers recommend using a Mg:P stoichiometric ratio greater than 1:1 [26]. While magnesium in excess is beneficial for struvite precipitation, in a large-scale plant with several hundred cubic meters per day, it has an enormous impact on magnesium consumption, which is a major cost factor [2]. Also, an over-stoichiometric Mg:P ratio may result in undesirable struvite precipitation within the WWTP as the effluent from the struvite precipitation facility is returned to the WWTP [21]. To ensure findings from research translate effectively into practice, it is necessary to consider PO4-P concentration ranges used in experiments. Researchers have conducted a number of studies that exclusively consider one PO4-P concentration or only the ranges below 100 mg/L [15,27]. However, these concentration ranges do not reflect all the realistic conditions at WWTPs [28]. Operators must adapt the operation of a struvite precipitation plant to the unique conditions present at each wastewater treatment facility. The PO4-P concentrations can fluctuate severely from one WWTP to another but also within one WWTP, depending on the biological or chemical process parameters within the sludge line, as shown in the box plots in Figure 1.
Previous studies have utilized varying initial PO4-P concentrations; however, researchers have not systematically studied a wider spectrum with initial conditions from less than 100 mg P/L up to more than 300 mg P/L [15,27]. Consequently, there is a lack of clarity regarding individual operational issues. The following research questions can be derived from these observations, especially for full-scale applications:
  • Is it necessary to maintain a high pH level in centrates at a high SI due to existing ion concentration?
  • What is the optimum pH level balancing low PO4-P concentration after precipitation, while avoiding excessive use of lye for pH adjustment?
Research has identified the effect of temperature on struvite precipitation from centrate [18], but further research is required to fully understand this process [29]. The centrate temperature is typically influenced by the upstream anaerobic digestion, which is often performed at a mesophilic temperature range of approximately 30–38 °C. This leads to the third research question:
3.
How do temperature variations, combined with previously mentioned variations in pH and ion concentration, affect the precipitation process?
Despite researchers studying struvite precipitation for more than four decades from a variety of perspectives and disciplines [16,21,30,31,32,33,34,35], a significant gap remains in transferring this knowledge into practice, particularly regarding the precipitation of struvite from centrates at WWTPs [29]. Following the approval of struvite for use in organic farming in the EU, a new market has emerged, with the potential for significant demand for struvite fertilizer [36]. To meet this demand, more struvite precipitation plants need to be installed at WWTPs. To support this development, the aim of this work is twofold. Firstly, to identify the most important process parameters, and secondly, to translate these parameters into a pragmatic tool for real-world applications to ensure knowledge transfer and thus support the establishment of a circular economy in the wastewater sector. We propose that, on this basis, operators can optimize the operation of current and future struvite precipitation plants, with a concomitant reduction in costs and enhancement of the sustainability of fertilizer production.

2. Materials and Methods

2.1. Matrix

For this study, we used centrate from the anaerobic digestion of excess sludge from the Braunschweig WWTP (Braunschweig, Germany). The WWTP treats wastewater from 350,000 PE through an activated sludge plant, followed by anaerobic sludge treatment. We used the centrate from sludge treatment in its pure form (designated as A) and also diluted with tap water (designated as B and C) in order to obtain a wide range of different PO4-P concentrations, as seen in Table 1. Theses concentrations represent the possible PO4-P concentration ranges in WWTPs as shown in Figure 1. The first set of experiments A was carried out using the original pure centrate. The second experiment B involved a 50:50 ratio of centrate to tap water, while the third experiment C utilized a 25:75 ratio. Due to the fact that the centrate was mixed with tap water to produce B and C, the calcium content was increased while other ions were diluted. Nevertheless, the experiments contained an over-stoichiometric amount of ammonium.

2.2. Design of the Experiments

We conducted the experiments in three sets, with each set comprising specific concentrations of PO4-P and NH4-N. Each set was executed across two temperature ranges of 33 °C and 5 °C, representing the expected temperature range at WWTPs. We assessed four different pH values, ranging from 7.0 to 8.5 in increments of 0.5. This resulted in a total of 24 test runs which were performed as duplicates. The specific experimental conditions are outlined in Table 2.

2.3. Procedure of the Experiments

Once the pH and temperature had been stabilized, we initiated the experiment by adding MgCl2 at a stoichiometric P:Mg ratio of 1:1. Subsequent to the initiation of the experiment, we collected samples at 5, 30, 90 and 180 min, immediately filtered them through a 0.45 µm Chompure nylon syringe filter (Membrane Solutions, Auburn, WA, USA) and subsequently analyzed them. We set the duration of the experiment to a maximum of 180 min, as the reaction is expected to be complete within this time according to the literature [6].

2.4. Mixing, Temperature and pH Control

We conducted the experimental studies utilizing a double-walled beaker, wherein water was circulated through a thermostat (RE 104, Lauda, Germany) to regulate the temperature. The beaker was initially filled with 0.5 L of the sample and the mixing was executed using a magnetic stirrer (IKAMAG, Staufen im Breisgau, Germany) operating at a speed of 200 rpm. We controlled the pH by a glass electrode (Mettler Toledo, Columbus, OH, USA) with a 3 mol/L KCl reference electrolyte connected to a control unit (Dulcometer—D1CB, Prominent, Heidelberg, Germany). This unit automatically triggered a dosing of either NaOH or HCl, which could be very precisely controlled. This ensured that the desired pH value remained stable throughout the test period. We calibrated the pH probe daily. Prior to the beginning of an experiment, we adjusted the pH to the desired value and tempered the centrate accordingly.

2.5. Chemicals

The authors decided to utilize MgCl2 (25% Schuessler salt, technical grade) as the magnesium source for the experimental procedures as it represents the most prevalent chemical in this field [37]. Furthermore, it is regarded as the magnesium source for struvite precipitation at the WWTP in Braunschweig. A notable benefit of this chemical is its simplicity in terms of handling and dosage, given its status as a particle-free, high-concentration liquid. Other magnesium sources, including Mg(OH)2, MgO, seawater and bittern, were also considered. However, the use of MgO or Mg(OH)2 presents a dilemma, as while it reduces the need for lye in the process, it concomitantly complicates control at the laboratory scale. A further disadvantage of these alternatives is the handling of the solution, which has to be constantly mixed due to the presence of undissolved particles. Seawater and bittern are also good options, but they are not readily available and therefore have lost their practical relevance. For pH adjustment, we prepared 1 molar NaOH (1 M, Roth, technical grade) and 1 molar HCl (1 M, Roth, technical grade) solutions.

2.6. Analytics

We filtered the samples through a 0.45 µm filter and subsequently analyzed them for ions. The orthophosphate concentration was measured using a cuvette test and UV-vis spectrophotometer (LCK 350, Hach + Lange, Düsseldorf, Germany). We followed the same procedure for magnesium and calcium (LCK 327, Hach + Lange, Germany). Ammonium was determined using an ion-selective probe (NH3 502, WTW, Troistedt, Germany). At the beginning and at the end of each experiment a sample was filtered through 0.45 µm and analyzed with inductively coupled plasma optical emission spectroscopy (ICP-OES) to determine the fate of other ions.
Prior to use in the experiments, we filtered the centrate through a 0.7 µm glass fiber filter (Roth, Germany) to avoid interference from sludge or struvite particles during the particle size distribution (PSD) measurement. At the end of the experiment, we decanted the solids for one hour, after which we collected the precipitate in glass snap-cap vials using a pipette. We collected the solid-free supernatant and used it as the medium for the PSD measurement to avoid possible agglomeration of the particles. Immediately after phase separation, we determined the PSD using dynamic image analysis (Qicpic L02-Lixel, 0.5 cuvette, M5, SYMPATEC, Clausthal-Zellerfeld, Germany). We transferred 250 mL of the supernatant to a 1 L beaker and placed it on a magnetic stirrer. The stirring speed was meticulously calibrated to ensure the absence of air bubbles, as this could otherwise compromise the accuracy of the measurement, while also preventing the settlement of any precipitate at the base of the beaker. We used a peristaltic pump (Medorex—SN 1509-980, Nörten-Hardenberg, Germany) to transfer the sample into the measuring chamber and afterwards into another baker at a flow rate of 200 mL/min and started it before adding the particles. The precipitation sample was homogenized by shaking and sampled with a pipette. We slowly added the sample to the supernatant until 0.2% of the optical concentration was reached. We then started the measurement and allowed it to run for one minute, after which we rinsed the instrument with distilled water. We used the EQPC (equivalent projection area of a circle) evaluation method, representing the diameter of the circle whose projection area is identical to that of the particle.

2.7. Software

We determined the SI for struvite in each experiment using the software PHREEQC version 3 [38]. The sit database was used, which was previously expanded to include struvite [16]. In the literature, the pkSP of struvite is given in the range 10 °C to 45 °C. For 5 °C, the pkSP was extrapolated from the data reported by Rahaman. In this work, the pkSP for 5 °C and 33 °C was determined to be 13.85 (kSP = 1.41 × 10⁻¹⁴) and 13.1 (kSP = 7.94 × 10⁻¹⁴), respectively [22].

3. Results

3.1. Effect of Initial Ion Concentration, Applied pH Value and Temperature

The 24 lab scale experiments to identify the influence of pH, initial ion concentration and temperature on the struvite precipitation in anaerobic digestion centrate are presented in Figure 2. For each initial PO4-P concentration, we plotted a graph separated at 5 °C and 33 °C, resulting in six graphs in total. The graphs are as follows: (a) = 353 mg P/L at 5 °C; (b) = 353 mg P/L at 33 °C; (c) = 165 mg P/L at 5 °C; 165 mg P/L at 33 °C; (e) = 68 mg P/L at 5 °C and (f) = 68 mg P/L at 33 °C. In each graph, we plotted the PO4-P concentration over time for each pH level. Based on these results, we developed a nomograph. Table 2 provides a summary of the experimental design and the initial start conditions. The discussion will address the impact of various parameters on the centrate’s crystal size distribution, including initial ion concentration, pH, and temperature.

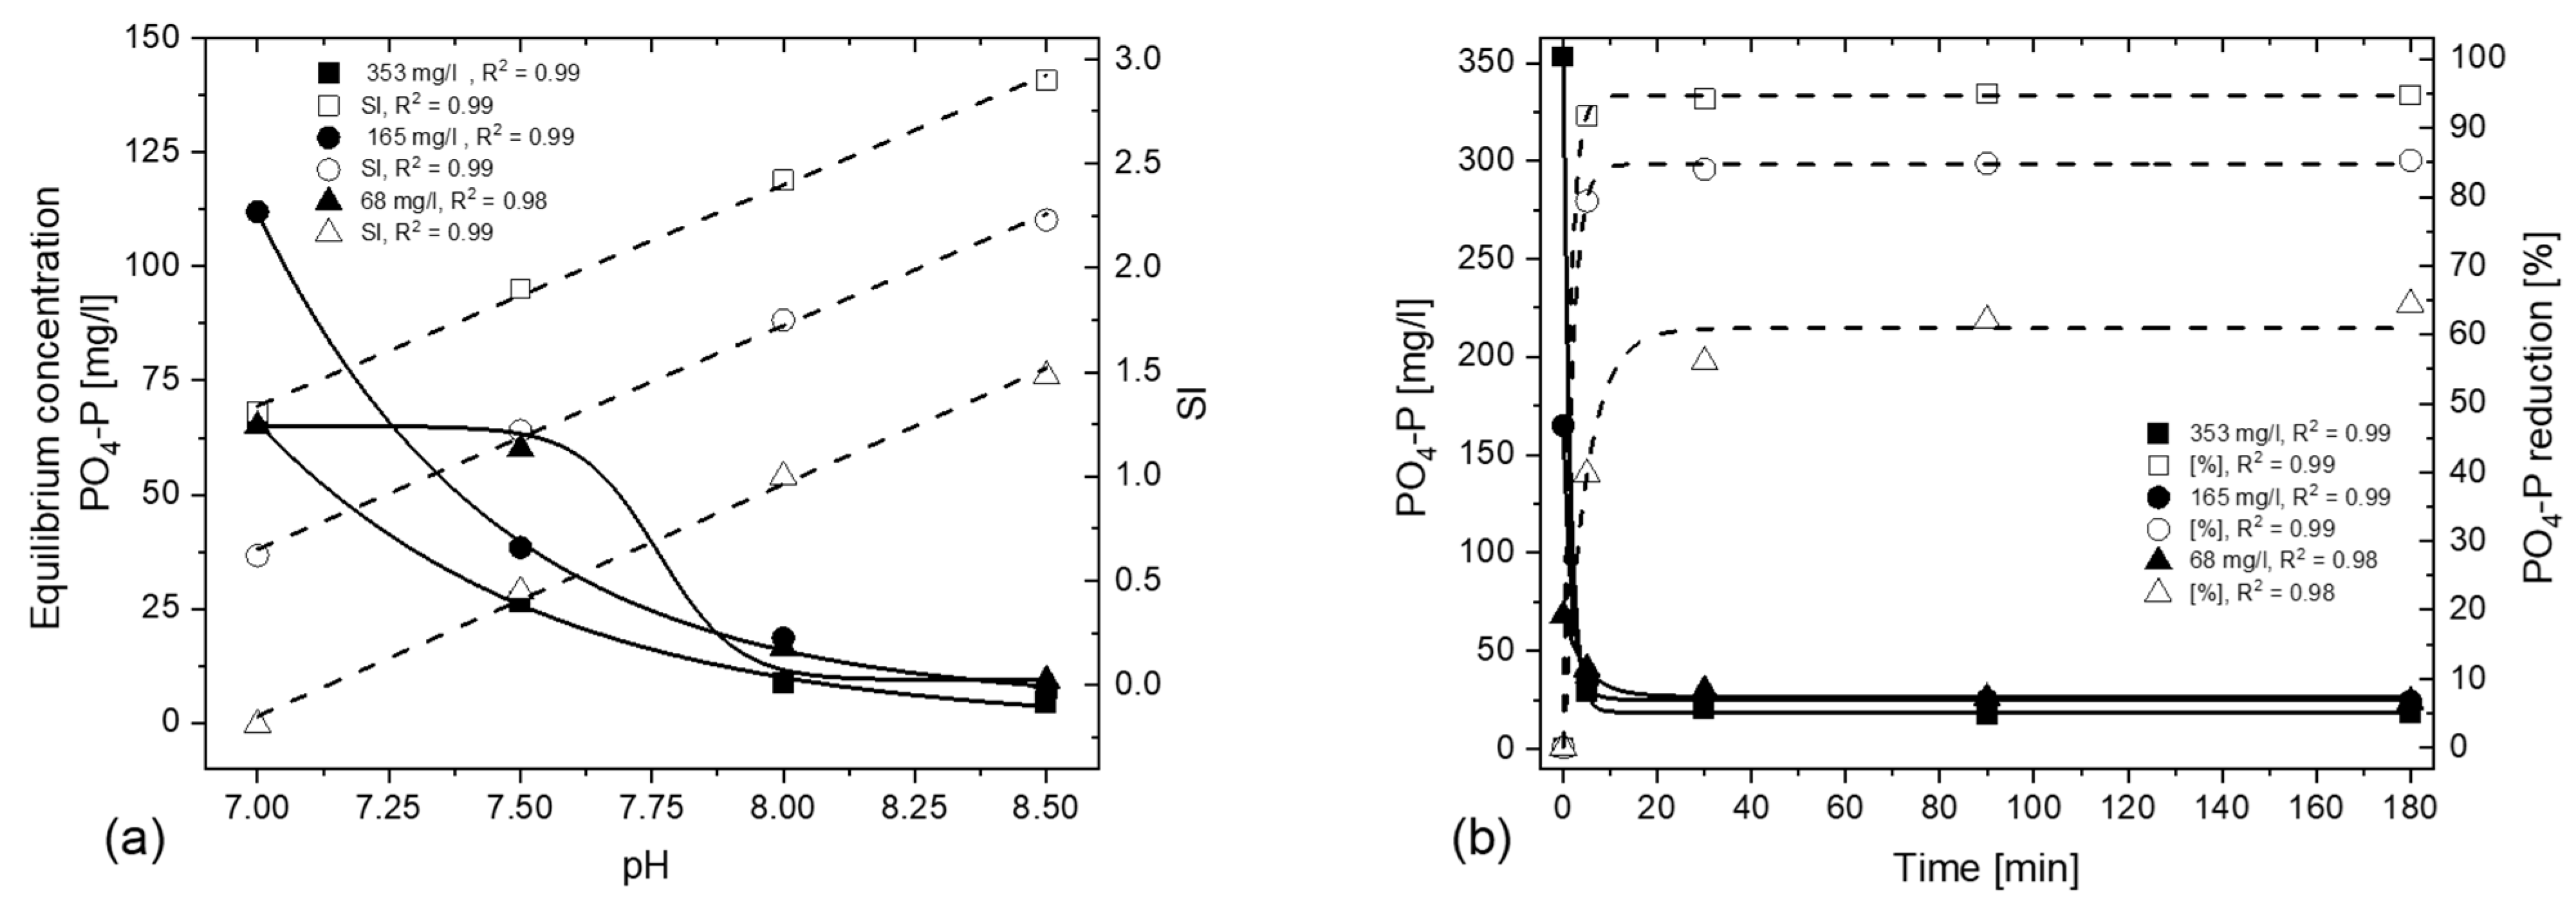
3.1.1. Effect of Initial Ion Concentration and Applied pH Value

Figure 2 shows clearly that adapting the process conditions to the properties of the precipitation matrix is imperative to achieve optimal P reduction and subsequent struvite yield. It also shows that, an increase in pH results in a decrease in the resulting PO4-P concentration in each set, implying more effective struvite precipitation, a finding that is consistent with the results of previous research [39]. Nevertheless, in earlier studies, researchers frequently analyzed PO4-P concentrations below 100 mg/L [15,27]. Since we considered higher initial PO4-P concentrations in the present study, we can also confirm the positive influence of increasing pH on PO4-P reduction and subsequent struvite precipitation for this concentration range. Furthermore, the use of different concentrations demonstrated that an increase in the initial ion concentration results in increased precipitation at the same pH value. This correlation stands in contrast with investigations promoting a universal optimum pH of 9 or above for struvite precipitation [17,26,40]. Instead, the pH value must be considered in relation to the input concentration. Consequently, the pH value must be selected higher for a low concentration and lower for a high concentration in order to achieve sustainable recovery of P. An increase in either the initial ion concentration or the applied pH value has been demonstrated to result in a higher SI, thereby leading to a subsequent decrease in PO4-P. Figure 3 shows a contour plot that provides a visual representation of the percentage of PO4-P reduction resulting from the interaction between different initial PO4-P concentrations, pH values at 5 °C, and struvite precipitation. The plot demonstrates that as the initial PO4-P concentration decreases, the pH must increase to achieve the same process efficiency. For instance, in set C, where the initial ion concentration is low, a pH of 8.5 is necessary to achieve a process efficiency of over 80% PO4-P reduction (C20). In contrast, for the high initial concentrations in set A, the same PO4-P decrease can be achieved with a pH of 7.0 (A1), and even over 90% with a pH of 7.5 (A2). The results demonstrate that an elevated initial PO4-P concentration yields a higher PO4-P removal efficiency.
Irrespective of the initial ionic concentration, all experiments proceed towards a state of equilibrium with respect to PO4-P, provided that there is sufficient SI at the beginning. For example, we observed no struvite reaction or only an incomplete reaction in experiments C 17, C 18, and C 21 with pH of 7.0 and 7.5, which can be explained by the low or even negative SI of −0.19, 0.45 and −0.31, respectively. Figure 4a shows the equilibrium PO4-P concentration after 180 min and the resulting SI at 5 °C. It is noteworthy that when SI above 1 is attained, the equilibrium concentration is predominantly influenced by the applied pH, becoming independent of the initial ion concentration. This observation indicates that an increase in the initial PO4-P concentration results in a greater percentage PO4-P reduction at the same pH level (Figure 4b), and consequently, a higher amount of struvite [41].
Figure 5 shows that a correlation between the resulting SI values of the experiments and the percentage of PO4-P reduction during precipitation exists, with a sigmoidal curve fitted for each temperature range. Regardless of the temperature, an SI above 1 is required for successful precipitation, with approximately 75% of the PO4-P eliminated when the SI exceeds 1.0–1.15. To achieve a 90% PO4-P reduction from the centrate after 180 min, the precipitation process must have an SI of at least 1.7 at 5 °C and 33 °C. An SI above 2.1 provides little improvement regarding PO4-P removal and is disproportionate to the amount of caustic used. Corona et al. (2021) and Ye et al. (2016) also describe another disadvantage of a high SI: struvite particle size decreases when SI increases, resulting in more fine particles being lost in the effluent [26,42]. In contrast, an SI within the range of 1.36–1.69 has proven to be conducive to struvite crystal growth in a fluidized bed reactor, suggesting that the optimal SI for PO4-P reduction and crystal growth may be similar [16,42]. Bhuiyan et al. (2008) report an SI range between 0.3 and 0.77 to be sufficient to precipitate more than 80% of the PO4-P mean input concentration of 76 mg/L in a fluidized bed reactor and a recycling ratio between 5 and 9 at pH 8.0–8.2 [43]. In this study, researchers used a different ksp of 13.36 to feed PHREEQC. In 2008, version 2 was current, which did not yet include the sit database that was used for the present work. However, Gonzales-Morales et al. (2021) report an SI of 1.71 with a PO4-P removal efficiency of 92.7%. It is also noteworthy that SI values greater than 3.19 have been shown to result in 99% removal efficiency [44]. In consideration of the heterogeneity of the research community with regard to the methods of saturation, supersaturation and SI employed, as well as the utilization of disparate models and databases, the comparison of studies and their outcomes can prove challenging [16].

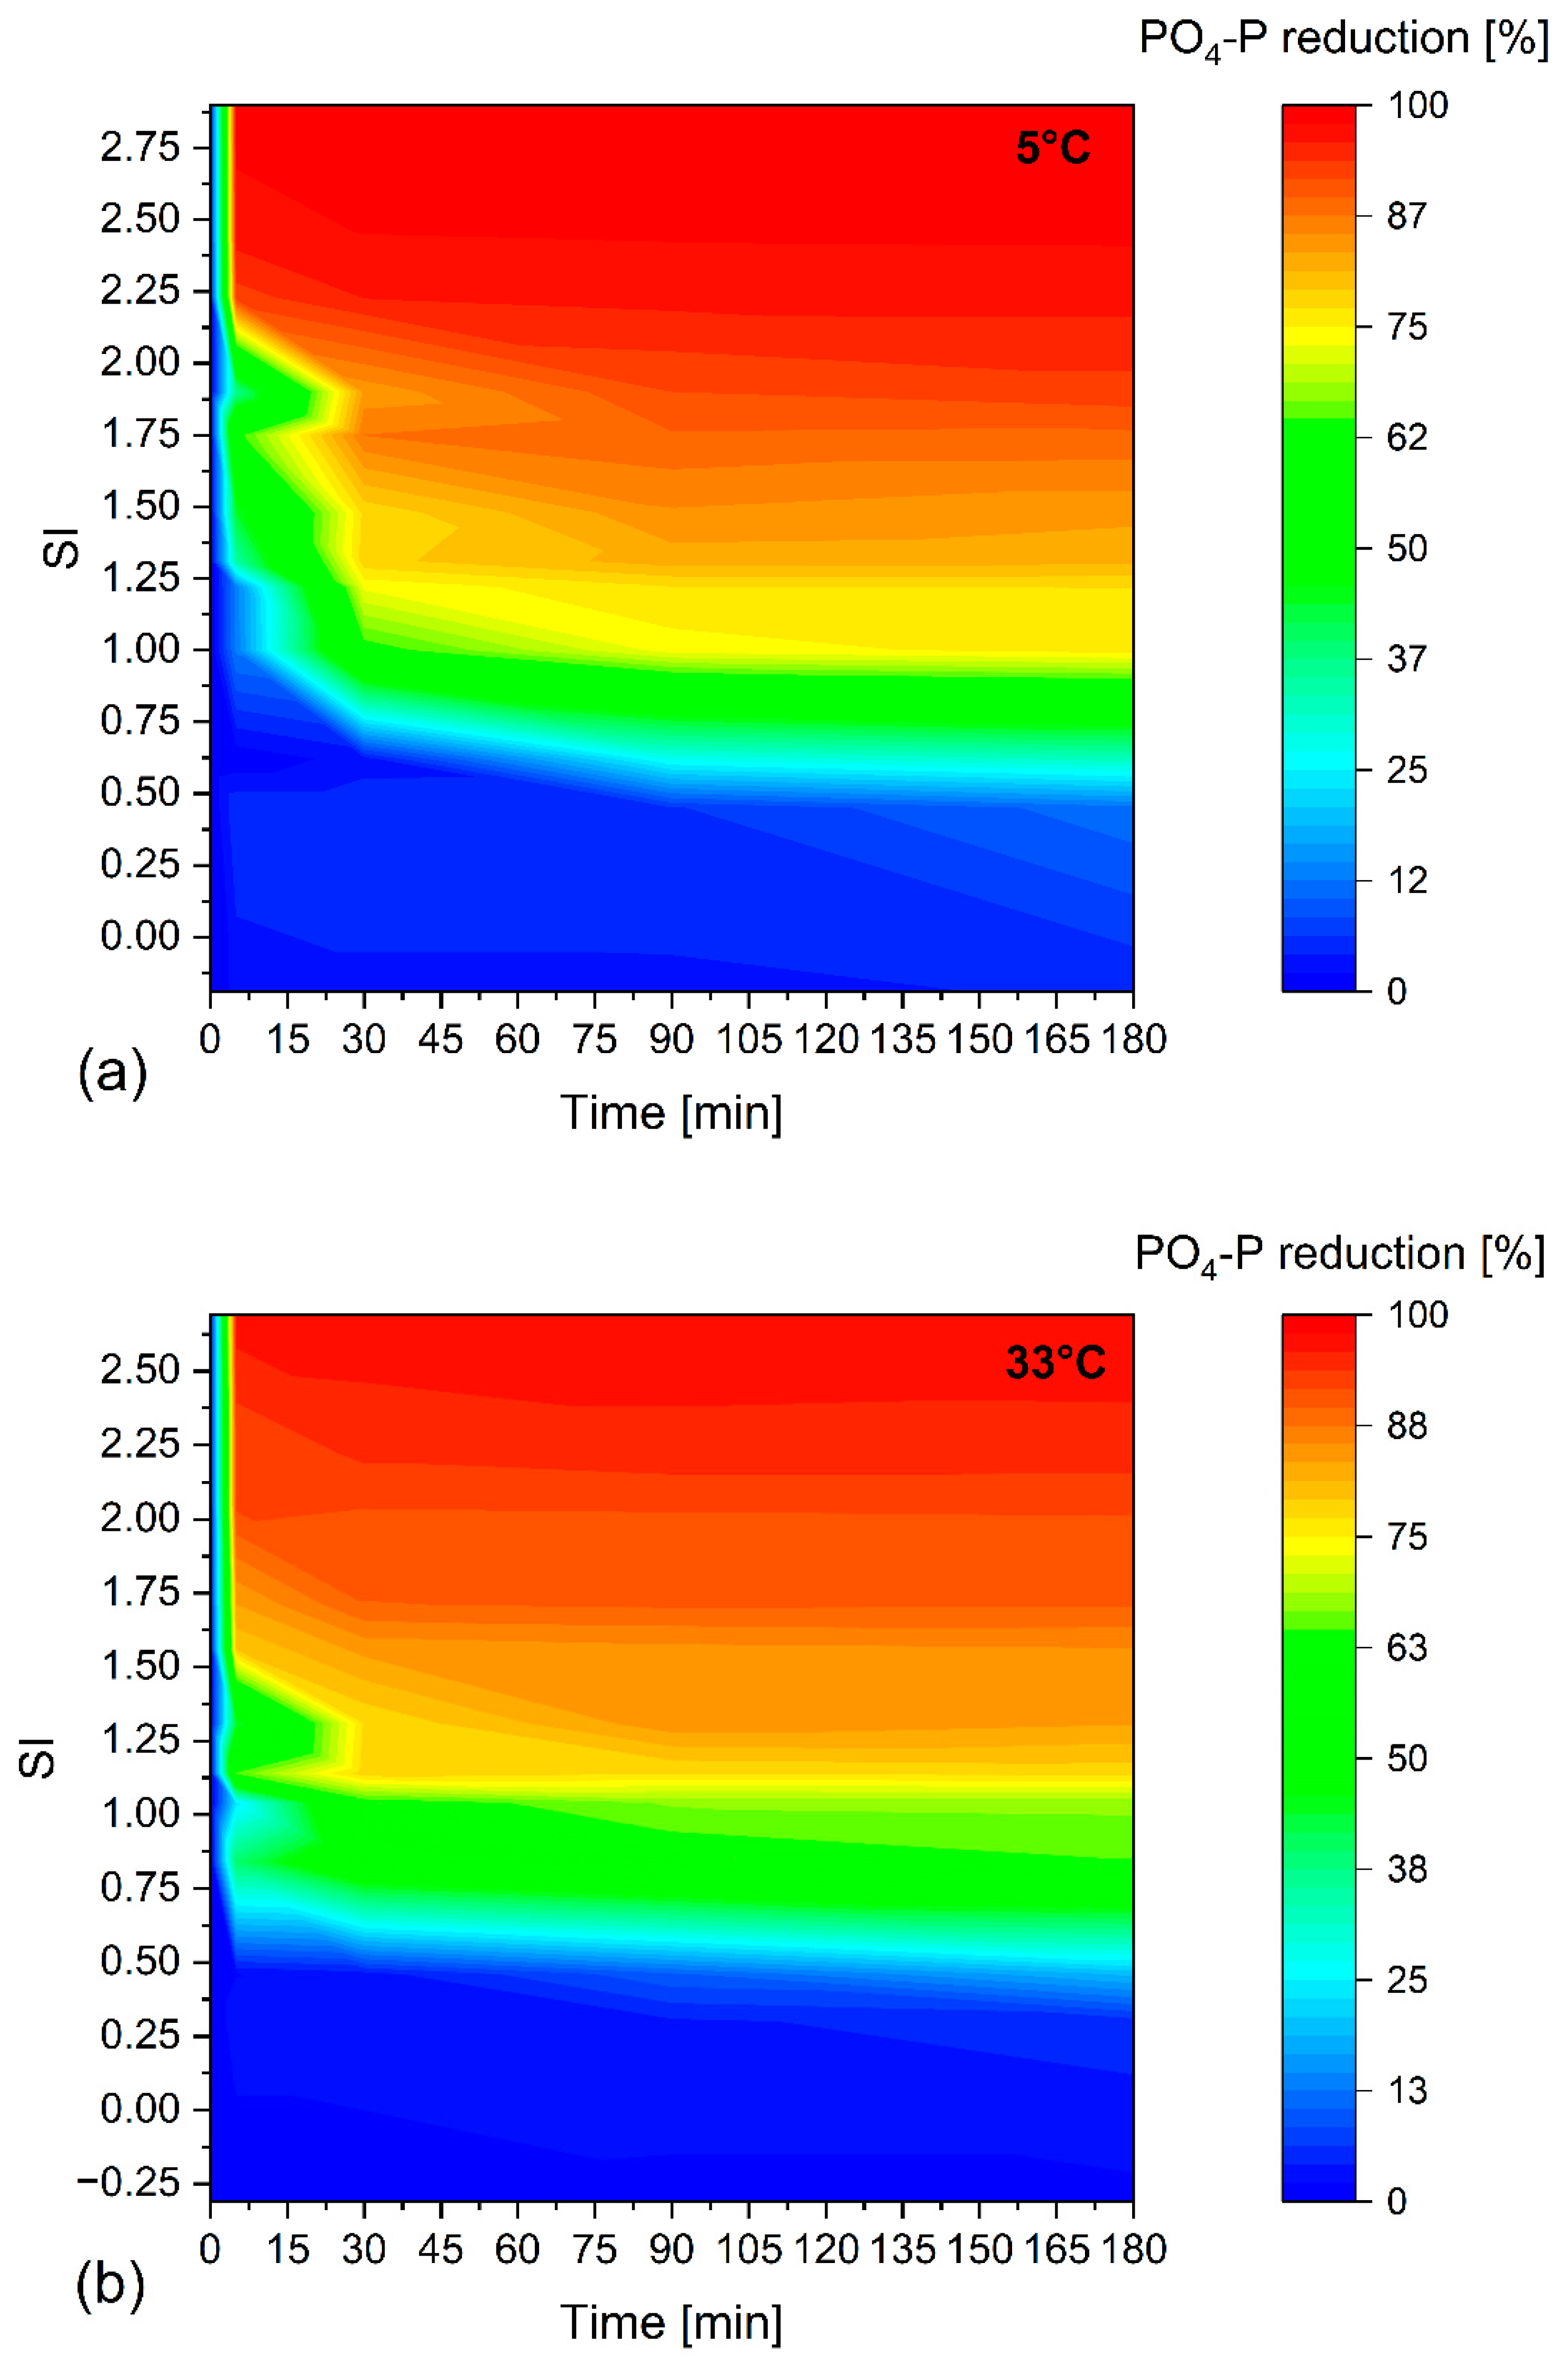
3.1.2. Effect of Temperature

An increase in temperature causes an increase in reaction kinetics and a subsequent reduction in induction time. This effect leads to a higher PO4-P reduction at the beginning of the experiment at 33 °C, which is compensated by the end of the experiment at 5 °C (Figure 2). This is consistent with the slightly higher PO4-P reduction observed at 5 °C compared to 33 °C, indicating that efficiency of PO4-P reduction is consistently slightly higher at lower temperatures (Figure 5). This phenomenon can be explained by the elevated SI as well as by the findings of Ariyanto et al. (2011), who demonstrated that the maximum solubility of struvite occurs at 35 °C [45]. It is evident that a proportion of the precipitated struvite dissolves again at 33 °C, thereby resulting in elevated PO4-P concentrations. Consequently, we do not recommend the precipitation of struvite at temperatures ranging from 30 to 33 °C, as this results in a lower PO4-P reduction in comparison to other temperature ranges that exhibit equivalent precipitation conditions. Furthermore, these temperatures favor the co-precipitation of additional ions, such as calcium, as evidenced by Gonzales-Morales et al. (2010) [44].

3.1.3. Influence on Reaction Kinetics

The study demonstrated that the reaction kinetics exert a significant influence on the requisite hydraulic retention time (HRT), consequently affecting the volume required for precipitation tanks. The findings of the study indicate that the kinetics increase in proportion to an increase in either the SI or temperature. Figure 6 presents a contour plot of the SI and the PO4-P reduction for all experiments, with the data separated according to temperature conditions of 5 °C and 33 °C. The effect of temperature on the reaction was striking at the outset of the experiments; at 5 °C, the reaction was very slow within the first five minutes, whereas at 33 °C, the reaction was almost complete under the same conditions. A PO4-P reduction of more than 85% within the first five minutes requires an SI of more than 2.25 at 5 °C, whereas an SI of 2.00 is required at 33 °C.
From the results obtained, it can be deduced that as SI increases, so does the reaction speed. Furthermore, it is evident from the results of Mehta and Batstone (2013) that the majority of the reaction is complete after 30 min [46]. After 90 min, the PO4-P concentration remains constant in all experiments except B9 and B13 due to the pH of 7.0, resulting in an SI of 0.62 and 0.46, respectively. Therefore, we recommend a HRT of two hours as long as sufficient mixing is ensured and there are no short-circuit flows in the reactor. As shown in Figure 6, there is a clear indication of SI values or limits beyond which a further enhancement in PO4-P reduction is observed. The SI limits are approximately 1.7; 1.1; 0.6 for 5 °C and 1.7; 1.15; 0.55 for 33 °C, corresponding to PO4-P reductions of 90%, 75% and 25%, respectively.
From the findings of the experiments, in conjunction with the calculated SI and the resultant PO4-P reduction, a contour plot as seen in Figure 7 was created to facilitate the determination of the resulting SI for variable PO4-P and pH values. The calculation of the SI was performed utilizing the PHREEQC software version 3, with a Mg:P ratio of 1:1, a constant NH4-N concentration of 616 mg/L at 25 °C and a pkSP of 13.26 [21]. The results shown in Figure 7 highlight an ideal operational SI in the range of 1.7 to 2.1, which correlates to a reduction of PO4-P of over 90% and minimal caustic requirements, representing the sweet spot between process effectiveness and resource efficiency. To the best of the authors’ knowledge, this type of nomogram is presented for the first time in this paper. The tool can be utilized by WWTPs or other plant operators to ascertain the optimal pH level for operation, considering the prevailing PO4-P concentration in the centrate. The primary benefit of the tool is that time-consuming investigations into the optimized pH can be reduced. Furthermore, the tool enables the determination of whether the process settings are within an appropriate range, thus enabling the reduction of unnecessary NaOH dosing or the adjustment of settings to enhance precipitation efficiency. While the measurement of the pH and the determination of PO4-P in the input and output for control remain essential, the extent of expensive analyses can be reduced, which in turn reduces the working hours of the personnel. However, it should be noted that the application of the nomogram is not without its limitations, specifically that its efficacy is diminished in matrices that contain elevated concentrations of calcium and iron ions, as these compete for the PO4-P. It is also important to consider the NH4-N concentration, as Figure 7 is based on a fixed concentration. If the specific concentration exceeds this value, the SI will increase, while it will decrease at lower concentrations.

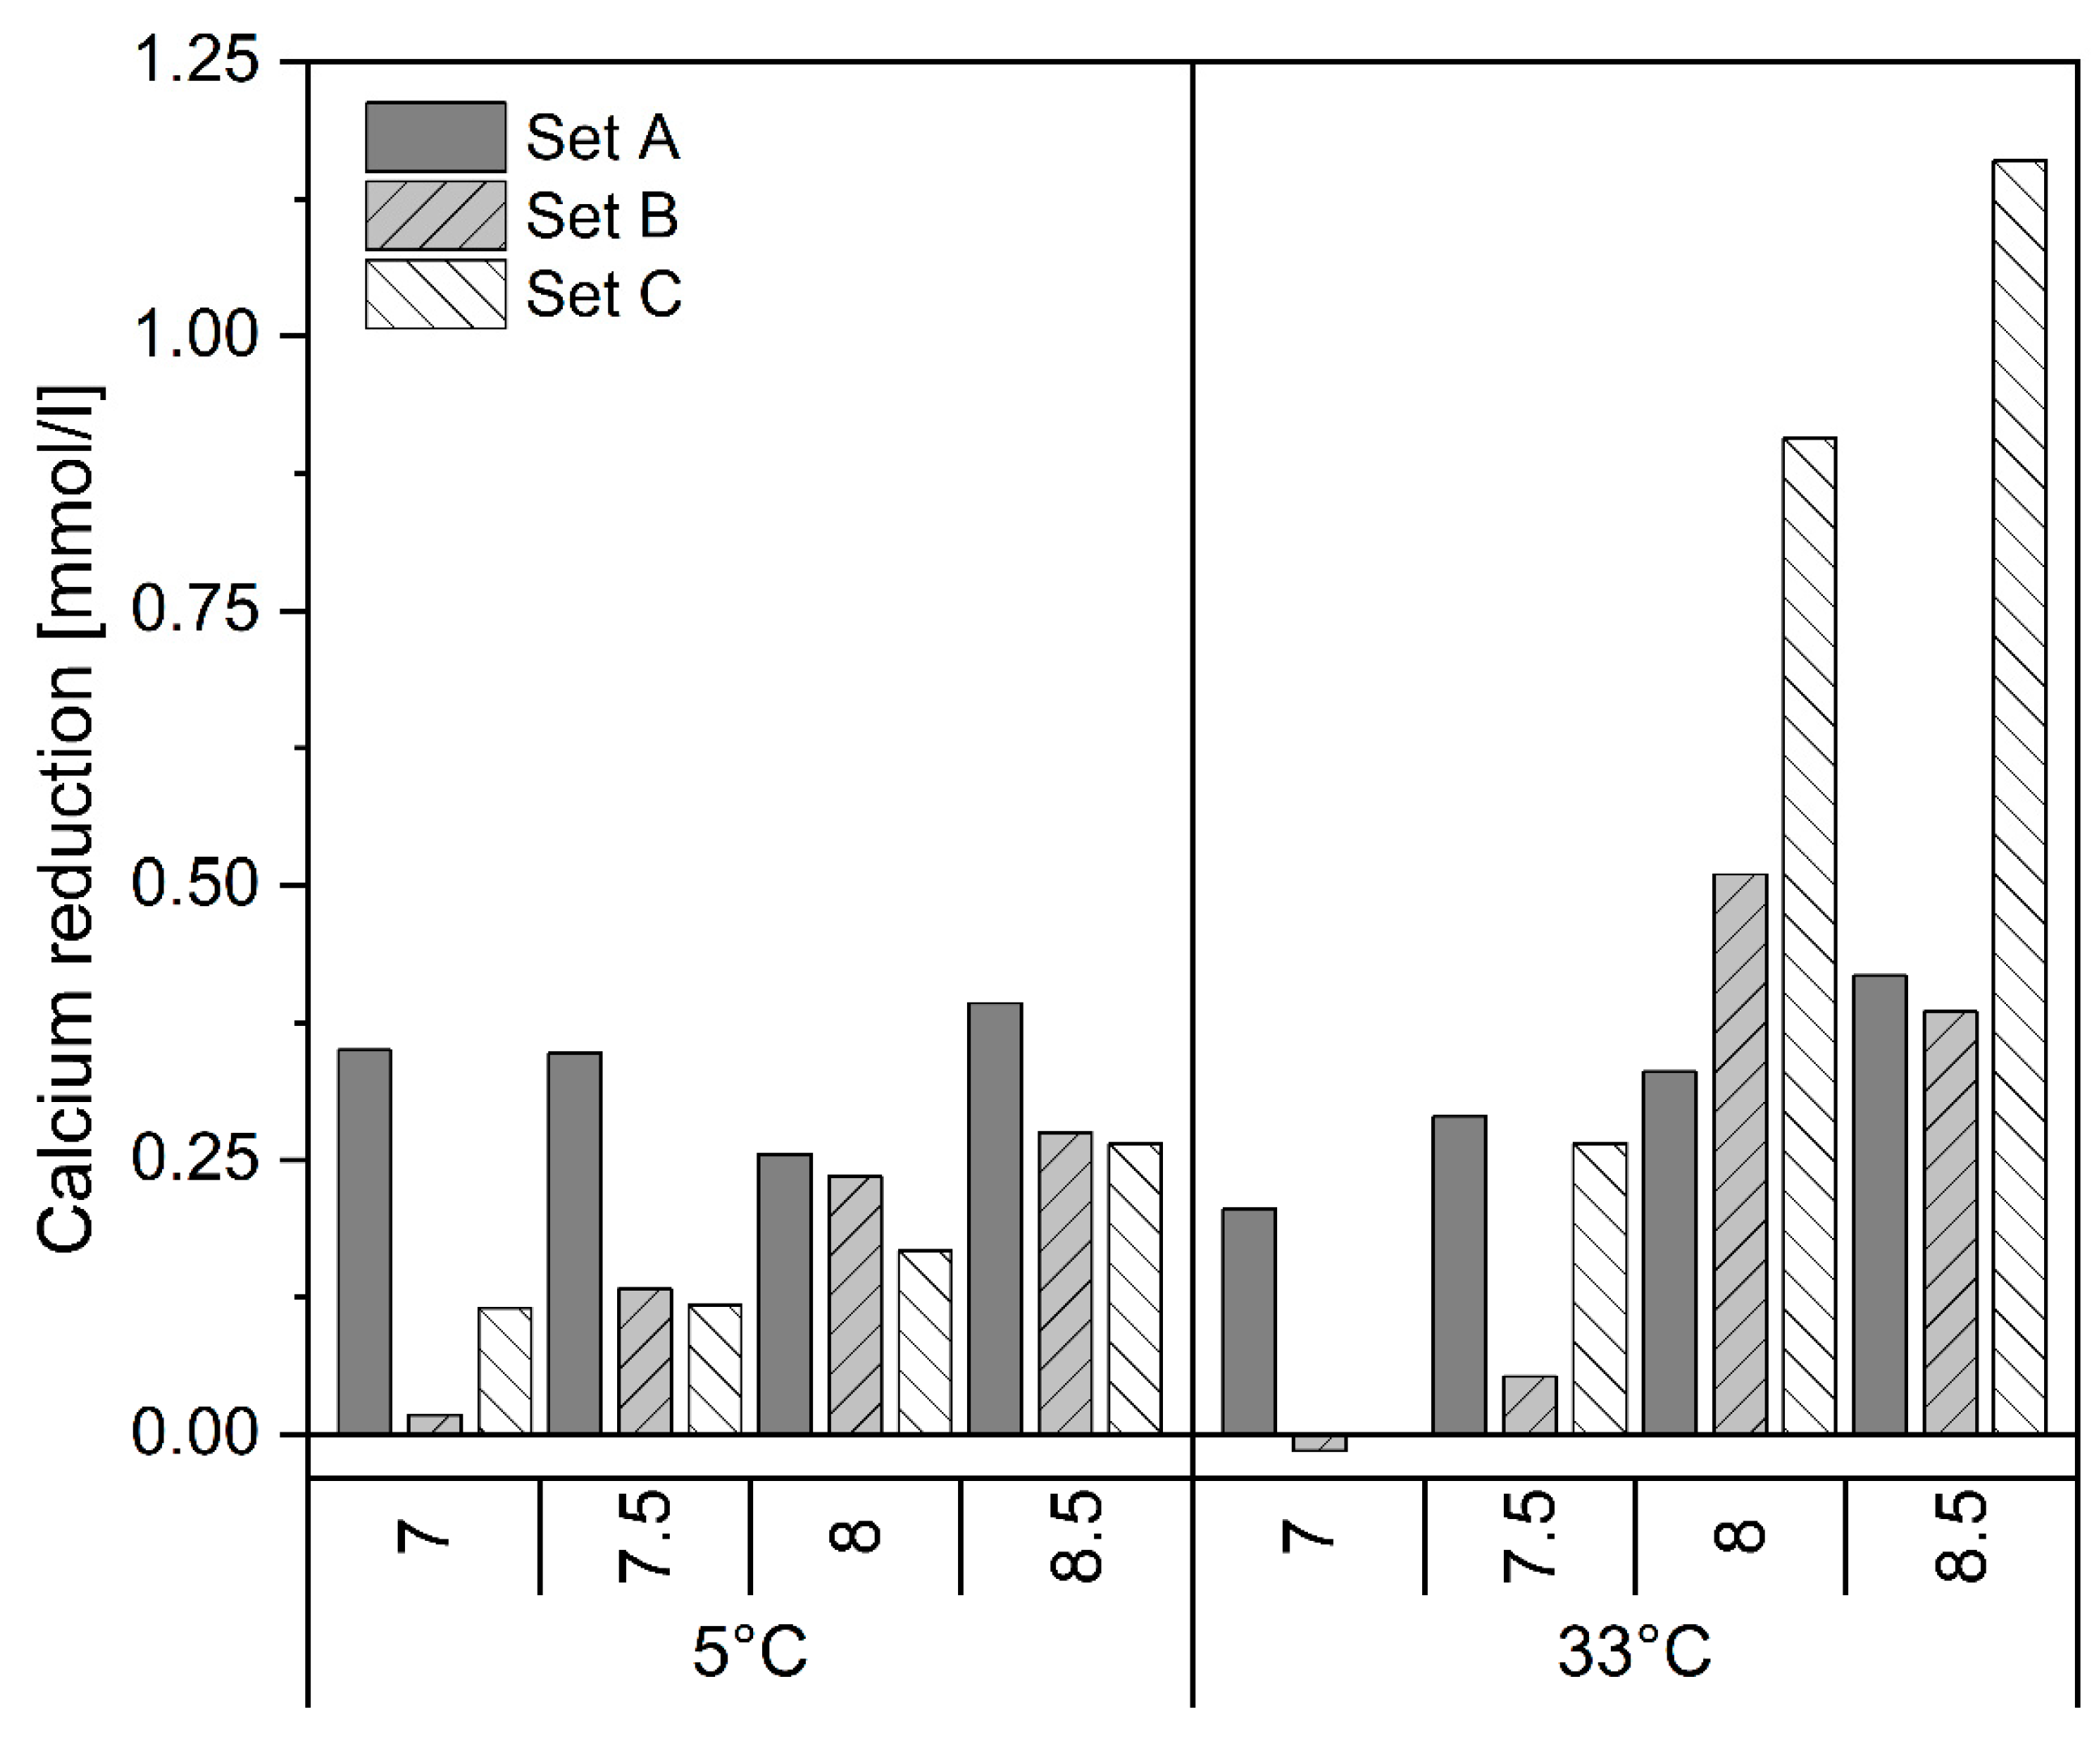
3.2. Fate of Other Ions

As we mixed centrate with tap water for set B and C, most of the ions were diluted. However, in all experiments, an over-stoichiometric amount of ammonium to precipitate struvite was still provided. Concurrently, the calcium content increased due to the tap water and the sodium concentration increased due to the pH adjustment. It is therefore conceivable that, at the prevailing alkaline pH values, phases other than struvite may precipitate, e.g., brushite, hydroxyapatite, K-struvite or newberyite [47]. We established the presence of struvite through two methods. Firstly, we estimated the molar reduction of the precipitating partners. Secondly, we identified the struvite crystals under the microscope.
The ICP-OES analyses demonstrated that the majority of other ions exhibited stability within the matrix and did not precipitate. However, we also observed that the element with the greatest reduction, apart from P and Mg, was calcium, particularly at elevated pH and temperature shown in Figure 8. While the reduction within the 5 °C precipitation regime is in a moderate and comparable range for all sets, in set C with the highest calcium concentration at 33 °C and pH 8.5, almost five times as much calcium precipitates. For an absolute understanding of the precipitate composition, a solid phase analysis such as XRD would have to be carried out, which was not possible in this case.
The objective of the present study was to recover phosphorus and, in the most favorable circumstances, struvite. It is improbable that an entirely pure product will be obtained by working with centrate/filtrate from WWTPs, which all possess an individual composition that allows for a wide range of other possible and probable precipitates [47]. Notwithstanding, the most probable impurities cited above, including calcium and potassium, are also essential nutrients for plants and thus do not pose a problem when utilized as fertilizer [48].

3.3. Crystals

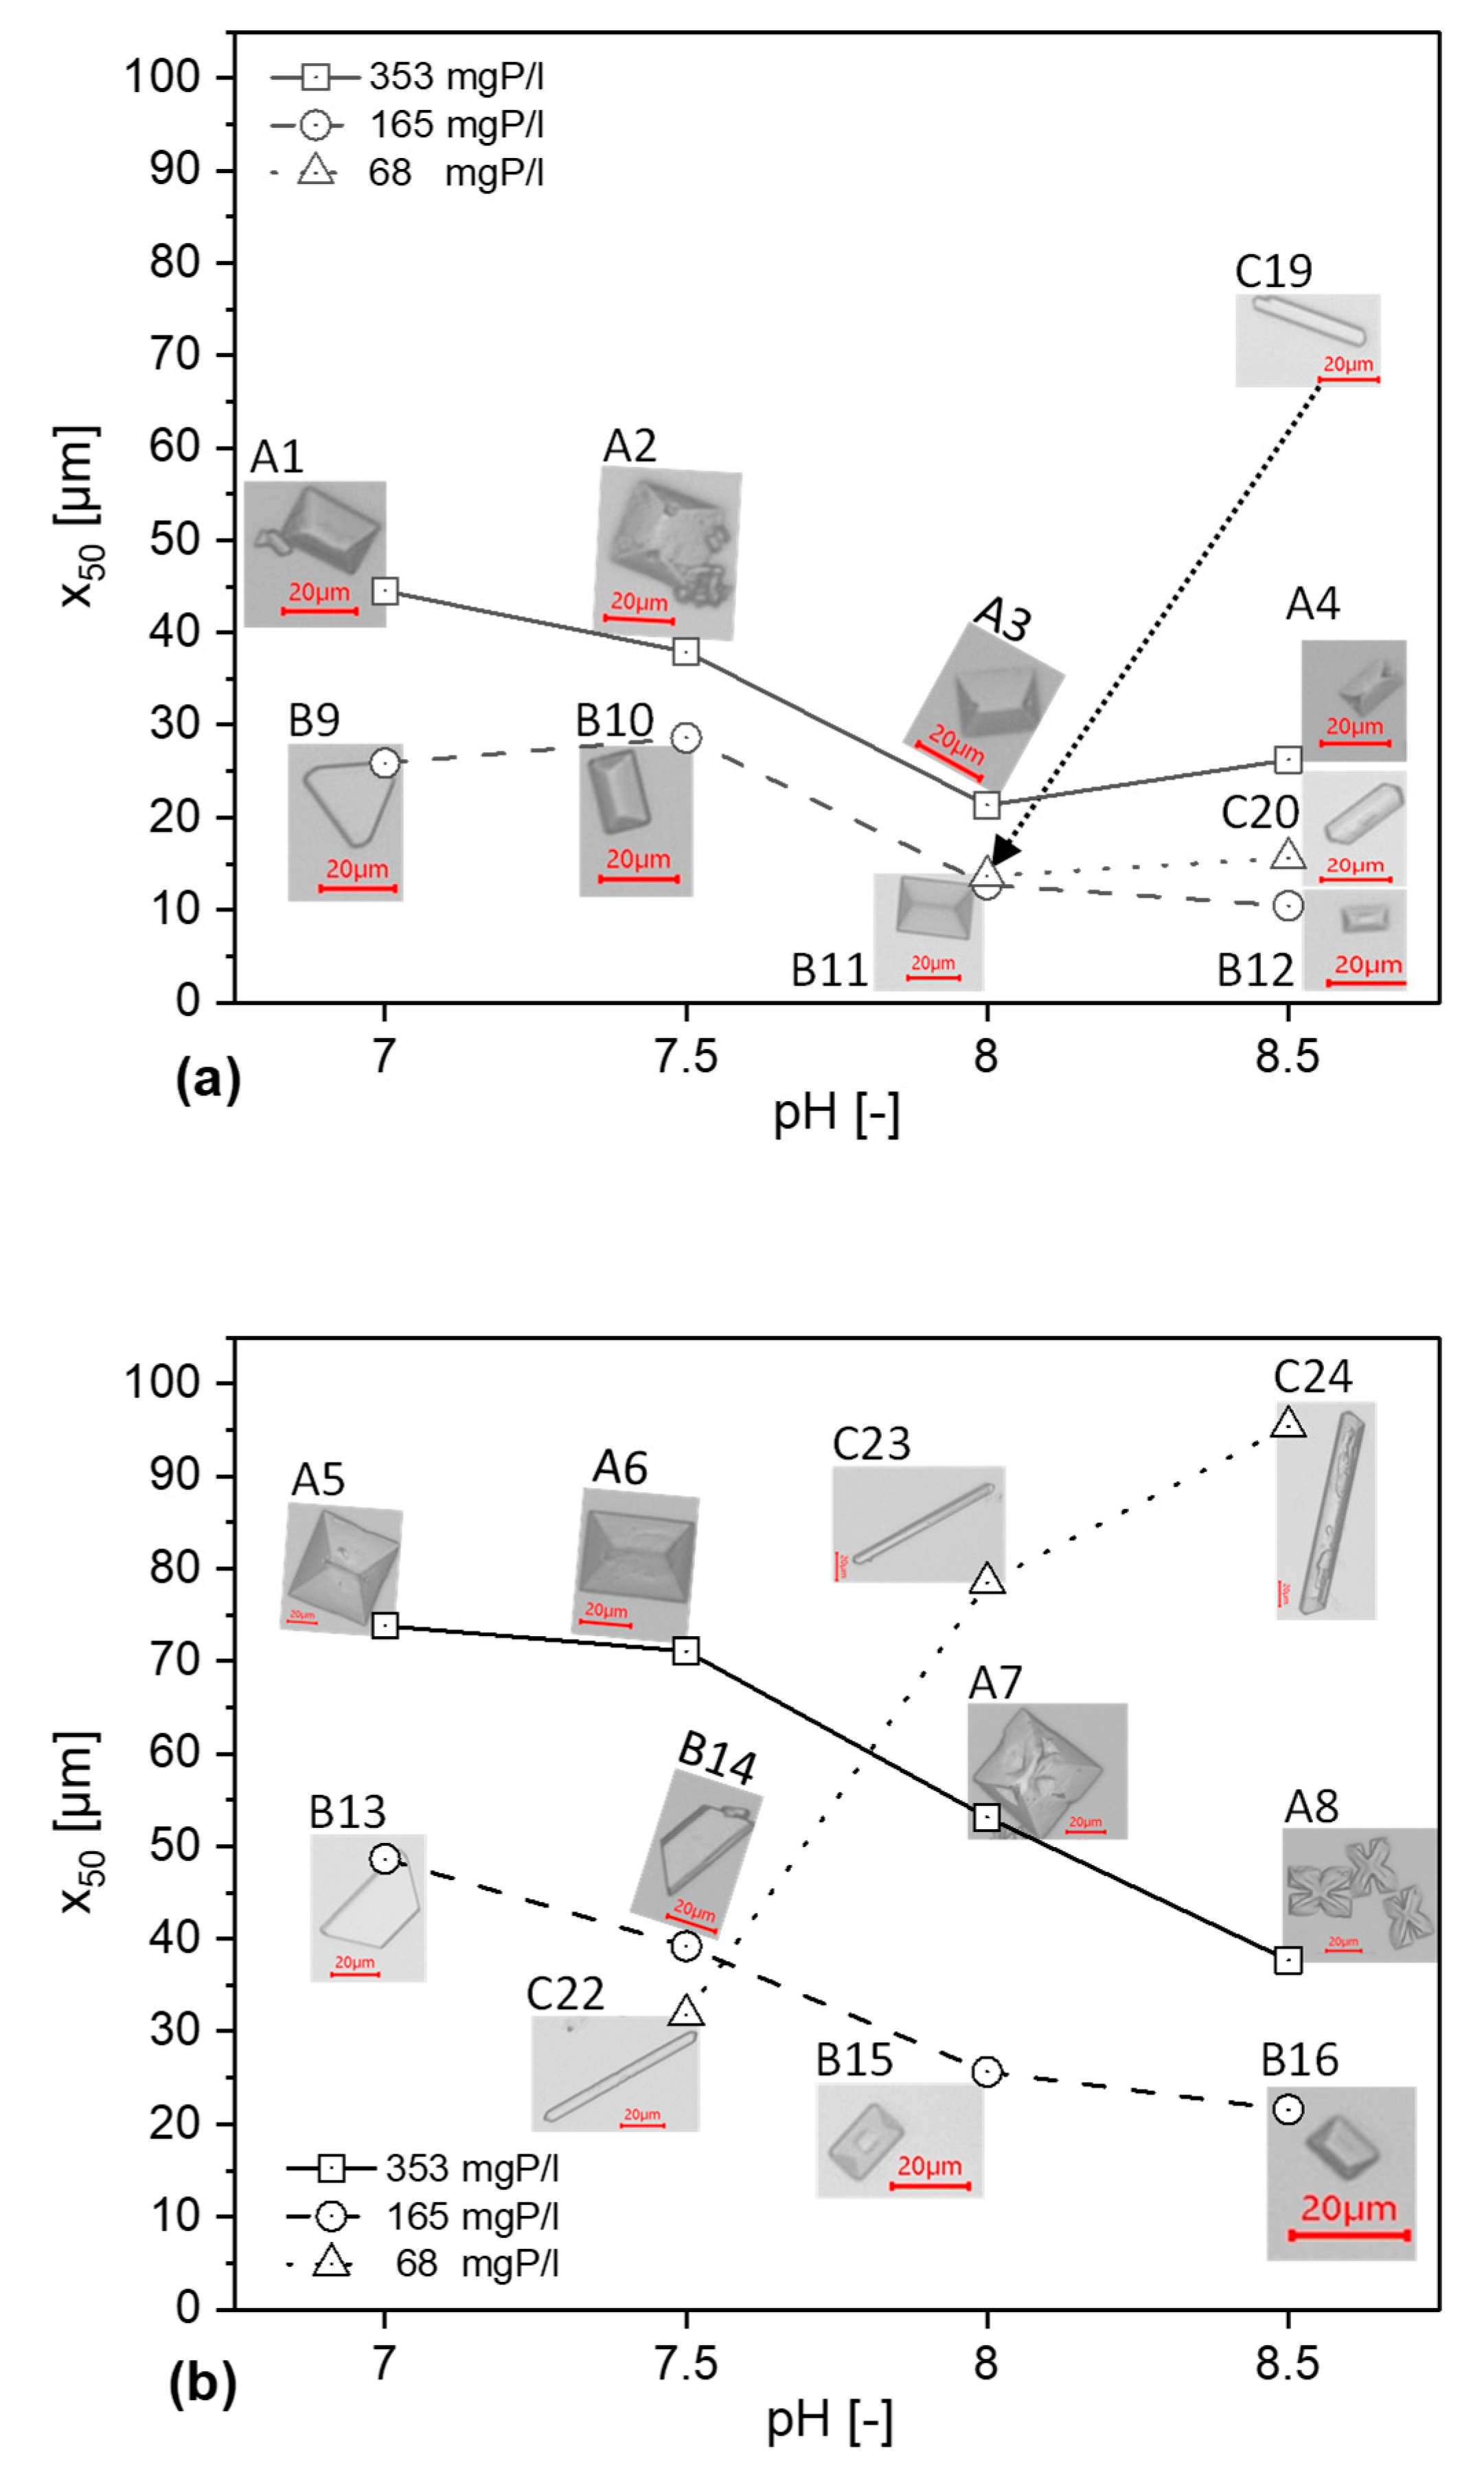
3.3.1. Influence on Particle Size Distribution

After each experiment, we retrieved the crystals and determined their dimensions directly in suspension via dynamic image analysis. Table 3 presents the outcomes for the PSD ×10, ×50 and ×90, indicating the particle size at which 10%, 50% and 90% of the quantity, respectively, is smaller. However, in set C, we could not obtain sufficient measurements for all experiments due to the low number of crystals formed and recovered in the experiments C17, C18 and C21. We can observe from all experiments in sets A and B that the resulting crystal size decreases with increasing pH, which is also supported by other research [49]. We observed an exception to this in experiment A4, where the small crystals tended to stick together in the suspension, resulting in distorted measurements. For set C, we observed the opposite effect of pH on crystal size, with increasing pH being associated with increasing average particle size. In C24, we collected the largest crystals of all experiments at pH 8.5. In general, the crystal size increased with increasing temperature, irrespective of the initial ion concentration. We obtained the largest average crystals at 68 mg/L PO4-P, NH4-N = 320 mg/L, pH = 8.5 and 33 °C with a size of 92.83 µm; the smallest at 9.87 µm at 165 mg P/L, 542 mg N/L, pH = 8.5 and 5 °C. Figure 9 presents microscopic images of the crystals.

3.3.2. Morphology of the Crystals

As demonstrated in Figure 9, the precipitation conditions result in a wide range of crystal morphology. The authors have attempted to select representative crystals for each experiment, but it should be noted that the images in Figure 9 are merely illustrative. While the temperature exerts the least influence on PO4-P reduction, it predominantly influences the shape of the crystals. The crystals not only become larger at 33 °C, but also tend to grow more irregularly. This phenomenon could be attributed to the acceleration of precipitation shown in Figure 6. This process has been observed in environments characterized by high supersaturation, such as those with elevated pH levels or initial ion concentrations. This acceleration in crystal growth is evident in experiments A4 and A8 of Figure 9, where the majority of crystals exhibited an X-shaped morphology. In set C, characterized by low PO4-P and elevated calcium concentrations, elevated temperatures give rise to crystals of a markedly elongated and needle-like nature (C22, C23, C24). This tendency to this effect is also observed at 5 °C (C19, C20), albeit to a lesser extent. The coffin-lid shape, for which struvite is renowned (i.e., A5, B11), is the common morphology observed between these two extremes. Similar observations have been made in other studies [49]. Although a correlation of SI with the resulting PSD would be very beneficial in predicting the associated crystal size, this research is not suitable due to the limited amounts of centrate used for the experiments. In order to better understand the effect of initial ion concentration, pH and temperature on crystal growth, a larger amount of centrate needs to be used. This could be the subject of further research.

4. Conclusions

In order to ensure the continued safety of food supplies, we must prioritize the recovery of P. Struvite has emerged as a promising solution to address this issue, as it has the potential to facilitate the closure of the nutrient loop. This research not only advances our understanding of struvite precipitation but also provides practical tools for its implementation, marking a significant step towards sustainable phosphorus management and circular economy principles in wastewater treatment.
The following points summarize the main findings of this study with regard to the effect of pH, initial ion concentration, temperature and SI on the PO4-P elimination and the crystals formed during struvite precipitation:
pH:
  • Increasing the pH accelerates the precipitation process.
  • PO4-P strives for a state of equilibrium, provided there is a sufficient SI. The resulting PO4-P concentration depends on the applied pH, independent of the initial ion concentration.
  • The size of the recovered crystals decreases with increasing pH at high and moderate concentrations in set A and B, whilst doing the opposite for low concentrations in set C.
Initial ion concentration:
  • Higher percentual PO4-P elimination is possible with a higher initial PO4-P concentration for the same pH and temperature conditions; by decreasing the initial ion concentration, operators must increase the applied pH of the process in order to achieve the same percentual P-removal.
Temperature:
  • Temperature has the least effect on the PO4-P removal. P removal is slightly better but slower within the first 30 min at 5 °C.
  • Higher temperature has a positive effect on the resulting crystal size compared to the same conditions at 5 °C.
Saturation Index:
  • An SI above 1 is required for a noticeable precipitation effect. No further PO4-P reduction occurs after 90 min at an SI of above 1.
  • An SI of 1.0–1.15 will precipitate about 75% of the PO4-P for 5 °C and 33 °C, respectively. To precipitate 90% of the PO4-P, an SI of 1.7 is required for 5 °C and 33 °C.
The results obtained from this study have enabled the creation of a nomogram as seen in Figure 7, which contributes to a more profound comprehension of struvite precipitation. This tool enables practitioners to do the following:
  • Identify optimal operating conditions for specific centrate compositions.
  • Effectively control struvite precipitation in real-world applications.
  • Balance process effectiveness with resource efficiency.
While this study focused on centrate from anaerobic digestion sludge, the principles uncovered here may be applicable to other phosphorus-rich waste streams, such as urine, dairy wastewater, and agricultural residues. Further targeted investigations into these streams are necessary to maximize phosphorus recovery and meet future market demands.

Supplementary Materials

The following supporting information can be downloaded at: https://www.mdpi.com/article/10.3390/resources14040056/s1.

Author Contributions

Conceptualization, A.K.; Methodology, A.K.; Validation, A.K.; Software, A.K.; Formal Analysis, A.K. and T.D.; Investigation, A.K.; Resources, T.D.; Data Curation, A.K.; Writing—Original Draft Preparation, A.K.; Writing—Review and Editing, A.K., T.G. and T.D.; Visualization, A.K.; Supervision, T.D.; Project Administration, T.D.; Funding Acquisition, T.D. All authors have read and agreed to the published version of the manuscript.

Funding

The authors would like to thank the German Federal Ministry of Education and Research (BMBF) for funding this research as part of the “P-Net” project (Grant No.: O2WPR1542A), as well as the Braunschweig wastewater treatment plant, the AVB and SE-BS. We acknowledge support by the Open Access Publication Funds of Technische Universität Braunschweig.

Data Availability Statement

Data are contained within the article or Supplementary Materials.

Conflicts of Interest

The authors declare no conflicts of interest.

References

  1. European Commission. Communication from the Commission to the European Parliament, the Council, the European Economic and Social Committee and the Committee of the Regions: Critical Raw Materials Resilience: Charting a Path Towards Greater Security and Sustainability, COM(2020) 474 Final; Office for Official Publications of the European Communities: Brussels, Belgium, 2020. [Google Scholar]
  2. Dockhorn, T. Stoffstrommanagement und Ressourcenökonomie in der Kommunalen Abwasserwirtschaft; Gesellschaft zur Förderung des Institutes für Siedlungswasserwirtschaft an der Technischen Universität Braunschweig: Braunschweig, Germany, 2007. [Google Scholar]
  3. Achilleos, P.; Roberts, K.R.; Williams, I.D. Struvite precipitation within wastewater treatment: A problem or a circular economy opportunity? Heliyon 2022, 8, e09862. [Google Scholar] [CrossRef]
  4. Valle, S.F.; Giroto, A.S.; Dombinov, V.; Robles-Aguilar, A.A.; Jablonowski, N.D.; Ribeiro, C. Struvite-based composites for slow-release fertilization: A case study in sand. Sci. Rep. 2022, 12, 14176. [Google Scholar] [CrossRef]
  5. Le Corre, K.S.; Valsami-Jones, E.; Hobbs, P.; Parsons, S.A. Phosphorus Recovery from Wastewater by Struvite Crystallization: A Review. Crit. Rev. Environ. Sci. Technol. 2009, 39, 433–477. [Google Scholar] [CrossRef]
  6. Rahaman, M.S.; Ellis, N.; Mavinic, D.S. Effects of various process parameters on struvite precipitation kinetics and subsequent determination of rate constants. Water Sci. Technol. 2008, 57, 647–654. [Google Scholar] [CrossRef] [PubMed]
  7. Bouropoulos, N.C.; Koutsoukos, P.G. Spontaneous precipitation of struvite from aqueous solutions. J. Cryst. Growth 2000, 213, 381–388. [Google Scholar] [CrossRef]
  8. Shih, Y.-J.; Abarca, R.R.M.; de Luna, M.D.G.; Huang, Y.-H.; Lu, M.-C. Recovery of phosphorus from synthetic wastewaters by struvite crystallization in a fluidized-bed reactor: Effects of pH, phosphate concentration and coexisting ions. Chemosphere 2017, 173, 466–473. [Google Scholar] [CrossRef]
  9. Kofina, A.N.; Koutsoukos, P.G. Spontaneous Precipitation of Struvite from Synthetic Wastewater Solutions. Cryst. Growth Des. 2005, 5, 489–496. [Google Scholar] [CrossRef]
  10. Cao, L.; Wang, J.; Xiang, S.; Huang, Z.; Ruan, R.; Liu, Y. Nutrient removal from digested swine wastewater by combining ammonia stripping with struvite precipitation. Environ. Sci. Pollut. Res. Int. 2019, 26, 6725–6734. [Google Scholar] [CrossRef]
  11. Song, Y.-H.; Qiu, G.-L.; Yuan, P.; Cui, X.-Y.; Peng, J.-F.; Zeng, P.; Duan, L.; Xiang, L.-C.; Qian, F. Nutrients removal and recovery from anaerobically digested swine wastewater by struvite crystallization without chemical additions. J. Hazard. Mater. 2011, 190, 140–149. [Google Scholar] [CrossRef]
  12. Wilsenach, J.A.; Schuurbiers, C.A.H.; van Loosdrecht, M.C.M. Phosphate and potassium recovery from source separated urine through struvite precipitation. Water Res. 2007, 41, 458–466. [Google Scholar] [CrossRef]
  13. Ronteltap, M.; Maurer, M.; Gujer, W. Struvite precipitation thermodynamics in source-separated urine. Water Res. 2007, 41, 977–984. [Google Scholar] [CrossRef]
  14. Ueno, Y.; Fujii, M. Three years experience of operating and selling recovered struvite from full-scale plant. Environ. Technol. 2001, 22, 1373–1381. [Google Scholar] [CrossRef]
  15. Battistoni, P.; de Angelis, A.; Pavan, P.; Prisciandaro, M.; Cecchi, F. Phosphorus removal from a real anaerobic supernatant by struvite crystallization. Water Res. 2001, 35, 2167–2178. [Google Scholar] [CrossRef] [PubMed]
  16. Natividad-Marin, L.; Burns, M.W.; Schneider, P. A comparison of struvite precipitation thermodynamics and kinetics modelling techniques. Water Sci. Technol. 2023, 87, 1393–1422. [Google Scholar] [CrossRef] [PubMed]
  17. Wang, J.; Song, Y.; Yuan, P.; Peng, J.; Fan, M. Modeling the crystallization of magnesium ammonium phosphate for phosphorus recovery. Chemosphere 2006, 65, 1182–1187. [Google Scholar] [CrossRef] [PubMed]
  18. Jones, A.G. Crystallization principles and techniques. In Crystallization Process Systems; Elsevier: Amsterdam, The Netherlands, 2002; pp. 58–79. [Google Scholar] [CrossRef]
  19. Hanhoun, M.; Montastruc, L.; Azzaro-Pantel, C.; Biscans, B.; Frèche, M.; Pibouleau, L. Temperature impact assessment on struvite solubility product: A thermodynamic modeling approach. Chem. Eng. J. 2011, 167, 50–58. [Google Scholar] [CrossRef]
  20. Bhuiyan, M.I.H.; Mavinic, D.S.; Beckie, R.D. A solubility and thermodynamic study of struvite. Environ. Technol. 2007, 28, 1015–1026. [Google Scholar] [CrossRef]
  21. Ohlinger, K.N.; P.E.; Young, T.M.; Schroeder, E.D. Kinetics Effects on Preferential Struvite Accumulation in Wastewater. J. Environ. Eng. 1999, 125, 730–737. [Google Scholar] [CrossRef]
  22. Rahaman, M.S.; Mavinic, D.S.; Bhuiyan, M.I.H.; Koch, F.A. Exploring the determination of struvite solubility product from analytical results. Environ. Technol. 2006, 27, 951–961. [Google Scholar] [CrossRef]
  23. Ali, M.I.; Schneider, P.A. An approach of estimating struvite growth kinetic incorporating thermodynamic and solution chemistry, kinetic and process description. Chem. Eng. Sci. 2008, 63, 3514–3525. [Google Scholar] [CrossRef]
  24. Daneshgar, S.; Buttafava, A.; Callegari, A.; Capodaglio, A. Simulations and Laboratory Tests for Assessing Phosphorus Recovery Efficiency from Sewage Sludge. Resources 2018, 7, 54. [Google Scholar] [CrossRef]
  25. Buchanan, J.R.; Mote, C.R.; Robinson, R.B. Thermodynamics of struvite formation. Am. Soc. Agric. Eng. 1994, 37, 617–621. [Google Scholar]
  26. Corona, F.; Hidalgo, D.; Martín-Marroquín, J.M.; Antolín, G. Study of the influence of the reaction parameters on nutrients recovering from digestate by struvite crystallisation. Environ. Sci. Pollut. Res. Int. 2021, 28, 24362–24374. [Google Scholar] [CrossRef] [PubMed]
  27. Kabdaşlı, I.; Atalay, Z.; Tünay, O. Effect of solution composition on struvite crystallization. J. Chem. Technol. Biotechnol. 2017, 92, 2921–2928. [Google Scholar] [CrossRef]
  28. Bareha, Y.; Saoudi, M.; Santellani, A.C.; Le Bihan, A.; Picard, S.; Mebarki, C.; Cunha, M.; Daumer, M.-L. Use of fermentation processes for improving the dissolution of phosphorus and its recovery from waste activated sludge. Environ. Technol. 2022, 43, 1307–1317. [Google Scholar] [CrossRef]
  29. Li, B.; Huang, H.M.; Boiarkina, I.; Yu, W.; Huang, Y.F.; Wang, G.Q.; Young, B.R. Phosphorus recovery through struvite crystallisation: Recent developments in the understanding of operational factors. J. Environ. Manag. 2019, 248, 109254. [Google Scholar] [CrossRef]
  30. Abbona, F.; Calleri, M.; Ivaldi, G. Synthetic struvite, MgNH4PO4.6H2O: Correct polarity and surface features of some complementary forms. Acta Crystallogr. B Struct. Sci. 1984, 40, 223–227. [Google Scholar] [CrossRef]
  31. Mohajit; Bhattarai, K.K.; Taiganides, E.; Yap, B.C. Struvite deposits in pipes and aerators. Biol. Wastes 1989, 30, 133–147. [Google Scholar] [CrossRef]
  32. Booker, N.A.; Priestley, A.J.; Fraser, I.H. Struvite Formation in Wastewater Treatment Plants: Opportunities for Nutrient Recovery. Environ. Technol. 1999, 20, 777–782. [Google Scholar] [CrossRef]
  33. Münch, E.V.; Barr, K. Controlled struvite crystallisation for removing phosphorus from anaerobic digester sidestreams. Water Res. 2001, 35, 151–159. [Google Scholar] [CrossRef]
  34. Quintana, M.; Sánchez, E.; Colmenarejo, M.F.; Barrera, J.; García, G.; Borja, R. Kinetics of phosphorus removal and struvite formation by the utilization of by-product of magnesium oxide production. Chem. Eng. J. 2005, 111, 45–52. [Google Scholar] [CrossRef]
  35. Li, B.; Boiarkina, I.; Yu, W.; Huang, H.M.; Munir, T.; Wang, G.Q.; Young, B.R. Phosphorous recovery through struvite crystallization: Challenges for future design. Sci. Total Environ. 2019, 648, 1244–1256. [Google Scholar] [CrossRef]
  36. European Union. Commission Implementing Regulation (EU) 2023/121 of 17 January 2023 Amending and Correcting Implementing Regulation (EU) 2021/1165 Authorising Certain Products and Substances for Use in Organic Production and Establishing Their Lists. In Official Journal of the European Union; Implementing Regulation EU 2023/121; European Union: Brussels, Belgium, 2023. [Google Scholar]
  37. Fattah, K.P.; Sinno, S.; Atabay, S.; Khan, Z.; Al-Dawood, Z.; Yasser, A.K.; Temam, R. Impact of Magnesium Sources for Phosphate Recovery and/or Removal from Waste. Energies 2022, 15, 4585. [Google Scholar] [CrossRef]
  38. Parkhurst, D.L.; Appelo, T. User’s Guide to PHREEQC Version 3: A Computer Program for Speciation, Batch-Reaction, One-Dimensional Transport, and Inverse Geochemical Calculations; US Geological Survey: Baltimore, MD, USA, 1999. [Google Scholar]
  39. Battistoni, P.; Pavan, P.; Prisciandaro, M.; Cecchi, F. Struvite crystallization: A feasible and reliable way to fix phosphorus in anaerobic supernatants. Water Res. 2000, 34, 3033–3041. [Google Scholar] [CrossRef]
  40. Celen, I.; Türker, M. Recovery of ammonia as struvite from anaerobic digester effluents. Environ. Technol. 2001, 22, 1263–1272. [Google Scholar] [CrossRef] [PubMed]
  41. Marchi, A.; Geerts, S.; Weemaes, M.; Schiettecatte, W.; Vanhoof, C. Full-scale phosphorus recovery from digested waste water sludge in Belgium—Part I: Technical achievements and challenges. Water Sci. Technol. 2015, 71, 487–494. [Google Scholar] [CrossRef] [PubMed]
  42. Ye, X.; Ye, Z.-L.; Lou, Y.; Pan, S.; Wang, X.; Wang, M.K.; Chen, S. A comprehensive understanding of saturation index and upflow velocity in a pilot-scale fluidized bed reactor for struvite recovery from swine wastewater. Powder Technol. 2016, 295, 16–26. [Google Scholar] [CrossRef]
  43. Bhuiyan, M.I.H.; Mavinic, D.S.; Koch, F.A. Phosphorus recovery from wastewater through struvite formation in fluidized bed reactors: A sustainable approach. Water Sci. Technol. 2008, 57, 175–181. [Google Scholar] [CrossRef]
  44. González-Morales, C.; Fernández, B.; Molina, F.J.; Naranjo-Fernández, D.; Matamoros-Veloza, A.; Camargo-Valero, M.A. Influence of pH and Temperature on Struvite Purity and Recovery from Anaerobic Digestate. Sustainability 2021, 13, 10730. [Google Scholar] [CrossRef]
  45. Eko, A.; Ang, H.M.; Sen, T. Effect of initial solution pH on solubility and morphology of struvite crystals. In Proceedings of the Chemeca 2011 Conference, Sydney, Australia, 18–21 September 2011; pp. 18–21. [Google Scholar]
  46. Mehta, C.M.; Batstone, D.J. Nucleation and growth kinetics of struvite crystallization. Water Res. 2013, 47, 2890–2900. [Google Scholar] [CrossRef]
  47. Kabdaşlı, I.; Siciliano, A.; Limonti, C.; Tünay, O. Is K-Struvite Precipitation a Plausible Nutrient Recovery Method from Potassium-Containing Wastes?—A Review. Sustainability 2022, 14, 11680. [Google Scholar] [CrossRef]
  48. Hoagland, D.R. Optimum nutrient solutions for plants. Science 1920, 52, 562–564. [Google Scholar] [CrossRef] [PubMed]
  49. Shaddel, S.; Ucar, S.; Andreassen, J.-P.; Østerhus, S.W. Engineering of struvite crystals by regulating supersaturation—Correlation with phosphorus recovery, crystal morphology and process efficiency. J. Environ. Chem. Eng. 2019, 7, 102918. [Google Scholar] [CrossRef]
Figure 1. PO4-P concentration within anaerobic digestion filtrate and centrate from two different WWTPs in northern Germany (own data): WWTP 1a: number of samples = 84; average pH = 8.2; WWTP 1b: number of samples = 122; average pH = 8.0; WWTP 2: number of samples = 58; average pH = 6.7.
Resources 14 00056 g001
Figure 2. Dissolved PO4-P concentrations over time for different initial ion concentrations, pH values and temperature ranges: (a) = 353 mg P/L at 5 °C; (b) = 353 mg P/L at 33 °C; (c) = 165 mg P/L at 5 °C; (d) = 165 mg P/L at 33 °C; (e) = 68 mg P/L at 5 °C; (f) = 68 mg P/L at 33 °C.
Resources 14 00056 g002
Figure 3. Contour plot of the results of the experiments at 5 °C after 180 min.
Resources 14 00056 g003
Figure 4. (a) Equilibrium concentration after 180 min for different initial PO4-P concentrations and pH levels at 5 °C with resulting SI. (b) Reduction of PO4-P over time for different initial PO4-P concentrations at a pH of 8.0 and 33 °C and the corresponding percentage removal.
Resources 14 00056 g004
Figure 5. PO4-P reduction efficiency for different SI values resulting from different initial conditions.
Resources 14 00056 g005
Figure 6. Contour plot for the effect of SI on PO4-P reduction over the time for different initial PO4-P concentrations at 5 °C (a) and 33 °C (b).
Resources 14 00056 g006
Figure 7. Resulting SI from different PO4-P concentrations and pH values at fixed NH4-N concentration and Mg:P ratio with highlighted operational range for struvite precipitation plants.
Resources 14 00056 g007
Figure 8. Calcium reduction in mmol/L at the end of the experiment for each experiment.
Resources 14 00056 g008
Figure 9. PSD ×50 of the recovered crystals and selected microscopic images for 5 °C (a) and 33 °C (b).
Resources 14 00056 g009
Table 1. Initial composition of the most relevant elements in the matrixes investigated.
ABC
PO4-Pmg/L35316568
NH4-N1042542320
Mg8.58.07.6
Ca354671
Na11910870.5
K398222102
Table 2. Overview of experimental design, initial conditions and results after 180 min.
Set#PO4-P
[mg/L]
NH4-N
[mg/L]
T.
[°C]
pH
[-]
A1353102457.0
A2353102457.5
A3353102458.0
A4353102458.5
A53531024337.0
A63531024337.5
A73531024338.0
A83531024338.5
B916554257.0
B1016554257.5
B1116554258.0
B1216554258.5
B13165542337.0
B14165542337.5
B15165542338.0
B16165542338.5
C176832057.0
C186832057.5
C196832058.0
C206832058.5
C2168320337.0
C2268320337.5
C2368320338.0
C2468320338.5
Table 3. PSD measurement results for the recovered crystals presented as EPQM, where ×10, ×50 and ×90 indicate the particle size for which 10%, 50% and 90% of the quantity is smaller, respectively.
Set#PO4-P
[mg/L]
NH4-N
[mg/L]
T
[°C]
pH
[-]
X10
[µm]
X50
[µm]
X90
[µm]
A135310245720.7943.163.15
A2353102457.519.4836.7856.80
A33531024588.9816.1328.67
A4353102458.525.2538.256.27
A5353102433728.4371.08103.25
A63531024337.541.6171.79104.68
A7353102433830.6451.9278.7
A83531024338.522.4138.1158.52
B9163542579.0524.3541.6
B1016354257.512.6728.0644.5
B11163542587.112.2620.66
B1216354258.56.489.8715.41
B1316354233724.5147.3182.61
B14163542337.522.8337.956.92
B1516354233813.0525.6141.38
B16163542338.514.524.2938.15
C176832057---
C186832057.5---
C1968320587.4413.3521.58
C206832058.58.531320.41
C2168320337---
C2268320337.5421.0499.88
C236832033839.8675.15120.64
C2468320338.555.6592.83134.43
Disclaimer/Publisher’s Note: The statements, opinions and data contained in all publications are solely those of the individual author(s) and contributor(s) and not of MDPI and/or the editor(s). MDPI and/or the editor(s) disclaim responsibility for any injury to people or property resulting from any ideas, methods, instructions or products referred to in the content.

