Article

Assessing Lead Waste and Secondary Resources in Major Consumer Nations: A Vanishing Resource or a Toxic Legacy?

1
Ritsumeikan Global Innovation Research Organization, 1-1-1 Nojihigashi, Kusatsu City 525-8577, Japan
2
Department of Civil and Environmental Engineering, Ritsumeikan University, 1-1-1 Nojihigashi, Kusatsu City 525-8577, Japan
*
Author to whom correspondence should be addressed.
Resources 2025, 14(4), 52; https://doi.org/10.3390/resources14040052
Submission received: 9 February 2025 / Revised: 14 March 2025 / Accepted: 20 March 2025 / Published: 24 March 2025

Abstract

:
This study applies a dynamic material flow analysis to track lead flows, in-use stocks, secondary reserves, and recycling trends across eleven major economies from 1950 to 2018. The results show the global lead cycle has shifted from a variety of industrial applications to a predominant reliance on lead–acid batteries. By 2018, China had become the dominant actor, accounting for 82% of global lead extraction and holding 47% of total in-use stocks (58.3 Mt). Despite regulatory efforts to phase out dissipative uses, the global domestic processed output in 2018 reached 1429 kt, surpassing 1976 levels (1148 kt). At the same time, end-of-life lead waste increased to 7717 kt, yet only 48% was successfully recovered, exposing inefficiencies in current recycling and circular economy initiatives. Secondary reserves also varied widely, with China (18.5 Mt) and the US (9.9 Mt) leading in absolute terms, while Europe maintained the highest per capita reserves. The growing competition from lithium-ion batteries raises questions about the long-term role of lead in industry. If demand declines, the accumulation of unmanaged legacy stocks could become a significant environmental challenge. To address these issues, improvements in recycling systems, stricter waste management policies, and the development of sustainable alternatives are needed.

1. Introduction

Metals are fundamental to modern economies, driving infrastructure, technology, and energy systems. Over the past seventy years, global consumption of key industrial metals such as aluminum, copper, lead, and zinc has surged 1.5–3-fold, largely driven by population growth, urbanization, and increasing mobility [1,2,3]. However, the sustainability of this demand is uncertain due to resource availability constraints, environmental concerns, and geopolitical risks that increasingly shape material supply chains [4].
Lead (Pb) presents a particularly complex case. Unlike metals classified as critical due to supply risks, lead has historically been considered abundant [5,6]. However, recent assessments have re-evaluated its criticality, ranking it higher than zinc, copper, and lithium due to its role in low-carbon technologies and severe environmental impacts [7,8]. Despite its well-documented toxicity, global lead demand has increased 6.5-fold, from 1873 kt in 1950 to 12,191 kt in 2018 [9]. This paradox—where a hazardous material remains economically essential—stems from lead’s unique properties, including corrosion resistance, malleability, and recyclability [10]. Lead–acid batteries, which account for over 85% of lead consumption, remain indispensable in automobiles, backup power systems, and renewable energy storage applications [11].
However, lead’s legacy extends beyond its economic utility. Lead exposure is linked to severe health consequences, particularly in children, impairing cognitive development and causing irreversible neurological damage [12]. Exposure pathways include inhalation during smelting and recycling, ingestion through contaminated food and water, and residual exposure from leaded gasoline and paint. In 2019, 900,000 deaths and 21.7 million years of healthy life lost were attributed to lead exposure, with developing countries experiencing the greatest burden [13]. Regulatory actions, including the phase-out of leaded gasoline (1972), bans on lead in paints (1971) and toys (1973), and restrictions on lead in drinking water (1974), have significantly reduced lead inputs into economies [14]. However, these measures do not address the vast historical stock of lead embedded in infrastructure and products, which continues to shape present and future waste flows.
As lead-containing products reach end-of-life, their secondary resource potential becomes critical for sustainable waste management and circular economy strategies [15]. While several studies have assessed lead stocks and flows in regions such as Europe [16], Japan [17], the Netherlands [18], China [19,20,21], and the United States [22], they often focus on specific periods, product categories, or national economies. Notably, they do not explore the concept of secondary reserve, which quantifies the share of in-use stock that can be recovered and reintegrated into the economy.
Since its introduction by Hashimoto et al. [23], the classification of secondary resources has been applied to materials such as copper [24,25,26], aluminum [27], and zinc [28]. This study extends its application to lead, bridging the gap between historical lead accumulation in society and the environment and its future recovery potential. Rather than analyzing lead production trends, we focus explicitly on lead consumption dynamics and secondary resource potential by selecting eleven major economies that collectively accounted for over 70% of global refined lead consumption between 1950 and 2018. We then developed a comprehensive material flow model for these selected economies, integrating economy-wide material flow analysis (EW-MFA) indicators with a refined classification framework. Our approach quantifies the lead secondary reserve while assessing its quality and accessibility, providing insights into how nations can fulfill future demand while managing the risks of lead waste accumulation.

2. Materials and Methods

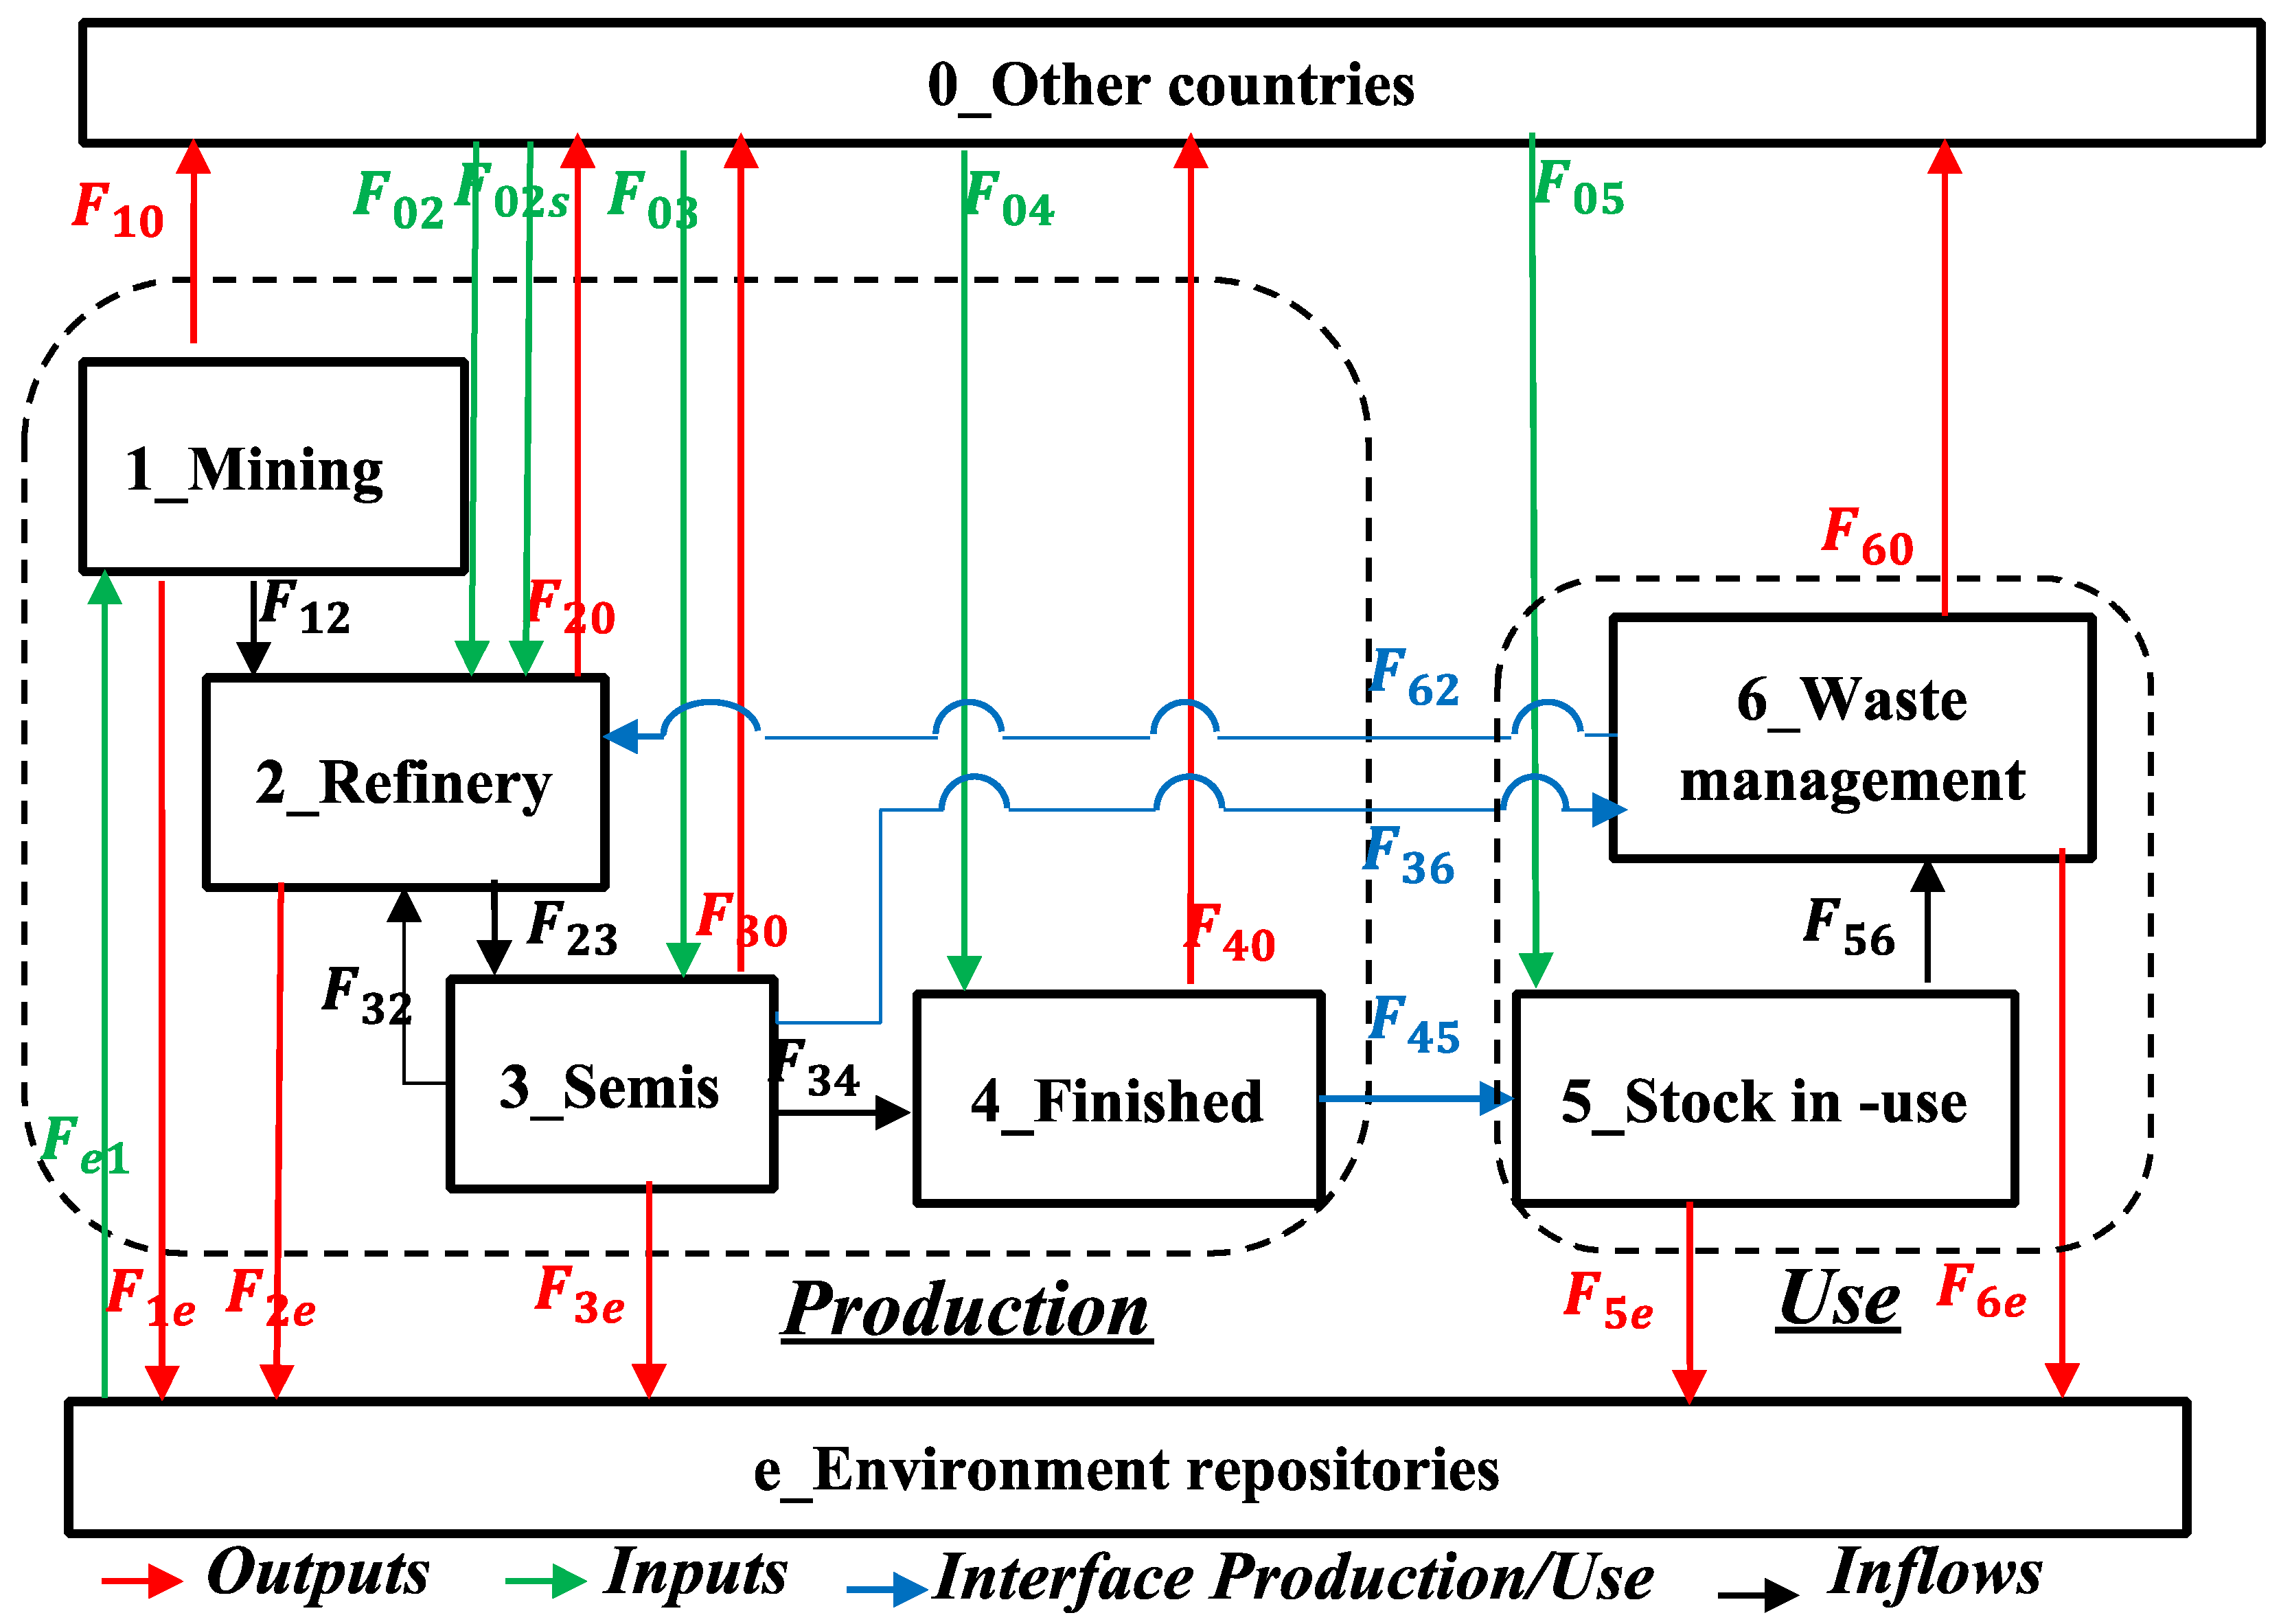
2.1. Lead Life Cycle and Material Flow Analysis (MFA) Indicators

The material flow of lead is structured into six key processes commonly used in metal MFA studies [21,27]: mining, refining, semi-production, finished product production, in-use stock, and waste management (Figure 1). Each process interacts with trade and environmental flows, shaping the overall lead lifecycle as described by flows ( F i j ) in Figure 1. The details of the calculation of flows F i j are presented in Appendix A.
Due to variations in fabrication efficiency and in-use retention time, lead applications were categorized into seven sectors in this study: transportation (Tr), construction (Co), chemicals (Ch), alloys (Al), miscellaneous (Mi), ammunition (Am), and gasoline (Ga). Each category j is characterized by its market share (mj), fabrication efficiency (fj), dissipation ratio (dj), and lifetime parameters as detailed in Section 2.4.3.
Furthermore, Economy-Wide Material Flow Analysis (EW-MFA) indicators, as recommended by the United Nations Environmental Program [29], were employed to quantify these flows comprehensively (see Table 1). While EW-MFA indicators traditionally assess the societal system as a whole, this study introduces a more granular approach by dividing the analysis into two subsystems: the production system (P) and the use system (U). Based on this framework, we derived five key indicators to evaluate lead flow dynamics.
1.
Share of domestically sourced input: Measures the ability of the production system to rely on domestic sources.
r I P , i D o m = F 62 , i + D E i I P , i = D E i I P , i 1 + F 62 D E i = r I P , i D E i 1 + r D E i 62
2.
Share of production output with economic value: Measures the efficiency of the production system.
r O P , i e c o = F 45 , i + E P , i O P , i = F 45 , i O P , i 1 + E P , i F 45 , i = r O P , i 45 1 + r 45 , i E P
3.
Dependence on imports for in-use stock input: Measures how much of the in-use stock depends on imported lead.
r I 5 , i d o m = r I P , i D o m F 45 , i I 5 , i = r I P , i D o m r I 5 , i 45
4.
Ratio of recycled end-of-life scrap to in-use stock input: Indicates the fraction of final demand that can be met by secondary materials.
r I 5 , i 62 = F 62 , i I 5 , i
5.
Recycling rate (RR): The fraction of end-of-life scrap recovered instead of being landfilled.
r 56 , i R R = F 62 , i + F 60 , i F 56 , i = F 62 , i F 56 , i 1 + F 60 , i F 62 , i = r 56 , i 62 1 + r 62 , i 60

2.2. In-Use Stock and Generated Scrap

The in-use stock at time i+N results from final demand inputs (I5), reduced by dissipated flows (F5e) and end-of-life scrap (F56). For an input to in-use stock in year i for end use category j, denoted I 5 j , i , the general mass balance equation is given by the following:
S i + N + 1 I 5 j , i = S i + N I 5 j , i D i + N I 5 j , i W i + N I 5 j , i
  • S i + N + 1 I 5 j , i is the stock at the beginning of year i + N issued from the final demand of year i for end use category j.
  • D i + N I 5 j , i is the dissipated amount during year i + N
  • W i + N I 5 j , i is the generated waste during year i + N.
Dissipation follows a direct fraction of in-use stock
D i + N I 5 j , i = d j S i + N I 5 j , i
where dj is the dissipation ratio for each end-use category j.
The waste flow depends on the lifetime distribution function, leading to the following:
W i + N I 5 j , i = λ i + N j , i 1 d j S i + N I 5 j , i
This allows for the direct expression of in-use stock variation:
S i + N + 1 I 5 j , i = 1 λ i + N j , i 1 d j S i + N I 5 j , i
The parameter λ i + N j , i depends on the lifetime function considered in the study. We define g(t) as the cumulative distribution function (CDF), where t = N i is the time elapsed since input into the stock. By definition, g(t) is a decreasing function between 0 and 1, with g(0) = 1. The probability of waste generation is then as follows:
1 λ i + N j , i = 1 g N 1 g N g N 1 = g N g N 1
Thus, the cumulative probability over time is as follows:
k = 1 i + N 1 λ i + N k + 1 j , i = k = 1 N g N k + 1 g N k = g N g 0 = g N
Given the initial conditions:
S i + 1 I 5 j , i = I 5 j , i   ; S i I 5 j , i = 0 ;   D i I 5 j , i = 0 ;   W i I 5 j , i = 0
We derive the following formulations:
S i + N + 1 I 5 j , i = g N 1 d j N I 5 j , i
D i + N + 1 I 5 j , i = d j g N 1 d j N I 5 j , i
W i + N + 1 I 5 j , i = g N g N + 1 1 d j N + 1 I 5 j , i
The cumulative function used in this study is the Weibull function, defined as follows:
g N = e N β α
where parameters α and β are related to the time when 50% (t50) and 90% (t90) of the input has left the stock (See Table 2):
1 2 = e t 50 β α ln 2 = t 50 β α ;   1 10 = e t 50 β α ln 10 = t 90 β α
α = l n ln 10 ln 2 l n t 90 t 50 ; β = t 50 l n ( 2 ) 1 / α
The total stock at year N is obtained by summing across all input years and end-use categories:
S N = j = 1 5 i = 1950 N S N I 5 j , i = j = 1 5 k = 0 N 1950 S N k + k I 5 j , N k

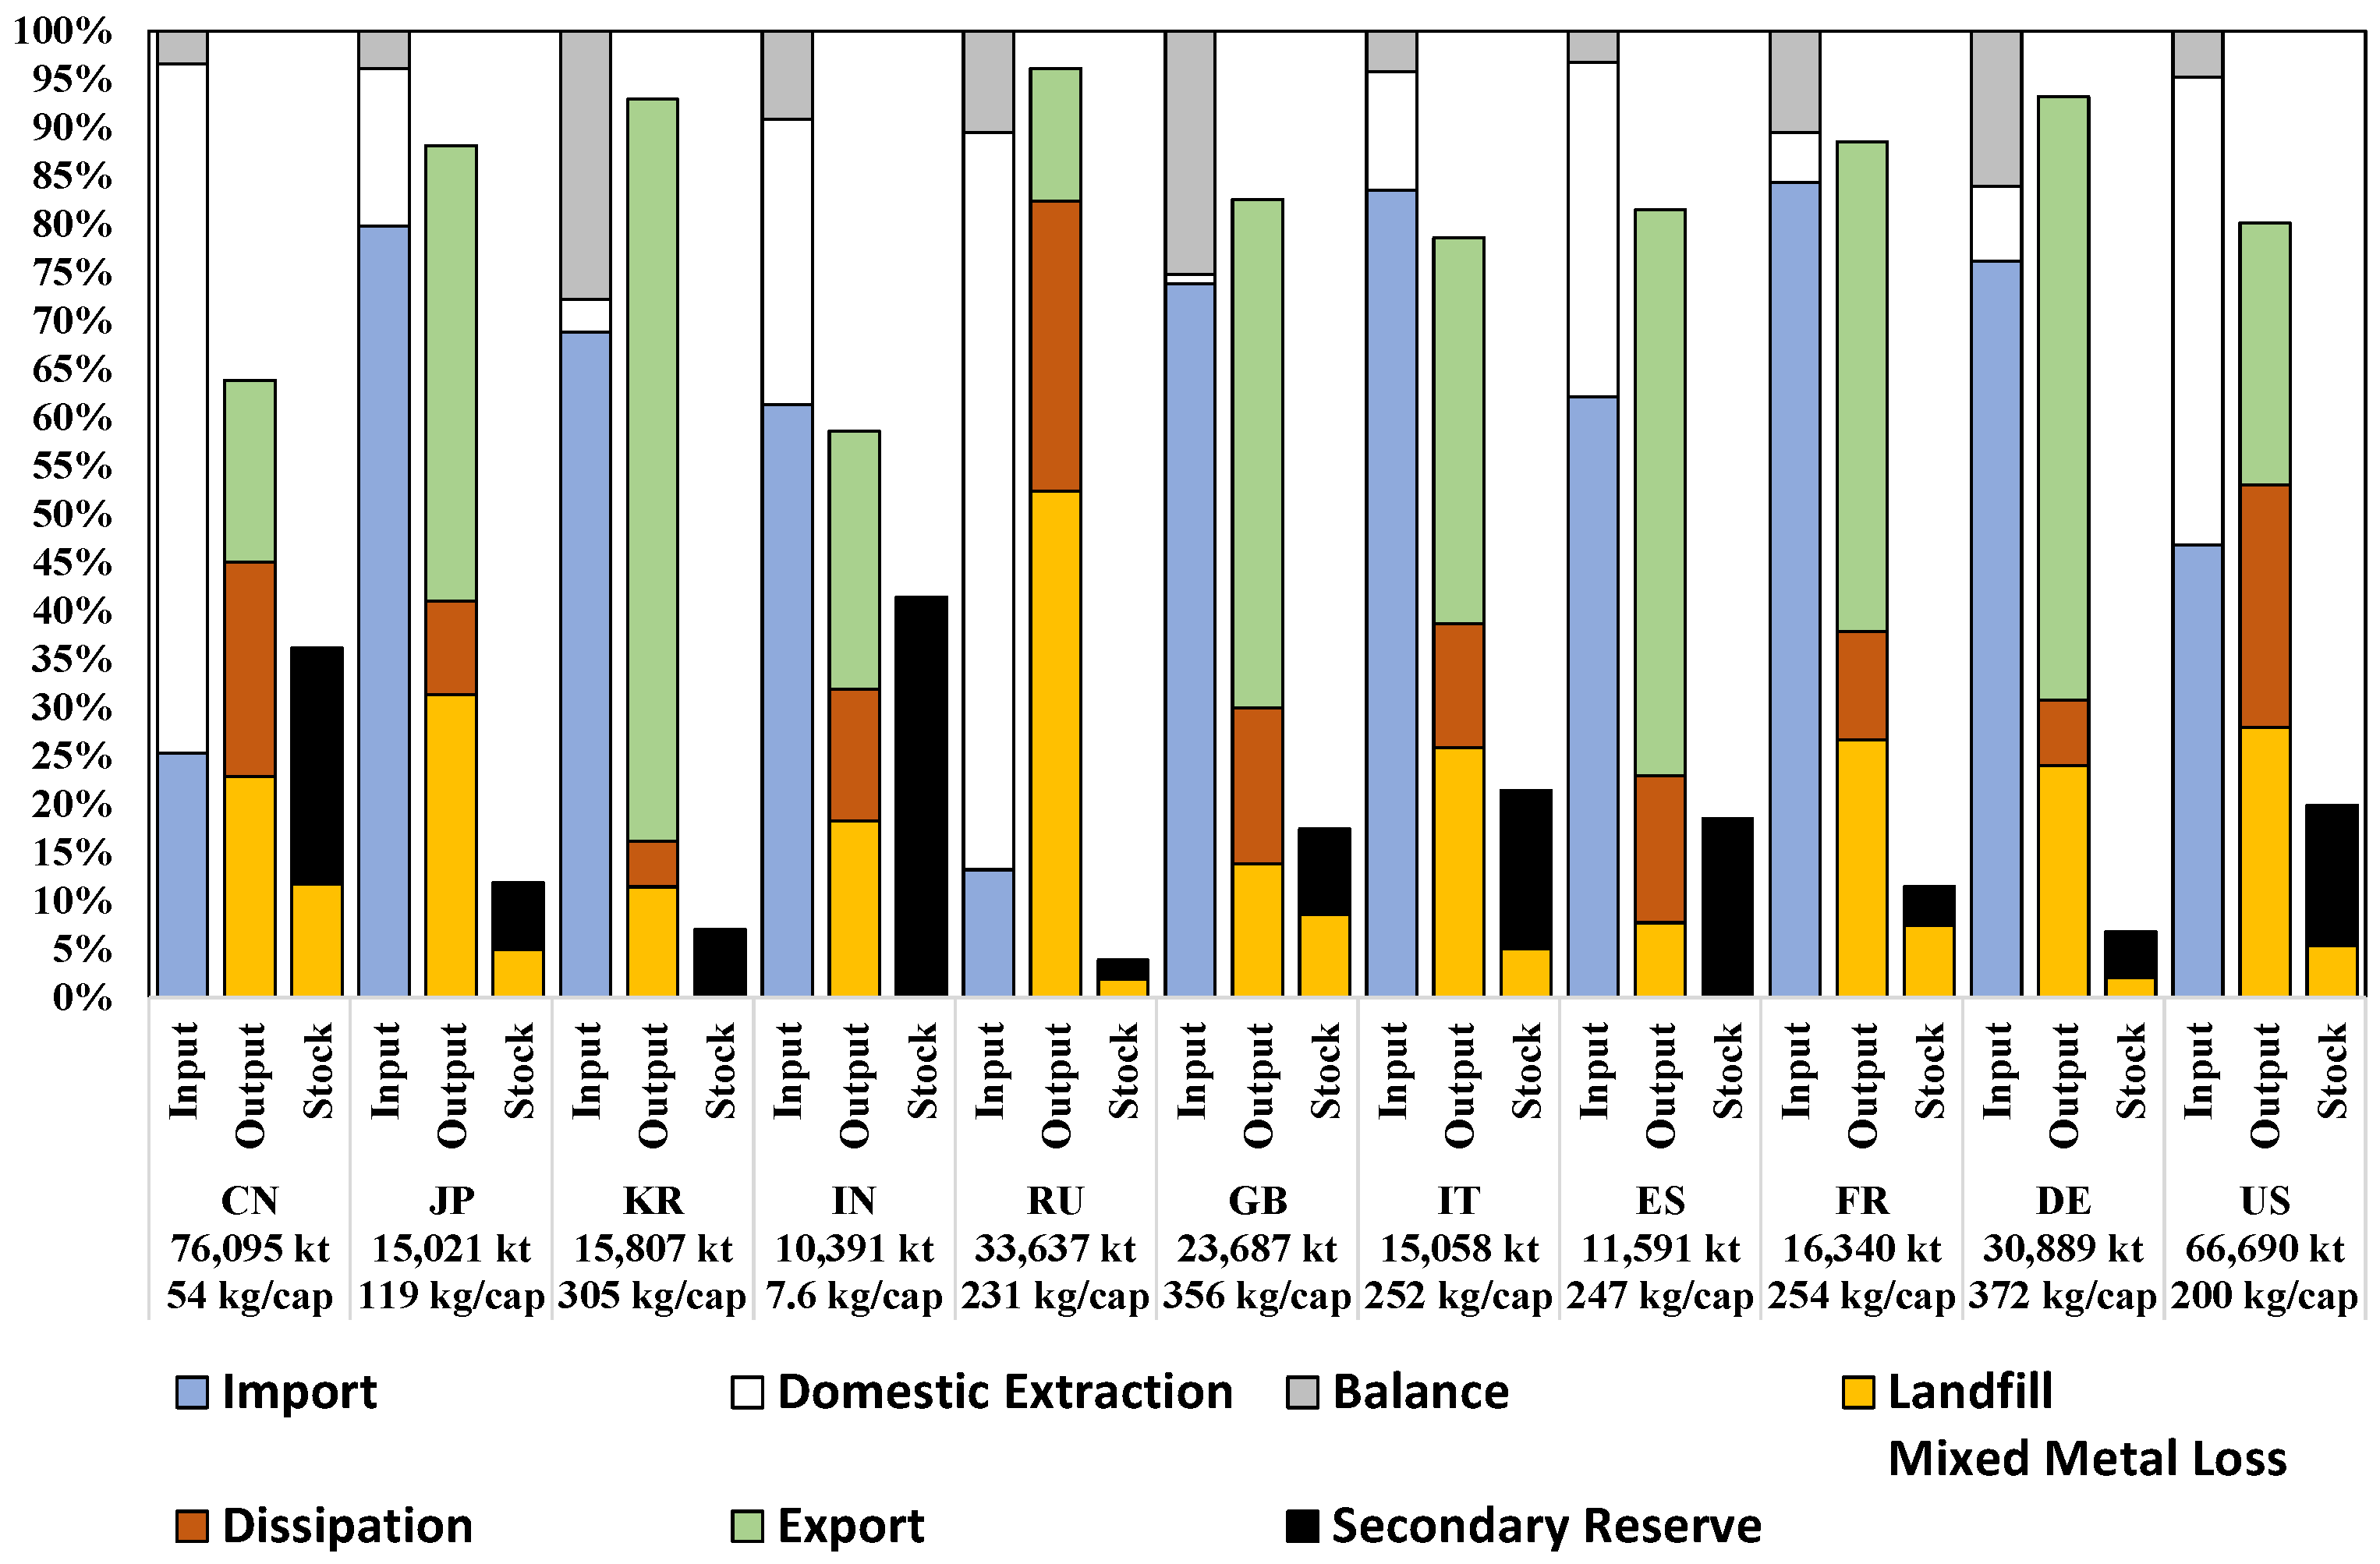
2.3. The Secondary Reserve Classification Framework

The secondary resource framework provides a classification system that offers a snapshot of the cumulated metal inputs to society [23,24,25]. This framework divides the cumulated input into three primary categories: Stock, the lead retained within the economy; Landfill (L), the lead discarded into waste streams, ending in landfills; and Dissipated Amount (D), the lead that is lost to the environment.
The profitability and feasibility of metal recovery further refine this classification by distinguishing between recoverable and non-recoverable fractions.
  • Economic Reserve (Eco): The portion of the stock recoverable under current economic conditions.
  • Marginal Economic Reserve (MEco): The portion that may be recoverable under favorable economic conditions.
  • Sub-economic Resource includes the following:
    Landfill (L): Lead waste in landfills.
    Mixed Metal Loss (ML): Lead that has been incorporated into other metal cycles and is not available for direct recovery.
    Dissipation (D): Lead lost through emissions, corrosion, or wear.
The classification in this study (Table 3) extends Hashimoto et al.’s [23] framework, which initially focused on in-use stock, to include society (S), production (P), and use (U) subsystems.

2.3.1. Cumulated Input

The input to the production system (P) includes cumulated recycled lead flow (4), cumulated imported lead (5) and cumulated domestic extraction (6).
4 = i = 1950 N F 62 , i ; 5 = i = 1950 N M P , i ; 6 = i = 1950 N D E i
The balance (26) corresponds to the cumulated difference between inputs and outputs in the production system (mining, refinery, semi-finished, and finished process).
The input to the use system (U) is divided between inputs to in-use stock (2) and (13) and inputs to the waste management system (7) and (8). In this sense, 2 corresponds to cumulated domestically produced finished consumption, whereas 13 accounts for the cumulated direct import of finished products (13).
As explained in Appendix A, F36 corresponds to the share of lead loss during semi-finished production processes that ends in the waste management system. In this paper, we assumed, following [30,31], that 30% of lead scrap leaves the lead cycle as mixed metal loss and 70% ends in landfills. These ratios were used to calculate cumulated inputs to the waste management system (7) and (8).
2 = i = 1950 N F 45 , i ; 13 = i = 1950 N M U , i
7 = 0.7 i = 1950 N F 36 , i ; 8 = 0.3 i = 1950 N F 36 , i
The balance (25) corresponds to the cumulated difference between inputs and outputs in the waste management system.

2.3.2. Cumulated Output

Due to the connection between production and use system, the cumulated inputs 4, 2, 7 and 8 in column Int of Table 3 appears also as cumulated outputs. The remaining output of the production system (P) is composed of the cumulated exports (3) and the cumulated dissipation flows (9) from mining, refinery, semis and finished product processes.
3 = i = 1950 N E P , i ; 9 = i = 1950 N D P O P , i
The remaining output of the use system (U) are the cumulated exports of end-of-life scrap (12), the in-use dissipation (24), and the cumulated landfill waste (18) and cumulated mixed metal loss (21) related to end-of-life scrap
12 = i = 1950 N E U , i ; 24 = i = 1950 N F 5 e , i
18 = 0.7 i = 1950 N F 6 e , i F 36 , i ; 21 = 0.3 i = 1950 N F 6 e , i F 36 , i

2.3.3. Stock

The stock in the production system (1) represents companies’ stocks that are intended for production in the next year. Any input to the in-use phase will eventually become end-of-life scrap or dissipate into the environment. The yearly dissipation rates (Table 2) accumulate through the years, leading to 0.76% and 1.63% dissipation rates for Chemicals and Alloys, respectively. The stock calculations for each classification are as follows:
10 = S R W i + N + 1 I 5 j , i ;   11 = S R i = N + 2 W i + k I 5 j , i
14 = m a x S R S R W i + N + 1 I 5 j , i ;   15 = m a x S R S R i = N + 2 W i + k I 5 j , i
16 = 0.7 W i + N + 1 I 5 j , i 10 + 14 ;   17 = 0.7 i = N + 2 W i + k I 5 j , i 11 + 15
19 = 0.3 W i + N + 1 I 5 j , i 10 + 14 ;   20 = 0.3 i = N + 2 W i + k I 5 j , i 11 + 15
22 = D i + N + 1 I 5 j , i ;   23 = i = N + 2 D i + k I 5 j , i

2.4. Data Sources and Collection

2.4.1. Country Selection

To ensure broad global coverage of lead stock and waste accumulation trends, this study selected countries that collectively represented at least 70% of the world’s refined lead consumption. The selection process involved analyzing lead consumption trends from the World Bureau of Metal Statistics [9] refined lead consumption database from 1950 to 2018 (see Figure A2). Countries with the highest gross and per capita refined lead consumption were identified, excluding those with populations below one million. To maintain consistency, only countries with historical consumption patterns representative of global trends were included. Details of the selection are presented in Annex B. Based on these criteria, the selected countries include the following:
Europe: France (FR), Germany (DE), United Kingdom (GB), Italy (IT), Spain (ES).
Russia (RU) corresponds to USSR before 1991 and Russian Federation after 1991.
Asia: India (IN), China (CN), South Korea (KR), Japan (JP).
North America: United States (US).

2.4.2. Period Selection

This study covers the period 1950–2018 to ensure consistency in lead production, consumption, and waste management data while avoiding disruptions from recent regulatory and market shifts. In 2019, the European Union initiated the revision of its Battery Directive [33], and China implemented Extended Producer Responsibility (EPR) policies for lead–acid batteries [34], significantly altering recycling flows and reporting methods. Additionally, post-2018 shifts in global lead demand—particularly the increasing competition from lithium-ion batteries in the energy storage sector and trade tensions affecting secondary lead supply—introduced uncertainties in long-term trends [35]. The implications of these regulatory and market changes are further analyzed in the Discussion section.

2.4.3. Data Collection

The analysis relies on multiple authoritative data sources to ensure completeness and reliability. The World Bureau of Metal Statistics [9] provides historical data on mining production, refined production, secondary refined production, and refined lead consumption as well as market share (see Figure A1). UN Comtrade [36] offers detailed statistics on lead imports and exports, facilitating the calculation of the Physical Trade Balance (PTB) and other key trade indicators. Information on lead content in products, and process efficiencies was obtained from various sources in the literature, as detailed in Table A1.

3. Results

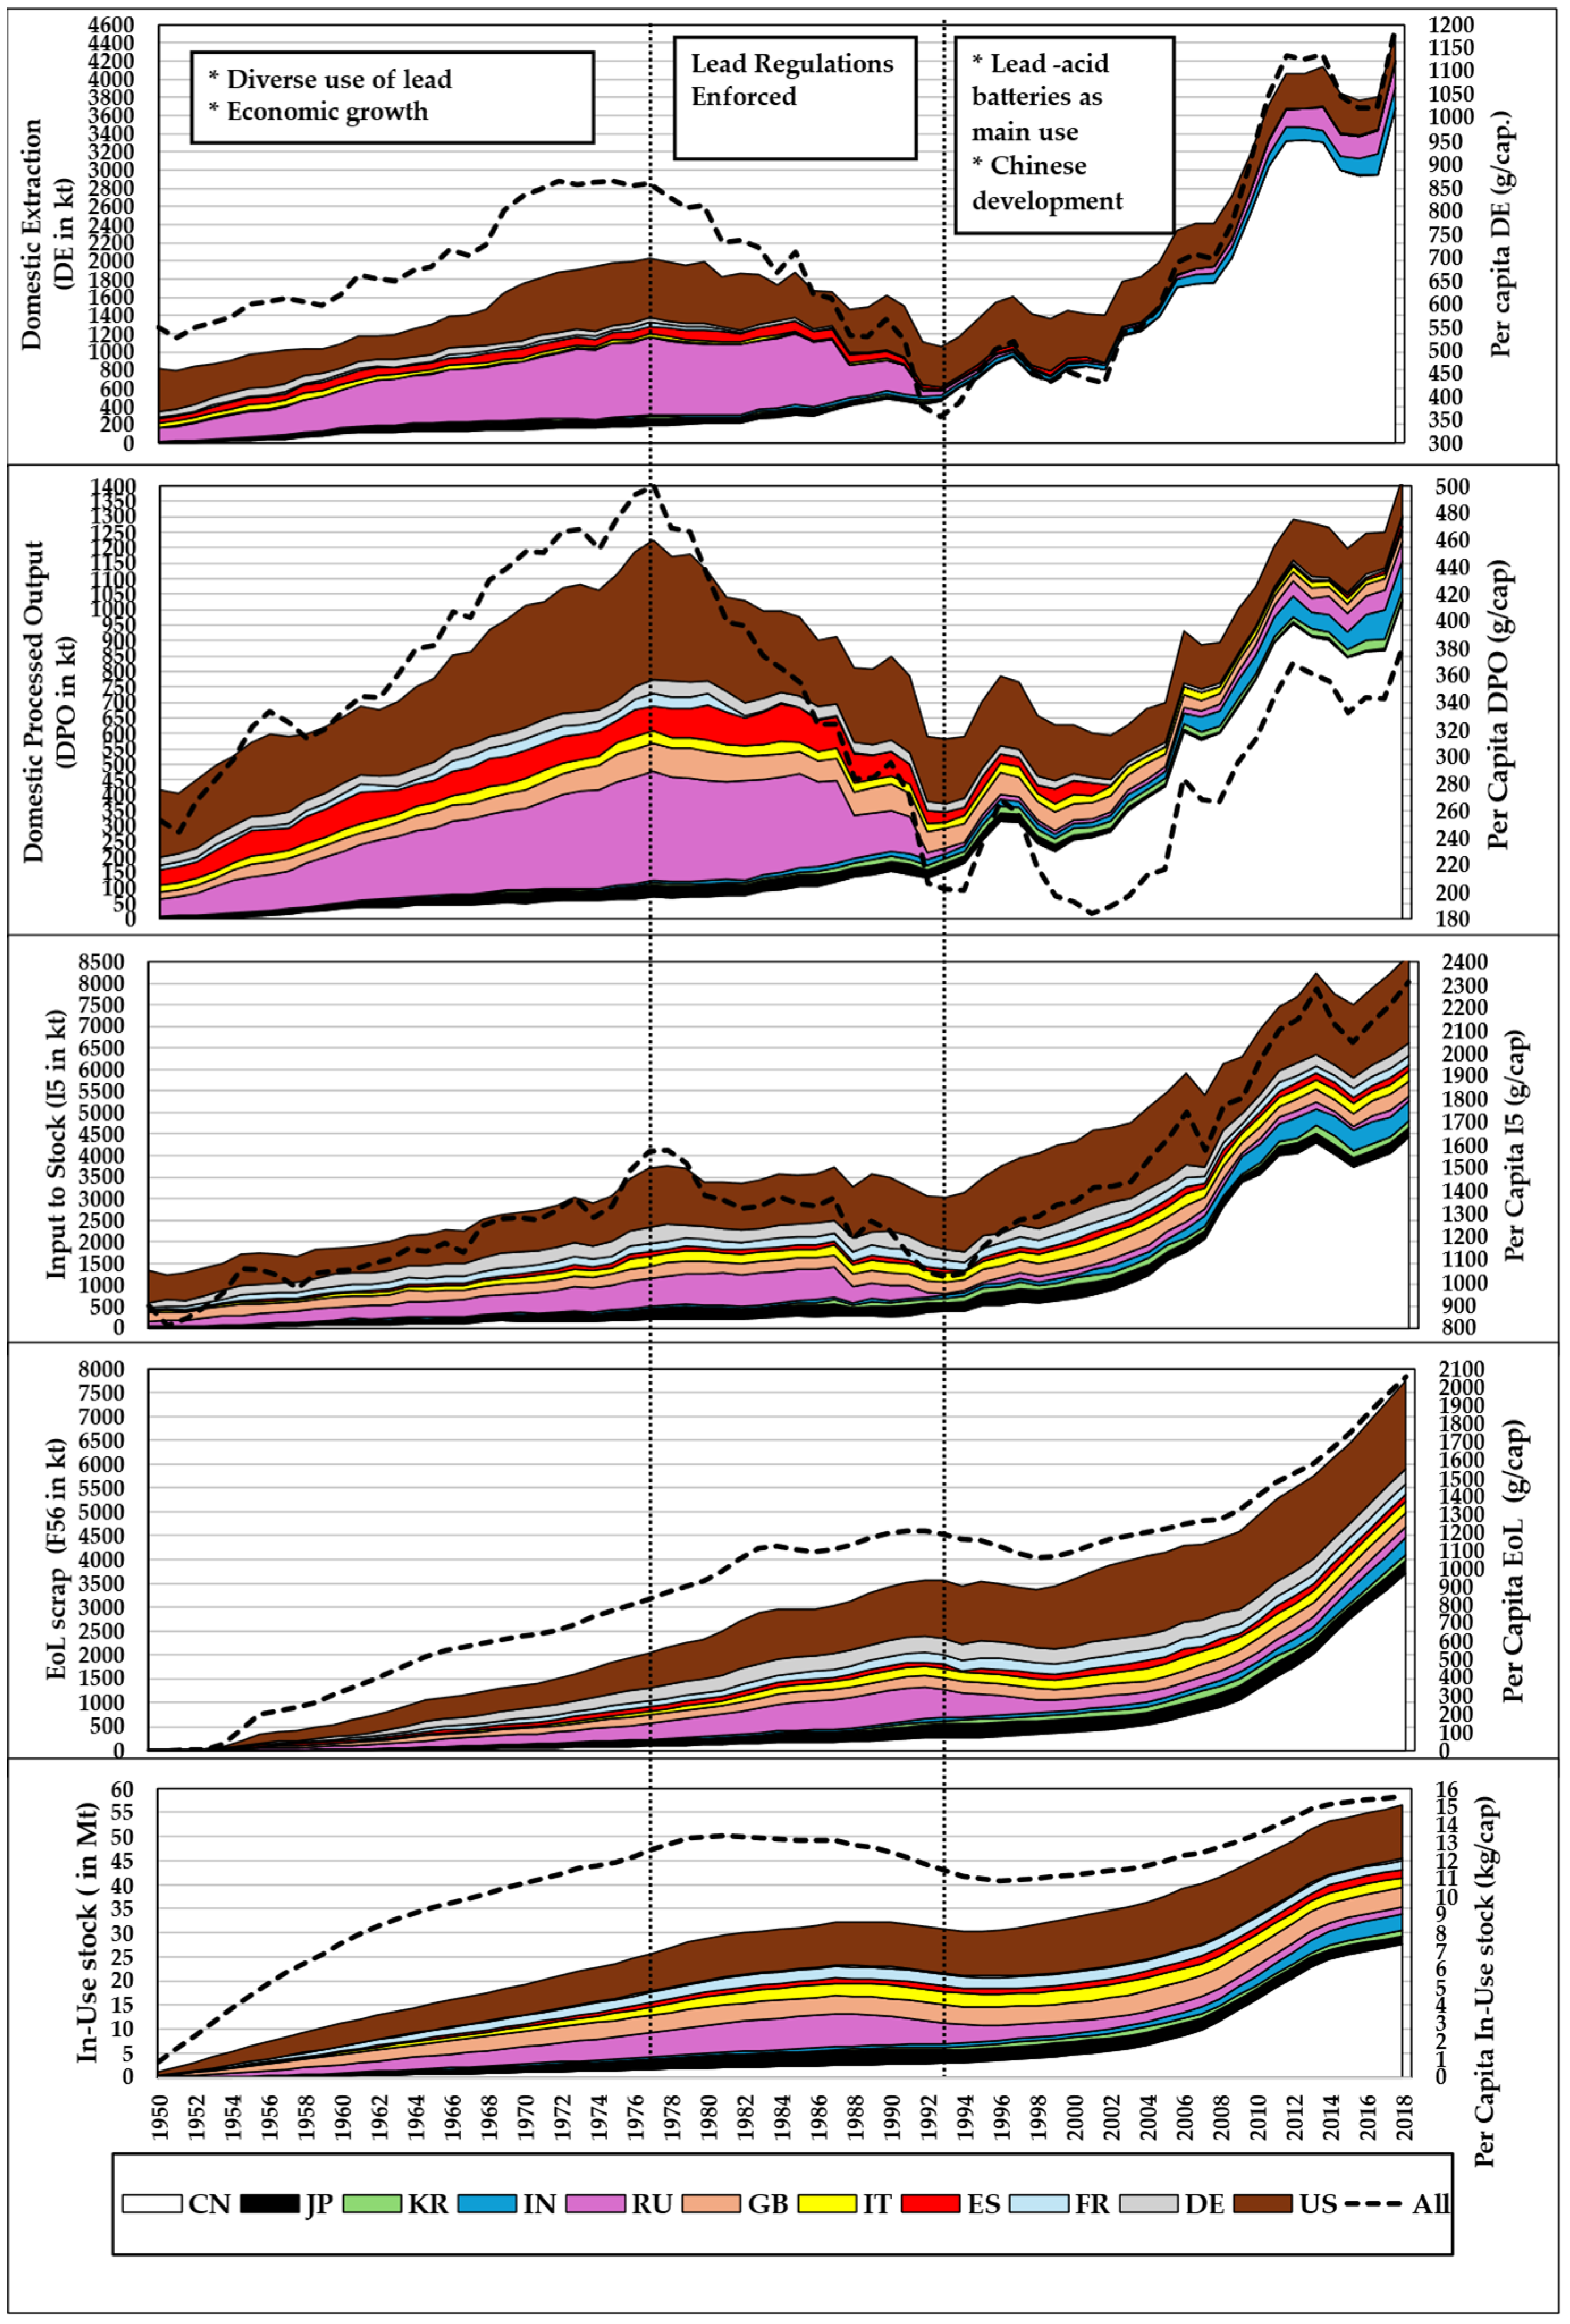
3.1. Evolution of Lead Inputs, Outputs, and Stocks

The historical progression of lead flows from 1950 to 2018 reveals distinct patterns in the sourcing, processing, and accumulation of lead. Over this period, the global lead cycle evolved through three major phases: (i) an era of diversified lead applications and economic expansion (1950–1976), (ii) a transition period marked by regulatory interventions and changing industrial demands (1977–1994), and (iii) a consolidation phase where lead–acid batteries dominated consumption patterns, and global production centers shifted (1995–2018). Each of these phases is characterized by shifts in domestic extraction, domestic processed output (DPO), input to stock, and end-of-life (EOL) scrap generation as presented in Figure 2 and Figure 3 below.

3.1.1. Economic Expansion and Diverse Lead Applications (1950–1976)

Domestic lead extraction expanded significantly from 812 kt (548 g/cap) in 1950 to 1976 kt (854 g/cap) in 1976. Initially, the United States (57%) and Europe (22%) dominated global lead mining, while Russia (18%) and Asia (3%) played marginal roles. However, as European mining activity declined, Russia emerged as the leading extractor by 1958, overtaking the United States. By 1976, Russia accounted for 41% of global lead extraction, followed by the United States (32%), Asia (15%), and Europe (11%).
Domestic processed output (DPO) followed similar trends, increasing from 374 kt (253 g/cap) in 1950 to 1148 kt (493 g/cap) in 1976. In 1950, lead emissions were primarily generated in the United States (58%) and Europe (25%), with Russia (14%) and Asia (3%) playing secondary roles. However, by 1976, emissions were more evenly distributed, with the United States (38%), Russia (30%), Europe (22%), and Asia (11%) contributing significant shares. Per capita processed output in 1976 was highest in Russia (2548 g/cap), followed by the United States (2048 g/cap), Great Britain (1632 g/cap), Spain (991 g/cap), and France (849 g/cap).
Final demand, represented by input to stock, increased from 1328 kt (896 g/cap) in 1950 to 3467 kt (1490 g/cap) in 1976. The US and European shares declined from 56% to 35%, and from 22% to 11%, respectively. Russia’s contribution increased from 18% to 41%, and Asia expanded from 2% to 13%. In absolute terms, per capita input to stock in 1976 was highest in the US (5742 g/cap), followed by Great Britain (4882 g/cap), Russia (4772 g/cap), Italy (4132 g/cap), and Spain (2908 g/cap).
End-of-life scrap generation followed a similar growth trajectory, reaching 1856 kt (798 g/cap) in 1976. Germany exhibited the highest per capita scrap generation (3346 g/cap), followed by the US (3226 g/cap), Great Britain (2884 g/cap), Russia (2317 g/cap), and France (1132 g/cap). The US and Europe collectively accounted for 72% of global EOL scrap, while Russia and Asia accounted for 17% and 11%, respectively.
The global in-use stock expanded from 1216 kt (821 g/cap) in 1950 to 28,477 kt (12,237 g/cap) in 1976. The regional distribution of in-use stocks shifted significantly during this period, with Europe increasing its share from 36% to 43%, while the US share declined from 53% to 26%. Russia’s in-use stock expanded to 17%, and Asia’s share increased to 14%. By 1976, Great Britain had the highest per capita in-use stock (62,011 g/cap), followed by Germany (51,828 g/cap), France (39,667 g/cap), Russia (36,275 g/cap), and the US (35,408 g/cap).

3.1.2. Regulatory Transition and Shifting Industrial Demand (1977–1994)

The period from 1977 to 1994 was characterized by regulatory constraints on lead usage, particularly in gasoline additives and paints, leading to slower growth in lead production and processing. By 1994, global DE had declined to 1165 kt, a significant reduction from the 1976 peak. The share of the US and Europe continued to decline, while China’s contribution surged, accounting for 51% of global DE by 1994. The US remained, however, the main per capita extractor (1656 g/cap), followed by Spain (740 g/cap) and China (496 g/cap).
DPO exhibited a similar decline, dropping to 605 kt in 1994, with China contributing 30% of the total. The per capita values for DPO dropped by 40% in Japan, Great Britain, Italy, France and Germany and up to 65% in Spain and the US, reflecting the impact of lead bans in consumer products. The dissolution of the Soviet Union led to a drop in lead emissions of 97% (78 g/cap). On the other hand, China, India and South Korea doubled their per capita emissions, showing the growing pollution concern in these countries.
Final demand (input to stock) reached 3127 kt (1039 g/cap) in 1994, with notable shifts in regional contributions. The US remained an important contributor (37%), but China’s share increased substantially from 9% to 51%. Europe and Russia only represented 4% and 3% of the total, respectively.
End-of-life scrap generation increased to 3500 kt in 1994, highlighting the delayed impact of lead regulations. Though the Chinese share doubled during the period, the per capita EOL scrap generation rate remained high in historical lead consumer countries (US: 4738 g/cap, Germany: 4629 g/cap, Great Britain: 4094 g/cap, France: 3680 g/cap, Italy 3517 g/cap).
The total in-use stock grew to 33,530 kt (11,144 g/cap) in 1994, with Europe (40%), US (27%) and Russia (12%) maintaining significant shares, while China’s stock accumulation increased to 9%. Per capita stocks remained particularly high in countries with high historical usage, with Great Britain reaching as much as 64,254 g/cap due to the use of lead in the long-lifetime construction sector.

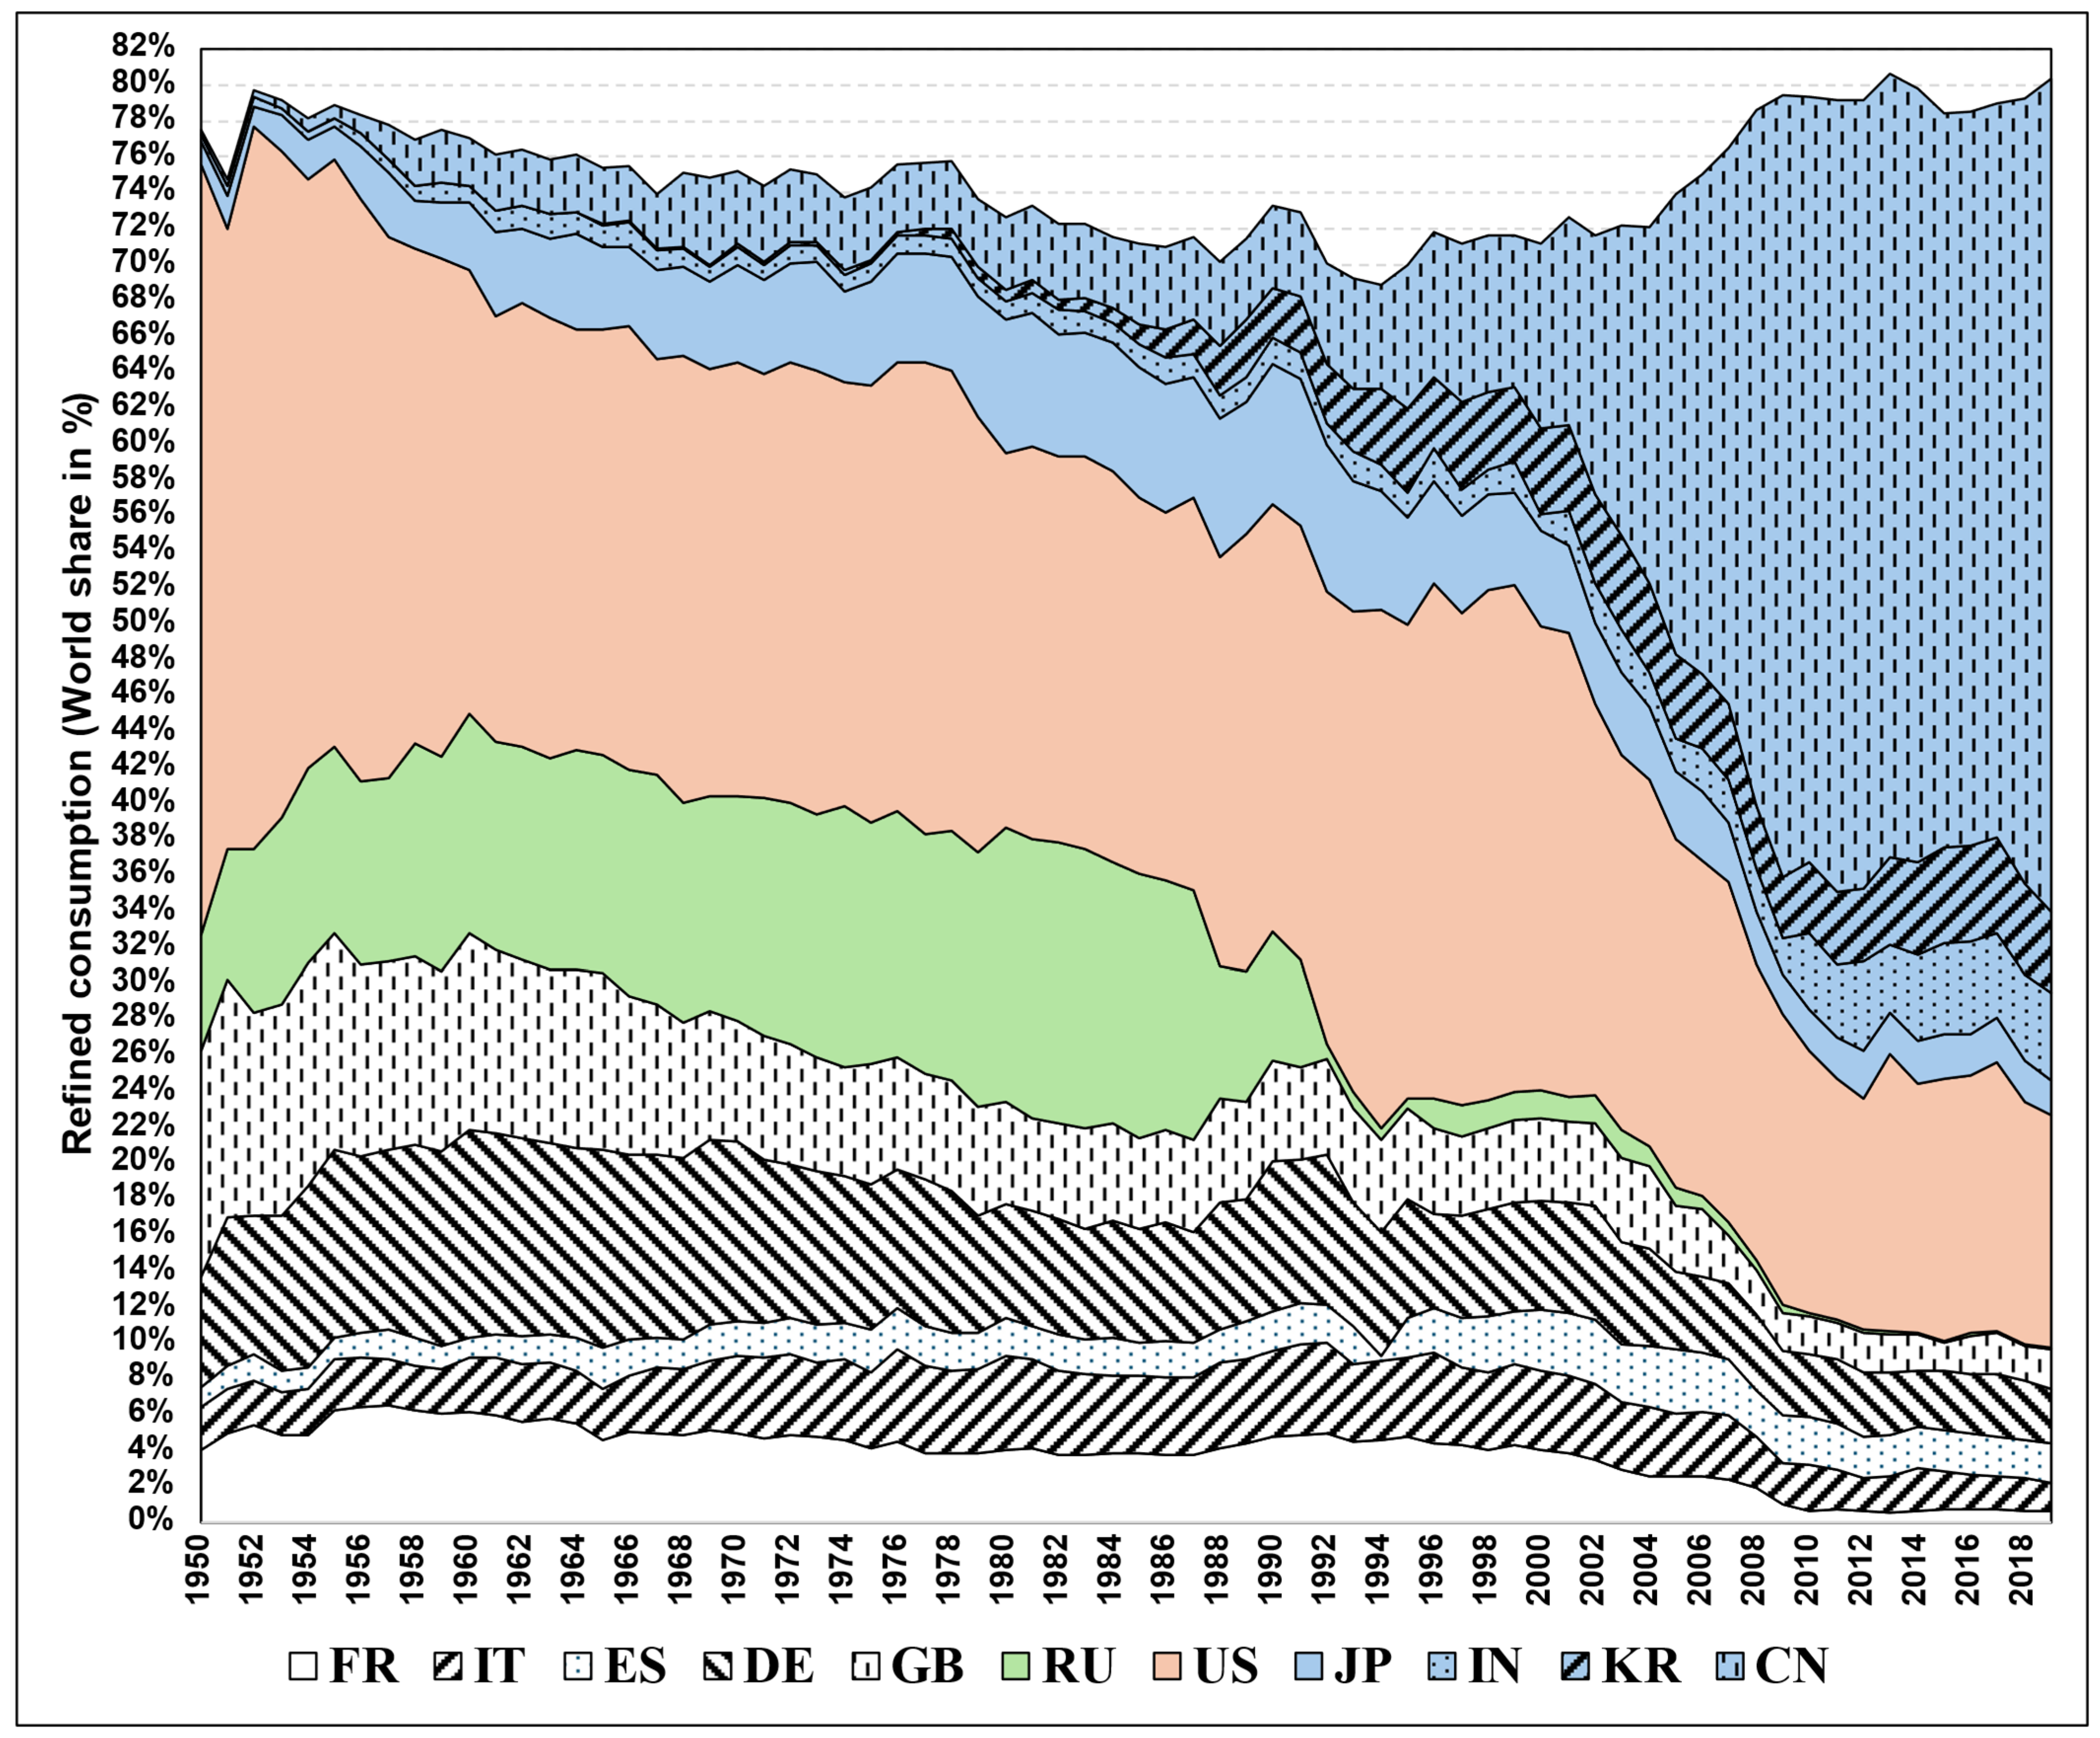
3.1.3. Transportation and Chinese Domination (1995–2018)

By 2018, global DE had reached 4493 kt (1198 g/cap), with China accounting for 82% of global extraction. The share of traditional producers such as the US and Europe dropped to negligible levels, while India and Russia accounted for 5.1% and 5.9%, respectively.
DPO increased to 1429 kt, with China contributing 72%, followed by US (8%) and India (7%). The highest per capita DPO was observed in China (725 g/cap), followed by South Korea (551 g/cap), Great Britain (538 g/cap), Spain (512 g/cap) and Russia (431 g/cap).
Final demand for lead stocks continued to grow, reaching 8664 kt (2310 g/cap) in 2018. China’s dominance was evident, with 82% of global input to stock. India and Russia emerged as 5% and 6% of the total. It is worthy to note that though US and European shares decreased sharply during the period, the input to stock still increased by 50% and 40%, respectively, in absolute terms compared to 1994 levels.
End-of-life scrap generation reached 7717 kt (2057 g/cap) in 2018, with China and the US together accounting for 72% of global EOL scrap. Per capita EOL scrap remained highest in the US (5555 g/cap), followed by Great Britain (4587 g/cap), Italy (3975 g/cap), Germany (3966 g/cap) and France (3194 g/cap).
By 2018, the global in-use stock reached 58,280 kt (15,538 g/cap), with China accounting for nearly half (47%) of the total. The US, while still significant, saw its share drop to 19%, while European nations maintained moderate levels of stock.

3.2. Material Flow Indicators

Figure 4 provides an overview of the material indicators discussed in Section 2.1 of the methodology. As of 2018, nine out of the eleven economies studied rely heavily on lead imports. Russia (57%) and China (74%) primarily utilize domestically extracted ore and secondary scrap as their lead sources. In contrast, Japan (22%), Spain (18%), the United States (16%), Italy (16%), and France (8%) heavily depend on imports of ore and refined lead due to the decrease in mining activities. This reliance on imports is not a recent development; the last time domestic sources of lead exceeded imports was 1993 in Japan, 1991 in Spain, 1983 in Germany and the US, 1982 in France, 1961 in Italy in 1961, and before 1950 in the United Kingdom. India and South Korea exhibit a more balanced situation, with domestic sources representing around 40% and 50% of their lead supply in the past decade.
The predominance of imports can be linked to other input indicators, such as r I 5 d o m and   r I 5 62 . In most countries, imports of finished products (F05) are small compared to domestic flows (F45). Consequently, China, Japan, South Korea, India, Russia, and the United States display similar patterns for r I 5 d o m and r I P d o m . On the other hand, European countries tend to rely more on direct imports, as evidenced by the drop in the domestic share of in-use stock r I 5 , i 45 to 76% in Spain, 80% in France, 83% in Germany, 84% in Italy, and 86% in the United Kingdom by 2018. In Germany, the importance of finished product imports was even more pronounced r I 5 , i 45 : 30 40 % during the period following reunification.
This dependence on imports contrasts with countries’ ability to meet their final demand from recycled scrap. In 2018, Russia and South Korea could fulfill their in-use lead demand entirely from recycled end-of-life scrap, while the United States, Germany, Spain, Italy, India, and Japan could meet two-thirds of their demand from recycling. France, China, and the United Kingdom, on the other hand, could only satisfy one-third of their demand through recycling. These differences stem from variations in the components of the r I 5 62 indicator components: recycled end-of-life scrap (F62) and demand (I5). From 2001 to 2018, the amount of recycled end-of-life scrap reintroduced into the economy remained relatively constant across all countries, except for India, China, Russia, and South Korea, where a significant increase was observed. During the same period, Russia’s demand remained constant, except for notable drops in 2009, 2015, and 2018 due to economic crises. Therefore, Russia’s high capacity to fulfill its demand from scrap in 2018 was a temporary situation, with its recycled scrap-to-demand ratio averaging closer to 50% in recent years. In contrast, South Korea experienced a significant increase in in-use demand until 2008, which has since stabilized. Meanwhile, the amount of recycled end-of-life scrap continued to rise after 2008, driven by the development of the battery market and associated transportation sector. In China, recycled end-of-life scrap (F62) and demand (I5) followed similar trends, resulting in low variations in the r I 5 62 indicator around the 2001–2018 period average of 32%. In India, the presence of recycled end-of-life scrap (F62) was almost negligible before 2007. However, with the development of the automotive industry and the implementation of regulations for managing and handling batteries [13], the recycling of lead has increased.
The recycling rate r 56 , i R R depends on the nature of the waste generated (F56) and the ability of the waste management system to recycle the generated waste (F62). Batteries have a high recyclability, and therefore the higher the share of generated waste associated with transportation, the higher the recycling rate indicator r 56 , i R R . On average, from 2008 to 2018, the share of waste derived from the transportation sector (F56) was 89% in China, 81% in the United States, 78% in South Korea, 77% in India, 67% in Italy, 63% in France, 58% in Japan, 56% in Germany, 55% in Russia, 47% in the United Kingdom, and 40% in Spain. In historical lead-consuming countries, the share is lower due to the diverse stock structure resulting from the historical use of lead in the construction sector. The recent expansion of the automotive industry in India and South Korea has contributed to higher recycling rates. Notably, China’s case is distinctive, with a rising recycling rate until 2010, followed by a sharp decline. The decrease can be attributed to a 2.8-fold increase in generated waste between 2010 and 2018, emphasizing the need for an increase in battery recycling capacity.

3.3. Secondary Reserve

Table 4 provides the secondary reserve classification for China, while Figure 5 illustrates the decomposition of cumulated inputs to society for all countries.
Based on Figure 5, the cumulated inputs to society between 1950 and 2018 range from 10 Mt in India to 76 Mt in China. The United States ranks second, followed by Russia, Germany, and the United Kingdom, while other countries have cumulated inputs of less than 20 Mt. Per capita cumulated inputs for growing economies like India (7.6 kg/cap) and China (54 kg/cap) are still significantly lower than those of other countries. Most countries (such as the US, Russia, Spain, Italy, and France) fall within the range of 200–250 kg/cap of cumulated inputs whereas level of inputs in Japan is comparatively low (119 kg/cap). The participation of countries in the lead trade helps explain the differences in cumulated inputs. For instance, 77% and 62% of the cumulated inputs for South Korea and Germany have been exported. The export share decreases to 47% in Japan, 27% in India, 19% in China, and 14% in Russia, indicating a greater focus on domestic consumption in these economies.
The history of lead consumption also plays a role, as more lead has already transitioned from in-use stock to end-of-life management in older consumer countries. In contrast, the stocks in China and India represent 36% and 41% of cumulated inputs, respectively. This share decreases to 21% in Italy, 20% in the United States, 19% in Spain, 17% in the United Kingdom, 12% in Japan, 11% in France, 7% in Germany and South Korea, and 4% in Russia.
The concept of secondary reserve is connected to the recycling rate or secondary reserve ratio r 56 R R mentioned in the previous section. The results presented in Figure 5 align with the findings of the previous section. For example, South Korea and India have significant secondary reserves as a share of their in-use stock. However, due to the Korean economy’s focus on exports, the secondary reserve in South Korea only accounts for 7% of cumulated inputs, compared to 41% in India.
As of the beginning of 2019, the secondary reserves for the eleven studied countries are as follows: China—18,517 kt (13 kg/cap); United States—9954 kt (29.9 kg/cap); India—4298 kt (3.1 kg/cap); United Kingdom—2787 kt (41.8 kg/cap); Italy—2562 kt (42.8 kg/cap); Spain—2145 kt (45.7 kg/cap); Germany—1515 kt (18.2 kg/cap); South Korea—1120 kt (21.7 kg/cap); France—1119 kt (17.4 kg/cap); Japan—1035 kt (8.2 kg/cap); Russia—641 kt (4.4 kg/cap). It is important to note that the level of secondary reserve does not necessarily indicate the ability to meet final demand from recovered scrap, as demand varies between countries. For instance, the r I 5 62 indicator is 67% in Japan and 66% in Spain, despite Spain having a secondary reserve per capita 5.6 times larger than Japan’s.
Table 4 provides additional insights into the secondary reserve classification for China. The table reveals that the inputs to Chinese society, economy, and use phase differ from each other. The inputs to the economy amount to 93,873 kt, which is 23% higher than the inputs to society reported in Figure 5. Out of the input to the economy, 19% comes from domestic scrap, and 58% is from domestic extraction. The Chinese economy’s output with economic value accounts for 81%, of which 66% is used domestically and 15% is exported. Dissipation represents 17% of the Chinese economy’s outputs but only 1.7% of the use phase output, indicating that Chinese lead consumption historically has had a lower dependency on dissipative uses such as gasoline and ammunition. In contrast, countries like the United States have a longer history of dissipative uses.
At the beginning of 2019, China’s secondary reserve amounted to 18,517 kt, which is roughly the same as the cumulated end-of-life scrap over the 1950–2018 period. Considering the 2018 ratio r 56 R R , 1468 kt of the secondary reserve was projected to be released in 2019. Furthermore, an additional 1152 kt (+78%) could be expected when considering marginal secondary reserve. This represents 59% of the 2018 secondary reserve, highlighting the need to enhance recycling capacity in China.

4. Discussion

4.1. A Vanishing Resource or a Toxic Legacy

Lead stands at a critical crossroads, transitioning from an essential industrial material to a potentially obsolete and hazardous legacy. Historically indispensable, its demand is increasingly challenged by the rise of lithium-ion (Li-ion) batteries, particularly in electric vehicles (EVs) and energy storage applications. While lead–acid batteries (LABs) remain cost-effective—three to ten times cheaper per kilowatt-hour than Li-ion alternatives—their future is uncertain as regulatory policies, electrification trends, and battery innovations favor lithium-based solutions [37,38,39]. If this transition accelerates, the resulting decline in lead demand could leave vast quantities of in-use stock and waste flows without a secondary market, raising concerns about its long-term management.
Despite its high recyclability—over 95% of LAB materials are recoverable—lead remains an environmental and health hazard. Historically, much of it was lost through dissipative uses such as gasoline additives, but the primary risk has now shifted to the waste sector. The recycling of LABs, while crucial for circular economy models, introduces significant occupational hazards, particularly in countries where informal recycling practices persist. In 2018, global end-of-life lead waste reached 7717 kt, with 48% recycled, yet unsafe recycling remains widespread in developing nations. Regulatory enforcement has mitigated some risks in developed countries, but paradoxically, domestic processed output (DPO) in 2018 exceeded 1976 levels, despite decades of lead restrictions. This raises questions about the true effectiveness of past regulations and whether they have merely shifted risks rather than eliminated them.
The future of lead depends on the balance between its declining industrial use and the challenge of managing its accumulated stocks. While emerging economies like India, where per capita in-use stock remains low, could sustain lead demand in the near term, a long-term decline would leave a substantial stockpile of hazardous material with no clear pathway for reuse. If secondary markets shrink, the risks of large-scale disposal, improper waste handling, and long-term environmental contamination will grow. Whether lead remains a valuable resource or becomes an unmanaged toxic legacy will ultimately depend on how effectively industries and policymakers anticipate and address these challenges.

4.2. Limitations and Validation

The accuracy of in-use stock estimation depends on factors such as production, trade, process efficiency, market shares, product lifetimes, and recycling rates. Table 5 compares this study’s findings with previous estimates for domestic extraction (DE), end-of-life scrap generation (F56), secondary reuse (F62), and input to in-use stock (I5). DE estimates remain stable due to reliance on official statistics, while variations in F56, F62, and I5 arise from differences in data sources and statistical adjustments. For example, this study’s Indian I5 values (107 kt in 1999 and 124 kt in 2001) align closely with Mao et al. [30,31]. Discrepancies in Chinese and US F62 values reflect variations in secondary production estimates from [21,30], and the World Bureau of Metal Statistics [9].
Stock estimates show greater divergence, with this study’s results up to six times higher than [31], especially for Russia. This difference likely stems from methodology as [31] downscaled global in-use stock data, whereas this study used country-specific datasets over a longer period. Additionally, this study assigns a higher market share to long-lifetime construction products (30-year lifespan vs. 20–30 years [31]). Similarly, ref. [20] estimated China’s transport-related lead stock at 910 kt, compared to 1864 kt in this study, indicating that extended historical coverage contributes to higher estimates.
Historically, material flow studies have focused on tracking flows rather than estimating stocks. However, precise in-use stock assessments are crucial for long-lifetime products with high recovery potential. Ensuring methodological rigor and data transparency remains essential for advancing material stock research and informing evidence-based policy recommendations.

5. Conclusions

Lead stands at a pivotal moment, caught between its historical industrial significance and its emerging status as a hazardous legacy. This study reveals how regulatory constraints and shifting market demands have redefined lead’s role over time, with China’s dominance (82% of global extraction by 2018) reshaping global supply chains. Despite stringent regulations phasing out dissipative uses such as gasoline additives, lead demand has remained resilient, driven by its role in lead-acid batteries (LABs), which continue to dominate automotive and backup power systems.
However, as lithium-ion batteries (Li-ion) gain market traction, the long-term viability of lead remains uncertain. If demand declines, vast quantities of in-use stocks and end-of-life lead may become an unmanaged toxic burden, particularly in nations lacking effective recycling infrastructure. While secondary reserves offer a pathway toward circularity, this study highlights significant inefficiencies in global recycling systems—with developed economies leveraging secondary production, while developing nations struggle with unsafe informal recycling.
Ultimately, whether lead remains a valuable resource, or a growing toxic liability, depends on how effectively policymakers and industries navigate the transition. Strengthening recycling policies, reducing reliance on primary extraction, and ensuring safe end-of-life management will be crucial. Without proactive strategies, the world may face a dual crisis: diminishing industrial relevance of lead, coupled with an escalating environmental burden.

Author Contributions

Conceptualization, S.M.R.D. and S.H.; methodology, S.M.R.D. and J.Z.; validation, S.M.R.D., J.Z. and S.H.; formal analysis, S.M.R.D. and J.Z.; investigation, S.M.R.D. and J.Z.; data curation, S.M.R.D. and J.Z.; writing—original draft preparation, S.M.R.D. and J.Z.; writing—review and editing, S.M.R.D. and S.H.; visualization, S.M.R.D.; supervision, S.H.; funding acquisition, S.H. All authors have read and agreed to the published version of the manuscript.

Funding

This research was supported by Environmental Economics and Policy Studies IV from the Ministry of Environment, Japan, Grant-in-Aid for Scientific Research (19H04329) from the Japan Society for the Promotion of Science, and Environment Research and Technology Development Fund (JPMEERF20193002) of the Environmental Restoration and Conservation Agency provided by Ministry of the Environment, Japan.

Data Availability Statement

The data that support the findings of this study are available from the authors, upon reasonable request.

Conflicts of Interest

The funders had no role in the design of the study; in the collection, analyses, or interpretation of data; in the writing of the manuscript; or in the decision to publish the results.

Appendix A. Material Flow Analysis

This section explains how the flows shown in Figure 1 were calculated. For this purpose, we used the WBMS data related to mining production (MP), refined production (RP), secondary refined production (SRP) and refined consumption (RC). All the export flows (F10, F20, F30, F40, F60) and import flows (F02, F02s, F03, F04, F05) are calculated by multiplying trade data from UN Comtrade with the product lead content described in Table A1.
Process 1:
F e 1 = M P c r ;   F 1 e = F e 1 M P ;   F 12 = M P F 10
Cr is the recovery rate at concentrate and was adapted from [30,31] and [21]. It varies from 72% to 92% depending on the countries. Note that when F10 is greater than MP, F12 is set to zero and the misbalance becomes part of the Balance item 26 presented in Table 3.
Process 2:
The primary refined production (PRP) is calculated as follows:
P R P = R P S R P
The emission to the environment F2e is then the sum of primary refinery losses and secondary refinery losses, as shown in Equation (A3). Pr and sr represent the primary refinery rate and secondary refinery rate, respectively, and were adapted [30,31] and [21].
F 2 e = P R P p r 1 p r + S R s r 1 s r
The flow between process 2 and 3 was directly calculated from refined consumption data:
F 23 = R C F 03
The total output flows (O2) and input flows (I2) of process 2 are then given as follows:
O 2 = F 20 + F 2 e + F 23 ;   I 2 = F 12 + F 02 + F 02 s + F 32 + F 62
where F 62 = S R s r F 02 s F 32 corresponds to the domestic flow of recycled end-of-life scrap. F32 is the new scrap flow calculated from the output of process 3.
Process 3:
The total input to process 3 is the refined consumption (RC) divided in each end-use category based on their market share mi and fabrication efficiency fi. Market share data were obtained from WBMS and Figure A1 below shows the market share evolution of the transportation sector for the studied countries. Fabrication losses were adapted from [21,30,31]. They are in the range of 89–96% for transportation (Tr), 87–90% for construction (Co), alloys (Al) and ammunition (Am), and 95–98% for chemicals (Ch), miscellaneous (Mi) and gasoline (Ga).
F 34 + F 30 = R C i = 1 6 m i f i F 30
The losses during semi-finished production are divided between loss to the environment (F3e), new scrap (F32) and loss to the landfill (F36), as shown in Equation (A7):
F 3 e = 0.2 R C i = 1 6 m i 1 f i ;   F 3 e = 0.5 R C i = 1 6 m i 1 f i ;   F 3 e = 0.3 R C i = 1 6 m i 1 f i
Process 4:
The finished production process was assumed without loss leading to the following simple equation balance:
F 45 = F 34 + F 04 F 40
Note that when the net trade (F40–F04) is greater than F34, F45 is set to zero and the misbalance becomes part of the Balance item 26 presented in Table 3.
Process 5:
Process 5 refers to the in-use stock whose equation are described in Section 2.2.
Process 6:
The input to the waste management is made of generated end-of-life scrap (F56) and losses from the semi-finished production process (F36).
F 6 e = F 36 + F 56 F 62 F 60
Note that when the sum of exported scrap (F60) and recycled scrap (F62) is greater than the generated end-of-life scrap (F56), F6e is set to zero and the misbalance becomes part of the Balance item 25 presented in Table 3.
Figure A1. 1950–2018 evolution of the Market share of the transportation sector. CN: China, JP: Japan, KR: South Korea, IN: India, RU: USSR until 1991 and Russian Federation after, GB: Great Britain, IT: Italy, ES: Spain, FR: France, DE: Germany, US: United States.
Resources 14 00052 g0a1
Table A1. Lead content of traded commodities.
CodeItem_NameLc_StageValueUnitFlowRef
HS 262020Ash or residues containing mainly leadRecycle0.005kg Pb/kgF02s,F60[40]
HS 262021Slag, ash and residues; (not from the manufacture of iron or steel), containing mainly lead; leadedRecycle0.005kg Pb/kgF02s,F60[40]
HS 262029Slag, ash and residues; (not from the manufacture of iron or steel), containing mainly lead; excludiRecycle0.005kg Pb/kgF02s,F60[40]
HS 780200Lead; waste and scrapRecycle0.9kg Pb/kgF02s,F60[18]
SITC 28406Lead waste and scrapRecycle0.9kg Pb/kgF02s,F60[18]
HS 260700Lead ores and concentratesRefinery0.64kg Pb/kgF10,F02[10]
HS 780199Lead; unwrought, unrefined, not containing by weight antimony as the principal other elementRefinery0.98kg Pb/kgF10,F02[18]
HS 780191Lead; unwrought, unrefined, containing by weight antimony as the principal other elementRefinery0.98kg Pb/kgF10,F02[18]
SITC 2834Ores and concentrates of leadRefinery0.64kg Pb/kgF10,F02[10]
SITC 68511Unrefined leadRefinery0.98kg Pb/kgF10,F02[18]
SITC 68513Lead alloys, unwroughtRefinery0.98kg Pb/kgF10,F02[18]
HS 780110Lead; unwrought, refinedRefinery1kg Pb/kgF20,F03Assumed
SITC 68512Refine lead (excluding lead alloys), unwroughtRefinery1kg Pb/kgF20,F03Assumed
HS 282410Lead monoxide (litharge, massicot)Semi-Products0.93kg Pb/kgF30,F04PbO
HS 282420Red lead & orange leadSemi-Products0.91kg Pb/kgF30,F04Pb3O4
HS 282490Lead oxides; n.e.c. in heading no. 2824Semi-Products0.87kg Pb/kgF30,F04PbO2
HS 283670Lead carbonatesSemi-Products0.78kg Pb/kgF30,F04PbCO3
HS 284120Chromates of zinc/of leadSemi-Products0.64kg Pb/kgF30,F04PbCrO4
HS 293110Organo-inorganic compounds; tetramethyl lead and tetraethyl leadSemi-Products0.71kg Pb/kgF30,F04C8H20Pb C4H12Pb
HS 381111Anti-knock preparations; based on lead compoundsSemi-Products0.00033kg Pb/kgF30,F04[18]
HS 390421Vinyl chloride, other halogenated olefin polymers; non-plasticised poly(vinyl chloride), in primarySemi-Products0.014kg Pb/kgF30,F04[41]
HS 391620Vinyl chloride polymers; monofilament, of which any cross-sectional dimension exceeds 1 mm, rods, stiSemi-Products0.014kg Pb/kgF30,F04[41]
HS 392041Sheet/film not cellular/reinf rigid vinyl polymerSemi-Products0.014kg Pb/kgF30,F04[41]
HS 721020Iron or non-alloy steel; flat-rolled, width 600mm or more, plated or coated with lead, including terSemi-Products0.71kg Pb/kgF30,F04[42]
HS 780300Lead bars, rods, profiles & wireSemi-Products0.95kg Pb/kgF30,F04[18]
HS 780411Lead; sheets, strip and foil, of a thickness (excluding any backing) not exceeding 0.2 mmSemi-Products0.95kg Pb/kgF30,F04[18]
HS 780419Lead; plates, sheets, strip and foil, of a thickness (excluding any backing) exceeding 0.2 mmSemi-Products0.95kg Pb/kgF30,F04[18]
HS 780420Lead; powders and flakesSemi-Products0.95kg Pb/kgF30,F04[18]
HS 780500Lead tubes, pipes & tube/pipe fittings (e.g., couplings, elbows, sleeves)Semi-Products0.95kg Pb/kgF30,F04[18]
HS 780600Lead; articles n.e.c. in chapter 78Semi-Products0.95kg Pb/kgF30,F04[18]
HS 850710Electric accumulators; lead-acid, of a kind used for starting piston engines, including separators,Semi-Products0.58kg Pb/kgF30,F04[41]
HS 850720Electric accumulators; lead-acid, (other than for starting piston engines), including separators, whSemi-Products0.58kg Pb/kgF30,F04[41]
HS 854011Tubes; cathode-ray television picture tubes, including video monitor cathode-ray tubes, colourSemi-Products0.21kg Pb/kgF30,F04[18]
HS 854012Tubes; cathode-ray television picture tubes, including video monitor cathode-ray tubes, monochromeSemi-Products0.21kg Pb/kgF30,F04[18]
HS 854030Cathode-ray tubes, except for televisionSemi-Products0.21kg Pb/kgF30,F04[18]
HS 854060Tubes; cathode ray, n.e.c. in heading no. 8540Semi-Products0.21kg Pb/kgF30,F04[18]
HS 854091Parts of cathode-ray tubesSemi-Products0.21kg Pb/kgF30,F04[18]
SITC 51356Lead oxidesSemi-Products0.8kg Pb/kgF30,F04[18]
SITC 68521Bars, rods, angles, shapes, sections/wire of leadSemi-Products0.95kg Pb/kgF30,F04[18]
SITC 68523Lead foil, powders and flakesSemi-Products0.95kg Pb/kgF30,F04[18]
SITC 68522Plates,sheets and strip of leadSemi-Products0.95kg Pb/kgF30,F04[18]
SITC 68524Tubes, pipes, blanks/fittings, hollow bars of leadSemi-Products0.95kg Pb/kgF30,F04[18]
SITC 69896Articles of lead, n.e.s.Semi-Products0.95kg Pb/kgF30,F04[18]
HS 391723Plastics; tubes, pipes and hoses thereof, rigid, of polymers of vinyl chlorideConsumer Products0.014kg Pb/kgF40,F05[41]
HS 701321Drinking glasses (excl. of glass-ceramics), of lead crystalConsumer Products0.2785kg Pb/kgF40,F05[41]
HS 701322Stemware drinking glasses, of lead crystalConsumer Products0.2785kg Pb/kgF40,F05[41]
HS 701331Glassware of a kind used for table/kitchen purps. (excl. drinking glasses), ...Consumer Products0.2785kg Pb/kgF40,F05[41]
HS 701333Glassware; drinking glasses (not stemware), of lead crystalConsumer Products0.2785kg Pb/kgF40,F05[41]
HS 701341Glassware of a kind used for table or kitchen purposes (not drinking glasses), of lead crystalConsumer Products0.2785kg Pb/kgF40,F05[41]
HS 701391Glassware; n.e.c. in heading no. 7013, of lead crystalConsumer Products0.2785kg Pb/kgF40,F05[41]
HS 852810Colour television receivers/monitors/projectorsConsumer Products0.2291kg Pb/kgF40,F05[43]
HS 852820Monochrome television receivers/monitors/projectorsConsumer Products0.2291kg Pb/kgF40,F05[43]
HS 852812Color television receiveConsumer Products0.2291kg Pb/kgF40,F05[43]
HS 852813B & W television receiveConsumer Products0.2291kg Pb/kgF40,F05[43]
HS 852821Video monitors, colourConsumer Products0.2291kg Pb/kgF40,F05[43]
HS 852822Video monitors, black & white/oth. monochromeConsumer Products0.2291kg Pb/kgF40,F05[43]
HS 852830Video projectorsConsumer Products0.2291kg Pb/kgF40,F05[43]
HS 852841Cathode-ray tube monitors; of a kind solely or principally used in an automatic data processing systConsumer Products0.2291kg Pb/kgF40,F05[43]
HS 852842Monitors; cathode-ray tube, capable of directly connecting to and designed for use with an automaticConsumer Products0.2291kg Pb/kgF40,F05[43]
HS 852849Monitors; cathode-ray tube, n.e.c. in subheading 8528.42, whether or not colourConsumer Products0.2291kg Pb/kgF40,F05[43]
HS 852851Monitors other than cathode-ray tube; of a kind solely or principally used in an automatic data procConsumer Products0.00067kg Pb/kgF40,F05[43]
HS 852852Monitors; other than cathode-ray tube; capable of directly connecting to and designed for use with aConsumer Products0.00067kg Pb/kgF40,F05[43]
HS 852859Monitors other than cathode-ray tube; n.e.c. in subheading 8528.52, whether or not colourConsumer Products0.00067kg Pb/kgF40,F05[43]
HS 852872Reception apparatus for television, whether or not incorporating radio-broadcast receivers or soundConsumer Products0.00067kg Pb/kgF40,F05[43]
HS 852873Reception apparatus for television, whether or not incorporating radio-broadcast receivers or soundConsumer Products0.00067kg Pb/kgF40,F05[43]
HS 903020Cathode-ray oscilloscopes, oscillographsConsumer Products0.2291kg Pb/kgF40,F05[43]
HS 8701Tractors (other than works, warehouse equipment)Consumer Products16.667kg Pb/unitF40,F05[44]
HS 8702Public-transport type passenger motor vehiclesConsumer Products19.444kg Pb/unitF40,F05[44]
HS 8703Motor vehicles for transport of persons (except busesConsumer Products10.833kg Pb/unitF40,F05[44]
HS 8704Motor vehicles for the transport of goodsConsumer Products19.444kg Pb/unitF40,F05[44]
HS 8705Special purpose motor vehiclesConsumer Products17.111kg Pb/unitF40,F05[44]
HS 842710Fork-lift and other works trucks; fitted with lifting or handling equipment, self-propelled by electConsumer Products4.556kg Pb/unitF40,F05[44]
HS 842720Fork-lift and other works trucks; fitted with lifting or handling equipment, self-propelled by otherConsumer Products4.556kg Pb/unitF40,F05[44]
HS 8709Work truck, self-propelled, except lift trucks etc.Consumer Products4.556kg Pb/unitF40,F05[44]
HS 8710Tanks and other armoured fighting vehiclesConsumer Products22.222kg Pb/unitF40,F05[44]
HS 8711Motorcycles, bicycles etc. with auxiliary motorConsumer Products3.178kg Pb/unitF40,F05[44]
SITC 7241Television broadcast receiversConsumer Products0.229kg Pb/kgF40,F05[43]
SITC 7125Tractors, other than road tractorsConsumer Products16.667kg Pb/unitF40,F05[44]
SITC 7325Road tractors for tractor trailer combinationsConsumer Products16.667kg Pb/unitF40,F05[44]
SITC 7322Buses, including trolleybusesConsumer Products19.444kg Pb/unitF40,F05[44]
SITC 7321Passenger motor cars, other than busesConsumer Products10.833kg Pb/unitF40,F05[44]
SITC 7323Lorries and trucks, including ambulances, etc.Consumer Products19.444kg Pb/unitF40,F05[44]
SITC 7324Special purpose lorries, trucks and vansConsumer Products17.111kg Pb/unitF40,F05[44]
SITC 71932Fork lift trucks for moving goods within plantConsumer Products4.556kg Pb/unitF40,F05[44]
SITC 95101Armoured fighting vehiclesConsumer Products22.222kg Pb/unitF40,F05[44]
SITC 73291Motorcycles, auto cycles, etc. side carsConsumer Products3.178kg Pb/unitF40,F05[43]

Appendix B. Selection of Countries

The present study focuses explicitly on major refined lead-consuming countries. As presented in Section 2.3, we identified annually the top five refined lead consumers for each year from 1950 to 2018. This analysis resulted in a consistent selection of eleven countries, which cumulatively represent at least 70% of global refined lead consumption both annually and over the entire period studied. We also ensured that these countries correspond with the highest per capita refined lead consumption, with populations exceeding one million inhabitants. Additionally, the availability of detailed market share data for various end-use applications, crucial for analyzing lifetime and recycling dynamics, was considered. The countries selected, along with the specific years in which they were among the top five global consumers, are as follows:
Europe: France (FR): 1950–1964; 1966–1967; 1969
Italy (IT): 1996, 2007
Spain (ES): 2009
Germany (DE): 1950–2018
Great Britain (GB): 1950–1995; 1998–1999; 2002–2004
USSR and Russian Federation (RU): 1950–1991
United States of America (US): 1950–2018
Asia: Japan (JP): 1965, 1968, 1970–2001, 2005–2006, 2008
India (IN): 2010–2018
South Korea (KR): 1997, 2000–2018
China (CN): 1992–2018
In recent years, Brazil and Mexico have emerged as important refined lead consumers; however, neither consistently ranked within the top five historically. Specifically, Brazil’s refined lead consumption is predominantly domestically oriented and only recently positioned within the global top ten, primarily driven by domestic battery manufacturing and recycling. Mexico’s consumption, despite its global significance, involves substantial refined lead exports embedded in finished batteries and automotive components, complicating the historical assessment of true domestic consumption. Furthermore, consistent historical market share data and end-use distributions for these two countries were unavailable, limiting comparability with the selected group. The refined lead consumption trends of the eleven countries selected are illustrated in Figure A2, clearly depicting their evolving global share over the studied period (1950–2018).
Figure A2. 1950–2018 refined consumption shares of selected countries. CN: China, JP: Japan, KR: South Korea, IN: India, RU: USSR until 1991 and Russian Federation after, GB: Great Britain, IT: Italy, ES: Spain, FR: France, DE: Germany, US: United States.
Resources 14 00052 g0a2

References

  1. Rogich, D.G.; Matos, G.R. Global Flows of Metals and Minerals; US Department of the Interior, US Geological Survey: Washington, DC, USA, 2008.
  2. Vidal, O.; Rostom, F.; François, C.; Giraud, G. Global trends in metal consumption and supply: The raw material–energy nexus. Elements 2017, 13, 319–324. [Google Scholar] [CrossRef]
  3. Deetman, S.; Pauliuk, S.; Van Vuuren, D.P.; Van Der Voet, E.; Tukker, A. Scenarios for demand growth of metals in electricity generation technologies, cars, and electronic appliances. Environ. Sci. Technol. 2018, 52, 4950–4959. [Google Scholar] [PubMed]
  4. Watari, T.; Nansai, K.; Nakajima, K. Review of critical metal dynamics to 2050 for 48 elements. Resour. Conserv. Recycl. 2020, 155, 104669. [Google Scholar] [CrossRef]
  5. Schafer, L.L.; Mountford, P.; Piers, W.E. Earth abundant element compounds in homogeneous catalysis. Dalton Trans. 2015, 44, 12027–12028. [Google Scholar]
  6. Mudd, G.M.; Jowitt, S.M.; Werner, T.T. The world’s lead-zinc mineral resources: Scarcity, data, issues, and opportunities. Ore Geol. Rev. 2017, 80, 1160–1190. [Google Scholar] [CrossRef]
  7. Harper, E.; Kavlak, G.; Burmeister, L.; Eckelman, M.J.; Erbis, S.; Espinoza, V.S.; Nuss, P.; Graedel, T.E. Criticality of the geological zinc, tin, and lead family. J. Ind. Ecol. 2015, 19, 628–644. [Google Scholar]
  8. Graedel, T.E.; Harper, E.M.; Nassar, N.T.; Reck, B.K. Criticality of metals and metalloids. Proc. Natl. Acad. Sci. USA 2015, 112, 4257–4262. [Google Scholar] [CrossRef]
  9. World Bureau Metal Statistics (WBMS). Lead Statistics and Information. 2022. Available online: https://www.refinitiv.com/en/financial-data/commodities-data/metals-data/world-bureau-of-metal-statistics-wbms (accessed on 10 May 2024).
  10. United States Geological Survey (USGS). Lead Statistics and Information. 2023. Available online: https://www.usgs.gov/centers/national-minerals-information-center/lead-statistics-and-information (accessed on 10 May 2024).
  11. Reck, B.K.; Graedel, T.E. Challenges in metal recycling. Science 2012, 337, 690–695. [Google Scholar]
  12. Rees, N.; Fuller, R. The Toxic Truth: Children’s Exposure to Lead Pollution Undermines a Generation of Future Potential; UNICEF: Geneva, Switzerland, 2020; ISBN 978-92-806-5140-9. [Google Scholar]
  13. Gupt, Y.; Sahay, S. Managing Used Lead Acid Batteries in India: Evaluation of EPR-DRS Approaches. J. Health Pollut. 2015, 5, 52–63. [Google Scholar] [CrossRef]
  14. United States Environmental Protection Agency (EPA). Lead Regulations and Laws. Available online: https://www.epa.gov/lead (accessed on 20 September 2024).
  15. Elshkaki, A.; van der Voet, E.; Van Holderbeke, M.; Timmermans, V. Long-term consequences of non-intentional flows of substances: Modelling non-intentional flows of lead in the Dutch economic system and evaluating their environmental consequences. Waste Manag. 2009, 29, 1916–1928. [Google Scholar] [CrossRef]
  16. Elshkaki, A.; Van der Voet, E.; Van Holderbeke, M.; Timmermans, V. The environmental and economic consequences of the developments of lead stocks in the Dutch economic system. Resour. Conserv. Recycl. 2004, 42, 133–154. [Google Scholar] [CrossRef]
  17. Ando, S.; Murakami, S.; Yamatomi, J. Material flow/stock analysis of lead in Japan. J. MMIJ 2010, 126, 482–489. (In Japanese) [Google Scholar] [CrossRef]
  18. Mao, J.S.; Yang, Z.F.; Lu, Z.W. Industrial flow of lead in China. Trans. Nonferrous Met. Soc. China 2007, 17, 400–411. [Google Scholar] [CrossRef]
  19. Liu, W.; Sang, J.; Chen, L.; Tian, J.; Zhang, H.; Palma, G.O. Life cycle assessment of lead–acid batteries used in electric bicycles in China. J. Clean. Prod. 2015, 108, 1149–1156. [Google Scholar]
  20. Liu, W.; Chen, L.; Tian, J. Uncovering the evolution of lead in-use stocks in lead-acid batteries and the impact on future lead metabolism in China. Environ. Sci. Technol. 2016, 50, 5412–5419. [Google Scholar]
  21. Liu, W.; Cui, Z.; Tian, J.; Chen, L. Dynamic analysis of lead stocks and flows in China from 1990 to 2015. J. Clean. Prod. 2018, 205, 86–94. [Google Scholar]
  22. Bleiwas, D.I. Stocks and Flows of Lead-Based Wheel Weights in the United States; Open-File Reports; U.S. Geological Survey: Sunrise Valley Drive Reston, VA, USA, 2006; Volume 1111. Available online: https://pubs.usgs.gov/of/2006/1111/2006-1111.pdf (accessed on 10 March 2025).
  23. Hashimoto, S.; Daigo, I.; Murakami, S.; Matsubae-Yokoyama, K.; Fuse, M.; Nakajima, K.; Oguchi, M.; Tanikawa, H.; Tasaki, T.; Yamasue, E.; et al. Framework of material stock accounts: Toward assessment of material accumulation in the economic sphere. In Proceedings of the 8th International Conference EcoBalance, Tokyo, Japan, 10–12 December 2008. [Google Scholar]
  24. Maung, K.N.; Hashimoto, S.; Mizukami, M.; Morozumi, M.; Lwin, C.M. Assessment of the secondary copper reserves of nations. Environ. Sci. Technol. 2017, 51, 3824–3832. [Google Scholar] [CrossRef]
  25. Le, T.V.; Dente, S.M.R.; Hashimoto, S. Contemporary and Future Secondary Copper Reserves of Southeast Asian Countries. Recycling 2024, 9, 116. [Google Scholar] [CrossRef]
  26. Le, T.V.; Yamamoto, R.; Dente, S.M.R.; Hashimoto, S. Contemporary and Future Secondary Copper Reserves of Vietnam. Resources 2024, 13, 82. [Google Scholar] [CrossRef]
  27. Maung, K.N.; Yoshida, T.; Liu, G.; Lwin, C.M.; Muller, D.B.; Hashimoto, S. Assessment of secondary aluminum reserves of nations. Resour. Conserv. Recycl. 2017, 126, 34–41. [Google Scholar] [CrossRef]
  28. Maung, K.N.; Lwin, C.M.; Hashimoto, S. Assessment of secondary zinc reserves of nations. J. Ind. Ecol. 2019, 23, 1109–1120. [Google Scholar]
  29. United Nations Environment Programme. The Use of Natural Resources in the Economy: A Global Manual on Economy-Wide Material Flow Accounting; United Nations Environment Programme: Washington, DC, USA, 2023; Available online: https://wedocs.unep.org/20.500.11822/36253 (accessed on 10 March 2025).
  30. Mao, J.S.; Dong, J.; Graedel, T.E. The multilevel cycle of anthropogenic lead: I. Methodology. Resour. Conserv. Recycl. 2008, 52, 1058–1064. [Google Scholar]
  31. Mao, J.S.; Dong, J.; Graedel, T.E. The multilevel cycle of anthropogenic lead: II. Results and discussion. Resour. Conserv. Recycl. 2008, 52, 1050–1057. [Google Scholar] [CrossRef]
  32. Ciacci, L.; Reck, B.K.; Nassar, N.T.; Graedel, T.E. Lost by Design. Environ. Sci. Technol. 2015, 49, 9443–9451. [Google Scholar] [CrossRef] [PubMed]
  33. European Commission. Evaluation of the Directive 2006/66/EC on Batteries and Accumulators and Waste Batteries and Accumulators and Repealing Directive 91/157/EEC. In EU Battery Regulations and Market Impact, 2nd ed.; European Union: Brussels, Belgium, 2019; Volume 3, pp. 154–196. [Google Scholar]
  34. Batteries International. China Issues New Collection and Recycling Plan for Lead Batteries. Batteries International. 14 February 2019. Available online: https://www.batteriesinternational.com/2019/02/14/china-issues-new-collection-and-recycling-plan-for-lead-batteries/ (accessed on 9 February 2025).
  35. International Energy Agency (IEA). Global EV Outlook 2020: Entering the Decade of Electric Drive? IEA: Paris, France, 2020; pp. 1–243. [Google Scholar]
  36. United Nations Comtrade. 2022. Available online: https://comtradeplus.un.org (accessed on 17 April 2024).
  37. JYC Battery. 2025 Lead-Acid Battery Industry: Current Status and Future Trends. JYC Battery. 17 January 2025. Available online: https://www.jycbattery.com/2025-lead-acid-battery-industry-current-status-and-future-trends/ (accessed on 9 February 2025).
  38. GME Recycling. Do Lead Acid Batteries Have a Future? Gianni Mori Engineering. 15 December 2023. Available online: https://www.gme-recycling.com/do-lead-acid-batteries-have-a-future/ (accessed on 9 February 2025).
  39. SAFETY4SEA. Lithium Batteries vs Lead Acid Batteries. SAFETY4SEA. 23 December 2022. Available online: https://safety4sea.com/cm-lithium-batteries-vs-lead-acid-batteries/ (accessed on 9 February 2025).
  40. Health Protection Programme. Treatment and Disposal of Leaded Petrol Sludges (Waste Management Guide: 03); Department of Health: Wellington, New Zealand, 1988; ISBN 0-477-04543-X.
  41. Heavy Metals in Waste. European Commission DG ENV. E3. Heavy Metals in Waste: Final Report. COWI A/S. C:\temp\IECache\OLK29\Heavy metals in waste1.doc. 2002.
  42. QQ-T-201F (Federal Specification for Terneplate). General Services Administration. Federal Specification QQ-T-201F: Terneplate, for Roofing and Roofing Products. U.S. Federal Supply Service. 1986.
  43. Wang, M.; You, X.; Li, X.; Liu, G. Watch more, waste more? A stock-driven dynamic material flow analysis of metals and plastics in TV sets in China. J. Clean. Prod. 2018, 187, 730–739. [Google Scholar] [CrossRef]
  44. European Commission. Heavy Metals in Vehicles II: Final Report; European Commission, DG Environment: Hamburg, Germany, 2006. [Google Scholar]
Figure 1. Lead material flow diagram. F i 0 : Lead export from process i. F 0 i : Lead import to process i. F i e : Lead dissipated to the environment from process i. F i j : Lead flow from process i to process j.
Resources 14 00052 g001
Figure 2. 1950–2018 evolution of Domestic extraction (DE), domestic processed outputs (DPO), input to in-use stock (I5), end-of-life scrap (F56) and in-use stock. CN: China, JP: Japan, KR: South Korea, IN: India, RU: USSR until 1991 and Russian Federation after, GB: Great Britain, IT: Italy, ES: Spain, FR: France, DE: Germany, US: United States. All: All previous eleven countries.
Resources 14 00052 g002
Figure 3. 1950–2018 evolution of per capita stock, end-of-life scrap and domestic processed output. CN: China, JP: Japan, KR: South Korea, IN: India, RU: USSR until 1991 and Russian Federation after, GB: Great Britain, IT: Italy, ES: Spain, FR: France, DE: Germany, US: United States.
Resources 14 00052 g003
Figure 4. Domestic share input to the economy r I P d o m , Economic value output share r O P e c o , Domestic share input to in-use stock r I 5 d o m , ratio of recycled EOL to demand r I 5 62 , recycling rate r 56 R R . CN: China, JP: Japan, KR: South Korea, IN: India, RU: USSR until 1991 and Russian Federation after, GB: Great Britain, IT: Italy, ES: Spain, FR: France, DE: Germany, US: United States.
Resources 14 00052 g004
Figure 5. Decomposition of cumulated 1950–2018 inputs into outputs and stock (per capita ratio calculated using 2019 population data). CN: China, JP: Japan, KR: South Korea, IN: India, RU: USSR until 1991 and Russian Federation after, GB: Great Britain, IT: Italy, ES: Spain, FR: France, DE: Germany, US: United States. N.B. Total cumulated 1950–2018 input to China (CN) is 76,095 kt for a 2018 in-use per capita of 54 kg/capita.
Resources 14 00052 g005
Table 1. MFA Indicators.
Production (P)Use (U)Society (S)
Domestic extraction (DE) D E P = F e 1 D E S = F e 1
Import (M) M P = F 02 + F 03 + F 04 + F 02 s M U = F 05 M S = M P + M U
Export (E) E P = F 10 + F 20 + F 30 + F 40 E U = F 60 E S = E P + E U
Domestic Material Input (DMI) D M I P = D E P + M P D M I U = D E U + M U D M I S = D E S + M S
Physical Trade Balance (PTB) P T B P = M P E P P T B U = M U E U P T B S = M S E S
Domestic Processed Output (DPO) D P O P = F 1 e + F 2 e + F 3 e D P O U = F 5 e + F 6 e D P O S = D P O P + D P O U
Domestic material Consumption (DMC) D M C P = D M I P E P D M C U = D M I U E U D M C S = D M I S E S
Input (I) I P = D M I P + F 62 I U = D M I U + F 36 + F 45 I S = D M I S
Output (O) O P = D P O P + E P + F 36 + F 45 O U = D P O U + E U + F 62 O U = D P O S + E S
Net Addition to Stock (NAS) N A S P = I P O P N A S U = I U O U N A S S = I S O S
F i 0 : Lead export from process i. F 0 i : Lead import to process i. F i e : Lead dissipated to the environment from process i. F i j : Lead flow from process i to process j. Production (P): Includes mining, refining, semi-finished, and finished product stages. Use (U): Covers in-use stocks and waste management processes. Society (S): Represents the combined system of production and use.
Table 2. Life function parameters.
Number of Years by WhichTransportConstructionChemicalAlloysMiscellaneous
50% of inputs left the stock (t50)530121212
90% of inputs left the stock (t90)645151515
Reference[30,31]
In-use dissipation ratio (d in %)000.0620.1330
Reference[32]
Table 3. Extended secondary reserve framework.
Stock Released inCumulated Output Cumulated Input
YearFutureIntLDEIntMDEB
Production (P)Economic1 2 345626
Marginal Economic
Sub-economic 7
8
9
TotalΣc ΣcΣcΣcΣcΣrΣcΣcΣcΣcΣr
Use (U)Economic10114 12 213
Marginal Economic1415
Sub-economic1617 18 7 25
1920 21 8
2223 24
TotalΣcΣcΣcΣcΣcΣcΣrΣcΣcΣcΣcΣr
Society (S)Economic1 + 1011 5626
Marginal Economic1415
Sub-economic1617 18 25
1920 21
2223 9 + 24
TotalΣcΣcΣcΣcΣcΣcΣrΣcΣcΣcΣcΣr
L: Waste management (landfill and mixed metal loss), D: Dissipation, E: Export, M: Import. Int: Intermediate flows between Use and Production systems, Σr: Row sum, Σc: Column Sum.
Table 4. Secondary reserve classification of China (1950–2018) in kt.
CNStock Released inCumulated Output Cumulated Input
YearFutureIntLDE IntMDEB
Produciton (P)Economic0 61,962 14,291 18,08818,95954,2372589
0.0% 66% 15% 19%20%58%3%
Marginal Economic
SubEconomic 1290
1.4%
553
0.6%
15,777
17%
Total0 63,805 15,77714,29193,87318,08818,95954,237258993,873
0.0% 68% 16.8%15%100%19%20%58%3%100%
Use (U)Economic1468890918,088 8 61,962297
2.3%14%28% 0.0% 97%0.5%
Marginal Economic11526988
1.8%11%
SubEconomic8895394 12,190 1290 14
1.4%8% 19% 2.0% 0.0%
3812312 5224 553
0.6%4% 8.1% 0.9%
528 1081
0.008%0.043% 1.7%
Total389423,63118,08817,4141081864,11663,80529701464,116
6.1%37%28%27%1.7%0.0%100%100%0%0%0%100%
Society (S)Economic14688909 14,299 19,25554,2372589
1.9%12% 19% 25%71%
Marginal Economic11526988
2%9%
SubEconomic8895394 12,190 14
1.2%7% 16% 0.0%
3812312 5224
0.5%3% 6.9%
528 16,857
0.007%0.037% 22%
Total389423,631017,41416,85714,29976,095 19,25554,237260376,095
5.1%31%0%23%22%19% 0%25%71%3%100%
L: Waste management (landfill and mixed metal loss), D: Dissipation, E: Export, M: Import. Int: Intermediate flows between Use and Production systems, Σr: Row sum, Σc: Column Sum. N.B.: 1950–2018 Cumulated input in China amounts to 76,095 kt of which 22% have been dissipated to the environment, 19% exported and 23% remained in the waste management system. The share currently in stock amounts to 36.1%, with 35% to be released in the future.
Table 5. Comparison with other studies (year 2000).
Domestic
Extraction (DE)
End-of-Life Scrap
(F56)
Recycled Scrap (F62)Finished Product Consumption (I5)In-Use Stock
CountryOther This StudyOther This StudyOther This StudyOther This StudyOther This Study
China (CN)825 1, 832 3810153 1, 190 339139 1, 202 3115327 1, 598 36941843 2, 1432 3, 910 4 *4645, 1864 *
Germany (DE)0 10227 1323205 1194270 13211502 23172
Spain (ES)61 147132 169114 1 107167 1137594 21227
France (FR)0 10200 1208128 1109220 12411079 22315
Great Britain (GB)0 11.2246 1233172 1152306 13071543 23821
India (IN)45 14553 17421 112136 163326 2779
Italy (IT)3.6 13.9206 1212159 1154238 12391039 22718
Japan (JP)11 111247 1257178 1174276 13201487 22743
South Korea (KR)3.8 13.3112 111656 140160 1162443 2909
USSR and Russian Federation (RU)18 11689 122411 115116 1132444 22631
United States (US)515 15141481 114011061 16441727 117196878 211,006
1 [30], 2 [31], 3 [21], 4 [20]. * Only Lead Acid Batteries (Transportation).
Disclaimer/Publisher’s Note: The statements, opinions and data contained in all publications are solely those of the individual author(s) and contributor(s) and not of MDPI and/or the editor(s). MDPI and/or the editor(s) disclaim responsibility for any injury to people or property resulting from any ideas, methods, instructions or products referred to in the content.

