Article

Exploring the Interplay Between Food Provision and Habitat Quality Assessment for Sustainable Coexistence in the Bioproduction Systems of the Philippines

1
Institute for Global Environmental Strategies, Kanagawa 240-0115, Japan
2
Institute of Renewable Natural Resources, College of Forestry and Natural Resources, University of the Philippines Los Baños, Laguna 4031, Philippines
3
Interdisciplinary Studies Center for Integrated Natural Resources and Environment Management, University of the Philippines Los Baños, Laguna 4031, Philippines
*
Author to whom correspondence should be addressed.
Resources 2025, 14(3), 45; https://doi.org/10.3390/resources14030045
Submission received: 13 January 2025 / Revised: 3 March 2025 / Accepted: 5 March 2025 / Published: 7 March 2025

Abstract

:
Balancing human activities and ecosystem health is critical amid increasing biodiversity concerns. This study explores the relationship between food provision and habitat quality in bioproduction systems in the Philippines, focusing on the Pagsanjan-Lumban Watershed (PLW) and the Baroro Watershed (BW). Using the TerrSet Land Change Modeler for LULC projections, the InVEST model for habitat quality assessment, and statistical analysis of disaggregated crop production data, this study evaluates the synergies and trade-offs between food provision and biodiversity conservation. The findings reveal that LULC changes—such as shifts in annual crops, built-up areas, forests, and agroforestry systems—impact ecosystem health. Habitat quality in the PLW shows temporal degradation, while the BW remains relatively stable. Food production trends indicate fluctuating yields in the PLW, with a decline in the BW. Correlation analysis highlights trade-offs between food provision and habitat quality in the PLW, whereas the BW exhibits a positive correlation, suggesting potential synergies. These findings emphasize the importance of place-based strategies to reconcile food production and biodiversity conservation, ensuring sustainable bioproduction systems that support both ecosystem health and food security.

1. Introduction

Recently, there has been a growing concern about the intricate interplay between human activities, ecosystem services, and the delicate balance necessary for sustainable coexistence [1]. While previous research has extensively documented the role of biodiversity in supporting key ecosystem services such as food production, climate regulation, and water purification [2], fewer studies have focused on how land-use changes affect the trade-offs and synergies between food provision and habitat quality in agricultural landscapes [3]. Recognizing the profound impact of human-induced land-use changes on habitat quality and ecosystem resilience is imperative to inform sustainable management strategies [4].
Human activities, particularly alterations in land use, significantly influence habitat composition and structure, leading to far-reaching consequences that disrupt the essential flow of materials and energy within critical ecosystems [5]. However, while habitat loss and land fragmentation are well-documented consequences of agricultural expansion, there remains a limited understanding of how specific land-use transitions affect both food production and ecosystem health at a watershed scale [6]. This study addresses this gap by examining spatial and temporal patterns of land-use change and their implications for habitat quality and food security.
Bioproduction systems—also referred to as agroecosystems—represent managed ecosystems dedicated to crop cultivation, livestock rearing, and other biological resource production [7]. Conventional and traditional systems coexist within these landscapes, each presenting unique strengths and challenges [8,9]. However, these systems face increasing pressures, including habitat degradation, soil erosion, and biodiversity loss [10,11], underscoring the need for an integrated approach to balancing agricultural productivity with conservation goals [12,13,14].
The Pagsanjan-Lumban Watershed (PLW) and Baroro Watershed (BW) in the Philippines provide an ideal case study for exploring land-use dynamics. These watersheds differ in their locations, agricultural systems, and environmental pressures. The PLW, a Laguna de Bay Basin sub-watershed, experiences rapid urbanization and agricultural expansion, raising concerns over habitat degradation [15]. Meanwhile, the BW, located in northern Luzon, plays a crucial role in rice farming, forestry, and eco-tourism but faces challenges such as deforestation, soil erosion, and land-use changes [16]. Investigating these watersheds provides insights into their distinct land-use trajectories and their implications for sustainable ecosystem management.
Although ecological and spatial factors are fundamental to understanding land-use dynamics, socio-economic drivers also play a crucial role in shaping habitat quality. Agricultural policies, demographic changes, and food market dynamics significantly influence land-use decisions and, consequently, ecosystem health [17,18]. For example, government incentives promoting monoculture farming may accelerate deforestation, while policies supporting agroforestry can enhance habitat connectivity [19]. Similarly, population growth, climate change, and urban expansion can increase land pressure, leading to the conversion of forests and wetlands into agricultural or residential areas [20]. The fluctuating demand for food products in domestic and international markets also affects land-use intensity, with commodity price shifts driving deforestation or reforestation efforts [21].
Despite extensive studies on land-use change, there is still a lack of spatially explicit, future-oriented assessments that quantify the relationship between food provision and habitat quality [22,23]. This study seeks to fill this gap by using the TerrSet Land Change Modeler to project land-use scenarios up to 2050 and the InVEST model to assess habitat quality changes. By integrating land-use projections, food crop production analysis, and spatial modeling techniques, we aim to provide a comprehensive understanding of the trade-offs and synergies between these critical ecosystem services.
Thus, this study addresses the following question: “How do changes in land use and food production affect habitat quality in the Pagsanjan-Lumban and Baroro watersheds of the Philippines, and what are the trade-offs and synergies between these ecosystem services?”
By providing a spatially explicit assessment of land-use transitions and their ecosystem service implications, this research contributes to more informed land-use planning, helping policymakers and stakeholders develop strategies that balance agricultural development with biodiversity conservation [14].

2. Materials and Methods

2.1. The Study Area

This study considered two significant watershed areas in the Philippines (Figure 1). The Pagsanjan-Lumban Watershed (PLW) is a vital sub-watershed of the Laguna de Bay Basin, located in Laguna Province, Philippines. Covering 45,445 hectares, it supports key socio-economic activities, including agriculture, tourism, and hydropower generation. The watershed provides essential ecosystem services such as water regulation, soil conservation, and biodiversity support, hosting both endemic and threatened species [15]. However, it faces increasing threats from deforestation, urbanization, and agricultural expansion, leading to soil erosion, sedimentation, and water pollution.
The Baroro Watershed, located in La Union Province, northern Luzon, Philippines, spans approximately 19,063 hectares and is a vital socio-ecological landscape. The BW plays a crucial role in the region, serving as a primary water source for various municipalities [16]. The watershed’s diverse topography ranges from steep uplands to coastal plains, fostering rich biodiversity and essential ecosystem services. The watershed is crucial for rice farming, forestry, fisheries, and emerging eco-tourism industries [20,23]. However, it faces challenges such as deforestation, soil erosion, pollution, and climate change impacts. Ongoing conservation efforts include reforestation, agroforestry, and community-based water resource management, aimed at enhancing socio-ecological resilience and promoting sustainable land-use practices in the region.

2.2. Land-Use Land Cover Assessment

This study adopted a hybrid classification approach, combining machine learning-based supervised classification with post-classification refinement techniques to enhance accuracy. This study classified the LULC in the PLW and the BW for 2000, 2010, and 2020 (Figure 2). Digital preprocessing was performed using Google Earth Engine, where a combination of remotely sensed optical and radar images were filtered and processed. Landsat imagery served as the source for optical images, with temporal and spatial filtering and cloud masking applied to ensure accurate results. Additionally, radar data from ALOS PALSAR datasets were integrated into the analysis to understand the landscape dynamics accurately. Reference data points were collected through various means, including secondary maps, high-resolution satellite and aerial images, key informant interviews, and focus group discussions, all aimed at verifying and enhancing the quality of training and test data for land cover classification. The details were presented by [23].
The LULC classification phase involved using Random Forest (RF) classifiers, known for superior performance in multicategory classification [24]. Spectral indices were computed for the masked images, and spectral bands and vegetation indices were reduced into spectral–temporal and seasonal spectral–temporal composites to improve processing efficiency. Radiometric features from the ALOS PALSAR dataset and terrain-related attributes like slope and elevation were also incorporated as predictor variables [25]. To refine the classification results, a post-processing step applied a majority filter to reduce noise caused by misclassified pixels in the images [26]. This filter replaced pixel values with the most frequently occurring value within a local neighborhood, resulting in smoother and more reliable representations of land cover features.
This study evaluated model performance and accuracy through a hold-out validation approach, dividing the dataset into 80% for training and 20% for testing. Accuracy metrics, such as overall accuracy (OA) and Kappa coefficient, were utilized to gauge model performance [27,28]. Furthermore, hyperparameter tuning was conducted to enhance model performance by adjusting parameters like the number of trees and variables per split [29]. The optimized RF classifier achieved an OA of 0.93 and a Kappa coefficient of 0.9 for the PLW. In contrast, the RF classifier for the BW boasted an OA of 0.96 and a Kappa coefficient of 0.9.
Initially, the LULC classification for the BW explicitly defined categories such as built-up areas, fish ponds, open forests, grassland, annual crops, shrubland, and water bodies. Similarly, the PLW classification included built-up areas, perennial crops, closed forests, open forests, grassland, annual crops, shrubland, and water bodies. However, specific LULC categories were merged to improve classification accuracy and facilitate analysis of ecosystem service interactions. For instance, shrublands, open forests, and areas with perennial crops were grouped into ‘mixed agroforestry systems’ due to their shared ecological functions, such as providing habitat continuity and contributing to biodiversity conservation. This consolidation also helps address classification challenges associated with spectral similarity in remote sensing data and aligns with previous studies on landscape dynamics. The consolidated categories include built-up areas, closed forests, annual crops, mixed agroforestry systems, and water bodies (Table 1).

2.3. Projection of Land-Use Land Cover

TerrSet is a geospatial software suite offering diverse tools for effectively analyzing and managing LULC data [30]. One of its notable features is the Land Change Modeler (LCM), a tool designed to predict changes in LULC [31]. This study employed the CA–Markov model to predict future LULC changes up to 2050. This was achieved by calculating the transition probability of LULC between 2000 and 2010, which signifies the likelihood of a transition from one land-use type to another, and then using this information to project the spatial changes in LULC [32]. For producing simulations of LULC changes, it is essential to account for the potential influence of independent variables [33]. Both natural and human activities are primary drivers impacting LULC alterations, and the integration of biophysical, socioeconomic, and infrastructural factors is crucial for improving model accuracy and reliability [34].
This study considered driver variables, including topographic factors, distance-based metrics such as elevation, slope, proximity to roads, streams, and urban areas, and the use of evidence likelihood rasters following previous studies [35,36]. The proximity of rivers significantly enhances residents’ access to resources, thereby influencing changes in land use [37]. Additionally, the distance from roads and urban centers is a crucial driver of land-use changes [38,39]. Among anthropogenic factors, population density emerges as a key determinant associated with more frequent instances of land-use change [40].
Simultaneously, elevation, as a topographic factor, is recognized as a critical element driving LULC changes due to its influence on climate, vegetation types, and land-use suitability [41,42]. Furthermore, slopes play a substantial role in influencing LULC dynamics, with gentle slopes facilitating changes in land use [43,44]. Specifically, urban land expansion tends to occur more frequently on relatively flat slopes, while deforestation is less likely as the slope gradient increases [45]. To effectively consider the significant expansion of agriculture, it is important to incorporate an evidence likelihood variable [46]. This variable quantifies the likelihood of change occurring between agricultural land and other land classes at a specific pixel location [47].
This study used the 2020 LULC map to calibrate the model and leveraged the Cellular Automata -Markov transition data covering 2000 to 2010. These data were used to simulate the LULC map for the year 2020 and simulated with an overall accuracy of 89.95% and skill measure of 0.79 for BW and an overall accuracy of 88.82% and skill measure of 0.77 for PLW. After validating the model’s accuracy by comparing its predictions against observed LULC in 2020, this study conducted simulations to forecast LULC patterns for 2035 and 2050.

2.4. Habitat Quality Assessment

The InVEST habitat quality assessment model is a valuable tool for evaluating the state of habitat and vegetation types across a landscape, along with their levels of degradation [48]. This assessment relies on habitat quality and rarity as proxies for measuring biodiversity [49]. It considers four critical factors: the relative impact of threats, the sensitivity of each habitat type to these threats, the proximity of habitats to sources of threats, and the effectiveness of legal protection measures [50]. The model operates under the assumption that legal land protection is adequate and that all threats to a landscape are additive [51].
The InVEST habitat quality model comprises several key components that work together to assess habitat quality. These components encompass various habitat quality metrics, an LULC model for simulating land-use dynamics, a habitat suitability model, habitat quality weighting to prioritize aspects of habitat quality, and habitat quality mapping for visualization. Together, these components enable an understanding of habitat quality across a study area, aiding in identifying areas requiring conservation efforts. A detailed description of the model assumption and assessment can be read through the InVEST habitat quality model user guide [52].
This model accounts for various threat factors, including weight, maximum distance, and decay type, which are assigned based on empirical data or expert knowledge. Threat factor weights were determined based on their relative impact on habitat degradation, following previous studies and expert consultation [50,53,54]. For example, urban areas were assigned a higher weight (0.9) due to their irreversible land transformation and strong negative effects on biodiversity. In contrast, low-graded roads were given a lower weight (0.2) since their direct impact on habitat fragmentation is relatively limited. Similarly, high-graded roads (0.5) were weighted higher than rural settlements (0.5) due to their role in facilitating land conversion and human encroachment into natural areas (Table 2). This study considered threat factors of annual cropland, population density, urban area, rural settlement, and high-graded and low-graded roads.
The sensitivity of various LULC types to specific threat factors was assessed using a sensitivity scoring system ranging from 0 to 1, where 1 indicates high sensitivity and 0 indicates low sensitivity. This scoring approach was informed by existing research findings on land cover vulnerability to anthropogenic and environmental threats [55,56,57]. The sensitivity scores were assigned based on habitat characteristics, species richness, and susceptibility to human impacts [58]. For example, closed forests were given higher sensitivity scores due to their role as biodiversity hotspots and vulnerability to deforestation and habitat fragmentation [59]. In contrast, agricultural lands and urban areas were assigned lower sensitivity scores, reflecting their high level of human modification and reduced habitat suitability [60]. It is important to note that these dimensionless sensitivity scores serve as a relative measure of the vulnerability of different LULC types to specific threat factors, such as land conversion, pollution, and climate change impacts [61,62].

2.5. Crop Production Analysis

This study utilized crop production data from the Philippine Statistics Authority (PSA) OpenSTAT, which provides regional and provincial-level data on agricultural production across the Philippines. Since the PSA data were aggregated at administrative levels (province and region), it was necessary to downscale the crop production figures to the watershed level to enable more spatially precise analysis. To achieve this, this study employed a spatial disaggregation technique using land use and land cover (LULC) data as a key factor in allocating crop production values across watersheds.
The downscaling process involved integrating the national LULC map for 2020 produced by the Philippine National Mapping and Resource Information Authority (NAMRIA) with the watershed boundaries to distribute the provincial and regional crop production data proportionally based on the area of agricultural LULC within each watershed. In allocating crop production data to distinct LULC categories, this study initially categorized cereal crops such as palay (rice), corn, and other seasonal vegetables and herbs into the annual crops. Meanwhile, crops like banana, mango, peanut, coconut, and other fruit-bearing varieties were assigned to the mixed agroforestry system. The amalgamation of brush/shrubs, open forest, and perennial crop categories from the NAMRIA LULC was deemed necessary, given that farmers cultivated diverse crops in areas.
Furthermore, the total crop production data available at the provincial level for La Union and Laguna provinces were disaggregated to match the land use and LULC types within the BW and PLW. The disaggregation focused on two key LULC categories: annual crop areas and mixed agroforestry systems. To achieve this, the average crop yield per hectare was calculated for each province by dividing the total provincial crop production (metric tons) by the total agricultural area (hectares) in that province. This average yield value was then assigned to the corresponding LULC types in the watersheds.
The total food production for each watershed was calculated by multiplying the area size of each LULC type within the watershed by the average crop yield. The formula used for this estimation was as follows:
Total food production (tons) = Area of LULC type (ha) × Average yield (tons/ha)
This calculation provided an estimate of the total food production for both watersheds, based on the distribution of agricultural land across the annual crop and mixed agroforestry system areas. Finally, the calculated production data were used to generate spatial maps that illustrated the distribution of food production within the BW and PLW, offering a visual representation of food production potential at the watershed scale. The estimation of food crop production in this study focuses explicitly on land areas designated for annual crops and mixed agroforestry systems. No food crop production has been assumed in built-up, closed forest, and water LULC. This assumption is consistent across all years analyzed (2000, 2020, and 2050).

2.6. Calculation of the Correlation Between Food Production and Habitat Quality

This study investigated the correlation between food production and habitat quality to explore potential trade-offs or synergies between these two ecosystem services within the BW and PLW. The analysis was conducted using spatial sampling methods and statistical correlation techniques. To ensure a spatially representative sample, 2000 random sampling points were generated for the BW and 4000 points for the PLW using the “Create Random Points” tool within the Data Management toolbox of ArcGIS 10.8. The difference in the number of sampling points between the two watersheds accounted for their differences in area size, ensuring consistent point density across both study areas.
Once the random sampling points were established, the “Extract Multiple Values to Points” tool in ArcGIS was used to extract food production values (in tons/ha) from the spatial food production maps and habitat quality values (on a 0 to 1 scale) from the InVEST habitat quality model outputs. The extracted values at each sampling point provided the input dataset for the subsequent correlation analysis.
For the statistical analysis, the extracted service values were exported to a CSV file and processed in Python 3.10 using the SciPy library. Initially, Spearman’s rank correlation coefficient was intended, but to ensure a more robust analysis, this study employed the Pearson correlation coefficient instead, utilizing a two-tailed approach to test for both positive and negative relationships between food production and habitat quality. The Pearson coefficient was calculated using the SciPy function in Python, which returns both the correlation coefficient (r) and the p-value to assess statistical significance. A p-value threshold of 0.05 was used to determine whether the observed correlation was statistically significant.

3. Results

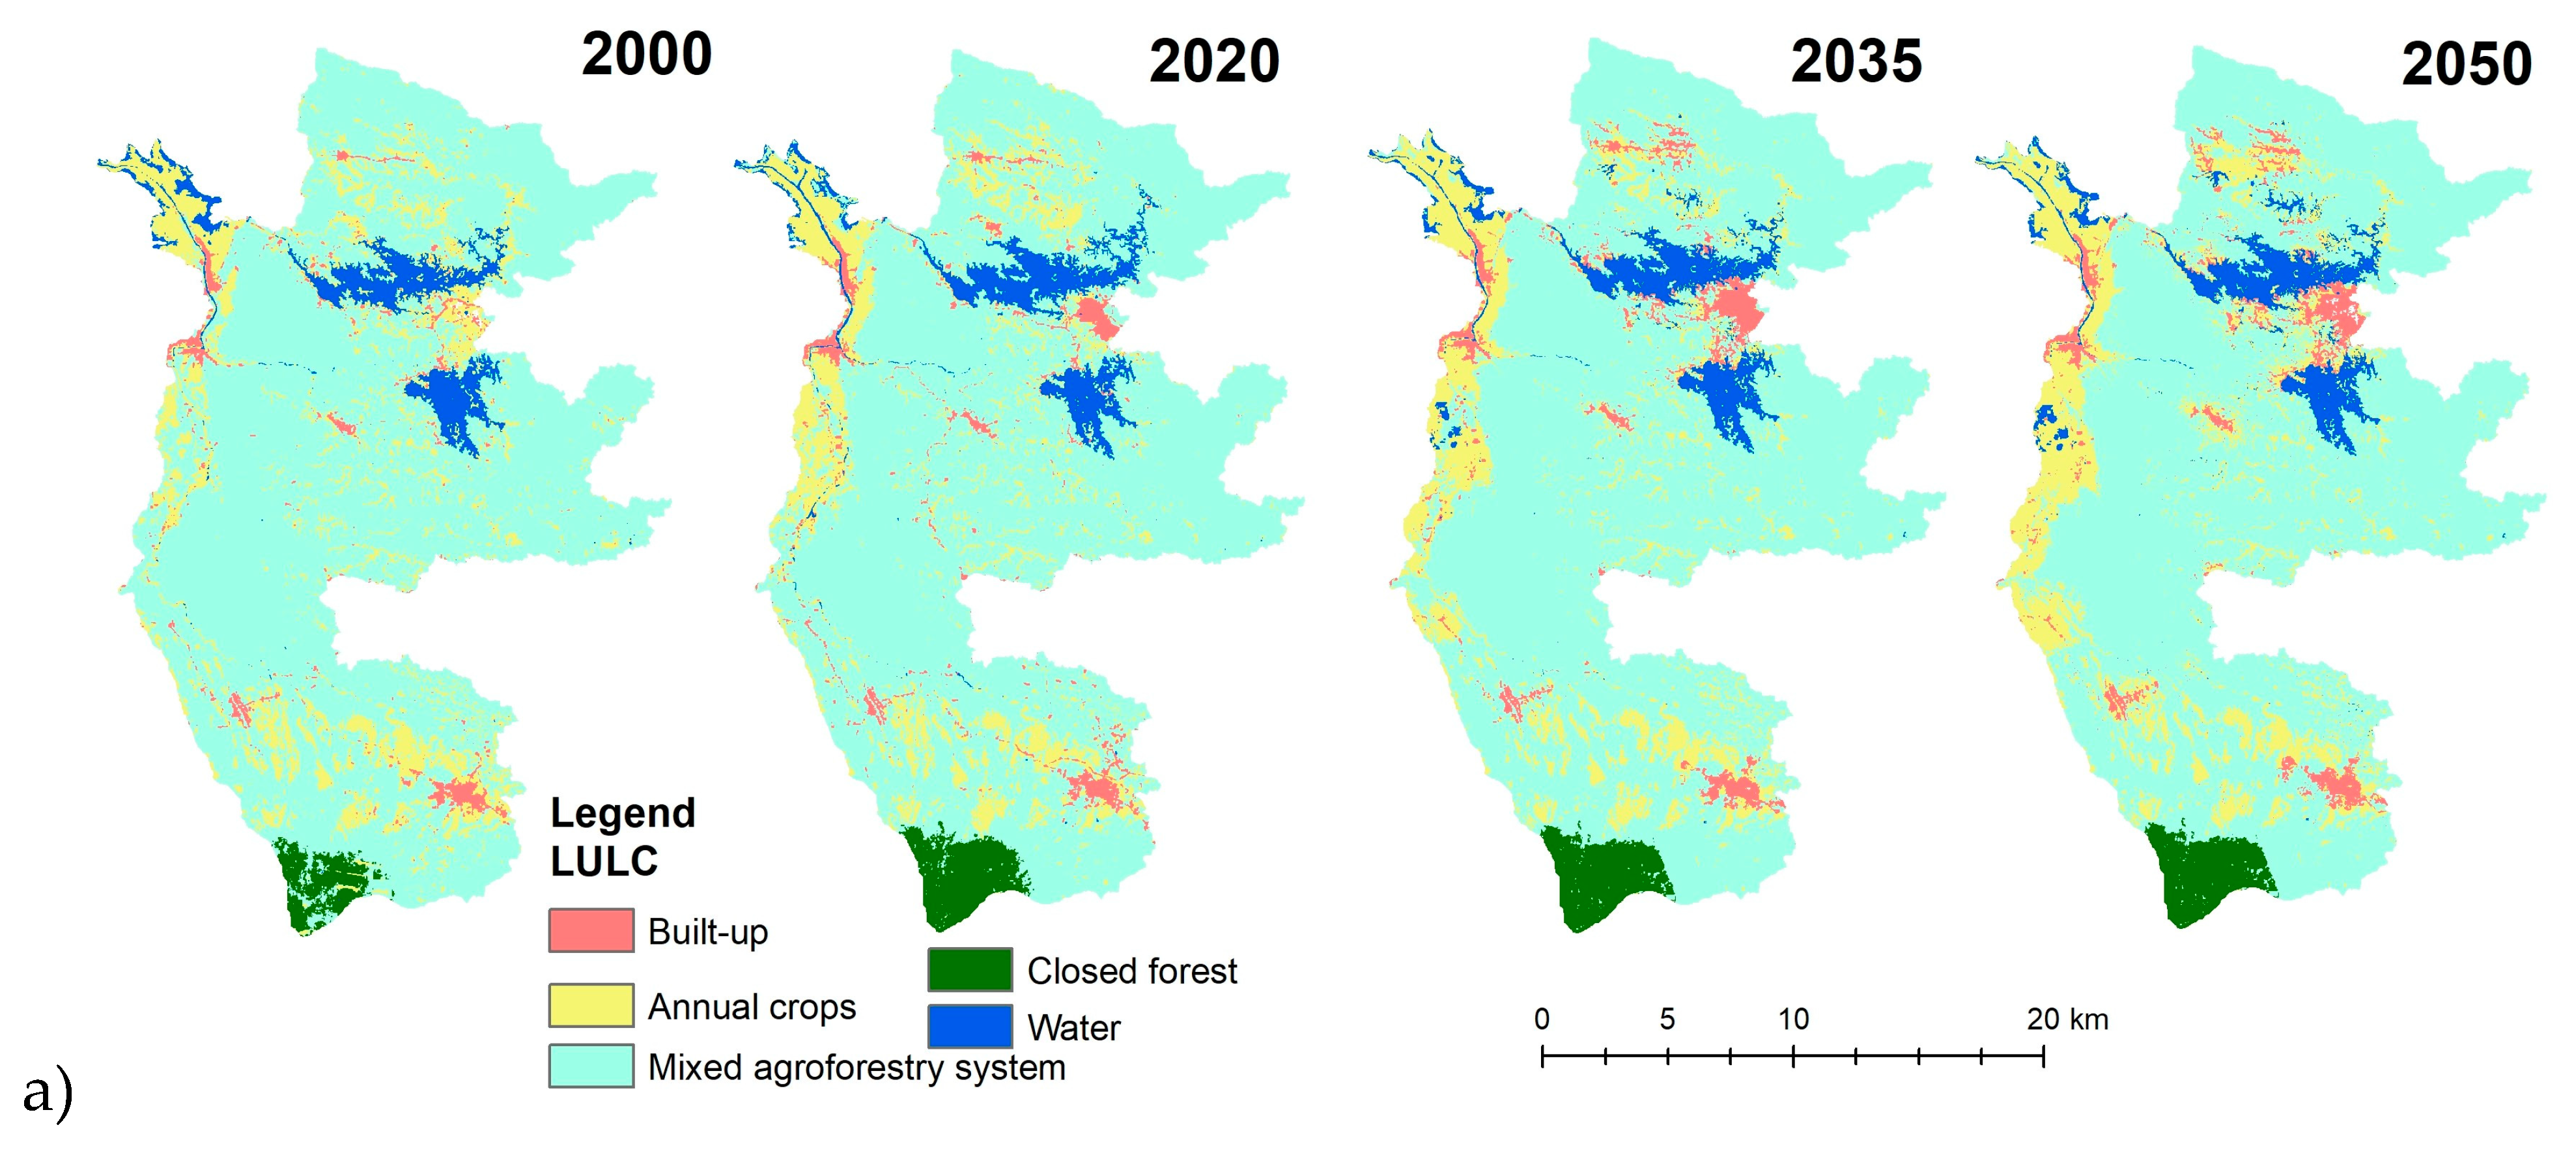
3.1. The Historical and Predicted LULC in PLW and BW

The historical and projected LULC trends are evident in the PLW and the BW (Table 3 and Figure 3). In the PLW, the coverage of annual crops decreased from 14.3% in 2000 to 12% in 2010, followed by a slight increase to 13% by 2020. Forecasts suggest a further rise to 13.2% in 2035, with a more substantial increase to 16.1% by 2050. Built-up areas expanded from 2% in 2000 to 3.1% in 2010, declining to 2.8% by 2020. Projections anticipate further increments to 3.3% in 2035 and 3.4% in 2050. Closed forests in the PLW expanded from 1.6% in 2000 to 2.8% in 2010, with a slight reduction to 2.7% by 2020. Forecasts indicate a continual rise to 2.8% in both 2035 and 2050. Mixed agroforestry systems, the predominant feature, comprised 77.7% in 2000, remaining relatively stable at 77.8% in 2010 and experiencing a slight decrease to 76.7% by 2020. Predictions suggest a further reduction to 76.1% in 2035, followed by a more pronounced decline to 72.8% by 2050. Water bodies, constituting 4.4% in 2000, exhibited a slight increase to 4.7% in 2020, with projections indicating a marginal decrease to 4.6% in 2035 and a subsequent rise to 4.9% by 2050.
In the BW, annual crops, constituting a substantial 34.4% in 2000, gradually reduced to 32.5% in 2020. Predictions anticipate a decline to 31.1% in 2035, followed by a marginal increase to 31.9% in 2050. Built-up areas, which began at a modest 0.9% in 2000, have consistently increased, reaching 1.7% in 2020. Forecasts suggest a notable escalation to 3.2% in 2035 and a further rise to 4.1% in 2050. Closed forests, representing 4.3% in 2000, have significantly decreased to 1.6% in 2020, with predictions indicating a continued reduction to 1.5% in 2035 and stabilization at 0.8% in 2050. The predominant land cover, mixed agroforestry systems, covered 59.9% of the BW in 2000, then witnessed an increase to 63.8% in 2020. Projections suggest a slight decrease to 63.7% in 2035 and a more notable decline to 62.6% by 2050. Water bodies, constituting a minimal 0.4% in 2000, have experienced a decrease to 0.3% in 2020. Forecasts indicate a slight increase to 0.6% in 2035, followed by a subsequent decrease to 0.5% in 2050.

3.2. Habitat Quality Assessment of PLW and BW

The changes in LULC in the PLW between the year 2000 and the projected 2050 values have varied impacts on habitat quality within the study area (Figure 4 and Figure 5a). Habitats falling under the “very low” quality range (0–0.2) constituted 34.8% in 2000, experienced a substantial reduction to 5.6% in 2020, and are anticipated to increase marginally to 6.1% by 2050. The “low” quality habitats (0.21–0.4) started at 49.9% in 2000, underwent a significant decrease to 21.4% in 2020, and are predicted to slightly rebound to 27.7% by 2050. “Moderate” quality habitats (0.41–0.6) began at 10.4% in 2000, rose to 28.1% in 2020, and are projected to increase to 30.4% by 2050. The “high” quality habitats (0.61–0.8) were initially at 4.1% in 2000 but exhibited a substantial increase to 32.2% in 2020 and are expected to decrease to 23.9% by 2050. Lastly, habitats in the “very high” quality range (0.81–0.99) started at 0.7% in 2000, rose to 12.8% in 2020, and are anticipated to decrease slightly to 11.9% by 2050.
Conversely, the overall habitat quality in the BW has demonstrated relative stability, showing a very modest increase from the year 2000 baseline until 2020, with further improvements expected by 2050. However, the habitat quality is predominantly distributed among deficient levels (0–0.2) and low levels (0.21–0.4) (Figure 5b). Notably, there has been a marginal enhancement in the low habitat quality level, with a decrease from 66.6% in 2000 to 66.3% in 2020 and a slight increase to 67.6% by 2050. Concurrently, the extent of moderate habitat quality (0.41–0.6) has remained relatively consistent, while the very high habitat quality levels (0.61–0.8) have experienced a marginal decline from 2000 to 2020, with a subsequent stabilization at 3.1% by 2050.
Habitat quality levels varied across various LULC categories and are expected to change differently over time across the two study areas (Table 4). For instance, in 2000, annual crops in the PLW had a habitat quality score of 0.2, indicating a relatively low habitat quality. Built-up areas had a slightly lower habitat quality of 0.1, suggesting a less favorable environment. Both mixed agroforestry systems and water areas scored 0.3, indicating moderate habitat quality. Closed forests exhibited a relatively higher habitat quality of 0.4 but are still within the moderate habitat quality range. By 2020, notable improvements in habitat quality were observed. Annual crops, closed forests, and water areas experienced increased habitat quality, reaching scores of 0.3, 0.8, and 0.5, respectively. Built-up areas showed a noteworthy improvement, increasing from 0.1 to 0.22. Mixed agroforestry systems also demonstrated improved habitat quality, increasing to 0.6, suggesting enhanced ecological conditions. Looking forward to 2050, habitat quality trends in the PLW continue to evolve. Closed forests remain relatively stable, with a high-quality score of 0.8. Mixed agroforestry systems maintain habitat quality at 0.6. Notably, annual crops exhibit a substantial improvement, reaching a habitat quality score of 0.3. However, built-up areas show a decline in habitat quality to 0.1.
In the BW, habitat quality is consistently absent for annual crops. Similarly, built-up areas exhibit a steady 0.1% habitat quality from 2000 to 2020, followed by a decline to 0% in 2050. The mixed agroforestry system demonstrates a gradual increase in habitat quality from 0.5% in 2000 to 0.7% in 2020, followed by a subsequent decrease to 0.4% in 2050. Closed forests experienced a decline from 0.2% in 2000 to 0.1% in 2020, with a slight recovery to 0.2% in 2050. Water areas show an increase in habitat quality from 0.1% in 2000 to 0.2% in 2020, maintaining this level at 0.1% in 2050.

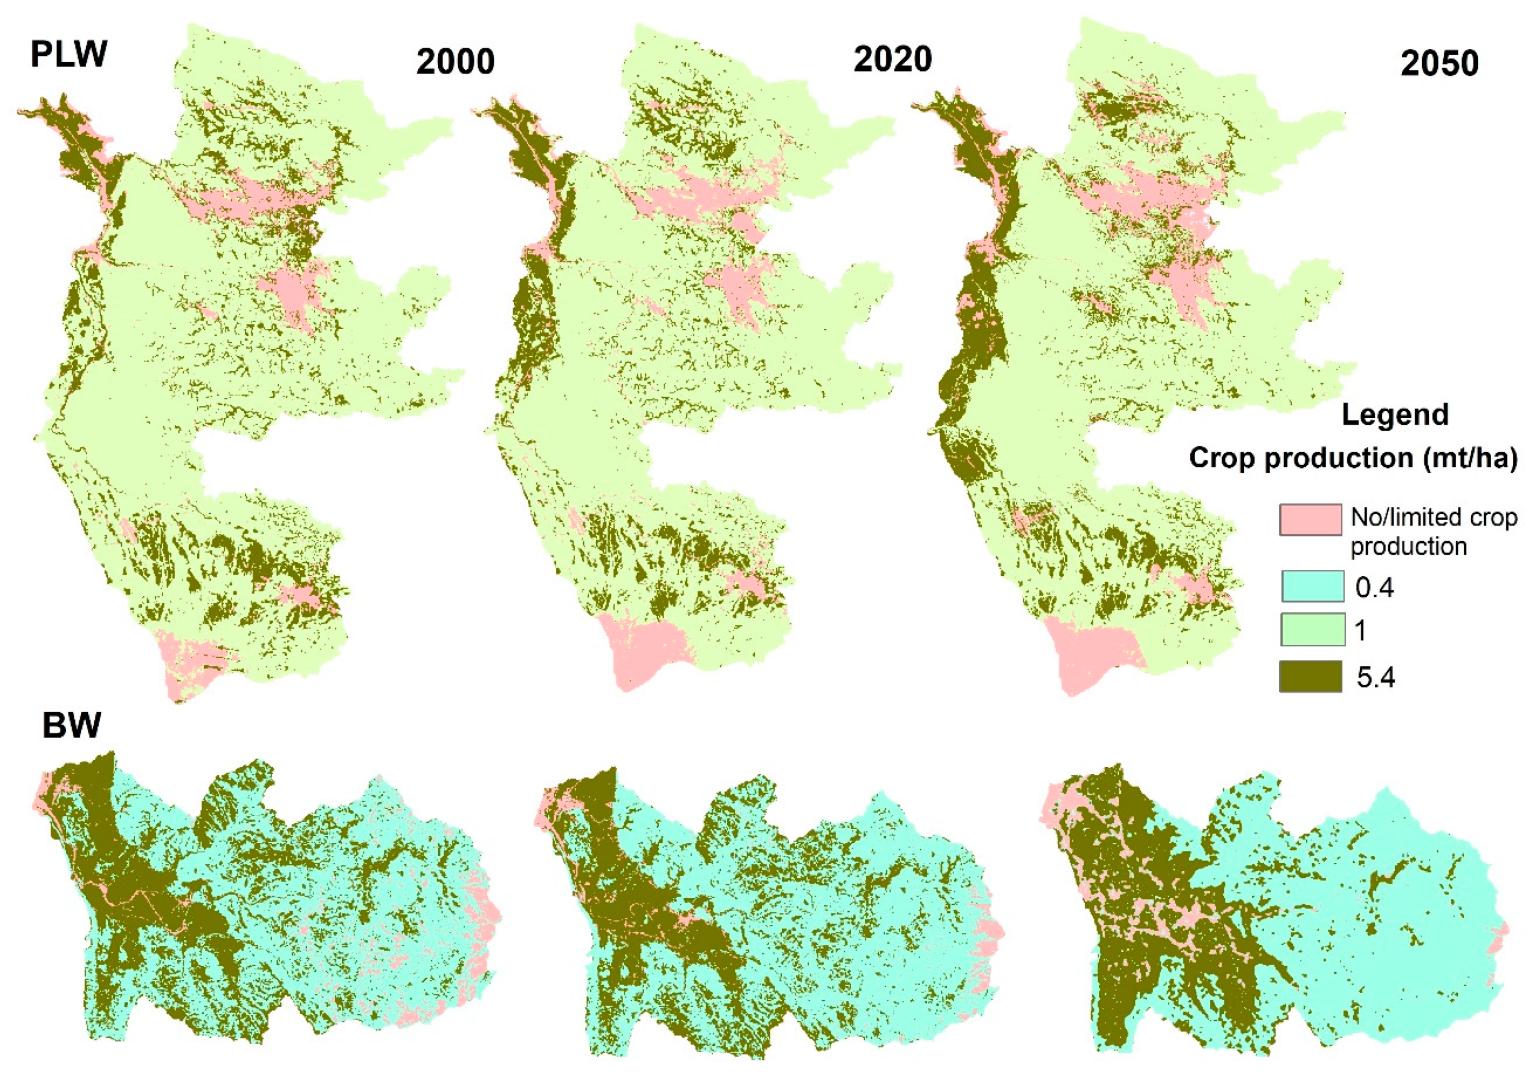
3.3. Food Production

In the PLW, food production is characterized by varying yields at different years (Table 5 and Figure 6). In the year 2000, the mean food crop production for annual crops is recorded at 5.4 metric tons per hectare (Mt ha−1), with specific yields for production types such as 32,081 Mt for 2000, 29,279 Mt for 2020, and 36,131 Mt for 2050. In the mixed agroforestry system category, the mean food crop production is 1 Mt ha−1, with corresponding yields of 32,300 Mt, 31,883 Mt, and 30,249 Mt for 2000, 2020, and 2050, respectively.
In the BW, annual crops exhibit a mean food production of 5.4 Mt ha−1, resulting in 36,050 Mt, 34,009 Mt, and 33,442 Mt for 2000, 2020, and 2050, respectively (Table 5 and Figure 6). In the mixed agroforestry system of the BW, the mean food crop production is 0.4 Mt ha−1, leading to yields of 4643 Mt, 4952 Mt, and 4860 Mt for the same respective years. Additionally, the total production, encompassing annual crops and mixed agroforestry systems, is summarized as 40,694 Mt in 2000, 38,962 Mt in 2020, and 38,302 Mt in 2050 for the BW.

3.4. Trade-Offs and Synergies Between Food Provision and Habitat Quality

The correlation analysis of the food provision and habitat quality data for 2000, 2020, and 2050 reveal nuanced relationships in the PLW (Table 6). In 2000, a weak negative correlation was identified between food provision and habitat quality, implying a slight decrease in habitat quality as food provision increases. However, this correlation did not reach statistical significance at the conventional threshold of 0.05. Moving to the year 2020, a statistically significant weak negative correlation was observed, indicating that as food provision increases during this period, there is a slight tendency for habitat quality to decrease. Conversely, in the year 2050, a very weak negative correlation was found in the PLW, suggesting a subtle decrease in habitat quality with increased food provision. However, this correlation did not attain statistical significance. Overall, the interaction between food provision and habitat quality over time suggests a trade-off in the PLW.
The inverse was observed for the BW (Table 6). In 2000, there was a statistically significant positive correlation between food provision and habitat quality, indicating that an increase in food provision coincided with an improvement in habitat quality during this period. This positive correlation did not persist in 2020; although the correlation coefficient had decreased to 0.0267, it was not statistically significant. However, in 2050, a substantial positive correlation was observed, indicating that an increase in food provision is strongly associated with an enhancement in habitat quality. These results suggest a dynamic and evolving relationship between food provision and habitat quality in the BW over the three analyzed time points.

4. Discussion

4.1. Land-Use Dynamics

Exploring the dynamics of LULC in the Pagsanjan-Lumban and Baroro watersheds provides valuable insights into the evolving landscapes. The trends reveal notable shifts in land categories, with specific land uses, like mixed agroforestry systems, demonstrating resilience, while others indicate evolving land-use patterns. Previous studies have generated similar results, particularly in the BW [16,22]. The observed changes in LULC, such as the gradual expansion of built-up areas, alterations in agricultural practices, and shifts in natural ecosystems, indicate ongoing processes like urbanization, agricultural intensification, and ecosystem fragmentation [63].
The differences in LULC trends between the PLW and the BW underscore the diverse socio-economic contexts and environmental challenges influencing land-use patterns over time. Factors such as proximity to urban centers, access to infrastructure, land tenure systems, and agroecological conditions can result in distinct LULC dynamics between landscapes [64]. Variations in policy interventions and governance frameworks can also shape land-use decisions and outcomes [65].
Understanding these dynamics is important for effective land-use planning, natural resource management, and sustainable development [66]. Integrated approaches considering socio-economic, environmental, and governance dimensions are needed to address the complex drivers of land-use change and mitigate its adverse impacts on ecosystems and livelihoods [67,68]. Moreover, community participation and stakeholder engagement are essential for fostering inclusive decision-making processes and promoting sustainable land-use practices [69].

4.2. Habitat Quality and Food Production Assessment

Assessing habitat quality provides insight into the ecological resilience of the PLW and the BW regions. Spatial and temporal variations in habitat quality highlight the diverse environmental conditions and impacts of land-use changes on ecosystem services [70]. While certain land cover types, such as mixed agroforestry systems, exhibit enhanced habitat quality due to sustainable land management [71], others, like built-up areas, experience declines, reflecting the negative effects of urbanization and infrastructure expansion [72]. The consistency of high-quality scores in forests underscores the critical need to shield these areas from conservation efforts to protect them from human disturbances and land conversions [73].
Effective land-use management is essential to mitigate habitat degradation and biodiversity loss. It is crucial to prioritize the protection of high-quality habitats, such as closed forests and water areas, alongside measures like protected area designation, land-use zoning, and sustainable land management [74]. Continuous monitoring enables evaluating management strategies and identifying areas requiring conservation and restoration interventions [75]. Targeted conservation intervention efforts informed by habitat quality assessments can enhance biodiversity and ecosystem functions.
Stakeholder engagement and adaptable management play a key role in safeguarding natural habitats. Integrated watershed management strategies and payment for ecosystem services programs have proven effective in improving habitat quality and promoting sustainable land use [76,77,78]. These approaches offer valuable frameworks for guiding conservation efforts in the PLW and the BW regions.
Food production assessments provide insights into a key provisioning ecosystem service. Given data limitations, provincial-level crop production was disaggregated into annual crops and mixed agroforestry systems, which are central to food production in these watersheds. Production trends exhibit fluctuations influenced by climate variability, land-use changes, and agricultural practices [79,80,81].
Adaptive agricultural strategies are essential for balancing food security with ecosystem sustainability. While food crop production remains substantial, variations highlight the complex interactions between land use, agroecological conditions, and socio-economic factors. Promoting sustainable farming practices is essential. These practices can help mitigate risks to biodiversity, soil fertility, and water quality, ensuring food security while minimizing environmental impacts and ensuring long-term food security.

4.3. Managing the Trade-Offs and Synergies Between Food Production and Habitat Conservation for Sustainable Coexistence

Trade-offs and synergies between food production and habitat conservation are complex and multifaceted, influenced by various factors such as land-use practices, ecosystem dynamics, and socio-economic contexts [82]. For the PLW, the correlation between food provision and habitat quality is shaped by multiple factors [83,84]. A statistically significant positive correlation in the BW strengthens over time, indicating potential harmonization and suggesting greater alignment between food provision and habitat quality. Home garden agroforestry systems in both watersheds demonstrate a positive correlation, as they promote soil health, reduce chemical inputs, and enhance biodiversity, reinforcing the potential synergy between agriculture and conservation [85,86].
However, trade-offs between food production and habitat conservation arise, particularly where annual crop production encroaches on agroforestry systems or natural habitats. Identifying these trade-offs highlights the importance of integrated land management approaches that balance socio-economic development objectives and environmental conservation priorities [87].
Landscape management strategies in the PLW and the BW differ due to variations in land-use intensity, ecological conditions, and governance frameworks [88]. The PLW is characterized by mixed agroforestry systems, which are gradually declining due to increasing annual crop expansion, posing risks to habitat quality. To address this, sustainable intensification—through agroecological farming and biodiversity-friendly agriculture—can help maintain food security while preventing excessive land conversion. Conversely, BW follows a structured conservation approach, supported by expanding agroforestry coverage and agroecological zoning, which enhances habitat quality. However, rapid urbanization and deforestation present major threats, with built-up areas projected to quadruple and forests expected to decline sharply by 2050. Effective strategies for the BW should focus on limiting urban expansion, promoting reforestation, and strengthening conservation incentives to counteract environmental degradation.
Despite these differences, both watersheds require adaptive land management approaches integrating conservation with food production. The PLW would benefit from incentives for agroforestry and sustainable farming to prevent further habitat loss, while the BW should reinforce its conservation zoning and reforestation efforts to mitigate urban sprawl and forest decline. Both watersheds can enhance landscape sustainability and resilience by sharing best practices—such as conservation-friendly farming in the PLW and reforestation programs in the BW.
Achieving sustainable coexistence between food production and habitat conservation requires ongoing monitoring, evaluation, and adaptive management [89]. Collaborative engagement among stakeholders—including farmers, policymakers, scientists, and local communities—is essential to developing land-use strategies that reconcile competing objectives [90,91,92,93]. Integrated landscape planning, participatory decision-making processes, and incentive mechanisms can help ensure that both food security and biodiversity conservation are sustained [94,95].
Global experiences offer valuable lessons for balancing economic development with ecological preservation [96]. Sustainable land management models, such as agroforestry initiatives in sub-Saharan Africa and community-led conservation in Costa Rica, demonstrate the importance of local engagement in conservation efforts [97,98]. Implementing climate-resilient conservation strategies—such as habitat quality modeling and habitat connectivity conservation—can safeguard biodiversity [99,100]. These strategies should align with international sustainability targets, including SDG 15 and the Kunming-Montreal Global Biodiversity Framework, to ensure long-term environmental resilience.

4.4. Uncertainties and Limitations of This Study

This study acknowledges limitations that may affect its findings. LULC classification relied on Landsat imagery, which may not capture fine-scale land-use changes, especially in heterogeneous agroforestry landscapes. ALOS PALSAR radar data were integrated to mitigate this, though signal scattering can introduce errors in detecting specific land transitions. Future studies could improve accuracy using higher-resolution datasets like Sentinel-2 or PlanetScope. Land-use projections using the TerrSet model assume that past trends will continue, potentially overlooking abrupt policy or economic shifts. Similarly, the InVEST model assumes additive threat impacts and does not fully capture habitat connectivity effects. Sensitivity scores for LULC types, though informed by literature and expert input, remain somewhat subjective. The food production analysis assumes uniform yield distribution, which may not reflect variations in soil quality, irrigation access, and farming techniques. Future work should incorporate localized agricultural data for improved accuracy. Despite these limitations, the integration of multi-source data and spatial modeling provides valuable insights into land-use dynamics and ecosystem trade-offs.

5. Conclusions

This study assesses land-use dynamics, habitat quality, and food provision in the PLW and the BW, revealing shifts in land cover, habitat quality trends, and food production variations. The PLW shows a weak negative correlation between food provision and habitat quality, suggesting trade-offs, while the BW exhibits a positive correlation, indicating potential synergies. These findings emphasize the need for targeted land management strategies to balance food security with biodiversity conservation.
To address these challenges, agroforestry-based land-use strategies should be promoted, with PLW requiring incentives for sustainable agroforestry to mitigate habitat loss, while BW should strengthen conservation incentives to sustain agroforestry growth. Conservation zoning and land-use planning are also critical, with the PLW needing buffer zones and ecological corridors to protect high-quality habitats, while the BW must regulate urban expansion to prevent excessive land conversion. Additionally, climate-resilient agricultural practices—such as soil conservation, water-efficient irrigation, and diversified cropping systems—should be adopted to maintain productivity without degrading ecosystems.
Strengthening community-led conservation efforts is essential, ensuring active participation from farmers, policymakers, and conservation groups in decision-making processes. Finally, continuous monitoring through spatial modeling and remote sensing should be integrated into land management policies to provide empirical data-driven, adaptive solutions.
In conclusion, integrated land-use planning, agroforestry incentives, and conservation zoning are essential for ensuring sustainable bioproduction landscapes in the PLW and the BW. Decision makers should implement targeted interventions that balance economic and ecological priorities, fostering resilience in both food systems and natural ecosystems.

Author Contributions

Conceptualization, M.S. and O.S.; methodology, M.S. and N.R.A.; software, M.S. and N.R.A.; validation, M.S. and N.R.A.; formal analysis, M.S.; investigation, M.S.; resources, O.S.; data curation, M.S.; writing—original draft preparation, M.S.; writing—review and editing, M.S., N.R.A., S.A.L., C.L.T.J., J.M.P. and O.S.; visualization, M.S.; supervision, O.S.; project administration, O.S., M.S. and S.A.L.; funding acquisition, O.S. All authors have read and agreed to the published version of the manuscript.

Funding

Japan Science and Technology (e-ASIA JRP) with a Grant Number JPMJSC20E6 and the Philippine Council for Agriculture, Aquatic and Natural Resources Research and Development (PCAARRD) of the Department of Science and Technology (DOST).

Data Availability Statement

The data used for the analysis in this study can be made available upon reasonable request.

Acknowledgments

This study has been conducted as a part of the project “Integration of Traditional and Modern Bioproduction System for a Sustainable and Resilient Future under Climate and Ecosystem Changes (ITMoB)” under the e-ASIA Joint Research Program (e-ASIA JRP). We thank the financial providers, ITMoB project members, and local policymakers for their valuable feedback and contributions.

Conflicts of Interest

The authors declare no conflicts of interest with respect to the research, authorship, and/or publication of this article.

References

  1. Niesenbaum, R.A. The Integration of Conservation, Biodiversity, and Sustainability. Sustainability 2019, 11, 4676. [Google Scholar] [CrossRef]
  2. Millennium Ecosystem Assessment (MA). Ecosystems and Human Well-Being: Biodiversity Synthesis; World Resources Institute: Washington, DC, USA, 2005. [Google Scholar]
  3. Haddad, N.M.; Brudvig, L.A.; Clobert, J.; Davies, K.F.; Gonzalez, A.; Holt, R.D.; Lovejoy, T.E.; Sexton, J.O.; Austin, M.P.; Collins, C.D.; et al. Habitat fragmentation and its lasting impact on Earth’s ecosystems. Sci. Adv. 2015, 1, e1500052. [Google Scholar] [CrossRef] [PubMed]
  4. Pollock, L.J.; Thuiller, W.; Jetz, W. Large conservation gains possible for global biodiversity facets. Nature 2017, 546, 141–144. [Google Scholar] [CrossRef] [PubMed]
  5. Folke, C.; Polasky, S.; Rockström, J.; Galaz, V.; Westley, F.; Lamont, M.; Scheffer, M.; Österblom, H.; Carpenter, S.R.; Chapin, F.S.; et al. Our future in the Anthropocene biosphere. AMBIO 2021, 50, 834–869. [Google Scholar] [CrossRef]
  6. Kumi, S.; Addo-Fordjour, P.; Fei-Baffoe, B.; Belford, E.J.; Ameyaw, Y. Land use land cover dynamics and fragmentation-induced changes in woody plant community structure in a mining landscape, Ghana. Trees For. People 2021, 4, 100070. [Google Scholar] [CrossRef]
  7. Stokes, A.; Bocquého, G.; Carrere, P.; Salazar, R.C.; Deconchat, M.; Garcia, L.; Gardarin, A.; Gary, C.; Gaucherel, C.; Gueye, M.; et al. Services provided by multifunctional agroecosystems: Questions, obstacles and solutions. Ecol. Eng. 2023, 191, 106949. [Google Scholar] [CrossRef]
  8. Lahoti, S.A.; Withaningsih, S.; Lomente, L.; Kamiyama, C.; De Luna, C.; Sahle, M.; Malik, A.D.; Parikesit, P.; Pulhin, J.; Hashimoto, S.; et al. Exploring bioproduction systems in socio-ecological production landscapes and seascapes in Asia through solution scanning using the Nature Futures Framework. Sustain. Sci. 2023, 1–19. [Google Scholar] [CrossRef]
  9. Torralba, M.; Nishi, M.; Cebrián-Piqueras, M.A.; Quintas-Soriano, C.; García-Martín, M.; Plieninger, T. Disentangling the practice of landscape approaches: A Q-method analysis on experiences in socio-ecological production landscapes and seascapes. Sustain. Sci. 2023, 18, 1893–1906. [Google Scholar] [CrossRef]
  10. Reynolds, T.W.; Waddington, S.R.; Anderson, C.L.; Chew, A.; True, Z.; Cullen, A. Environmental impacts and constraints associated with the production of major food crops in Sub-Saharan Africa and South Asia. Food Secur. 2015, 7, 795–822. [Google Scholar] [CrossRef]
  11. Çakmakçı, R.; Salık, M.A.; Çakmakçı, S. Assessment and Principles of Environmentally Sustainable Food and Agriculture Systems. Agriculture 2023, 13, 1073. [Google Scholar] [CrossRef]
  12. Muhie, S.H. Novel approaches and practices to sustainable agriculture. J. Agric. Food Res. 2022, 10, 100446. [Google Scholar] [CrossRef]
  13. Landis, D.A. Designing agricultural landscapes for biodiversity-based ecosystem services. Basic Appl. Ecol. 2017, 18, 1–12. [Google Scholar] [CrossRef]
  14. Colucci, A. Resilience Practices Contribution Enabling European Landscape Policy Innovation and Implementation. Land 2023, 12, 637. [Google Scholar] [CrossRef]
  15. Arceo, M.G.A.S.; Cruz, R.V.O.; Tiburan, C.L., Jr.; Balatibat, J.B.; Alibuyog, N.R. Modeling the hydrologic responses to land cover and climate changes of selected watersheds in the Philippines using Soil and Water Assessment Tool (SWAT) model. DLSU Bus. Econ. Rev. 2018, 28, 84–101. [Google Scholar]
  16. Ramirez, M.A.M.; Pulhin, J.M.; Garcia, J.E.; Tapia, M.A.; Pulhin, F.B.; Cruz, R.V.O.; De Luna, C.C.; Inoue, M. Landscape Fragmentation, Ecosystem Services, and Local Knowledge in the Baroro River Watershed, Northern Philippines. Resources 2019, 8, 164. [Google Scholar] [CrossRef]
  17. El Bilali, H.; Strassner, C.; Ben Hassen, T. Sustainable Agri-Food Systems: Environment, Economy, Society, and Policy. Sustainability 2021, 13, 6260. [Google Scholar] [CrossRef]
  18. Flores, J.J.M.; Inocencio, E.B., Jr. The structure of permaculture landscapes in the Philippines. Biodivers. J. Biol. Divers. 2021, 22, 2032–2044. [Google Scholar] [CrossRef]
  19. Natori, Y.; Hino, A. Global identification and mapping of socio-ecological production landscapes with the Satoyama Index. PLoS ONE 2021, 16, e0256327. [Google Scholar] [CrossRef]
  20. Pulhin, J.M.; Tapia-Villamayor, M.A.; Garcia, J.E.; De Luna, C.C.; Cruz RV, O.; Pulhin, F.B.; Ramirez MA, M. Participatory Climate Change Adaptation Using Watershed Approach: Processes and Lessons from the Philippines. In Interlocal Adaptations to Climate Change in East and Southeast Asia; Springer: Cham, Switzerland, 2022. [Google Scholar] [CrossRef]
  21. Javaid, M.; Haleem, A.; Singh, R.P.; Suman, R. Enhancing smart farming through the applications of Agriculture 4.0 technologies. Int. J. Intell. Netw. 2022, 3, 150–164. [Google Scholar] [CrossRef]
  22. Encisa-Garcia, J.; Pulhin, J.; Cruz, R.V.; Simondac-Peria, A.; Ramirez, M.A.; De Luna, C. Land Use/Land Cover Changes Assessment and Forest Fragmentation Analysis in the Baroro River Watershed, La Union, Philippines. J. Environ. Sci. Manag. 2020, 2, 14–27. [Google Scholar] [CrossRef]
  23. Almarines, N.R.; Hashimoto, S.; Pulhin, J.M.; Tiburan, C.L.; Magpantay, A.T.; Saito, O. Influence of Image Compositing and Multisource Data Fusion on Multitemporal Land Cover Mapping of Two Philippine Watersheds. Remote Sens. 2024, 16, 2167. [Google Scholar] [CrossRef]
  24. Chen, R.-C.; Dewi, C.; Huang, S.-W.; Caraka, R.E. Selecting critical features for data classification based on machine learning methods. J. Big Data 2020, 7, 1–26. [Google Scholar] [CrossRef]
  25. Clewley, D.; Whitcomb, J.; Moghaddam, M.; McDonald, K.; Chapman, B.; Bunting, P. Evaluation of ALOS PALSAR Data for High-Resolution Mapping of Vegetated Wetlands in Alaska. Remote Sens. 2015, 7, 7272–7297. [Google Scholar] [CrossRef]
  26. He, J.; Huang, J.; Li, C. The evaluation for the impact of land use change on habitat quality: A joint contribution of cellular automata scenario simulation and habitat quality assessment model. Ecol. Model. 2017, 366, 58–67. [Google Scholar] [CrossRef]
  27. Verma, P.; Padghan, S.; Prakash, R. Land Use Land Cover Change Detection Using Random Forest Classifier. J. Environ. Manag. 2020, 242, 164–176. [Google Scholar]
  28. Chicco, D.; Warrens, M.J.; Jurman, G. The coefficient of determination R2 and its adjustments. Biometrics 2021, 77, 654–662. [Google Scholar] [CrossRef]
  29. Yang, X.; Cervone, G. Hyperparameter tuning in Random Forest for land use classification using remote sensing data. Geosci. Front. 2019, 10, 1481–1492. [Google Scholar] [CrossRef]
  30. Eastman, J.R. TerrSet Geospatial Monitoring and Modeling System: Manual; Clark Labs, Clark University: Worcester, MA, USA, 2016. [Google Scholar]
  31. Singh, S.K.; Srivastava, P.K.; Gupta, M.; Thakur, J.K. Modelling Land Use Land Cover Change Using Earth Observation Data: A Review of Techniques and Tools. Earth Syst. Environ. 2020, 4, 119–132. [Google Scholar] [CrossRef]
  32. Keshtkar, H.; Voigt, W. A spatiotemporal analysis of landscape change using an integrated Markov chain and cellular automata models. Model. Earth Syst. Environ. 2015, 2, 1–13. [Google Scholar] [CrossRef]
  33. Gharaibeh, A.; AbdelMoty, A.; Bandaru, V. Incorporating environmental variables for better predictions in land use and land cover change models. J. Environ. Manag. 2020, 262, 110349. [Google Scholar] [CrossRef]
  34. Musa, Z.N.; Ahmed, A.; Abubakar, I.R.; Bala, A. Modeling urban growth and land use changes using geospatial tools: A review. Land Use Policy 2022, 113, 105880. [Google Scholar] [CrossRef]
  35. Sahle, M.; Saito, O.; Fürst, C.; Demissew, S.; Yeshitela, K. Future land use management effects on ecosystem services under different scenarios in the Wabe River catchment of Gurage Mountain chain landscape, Ethiopia. Sustain. Sci. 2018, 14, 175–190. [Google Scholar] [CrossRef]
  36. Girma, R.; Fürst, C.; Moges, A. Land use land cover change modeling by integrating artificial neural network with cellular Automata-Markov chain model in Gidabo river basin, main Ethiopian rift. Environ. Challenges 2022, 6, 100419. [Google Scholar] [CrossRef]
  37. Leta, M.K.; Demissie, T.A.; Tränckner, J. Modeling and Prediction of Land Use Land Cover Change Dynamics Based on Land Change Modeler (LCM) in Nashe Watershed, Upper Blue Nile Basin, Ethiopia. Sustainability 2021, 13, 3740. [Google Scholar] [CrossRef]
  38. Kim, Y.; Newman, G.; Güneralp, B. A Review of Driving Factors, Scenarios, and Topics in Urban Land Change Models. Land 2020, 9, 246. [Google Scholar] [CrossRef]
  39. Chowdhury, M.; Hasan, M.E.; Abdullah-Al-Mamun, M.M. Land use/land cover change assessment of Halda watershed using remote sensing and GIS. Egypt. J. Remote Sens. Space Sci. 2020, 23, 63–75. [Google Scholar] [CrossRef]
  40. Zhang, C.; Wang, Z.; Wang, Q.; Yang, C. Interaction of population density and slope will exacerbate spatiotemporal changes in land use and landscape patterns in mountain city. Sci Rep. 2025, 15, 3168. [Google Scholar] [CrossRef]
  41. Huang, C.; Yang, L.; Homer, C.G. The role of topography in land cover change detection: Elevation, slope, and aspect effects. Remote Sens. Environ. 2019, 230, 111207. [Google Scholar] [CrossRef]
  42. Huang, J.; Tang, Z.; Liu, D.; He, J. Ecological response to urban development in a changing socio-economic and climate context: Policy implications for balancing regional development and habitat conservation. Land Use Policy 2020, 97, 104772. [Google Scholar] [CrossRef]
  43. Gharaibeh, A.; Shaamala, A.; Obeidat, R.; Al-Kofahi, S. Improving land-use change modeling by integrating ANN with Cellular Automata-Markov Chain model. Heliyon 2020, 6, e05092. [Google Scholar] [CrossRef]
  44. Zhang, D.; Liu, X.; Wu, X.; Yao, Y.; Wu, X.; Chen, Y. Multiple intra-urban land use simulations and driving factors analysis: A case study in Huicheng, China. GIScience Remote Sens. 2018, 56, 282–308. [Google Scholar] [CrossRef]
  45. Wang, S.W.; Munkhnasan, L.; Lee, W.-K. Land use and land cover change detection and prediction in Bhutan’s high altitude city of Thimphu, using cellular automata and Markov chain. Environ. Chall. 2020, 2, 100017. [Google Scholar] [CrossRef]
  46. Toma, M.B.; Belete, M.D.; Ulsido, M.D. Historical and future dynamics of land use land cover and its drivers in Ajora-Woybo watershed, Omo-Gibe basin, Ethiopia. Nat. Resour. Model. 2023, 36, e12353. [Google Scholar] [CrossRef]
  47. Eastman, J.R. TerrSet Tutorial, Geospatial Monitoring and Modeling System; Clark University: Worcester, MA, USA, 2016. [Google Scholar]
  48. Terrado, M.; Sabater, S.; Chaplin-Kramer, B.; Mandle, L.; Ziv, G.; Acuña, V. Model development for the assessment of terrestrial and aquatic habitat quality in conservation planning. Sci. Total. Environ. 2016, 540, 63–70. [Google Scholar] [CrossRef]
  49. Liu, S.; Liao, Q.; Xiao, M.; Zhao, D.; Huang, C. Spatial and Temporal Variations of Habitat Quality and Its Response of Landscape Dynamic in the Three Gorges Reservoir Area, China. Int. J. Environ. Res. Public Health 2022, 19, 3594. [Google Scholar] [CrossRef] [PubMed]
  50. Aneseyee, A.B.; Noszczyk, T.; Soromessa, T.; Elias, E. The InVEST Habitat Quality Model Associated with Land Use/Cover Changes: A Qualitative Case Study of the Winike Watershed in the Omo-Gibe Basin, Southwest Ethiopia. Remote Sens. 2020, 12, 1103. [Google Scholar] [CrossRef]
  51. Chu, L.; Sun, T.; Wang, T.; Li, Z.; Cai, C. Evolution and Prediction of Landscape Pattern and Habitat Quality Based on CA-Markov and InVEST Model in Hubei Section of Three Gorges Reservoir Area (TGRA). Sustainability 2018, 10, 3854. [Google Scholar] [CrossRef]
  52. Sharp, R.P.; Douglass, J.; Wolny, S.; Arkema, K.K.; Bernhardt, J.; Bierbower, W.; Chaumont, N.; Denu, D.; Fisher, D.; Glowinski, K.; et al. InVEST 3.4.4 User’s Guide; 2018; Stanford University, University of Minnesota, The Nature Conservancy, World Wildlife Fund, The Natural Capital Project. [Google Scholar]
  53. Yohannes, H.; Soromessa, T.; Argaw, M.; Dewan, A. Spatio-temporal changes in habitat quality and linkage with landscape characteristics in the Beressa watershed, Blue Nile basin of Ethiopian highlands. J. Environ. Manag. 2021, 281, 111885. [Google Scholar] [CrossRef]
  54. Mengist, W.; Soromessa, T.; Legese, G. Assessment of land use and land cover changes and its driving forces in Finchaa catchment, Northwestern Ethiopia. Remote Sens. Appl. Soc. Environ. 2021, 22, 100557. [Google Scholar] [CrossRef]
  55. De Lange, H.; Sala, S.; Vighi, M.; Faber, J. Ecological vulnerability in risk assessment—A review and perspectives. Sci. Total. Environ. 2010, 408, 3871–3879. [Google Scholar] [CrossRef]
  56. Allan, J.R.; Venter, O.; Watson, J.E. Temporally inter-comparable maps of terrestrial wilderness and the Last of the Wild. Sci. Data 2015, 2, 1–12. [Google Scholar] [CrossRef] [PubMed]
  57. Wang, Z.; Liu, C.; Wu, J. Assessing the vulnerability of global terrestrial ecosystems to climate change. Nat. Clim. Change 2020, 10, 540–546. [Google Scholar] [CrossRef]
  58. Bryan, B.A.; Crossman, N.D.; King, D.; Meyer, W.S. Land use change and ecosystem services provisioning in agricultural landscapes. Ecosyst. Serv. 2018, 31, 70–81. [Google Scholar] [CrossRef]
  59. Gibson, L.; Lee, T.M.; Koh, L.P.; Brook, B.; Gardner, T.A.; Barlow, J.; Peres, C.; Bradshaw, C.; Laurance, W.F.; Lovejoy, T.E.; et al. Primary forests are irreplaceable for sustaining tropical biodiversity. Nature 2011, 478, 378–381. [Google Scholar] [CrossRef]
  60. Foley, J.A.; DeFries, R.; Asner, G.P.; Barford, C.; Bonan, G.; Carpenter, S.R.; Chapin, F.S.; Coe, M.T.; Daily, G.C.; Gibbs, H.K.; et al. Global consequences of land use. Science 2005, 309, 570–574. [Google Scholar] [CrossRef]
  61. Newbold, T.; Hudson, L.N.; Hill, S.L.L.; Contu, S.; Lysenko, I.; Senior, R.A.; Börger, L.; Bennett, D.J.; Choimes, A.; Collen, B.; et al. Global effects of land use on local terrestrial biodiversity. Nature 2015, 520, 45–50. [Google Scholar] [CrossRef]
  62. Alkemade, R.; van Oorschot, M.; Miles, L.; Nellemann, C.; Bakkenes, M.; Brink, B.T. GLOBIO3: A Framework to Investigate Options for Reducing Global Terrestrial Biodiversity Loss. Ecosystems 2009, 12, 374–390. [Google Scholar] [CrossRef]
  63. Bravo, M.R. Urbanization in the Philippines and Its Influence on Agriculture. In Sustainable Landscape Planning in Selected Urban Regions; Springer: Tokyo, Japan, 2017. [Google Scholar] [CrossRef]
  64. Buhay, A.F.V.; Cruz, R.V.O., Jr.; Tiburan, C.L.; Pulhin, J.M. Factors affecting land use, land cover change, and fragmentation in selected protected areas in the Philippines. SciEnggJ 2023, 16, 37–48. [Google Scholar] [CrossRef]
  65. Leppert, G.; Hohfeld, L.; Lech, M.; Wencker, T. Impact, Diffusion and Scaling-Up of a Comprehensive Land-Use Planning Approach in the Philippines: From Development Cooperation to National Policies; German Institute for Development Evaluation (DEval): Bonn, Germany, 2018. [Google Scholar]
  66. Sisay, G.; Gitima, G.; Mersha, M.; Alemu, W.G. Assessment of land use land cover dynamics and its drivers in Bechet Watershed Upper Blue Nile Basin, Ethiopia. Remote Sens. Appl. Soc. Environ. 2021, 24, 100648. [Google Scholar] [CrossRef]
  67. Reed, J.; Ickowitz, A.; Chervier, C.; Djoudi, H.; Moombe, K.; Ros-Tonen, M.; Yanou, M.; Yuliani, L.; Sunderland, T. Integrated landscape approaches in the tropics: A brief stock-take. Land Use Policy 2020, 99, 104822. [Google Scholar] [CrossRef]
  68. Hariram, N.P.; Mekha, K.B.; Suganthan, V.; Sudhakar, K. Sustainalism: An Integrated Socio-Economic-Environmental Model to Address Sustainable Development and Sustainability. Sustainability 2023, 15, 10682. [Google Scholar] [CrossRef]
  69. Wang, J.; Aenis, T. Stakeholder analysis in support of sustainable land management: Experiences from southwest China. J. Environ. Manag. 2019, 243, 1–11. [Google Scholar] [CrossRef] [PubMed]
  70. He, N.; Guo, W.; Wang, H.; Yu, L.; Cheng, S.; Huang, L.; Jiao, X.; Chen, W.; Zhou, H. Temporal and Spatial Variations in Landscape Habitat Quality under Multiple Land-Use/Land-Cover Scenarios Based on the PLUS-InVEST Model in the Yangtze River Basin, China. Land 2023, 12, 1338. [Google Scholar] [CrossRef]
  71. Santos, M.; Cajaiba, R.L.; Bastos, R.; Gonzalez, D.; Bakış, A.-L.P.; Ferreira, D.; Leote, P.; da Silva, W.B.; Cabral, J.A.; Gonçalves, B.; et al. Why Do Agroforestry Systems Enhance Biodiversity? Evidence From Habitat Amount Hypothesis Predictions. Front. Ecol. Evol. 2022, 9, 630151. [Google Scholar] [CrossRef]
  72. Tang, J.; Zhou, L.; Dang, X.; Hu, F.; Yuan, B.; Yuan, Z.; Wei, L. Impacts and predictions of urban expansion on habitat quality in the densely populated areas: A case study of the Yellow River Basin, China. Ecol. Indic. 2023, 151, 110320. [Google Scholar] [CrossRef]
  73. Hong, H.-J.; Kim, C.-K.; Lee, H.-W.; Lee, W.-K. Conservation, Restoration, and Sustainable Use of Biodiversity Based on Habitat Quality Monitoring: A Case Study on Jeju Island, South Korea (1989–2019). Land 2021, 10, 774. [Google Scholar] [CrossRef]
  74. Haregeweyn, N.; Berhe, A.; Tsunekawa, A.; Tsubo, M.; Meshesha, D.T. Integrated Watershed Management as an Effective Approach to Curb Land Degradation: A Case Study of the Enabered Watershed in Northern Ethiopia. Environ. Manag. 2012, 50, 1219–1233. [Google Scholar] [CrossRef]
  75. Stem, C.; Margoluis, R.; Salafsky, N.; Brown, M. Monitoring and Evaluation in Conservation: A Review of Trends and Approaches. Conserv. Biol. 2005, 19, 295–309. [Google Scholar] [CrossRef]
  76. Garbach, K.; Lubell, M.; DeClerck, F.A. Payment for Ecosystem Services: The roles of positive incentives and information sharing in stimulating adoption of silvopastoral conservation practices. Agric. Ecosyst. Environ. 2012, 156, 27–36. [Google Scholar] [CrossRef]
  77. Wegner, G.I. Payments for ecosystem services (PES): A flexible, participatory, and integrated approach for improved conservation and equity outcomes. Environ. Dev. Sustain. 2015, 18, 617–644. [Google Scholar] [CrossRef]
  78. Lansigan, F.; De Los Santos, W.L.; Coladilla, J. Agronomic impacts of climate variability on rice production in the Philippines. Agric. Ecosyst. Environ. 2000, 82, 129–137. [Google Scholar] [CrossRef]
  79. Kastner, T.; Nonhebel, S. Changes in land requirements for food in the Philippines: A historical analysis. Land Use Policy 2010, 27, 853–863. [Google Scholar] [CrossRef]
  80. Stuecker, M.F.; Tigchelaar, M.; Kantar, M.B. Climate variability impacts on rice production in the Philippines. PLoS ONE 2018, 13, e0201426. [Google Scholar] [CrossRef] [PubMed]
  81. Varca, L.M. Pesticide residues in surface waters of Pagsanjan-Lumban catchment of Laguna de Bay, Philippines. Agric. Water Manag. 2012, 106, 35–41. [Google Scholar] [CrossRef]
  82. Montoya, D.; Gaba, S.; de Mazancourt, C.; Bretagnolle, V.; Loreau, M. Reconciling biodiversity conservation, food production and farmers’ demand in agricultural landscapes. Ecol. Model. 2019, 416, 108889. [Google Scholar] [CrossRef]
  83. Ligaray, M.; Kim, M.; Baek, S.; Ra, J.-S.; Chun, J.A.; Park, Y.; Boithias, L.; Ribolzi, O.; Chon, K.; Cho, K.H. Modeling the Fate and Transport of Malathion in the Pagsanjan-Lumban Basin, Philippines. Water 2017, 9, 451. [Google Scholar] [CrossRef]
  84. Bucheli, V.J.P.; Bokelmann, W. Agroforestry systems for biodiversity and ecosystem services: The case of the Sibundoy Valley in the Colombian province of Putumayo. Int. J. Biodivers. Sci. Ecosyst. Serv. Manag. 2017, 13, 380–397. [Google Scholar] [CrossRef]
  85. Fahad, S.; Chavan, S.B.; Chichaghare, A.R.; Uthappa, A.R.; Kumar, M.; Kakade, V.; Pradhan, A.; Jinger, D.; Rawale, G.; Yadav, D.K.; et al. Agroforestry Systems for Soil Health Improvement and Maintenance. Sustainability 2022, 14, 14877. [Google Scholar] [CrossRef]
  86. Reith, E.; Gosling, E.; Knoke, T.; Paul, C. Exploring trade-offs in agro-ecological landscapes: Using a multi-objective land-use allocation model to support agroforestry research. Basic Appl. Ecol. 2022, 64, 103–119. [Google Scholar] [CrossRef]
  87. Stuch, B.; Alcamo, J. Systems methods for analyzing trade-offs between food security and conserving biodiversity. Environ. Syst. Decis. 2023, 44, 16–29. [Google Scholar] [CrossRef]
  88. Almarines, N.R.; Hashimoto, S.; Pulhin, J.M.; Predo, C.D.; Pulhin, F.B.; Magpantay, A.T.; Saito, O. Spatiotemporal dynamics of bioproduction systems and ecosystem services in the Baroro and Pagsanjan-Lumban watersheds, Philippines. Paddy Water Environ. 2024. [Google Scholar] [CrossRef]
  89. Munang, R.T.; Thiaw, I.; Rivington, M. Ecosystem Management: Tomorrow’s Approach to Enhancing Food Security under a Changing Climate. Sustainability 2011, 3, 937–954. [Google Scholar] [CrossRef]
  90. Reed, J.; Van Vianen, J.; Deakin, E.L.; Barlow, J.; Sunderland, T. Integrated landscape approaches to managing social and environmental issues in the tropics: Learning from the past to guide the future. Glob. Change Biol. 2016, 22, 2540–2554. [Google Scholar] [CrossRef] [PubMed]
  91. Reed, J.; Barlow, J.; Carmenta, R.; van Vianen, J.; Sunderland, T. Engaging multiple stakeholders to reconcile climate, conservation and development objectives in tropical landscapes. Biol. Conserv. 2019, 238, 108229. [Google Scholar] [CrossRef]
  92. Jiren, T.S.; Hanspach, J.; Schultner, J.; Fischer, J.; Bergsten, A.; Senbeta, F.; Hylander, K.; Dorresteijn, I. Reconciling food security and biodiversity conservation: Participatory scenario planning in southwestern Ethiopia. Ecol. Soc. 2020, 25, 24. [Google Scholar] [CrossRef]
  93. Aryal, K.; Maraseni, T.; Apan, A. Transforming agroforestry in contested landscapes: A win-win solution to trade-offs in ecosystem services in Nepal. Sci. Total. Environ. 2022, 857, 159301. [Google Scholar] [CrossRef]
  94. Estrada-Carmona, N.; Hart, A.K.; DeClerck, F.A.; Harvey, C.A.; Milder, J.C. Integrated landscape management for agriculture, rural livelihoods, and ecosystem conservation: An assessment of experience from Latin America and the Caribbean. Landsc. Urban Plan. 2014, 129, 1–11. [Google Scholar] [CrossRef]
  95. Tafoya, K.A.; Brondizio, E.S.; Johnson, C.E.; Beck, P.; Wallace, M.; Quirós, R.; Wasserman, M.D. Effectiveness of Costa Rica’s Conservation Portfolio to Lower Deforestation, Protect Primates, and Increase Community Participation. Front. Environ. Sci. 2020, 8, 580724. [Google Scholar] [CrossRef]
  96. IPBES. Global Assessment Report on Biodiversity and Ecosystem Services. In Intergovernmental Science-Policy Platform on Biodiversity and Ecosystem Services; Brondizio, E.S., Settele, J., Díaz, S., Ngo, H.T., Eds.; IPBES Secretariat: Bonn, Germany, 2019. [Google Scholar] [CrossRef]
  97. Maisharou, A.; Chirwa, P.; Larwanou, M.; Babalola, F.; Ofoegbu, C. Sustainable land management practices in the Sahel: Review of practices, techniques and technologies for land restoration and strategy for up-scaling. Int. For. Rev. 2015, 17, 1–19. [Google Scholar] [CrossRef]
  98. Simonson, W.D.; Miller, E.; Jones, A.; García-Rangel, S.; Thornton, H.; McOwen, C. Enhancing climate change resilience of ecological restoration—A framework for action. Perspect. Ecol. Conserv. 2021, 19, 300–310. [Google Scholar] [CrossRef]
  99. Correa Ayram, C.A.; Mendoza, M.E.; Etter, A.; Salicrup, D.R.P. Habitat connectivity in biodiversity conservation: A review of recent studies and applications. Prog. Phys. Geogr. Earth Environ. 2016, 40, 7–37. [Google Scholar] [CrossRef]
  100. Danielsen, F.; Burgess, N.D.; Balmford, A. Monitoring Matters: Examining the Potential of Locally-based Approaches. Biodivers. Conserv. 2005, 14, 2507–2542. [Google Scholar] [CrossRef]
Figure 1. The location map of the Pagsanjan-Lumban Watershed in the Laguna Lake Basin and the Bororo Watershed in La Union province.
Resources 14 00045 g001
Figure 2. The overall approach of the LULC scenario, habitat quality modeling, and food provision estimation to evaluate the synergies and trade-offs between the services.
Resources 14 00045 g002
Figure 3. The historical and predicted LULC in the PLW (a) and the BW (b).
Resources 14 00045 g003aResources 14 00045 g003b
Figure 4. Habitat quality level and change rates in percentage share from 2000 to 2050.
Resources 14 00045 g004
Figure 5. The spatial distribution of habitat quality in PLW (a) and BW (b) in 2010, 2020, and 2050.
Resources 14 00045 g005aResources 14 00045 g005b
Figure 6. The mean annual food crop productions of the PLW and the BW.
Resources 14 00045 g006
Table 1. Definitions of LULC considered in this study.
LULCDefinitions
Built-upAreas characterized by the presence of infrastructure, buildings, and other man-made structures. This category typically includes urban and suburban developments and the bare land allocated built up.
Closed forestsA land cover type representing areas densely covered with trees, where the canopy cover is so dense that it limits sunlight penetration to the forest floor.
Annual cropsAreas are used to cultivate crops planted and harvested within the same agricultural year. These crops typically have a short growing cycle, including corn, palay (rice), vegetables, and herbs.
Mixed agroforestry systemsA land-use system that combines trees or shrubs with perennial crops in the same area. This LULC includes an open forest and shrublands/ bushes, which mostly integrate perennial crops in the watershed area.
WaterThis category represents areas covered by water bodies, such as rivers, lakes, reservoirs, and ponds.
Table 2. The maximum distance, weight, and spatial decay type of the threat factors affecting the habitat quality.
ThreatMaximum Distance (km)Weight (0–1)DecayLULC
Annual cropsBuilt-upMixed agroforestry systemsClosed forestWater
Habitat suitability score
0.40.20.710.9
Habitat sensitivity to threats
Annual crops20.6Linear00.10.70.90.9
Population density20.6Exponential0.50.10.60.80.6
Urban area30.9Exponential0.400.710.9
Rural settlement10.5Linear0.100.40.60.5
High-graded roads20.5Exponential0.50.10.70.80.5
Low-graded roads10.2Linear0.30.10.30.50.3
Table 3. The historical and predicted LULC in the PLW and the BW.
LULCPLWBW
Historical Trends (%)Prediction (%)Historical Trends (%)Prediction (%)
2000201020202035205020002010202020352050
Annual crops14.312.013.013.216.134.434.232.531.131.9
Built-up2.03.12.83.33.40.91.41.73.24.1
Closed forests1.62.82.72.82.84.31.91.61.50.8
Mixed agroforestry systems77.777.876.776.172.859.962.063.863.762.6
Water4.44.24.74.64.90.40.50.30.60.5
Table 4. An overview of habitat quality levels within the PLW and the BW across various LULC categories for 2010, 2020, and 2050 (the color matches with Figure 5).
LULCPLWBW
200020202050200020202050
Annual crop0.20.30.30.00.00.0
Built-up0.10.10.10.10.10.0
Mixed agroforestry system0.30.60.60.50.70.4
Closed forest0.40.80.80.20.10.2
Water0.30.50.40.10.20.1
Table 5. The food crop production yield of the PLW and the BW.
WatershedsLULCMean Food Crop Production (Mt ha−1)Yield per Production Type (Mt)Yield per Production Type (Mt)Yield per Production Type (Mt)
200020202050
PLWAnnual crop5.432,08129,27936,131
Mixed agroforestry system132,30031,88330,249
Total production 64,38161,16266,380
BWAnnual crop5.436,05034,00933,442
Mixed agroforestry system0.4464349524860
Total production 40,69438,96238,302
Table 6. Trade-offs and synergies between food provisions vs. habitat quality (HQ) in the PLW and the BW.
WatershedsFood Provisions vs. Habitat QualityCorrelation Coefficientp-Value
PLW2000−0.02560.1057
2020−0.03550.0248
2050−0.01510.3392
BW20000.18693.56 × 10−17
20200.02670.2326
20500.25671.79 × 10−31
Disclaimer/Publisher’s Note: The statements, opinions and data contained in all publications are solely those of the individual author(s) and contributor(s) and not of MDPI and/or the editor(s). MDPI and/or the editor(s) disclaim responsibility for any injury to people or property resulting from any ideas, methods, instructions or products referred to in the content.

