Article

Geostatistical and Multivariate Assessment of Radon Distribution in Groundwater from the Mexican Altiplano

by
Alfredo Bizarro Sánchez
1,
Marusia Renteria-Villalobos
2,*,
Héctor V. Cabadas Báez
1,*,
Alondra Villarreal Vega
2,
Miguel Balcázar
3 and
Francisco Zepeda Mondragón
1
1
Facultad de Geografía, Universidad Autónoma del Estado de México, Toluca 50110, Mexico
2
Faculty of Animal Science and Ecology, Autonomous University of Chihuahua, Perif. R. Almada km 1, Chihuahua 31453, Mexico
3
Instituto Nacional de Investigaciones Nucleares, Carretera México—Toluca s/n, Ocoyoacac 52750, Mexico
*
Authors to whom correspondence should be addressed.
Resources 2025, 14(10), 154; https://doi.org/10.3390/resources14100154
Submission received: 16 June 2025 / Revised: 5 September 2025 / Accepted: 10 September 2025 / Published: 29 September 2025

Abstract

This study examines the impact of physicochemical and geological factors on radon concentrations in groundwater throughout the Mexican Altiplano. Geological diversity, uranium deposits, seismic zones, and geothermal areas with high heat flow are all potential factors contributing to the presence of radon in groundwater. To move beyond local-scale assessments, this research employs spatial prediction methodologies that incorporate geological and geochemical variables recognized for their role in radon transport and geogenic potential. Certain properties of radon enable it to serve as an ideal tracer, viz., short half-life, inertness, and higher incidence in groundwater than surface water. Twenty-five variables were analyzed in samples from 135 water wells. Geostatistical techniques, including inverse distance weighted interpolation and kriging, were used in conjunction with multivariate statistical analyses. Salinity and geothermal heat flow are key indicators for determining groundwater origin, revealing a dynamic interplay between geothermal activity and hydrogeochemical evolution, where high temperatures do not necessarily correlate with increased solute concentrations. The occurrence of toxic trace elements such as Cd, Cr, and Pb is primarily governed by lithogenic sources and proximity to mineralized zones. Radon levels in groundwater are mainly influenced by geological and structural features, notably rhyolitic formations and deep hydrothermal systems. These findings underscore the importance of site-specific groundwater examination, combined with spatiotemporal models, to account for uranium–radium dynamics and flow paths, thereby enhancing radiological risk assessment.

1. Introduction

Freshwater depletion is worsening worldwide. During this century, the depletion rate is expected to increase due to global warming, changes in conditions, population growth, and economic expansion. This water reduction is exacerbated when its quality is modified by human or natural events, rendering it unsuitable for consumption. Radionuclide monitoring in groundwater is crucial for protecting public health and the environment [1]. Understanding the presence and levels of radionuclides is essential, particularly in Mexico, where scant research has addressed the public water supply, the potential risks associated with contaminated drinking water and assessing the impact of various activities on groundwater quality.
Liquid effluents may contain radiological or chemical contaminants in dissolved or particulate form, which can exhibit a range of concentrations in groundwater [2]. These variations are partly due to the physical f of the aquifers, including the degree of rock fracturing and the duration of water percolation, which all influence the radionuclide concentration of the stored water [3]. Consequently, the natural radioactivity present in the groundwater is directly related to the geological features it passes through, the residence time, temperature, solubility, and reactions of the geochemical content. Additionally, weathering, evapotranspiration, and human activities (including agriculture, wastewater discharge, and industrial waste) [4,5] also impact in the water quality.
Most geochemical research on water in Mexico has been limited to local areas and considers few variables, due to the challenges of covering the enormous territory and its diverse geology. Similarly, research on radon concentrations in groundwater is relatively limited, compared to studies on radon that enters homes through soil and building materials. Moreover, most radon research in groundwater has been conducted on a local scale [6,7,8], with fewer studies focusing on regional levels [9,10]. Published radon concentrations vary from 90 Bq/L [11] to 4400 Bq/L [12,13]. The initial measurements of radon in Mexican groundwater were conducted in a few localized areas (wells, springs, and boreholes supplying drinking water). They focused on alluvial and volcanic aquifers and are associated with relatively low concentrations [5,6,8]. In the northern region of the country, higher radon concentrations were recorded in the groundwater (34.2 kBq/m3) and drinking water (27.3 kBq/m3) [14,15,16].
Radon has also been identified as a public health concern when present in drinking water. Surface water contains very small amounts of dissolved radon, with typical concentrations of less than 4000 kBq/m3. Well water can present high radon concentrations. Ingesting radon through drinking water may pose direct health risks by irradiating sensitive cells in the gastrointestinal tract and other organs once absorbed into the bloodstream. Therefore, radon in drinking water could contribute to adverse health effects beyond lung cancer [17]. However, assessing the impact on population health was beyond the scope of this research.
Extensive literature also exists on the use of GIS and geostatistical methods to understand the geographical distribution of radon concentrations in groundwater and to map potential radon (geogenic) distribution [18,19,20,21]. These methods range from spatial sampling to modeling [9], analyzing the relationship between radon-concentration and geology [20], geological faults [11], lithology and mineralogy [18]. They include other factors such as tectonic lineaments, slope, drainage density, precipitation, net groundwater recharge, and water quality [20], including uranium and radium concentrations [13,22]. Studies have also utilized GIS (regression-kriging) and multivariate statistics for mapping radon distribution [9,19,20,23] and predicting radon concentrations [4,13,22].
The Mexican Altiplano is a vast region with a high population density and distinct geological features, including Cenozoic volcanism associated with felsic magmas. These conditions are favorable for producing radon [24]. Erosion and weathering processes also contribute to the formation of sedimentary deposits, which, in turn, affect groundwater geochemistry. The risk of exposure to radon concentration in water wells necessitates the observation of parameters on a regional scale; however, collecting data from research institutions requires significant effort, and often results in varying levels of detail and accuracy. This study introduces a novel approach to establishing a comprehensive database and producing a regional characterization of the variables that influence radon concentrations in groundwater to support future research and policy development on groundwater safety.

2. Materials and Methods

Geostatistical methodologies are essential for identifying any possible dependence or interdependence of radon with the variables available from in situ measurements and institutional data. These methodologies help explain, predict, or establish relationships or similarities. The advantages of applying multivariate analysis included its ability to clarify relationships between variables, visualization, and eliminate biases or influences from other factors not considered in the results. In addition, spatial distribution and spatial predictions were performed using IDW and Kriging analyses, involving a combination of descriptive statistics, anomaly detection based on variations in standard deviation ranges, and principal component analysis.

2.1. Study Site

The study area was defined based on measurements from 135 wells across several Mexican states and aquifers (Appendix A). The potable water wells that CONAGUA monitors vary in depth depending on the region and aquifer. The potable water wells range from 5 m to no more than 200 m [25]; the recorded water temperatures from the output wells range from 13–36 °C. Heat flow is assessed at depths greater than one kilometer, so the depth of potable water wells is not a determining factor for temperature. The average altitude ranges from 1800 to 2300 masl, with a semi-arid climate, including sub-humid tropical zones [26]. It is a vast area with scarce rainfall, where aridity results from its location relative to the subtropical high-pressure belt and from the orientation of the surrounding mountain ranges, which isolate it from the seas [27]. Its surface is dotted with mesas, which are isolated flat-topped hills that rise abruptly from the surrounding terrain, with steep, vertical sides. Deep river valleys and streams crisscross the extensive terrain, creating spectacular landscapes and providing vital water sources for the region’s inhabitants. This zone is part of the National Monitoring Network for the General Technical Sub-Directorate of the National Water Commission (CONAGUA). Figure 1 shows the study area and the sampling points. Mexico’s territory is characterized by a series of crustal blocks with distinct geological evolutions divided by large-scale structures. This complexity reflects an intricate tectonic evolution [28]. During the Cenozoic era, volcanic activity and its associated ore deposits had varying effects across Mexican territory as it evolved through different stages. The most recent activity is concentrated in the Trans-Mexican Volcanic Belt, in which extends across south-central Mexico from the Pacific Ocean to the Gulf of Mexico. This area is characterized by seismic, volcanic, and geothermal activity. Exogenic events, such as erosion and weathering, have influenced different geochemical cycles, including the presence of radon. Furthermore, Mexico’s vast size and geographical diversity result in a restricted and irregular distribution of groundwater [29].
Volcanic rocks form a heterogeneous and anisotropic environment [30]; their hydrogeological behavior ranges from fractured, hard rock to a porous formation, depending on the diverse complexities of their genesis [24]. In general, volcanic rocks are often more chemically reactive due to the presence of fine particles, a large specific surface area, and an abundance of volcanic glass [30]. The presence of felsic volcanic rocks is a significant factor in radon generation, as they are associated with hydrothermal and structural systems [31]. At the same time, the erosion and weathering conditions help form sedimentary deposits, which become part of the aquifers and influence the geochemistry of the groundwater, which is difficult to model.

2.2. Data and Experiment

This study analyzed elemental, physicochemical, and geological variables. All 135 of the studied water wells are used for human consumption. The shallow wells are located in 49 aquifers where the water is extracted for various purposes, ranging from 0.5–16.5% for domestic use and 8.9–97.8% for agricultural use [32]. Samples and in situ measurements of radon, pH, total dissolved solids (TDSm), electrical conductivity, and temperature were taken in groundwater from 135 wells between October 2019 and July 2021, following the device instructions and guidelines from the National Institute of Nuclear Research (ININ) [31]. The detection of 222Rn was conducted using an AlphaGUARD device (Campbell Scientific’s CR1000 datalogger), with a sensitivity interval of 2 to 2,000,000 Bq/m3 (0.05 to 50,000 pCi/L) of active measurement. A Hanna Instruments (HI98196) multiparameter meter was used to measure pH, electrical conductivity (EC), and temperature (T). Certain element concentrations and physicochemical and geological variables were integrated into this analysis; these geological and physicochemical variables were obtained from the National Water Information System (SINA) [33]. Table 1 summarizes the 25 variables included in the analysis. The parameters measured in this study are used by the National Water Commission [33] to assess water quality and its possible uses. In the region where the wells are located, surface activities are predominantly agricultural, and the landscape includes halophilic xerophytic vegetation and secondary shrub vegetation typical of pine forests, along with grasslands and scrubland. Therefore, activities such as industry, mining, and livestock farming—common in those states and potentially determining factors—are not present. Temperatures of the samples were recorded immediately after they were taken from the well. The minimum recorded temperature was 13 °C and the maximum was 36 °C, with an average of 24 °C. The temperature associated with heat flow comes from depths of one, three, and five kilometers, while the depth of the 135 sampled wells does not exceed 200 m.

2.3. Data Processing

2.3.1. Spatial Distribution Analysis

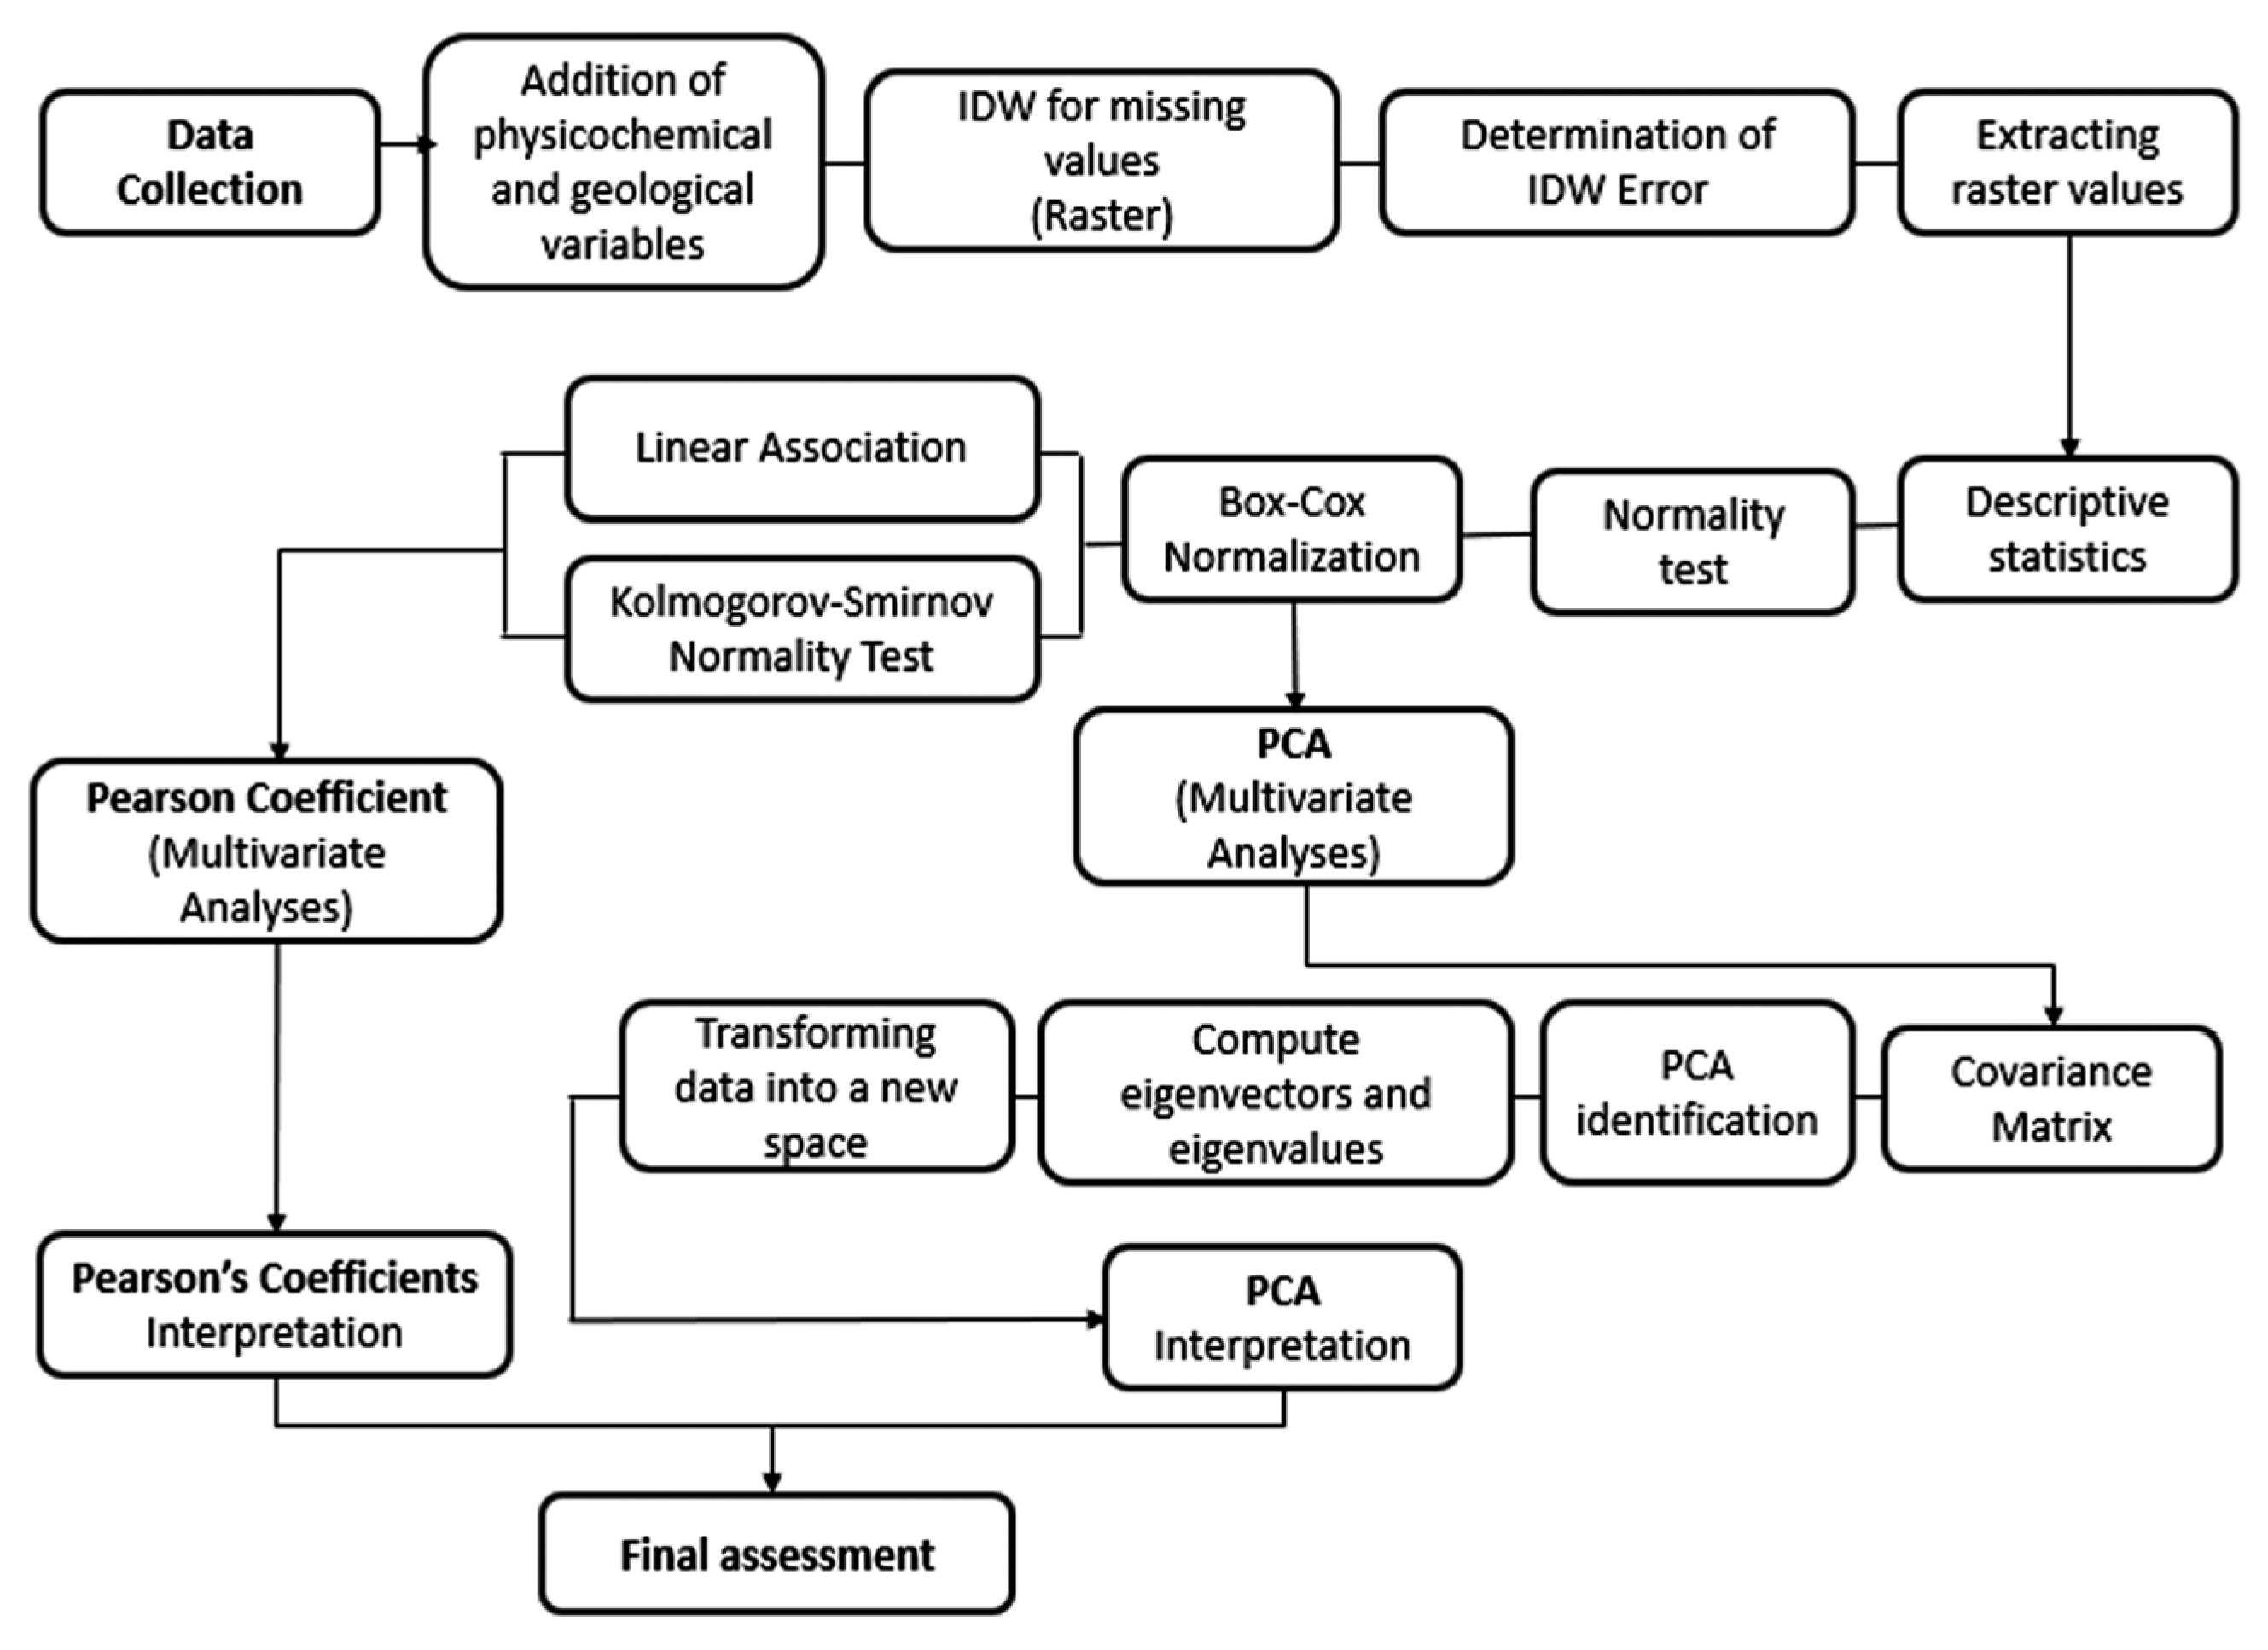
All variables were entered into a Geographical Information System (GIS) to create a new database for analysis, as shown in Figure 2. The integration process involved: (i) reviewing all well identification codes and georeferencing them to identify possible inconsistencies and missing values, and (ii) estimating missing pH and/or electrical conductivity (EC) values in 18 wells using the inverse distance weighting (IDW) method, which is commonly used to estimate contaminant concentrations in groundwater [23]. The number of measurements is relatively low for the size of the study area; however, the main objective of the study was to perform an exploratory analysis of radon distribution and behavior, so the resulting errors of ±3.6 for EC and ±2.7 for pH are considered acceptable [31]. The error was calculated using RMSE (Root Mean Square Error), which minimizes the sum of squared residuals and reflects the average magnitude of the prediction errors. Thus, the conditional mean of the dependent variable represents the best predictor.
A simple ordinary Kriging interpolation method was used to estimate areas without parameter data and to delineate the overall radon spatial distribution. Similarly, the inverse distance weighting (IDW) interpolation method was applied to heat flow values to generate a map of this variable across the entire study area.

2.3.2. Statistical Analysis

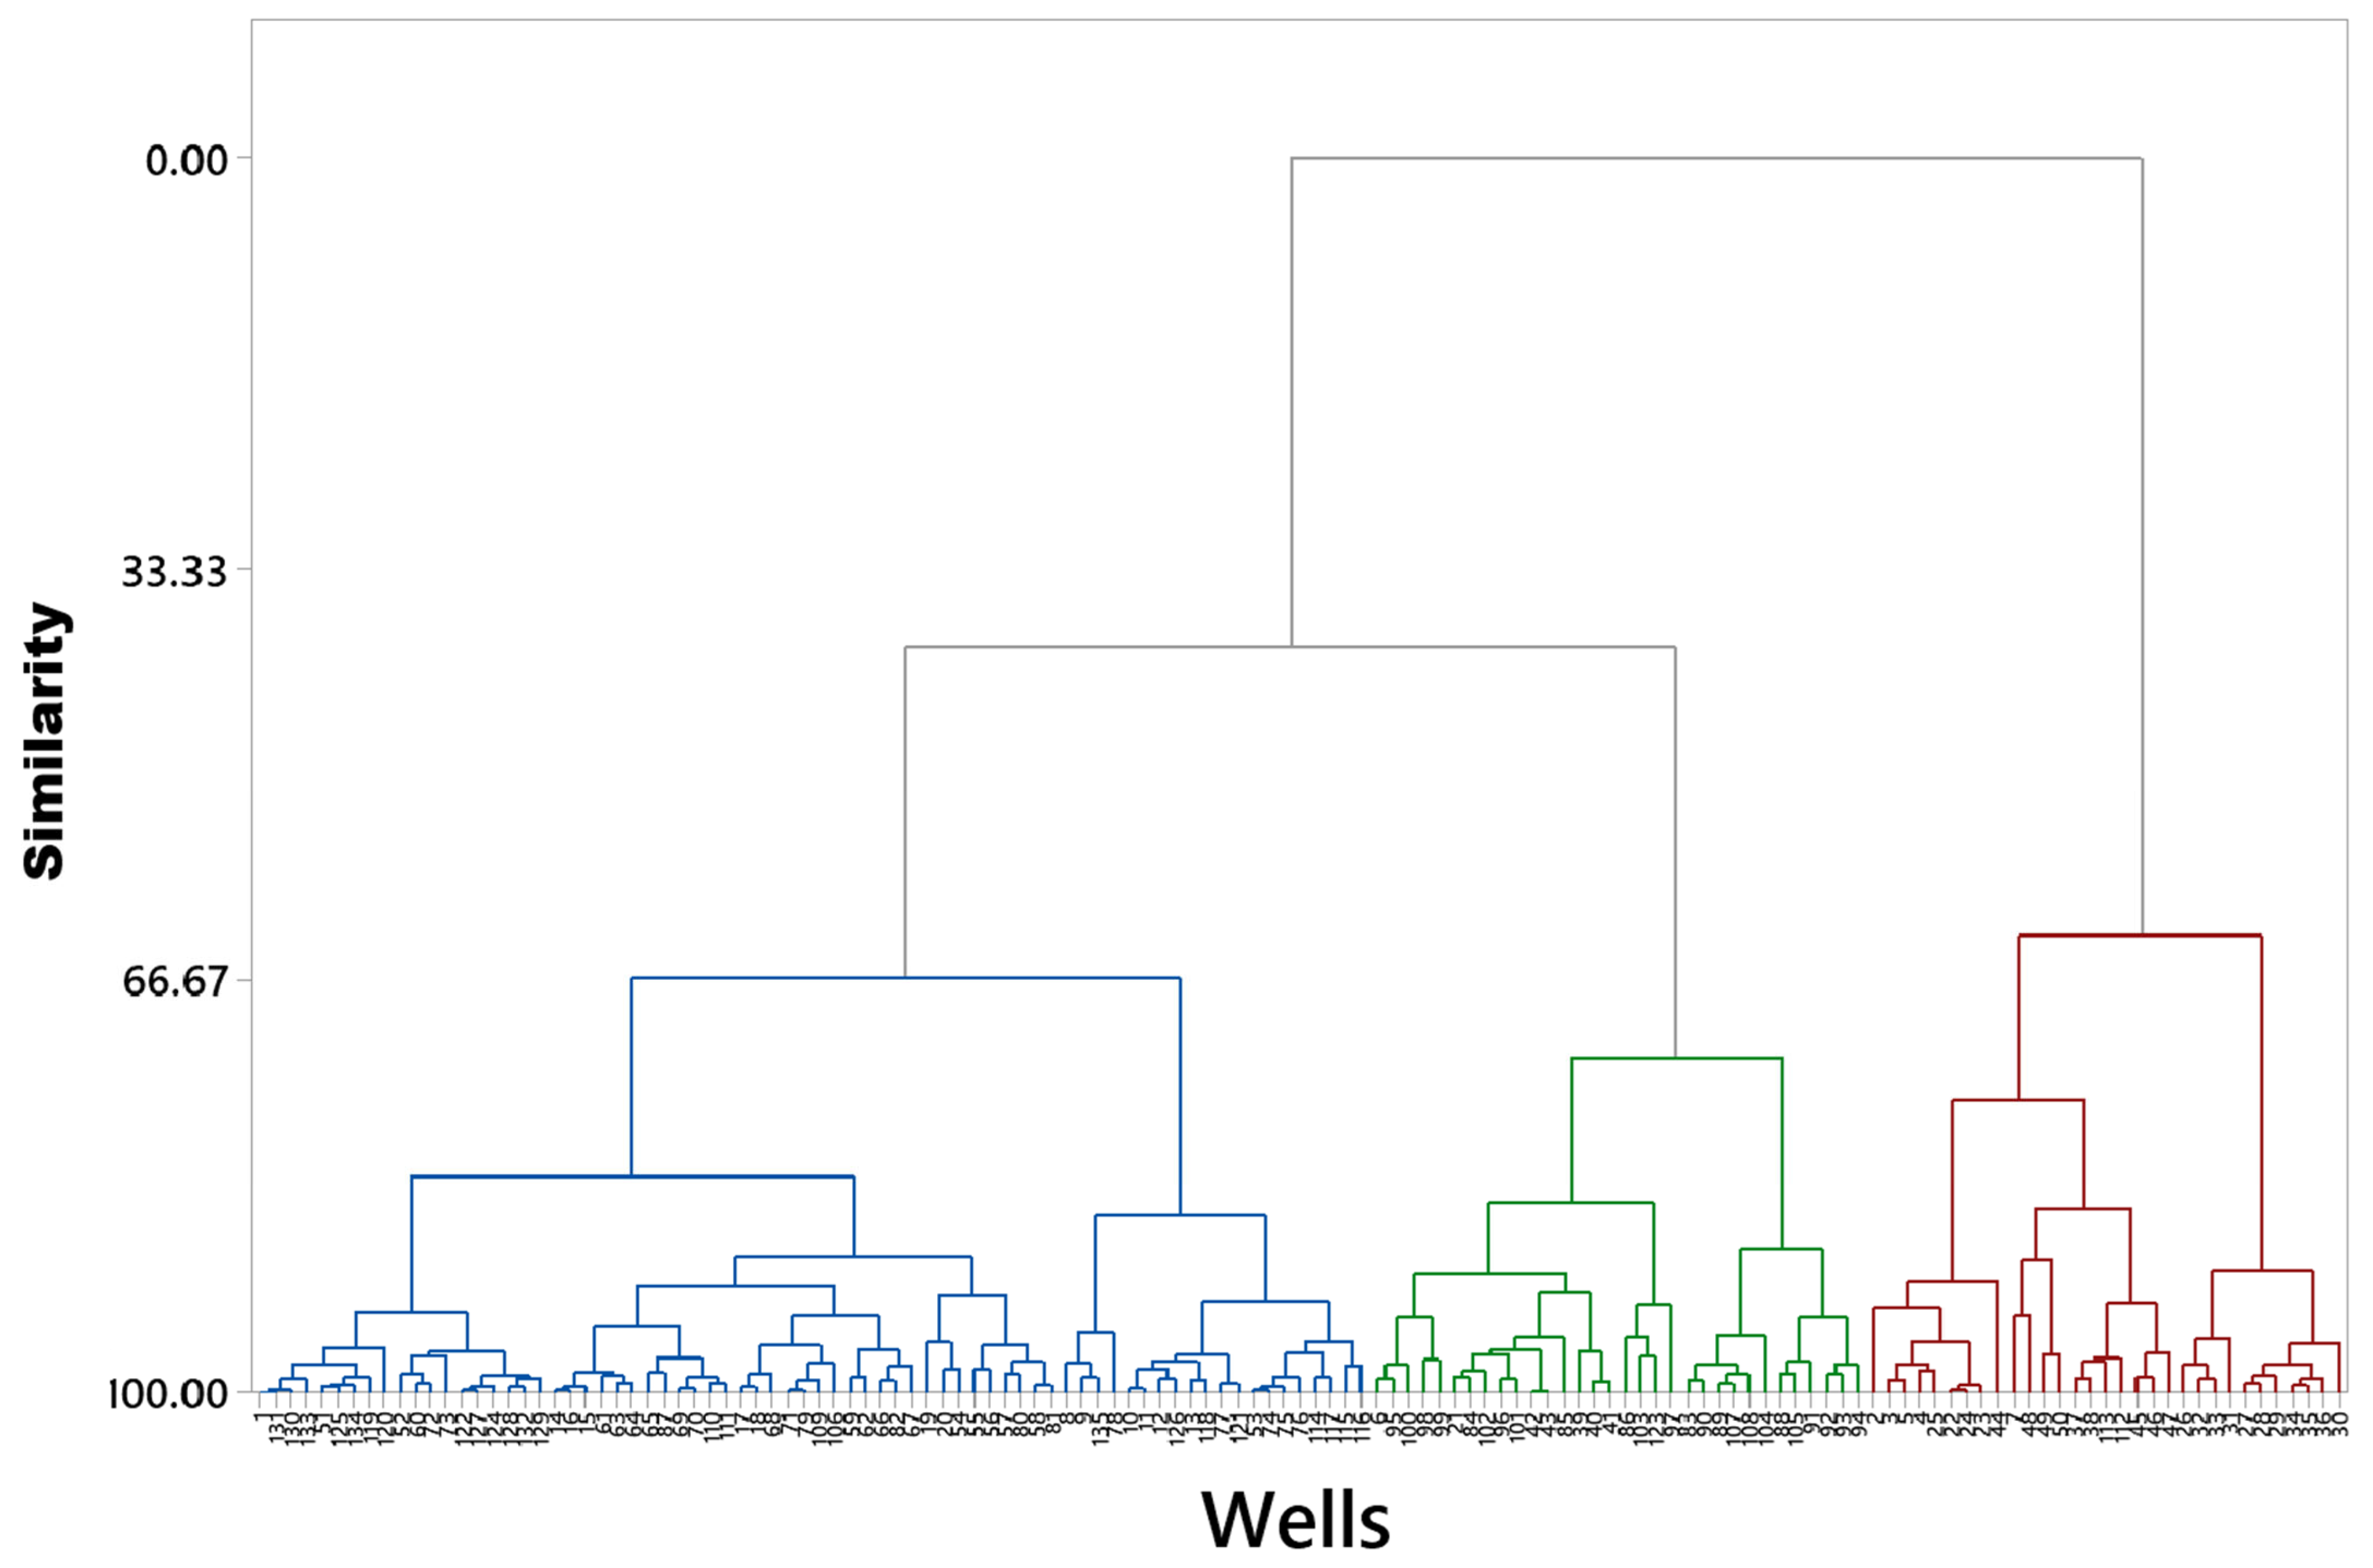
The updated database, containing 135 wells and 25 variables, was exported to Minitab software Version 18.1 (Minitab LLC, State College, PA, USA) to perform a data normality test and to assess the linear relationships between variables by applying the Pearson correlation [34]. The normality test showed that, except for T, the variables did not follow a normal distribution. As a result, data was normalized by the Box–Cox tool [35] available in the software. This software automatically estimates the optimal value of lambda to best fit a normal distribution. The lambda values obtained ranged between −0.5 and 3, ensuring that the variables were on a common scale (normalization) before proceeding with statistical analyses. [36]. The linear relationships between variables were assessed to calculate the Pearson correlation coefficient. In addition, a Principal Component Analysis (PCA) with Varimax orthogonal rotation was conducted to analyze correlations among variables [37,38,39]. Finally, a dendrogram was generated using the complete linkage method and Euclidean distances (at 60% similarity) to visualize the grouping of wells based on the analyzed variables.

3. Results

Descriptive statistics for the variables are shown in Table 2. The in situ radon concentrations in the 135 wells analyzed range from 0.02 Bq/L to 64.8 Bq/L, with an arithmetic mean of 10.6 Bq/L and a standard deviation (SD) of 11.1 Bq/L. Of the total wells, 84 (62.2%) have concentrations below the maximum recommended level (MRL) of 11.1 Bq L−1, as recommended by the Environmental Protection Agency [40]. Among the 51 remaining wells (37.8%), the registered concentrations ranged from 11.2 Bq/L to 39.0 Bq/L, with an average of 21.4 Bq/L. Only one well recorded a value of 64.8 Bq/L.
On the other hand, the PCA results identified eight components that explain 74% of the data variance; the Kaiser criterion (1960) was applied, which considers only eigenvalues of 1 or greater. These results reveal a multidimensional hydrogeochemical structure, with variance distributed across components and low redundancy among variables, each contributing distinct information. To improve interpretability and enhance the clarity of factor loadings, Varimax orthogonal rotation was applied to the eight components. Table 3 shows the PCA results for 25 variables considered in this study. The multifactorial origin of groundwater geochemistry is attributed to the cumulative effect of each component, accounting for 76% of the total variance.
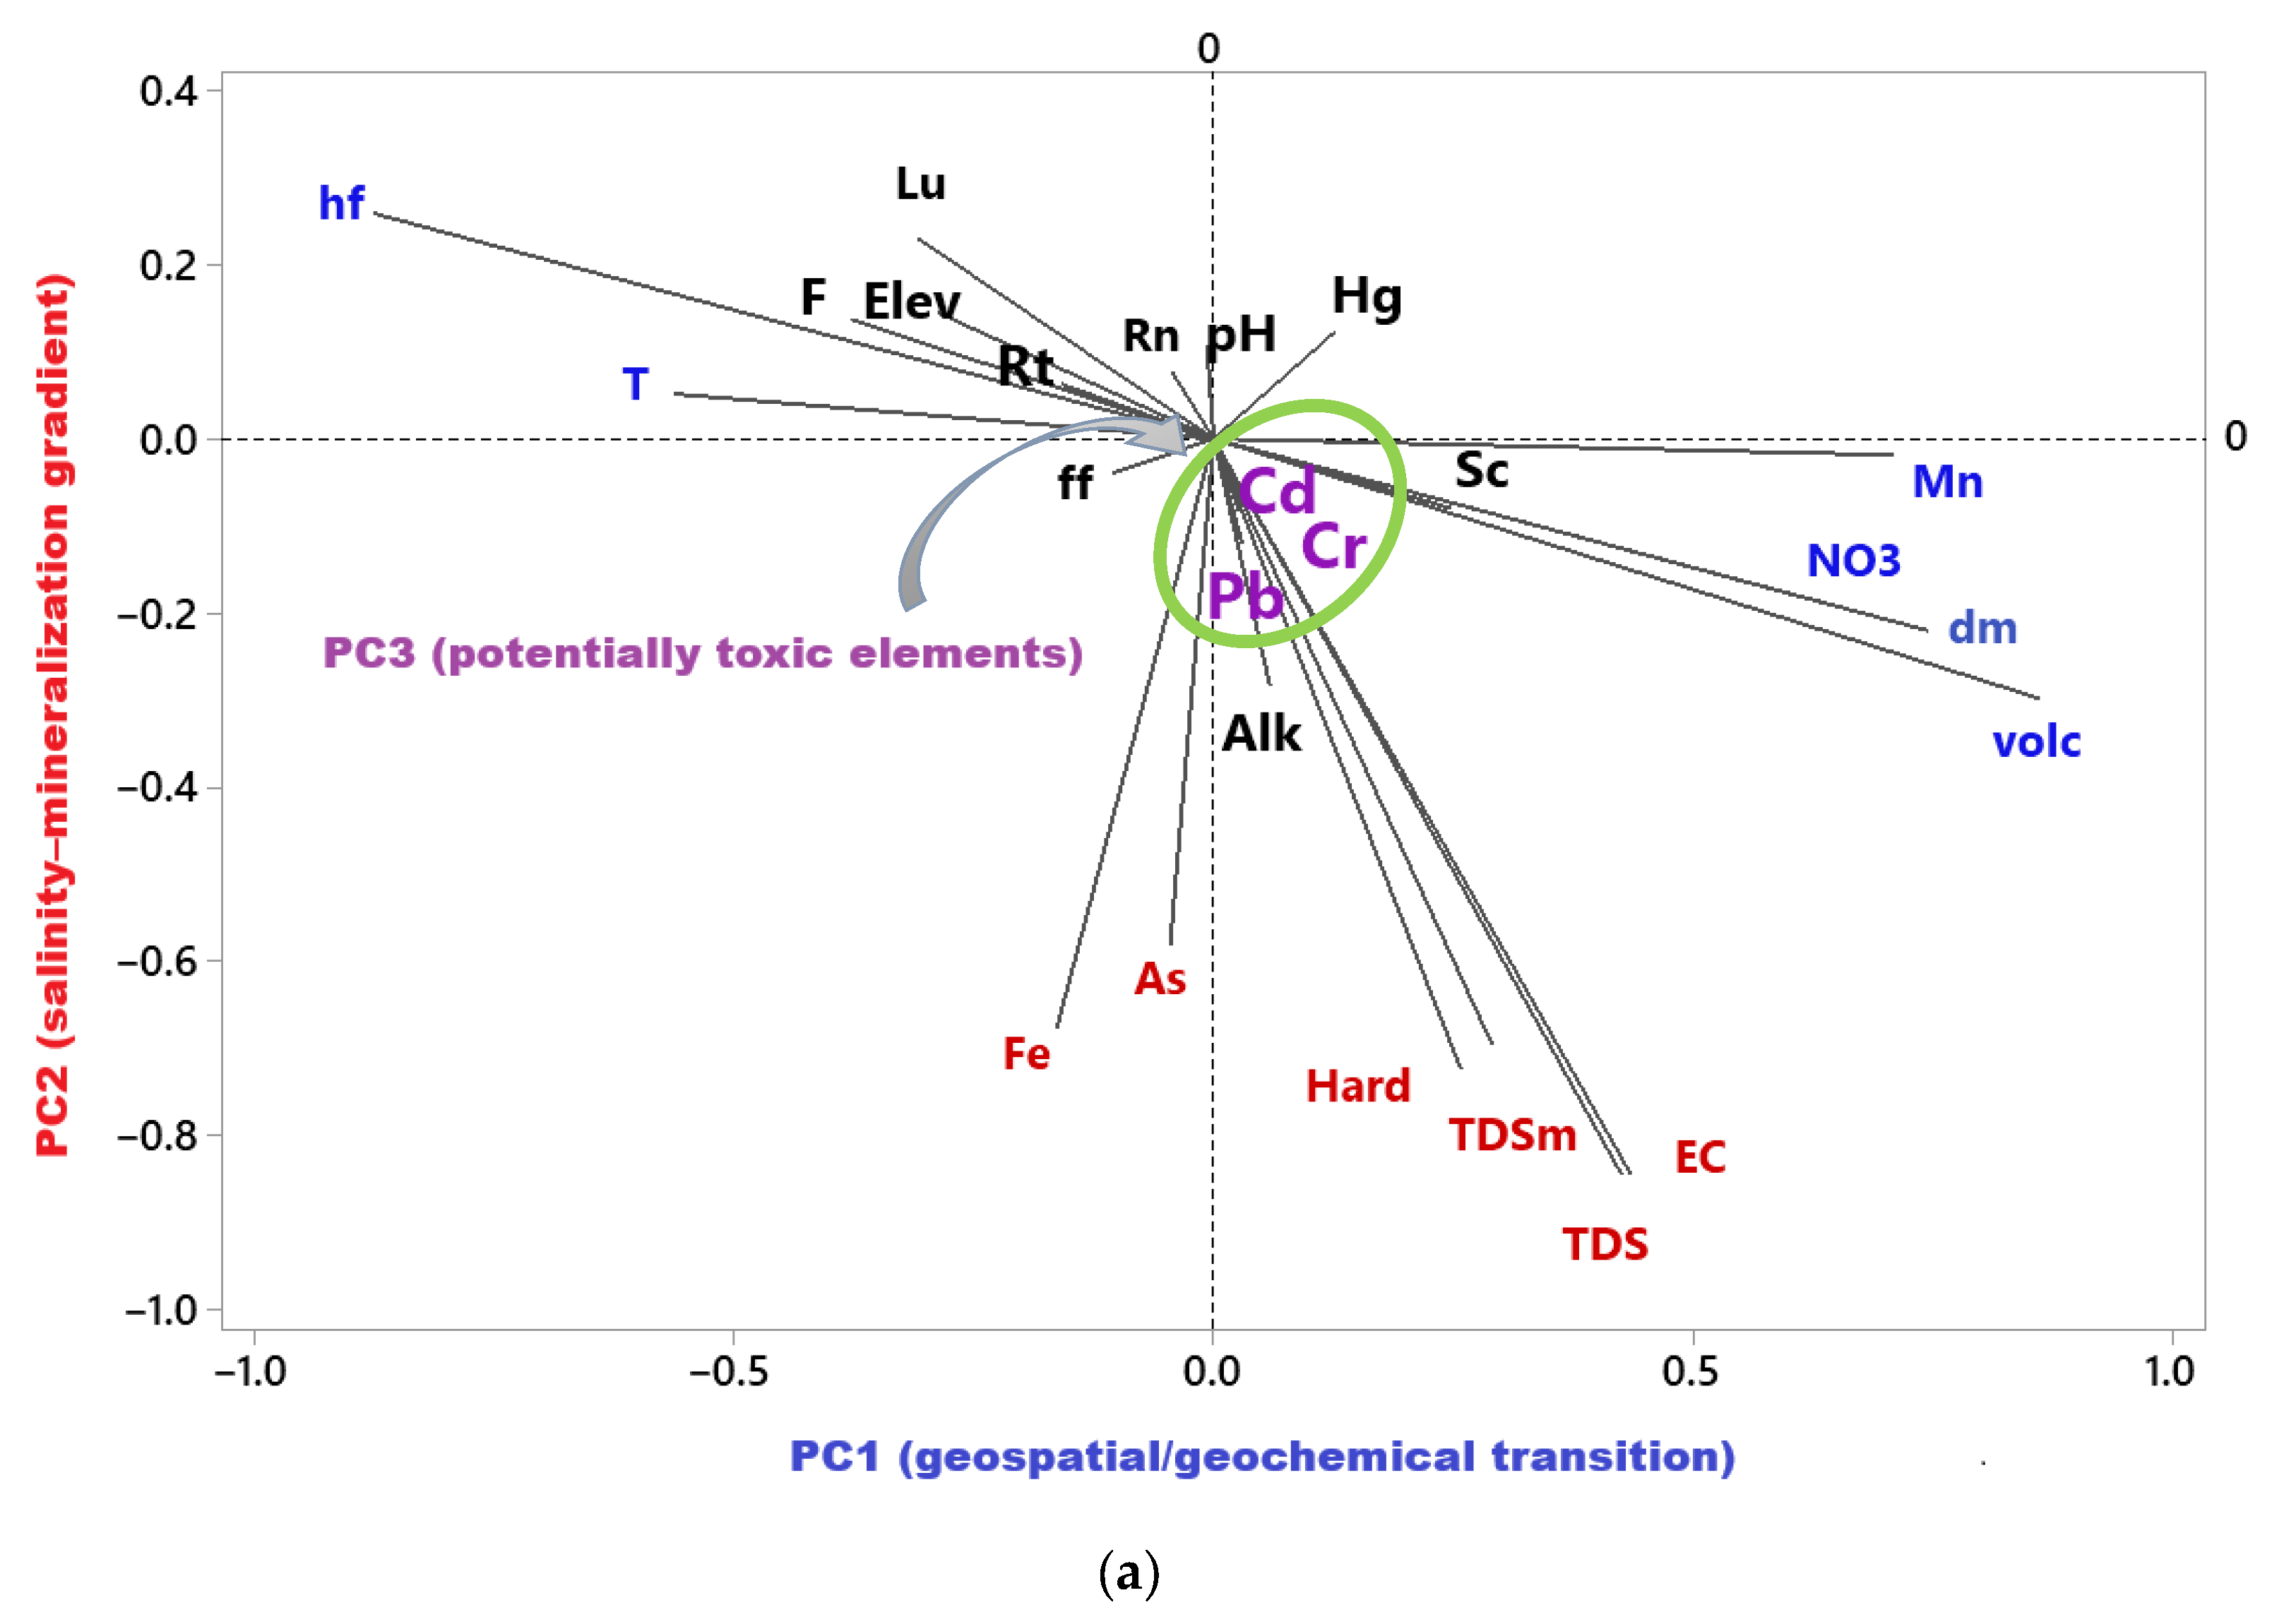
Thus, PC1 (17%) was characterized by high positive loadings for lithological indicators such as Hf, Dm, and Volc, as well as Mn and NO3; it can represent a geogenic component combined with nitrate contamination, possibly linked to diffuse agricultural sources. PC2 (15%) exhibited high negative loadings for EC, TDS, and TDSm, as well as for Hardness, Fe, and As. This suggests a salinity and mineralization gradient, resulting from water–rock interactions and element mobilization under reducing conditions. PC3 (14%) was dominated by potential toxic elements (Cd, Pb, and Cr), indicating trace metal contamination, possibly from anthropogenic sources such as mining or industrial discharge.
From PC4 to PC8, each component showed variances of less than 10%. While PC4 (7%) can represent carbonate-rich conditions, which influence the mobilization of certain metals under specific pH regimes, PC5 suggests that natural fluoride mobilization is enhanced in more alkaline environments. PC6 (6%) and PC7 (5%) were defined by structural (ff) and spatial/land-use (Lu, Sc, and Rt) controls, respectively, linked to aquifer heterogeneity. Finally, PC8 (5%) was dominated by Rn, confirming its distinctive behavior compared to the other hydrogeochemical parameters.
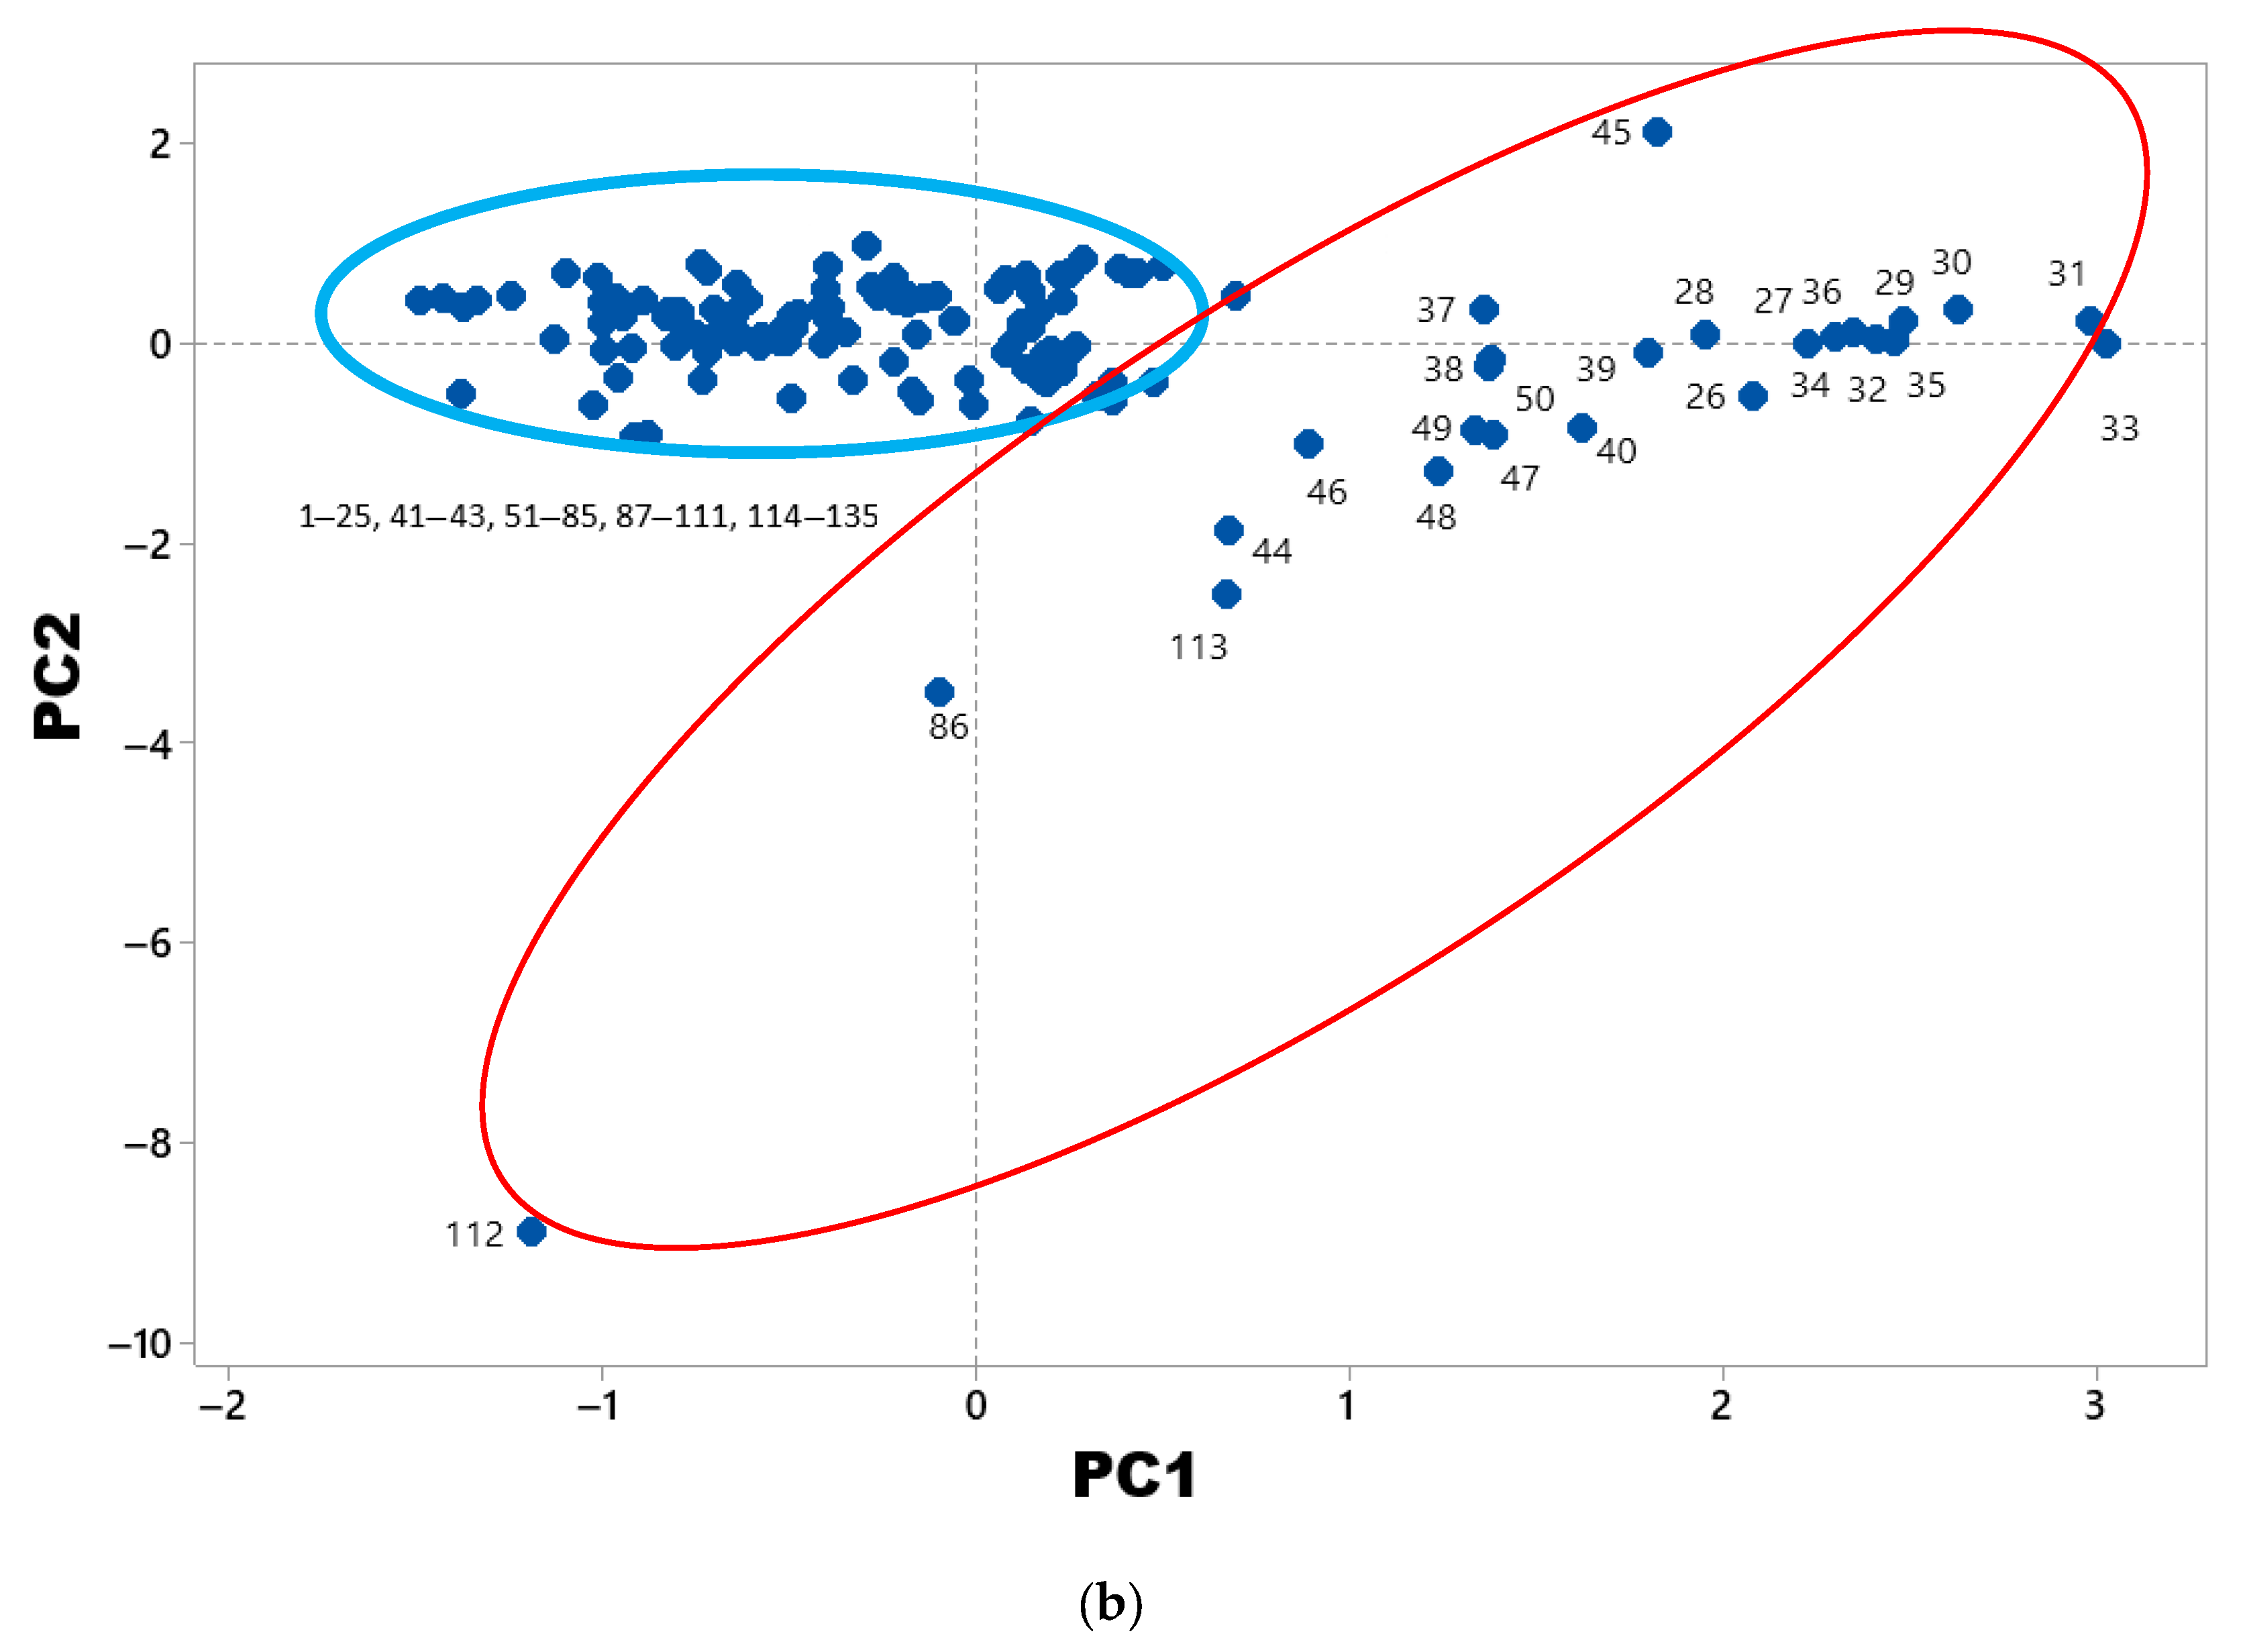
As shown in Figure 3, the graph illustrates the arrangements of variables and wells in the first two components. In Figure 3a, PC1 and PC2, along with the additional PC3, account for most of the total variance and reflect distinct geospatial patterns in groundwater geochemistry. PC1 differentiates the areas where natural geological controls predominate (lithogenic salinity, redox-sensitive element mobilization, and geothermal gradients) from those influenced by different lithological contexts, redox conditions, or anthropogenic inputs, particularly agricultural activity (high nitrate loading). Thus, salinity characteristics are located in the lower-right quadrant, where TDS, hardness, and electrical conductivity are grouped, while geological variables are grouped in the upper-left quadrant. The lower-left quadrant also indicates the similarity between ion contents As and Fe, produced from rock-water interaction. Finally, in PC3, the potentially toxic metals were grouped within the green circle. Figure 3b shows the similarity between wells. Thus, wells with high salt contents that are distant from high heat flow zones are grouped within the red circle. Wells located near mineralized areas and volcanoes, with high heat flow values and temperatures, are highlighted within the blue circle.
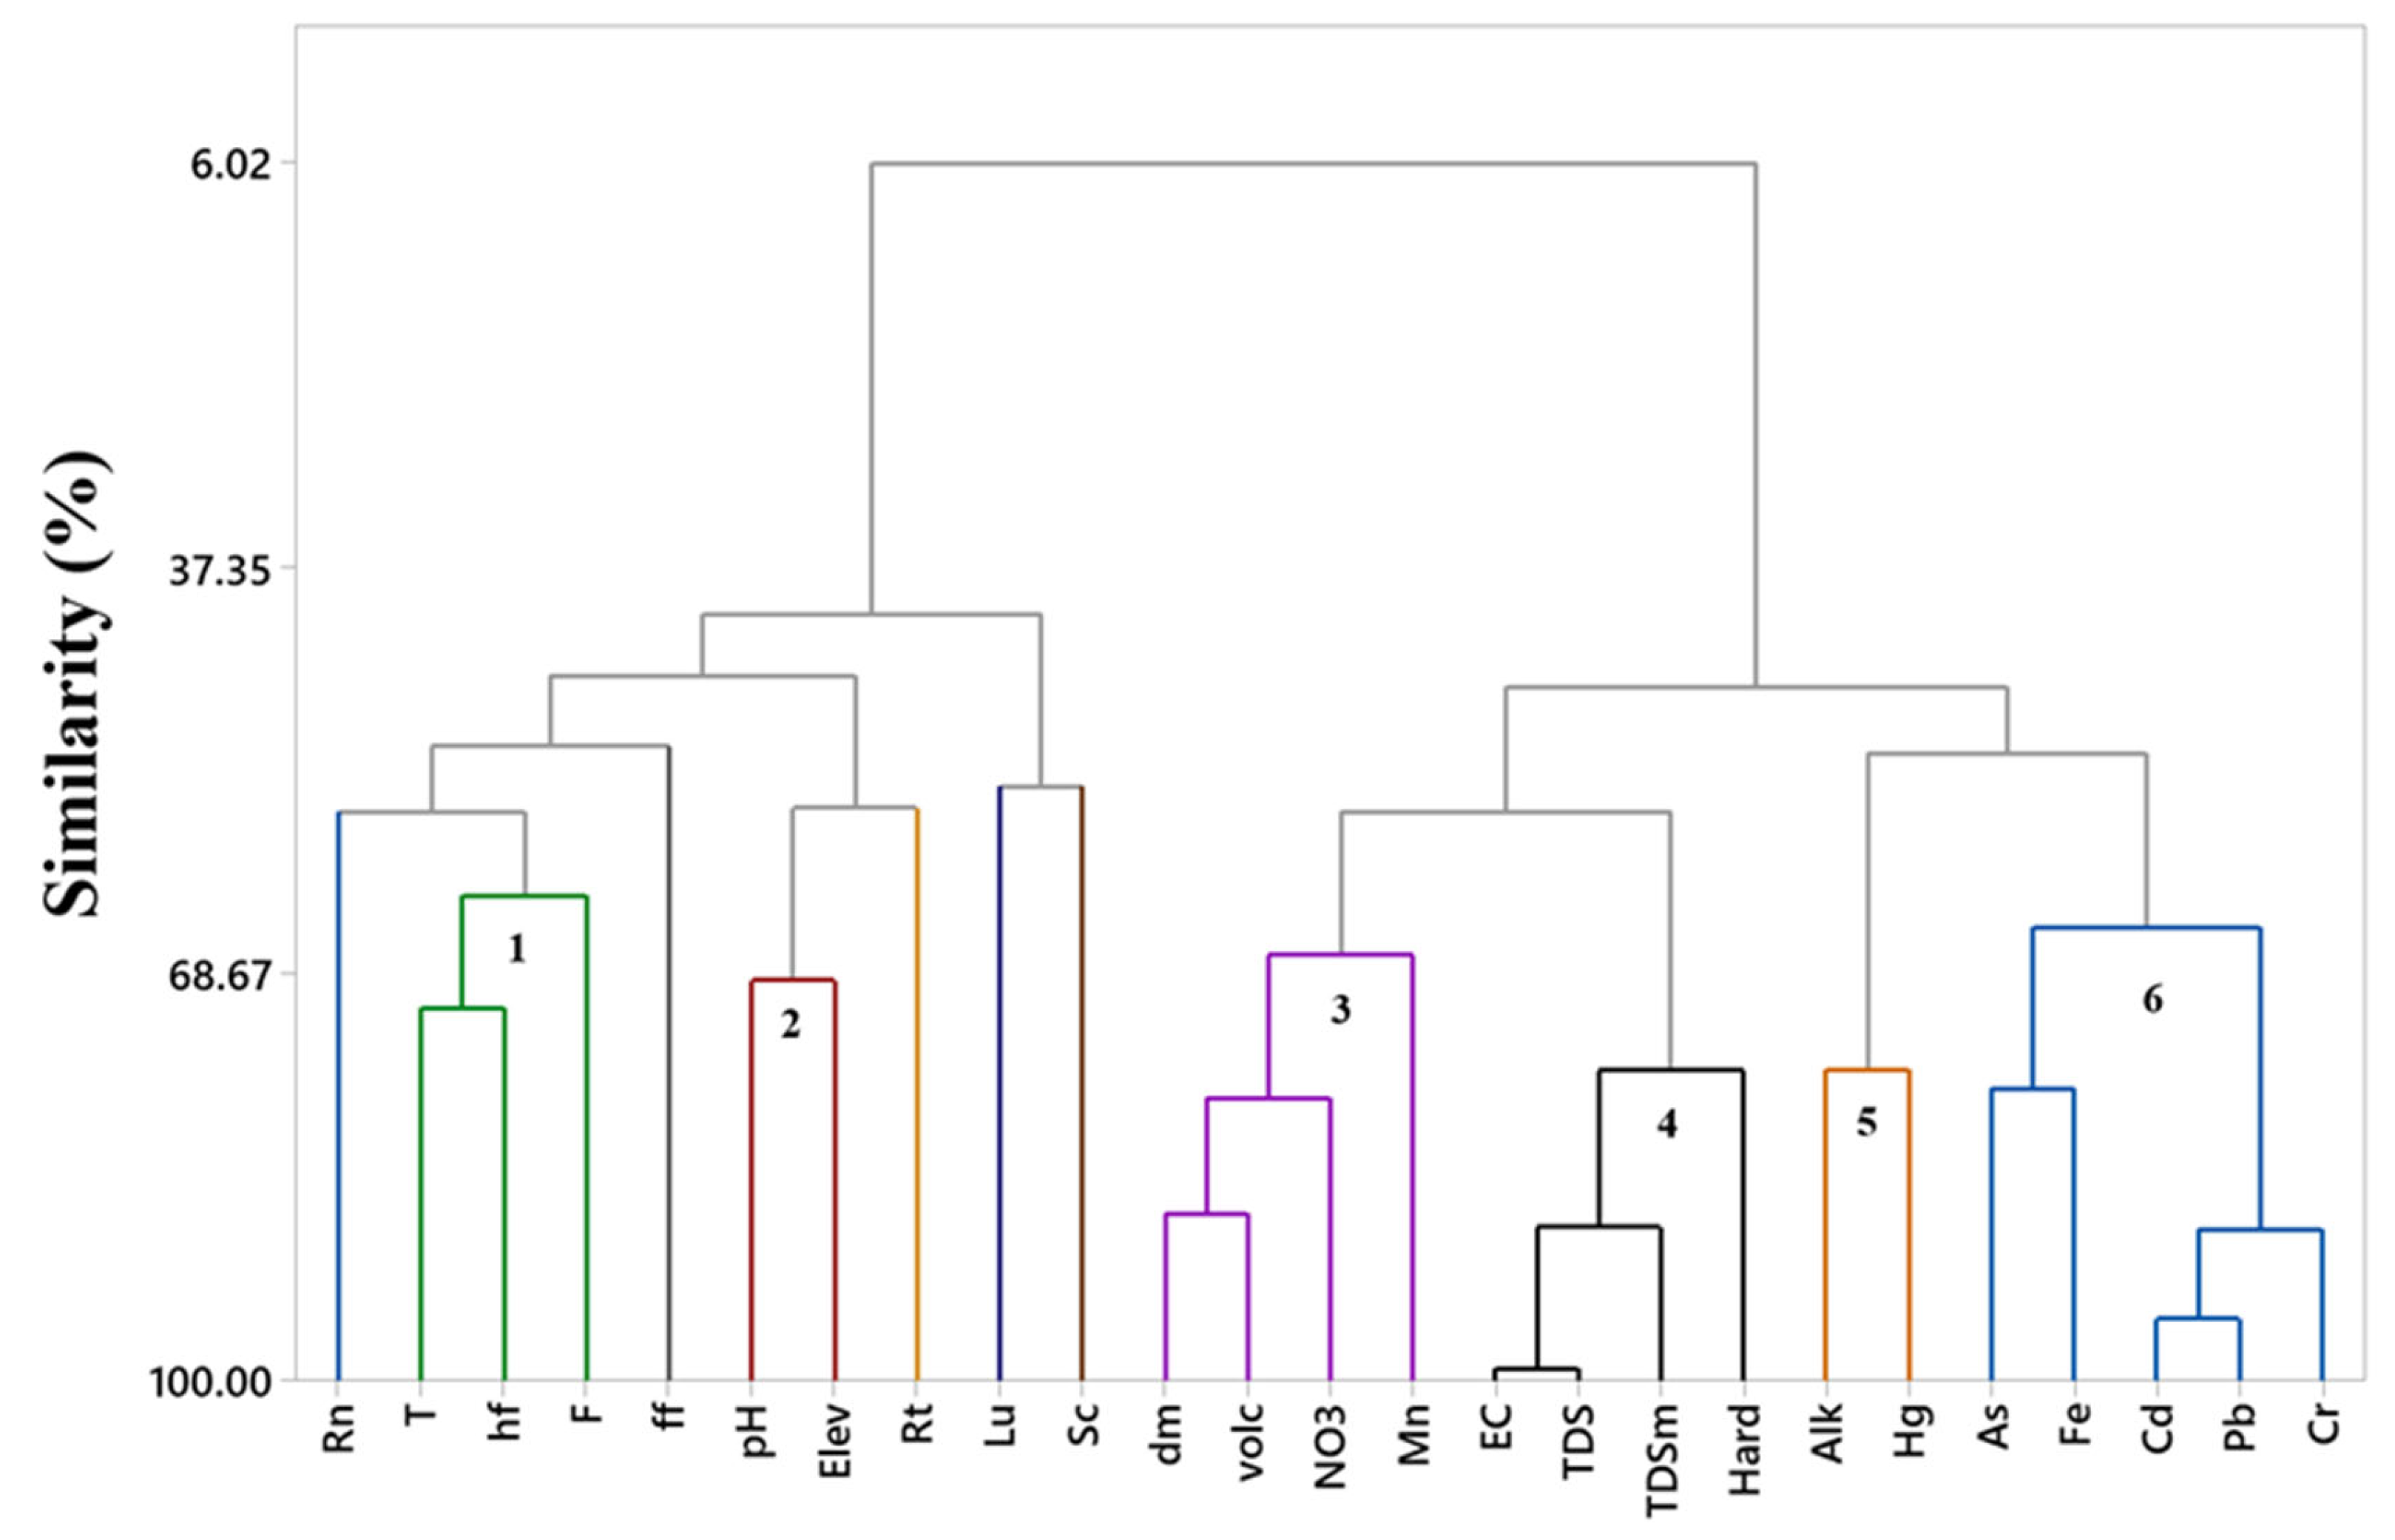
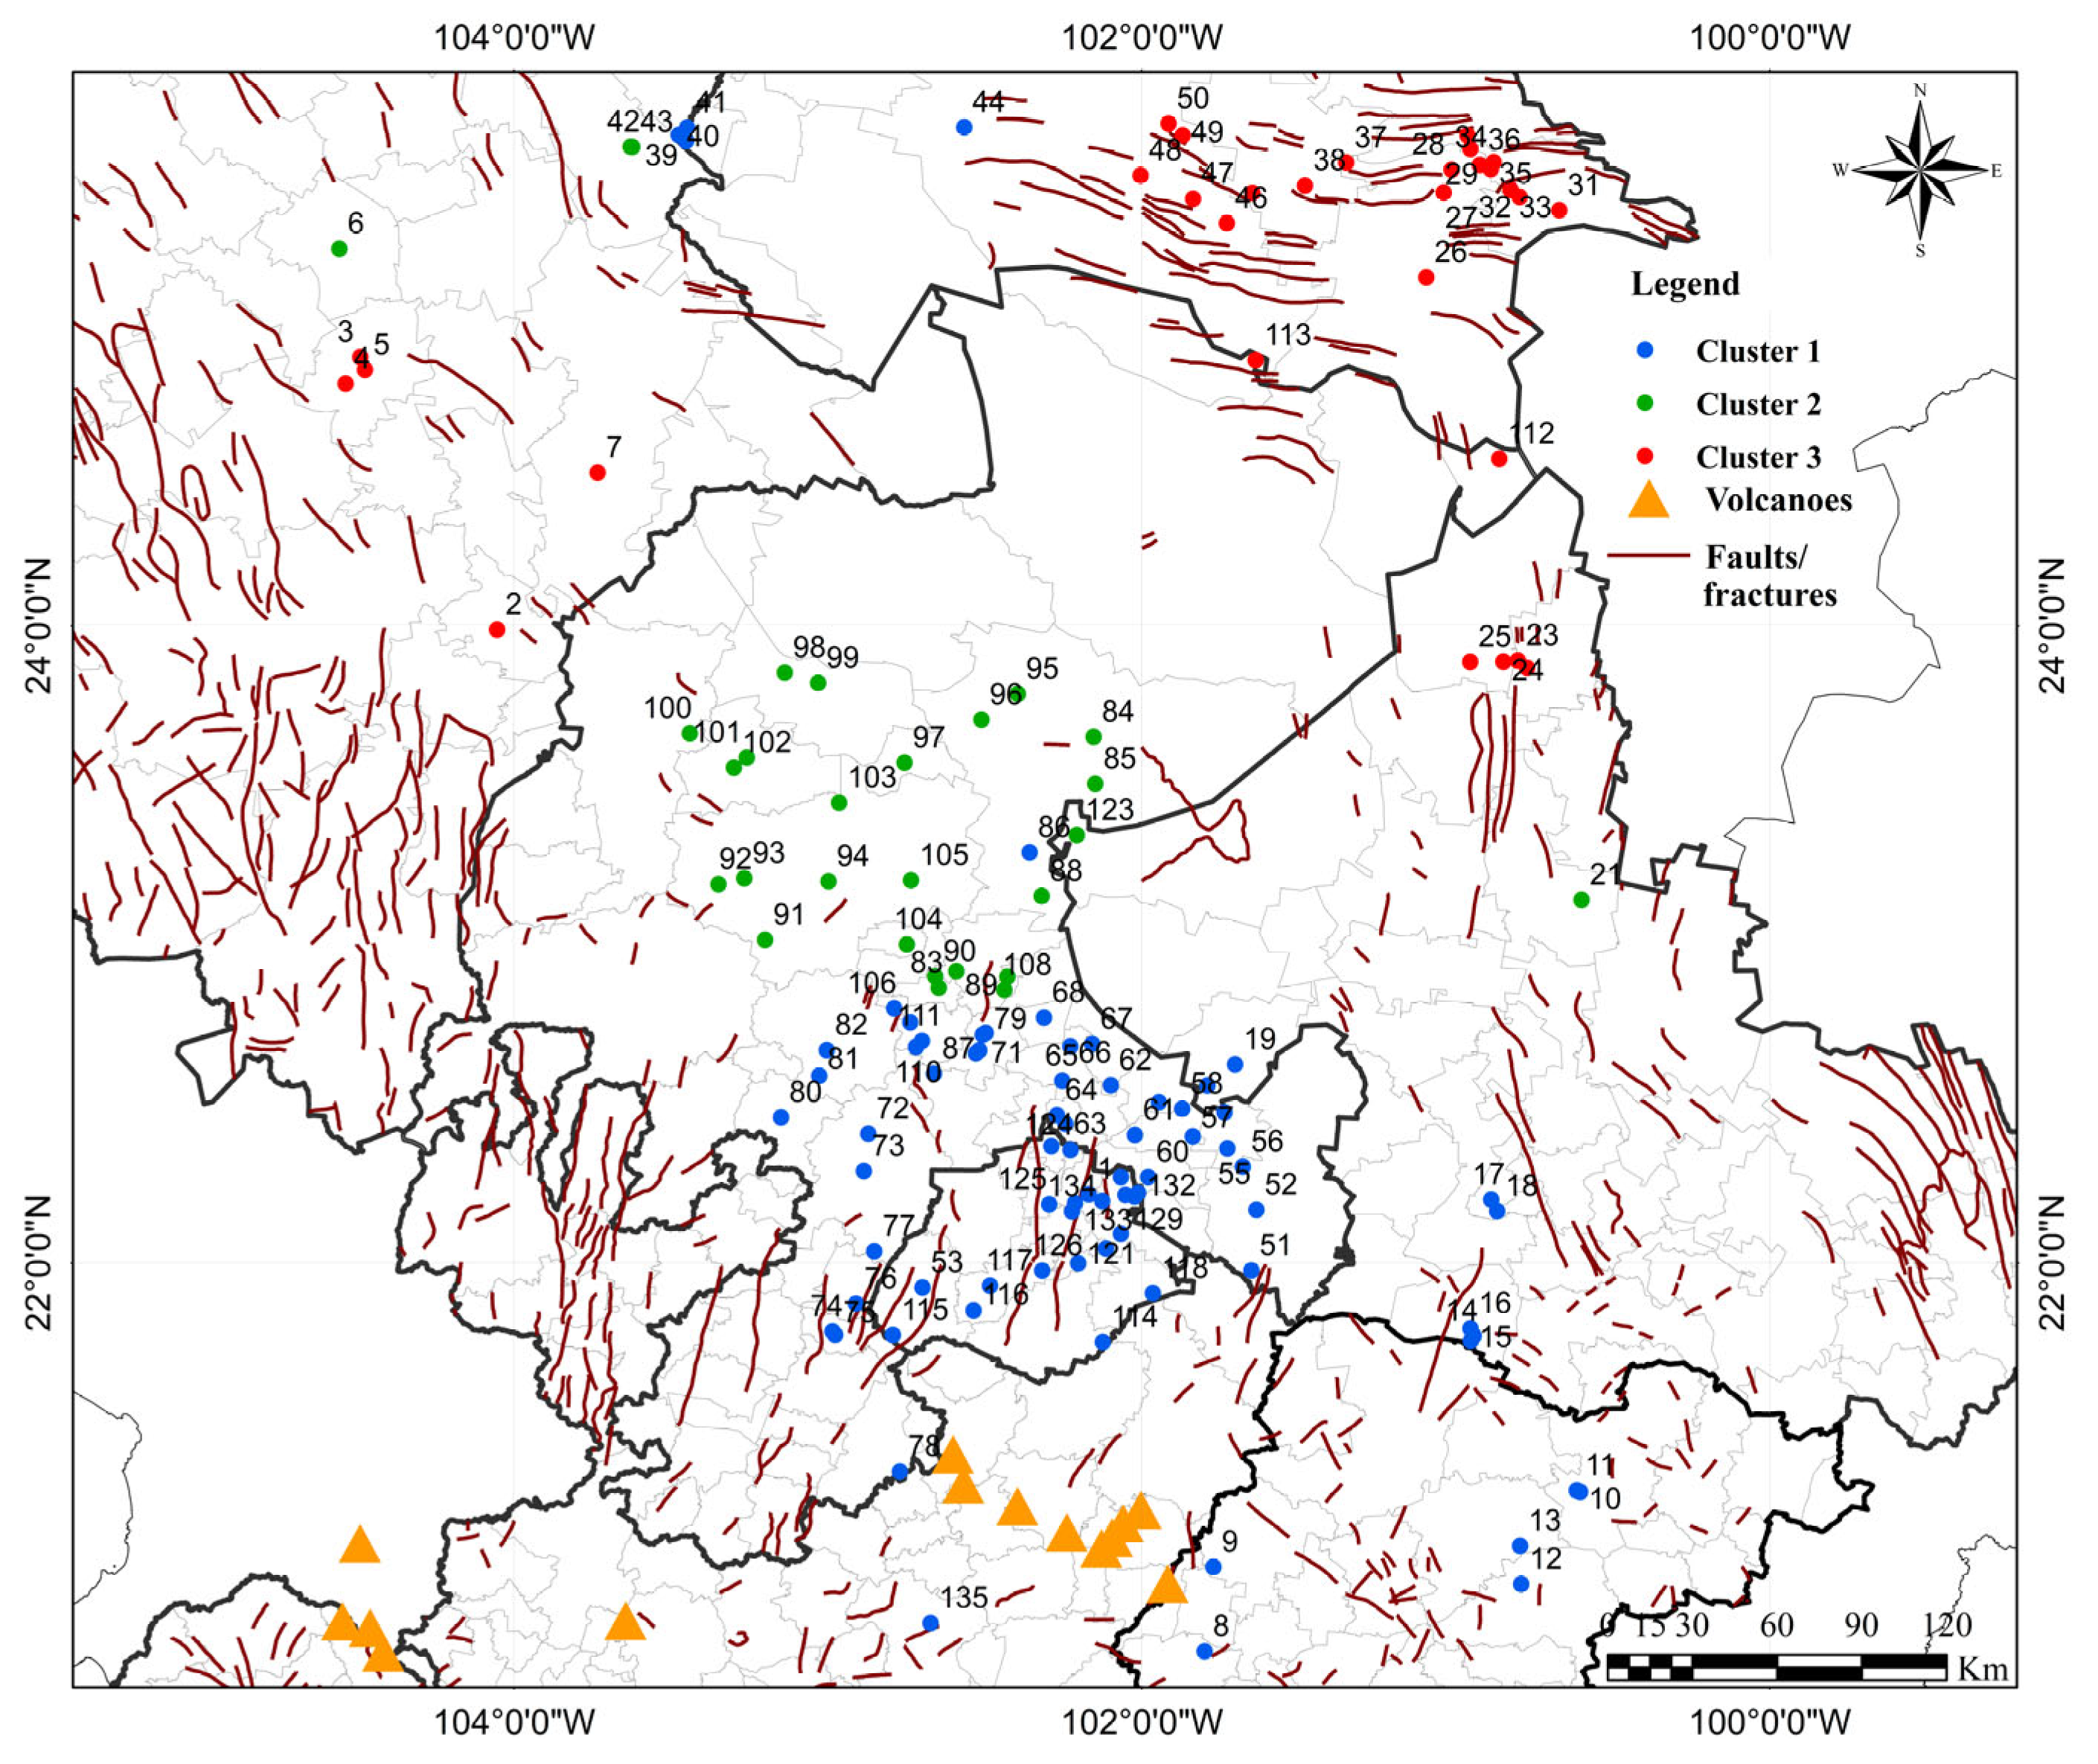
Based on the groundwater samples, the variables formed six distinct clusters, all of which were consistent with the PCA results. Figure 4 details the groups formed by variables with a similarity greater than 60%. Variables grouped within these clusters reflect strong covariance and similar PC loadings. Notably, some variables remain ungrouped (above the 60% similarity threshold), which reflects their behavior, as observed in the PCA, and justifies their unique contribution to the observed multivariate pattern. The highlighted clusters are salinity variables (cluster 4), alkalinity and mercury (cluster 5), potential metals (Cd-Pb-Cr) and Fe-As (cluster 6), radon content in wells located at high altitudes, and groundwater temperature in areas with greater heat flow (cluster 1). Additionally, the wells were clustered based on the similarity of their hydrogeochemical composition, using Euclidean distance (≥60%), as shown in Figure 5. The cluster graph of the wells is presented in Appendix B, Figure A1. Three groups of wells were identified, reflecting the combined influence of the variables identified in the PCA, mainly from the first three components. This grouping classifies sampling sites based on geochemical patterns: (a) In Cluster 1, wells were located to the north (in the states of Durango, Coahuila, and northern San Luis Potosí), (b) in Cluster 2, wells were located in central Zacatecas, and (c) in Cluster 3, wells were located in the southeastern section of the study area (south of Zacatecas, Guanajuato, west of San Luis Potosí, and Aguascalientes.
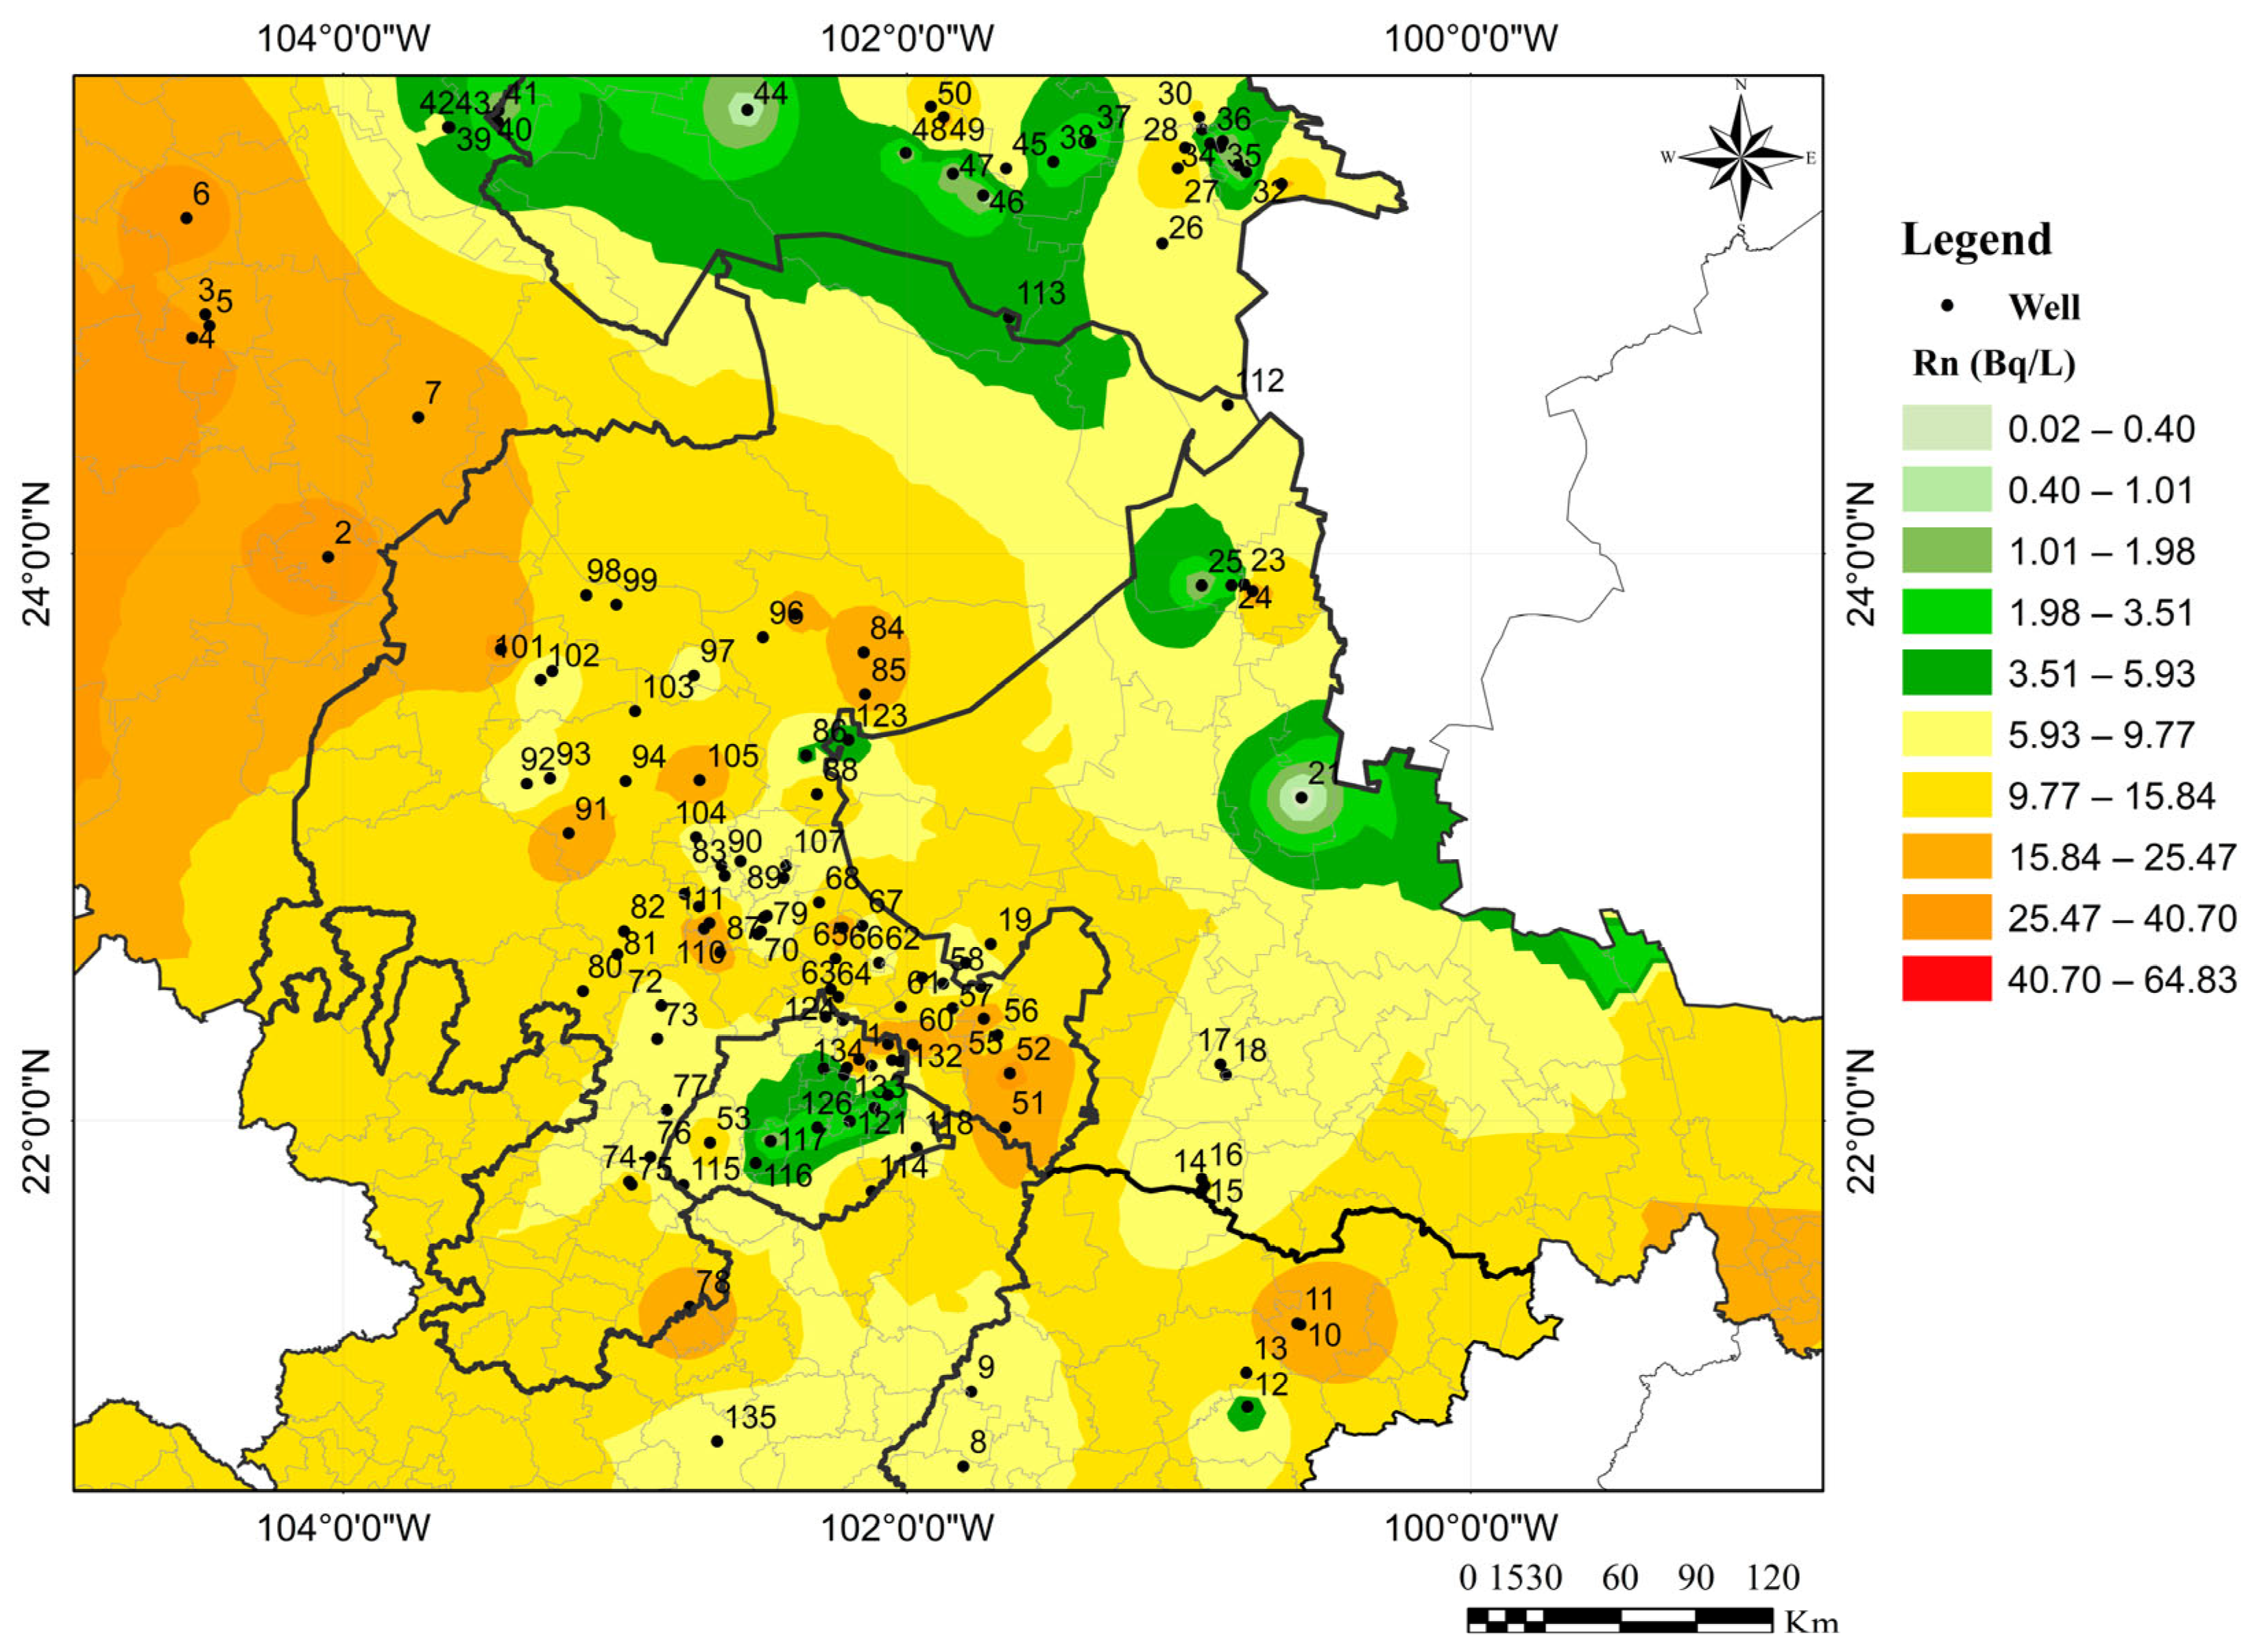
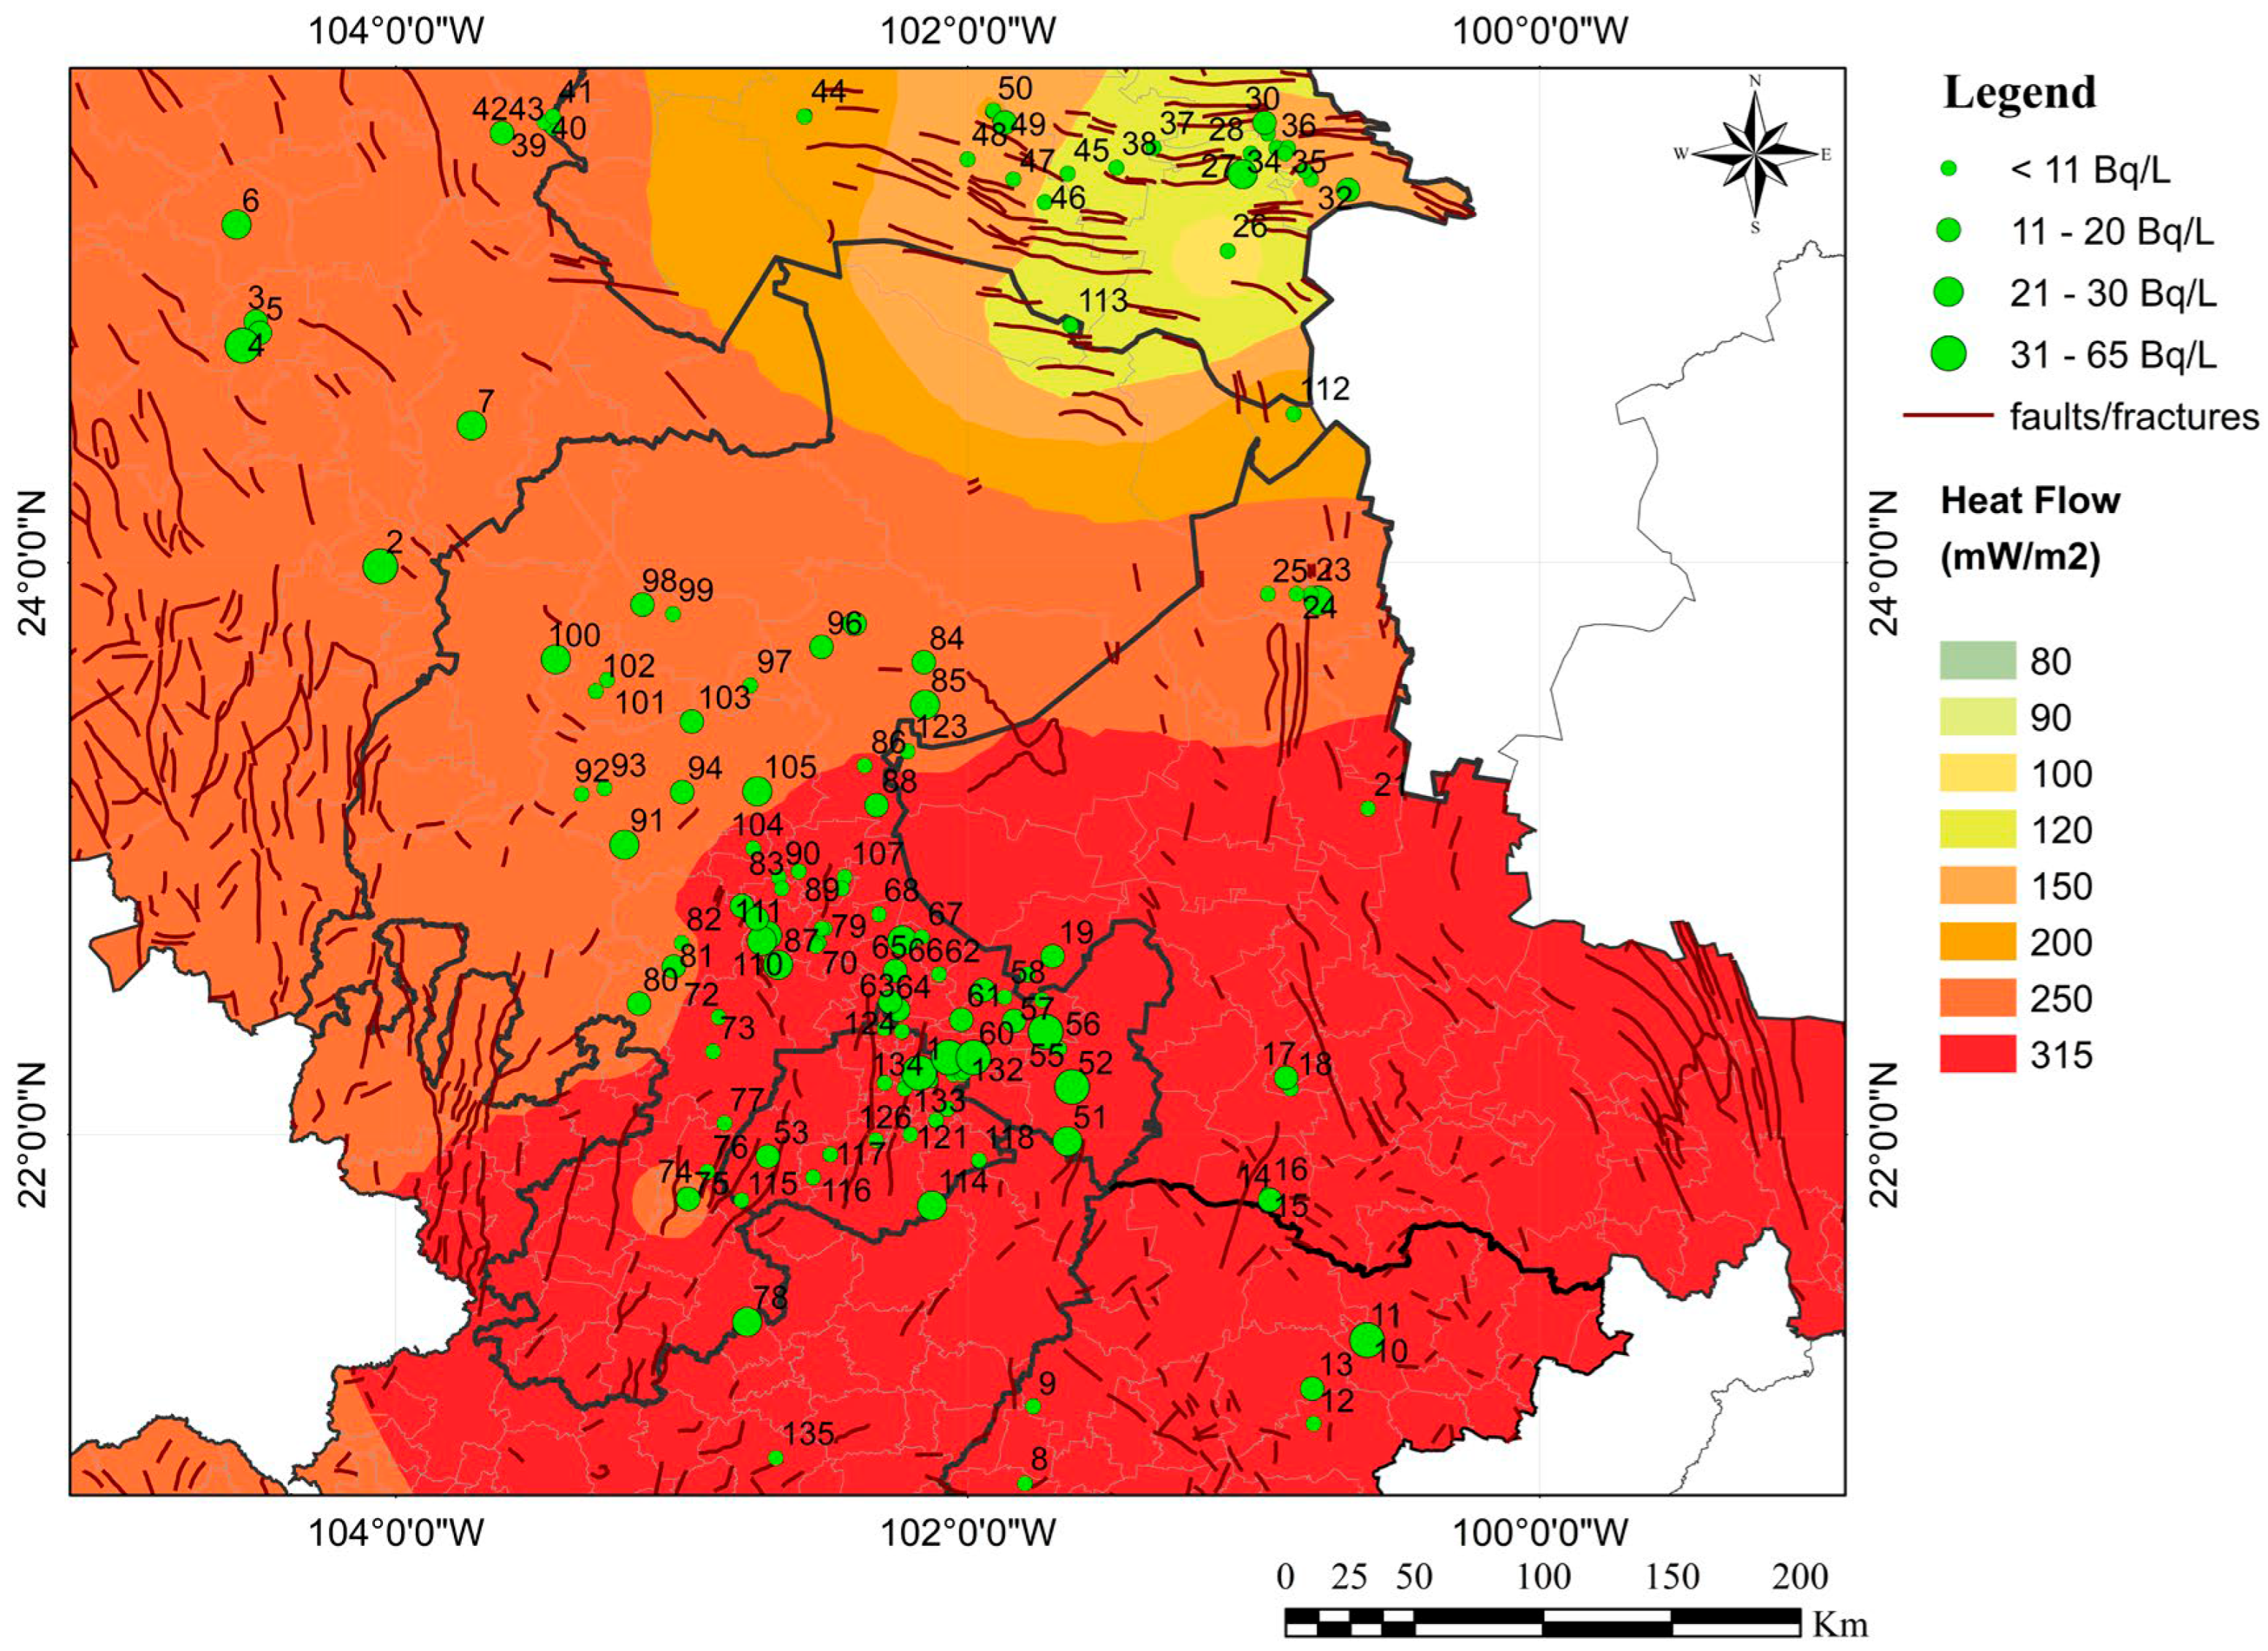
In contrast, Figure 6 presents the kriging analysis for radon concentrations in groundwater. It was observed that the wells with the highest radon concentrations are located in the western part of the study area, with the highest values recorded in the southern region. The spatial distribution of hf in groundwater was obtained using the IDW method (Figure 7).

4. Discussion

This regional groundwater assessment provides a spatial understanding of the distribution of chemical constituents across the study area, with a particular emphasis on radon concentrations and their geochemical context. By integrating geostatistical and multivariate approaches, the analysis provides insights into the spatial variability of groundwater composition and the processes that influence radon occurrence.
The PC1 showed a systematic covariance between variables such as electrical conductivity (EC), total dissolved solids (TDS), nitrates, heat fluxes, temperature, and proximity to volcanic and mineralized areas, indicating a complex interplay between spatial gradients/hydrogeochemical processes and geothermal conditions (Table 2). Notably, the significant negative correlation between salinity indicators (EC and TDS) and heat fluxes suggests (r = −0.6) that higher solute concentrations do not necessarily accompany elevated thermal gradients. This observation supports at least two plausible interpretations.
Firstly, zones exhibiting higher heat fluxes likely correspond to environments characterized by rapid groundwater recharge, such as fractured aquifers near active volcanic areas, where groundwater exhibits short residence times and limited water-rock interaction, resulting in low salinity. This pattern is evident in the wells located in the southern section of the study area (Figure 3b, marked by a blue circle; Figure 5, denoted by blue dots). Such conditions are typical of active volcanic or tectonically fractured regions, where high permeability and accelerated groundwater flow foster diluted hydrogeochemical processes [41,42]. This phenomenon has been observed in the volcanic regions of central Mexico, such as the Puebla-Tlaxcala Basin, where proximity to volcanic systems is correlated with low-salinity and high-temperature waters [43]. Additionally, agricultural areas can influence nitrate levels (PC1) in irrigation recharge zones, where shallower groundwater is more susceptible to surface contamination. This vulnerability is reinforced by the fact that approximately 60% of the wells in these aquifers are used for agricultural purposes [44], indicating a significant nutrient load from land-use practices [45].
Conversely, to the north and northeast of the study area, the wells located in the states of Durango, Coahuila, and northeastern San Luis Potosí, are in areas farther from direct volcanic influence, with relatively less thermal flux and greater hydrogeological confinement. These wells tend to present high concentrations of TDS, as shown in Figure 5 (red points) and Figure 3b (red circle). The lithology of these aquifers can directly influence the physicochemical quality of groundwater, especially in terms of salinity and the type of hydrogeochemical facies. Thus, groundwater EC ranges from 400 to 4920 μS/cm, where 68% of these wells showed values greater than 1000 μS/cm. These wells are located in the aquifers found at Saltillo–Ramos Arizpe (0510), Manzanera–Zapalinamé Region (0511) and Cedral-Matehuala (2407), in the state of San Luis Potosí. Their geology is dominated by limestone and alluvial materials, with low to moderate salinity recorded (<1500 mg/L STD) and a predominance of calcium and magnesium bicarbonate waters [46,47,48]. Likewise, the General Cepeda-Sauceda aquifer (0505) in Coahuila shows greater hydrogeochemical heterogeneity. It comprises identified gypsum sequences, volcanic materials, fractured limestones, and alluvial deposits, resulting in sulfated and calcium bicarbonate water with moderate to high salinity (1000 to >2000 mg/L TDS). In these sedimentary aquifers, prolonged interaction with sedimentary materials (including silts, clays, and evaporites) typically results in fine-grained materials with low permeability, which slows groundwater movement and increases residence time. It extends contact, promoting ion exchange, adsorption–desorption reactions, and solute accumulation, which may be exacerbated through evaporation [42] or by mixture with agricultural water infiltration [49,50].
Likewise, the simultaneous presence of Fe and As (PC2) in groundwater has been widely documented in various regions [51,52]. This co-occurrence is primarily associated with reducing conditions, where microbial activity and the abundance of organic matter foster the dissolution of iron and manganese oxides, releasing Fe2+ and Mn2+ into the groundwater [53]. Arsenic, which is commonly found adsorbed or coprecipitated with these oxides, is released during these processes, mainly in its most mobile and toxic form As3+ [54,55]. The highest values of Fe (0.5 mg/L) and As (0.11 mg/L) were detected in a well in the state of Zacatecas (well ID: 112); however, the As values exceeded the permissible limit (0.025 mg/L) established by Mexican legislation [56] in wells in Aguascalientes, Coahuila, and Durango.
Additionally, the highest concentrations of Mn are found in the wells located in the southern part of the state of Coahuila (red points, Figure 5), with values ranging from 0.12 to 0.43 mg/L. These concentrations are favored by geological conditions such as fluvial-lacustrine sediments, altered volcanic rocks, as well as silts and clays rich in organic matter, which create environments conducive to the accumulation and subsequent release of these elements under anoxic conditions. Notably, the Principal-Lagunera Region aquifer (0523), characterized by complex sedimentary lithology and overexploitation, shows sodium facies and the presence of contaminants such as arsenic and fluoride, with salinities exceeding 3000 mg/L [57]. Several authors have reported these geological characteristics in regions such as the Comarca Lagunera (Coahuila), San Antonio-El Triunfo (Baja California Sur) and the Apan Valley (Hidalgo), where arsenic concentrations above 400 μg/L have been recorded, along with Fe and Mn levels that exceed the permissible limits of 0.3 mg/L and 0.15 mg/L [58], respectively, by several times [56].
PC3 identifies a group of potentially toxic elements (Cd, Cr, and Pb), whose presence is strongly associated with proximity to mineralized zones (Table 2). Unlike PC1 and PC2, which are dominated by variables related to salinization processes, hydrothermal interaction, and agricultural pollution, PC2 corroborates the geochemical influence of lithogenic origin, linked to the mineralogy and geochemistry of the aquifer’s parent materials. The wells with these characteristics are shown in red (Coahuila) and blue (Guanajuato and southern San Luis Potosí), in Figure 5.
In Coahuila, the General Cepeda-Sauceda (0505) and La Paila (0509) aquifers exhibit geological conditions indicative of hydrothermal alteration processes and metallic mineralization, which affect groundwater quality [59]. In the General Cepeda-Sauceda aquifer, mineralized bodies containing magnetite, ilmenite, zircon, and rare earth elements have been identified within the sandstones of the Difunta Group. Furthermore, surface oxidation processes attributable to the weathering of these mineralized formations have been observed [60]. These mineralized formations can be associated with surface oxidation processes through weathering [60]. Likewise, the Saltillo-Ramos Arizpe and Saltillo Sur aquifers are located within a region characterized by the presence of complex geological structures, with limestone fracturing and tectonic activity that has been conducive to the circulation of hydrothermal fluids [61,62]. In these areas, evidence of metallic mineralization has been recorded, primarily of iron and manganese, as well as trace elements such as arsenic and fluoride, which are linked to water-rock interaction processes in shallow geothermal environments. This grouping suggests that the release of these heavy metals into groundwater is closely linked to the weathering of sulfide minerals and/or the mobilization of elements from hydrothermal disturbance areas with volcanic characteristics or metallic mineralization [63,64].
Previous studies of aquifers in Guanajuato and Aguascalientes located south of the study area determined that the geological formations in this region are rich in lead sulfides, zinc, and arsenopyrite, which can release toxic elements into the aquifers through oxidation or acid dissolution processes [65]. Thus, the spatial coincidence between the areas with high concentrations of Cd, Cr, and Pb and the mineralized geological units suggests that they have a natural origin, which is amplified by the redox conditions of the aquifer as a dominant factor.
These findings have also been reported in the Eastern Basin of Mexico (in the State of Puebla), where areas rich in fluoride and nitrate spatially coincide with those affected by heavy metals as a result of the overlapping of natural processes and anthropogenic pressures [66]. Therefore, both interpretations are consistent with previous studies demonstrating the diversity of hydrogeochemical processes controlled by both geothermal and hydrogeological factors [67].
In general terms, it was observed that the wells with the highest radon content (≥11 Bq/L) are located in areas with rhyolitic rocks, rhyolite-acid tuffs, and conglomerates. In rhyolitic rocks, the largest share of whole-rock uranium is often contained in volcanic glass [68,69]. Glass-water interactions readily remove uranium from volcanic glass; subsequently, secondary uranium mineralization can occur along fractures, bedding planes, porous and permeable zones, or in clay, zeolites, and even organic-rich units, either within the volcanics or in adjoining rock units. Consequently, the association with structural faults plays a significant role in the variability of radon concentrations in groundwater [11,21]. The most favorable geologic setting for groundwater leaching of uranium from felsic volcanic rocks is are calderas [69] and deposits of fluvial and lacustrine tuffaceous sediments, which are derived from contexts with numerous complexities in the Altiplano Central throughout the Cenozoic [70,71].
Although radon loads primarily onto PC8, indicating its statistical independence from most other variables, its groundwater concentrations showed low but statistically significant correlations (p-value ≤ 0.05). Radon showed correlations with variables such as temperature (r = 0.17), fluorides (r = 0.18), elevation (r = 0.20), distance to volcanoes (r = −0.19), and nitrates (r = −0.17). It suggests a geogenic influence associated with deep groundwater flow, thermal gradients, and rock–water interaction at high altitudes (Figure 3a and Figure 4); however, since the shallowness of the wells range from 5 m to no more than 200 m, well depth is not a determining factor for temperature. Radon tends to accumulate in waters with longer residence time and in confined areas, where prolonged interaction with uranium- or thorium-rich formations favors its presence [72]. Moreover, concentrations of radon and fluoride in groundwater have shown positive correlations in various geological environments, particularly in uranium-rich granitic rocks [73]. In addition, hydrogeochemical studies have shown that fluoride can influence radon solubility and mobility in groundwater, particularly under acidic conditions, where it can stabilize radon in solution and reduce its volatilization, possibly by altering degassing dynamics [74]. Thus, hydrogeochemical parameters such as pH, alkalinity, and temperature significantly affect the solubility and transport of these elements [75], as observed in volcanic aquifers of central Italy. These findings suggest that fluoride may function not only as a co-occurring indicator but also as a modulating factor in the aqueous behavior of radon.
Although this study does not include direct measurements of groundwater flow, and the PCA did not reveal a clear association between radon concentrations and ff, previous research has established a strong relationship between radon levels and groundwater flow paths intersecting tectonic structures. Faults and fractures can act as conduits that facilitate radon migration from bedrock to groundwater [58,76]. Likewise, temporal variations in radon concentrations near active faults suggest that seismic activity may enhance radon emanation, potentially influencing adjacent groundwater systems [77].
In central Mexico, the region known as Intraplate Volcanism Central Province is a geothermally active zone with thermal and structural conditions conducive to the development of deep hydrothermal systems [78]. Thus, water from deep wells, above 1 km, typically contains significantly higher levels of natural radioactivity (such as radon) than surface water in rivers [79]. The shallow wells in this region (Figure 5, blue points) contain high concentrations of radon and fluoride, both of which show significant correlation with groundwater temperature. In the analyzed wells, fluoride exhibited similarities with heat flow and temperature above 60% (Figure 3a and Figure 4). Although radon did not correlate with heat flow, as expected, given that all wells are used for drinking water and are less than 200 m deep, it was similar to this variable in 56% of cases (Figure 4). Moreover, the highest concentrations of radon are found in the western and southern parts of the study area (Figure 6), coinciding with heat flux values ≥150 mW/m2, which reflect thermal anomalies [80] (Figure 7). This can be explained by the interaction between active tectonic structures and the thermally heated natural waters, where magmatic ascent promotes high thermal gradients and temperatures at aquifer depths greater than 1 km [81].
Furthermore, much of the study area produces favorable conditions for deep recharge and the formation of confined hydrothermal systems. In these systems, meteoric waters can infiltrate through faults and highly fractured zones, are heated by contact with magmatic bodies or hot rocks and rise again to the surface. This dynamic contributes to the geochemical diversity of groundwater, which also conditions the mobilization of elements such as radon, fluorides, and other geogenic tracers associated with magmatism, as observed in other volcanic regions worldwide [82,83,84].
Finally, the negative correlation between radon and nitrates is consistent with the fact that the latter originate mainly from recent contaminated infiltration events, such as agricultural activities and inadequate wastewater treatment. These ions are typically concentrated in shallow, oxidized groundwater [85]. In contrast, radon is generated by the radioactive decay of its parents and mobilizes in deeper, reductive or confined environments, where surface contamination processes have little or no influence [82].
Although this study provides critical information on radon occurrence and concentration distribution, as well as the hydrogeochemistry of groundwater in a geologically complex Mexican Altiplano, one of the main challenges lies in the complexity of the hydrogeological setting. The inclusion of multiple aquifers with contrasting geological, structural, and lithological characteristics generates high spatial variability in the hydrogeochemical data, limiting the ability to establish robust generalizations or to define uniform regional patterns. Factors such as the degree of fracturing, the depth of geological units, porosity, aquifer depth, and redox conditions significantly influence radon mobility [84,85]. Consequently, incorporating structural variables and flow dynamics into predictive models is essential to improve their accuracy [84]. In addition, radon analyses should be complemented with uranium and radium concentration values to identify leaching, fractionation, and transport processes [86,87].
Complementary studies are required to enhance the understanding of the processes governing radon occurrence and its interaction with other hydrogeochemical parameters. These include high-resolution spatial and temporal sampling campaigns [75], detailed mineralogical and structural characterization of aquifers, the use of stable and unstable isotopes to identify sources and residence times, and developing integrated hydrogeochemical models that consider climate change and overexploitation scenarios [40]. These strategies will not only enhance scientific knowledge of radon dynamics in groundwater but also support more informed water management decisions, particularly in regions where climatic pressures and intensive extraction compromise resource quality and sustainability.

5. Conclusions

The multivariate and geostatistical analysis of groundwater in the El Bajío region of Mexico reveals a complex interaction between hydrogeochemical, geothermal, and structural processes that control the quality and composition of the resource. The results show a strong connection between salinity, heat flux, and proximity to volcanic zones, indicating that higher temperatures do not necessarily result in increased solute concentrations. This behavior suggests rapid recharge conditions in fractured aquifers near volcanic structures, where short residence times limit water–rock interaction.
Additionally, the presence of toxic trace elements, such as Cd, Cr, and Pb, is influenced by the lithology of the aquifers. This geochemical signal is spatially well-defined and coincides with regions where geological settings favor the mobilization of heavy metals through acid dissolution processes and, likely, oxidation conditions.
Notably, radon was primarily associated with the eighth principal component, reflecting its distinct hydrogeochemical behavior and relative independence from the dominant salinity and redox gradients. This factor grouped radon with variables such as fluoride, temperature, heat flow, and elevation, suggesting that its presence is more closely tied to deeper groundwater flow paths, elevated geothermal gradients, and lithological characteristics favorable to uranium-bearing minerals. This grouping supports the use of multivariate approaches to differentiate geogenic from anthropogenic sources of radioactivity. Unfortunately, uranium and radium concentrations were not measured during the sampling campaign, preventing a direct assessment of their correlation with radon. Future studies should include measurements of uranium and radium isotopes, particularly in areas with high radon activity, to strengthen process-based interpretations and improve predictive understanding of radon behavior in relation to mineralogical sources and aquifer conditions.
Finally, the weak but consistent negative correlation with nitrates may indicate a limited anthropogenic influence in areas with higher radon levels, suggesting that radon occurs in deeper zones with longer residence times. Elevated radon concentrations are therefore more common in regions of higher altitude and geothermal flux, where tectonic and thermal conditions reinforce their distribution.
Overall, the findings highlight the need for a tailored approach to groundwater management, considering the diversity of sources, processes, and risks associated with each distinct hydrogeological context. Nevertheless, the high spatial variability caused by contrasting lithologies and structural complexity among aquifers limits the ability to generalize radon behavior. This underscores the need for integrated models that incorporate uranium/radium dynamics, flow paths, and redox conditions to assess radiological risk more accurately.

Author Contributions

Conceptualization: M.R.-V., A.B.S., H.V.C.B. and M.B.; methodology: A.B.S., M.R.-V., M.B. and H.V.C.B.; software: A.B.S. and M.R.-V.; validation: A.B.S. and M.R.-V.; formal analysis: A.B.S. and M.R.-V.; investigation: A.B.S., M.R.-V., H.V.C.B. and M.B.; resources: M.B. and M.R.-V.; data curation, A.B.S., M.R.-V., M.B., H.V.C.B. and A.V.V.; writing—original draft preparation: A.B.S., M.R.-V., H.V.C.B. and M.B.; writing—review and editing: M.R.-V., M.B., H.V.C.B. and F.Z.M.; visualization: A.B.S., M.R.-V. and A.V.V.; supervision: H.V.C.B., M.R.-V. and M.B.; project administration: M.B. and M.R.-V.; funding acquisition: M.B. and M.R.-V. All authors have read and agreed to the published version of the manuscript.

Funding

This research received no external funding.

Data Availability Statement

The original contributions presented in this study are included in the article. Further inquiries can be directed to the corresponding authors.

Acknowledgments

The authors would like to thank the National Institute of Nuclear Research (ININ), in particular the staff of the Environmental Radiological Monitoring Laboratory and the Nuclear Geophysics Laboratory; the Ministry of Science, Humanities, Technology, and Innovation (SECIHTI) for their support of the project and the scholarship received; and Aurora Mendieta for her help during the spatial analysis process.

Conflicts of Interest

The authors declare no conflicts of interest.

Appendix A

StateAquifers
AguascalientesValle de Aguas Calientes, Valle de Calvillo, El Llano, Venadero, and Valle de Chicalote
CoahuilaSaltillo Sur, Saltillo-Ramos Arizpe, Región Mazanera Zapaliname, General Cepeda-Sauceda, Principal-Región Lagunera, and La Paila
DurangoVicente Guerreo-Poanas, San Juan del Río, Nazas, Peñón Blanco, and Villa Juárez
JaliscoTepatitlán
GuanajuatoLa Muralla, Valle de León, Laguna Seca, and Cuenca Alta del Rio Laja
San Luis PotosíJaral de Berrios-Villa de Reyes, San Luis Potosí, Salinas de Hidalgo, Matehuala-Huizache, Cedral-Matehuala, Vanegas-Catorce, and El Barril
ZacatecasPinos, Villa Hidalgo, Loreto, La Blanca, Ojo Caliente, Chupaderos, Guadalupe Bañuelos, Villa Nueva, Jalpa-Juchipila, Nochistlán, Jerez, Calera, Guadalupe de las Corrientes, Puerto Madero, Benito Juárez, Agua Naval, Abrego, El Palmar, Sain Alto, El Salvador, and Cedros

Appendix B

Figure A1. Wells cluster based on similarity, Euclidean distance (≥60%), of their hydrogeochemical composition.
Resources 14 00154 g0a1

References

  1. World Health Organization. Guías Para la Calidad del Agua Potable Incluye el Primer Apéndice. Recomendaciones. Available online: https://sswm.info/sites/default/files/reference_attachments/OMS%202006.%20Gu%C3%ADa%20para%20la%20calidad%20dl%20agua%20potable.pdf (accessed on 10 March 2024).
  2. Prasad, Y.; Prasad, G.; Choubey, V.M.; Ramola, R.C. Geohydrological control on radon availability in groundwater. Radiat. Meas. 2009, 44, 122–126. [Google Scholar] [CrossRef]
  3. Suriyanarayanan, S.; Anil, K.M.; Divya, L.; Jessen, G.; Magesh, S.B.; Rashmi, R. Determination of Gross Alpha Activity and Physic-Chemical Parameters of Borewell Samples of Mysore District, India. Int. Res. J. Environ. Sci. 2015, 4, 6–11. [Google Scholar]
  4. Chok, N.S. Pearson’s Versus Spearman’s and Kendall’s Correlation Coefficients for Continuous Data. Ph.D. Thesis, University of Pittsburgh, Pittsburgh, PA, USA, 2008. [Google Scholar]
  5. Segovia, N.; Bulbulian, S. Radon determination in ground water. In Desarrollo; IAEA: Mexico City, Mexico, 1991. [Google Scholar]
  6. Olguin, M.T.; Segovia, N.; Tamez, E.; Alcántara, M.; Bulbulian, S. Radon concentration levels in ground water from Toluca, Mexico. Sci. Total Environ. 1993, 130–131, 43–50. [Google Scholar] [CrossRef] [PubMed]
  7. López, R.N.; Segovia, N.; Cisniega, M.G.; López, M.B.E.; Armienta, M.A.; Seidel, J.L.; Peña, P.; Godínez, L.; Tamez, E. Determination of radon, major and trace elements in water samples from springs and wells of northern Mexico State, Mexico. Geofísica Int. 2002, 41, 407–414. [Google Scholar]
  8. Segovia, N.; Tamez, E.; Peña, P.; Carrillo, J.; Acosta, E.; Armienta, M.A.; Iturbe, J.L. Groundwater flow system in the valley of Toluca, Mexico: An assay of natural radionuclide specific activities. Appl. Radiat. Isot. 1999, 50, 589–598. [Google Scholar] [CrossRef]
  9. De Iaco, S.; Maggio, S.; Palma, M. Radon Predictions with Geographical Information System Covariates: From Spatial Sampling to Modeling. Geogr. Anal. 2017, 49, 215–235. [Google Scholar] [CrossRef]
  10. Knutsson, G.; Olofsson, B. Radon content in groundwater from drilled wells in the Stockholm region of Sweden. Nor. Geol. Unders. Bull. 2002, 439, 79–85. [Google Scholar]
  11. Zafar, W.A.; Ahmed, J.; Barkat, A.; Nabi, A.; Mahmood, R.; Manzoor, S.; Iqbal, T. Spatial mapping of radon: Implication for fault delineation. Geochem. J. 2018, 52, 359–371. [Google Scholar] [CrossRef]
  12. Kasić, A.; Kasumović, A.; Adrović, F.; Hodžić, M. Radon measurements in well and spring water of the Tuzla area, Bosnia and Herzegovina. Arch. Ind. Hyg. Toxicol. 2016, 67, 332–339. [Google Scholar] [CrossRef]
  13. Skeppström, K.; Olofsson, B. Uranium and radon in groundwater. Eur. Water 2007, 17, 51–62. [Google Scholar]
  14. Villalba, L.; Colmenero Sujo, L.; Montero Cabrera, M.E.; Cano Jimenez, A.; Renteria Villalobos, M.; Delgado Mendoza, C.J.; Jurado Tenorio, L.A.; Davila Rangel, I.; Herrera Peraza, E.F. Radon concentrations in ground and drinking water in the state of Chihuahua, Mexico. J. Environ. Radioact. 2005, 80, 139–151. [Google Scholar] [CrossRef]
  15. Colmenero Sujo, L.; Montero Cabrera, M.E.; Villalba, L.; Renteria Villalobos, M.; Torres Moye, E.; Garcia Leon, M.; Garcia-Tenorio, R.; Mireles Garcia, F.; Herrera Peraza, E.F.; Sanchez Aroche, D. Uranium-238 and thorium-232 series concentrations in soil, radon-222 indoor and drinking water concentrations and dose assessment in the city of Aldama, Chihuahua, Mexico. J. Environ. Radioact. 2004, 77, 205–219. [Google Scholar] [CrossRef]
  16. Lopez, F.O.; Canoba, A.C. 222 Rn gas diffusion and determination of its adsorption coefficient on activated charcoal. J. Radioanal. Nucl. Chem. 2002, 252, 515–521. [Google Scholar] [CrossRef]
  17. Hopke, P.K.; Borak, T.B.; Doull, J.; Cleaver, J.E.; Eckerman, K.F.; Gundersen, L.C.S.; Harley, N.H.; Hess, C.T.; Kinner, N.E.; Kopecky, K.J.; et al. Health Risks Due to Radon in Drinking Water. Environ. Sci. Technol. 2000, 34, 921–926. [Google Scholar] [CrossRef]
  18. Grande, E.; Moran, J.E. Patterns in Radon Activity in California Groundwater. ACS EST Water 2021, 1, 2390–2402. [Google Scholar] [CrossRef]
  19. Pásztor, L.; Szabó, K.Z.; Szatmári, G.; Laborczi, A.; Horváth, Á. Mapping geogenic radon potential by regression kriging. Sci. Total Environ. 2016, 544, 883–891. [Google Scholar] [CrossRef] [PubMed]
  20. Teixeira, J.; Chaminé, H.I.; Espinha Marques, J.; Carvalho, J.M.; Pereira, A.J.S.C.; Carvalho, M.R.; Fonseca, P.E.; Pérez-Alberti, A.; Rocha, F. A comprehensive analysis of groundwater resources using GIS and multicriteria tools (Caldas da Cavaca, Central Portugal): Environmental issues. Environ. Earth Sci. 2015, 73, 2699–2715. [Google Scholar] [CrossRef]
  21. Guida, D.; Guida, M.; Cuomo, A.; Guadagnuolo, D.; Siervo, V. Assessment and Mapping of Radon-prone Areas on a regional scale as application of a Hierarchical Adaptive and Multi-scale Approach for the Environmental Planning. Case Study of Campania Region, Southern Italy. WSEAS Trans. Syst. 2013, 12, 105–120. [Google Scholar]
  22. Skeppström, K.; Olofsson, B. A prediction method for radon in groundwater using GIS and multivariate statistics. Sci. Total Environ. 2006, 367, 666–680. [Google Scholar] [CrossRef]
  23. Gong, G.; Mattevada, S.; O’Bryant, S.E. Comparison of the accuracy of kriging and IDW interpolations in estimating groundwater arsenic concentrations in Texas. Environ. Res. 2014, 130, 59–69. [Google Scholar] [CrossRef]
  24. Custodio, E. Groundwater in volcanic hard rocks. In Groundwater in Fractured Rocks, Selected Papers from the Groundwater in Fractured Rocks; Krásný, J., Sharp, J.M., Eds.; Taylor and Francis: Prague, Czech Republic, 2003; pp. 95–108. [Google Scholar]
  25. CONAGUA. Aguas Subterráneas. Disponibilidad por Acuíferos. 2023. Available online: https://sigagis.conagua.gob.mx/gas1/sections/Disponibilidad_Acuiferos.html (accessed on 28 July 2025).
  26. CONABIO: Explorador de Cambio Climático y Biodiversidad. 2023. Available online: https://www.biodiversidad.gob.mx/pais/cambio-climatico (accessed on 16 July 2025).
  27. García Amaro de Miranda, E. Distribución de la Precipitación en la República Mexicana. Investig. Geográficas 2003, 50, 67–76. Available online: http://www.scielo.org.mx/scielo.php?script=sci_arttext&pid=S0188-46112003000100009&lng=es&tlng=es (accessed on 9 September 2025).
  28. Ferrari, L.; Pasquaré, G.; Venegas-Salgado, S.; Romero-Rios, F. Geology of the western Mexican Volcanic Belt and adjacent Sierra Madre Occidental and Jalisco Block. In Cenozoic Tectonics and Volcanism of Mexico; Delgado-Granados, H., Aguirre-Díaz, G.J., Stock, J.M., Eds.; Geological Society of America: Boulder, CO, USA, 2000; pp. 65–83. [Google Scholar]
  29. Valenzuela-Vásquez, L.; Ramírez-Hernández, J.; Reyes-López, J.; Sol-Uribe, A.; Lázaro-Mancilla, O. The origin of fluoride in groundwater supply to Hermosillo City, Sonora, México. Environ. Geol. 2006, 51, 17–27. [Google Scholar] [CrossRef]
  30. Shah, T.; Bruke, J.; Vullholth, K.; Angelica, M.; Custodio, E.; Daibes, F. Groundwater: A global assessment of scale and significance. In Water for Food Water for Life: A Comprehensive Assessment of Water Management in Agriculture; Molden, D., Ed.; Earthscan: London, UK, 2007; pp. 395–423. [Google Scholar]
  31. Tositti, L.; Cinelli, G.; Brattich, E.; Galgaro, A.; Mostacci, D.; Mazzoli, C. Assessment of lithogenic radioactivity in the Euganean Hills magmatic district (NE Italy). J. Environ. Radioact. 2017, 166, 259–269. [Google Scholar] [CrossRef]
  32. CONAGUA-SINA. Calidad del Agua en México. Gobierno de México. Available online: https://www.gob.mx/conagua/articulos/calidad-del-agua (accessed on 17 May 2023).
  33. Schubert, M.; Buerkin, W.; Peña, P.; Lopez, A.E.; Balcázar, M. On-site determination of the radon concentration in water samples: Methodical background and results from laboratory studies and a field-scale test. Radiat. Meas. 2006, 41, 492–497. [Google Scholar] [CrossRef]
  34. Hernández Lalinde, J.D.; Espinosa Castro, J.F.; Peñaloza Tarazona, M.E.; Rodriguez, J.E.; Chacón Rangel, J.G.; Toloza Sierra, C.A.; Arenas Torrado, M.K.; Toloza Sierra, C.A.; Arenas Torrado, M.K.; Carrillo Sierra, S.M.; et al. Sobre el uso adecuado del coeficiente de correlación de Pearson: Definición, propiedades y suposiciones. AVFT–Arch. Venez. Farmacol. Ter. 2019, 37, 587–595. [Google Scholar]
  35. Marimuthu, S.; Mani, T.; Sudarsanam, T.D.; George, S.; Jeyaseelan, L. Preferring Box-Cox transformation, instead of log transformation to convert skewed distribution of outcomes to normal in medical research. Clin. Epidemiol. Glob. Health 2022, 15, 101043. [Google Scholar] [CrossRef]
  36. Berger, V.W.; Zhou, Y. Kolmogorov–Smirnov Test: Overview. In Wiley StatsRef: Statistics Reference Online; John Wiley & Sons, Ltd.: Hoboken, NJ, USA, 2014. [Google Scholar]
  37. Abdi, H.; Williams, L.J. Principal component analysis. WIREs Comput. Stat. 2010, 2, 433–459. [Google Scholar] [CrossRef]
  38. Matiatos, I.; Alexopoulos, A.; Godelitsas, A. Multivariate statistical analysis of the hydrogeochemical and isotopic composition of the groundwater resources in northeastern Peloponnesus (Greece). Sci. Total Environ. 2014, 476–477, 577–590. [Google Scholar] [CrossRef]
  39. Greenacre, M.; Groenen, P.J.F.; Hastie, T.; D’Enza, A.I.; Markos, A.; Tuzhilina, E. Publisher Correction: Principal component analysis. Nat. Rev. Methods Primers 2023, 3, 22. [Google Scholar] [CrossRef]
  40. United States Environmental Protection Agency (USEPA). Federal Register 40 Parts 141 and 142: National Primary Drinking Water Regulations; Radionuclides: Proposed Rule. 1991. Available online: https://nepis.epa.gov/Exe/ZyPDF.cgi/10003I8N.PDF?Dockey=10003I8N.PDF (accessed on 9 September 2025).
  41. Zhao, R.; Yi, J. Geochemistry of thermal waters in the Changbaishan volcanic geothermal system, Northeast China—Implications for vapor-liquid separation controls on geothermal fluid composition. Arab. J. Geosci. 2021, 14, 419. [Google Scholar] [CrossRef]
  42. Liu, S.; Tang, X.; Han, X.; Zhang, D.; Wang, G. Hydrochemistry of the Geothermal in Gonghe Basin, Northeastern Tibetan Plateau: Implications for Hydro-Circulation and the Geothermal System. Water 2023, 15, 1971. [Google Scholar] [CrossRef]
  43. Gárfias, J.; Arroyo, N.; Aravena, R. Hydrochemistry and origins of mineralized waters in the Puebla aquifer system, Mexico. Environ. Earth Sci. 2010, 59, 1789–1805. [Google Scholar] [CrossRef]
  44. REDPA-CONAGUA: Consulta a la Base de Datos del REPDA; Registro Publico de Derechos de Agua. Available online: https://app.conagua.gob.mx/consultarepda.aspx (accessed on 3 July 2025).
  45. CONAGUA S. Estadísticas del Agua en México. México, DF: CONAGUA (2011) Estadísticas del Agua en México Comisión Nacional del Agua Reporte. 2011. Available online: https://www.gob.mx/cms/uploads/attachment/file/259373/_2011_EAM2011.pdf (accessed on 9 September 2025).
  46. CONAGUA. Disponibilidad Media Anual de Agua Subterránea del Acuífero Saltillo–Ramos Arizpe (0510); Comisión Nacional del Agua: Mexico City, Mexico, 2024; Available online: https://sigagis.conagua.gob.mx/gas1/Edos_Acuiferos_18/coahuila/DR_0510.pdf (accessed on 9 September 2025).
  47. CONAGUA. Actualización de la Disponibilidad Media Anual de Agua Subterránea del Acuífero Región Manzanera–Zapalinamé (0511), Estado de Coahuila; Comisión Nacional del Agua: Mexico City, Mexico, 2024; Available online: https://sigagis.conagua.gob.mx/gas1/Edos_Acuiferos_18/coahuila/DR_0511.pdf (accessed on 9 September 2025).
  48. CONAGUA. Disponibilidad Media Anual de Agua Subterránea del Acuífero Cedral-Matehuala (2407), Estado de San Luis Potosí; Comisión Nacional del Agua: Mexico City, Mexico, 2024; Available online: https://sigagis.conagua.gob.mx/gas1/Edos_Acuiferos_18/sanluispotosi/DR_2407.pdf (accessed on 9 September 2025).
  49. Armienta, M.A.; Segovia, N. Arsenic and fluoride in the groundwater of Mexico. Environ. Geochem. Health 2008, 30, 345–353. [Google Scholar] [CrossRef]
  50. Reyes-Gómez, V.M.; Alarcón-Herrera, M.T.; Gutiérrez, M.; López, D.N. Fluoride and Arsenic in an Alluvial Aquifer System in Chihuahua, Mexico: Contaminant Levels, Potential Sources, and Co-occurrence. Water Air Soil Pollut. 2013, 224, 1433. [Google Scholar] [CrossRef]
  51. Nickson, R.; McArthur, J.; Burgess, W.; Ahmed, K.M.; Ravenscroft, P.; Rahmanñ, M. Arsenic poisoning of Bangladesh groundwater. Nature 1998, 395, 338. [Google Scholar] [CrossRef] [PubMed]
  52. Smedley, P.L.; Kinniburgh, D.G. A review of the source, behaviour and distribution of arsenic in natural waters. Appl. Geochem. 2002, 17, 517–568. [Google Scholar] [CrossRef]
  53. Postma, D.; Larsen, F.; Minh Hue, N.T.; Duc, M.T.; Viet, P.H.; Nhan, P.Q.; Jessen, S. Arsenic in groundwater of the Red River floodplain, Vietnam: Controlling geochemical processes and reactive transport modeling. Geochim. Cosmochim. Acta 2007, 71, 5054–5071. [Google Scholar] [CrossRef]
  54. Oremland, R.S.; Stolz, J.F. The Ecology of Arsenic. Science 2003, 300, 939–944. [Google Scholar] [CrossRef]
  55. Zheng, Y.; Stute, M.; van Geen, A.; Gavrieli, I.; Dhar, R.; Simpson, H.J.; Schlosser, P.; Ahmed, K.M. Redox control of arsenic mobilization in Bangladesh groundwater. Appl. Geochem. 2004, 19, 201–214. [Google Scholar] [CrossRef]
  56. NOM-127-SSA1-2021; Official Mexican Standard. Environmental Health. Water for Human Use and Consumption. Permissible limits for Water Quality (Agua Para Uso y Consumo Humano. Límites Permisibles de la Calidad del Agua). Deparment, H., Ed.; Official Gazette of the Federation: Mexico City, Mexico, 2022.
  57. CONAGUA. Actualización de la Disponibilidad Media Anual de Agua Subterránea del Acuífero Principal–Región Lagunera (0523), Estado de Coahuila; Comisión Nacional del Agua: Mexico City, Mexico, 2024; Available online: https://www.gob.mx/cms/uploads/attachment/file/102876/DR_0523.pdf (accessed on 9 September 2025).
  58. López, J.A.; Rodríguez, G.; Chavarría, I.; Ornelas, O.D.; Sajo-Bohus, L. Correlation between underground radon gas and dormant geological faults. J. Nucl. Phys. Mater. Sci. Radiat. Appl. 2016, 4, 265–275. [Google Scholar] [CrossRef]
  59. Santiago Carrasco, B.; Martínez Ramos, C.J.; Sánchez Bermeo, G.; Chiapa García, R.; Palacios García, R. Informe Final de la Cartografía Geológico-Minera Escala 1:250000, Carta Monterrey Clave G14–7, Estados de Coahuila, Nuevo León y Zacatecas; Consejo de Recursos Minerales: Coahuila, Mexico, 2000. [Google Scholar]
  60. Espinosa Aramburu, E.; Meneses Garibay, F.; Ignacio Jiménez, D. Carta Geológico-Minera General Cepeda, Clave G14–C32, Escala 1:50000; Mexicano, S.G., Ed.; Servicio Geológico Mexicano: Mexico City, Mexico, 2004. [Google Scholar]
  61. Rodríguez Rodríguez, J.S. Carta Geológico-Minera Sierra El Laurel Clave G14–C42, Escala 1:50000, Estado de Coahuila; Servicio Geológico Mexicano: Mexico City, Mexico, 2006. [Google Scholar]
  62. Carrasco Brígido, S.; Escamilla de la Rosa, J.E. Carta Geológico-Minera Agua Nueva Clave G14–C43, Escala 1:50000, Estado de Coahuila; Servicio Geológico Mexicano: Mexico City, Mexico, 2007. [Google Scholar]
  63. Carrillo-Rivera, J.J.; Varsányi, I.; Kovács, L.Ó.; Cardona, A. Tracing Groundwater Flow Systems with Hydrogeochemistry in Contrasting Geological Environments. Water Air Soil Pollut. 2007, 184, 77–103. [Google Scholar] [CrossRef]
  64. Mendoza-Amézquita, E.; Armienta-Hernández, M.A.; Ayora, C.; Soler, A.; Ramos-Ramírez, E. Potential lixiviation of trace elements in tailings from the mines La Asunción and Las Torres in the Guanajuato Mining District, Mexico. Rev. Mex. Cienc. Geológicas 2018, 23, 75–83. [Google Scholar]
  65. Valencia-Moreno, M.; Ochoa-Landín, L.; Noguez-Alcántara, B.; Ruiz, J.; Pérez-Segura, E. Características metalogenéticas de los depósitos de tipo pórfido cuprífero en México y su situación en el contexto mundial. Boletín Soc. Geológica Mex. 2006, 58, 1–26. [Google Scholar] [CrossRef]
  66. Roy, P.D.; García-Arriola, O.A.; Selvam, S.; Vargas-Martínez, I.G.; Sánchez-Zavala, J.L. Geochemistry of some fluoride and nitrate enriched water resources from the Oriental Basin: A prospective health risk hotspot from eastern-central Mexico. Environ. Geochem. Health 2025, 47, 114. [Google Scholar] [CrossRef]
  67. Zhu, G.; Cui, G.; Zhang, L.; Feng, Q.; Zhang, E.; Niu, Z.; Xu, W.; Li, X.; Deng, Z. Hydrogeochemical evidence for the geothermal origin of sedimentary hot dry rock in Gonghe Basin, Northwest China. Environ. Earth Sci. 2023, 82, 549. [Google Scholar] [CrossRef]
  68. Zielinski, R.A. Experimental Leaching of Volcanic Glass: Implications For Evaluation of Glassy Volcanic Rocks as Sources of Uranium. In Uranium in Volcanic and Volcaniclastic Rocks; Goodell, P.C., Waters, A.C., Eds.; American Association of Petroleum Geologists: Tulsa, OK, USA, 1981; Volume 13, pp. 1–11. [Google Scholar]
  69. Maithani, P.B.; Srinivasan, S. Felsic Volcanic Rocks, a Potential Source of Uranium—An Indian Overview. Energy Procedia 2011, 7, 163–168. [Google Scholar] [CrossRef]
  70. Nieto-Samaniego, A.F.; Del Pilar-Martínez, A.; Suárez-Arias, A.M.; Angeles-Moreno, E.; Alaniz-Álvarez, S.A.; Levresse, G.; Xu, S.; Olmos-Moya, M.d.J.P.; Báez-López, J.A. The geology and tectonic evolution of the Mesa Central of Mexico during the Cenozoic era: A review: Geology and tectonics of the Mesa Central. Rev. Mex. Cienc. Geológicas 2023, 40, 187–213. [Google Scholar] [CrossRef]
  71. Del Pilar-Martínez, A.; Nieto-Samaniego, A.F.; Alaniz-Alvarez, S.A.; Angeles-Moreno, E. Geology of the southern Mesa Central of Mexico: Recording the beginning of a polymodal fault system. J. Maps 2020, 16, 199–211. [Google Scholar] [CrossRef]
  72. Schubert, M.; Paschke, A.; Lieberman, E.; Burnett, W.C. Air–Water Partitioning of 222Rn and its Dependence on Water Temperature and Salinity. Environ. Sci. Technol. 2012, 46, 3905–3911. [Google Scholar] [CrossRef]
  73. Reimann, C.; Hall, G.E.; Siewers, U.; Bjorvatn, K.; Morland, G.; Skarphagen, H.; Strand, T. Radon, fluoride and 62 elements as determined by ICP-MS in 145 Norwegian hard rock groundwater samples. Sci Total Env. 1996, 192, 1–19. [Google Scholar] [CrossRef]
  74. Salih, I.; Bäckström, M.; Karlsson, S.; Lund, E.; Pettersson, H.B.L. Impact of fluoride and other aquatic parameters on radon concentration in natural waters. Appl. Radiat. Isot. 2004, 60, 99–104. [Google Scholar] [CrossRef] [PubMed]
  75. Cinti, D.; Vaselli, O.; Poncia, P.P.; Brusca, L.; Grassa, F.; Procesi, M.; Tassi, F. Anomalous concentrations of arsenic, fluoride and radon in volcanic-sedimentary aquifers from central Italy: Quality indexes for management of the water resource. Environ. Pollut. 2019, 253, 525–537. [Google Scholar] [CrossRef] [PubMed]
  76. Fakhari, M.; Raymond, J.; Martel, R.; Drolet, J.-P.; Dugdale, S.J.; Bergeron, N. Analysis of Large-Scale Groundwater-Driven Cooling Zones in Rivers Using Thermal Infrared Imagery and Radon Measurements. Water 2023, 15, 873. [Google Scholar] [CrossRef]
  77. Zhou, H.; Wan, Y.; Su, H.; Li, C. Spatial–temporal evolution of soil gas Rn before two Ms ≥ 5.0 earthquakes in the mid-eastern of the Qilian fault zone (QLF). Sci. Rep. 2023, 13, 21491. [Google Scholar] [CrossRef]
  78. Aranda-Gómez, J.J.; Luhr, J.F.; Housh, T.B.; Valdez-Moreno, G.; Chávez-Cabello, G. Late Cenozoic intraplate-type volcanism in central and northern México: A review. In Geology of México: Celebrating the Centenary of the Geological Society of México; Alaniz-Álvarez, S.A., Nieto-Samaniego, Á.F., Eds.; Geological Society of America: Boulder, CO, USA, 2007; pp. 187–2250. [Google Scholar]
  79. Fite, J.; Tracol, R.; Gran-Aymerich, L.; Grandguillot, G.; Guillotin, L.; Davezac, H.; Loyen, J. La Qualité Radiologique de L’eau Mise en Distribution en France: 2005–2007; Autorité du Súreté Nucléaire MdlSedS, Institut de Radioprotection et de Sûreté Nucléaire, Eds.; Francia, 2009; pp. 1–37. Available online: https://bretagne-environnement.fr/notice-documentaire/qualite-radiologique-leau-mise-distribution-france-2005-2007 (accessed on 9 September 2025).
  80. Prol-Ledesma, R.M.; Morán-Zenteno, D.J. Heat flow and geothermal provinces in Mexico. Geothermics 2019, 78, 183–200. [Google Scholar] [CrossRef]
  81. Macedo Serrano, E.; Prol Ledesma, R.M. GIS-based analysis for regional exploration in the geothermal province of intraplate volcanism in the Center of Mexico. In Proceedings of the EGU General Assembly 2023, Vienna, Austria, 23–28 April 2023. [Google Scholar]
  82. Sukanya, S.; Noble, J.; Joseph, S. Application of radon (222Rn) as an environmental tracer in hydrogeological and geological investigations: An overview. Chemosphere 2022, 303, 135141. [Google Scholar] [CrossRef]
  83. Mair, J.; Petermann, E.; Lehné, R.; Henk, A. Can neotectonic faults influence soil air radon levels in the Upper Rhine Graben? An exploratory machine learning assessment. Sci. Total Env. 2024, 956, 177179. [Google Scholar] [CrossRef]
  84. Stanley, J.; Reading, L. Determination of radon source in basaltic groundwater, using geochemical tracers and chemometric statistical analysis. Heliyon 2025, 11, e41859. [Google Scholar] [CrossRef]
  85. Morales Arredondo, I.; Flores Ocampo, I.Z.; Armienta, M.A.; Morán Ramírez, J.; Hernández Hernández, M.A.; Landa Arreguin, J.F. Identificación de las fuentes de nitratos mediante métodos hidrogeoquímicos e isotópicos en el agua subterránea del Bajío Guanajuatense. Geofísica Int. 2020, 59, 169–194. [Google Scholar] [CrossRef]
  86. Bonotto, D.M.; Bueno, T.O. The natural radioactivity in Guarani aquifer groundwater, Brazil. Appl. Radiat. Isot. 2008, 66, 1507–1522. [Google Scholar] [CrossRef]
  87. Cho, B.W.; Choo, C.O. Geochemical Behavior of Uranium and Radon in Groundwater of Jurassic Granite Area, Icheon, Middle Korea. Water 2019, 11, 1278. [Google Scholar] [CrossRef]
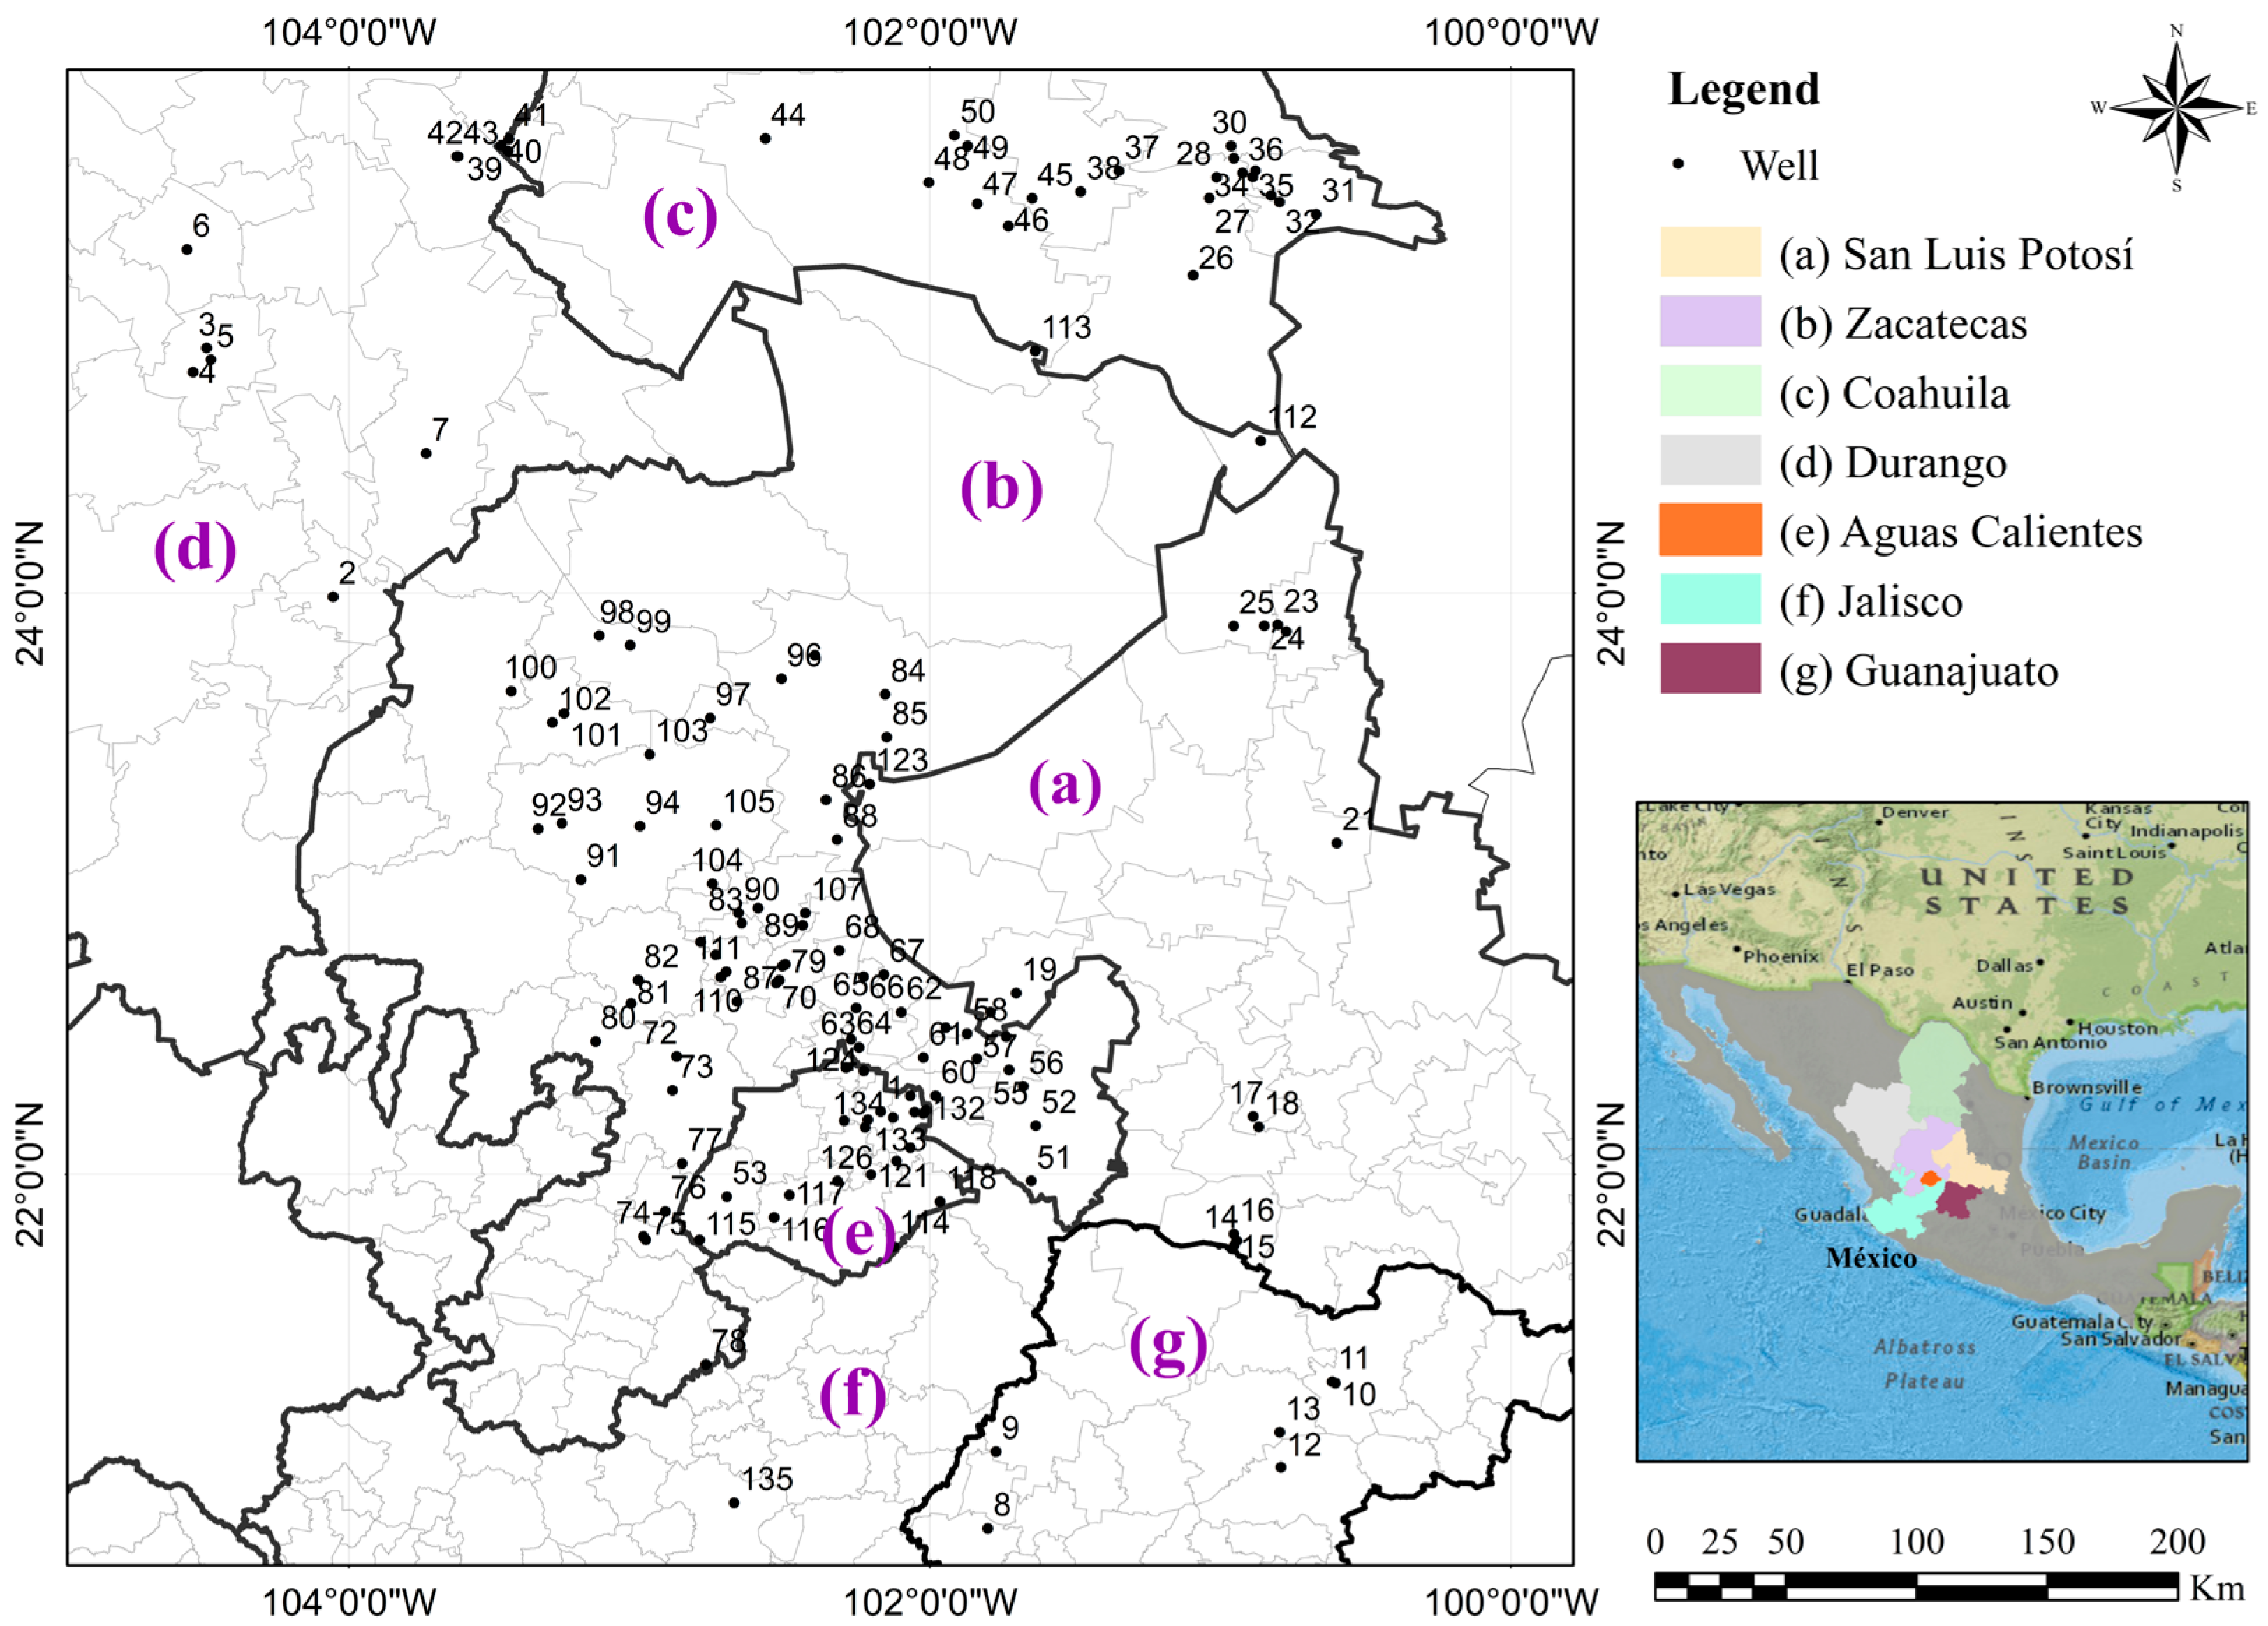
Figure 1. Study area and sampling points; the color code refers to the location of each Mexican state.
Resources 14 00154 g001
Figure 2. Methodology flow chart.
Resources 14 00154 g002
Figure 3. Analysis of two principal components through: (a) variables and (b) wells; variables grouped in PC1 are in blue, variables grouped in PC2 are in red, and the variables in purple in PC3, within the green circle, group potentially toxic metals. Additionally, wells with similar characteristics are marked in colored circles: high salinity (red) and high heat flow temperature (blue).
Resources 14 00154 g003aResources 14 00154 g003b
Figure 4. Variable clusters above 60% of similarity in groundwater: cluster 1, 62.6%; cluster 2, 69.1%; cluster 3, 67.2%; cluster 4, 76.1%; cluster 5, 76%; and cluster 6, 65%.
Resources 14 00154 g004
Figure 5. Spatial distribution of well clusters according to their physicochemical and geological variables. Red points represent the groundwater cluster with high levels of salinity and dissolved chemical species (cluster 1); green points indicate wells with the greatest distances to fractures and faults (cluster 2); blue points represent groundwater with the highest values of T, located in areas of high heat flow and elevation (cluster 3).
Resources 14 00154 g005
Figure 6. Radon distribution based on concentrations.
Resources 14 00154 g006
Figure 7. Heat flow spatial distribution and radon concentration in groundwater.
Resources 14 00154 g007
Table 1. Parameters analyzed, along with their corresponding data sources.
VariableData SourceParameter
PhysicochemicalMeasuredRadon (Rn), pH, measured total dissolved solids (TDSm) *, electrical conductivity (EC), and temperature (T).
PhysicochemicalFrom SINA-CONAGUAAlkalinity (Alk), total dissolved solids (TDS) *, fluorides (F), water hardness (Hard), nitrates (NO3), arsenic (As), cadmium (Cd), chromium (Cr), mercury (Hg), lead (Pb), manganese (Mn), and iron (Fe)
GeologicalFrom SINA-CONAGUAHeat flow (hf), proximity to mineral deposits (dm), proximity to volcanic centers (volc), proximity to faults and fractures (ff), rock type (Rt), land use (Lu), soil classification (Sc), and elevation (elev)
* TDS and TDSm r = 0.8, p-value ≤ 0.05.
Table 2. Descriptive statistics of physicochemical and geological variables.
VariablesMeanMedianMinMaxσCV *
Physical and chemical (measured)Rn (Bq/L)10.57.20.0264.811.1105.2
mTDS (mg/L)3512880.42764391111.3
pH7.67.86.19.50.79.6
EC (μS/cm)807.958598.34920587.872.8
T (°C)27.327.118.937.33.412.6
Geologicalhf (mW/m2)2372537531555.423.4
dm (m)10917912013347136812674.4
volc (m)195,707154,85316,341450,446114,93158.7
ff(m)13,45110,315117645,65410,59978.8
Elev (m)19261996185239833317.3
Physical and chemicalAlk (mg/L)1631491.56288049.1
TDS (mg/L)52742360.7314936970
Hard (mg/L)1771302.2100415386.1
NO3 (mg/L)3.51.70.01375.02143.2
F (mg/L)1.51.10.017.21.176.2
As (μg/L)17.815.80.311015.687.6
Cd (μg/L)1.820.0251.0457.9
Cr (μg/L)3.73.90.0316.22.361.1
Hg (μg/L)0.30.3050.44129
Pb (μg/L)3.13.40.038.41.959.5
Mn (μg/L)30.67.30.242567.9222
Fe (μg/L)39.1250.349751.9133
* Coefficient of variation (%).
Table 3. Principal components of the groundwater samples; the highest contribution is in bold.
VariablePC1PC2PC3PC4PC5PC6PC7PC8
Rn−0.040.08−0.12−0.060.04−0.020.050.87
pH−0.010.11−0.260.050.80−0.16−0.05−0.06
T−0.560.050.11−0.04−0.08−0.12−0.280.36
hf−0.880.26−0.07−0.190.01−0.090.010.02
Volc0.75−0.22−0.140.20−0.27−0.230.030.00
Dm0.86−0.300.010.09−0.13−0.020.100.06
Ff−0.11−0.04−0.13−0.100.07−0.810.100.05
Rt−0.160.06−0.06−0.110.080.26−0.610.05
Lu−0.310.230.04−0.10−0.120.180.70−0.10
Sc0.25−0.08−0.11−0.010.10−0.030.550.19
Elev−0.290.14−0.08−0.320.670.220.010.10
Alk0.06−0.28−0.040.86−0.080.040.10−0.08
EC0.44−0.840.080.00−0.14−0.080.00−0.07
TDS0.43−0.850.060.01−0.13−0.060.01−0.08
TDSm0.29−0.700.51−0.06−0.04−0.10−0.02−0.13
F−0.380.14−0.020.290.42−0.16−0.060.24
Hard0.26−0.72−0.190.16−0.19−0.110.00−0.18
NO30.64−0.190.41−0.14−0.24−0.32−0.07−0.09
As−0.05−0.580.390.130.070.040.080.35
Cd0.03−0.080.910.34−0.070.05−0.04−0.01
Cr0.05−0.110.85−0.07−0.130.100.03−0.10
Hg0.130.120.390.750.020.11−0.060.01
Pb0.03−0.120.930.05−0.140.07−0.02−0.02
Mn0.71−0.020.23−0.15−0.020.370.06−0.01
Fe−0.16−0.680.350.07−0.010.38−0.100.12
Eigenvalue4.293.733.541.831.591.371.311.22
Proportion of Variance (%)17.114.914.27.36.45.55.24.9
Cumulative Proportion (%)17.13246.253.559.965.470.675.5
Disclaimer/Publisher’s Note: The statements, opinions and data contained in all publications are solely those of the individual author(s) and contributor(s) and not of MDPI and/or the editor(s). MDPI and/or the editor(s) disclaim responsibility for any injury to people or property resulting from any ideas, methods, instructions or products referred to in the content.