Article

Chemical Leasing (Ch.L.) and the Sherwood Plot

by
Georgios Karakatsanis
1,2,* and
Christos Makropoulos
2
1
Department of Research, EVOTROPIA Ecological Finance Architectures Private Company (P.C.), 190 Syngrou Avenue, 17671 Kallithea, Greece
2
Department of Water Resources and Environmental Engineering, School of Civil Engineering, National Technical University of Athens (NTUA), 9 Heroon Polytechneiou St., 15870 Zografou, Greece
*
Author to whom correspondence should be addressed.
Resources 2024, 13(5), 65; https://doi.org/10.3390/resources13050065
Submission received: 12 March 2024 / Revised: 19 April 2024 / Accepted: 23 April 2024 / Published: 8 May 2024
(This article belongs to the Special Issue Advances in Wastewater Reuse)

Abstract

:
Although the Circular Economy (CE) has made remarkable technological progress by offering a wide range of alternative engineering solutions, an obstacle for its large-scale commercialization is nested in the adoption of those business and financial models that accurately depict the value generated from resource recovery. Recovering a resource from a waste matrix conserves natural reserves in situ by reducing demand for virgin resources, as well as conserving environmental carrying capacities by reducing waste discharges. The standard business model for resource recovery is Industrial Symbiosis (IS), where industries organize in clusters and allocate the process of waste matrices to achieve the recovery of a valuable resource at an optimal cost. Our work develops a coherent microeconomic architecture of Chemical Leasing (Ch.L.) contracts within the analytical framework of the Sherwood Plot (SP) for recovering a Value-Added Compound (VAC) from a wastewater matrix. The SP depicts the relationship between the VAC’s dilution in the wastewater matrix and its cost of recovery. ChL is engineered on the SP as a financial contract, motivating industrial synergies for delivering the VAC at the target dilution level at the market’s minimum cost and with mutual profits. In this context, we develop a ChL market typology where information completeness on which industry is most cost-efficient in recovering a VAC at every dilution level determines market dominance via a Kullback–Leibler Divergence (DKL) metric. In turn, we model how payoffs are allocated between industries via three ChL contract pricing systems, their profitability limits, and their fitting potential by market type. Finally, we discuss the emerging applications of ChL financial engineering in relation to three vital pillars of resource recovery and natural capital conservation.

1. Introduction

The structural economic transformation towards the Circular Economy (CE) is currently taking place at a growing rate, with related technological progress offering a wide range of alternative engineering solutions. Respectively, institutions in numerous countries have already adopted the principles of the CE. Currently, the main challenge concerns the large-scale commercialization of the CE via the design and adoption of proper business models and financial engineering instruments that accurately depict costs and benefits of resources’ recovery from wastes while constituting a market mechanism for profitable industrial synergies. Essentially, in our work, we structure the microeconomic architecture of Chemical Leasing (ChL), as both an ecological business model and financial instrument for the CE, to incentivize industrial symbiosis (IS) clusters and mutually profitable collaborations focused on the recovery of valuable compounds from wastewater.
So far, CE instruments have been designed almost exclusively by institutional banks [1]; however, the development of tailored financial instruments to respond to the needs of industrial ecosystems comprises a major challenge for private financial institutions as well, in search of reliable models and metrics for coupling payments to resource recovery performance. ChL is part of a wider set of sustainable chemistry practices called Chemical Management Services (CMS) [2], aiming at the environmental improvement of chemical supply chains, with significant success in the EU. ChL was introduced by the United Nations Industrial Development Organization (UNIDO) [3]. In its original form, ChL addressed a chemical compound’s lifecycle pro-active ecological design to achieve optimal industrial utilization and environmental performance. From an institutional standpoint, ChL is directly related to the principle of Extended Producer’s Responsibility (EPR), which constitutes the corner stone of the EU’s economic transformation towards the CE.
In this context, our work’s innovation is the postulation of a general ChL framework to upscale it to a mainstream and profitable commercial resource recovery practice. Specifically, we primarily utilized the Sherwood Plot (SP) as a quantitative framework on resource recovery [4], postulating the microeconomic foundations of Value-Added Compound (VAC) recovery from wastewater matrices. With this as a foundation, we have built a parsimonious, concise and coherent ChL mathematical framework to demonstrate what, in the first place, motivates industries to engage in resource recovery synergies with mutual benefits and how these benefits are allocated. Here, we also contribute to the related literature, as, although the UNIDO pilots have provided valuable empirical insights, the theoretical foundations of ChL are still incomplete. Secondarily, we postulate a stochastic framework of VAC recovery allocation between industries, with information completeness as a criterion in terms of relative entropy or Kullback–Leibler Divergence (DKL). Information completeness is a central concept in the microeconomic theory of industrial organization, affecting the VAC’s optimal allocation and its maximum recovery. Thirdly, we substantiate that the above ChL mathematical framework is compliant with the frameworks of the EU Green Deal and Sustainability Finance Taxonomy (SFT) [5]; hence, it has scalable commercial potential. This integration is a necessary condition for the large-scale engagement of private financial capital in ChL, which still remains a quite underdeveloped area.

2. Materials and Methods

In this section we present the theoretical foundations of ChL financial engineering. Specifically, the pillars of this section concern the following: (1) an examination of the SP framework on the relationship between a VAC’s dilution in a wastewater matrix and its cost of recovery [4]; (2) ChL’s origins and international pilots by the UNIDO; and (3) the structuring of the statistical mechanics in the context of information completeness by which ChL contracts work for industries as a synergistic VAC recovery optimization algorithm.

2.1. The Sherwood Plot (SP)

The Sherwood Plot (SP) was introduced by chemical engineer Thomas K. Sherwood [6], and it is based on the core assumption that waste matrices are potential sources for the recovery of valuable materials as an alternative to mining them from virgin ore deposits. Specifically, the original SP postulation [4,6,7] depicted the relationship between the required market price of a target material to be recovered from a waste matrix and its dilution in the latter [7]. Karakatsanis and Makropoulos [4] further revised the original SP to depict the relation between a target material’s dilution in the waste matrix and its cost of recovery from it as a more convenient representation. In this context, dilution is defined as inverse concentration in a real or logarithmic scale. This coordinates’ set structured a map on whether the recovery of the target material (VAC) from the waste matrix is profitable or not. Essentially, the SP suggests that for a perfectly miscible solution, a VAC’s dilution and its cost of recovery are inversely proportional quantities. Although the SP has remained relatively unutilized in resource recovery science, its potential utilization could offer significant insights for quantifying IS markets’ performance [8]. In this context, the SP is applied to model a VAC’s recovery from wastewater, depicting the relationship between the VAC’s dilution as the inverse of the mass concentration [mi−1 = 1/(mg/L)] and its recovery cost (in any monetary terms) by a single industry. The SP’s semi-analytical and most widely used empirical form [4], with parameters a,b expressing constant and variable cost coefficients, is written as follows:
C m i j 1 = a i j 1 / β i j + b i j 1 / γ i j 1 m i 1 / δ i j , C , a , b , m R ; β , γ , δ R +
Equation (1) suggests that for every VACi that is recovered by an industry j, the cost of recovery Ci comprises a function of the VAC’s dilution in terms of inverse mass concentration 1/mi. Parameter ai concerns constant costs (costs that are paid by the industry irrespective of the VAC’s recovery volume), and parameter bi concerns variable costs (costs that are proportional to the VAC’s dilution level), with βi, γi, and δi being their respective exponents. An SP can theoretically take any nonlinear (monotonic or not) or linear form [4]; however, linear regression models are empirically the most prevalent models and most operationally convenient to use. A complete mathematical analysis of the SP’s elements, derivation, behavior, and market structure can be found in [4]. The three rows of Figure 1 (below) schematically depict the effect of the values of exponents β,γ, and δ on the general behavior of a standard SP according to Equation (1).
The upper row of Figure 1 concerns how exponent β impacts on the industry’s constant cost. Essentially, exponent β is an industry’s constant cost sensitivity index. The middle row concerns the effect of exponent γ on the industry’s variable cost sensitivity, and the lower row concerns the effect of exponent δ on the economies of scale as the VAC’s dilution increases in the wastewater matrix. Constant and variable costs include both capital and operational expenses (CAPEX and OPEX) [4]. As shown in Equation (1), all exponents take positive values, with a critical value of β = γ=δ = 1, yielding the standard linear SP model. For any exponent value β,γ,δ∈(0,1)the exponents become cost multipliers, signifying that production factor combinations (e.g., manual labor, mechanical capital, scientific knowledge, buildings) yield below their maximum efficiency. In contrast, exponent values β,γ,δ∈(1,+∞), work as cost divisors, signifying optimal (or near-optimal) combinations of production factors [4]. The following section extends the above context to the microeconomic foundations of VAC recovery synergies for n ≥ 2 industries (with n∈N+).

2.2. Microeconomics of VAC Recovery Synergies

In this section, we develop the microeconomic foundations of VAC recovery optimization in line with neoclassical microeconomic theory [9], assuming the standard linear SP model unless stated otherwise. Specifically, we present the necessary conditions for allocating a VAC’s recovery between two or more industries, establishing the potential for structuring a ChL contract. The microeconomic potential for synergistic VAC recovery is depicted through an Edgeworth Box that incorporates each industry’s isotechnical curves that emerge from any initial dilution–cost coordinate. In its general form, an isotechnical depicts all combinations of a VAC’s dilution mi−1) by an industry j and its cost of recovery (Cij) at which the average cost C (capped) remains constant as:
C i j m i j 1 = C i j ¯ , m i , C i j , C i j ¯ 0 , +
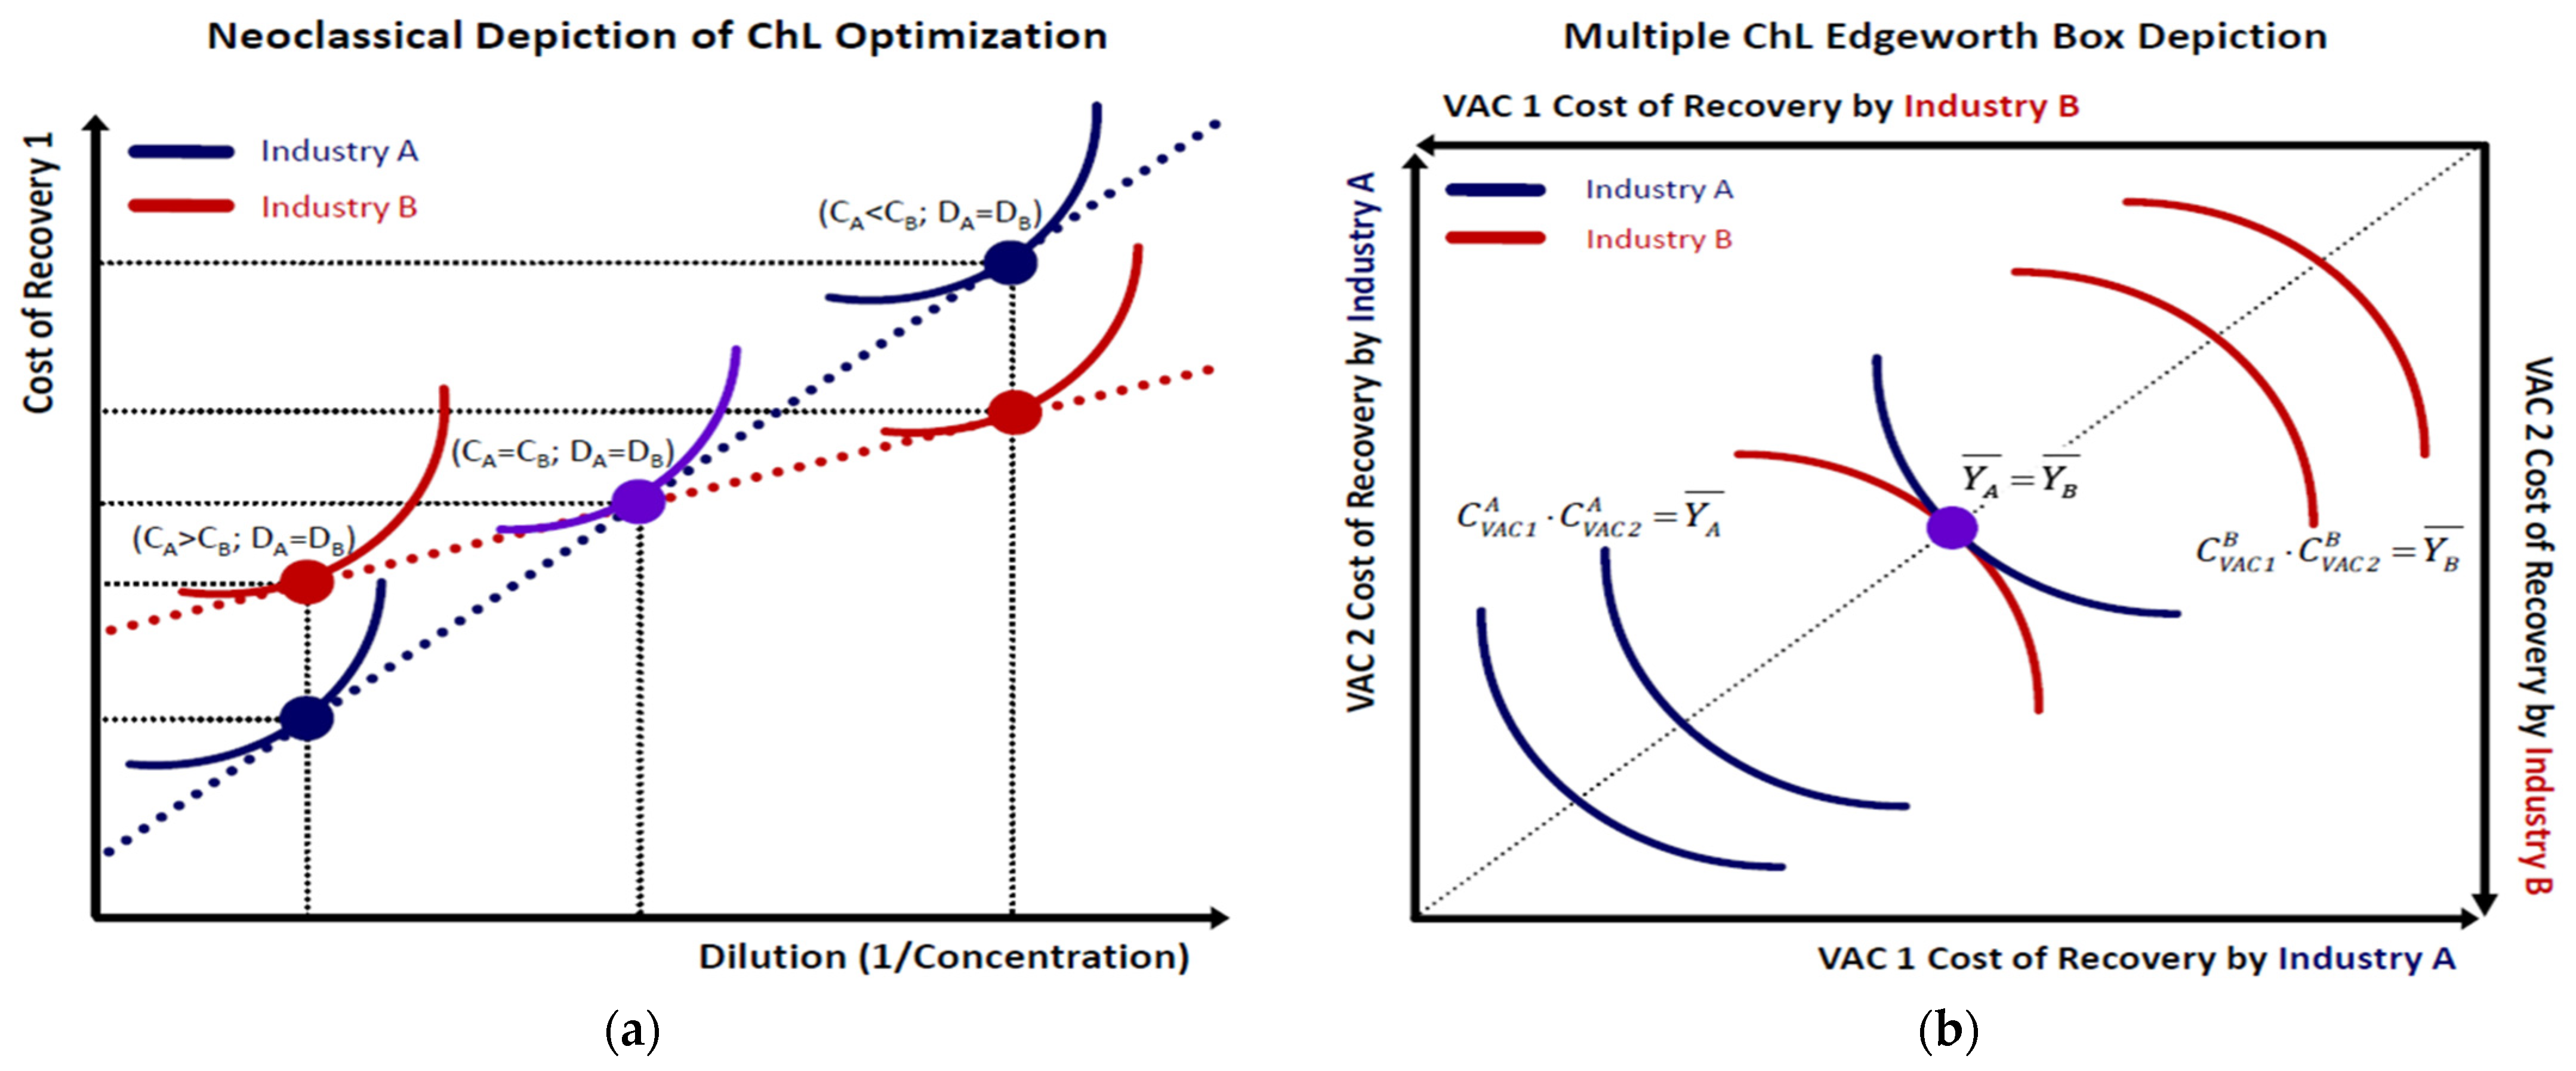
Figure 2 depicts the microeconomic potential of optimal resource recovery allocation between two industries via the isotechnicals’ approach in two views: (a) recovery of n = 1 VAC in terms of SP and (b) recovery of n > 1 VACs in terms of Edgeworth Box.
Based on Equation (2), the SP is essentially the tangent of constant average cost isotechnicals, crossing the points of the minimum total cost of VAC recovery. We may generalize Equation (2) for any number n > 1 (n∈N−[0;1]) of recovered VACs by an industry j as:
C 1 j ¯ C n j ¯ = C 1 j m 1 j 1 C n j m n j 1 = C j ¯ , n Ν + , m i , C i j , C i j ¯ 0 , +
In microeconomic terms, for any initial coordinate on the line D = DA = DB = Dj, the inequality CA > CB signifies that the VAC’s recovery cost from the waste stream increases for the same dilution level [4], as shown in Figure 2a, or simply that Industry B is more expensive at recovering the VAC compared to Industry A, which is cost-prevalent at this dilution level. The exact opposite result applies for higher dilutions in the right of Figure 2a, where cost-prevalence shifts in favor of Industry B. With the lack of any prior knowledge on the industries’ cost-prevalence ranges, a possible scenario is that the market will assign the recovery of a VAC at a very high dilution to Industry A, with Industry A outsourcing, via a ChL agreement, the VAC’s recovery to Industry B, which has a lower VAC recovery cost for the same dilution level. In this way, ChL is a method for compensating for information incompleteness and optimizing VAC recovery costs by a Pareto criterion. This core aspect is thoroughly examined in Section 3.2.
Additionally, as shown in Figure 2a, the SP is a sub-chart of all of the optimal dilution–cost coordinates out of all of the possible dilution–cost coordinates that are formed by the isotechnicals [4]. Except for the common coordinate (CA = CB, DA = DB) that depicts a pivotal equivalent solution, every isotechnical in Figure 2a presents all other coordinates depicting higher per unit recovery costs. Hence, for any set of cost–dilution values, the SP comprises the Pareto optimal chart of the minimum recovery costs. This property is shown in Figure 2b within an Edgeworth Box context for two VACs. The two industries share the mutual benefit margin from a ChL contract up to the point where their isotechnicals intersect. This approach can apply for any n number (with n∈N−[0;1]) of recovered VACs.

2.3. Chemical Leasing (ChL)

ChL officially originated in 2004 as an innovative business model introduced by the UNIDO, It was supported by the Austrian government [10], while in 2007, the German government joined, followed by the Swiss government in 2013 [10]. Initially, the UNIDO ChL program was launched at pilot scale with 12 case studies in eight different countries and 11 different sectors [11] in controlled commercial environments to study the business model’s various technical and economic dimensions [11]. Since the program’s inception, pilot projects have been conducted in close cooperation with National Cleaner Production Centers (NCPCs), with many located in South America, Africa, Eastern Europe, and Asia. Today, more than 100 companies worldwide have included ChL in their business strategies. The ChL concept was developed to deal with the core issue of how to detach revenues and profitability from maximizing the volume of chemical compounds sold, which was the conventional practice in the chemicals industry at the time [10]. Indeed, besides the degradation of ecosystem services due to the discharge of untreated or insufficiently treated wastewater with chemicals, an environmental moral hazard emerged. Specifically, considering the pivotal role of industrial chemicals for the modern economy, the manufacturer has the incentive to produce environmentally less efficient compounds without considering their environmental impact at lifecycle level, as the EPR principle suggests. In this way, based on the conventional legislation, manufacturers of chemicals had no responsibility for the product’s use and waste discharge after selling the product; the focus was on the Use level, while the End of Life (EoL) level was heavily underestimated. This approach initiated and enhanced a vicious circle of unsustainable paths of chemical use, crowding out or even canceling the progress achieved in other vital sectors, such as the accrued energy efficiency increases in the EU [12,13].
Since 2004, significant findings have been produced on the utilization of ChL by the UNIDO pilots, as well as by other case studies. The literature is diverse in terms of these results; for instance, some academic works provide a catalog and an overall examination of ChL practices, along with a ChL hierarchy with compatibility and compliance to the EPR principle [14]. Other works scrutinize the benefits of ChL for industrial processes with traditionally heavy environmental impacts such as conveyor lubrication in the beverage industry [15]. Complementary to the above, some works attempt to present a basic typology of possible partnerships in ChL agreements with three main versions of the ChL business model [10], along with an introductory presentation of quantified results for the Serbian case study. For instance, partnerships could concern the supply of equipment for processing the liquid waste left after a chemical’s use, which may belong to the producer or be rented from a third party that specializes in the field. The consultation on the chemical’s optimal use could be outsourced to a third party by the producer and offered to the user. Other works attempt to fuse qualitative and quantitative assessments to establish ChL Key Performance Indicators (KPIs) [16] for promoting sustainable chemistry practices that are compatible with Environmental, Social, and Governance (ESG) criteria. Another related category of works addresses the issue of quantifying ChL efficiency with energy and mass balances across a chemical compound’s lifecycle [17] and views the relation of a VAC’s market price to its production cost and relates it to its recovery risk.
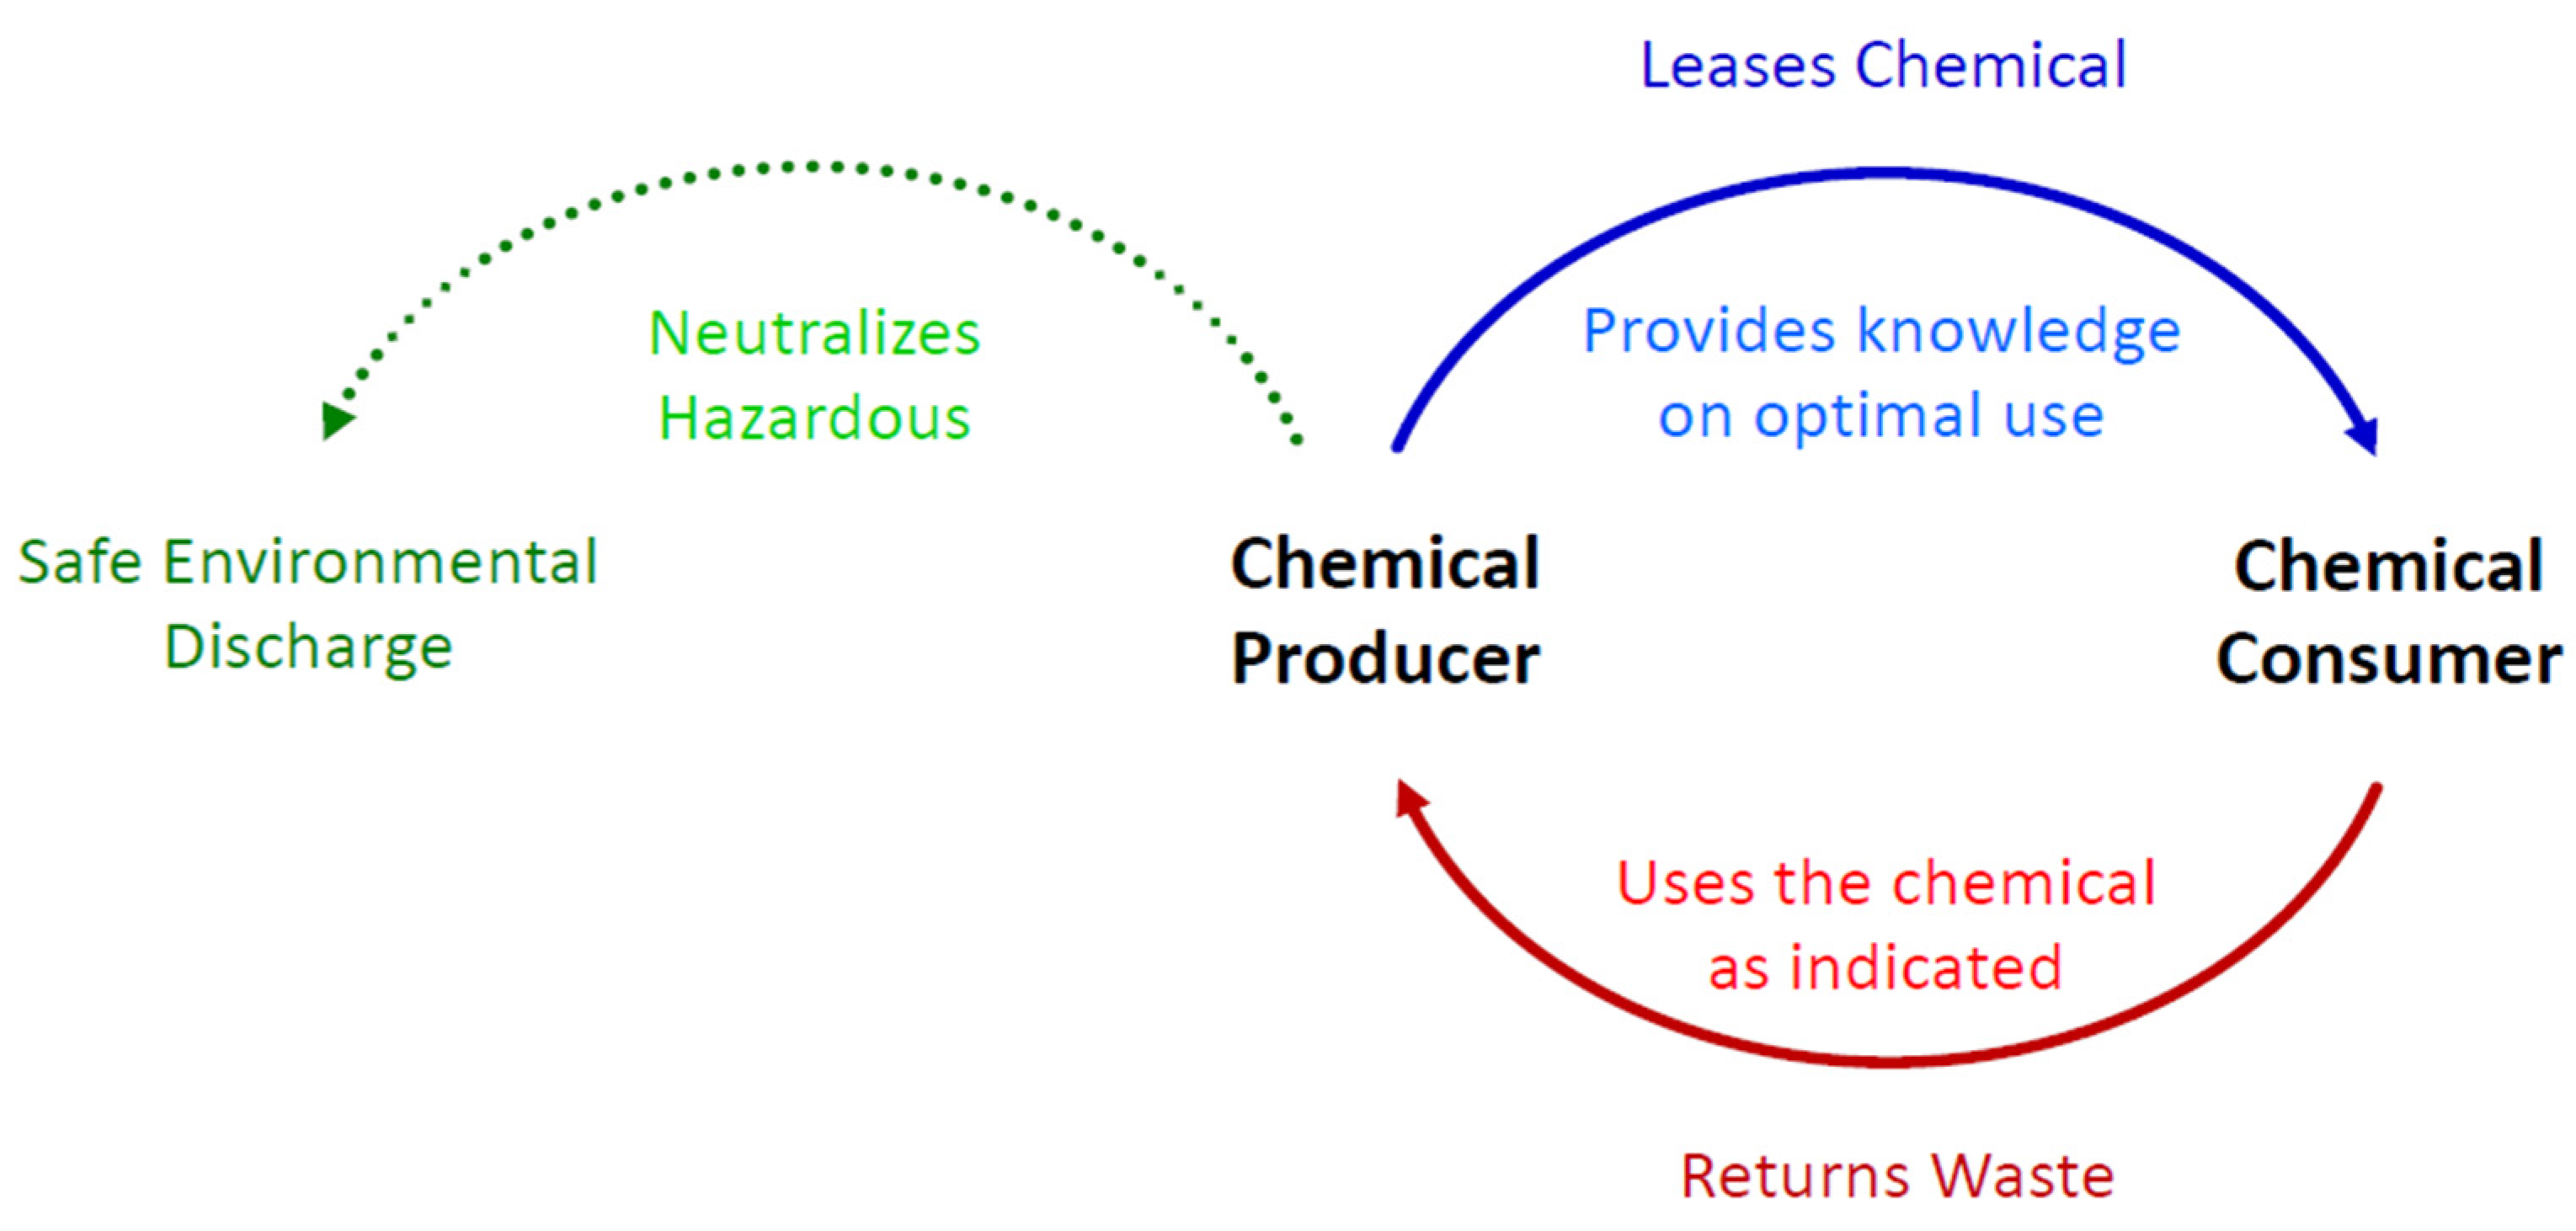
A more econometric-oriented ChL approach concerns the study of farmers’ preferences to engage in ChL agreements to reduce the use of agrochemicals via biomass reuse [18]. Another group of related works deals with how the social benefits or positive externalities of ChL could be incorporated into corporate environmental accounts and Corporate and Social Responsibility (CSR) reporting [19]. To review the global experience of ChL, the UNIDO published a report on its performance in cleaning operations [20], assessing core ecosystem health variables such as Biochemical Oxygen Demand (BOD). Finally, more recent works on ChL examine its improvement potential [21] via questionnaire models that are user-friendly for businesses, ChL’s integration with Sankey diagrams, and empirical ChL value-added examples [22]. In the above context, ChL allocates and optimizes a chemical product’s recovery cost between manufacturers and end users, in compliance with the EPR principle. The original UNIDO ChL model is depicted in Figure 3 as a Bilateral scheme with only two counterparties:
Figure 3 presents the mass and value flows in the standard Bilateral contract, establishing a collaboration between the chemical’s producer and user at lifecycle level. Specifically, the producer provides the chemical to the user along with consultation on its optimal utilization in order to minimize the amount of chemical waste that is discharged into the environment. Here, the contract binds the producer to manufacturing more environmentally efficient chemicals and guides the client on how to use them optimally. In turn, the producer is legally obligated to receive the wastes from the user, provided that the latter has used the chemical in the designated way. In this way, the agreement has more power, as it establishes checks and balances for both counterparties. Specifically, (a) the user ensures that the producer’s consultation is indeed effective, which is the case if the amount, costs, and generated wastes are minimal and expected, while (b) the producer ensures that the user has indeed used the chemicals as intended, as this is verifiable from the produced wastes. Once the wastes are the expected ones, the last step of the agreement includes the producer’s responsibility to manage and neutralize hazardous compounds for safe environmental discharge.
In the above context, a less discussed ChL facet concerns Construction and Demolition Wastes (CDWs), which, in weighted average terms of materials, could mitigate up to 20% of global CO2 emissions. Elements of ChL practices can be identified in the building sector, as transparency constitutes a fundamental requirement of the Whole Life Carbon Assessment (WLCA) [23] of a building material’s EoL Management (levels C1–C4). Essentially this comprises a commitment that the materials have the necessary R&D inputs (e.g., a lack of toxic compounds, low virtual fossil fuel and water footprints across manufacturing) from their design stage and be eligible as resource inputs again after the building’s disassembly at the end of its scheduled lifetime (the WLCA standard time is 60 years).
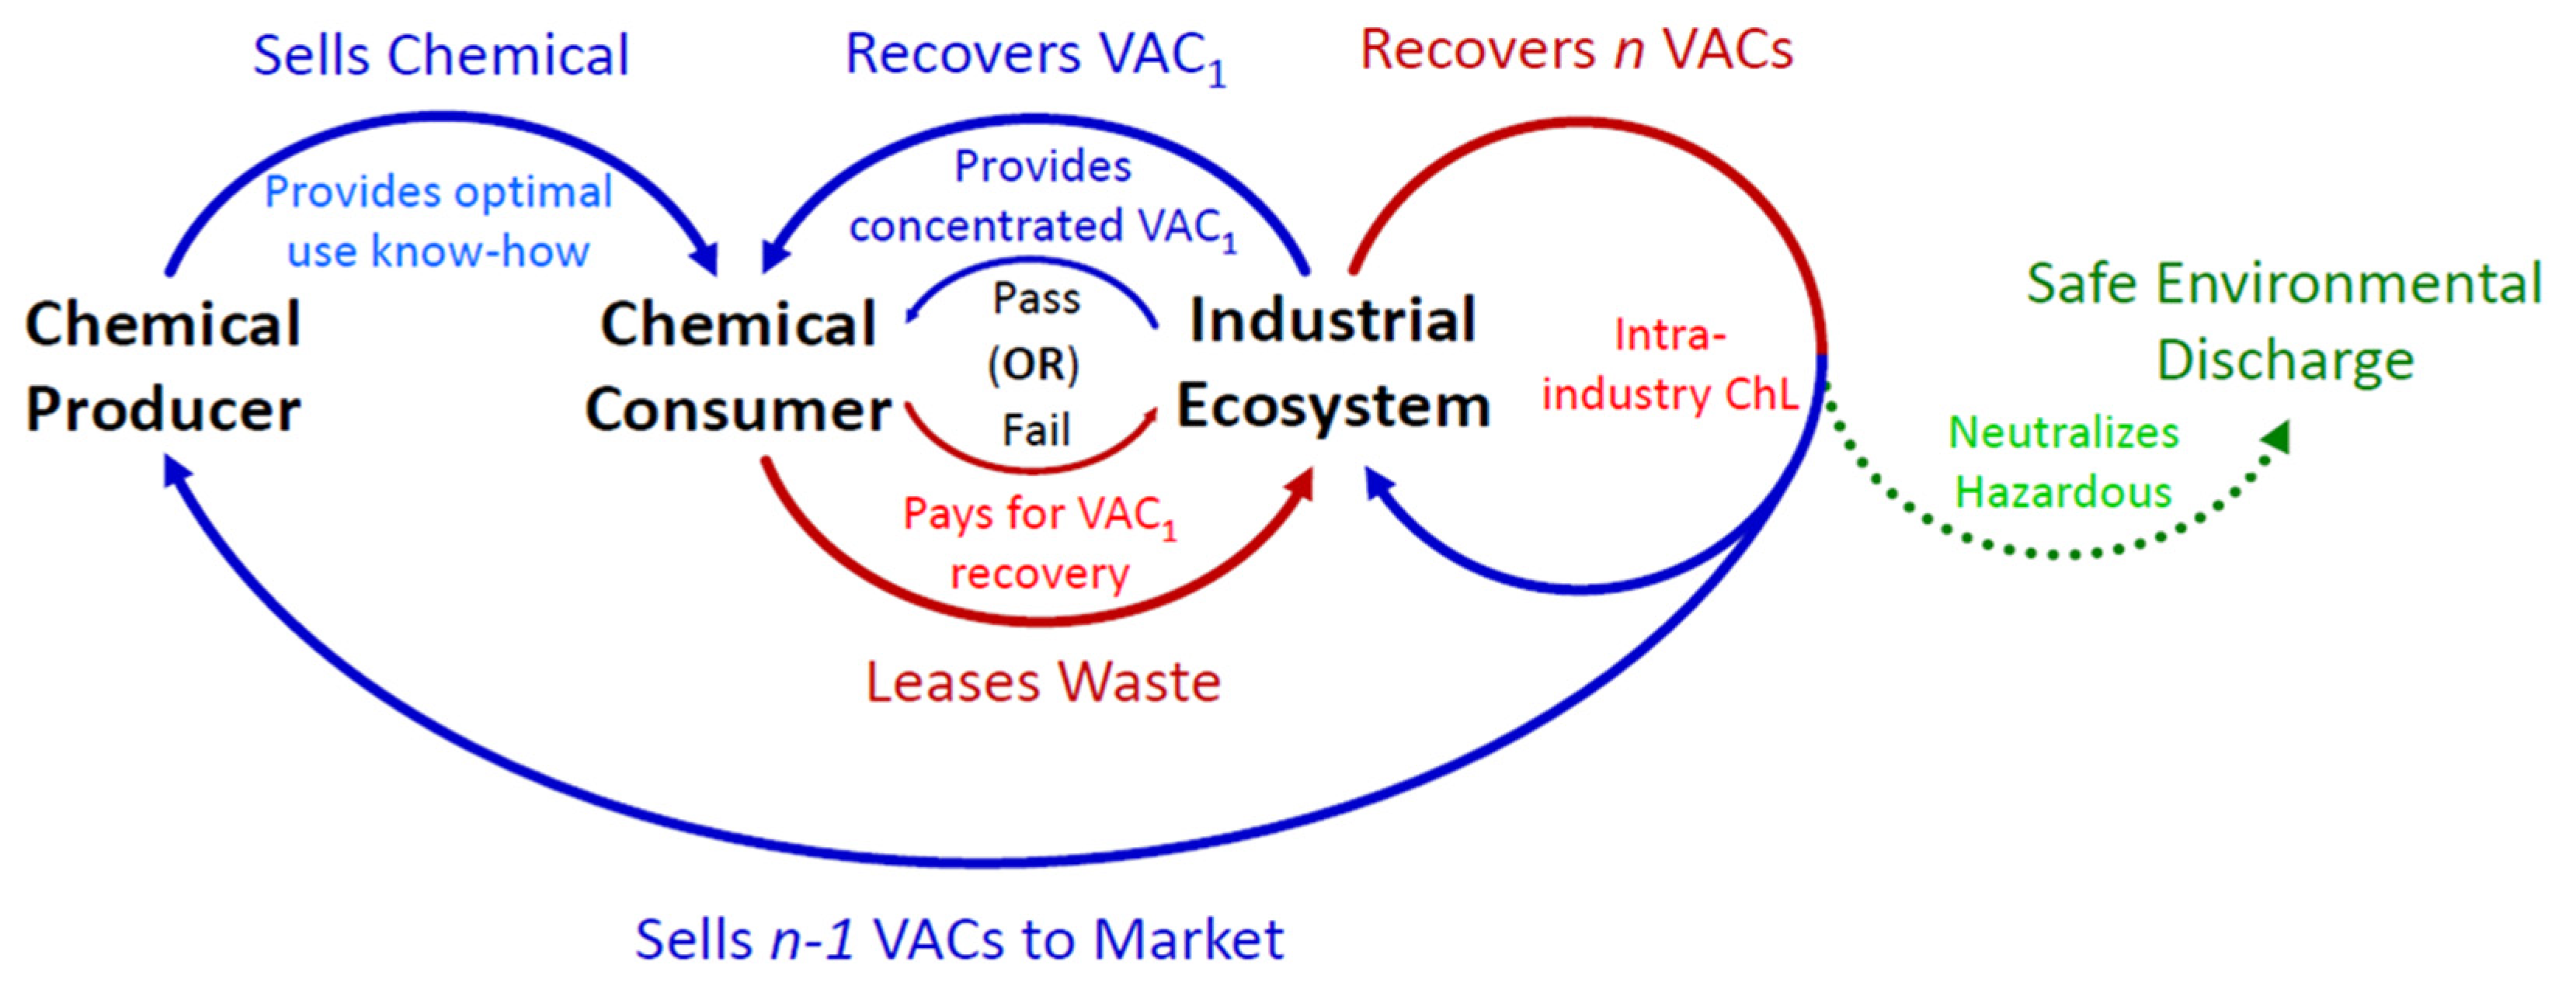
Similar sequences of checks and balances can be adopted for a VAC’s recovery from wastewater. The main difference is that an industry holding a wastewater matrix containing the VAC may assign its recovery to another industry as more cost-efficient. The ChL contract will ensure the VAC’s delivery at the agreed dilution level with a set of penalties in case of failure to meet this condition. Figure 4 generalizes the standard Bilateral ChL contract into the n-tier Multilateral/Bus scheme within the SP context.
The Multilateral/Bus contract is more complex as, besides the relationships described in the Bilateral contract, it includes third parties that are specialized in recovering VACs from waste matrices. The main diversification is that the user seeks a specialized third party to outsource (lease) its waste management, recover target VACs, and minimize its environmental footprint. Across this sequence, several intra-industrial agreements may take place to maximize the VAC amounts and species, minimize or eliminate hazardous compounds before safe environmental discharge, and sell back to the market any VAC that is not a part of the initial ChL agreement; hence belonging to the industrial cluster. The models in Section 3 concern the generalized ChL form unless stated otherwise.

3. Results

In this section, we present a comprehensive view of three ChL engineering modules of vital scientific and commercial significance: (1) the step-by-step structuring of the ChL statistical mechanics and their integration into the SP on a VAC’s recovery from wastewater; (2) the typology of ChL markets by information completeness on the cost-prevalence ranges of industries (i.e., at which VAC dilution level is each industry most cost-efficient at recovering the VAC) along with a Kullback–Leibler Divergence (DKL) metric for identifying market concentration; and (3) the analysis of three distinct ChL pricing models with the industry profiles that best fit each one of them.

3.1. ChL Financial Engineering

Having developed, in Section 2.2 and Section 2.3, the mathematical framework of the SP for each industry and the formation of the VAC recovery market SP from the composition of the SPs of at least two (n ≥ 2) industries [4], we further build the stochastic framework on how wastewater matrices containing VACs arrive at industries in discrete time. For mathematical convenience relative to the models developed, we will refer to these matrices as wastewater packages. The integration of the stochastic framework of wastewater package arrivals and the SP provides a complete ChL mathematical framework.
An important mathematical SP aspect when VAC dilutions are used instead of VAC concentrations is the non-constant increases in the fraction 1/m across constant decreases in concentration m. This results in a nonlinear 1/m growth pattern that follows a similar pattern to the Harmonic Series expressed by a 1/n decay function across constant changes in n [4]. Primarily, the use of inverse concentration provides conceptual, graphical, and visual SP conveniences, as it allows for the depiction of the dilution–cost coordinates with increasing values at both axes [4], beginning from higher concentrations (low dilutions) and lower recovery costs to lower concentrations (higher dilutions) and higher recovery costs. However, in this way, when the VAC dilution data (real or simulated) are plotted in relation to their frequencies, asymmetrical distributions like those shown in Figure 5a are yielded. Whatever the empirical distribution of the VAC dilutions in a population N or a sample of n wastewater “packages” is, its properties appear distorted due to the transformation of concentrations into dilutions. Hence, this view needs to be corrected.
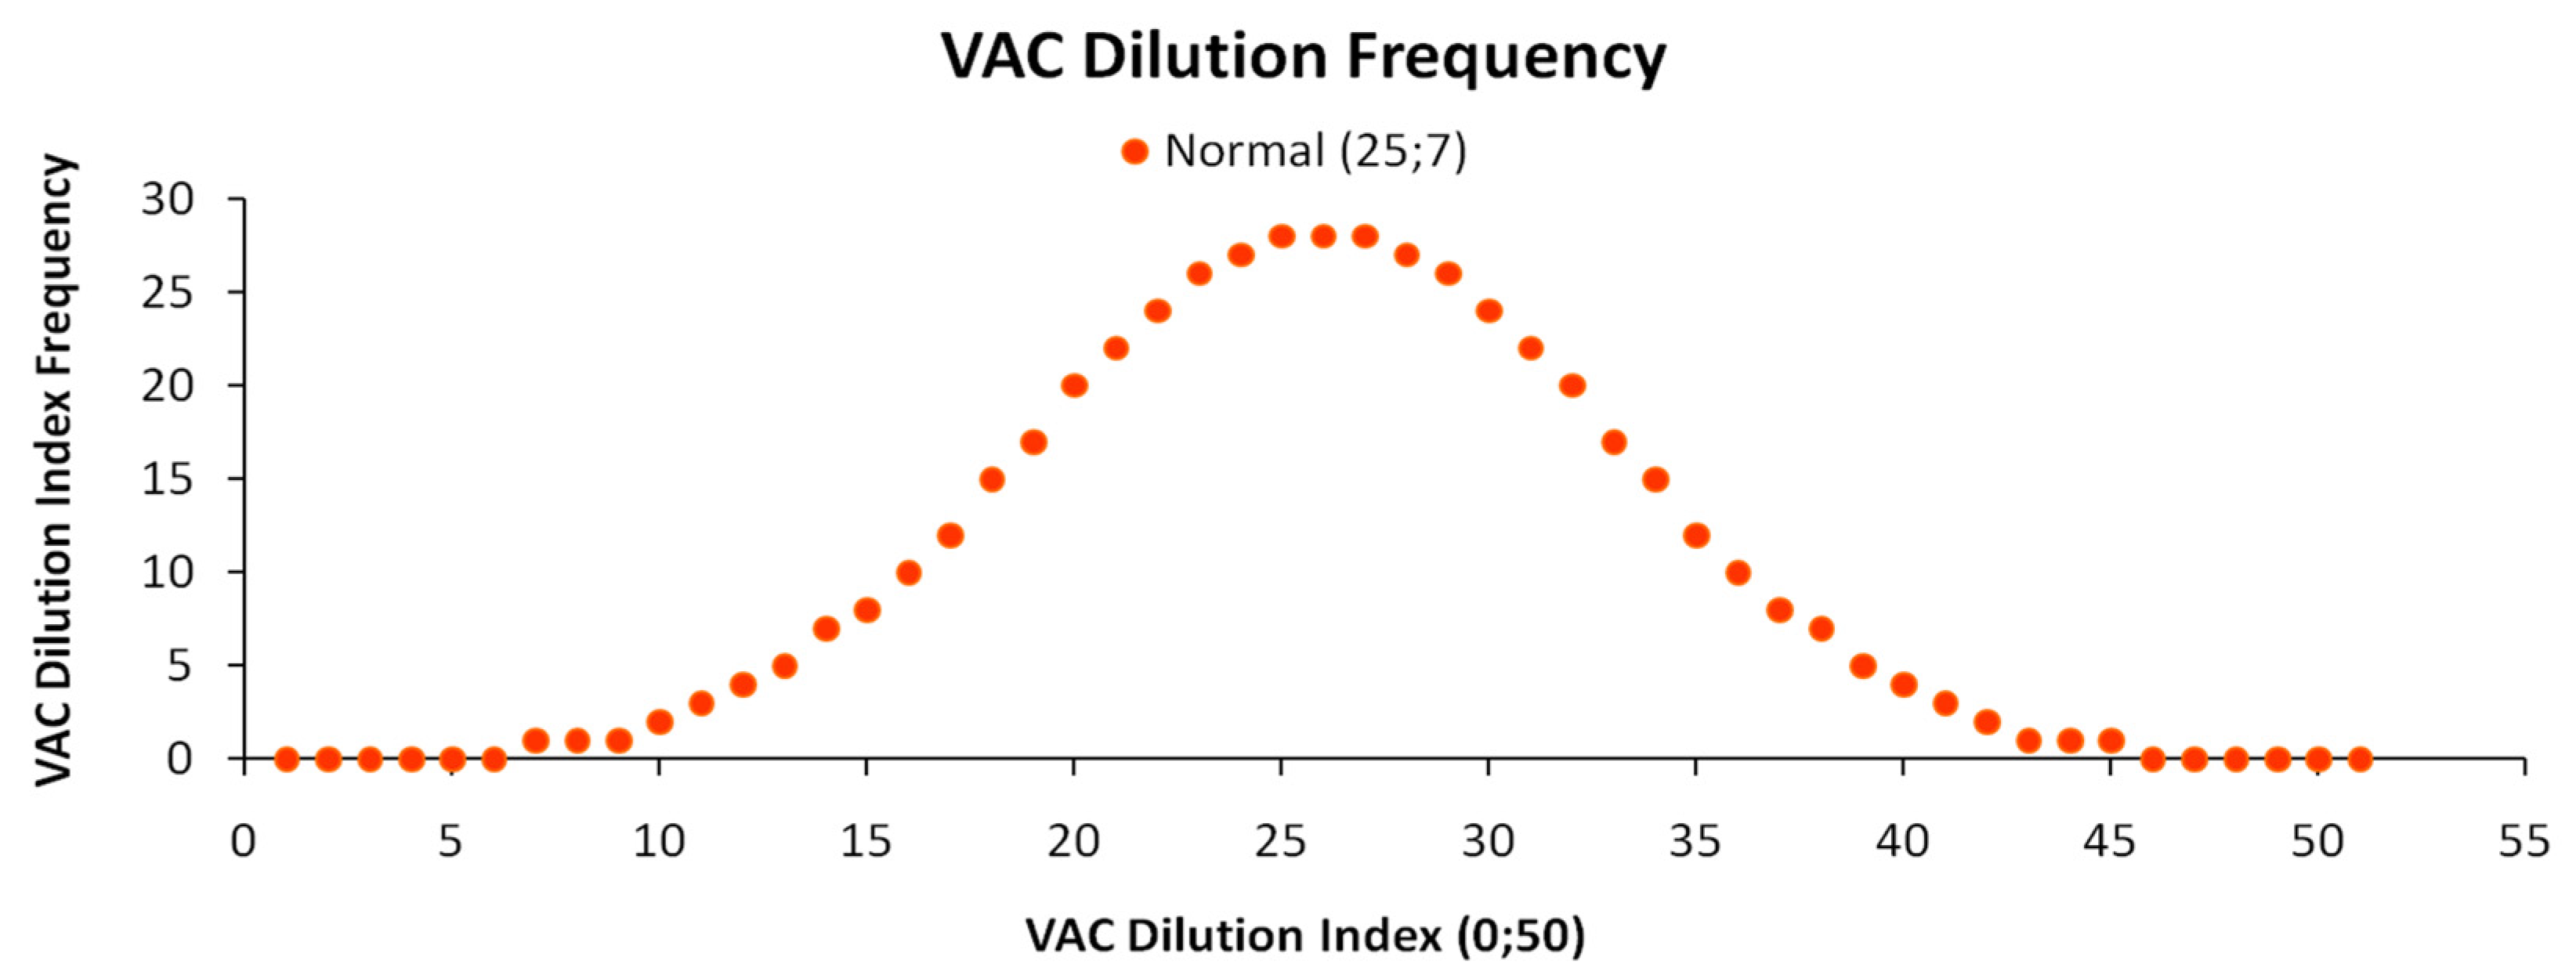
In Figure 5a, we present the distortion of a perfectly symmetrical Normal distribution giving a false visual impression of a positively skewed Normal distribution or even a Log–Normal distribution. Specifically, we present two simulated samples of 500 VAC dilution observations each. The first distribution (red) is the distribution of VAC dilution level frequencies at their arrival to the IS cluster for further processing, while the second distribution (blue) is the distribution of VAC dilution frequencies at their delivery to the customer by the IS cluster, after processing and recovering them from wastewater. Both distributions are described by the SP formula 1/Concentration (1/m, with m expressed as mg/L). Keeping that scale will create a visual distortion suggesting that the distributions are asymmetrical. By normalizing the data by simply assigning to each dilution level a monotonically increasing VAC Dilution Index (VAC DI) (e.g., for dilution 1/mi1 = 0.001→DI = 1; 1//mi2 = 0.001020→DI = 2, etc.), the data are visually corrected back to resemble the properties of the true distribution. Following this framework, Figure 6 depicts the frequency of VAC DI arrivals of N = 500 simulated samples, as presented in Figure 5b.
In our simulated case (DI∈(0,50), we assume symmetrical normality; however, one could choose any range and any frequency density. With this correction, Figure 5b depicts a symmetric Normal distribution of VAC arrivals (μ = 25, σ = 7) and of VAC deliveries (μ = 15, σ = 5), suggesting higher VAC concentrations at delivery due to its recovery. The symmetric Normal distribution properties back the theoretical background as one of the simplest possible cases. In real industrial symbiosis clusters, the distribution of VAC DI frequencies can obviously be described by any other distribution as well, symmetrical or asymmetrical (e.g., Log–Normal), short or heavy-tailed, suggesting the specific physical, chemical, and economic properties of the VACs contained in wastewater.
As ChL contracts are financial mechanisms for optimally allocating the recovery of VACs from wastewater in an IS market, we further consider Industry A and Industry B as its elements. We have already assumed a difference in their parameters, with aiA < aiB and biA > biB, according to Equation (1). For simplicity, we also assume the standard linear SP model with αij = βij = γij = δij = 1 for both industries. In addition, we assume that both industries have a common technical limit and operational range, meaning that there is an upper VAC dilution level after which none of the industries can technically achieve its recovery [4]. Hence, both industries can operate (to recover the VAC) in the range between that technical limit and 100% VAC concentration, meaning that both industries have exactly the same technological capabilities [4]. However, we can expect that for specific segments of this common operational range, industries are unequal in efficiency. For linear SPs, across an ascending or descending sorting of the VAC DI, the point after which the cost-efficient VAC recovery is achieved by a different industry than before is the operational shift point [4]; as, before or after that point, another industry begins to cost-dominate the VAC’s recovery [4]. However, irrespective of the above assumptions, the total number of operational shifts is relative, depending on the number of industries operating in the VAC DI range [4]. For simplicity, here, we assume that the market consists of only two industries. Figure 7 depicts how a market’s SP is composed by two individual industry SPs [4].
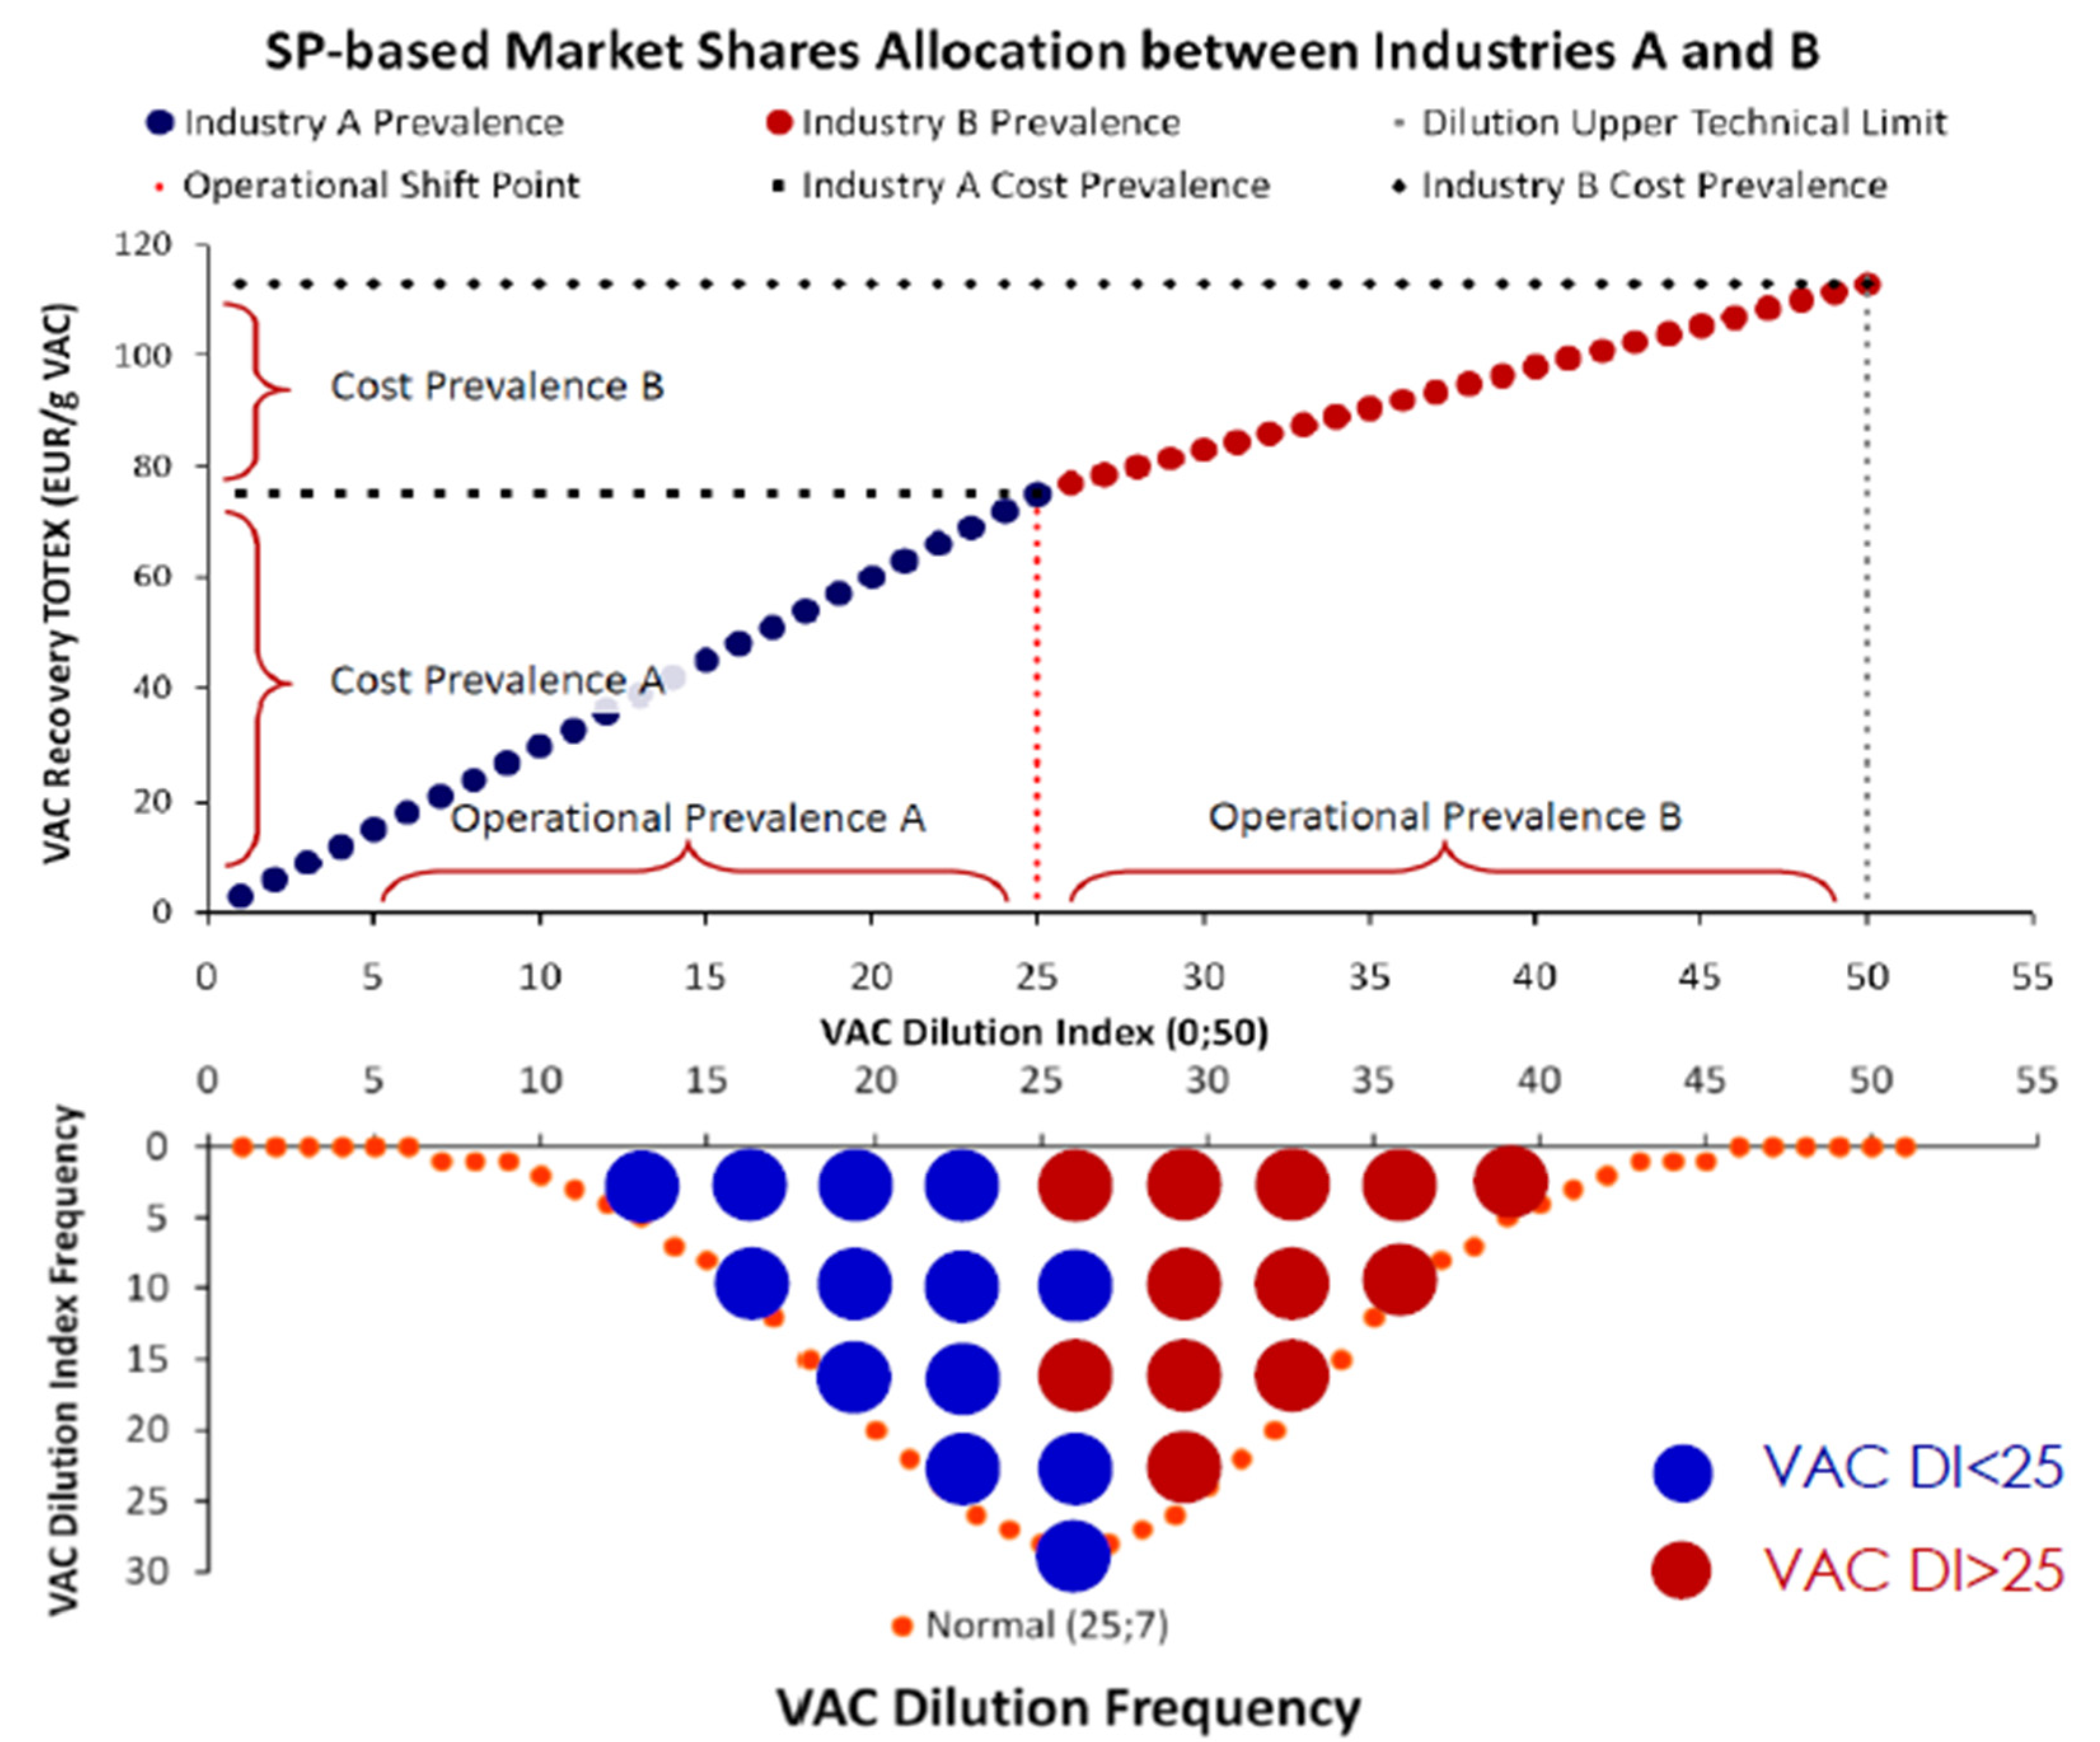
In Figure 7, as each industry is more cost-efficient at specific domains of the VAC DI range, the market will allocate industry shares by cost-prevalence. This domain is defined by where the VAC’s recovery is achieved at the minimum cost [4]. In our example, Industry A dominates in a range of lower VAC DI values (DI∈[0,25)), while Industry B dominates in the domain of higher VAC DI values (DI∈(25,50]). The SPs of the two industries intersect at VAC DI = 25, at the only dilution level where both industries recover the VAC at the same cost. This is the operational shift signaling the VAC’s cost-optimal recovery transition from Industry A to B. The nine assumptions regarding the VAC’s recovery and the relation between customers and industries are presented in Table 1.
Each assumption in Table 1 simplifies the framework without being unreasonable or distorting fundamental physical realities. For instance, although, at each VAC recovery, there will be thermodynamic material losses, assuming 100% efficiency will not sacrifice explanatory value. Applying the model to real IS ecosystems is just an issue of embodying a thermodynamic coefficient h∈(0,1). From a microeconomic view, assumptions 2–4 (wastewater matrices have the same chemical composition and are different only by the VAC’s dilution, inexistence of technological gaps between industries or quality differences across VAC delivery) suggest the conditions of a competitive VAC recovery market, as will be later shown via a Kullback–Leibler Divergence (DKL) metric. Regarding assumption 8, customers may indeed have geographical barriers (e.g., high transportation costs) for assigning their VACs’ recovery to industries in different geographical locations that are otherwise more cost-efficient. In general, although real-world IS cases have significantly higher complexity, in no case do they contradict the above framework. Having a statistical distribution of how wastewater packages arrive to the cluster and the market SP composed by the two industries, we are able to integrate these elements into a single framework and assess the potential of optimizing the VAC’s recovery. The combination of Figure 6 and Figure 7 yields this integrated framework, presented in Figure 8.
By integrating the market SP and the frequency of VAC DI arrivals, Figure 8 shows the range at which each industry is cost-prevalent at recovering the VAC. In our simulated example, as the market’s VAC DI range is allocated in equal parts, with the VAC DI distribution being symmetrical, the optimal allocation would be, respectively, for Industry A to recover all VAC arrivals with VAC DI∈(0,25) and Industry B to recover all VAC arrivals with VAC DI∈(25,50). Hence, the VAC recoveries will be allocated in exactly equal shares by the two industries. In the next section, we develop a ChL market typology with information completeness as a criterion. In this context, we argue that the higher the deviation from the state of complete information, the higher is the value of a ChL contract.

3.2. ChL Market Typology

From an industry’s process engineering view, the optimal allocation consists of the customer’s perfect knowledge of which of the two industries is more suitable (cost-efficient) for recovering the VAC at every DI level. As described in Table 1, there are various constraints on the customers’ rational selection of industries for recovering the VAC. In cases where the customer has all necessary information (i.e., at what DI is the VAC found in the wastewater package and which industry is cost-prevalent in recovering it), it will directly assign, via a ChL contract, the VAC’s recovery to the best available industry. In this case, the customer pays the industry to upgrade the VAC (i.e., increase the VAC’s concentration) while maintaining the VAC’s properties. A second possibility concerns a customer’s incomplete information. Specifically, the distribution of Figure 8 tells us nothing about how the VACs arrive to each industry when the customer has none of the above-mentioned information available. In such a case, we consider the VAC DI arrivals as random signals, where customers only see an industrial cluster and are unaware of any additional intra-industry arrangements needed to recover the VAC at the minimum cost, as long as they receive it back at the agreed concentration.

3.2.1. Complete Information

As mentioned, in the case of complete information, the customers know in advance the cost-prevalence ranges of both industries. Consequently they know where to optimally assign each wastewater package containing the VAC by its DI. The micro-structure of a VAC’s recovery market via the integration of SPs (as in Figure 7 and Figure 8) and the Normal distribution of how the VAC dilutions arrive in a simulated sample of N = 500 wastewater packages is presented in Figure 9.
Projected in our numerical example, this would mean that all VACs with DI < 25 will be assigned directly to Industry A, while all VACs with DI > 25 will be assigned to Industry B [for simplicity, we assume that VACs with DI = 25 are either assigned by the Uniform distribution, with the rationale of a “Fair Dice” (p = 1−p = 0.5 for both Industries A and B) or that there are no cases of DI =25 but only cases that asymptotically approach this value, with exact values either marginally below or above DI = 25]. With the above structure, a ChL agreement reduces to a Bilateral contract, as presented in Figure 3, involving only the customer and the IS ecosystem (1-tier agreement) without further need for intra-industry allocations. The physical foundations of a case like that could be traced to the existence of advanced sensors and real-time classification infrastructures that are able to handle huge amounts of data via fast and accurate sampling methods accompanied by accurate predictive algorithms on VAC DI distributions. In this view, Figure 9 depicts a market where each customer possesses prior knowledge on the market’s optimal cost allocation by VAC DI before assigning a wastewater package for VAC recovery, while the industries know in advance at what DI each (of the N = 500) wastewater packages contains the VAC. Figure 9 depicts the universal cost-efficient SP allocation of VAC recovery, as it prevents the need for intra-industry allocations with two-tier ChL contracts as a second optimal solution.
A pivotal aspect for both the complete and incomplete information cases concerns market concentration. In a previous work [4], we developed an integrated system of KPIs to measure market potential concentration. Following this context, we may further specify the quantification of the market’s empirical concentration via a Kullback–Leibler Divergence (DKL), as special information entropy metric, as follows:
D K L H O P I T L M | | Q D I i = X : M i n T L M m i 1 ; M a x D I i H O P I j T L M l n H O P I j T L M Q D I O P I j i , D I i [ 0 , + )
Equation (4) formulates the DKL components as a ratio of the distribution H of Operational Prevalence Indices (OPI) of a number ofM industries (M∈N+), forming the market’s technical limit (TLM) [4] to the distribution Q of VAC DI arrivals’ frequencies. In addition, we define the sample space X as the minimum function between the TLM and the maximum DI value of VAC arrivals to prevent Equation (4) from yielding invalid results DKL = ∅. However, any case where TLM < Max(DIi) should be interpreted as the market’s technical inability of VAC recovery at high dilutions. Respectively, cases where TLM > Max(DIi) should be interpreted as idle technical potential and a diagnostic of market inefficiency. Figure 8 and Figure 9 show a fully competitive VAC recovery market at maximum entropy state, with a DKL = 0. The DKL is fundamentally a relative entropy metric; here used to measure the distance between the distribution of VAC DI arrivals and the distribution of the market’s technical limit TLM between the industries. In our simulation, for M = 2, 50% of the 500 arriving wastewater matrices contain the VAC at DI < 25; hence, they are assigned to Industry A, which is cost-efficient in this range. The remaining 50% of the wastewater matrices containing the VAC at DI > 25 are assigned to Industry B with the same rationale. This is the simplest reference case, and real-world cases may deviate from it (e.g., all wastewater matrices contain the VAC at DI 0→25 range; hence, they all are assigned to Industry A).
From a process engineering perspective, complete information highlights the importance of improved infrastructure in facilitating separation from the source to shift the VAC DI arrivals’ distribution towards lower values (to the left), minimizing the information entropy (uncertainty) [26,27] and incentivizing industries to implement technical upgrades via investing in R&D [28,29], fostering know-how transfer via open-innovation agreements between the members of IS clusters [30,31], and reducing the embodied pollution intensity of materials [8,32] or even their complete substitution [33]. Figure 10, provides an analytical view of operational and cost allocations between the two industries and for two different distributions (symmetric and skewed Normal) of VAC DI arrivals for the complete information case.
A significant dimension of Figure 10 concerns the share that each industry has in the total cost. Although, in the case of the symmetric Normal distribution, 50% of the arrivals contain the VAC in dilution below DI = 25 and 50% above it, the recovery cost of Industry B for each DI > 25 is higher so that its share in the total cost of the market is higher, even if its Cost-Prevalence Index (CPI) [4] is lower.

3.2.2. Incomplete Information

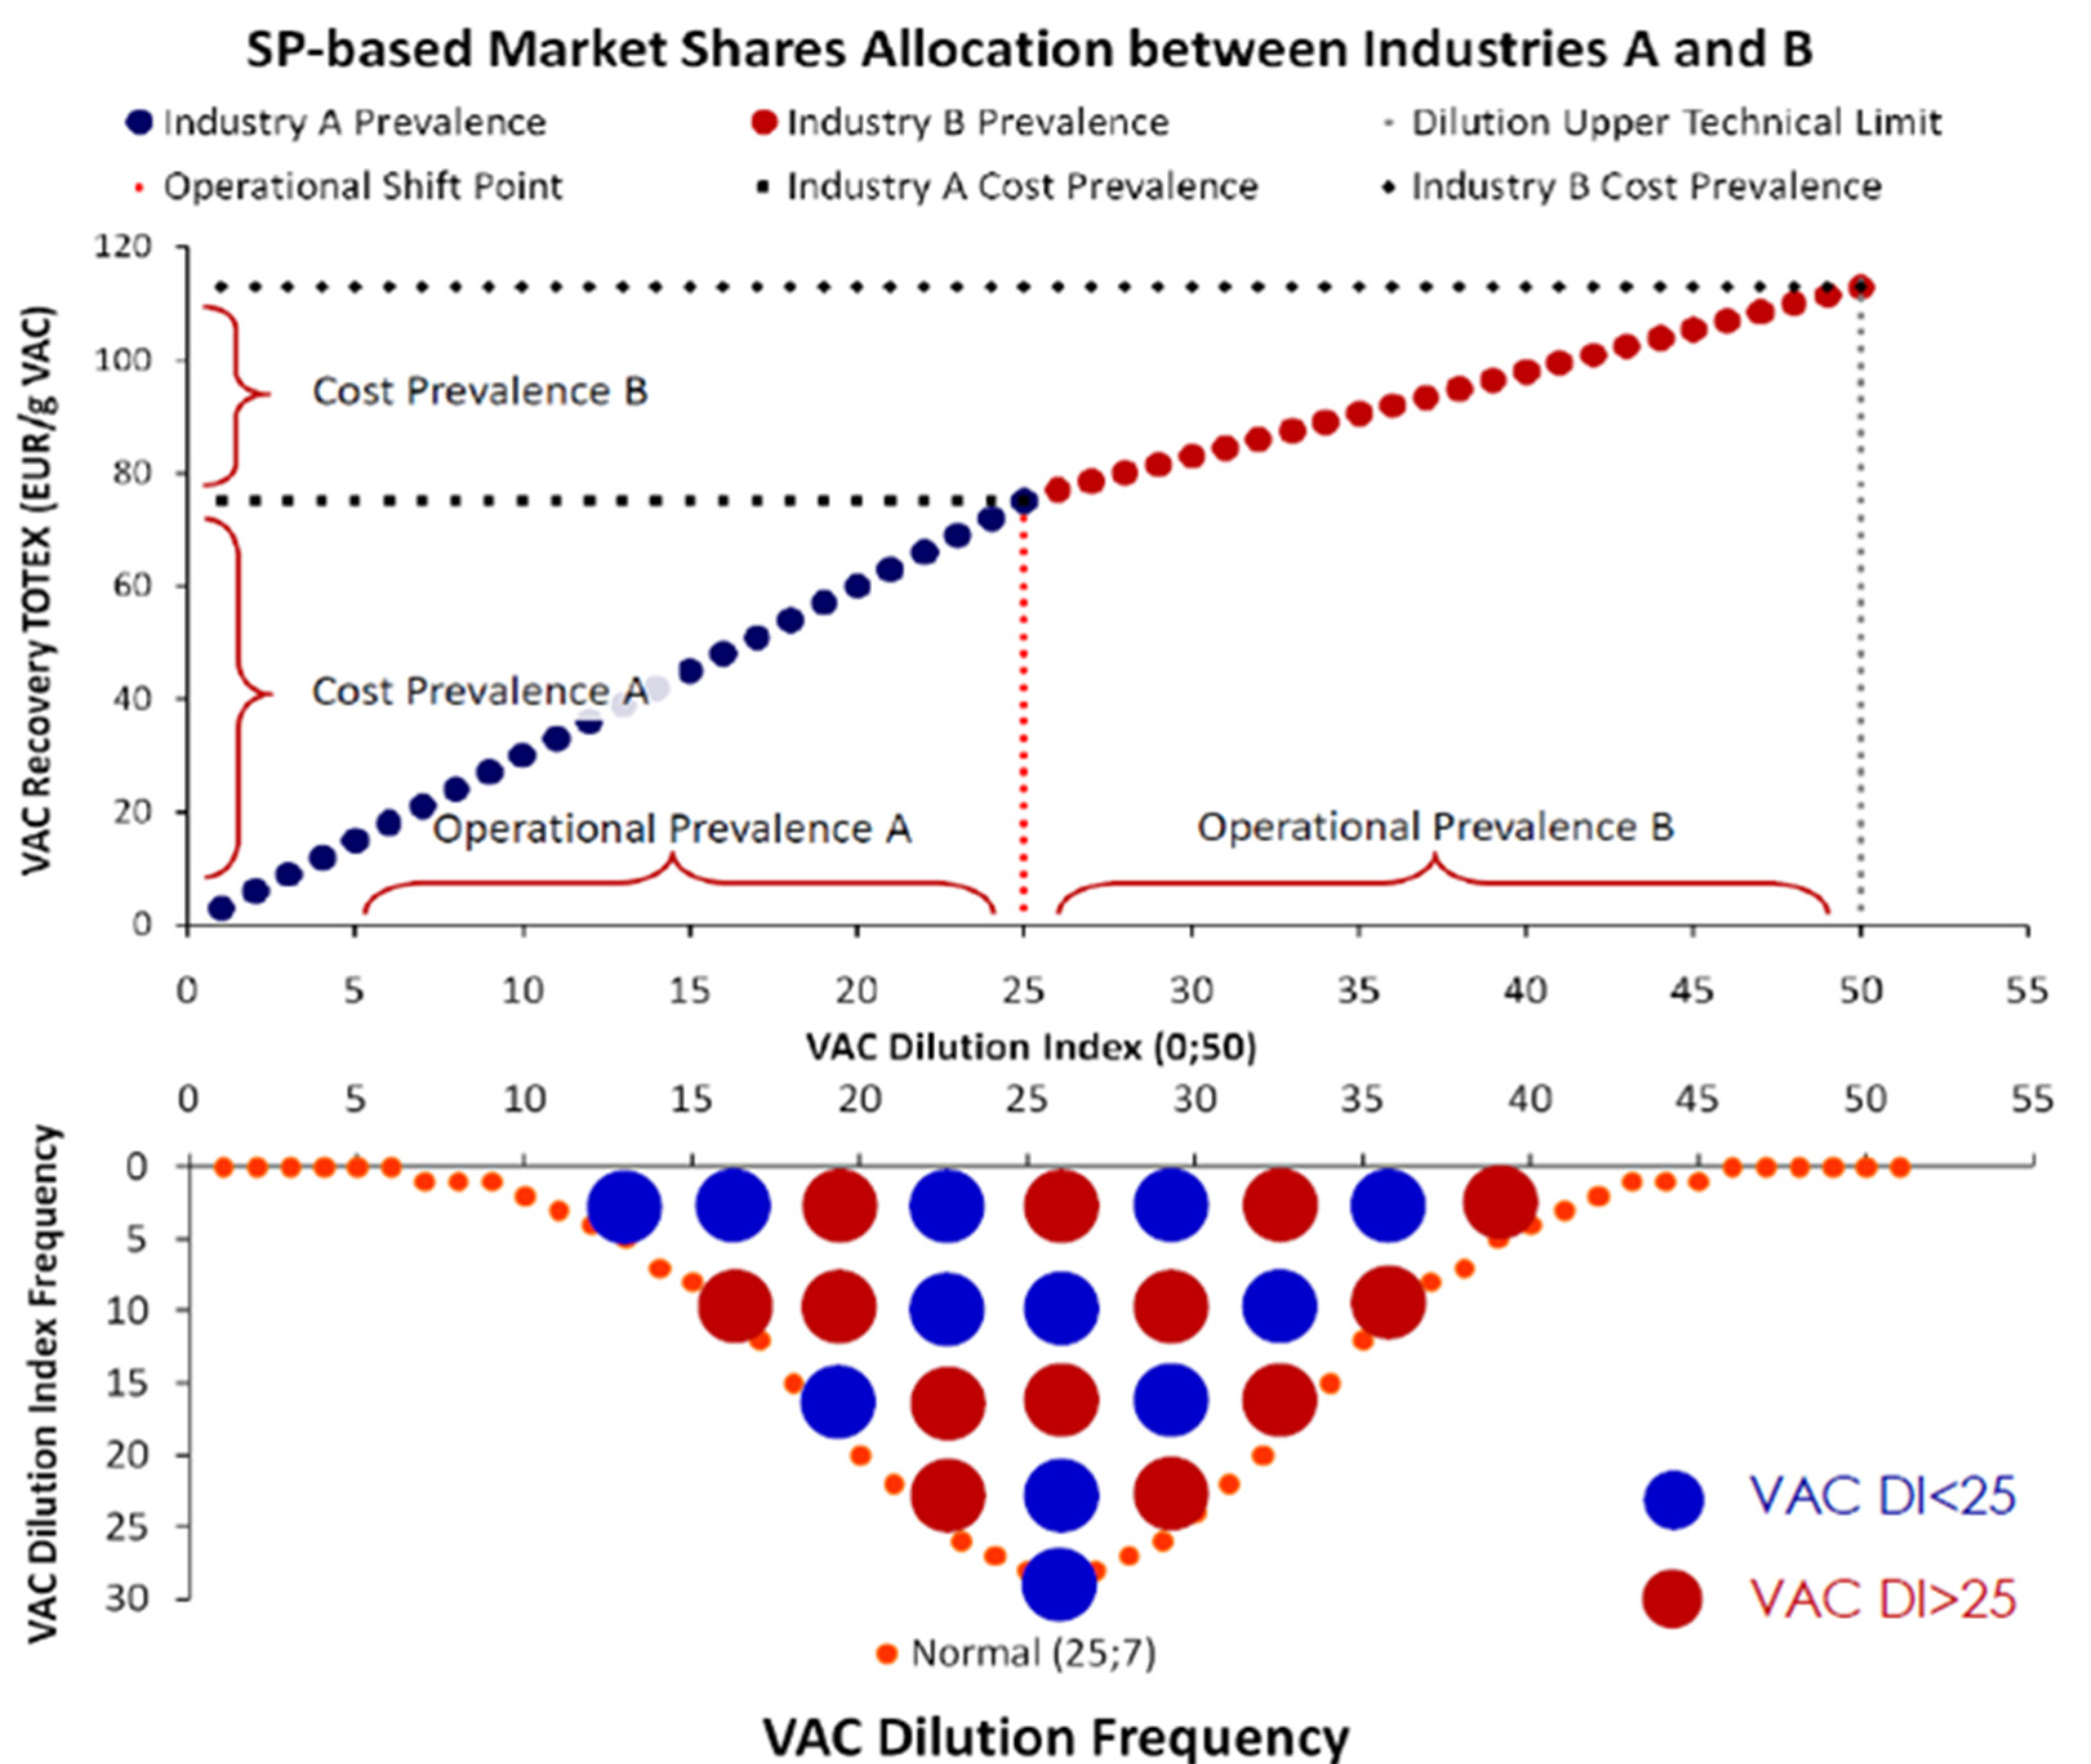
For the incomplete information case, VAC arrivals follow a Galton Board process [34], as a statistical mechanical analog of a supply chain consisting of a number of λ (λ∈N+) intermediate stages from the customer to the industry. Due to the lack of information on the DI of the VAC in their wastewater package and the cost-prevalence range of each industry, customers are unable to directly assign the recovery to the optimal industry. We also assume the no-slip property [35] of the Galton Board steps so that the distribution of VAC arrivals in industries fully reflects the distribution of the VAC dilution frequencies; which means 50% of the wastewater packages will be assigned to Industry A and the other 50% to Industry B. However, this time, the VACs are assigned in a scrambled order in relation to the optimal way. Thus, in our numerical example, some VACs with DI < 25 will be assigned to Industry B with operational prevalence for DI > 25, and vice versa. In this case, the industries have a motivation to collaborate with a two-tier ChL agreement and mutually outsource VACs with DIs for which they are not cost-prevalent.
In short, while it may be known (e.g., from the historical sampling) how the population of N = 500 packages is distributed in terms of VAC DI, each single wastewater package is a “black box” in terms of its own DI. With the lack of any preference towards a specific industry (e.g., due to established customer relations) making them commercially equal, as soon as wastewater packages arrive at the entry point of the IS cluster, they will be rationally assigned to each industry (A and B) according to the only available information: the overall VAC DI distribution. As shown in Figure 11, with the current market SP structure, the same number of wastewater packages will be initially assigned to each industry (250 to Industry A and 250 to Industry B), but this time, in a scrambled way.
For the case of incomplete information depicted in Figure 11, the fair (i.e., based on the best available information) assignment of wastewater packages to the two industries follows a Galton Board process [34]. A typical Galton Board follows the Binomial distribution, which for a large sample (as N = 500) converges to the Normal distribution:
P p k ; n N ; p = N n p n q n k , P , p , q 0 , 1 ; N , n , k Ν +
Equation (5) describes the stochastic process calculating the probability of having k assignments across a sequence of n independent Bernoulli Trials at a constant fairness level p for each separate trial. Overall, 500 wastewater packages arrive at the IS cluster, with each containing the VAC at specific DI value. Then, this population of N = 500 wastewater packages will be further assigned to Industries A or B via a binomial process. Assuming no bias towards a specific industry (the industries have equal power in the market; p = 0.5) the arrivals will preserve the properties of the (Normal) pool’s distribution. Hence, for a total number of arrivals N = 500 spread at a total range of VAC DIs (0,50), 50% percent of the arrived packages will be assigned to the segment (0,25) of the DI range, and the other 50% will be assigned to the segment (25,50) of the DI range. Alternatively, out of n = N = 500 fair (p = 0.5) trials, the most probable outcome is that k = 250 observations will be assigned to the DI∈(0,25) segment, while n-k = 250 observations will be assigned to the DI∈(25,50) segment of the market SP, as shown in Figure 11. Additionally, the sequence of arrivals has no impact on the allocation. For instance, even if all “blue” packages are the first 250 selected and distributed, with all the remaining 250 “red” packages following, the asymptotical 50–50% allocation between the two industries would be still preserved.
Two special facets of adopting the Binomial distribution to model the assignment of packages in the two industries are: (a) its inability to model the draws from a finite pool of N = 500 without replacement, which changes the next probability, and (b) a further analysis of each segment of the DI range. Regarding the first and most important aspect, it is reasonable to assume continuous arrivals of wastewater packages, which is equivalent to sampling with replacement. In regard to the second aspect, it suffices that each industry is cost-prevalent at a specific segment of the DI range; hence, each industry can recover the VAC from any wastewater package falling into that segment (e.g., it is negligible whether Industry A recovers a VAC from two wastewater packages, one at DI = 10 and one at DI = 15, as it is cost-prevalent for any DI∈(0,25)). However, for intermittent or finite sampling without replacement, the Hypergeometric distribution should be used instead as:
P k ; n N ; K = K k N K n k N n , P 0 , 1 ; N , K , n , k Ν +
Equation (6) suggests that from a finite population N (=500) of arriving wastewater packages, we seek the probability of k assignments to the right industry (having the role of “successes”, as this would mean that we assign packages with DI < 25 to Industry A and packages with DI > 25 to Industry B, respectively) from n withdrawals, knowing that there are exactly K packages with the desired feature (in our simulation, 250 with DI < 25 and 250 with DI > 25). The distinguishing difference from the Binomial distribution is that after every draw, the removed package is not replaced (i.e., the first package draw will leave a population N = 499 for the next draw and so on), which, in physical terms, is interpreted as the lack of a continuous flow of wastewater packages for VAC recovery. More analytical examples with incomplete information for full and partial VAC recovery with and without shift between industries are presented in Appendix A.
Finally, the features of wastewater package flows comprise a factor for the selection of the optimal ChL pricing model. As shown in Section 3.3, variable ChL pricing models are coupled to an industry’s real-time available VAC processing capacity; hence, they are more indicative of continuous flow patterns that are described by the Binomial distribution. Contrarily, an industry that receives wastewater packages from olive oil mills operating with high seasonality and generating relatively predictable quantities is an indicative example of intermittent and finite flow being better described by the Hypergeometric distribution, suggesting a less variable ChL pricing model due to easier scheduling.

3.3. ChL Pricing and Profitability

In this section, we answer a simple question: What is the economic incentive of industries to engage in two-tier ChL contracts without becoming competitive in their industrial cluster? Considering that within the EU Green Deal, EU SFT, and EPR contexts, ChL contracts are standardized financial instruments for IS that provide reliable performance metrics to financial institutions that seek opportunities to invest in resource recovery infrastructures but lack the suitable underlying payoff indices to do so.
In this context, we explore ChL profit patterns according to the three main fee models charged by the industries: (1) the constant fee, as the average of the difference of costs for each dilution level of the VAC; (2) the variable fee, as either (i) a weighted average fee by the frequency of the VAC’s dilution in the wastewater matrix or (ii) a fee pegged to an underlying index of the market’s fundamental commodity (e.g., fuel prices) or (iii) a fee coupled to the industry’s free processing capacity; and (c) the algorithmic fee, as a combination of a minimum and a variable charge up to a maximum cap. An important research aspect concerns how VAC DI frequency distributions affect ChL profits, assuming ceteris paribus [36] for the industries’ SP parameters (at least in the short term). This aspect is particularly important for developing countries with extremely low budgets for water infrastructures, resorting to Public–Private Partnerships (PPPs) [37]. In Appendix B, we examine in more detail the effect of imposed constraints on the distributions of VAC DI arrivals and deliveries, as well as on the profitability of the involved industries.
In relation to our numerical example, within the above context, the emerging question for industries will concern how much to charge for the service of recovering the VAC as part of the outsourcing agreement with another industry. For instance, assuming that Industry A receives a wastewater package for VAC recovery from Industry B via a ChL contract, the first step for Industry A will be to identify the objective pricing limits at each VAC DI level. Specifically, in our numerical example, at DI =10, the cost for Industry A to (fully) recover the VAC is 30 monetary units, while the cost of Industry B is 53 monetary units, meaning that Industry A cannot charge a price any lower than 30 monetary units, as it would be pricing below its own cost (hence recovering the VAC while making an economic loss). Respectively, it is unable to price above 53 monetary units, as this would be above the cost for Industry B to recover the VAC on its own without outsourcing it. In this context, we conclude that an industry hired to recover a VAC will price its services within a maximum range from just above from its own cost to just below the VAC recovery cost of the second-lowest bidding industry. Although, in our numerical example, the market consists of only two industries, in reality, more industries are expected to engage in both the VAC recovery and ChL markets, bidding against their immediate competitors (the immediately higher or lower bidder). Thus, for a number of M industries (M∈N+), with ascending cost orderCi1 < Ci2 < …<Cij, the general form of the Objective Pricing Limits (OPLs) P for any pricing model within the SP context is as follows:
P m i 1 | D I i = C ( m i 1 ) j | ν + 1 C ( m i 1 ) j | ν D I i | C ( m i j 1 ) | D I i O , P , m , D I , C R ; j , ν Ν +
Equation (7) shows the OPL as a function of each industry’s j SP at each DI for each VAC i for a number of industries M∈N-[0;1] that have the operational ability to recover the VAC at the specific DI and, hence, make an offer (in short, the DI belongs to the operational range of the industry’s SP), with industries sorted by an ascending cost order ν (from lowest to highest), is defined by the difference between the lowest possible recovery cost order and the exactly higher one. This means that for a number of industries recovering the VAC at a specific DI, the OPL is defined in pairs of two directly competitive industries. For instance, for four industries of different cost orders, with the lowest cost order at ν = 1, the OPL is defined between the industries with cost orders ν = 1→ν + 1=2, then ν + 1=2→ν + 2=3, and, finally, ν + 2=3→ν + 3=4. The critical detail for this formulation is that for a market consisting of any M > 2 industries, it is inaccurate to compare between the market’s minimum and maximum recovery cost, as there exist industries offering the VAC’s recovery at intermediate cost values. Hence, for instance, by comparing the costs of ranks 1 and 3, in case the industry of rank 1 would charge a ChL fee at a value between the cost of rank 2 and 3, it would be automatically excluded by the negotiation, with the industry of rank 2 taking its place. Equation (7) can be reformulated to fit our numerical example for M = 2 industries in the market as follows:
P m i 1 | D I i = M a x C ( m i 1 ) M i n C ( m i 1 ) D I i , P , m , D I , C R
Equation (8) is the benchmark for every ChL pricing model between two successive industries. After the examination of the formation of ChL agreements in relation to the SP as a flexible econometric model of a VAC’s recovery cost, we examine the three main ChL pricing models that usually take place in intra-industry outsourcing agreements. Specifically, we present (1) the Fixed or Mean (MEAN) ChL pricing, (2) the Variable or Capacity (VAR) ChL pricing, and (3) the Composite or Premium (COMP) ChL pricing models.

3.3.1. Mean ChL Pricing (MEANP)

The Fixed or Mean (MEAN) ChL pricing model is the simplest and most easily applicable model for intra-industry agreements, as it comprises the foundation for all other pricing models. Specifically, it sets the pricing modeling foundations, as it provides the upper and lower pricing bounds so that (a) VAC recovery is achieved at the optimal social cost and (b) with mutual private benefits derived for the industries engaging in the agreement (win–win contracts). The MEAN pricing of two industries signing a two-tier (intra-industry) ChL agreement for every VAC DI level is described by the following:
P M E A N m i 1 | D I i = M a x C ( m i 1 ) M i n C ( m i 1 D I i 2 , P , m , D I , C R ; i Ν +
Equation (9) is the mean value of Equation (8) on the OPL for M = 2, describing a state where the two industries agree to price their ChL services at a constant and predictable level across the whole VAC DI range. In our numerical example, except for the intersection at DI = 25, where both industries recover the VAC at the same cost, there is a constant profit margin that is beneficial to both industries across a wastewater package’s leasing. Specifically, for every DI ≤ 25, Industry A is cost-prevalent, while for DI ≥ 25, Industry B is cost-prevalent. Assuming that a case where Industry B holds a one-tier ChL contract with a customer on a wastewater package for recovering a VAC at DI = 10, the optimal strategy would be to sign a two-tier ChL agreement with Industry A as cost-prevalent at DI = 10, which would return the recovered VAC to Industry B, which would, in turn, deliver it to the external customer. The Mean pricing model is presented in Figure 12, depicting the simulated SPs of the two industries signing a two-tier ChL contract.
Such agreements resemble a long-term mutual commitment that is usually considered in futures derivative contracts to secure a purchase price. These agreements attempt to eliminate pricing competitions between counterparties; hence, they also reduce pricing variability risks in the IS cluster. In addition, fixed pricing essentially establishes a new market SP that is constant without structural breaks (yellow line in Figure 12), constantly depicting a higher VAC recovery cost that reflects the cost of incomplete information.

3.3.2. Variable ChL Pricing (VAR)

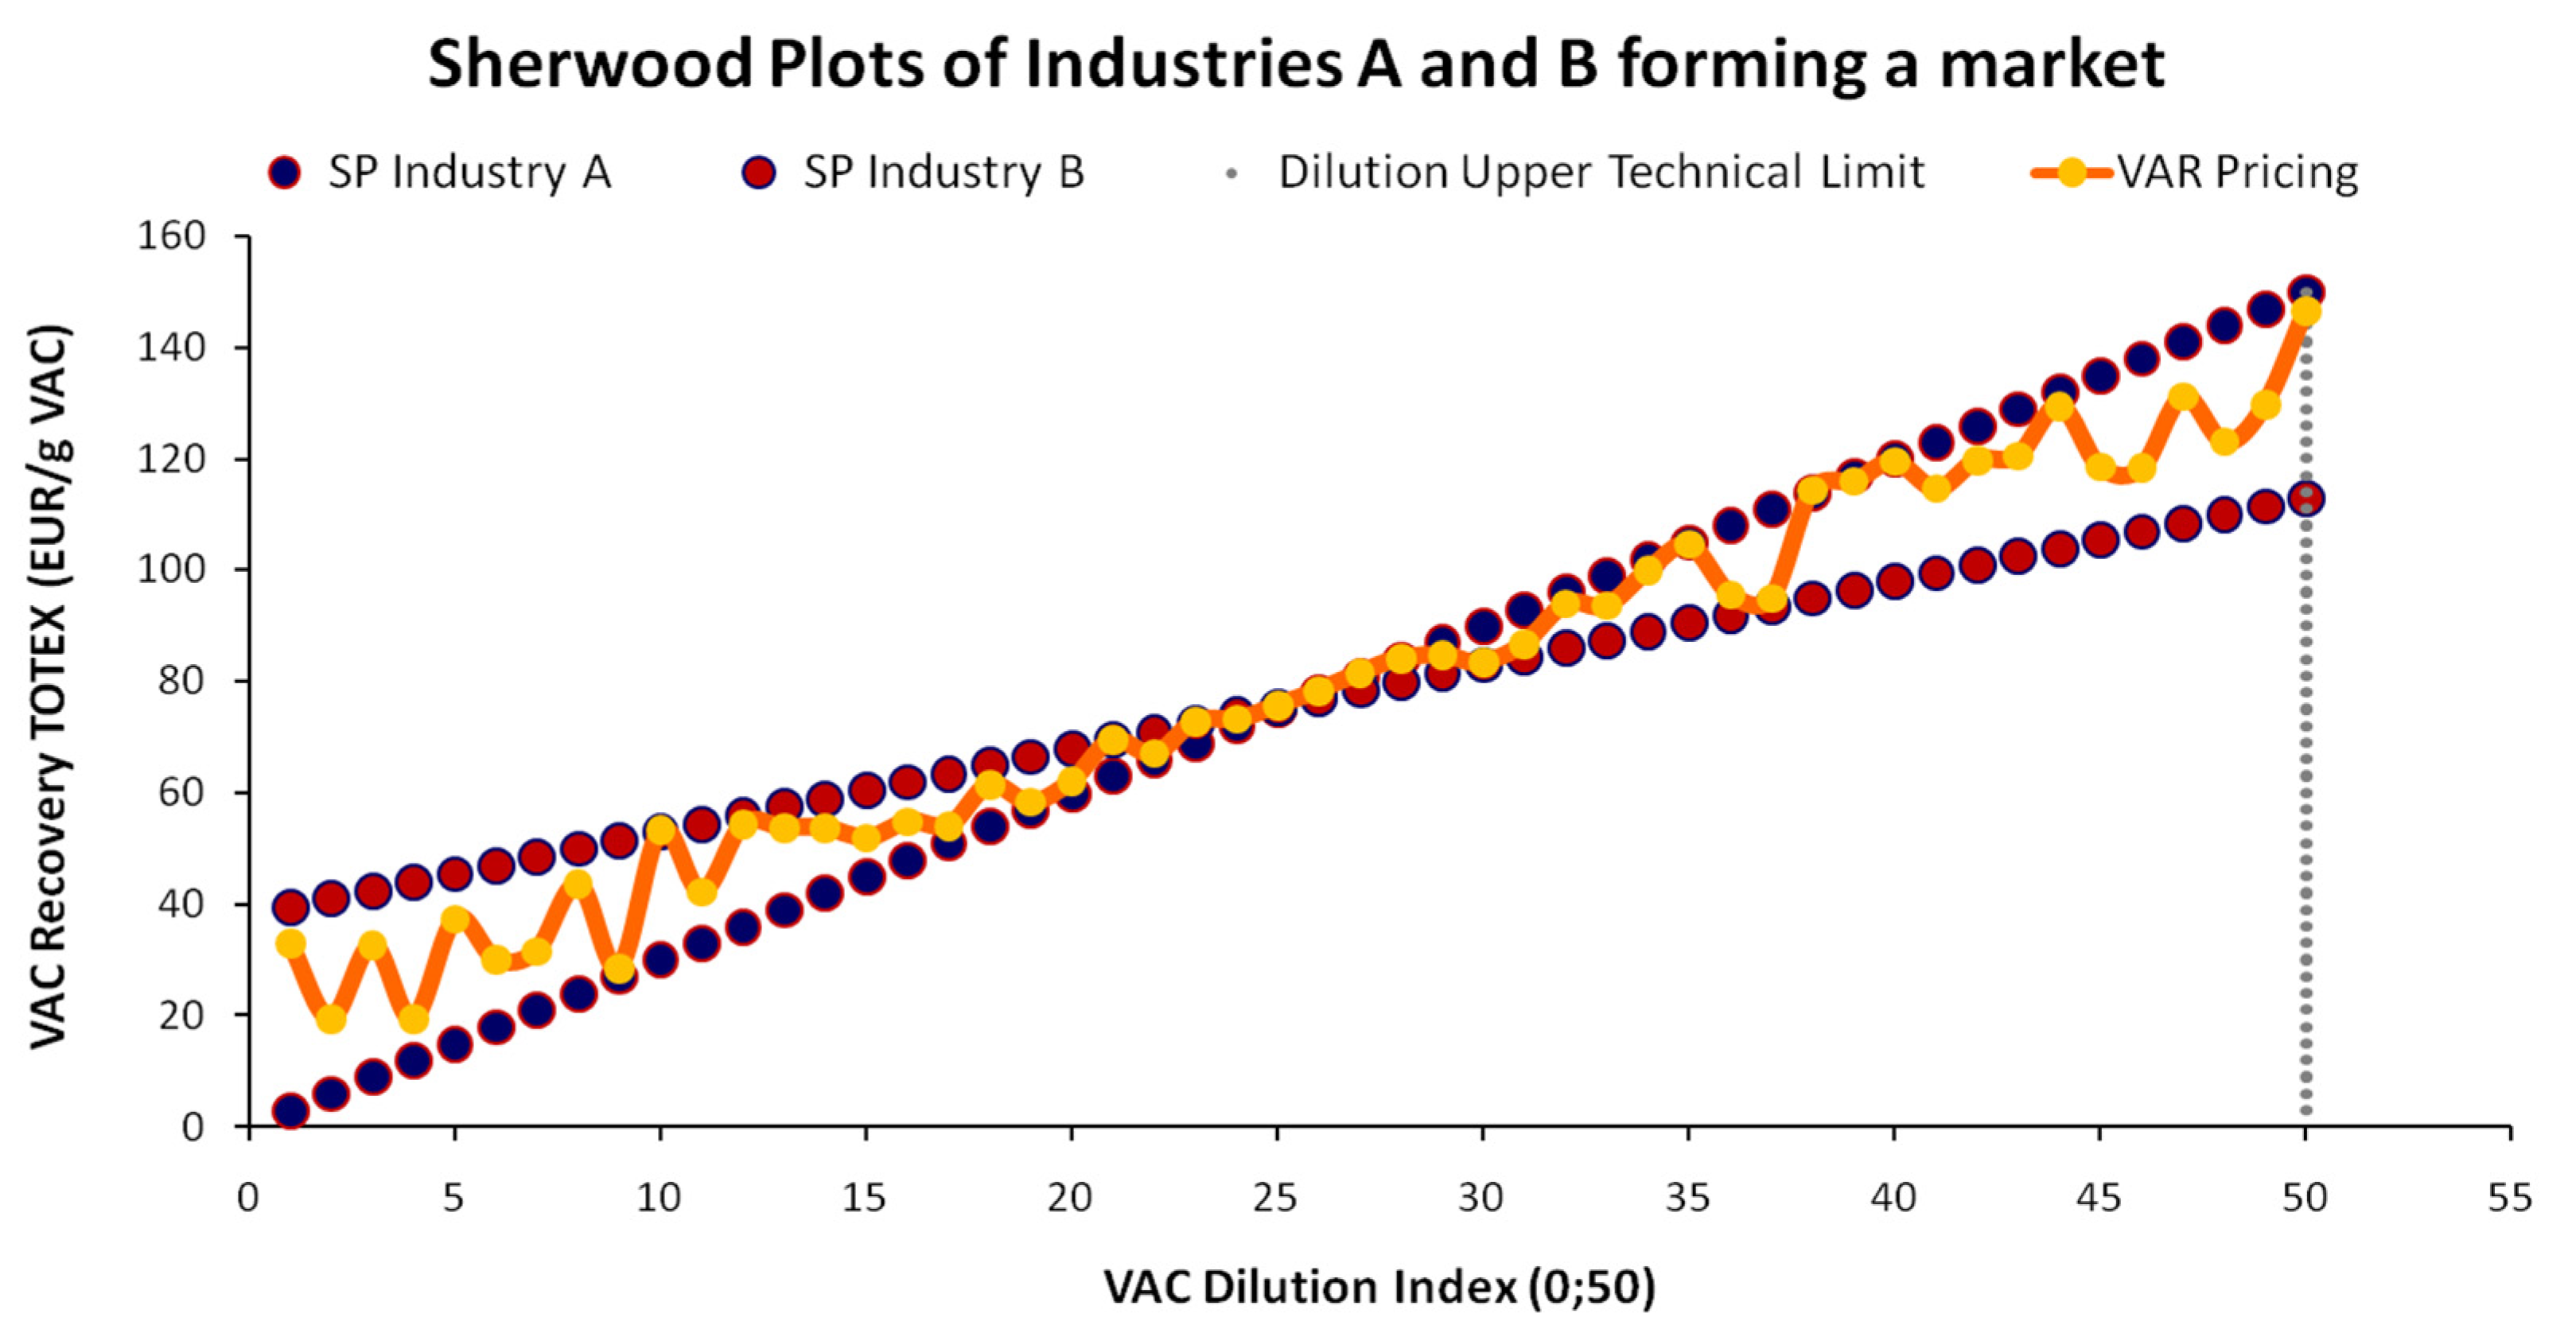
Following the OPL range and the Mean ChL pricing model, we examine the Variable or Capacity (VAR) ChL pricing model as a more complex case, shown in Figure 13.
As the OPL remains constant, we may see from Figure 13 that contrary to the fixed pricing model, VAR pricing yields fluctuating values at every VAC DI level for both industries, with no other reference aside from the OPL. Such a model can be perceived as ad hoc pricing that is usually adopted by industries with limited VAC processing capacity, which is easily exhausted across a continuous assignment of wastewater packages (containing the VAC), as described by the Binomial distribution in Equation (5). Such industries may operate continuously, book their capacity in advance via derivative contracts (e.g., futures, options), or use small compact units that can be easily disassembled and relocated geographically, such as small modular sewer-mining units [36,38], to treat the wastewater of small municipalities. Typically, small-scale units possess a limited wastewater processing capacity and VAC recovery volumes and require additional modules to achieve economies of scale.
In the above infrastructure context, the VAR ChL pricing model highly depends on the real-time density of wastewater packages’ arrivals. Thus, even if in overall the packages follow the Binomial or the Hypergeometric process, the arrivals’ sequence is of crucial importance for the VAR ChL pricing model. As VAR pricing depends on residual capacity, a high number of arrivals at a very short time or narrow VAC DI range (see Appendix B for a more detailed analysis) would create a bottleneck by consuming a high percentage of a unit’s residual capacity and increase the ChL charge. Furthermore, the allocation of profits highly depends on the distribution of delivered VAC DIs (see Appendix B). The VAR pricing of two industries signing a two-tier (intra-industry) ChL agreement at every VAC DI level is described as follows:
P V A R m i 1 | D I i = s t j | ν M a x C ( m i 1 D I i + 1 s t j | ν M i n C ( m i 1 D I i , P , m , D I , t , C R ; i , j , ν Ν +
Equation (10) suggests that the VAR pricing depends on the OPL capacity fraction s (0 ≤ s ≤ 1) consumed by the industry j with the lowest VAC recovery cost (at rank ν = 1) at every time step (t). For instance, upon the signing of an intra-industry ChL contract for a VAC’s recovery that, at time t, will consume 70% of its operating capacity, it will charge for its services an additional 70% of the OPL as a cap above its basic SP cost. Hence, with VAR ChL pricing, the unit will use the OPL at the specific VAC DI only as a benchmark to estimate the additional realistic charge above its basic cost.

3.3.3. Composite ChL Pricing (COM)

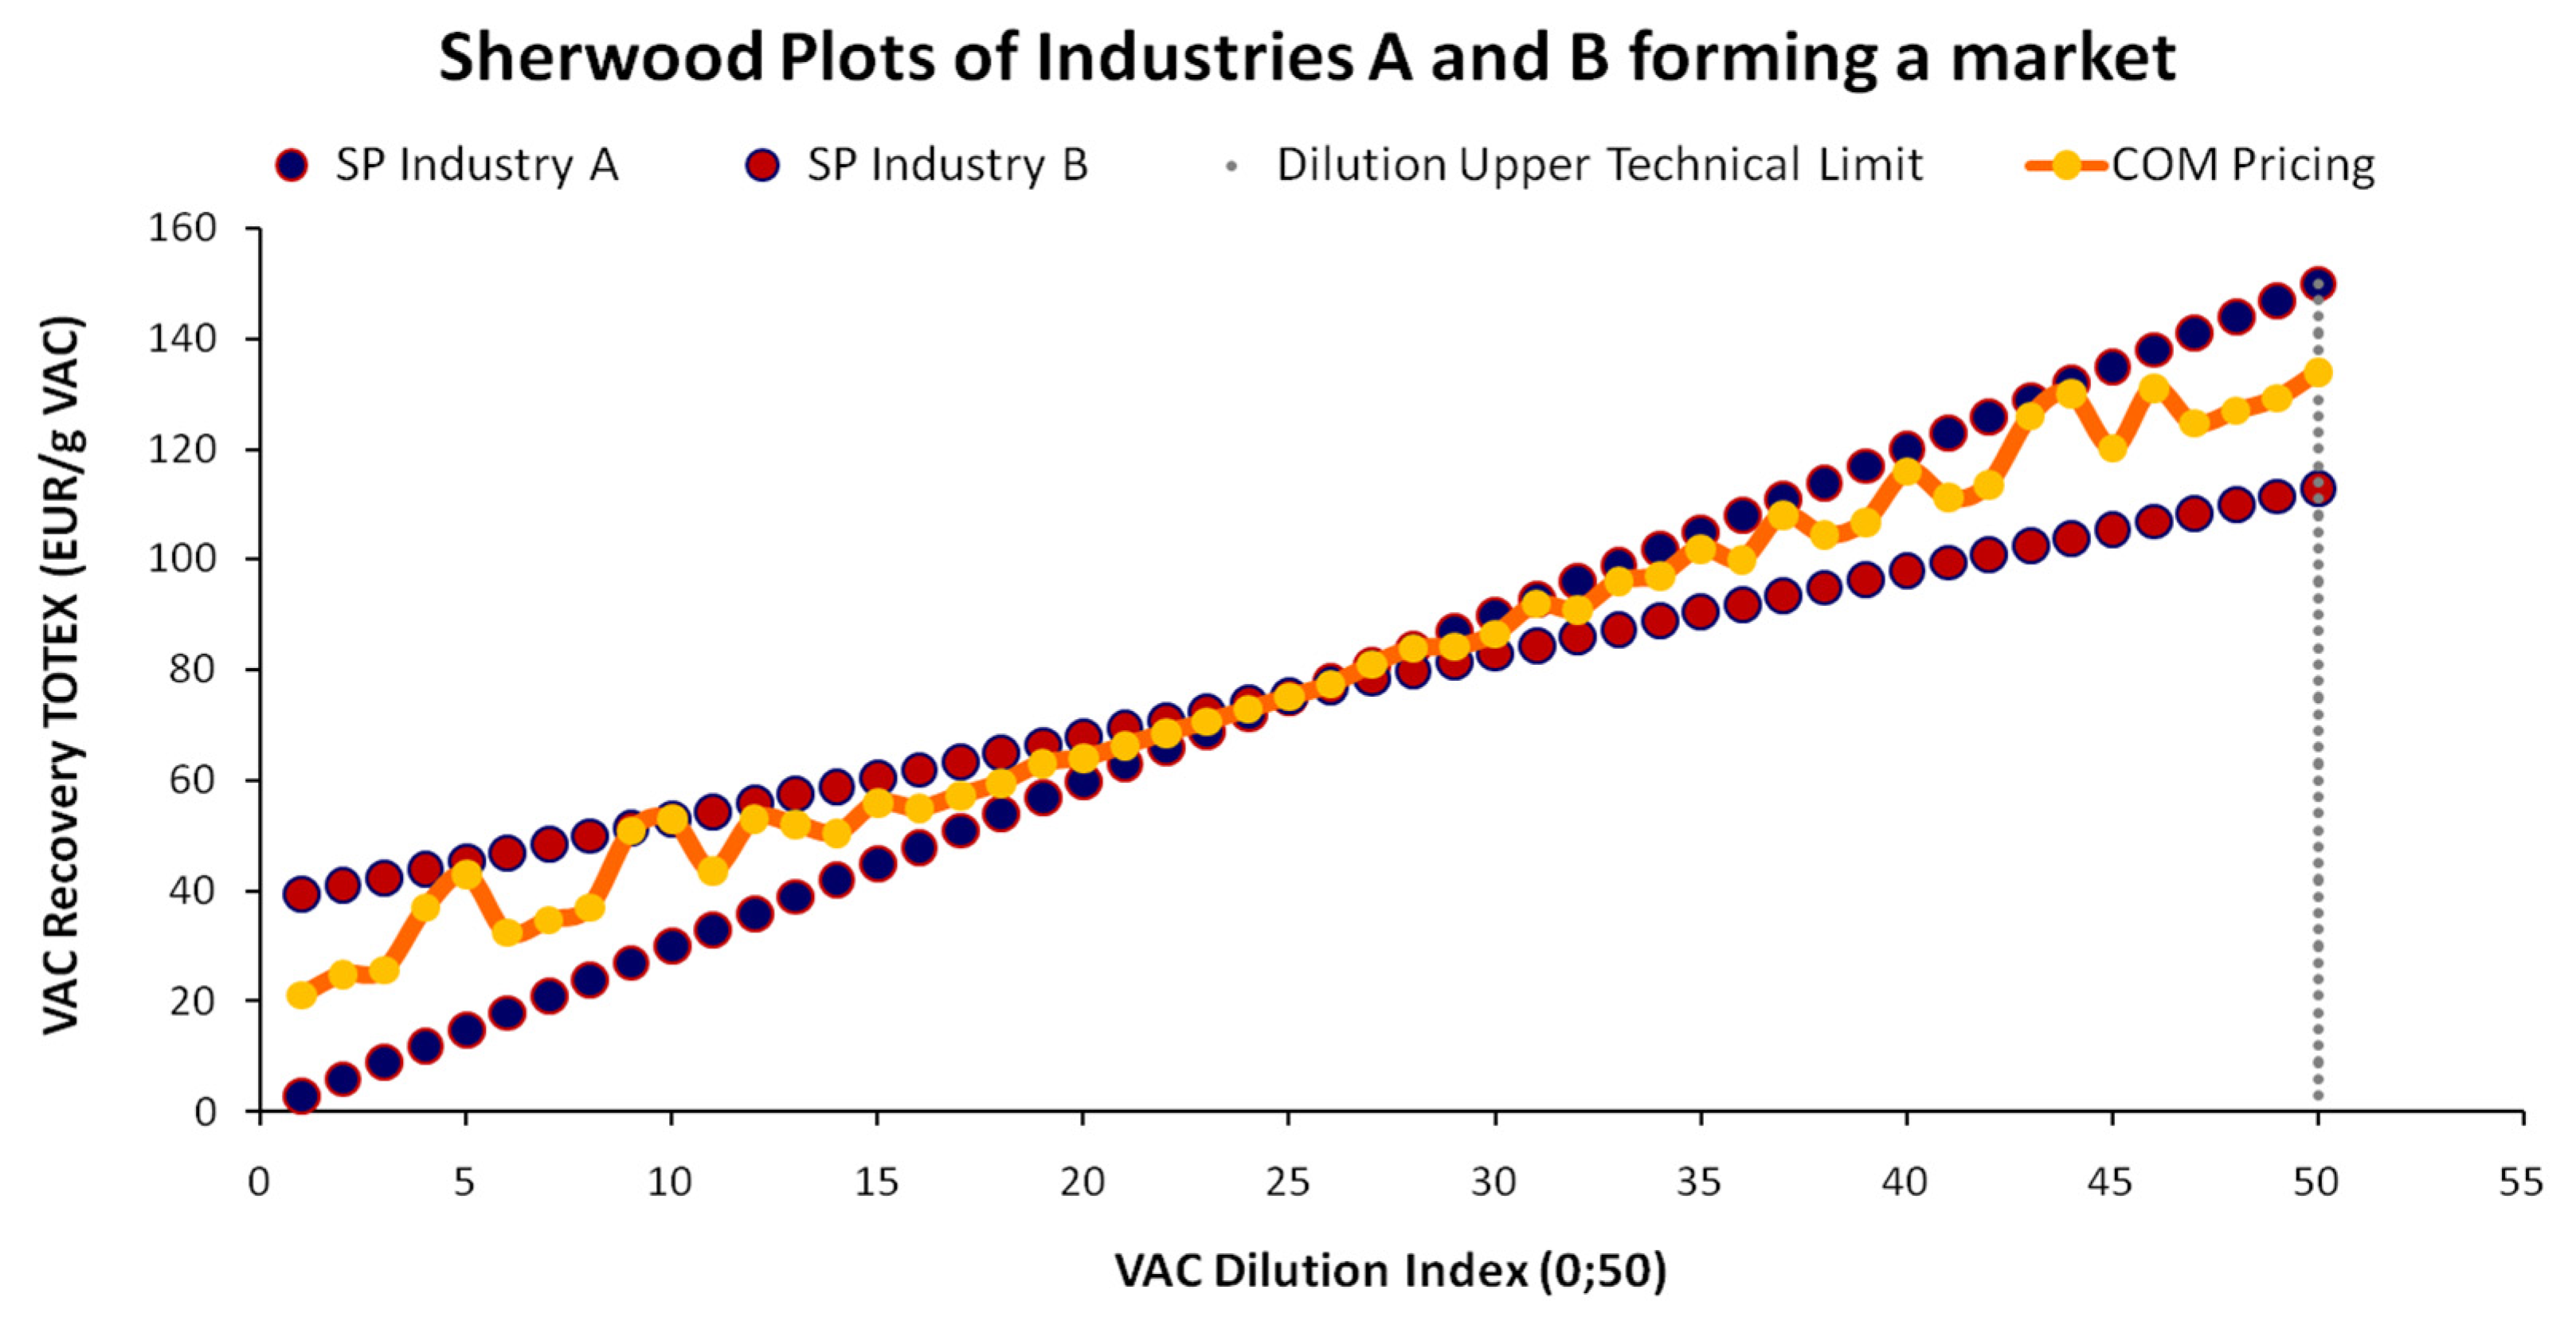
Finally, the third pricing model is essentially a combination of the MEAN and VAR pricing models. As presented in Figure 14, this model is the Composite or Premium (COM) model, as it aims at profit maximization via scalping strategies. Scalping essentially consists of maximizing the distance from the lower OPL bound and minimizing the distance from the OPL upper bound.
By composing the conditions of the MEAN and VAR pricing for the formation of a scalping strategy, the COM pricing of two industries signing a two-tier (intra-industry) ChL agreement for every VAC DI level is described by the following equation:
P C O M m i 1 | D I i = M a x P M E A N m i 1 | D I i ; P V A R m i 1 | D I i , D I i , t , P , m , D I , C R ; i Ν +
Equation (11) suggests that an industry will simply seek to price its services at each time step t at maximum value between the fixed and the variable pricing. This is generally an aggressive pricing policy (hence the title “premium”) and is usually adopted by industries that have a significant presence and level of dominance in the market (possibly being market leaders), either in terms of share or control. Such powerful industries remain unaffected by similar retaliating pricing tactics by their competitors as the percent impact on their revenue and profitability is lower by comparison. Although, all industries are assumed to be parts of an IS collective, a COM pricing behavior would not be a paradox, as it still allows the other industries to achieve positive profits, preserving the “win-win” scope of the IS cluster but significantly narrowing their profit margins. From the technical side, COM pricing is mainly adopted by industries with a large VAC processing capacity and high share of constant expenditures in the total cost, suggesting constant cost ontology [4]. With COM pricing, the industry partially compensates for periods with low operating (hence, high residual) capacity by charging its services with the MEAN model.

4. Discussion and Extensions

Following the structural SP and ChL models for resource recovery, we discuss three major extensions of our current work, as well as future research challenges: (1) the ongoing environmental finance paradigm shift backed by central banking authorities and the redefinition of IS clusters as environmental value hubs; (2) the general establishment of integrated environmental–economic accounting in compliance with the SEEA context [24,25] to reveal the true costs of virgin resource extraction, as well as the true value of resource recovery, aiming at increasing transparency to attract higher volumes of environmental finance investments; and (3) the selection of structural IS information entropy metrics (e.g., Shannon, Renyi, Tsalis, Kolmogorov) to standardize market concentration and collective performance as underlying indices for attracting investments in IS clusters.

4.1. Institutional Shifts and Circular Economy Finance (CEF)

The EU’s institutional transition towards the CE comprises an unprecedented legal shift and is also pivotal to CEF. CE markets within the EU are currently estimated to have a value between EUR 78.9 and 84.9 × 10⁹, deriving from various sectors [39]. The CE comprises one of the six pillars of the EU SFT [5] and expands to all economic sectors and all corporate sizes, from SMEs that form 98% of all EU businesses [40] to mid-caps and large corporations. The first major applications of the EU SFT concerned the finance of Renewable Energy Sources (RES) units, directly tethering the instruments’ yield to CO2 savings [41]. Specifically, in Greece, demand for issued RES bonds surpassed the supply by more than 4.5 times; in response to the initial request of EUR 150 × 106, EUR 684 × 106 was offered, with the 35% of the initial capital backed by the European Bank for Reconstruction and Development (EBRD) [42], continuing the first “green bond” issuance in Greece by one of the country’s four systemic banks [43]. Such environmental finance instruments expanded to large hydropower projects, with ESG profiling and reduction in CO2 emissions by 40% in relation to the benchmark value [44] as the underlying index. With the gradual accumulation of environmental finance know-how, such practices are now being rapidly adopted by other sectors, such as land development [45], where the certified environmental performance and adoption of environmental finance instruments comprise both a corporate environmental finance asset and proof of “best practices”. With the current EU energy shortages [46,47] and seeking of supply alternatives, the energy sector comprises an ideal “beach-head” market and “replication lighthouse” for industrial ecosystems. However, the still dominant share of financial organizations in such schemes indicates that private financial institutions still need time to restructure towards the large-scale deployment of CEF instruments.
The major obstacle for most commercial financial institutions in responding to the investment needs for CE upscaling is the lack of suitable underlying indices reflecting the environmental performance of their investments in monetary terms. Conventional financial instruments prove to be structurally insufficient to cope with both the needs of integrated economic–environmental accounting [24,25] for full cost–benefit assessment, as well with the particularities of IS clusters and their emerging synergistic business models [39]. However, the global financial and banking system is currently experiencing a top-down institutional paradigm shift towards the incorporation of monetized environmental costs and benefits by central banks as the highest levels of the financial regulation hierarchy.
Central banks are regulatory institutions that set the foundations of monetary compliance rules and monitor their abidance by commercial banks. The road to large-scale CEF adoption by commercial banks passes through its establishment by central banks, which will redefine the role of money with environmental content. For instance, the Bank of International Settlements (BIS), with its role as the “central bank of central banks”, has identified environmental and climate factors as determinants of the global financial system’s future stability [48]. It introduces the concept of the “Green Swan” event, in analogy to the “Black Swan” concept [49], highlighting the fundamental financial risks which can threaten the foundations of the financial architecture itself, which manifest where least expected. The European Central Bank (ECB) has recently issued a multi-level action plan for the period 2021–2024 for the introduction of environmental protection criteria to the banking system. Besides the purely macroeconomic stability aspects of environmental degradation (leading to natural capital loss), one of the most important identified goals is the incorporation of environmental risks in credit ratings for collateral and asset purchases [50]. In addition, the European Banking Authority (EBA) launched an EU-wide pilot exercise on ESG risks that included a proposal for the establishment of a Green Asset Ratio (GAR) under the EU SFT [51]. Practically, this context translates into a fundamental review of credit rating methodologies and an operational “game changer” in the financial sector, as, for the first time, the credit rating criteria for financial institutions are enriched and extend beyond liquidity and capital requirements.
Central banks have also begun to fundamentally reassess the role of money itself in the global economy; in some cases tethering it to natural resources of pivotal value, such as forests in the role of carbon sinks and metabolic networks [52]. In any case, monetary architectures start leaning towards more decentralized and local forms of financial organization, especially if respective business models and financial agreements combine the CE and ecosystems’ conservation. A vehicle for achieving consensus for global trade and corporate transactions that include environmental goods and services via the banking system is the reform of the Basel III and the introduction of the Basel IV regulatory frameworks [53], aiming at establishing environmental credit ratings that will affect the overall credit rating of a financial instrument’s recipient. Additionally, the “Green Swan” concept incorporates an operational utility, besides its epistemological value, as central banks provide themselves with a tool for quantifying the sources of financial risks and embodying environmental performance KPIs into their credit rating evaluations, which will attract the portfolios of commercial banks as well. In addition, for commercial banks, the EBA introduces ESG risk requirements along with GAR assessments, following the guidelines of the EU SFT. The roots of such unprecedented changes can be traced back to two decades ago (Stern Review on the Economics of Climate Change [54]).
With central banks as “gravitational monetary centers”, CEF and ecological finance engineering commercialization are currently steered by banking compliance authorities. In this context, ChL contracts are introduced as flexible Bilateral or Multilateral agreements with well-defined rules and performance criteria, filling the gap on resource recovery and ecosystem conservation performance KPIs. Thus, ChL engineering with such underlying indices would allow CE practices to release their full potential for industrial parks, increase the diversity of CF “species” and the tailoring options for financial organizations, and, at the same time, completely align with the EU Green Deal. In turn, CEF inventories applied successfully to a small number of counterparties could be engineered to upscale towards more complex structures, such as whole industrial parks that wish to issue debt by the principles of the EU Green Bond Standard (EU GBS) [5] for investments in infrastructures that maximize total energy and mass recovery.

4.2. Environmental Goods Accounting and Pricing

For the recovery of Polyphenols from the wastewater of olive oil mills, as the reference case of our model, for a range of dilutions between 10 and 500 mg/L, we observed a range of total recovery costs that was between EUR 522.53 and 10.78 [4]. This range was derived from an examination of 10 cost factors of the pilot unit, with constant costs ranging between EUR 0.290 and 0.347, with their share ranging from 2.7% for VAC concentrations at 500 mg/L to 0.06% for VAC concentrations at 10 mg/L. Although how the variability of the production factors’ costs affects the cost ontology of an industry has been thoroughly analyzed in other works [4,36,38], a crucial aspect related to the ongoing paradigm shift towards CEF is the monetization of environmental goods and services. In simple words, what is the size of monetized environmental cost savings from VAC recovery? How can these environmental savings be distributed in businesses and society fairly? In this context, corporate and national accounting is the corner stone for keeping a systematic and accurate record of diminishing virgin resource reserves and ecosystem capacities for pricing them properly according to the “scarcity signal” sent to both producers and consumers. In simple words, when the extraction of virgin resources becomes environmentally expensive, the market will resort to recovering resources from waste as an alternative. In addition, no economically meaningful or sufficient investments in resource recovery by financial institutions can take place unless resource prices have sent, in advance, a message for that need. In short, environmental accounting comprises a CEF prerequisite.
There are numerous methods one can utilize to account for natural resource scarcity; however, the need for unified environmental–economic accounting has been repeatedly substantiated to accurately depict total resource costs for corporate and national accounts [55,56,57,58,59,60]. In addition, such accounts should definitely depict a resource’s life cycle—from its extraction to its End of Life (EoL). To deal with the high heterogeneity (more than 400 methods) of Life Cycle Assessments (LCAs), the EU has began to establish the Product Environmental Footprint (PEF) as its major vehicle [61,62]. As a unified LCA method, the PEF is the major candidate in the EU-27 for accurately assessing environmental value chains. Environmental accounting has been a catalyst for the acceleration of the EU Green Deal and the EU SFT [63] as its main vehicle through the establishment of the EU GBS [5].
The SEEA constitutes a benchmark for environmental and resource efficiency performance and underlying indices for the tailoring of CEF instruments. The identification of the environmental costs and benefits of each product or service within a generally acceptable accounting framework would automatically provide financial institutions with the necessary information of corporate and national environmental credit profiles to achieve transparency and “green-washing” prevention. Specifically, for corporate environmental value chains, the Dow Jones Sustainability Index (DJSI) [64] is highly compatible with the SEEA. As the DJSI depicts environmental performance directly in relation to stock value, elements like participation in IS networks highlight the value of ChL as a highly flexible financial instrument.
A highly complementary and vital CEF aspect concerns the conservation of the value of ecosystem services. The combined effect of waste discharge and various uncontrolled effluents distorts the interlocked biogeochemical energy and mass sequences of ecosystems and degrades their ability to maintain their functions [65]. Hence, environmental pollution avoidance via VAC recovery, as presented in Figure 3 and Figure 4, offers economic value on its own. In the SEEA context, the Millennium Ecosystem Assessment (MEA), the Economics of Ecosystems and Biodiversity (TEEB), and the Common International Classification of Ecosystem Services (CICES), comprise the three main frameworks of ecosystem service classification and valuation, being used to estimate the environmental damage caused or saved if financed sustainability projects take place [66]. In line with the TEEB, as the most oriented towards valuation [67], indicative works on CEF for the conservation of continental and marine ecosystems have been published [68] for developed as well as developing countries [69]; with the latter lacking even basic financial services [70] but having an opportunity to build environmental finance foundations in their initial development steps.

4.3. Entropy and Industrial Symbiosis

The Galton Board used in Equations (5) and (6) comprises an econophysical approach of the resource recovery supply chain, opening up an interesting discussion on the microeconomics of IS clusters’ organization and market concentration. Although a thorough examination of this issue exceeds the scope of our work, we argue on a set of questions, such as the following: Which information entropy metrics could reveal the structural elements of an IS cluster? Can we observe a correlation between hierarchy in the IS cluster and VAC recovery efficiency, as many economists suggest? Do we observe clustering patterns (e.g., small world) favoring local against global optimizations that would signify high intra-industry competition? What industrial symbiosis cluster typologies could information entropy metrics reveal, and how do such patterns affect the decisions of financial institutions on whether an IS cluster is investable?
From our discussion so far, IS clusters are closed-loop complex networks with energy and material flow optimizations as objective functions. As information entropy metrics currently have very limited applications in IS networks, the research field still remains highly uncharted. In this context, we identify the following indicative research fields as the building blocks of our future work: (a) the application of information entropy metrics (such as Shannon, Renyi, Tsalis, Kolmogorov) as IS network topology identifiers and structural complexity; (b) the use of entropy metrics to identify small-world phenomena and multi-scale clustering; (c) the use of entropy metrics in non-parametric statistics as reliability tests in linear and nonlinear regression models (e.g., the SP) of energy and resource recovery; (d) the use of entropy metrics for assessing the bond between hierarchy and economies of scale; (e) the application of network regressions on the allocation of costs and benefits between the industries forming the IS cluster; and (f) a statistical mechanical framework of financial engineering (e.g., ChL) particularly for assessing the effect of the Sankey micro-structure on the profitability of financial agreements (see Appendix B for a related introduction).

5. Conclusions

The core argument of our work is that recovering resources from waste is essentially a form of unconventional mining, as mining principles are applied to waste streams. In addition, this view is conceptually consistent with the emerging terms of urban and sewer mining [36,38]. Just as the mining of virgin resources consists of a complex web of partnerships and legally binding agreements, similarly, the recovery of resources from waste matrices requires a similar set of checks and balances to maximize economic value and mitigate environmental pressures with reliability and transparency. In this context, we present the theoretical and quantitative foundations of ChL as tailored financial instruments for IS clusters focusing on resource recovery.
In the Materials and Methods section, we presented the SP as a general quantitative framework of resource recovery economics, examining the relation between a VAC’s dilution (as inverse concentration) in a waste matrix and its recovery cost as the benchmark approach. In this context, we have examined the microeconomic foundations of IS and the conditions that incentivize industries to participate in conglomerates. In turn, we introduced conceptually the Bilateral and Multilateral ChL contracts as the two main types of IS agreements, which involve at least two VAC recovery counterparties that aim at achieving multi-level corporate benefits (i.e., both individual and collective win–win collaborations). We applied the following principles in a simulation of the recovery of Polyphenols (fulfilling the role of the VAC) from wastewater.
In the Results section, we described the complete stochastic architecture of ChL assignments. Specifically, we provided a step-by-step analysis of how wastewater packages containing the VAC arrive at the cluster. Wastewater packages arrive randomly and can theoretically be described by any continuous statistical distribution based on the wastewater’s properties (e.g., symmetric, asymmetric, or short- or long-tailed), which take on an economic meaning. The critical variable upon the arrival of wastewater packages at the entry point of the IS cluster is the customer’s knowledge on which industry is most cost-effective at recovering a VAC at each dilution level. Hence, we make the distinction between complete and incomplete information (following the terminology in the economic literature). As the case of incomplete information requires additional intra-industry rearrangements, we model this state via the Binomial and the Hypergeometric distributions for flows with and without replacement. Via intra-industry (or two-tier) ChL agreements, the VAC recovery costs are minimized via industrial synergies with mutual profits, suggesting a Pareto Optimization (win–win transaction). In turn, we develop a ChL pricing typology with three pricing models fit to different industry profiles, examining how payoffs tend to be allocated between the cluster’s industries.
Finally, in the Discussion and Extensions section, we investigated three pivotal future aspects of our work. The first one is the ongoing restructuring of the international and EU financial architecture via the incorporation of underlying indices for environmental performance as investment prerequisites and the redefinition of IS clusters as special-purpose economic hubs of natural capital conservation. The second aspect concerns the universal application of integrated economic accounting; while the third aspect identifies our critical future research focus on the application of information entropy metrics on IS clusters and their utilization as part of financial institutions’ investment decision-making process.

Author Contributions

Conceptualization, analytical framework, methodology, formal analysis, and writing, G.K.; visualization, G.K.; revising and refining the manuscript, G.K. and C.M.; supervision and funding acquisition, C.M. All authors have read and agreed to the published version of the manuscript.

Funding

The research leading to these results received funding from the European Union’s Horizon 2020 under grant agreement no 869318, for the research project ULTIMATE “Industry water-Utility Symbiosis for a Smarter Water society”. The research and its conclusions reflect only the views of the authors, and the European Union is not liable for any use that may be made of the information contained herein.

Data Availability Statement

All raw data used are mentioned in the References. The simulated data used for the models’ construction will be provided by the authors upon request.

Acknowledgments

The support, help, and internal reviewing of ULTIMATE project partners, the anonymous reviewers and the MDPI Resources Editorial Team are highly appreciated.

Conflicts of Interest

Author Georgios Karakatsanis (corresponding author) was employed by the company EVOTROPIA Ecological Finance Architectures Private Company. The remaining authors declare that the research was conducted in the absence of any commercial or financial relationships that could be construed as a potential conflict of interest.

Appendix A. ChL Contracts for Full and Partial VAC Recovery

As stated in Table 1, industries engaging in ChL contracts aim at delivering the VAC at the optimal concentration (i.e., not too high, not too low). Although, for simplicity, we assume 100% VAC concentration at recovery; for numerous reasons, customers may require that the recovered VAC concentrations remain below 100%. Below, we develop four special cases of full and partial VAC recovery with incomplete information.

Appendix A.1. Full VAC Recovery

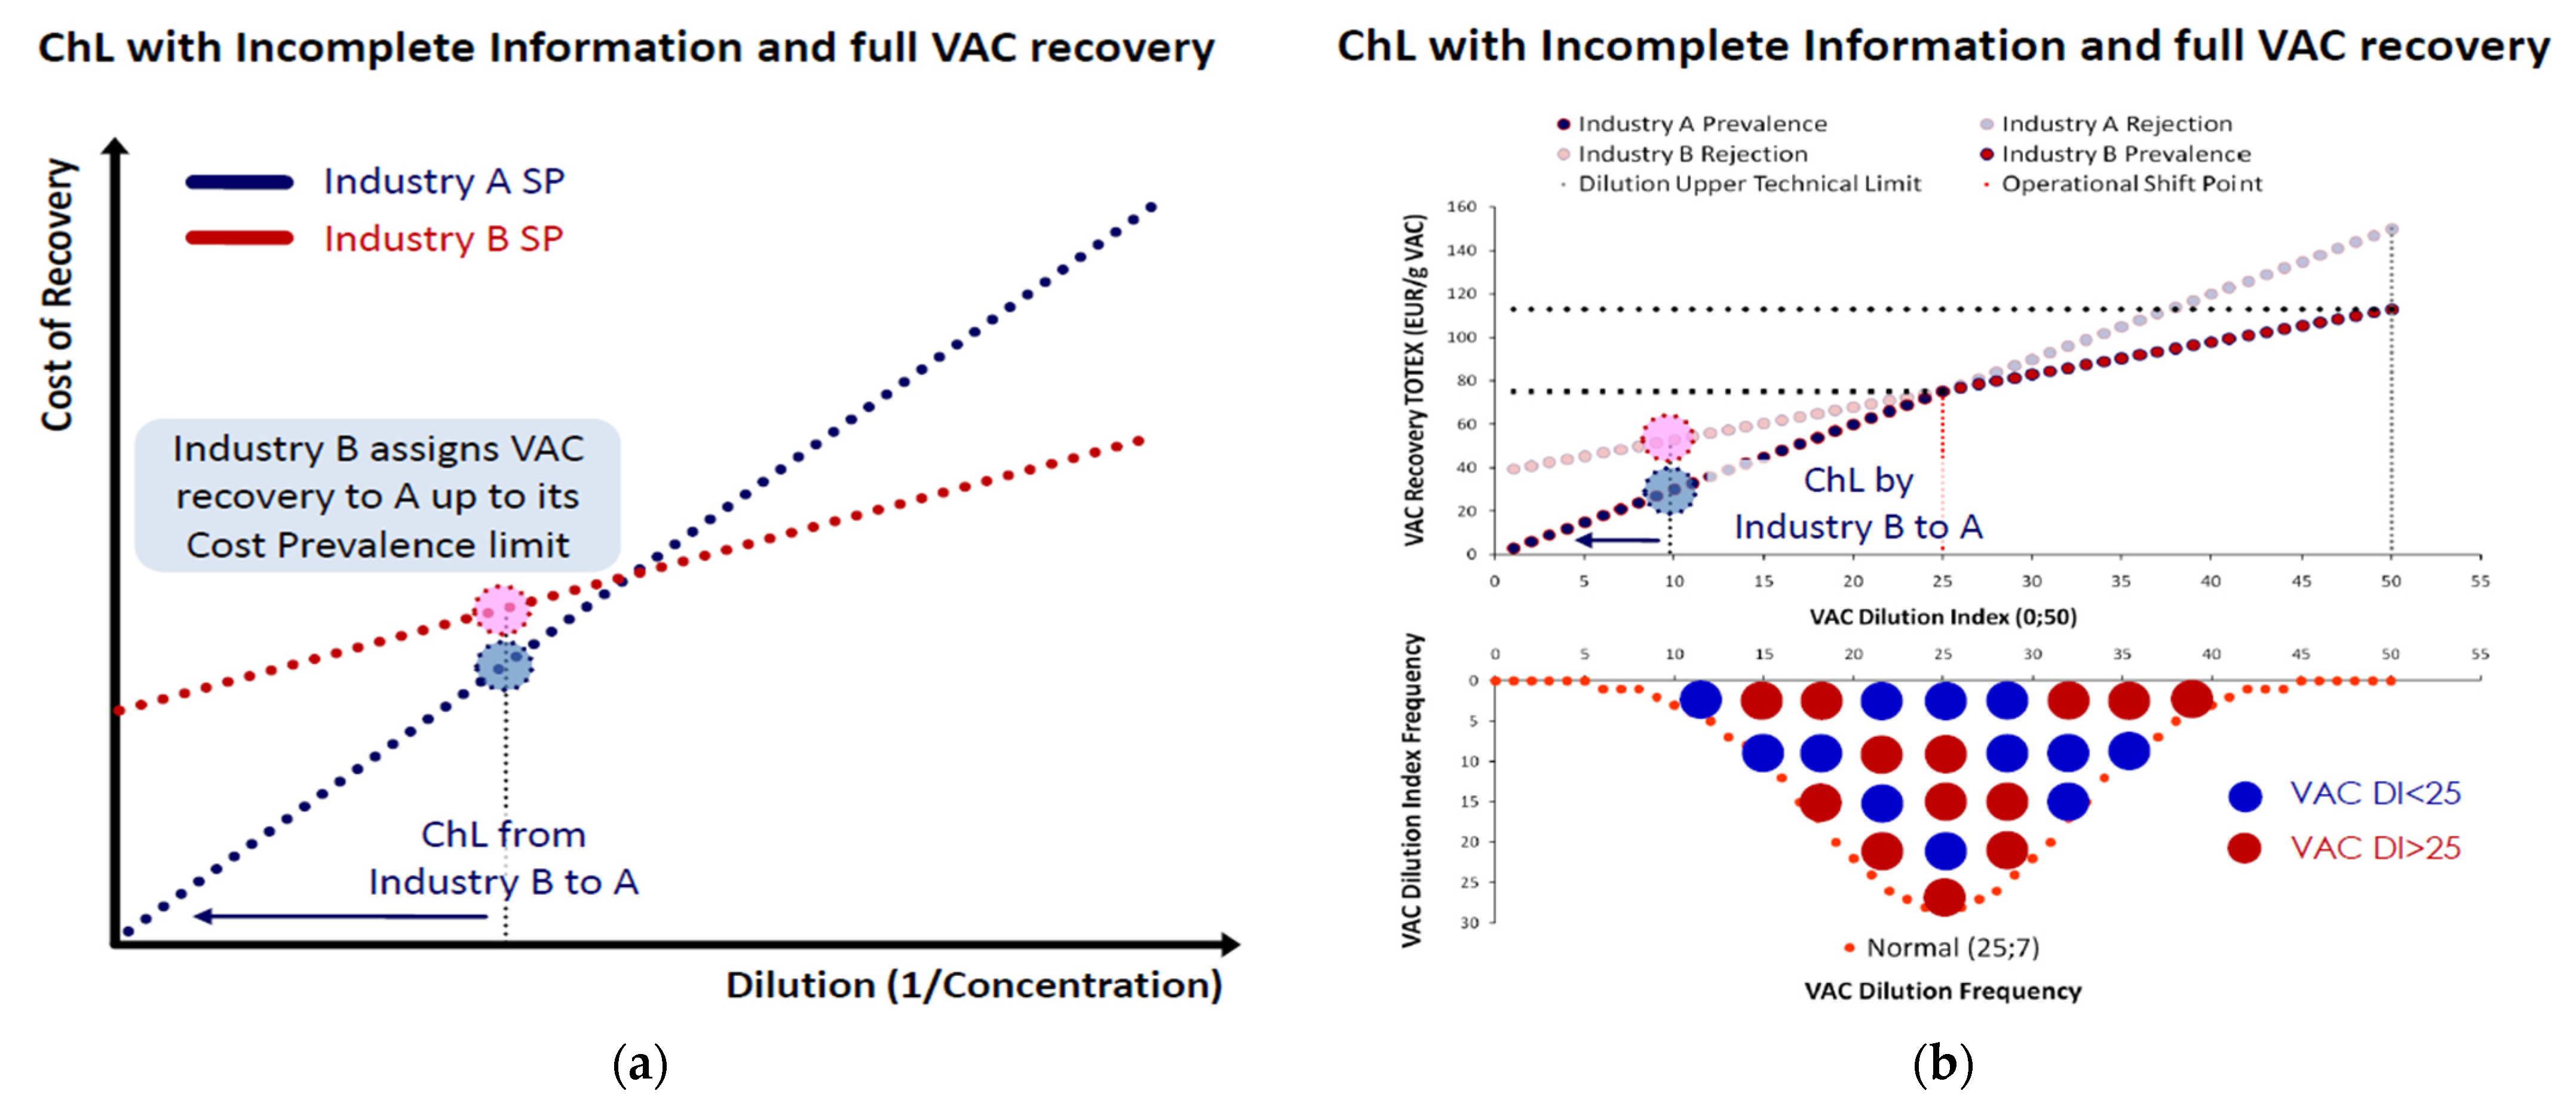
As shown in the basic version of Section 3.2.2, assigned wastewater packages outside an industry’s cost-prevalence are outsourced up to the VAC DI, where it again acquires the cost advantage, as presented in Figure A1 and Figure A2.
Figure A1. Schematic depiction of full VAC recovery: (a) the intra-industry ChL contract sequence without shift; (b) the optimal re-allocation from a scrambled arrivals’ distribution.
Resources 13 00065 g0a1
In Figure A1, the most simple case without ChL shifting suggests that when Industry B identifies an assigned package with VAC DI∈(0,25), it will outsource the VAC’s recovery to Industry A as cost-prevalent in this range. In turn, Industry A will return the VAC at 100% concentration (full recovery) to Industry B, which will deliver it to the customer.
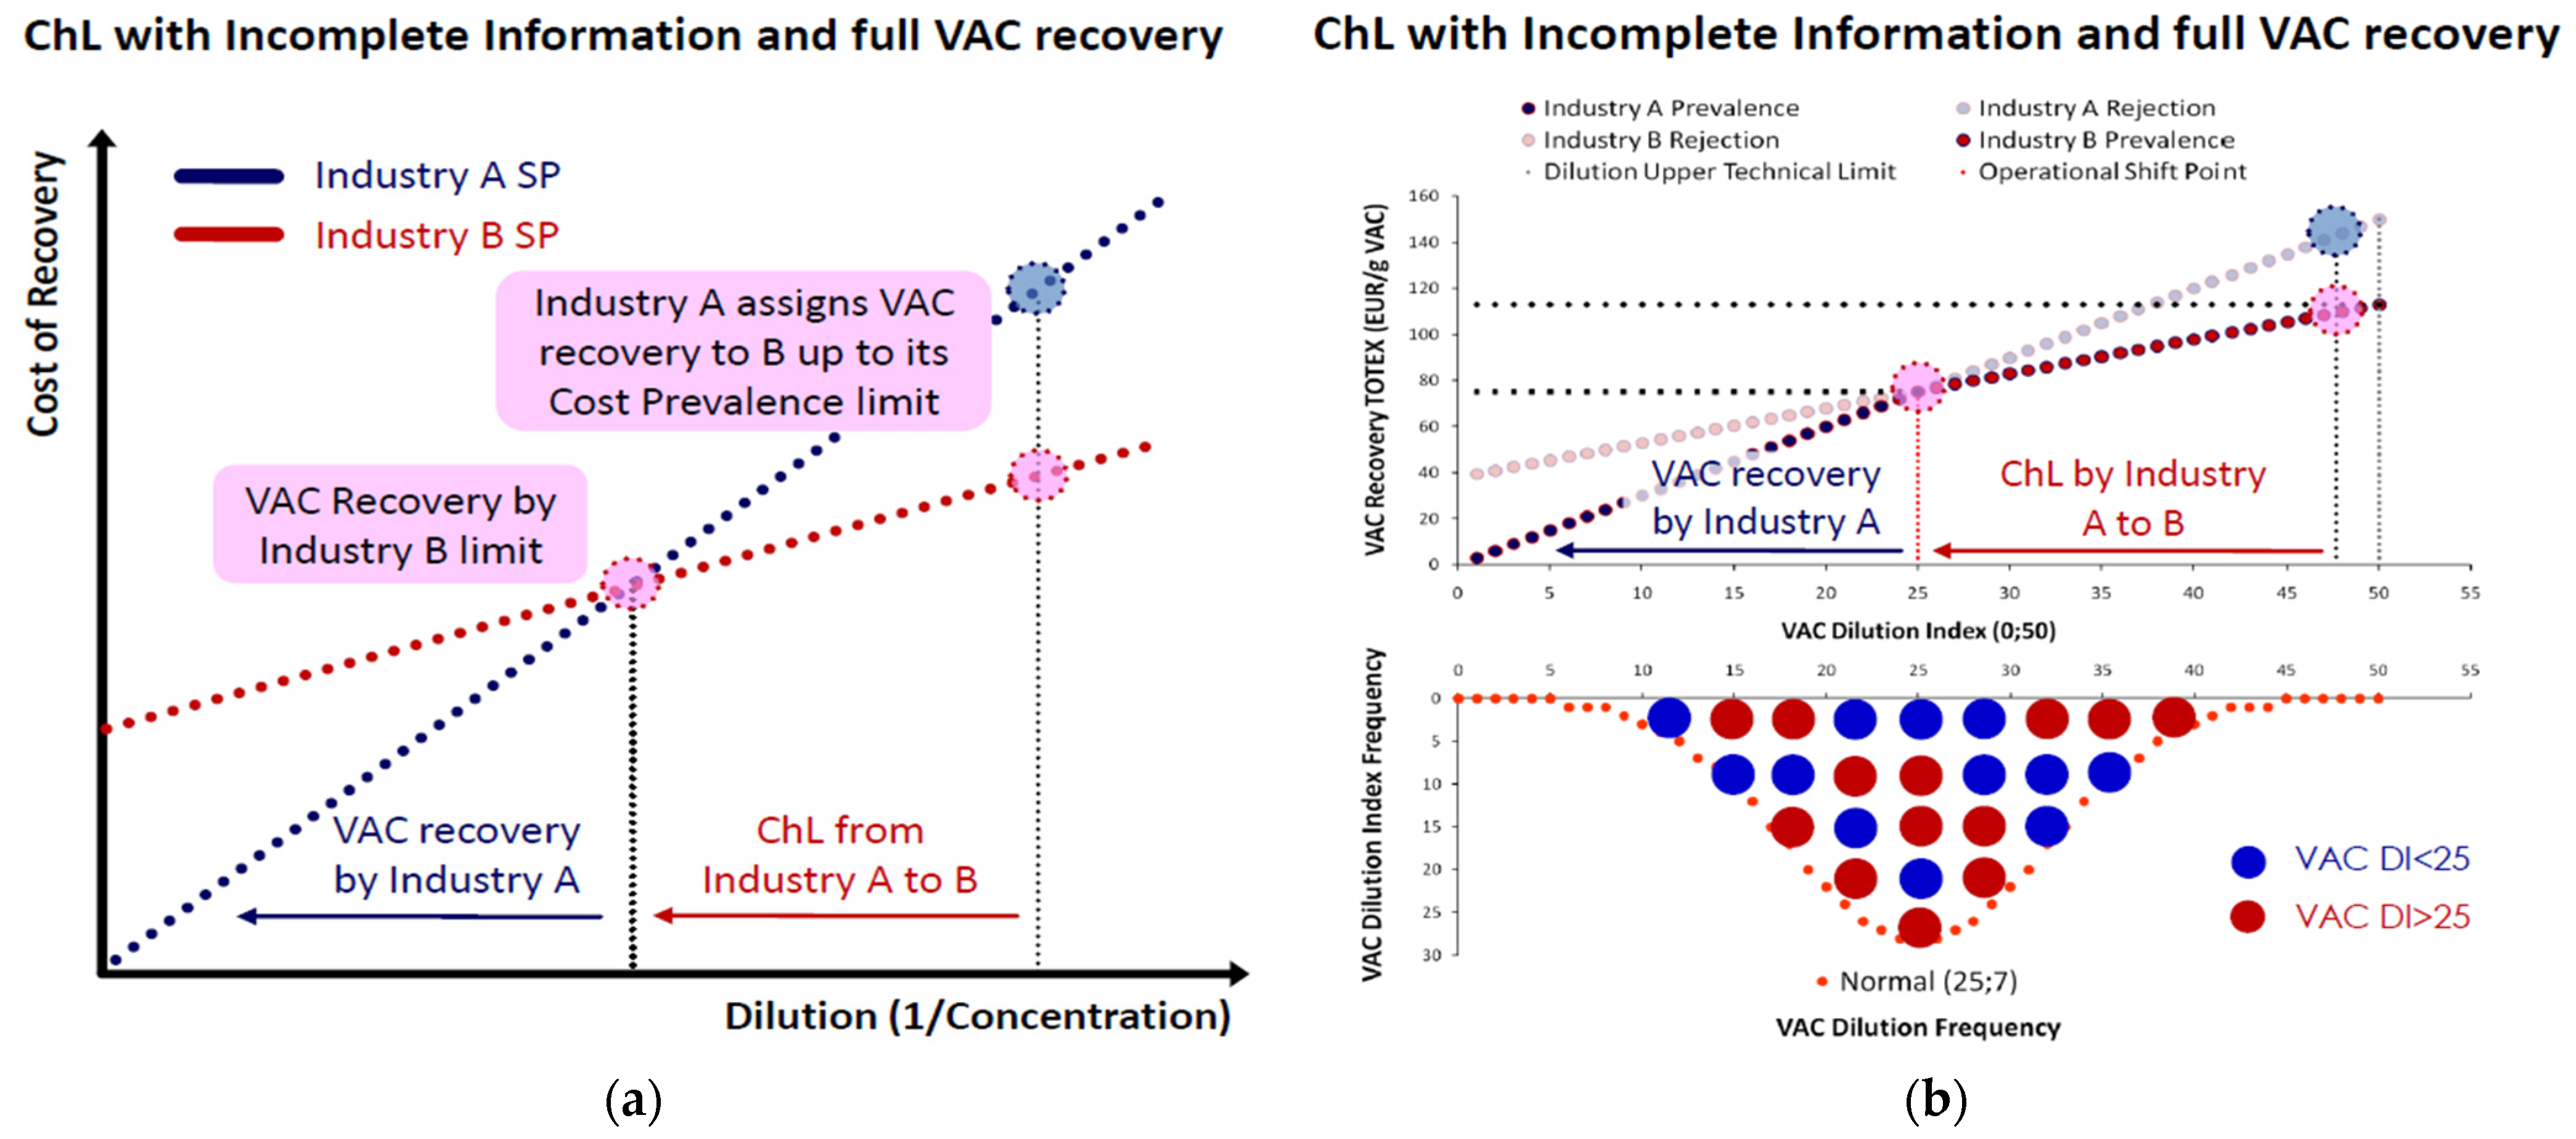
Figure A2. Schematic depiction of full VAC recovery: (a) the intra-industry ChL contract sequence with shift; (b) the optimal re-allocation from a scrambled arrivals’ distribution.
Resources 13 00065 g0a2
In Figure A2, ChL shifting suggests that as Industry A identifies an assigned package with VAC DI∈(25,50), it will outsource the VAC’s recovery to Industry B up to the transition point DI = 25. From there, it continues the recovery in-house up to DI = 0.

Appendix A.2. Partial VAC Recovery

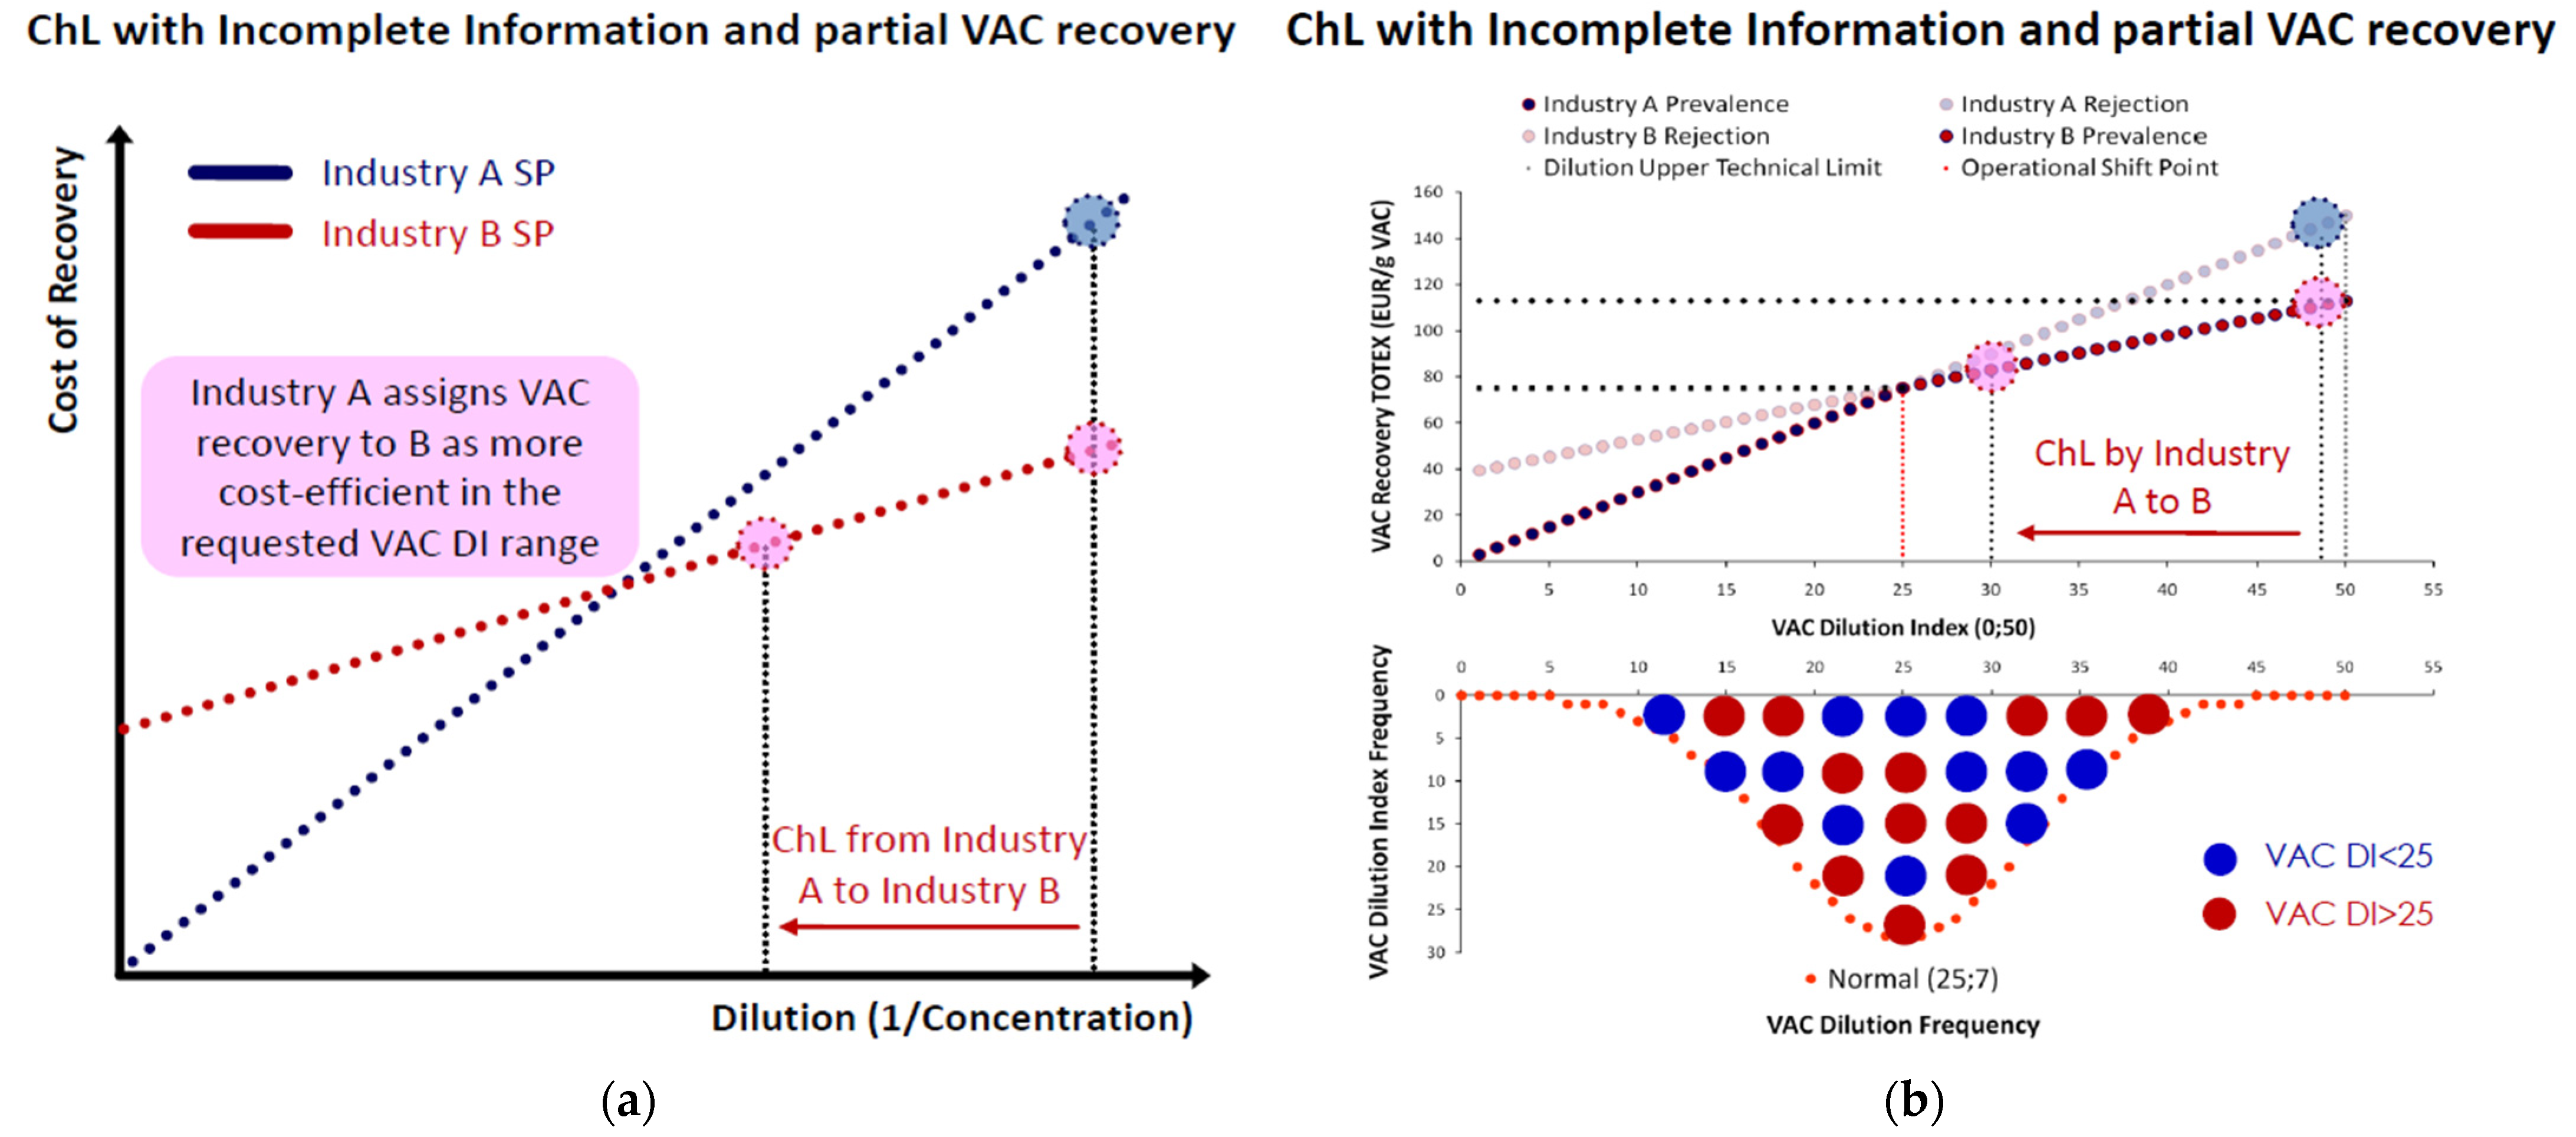
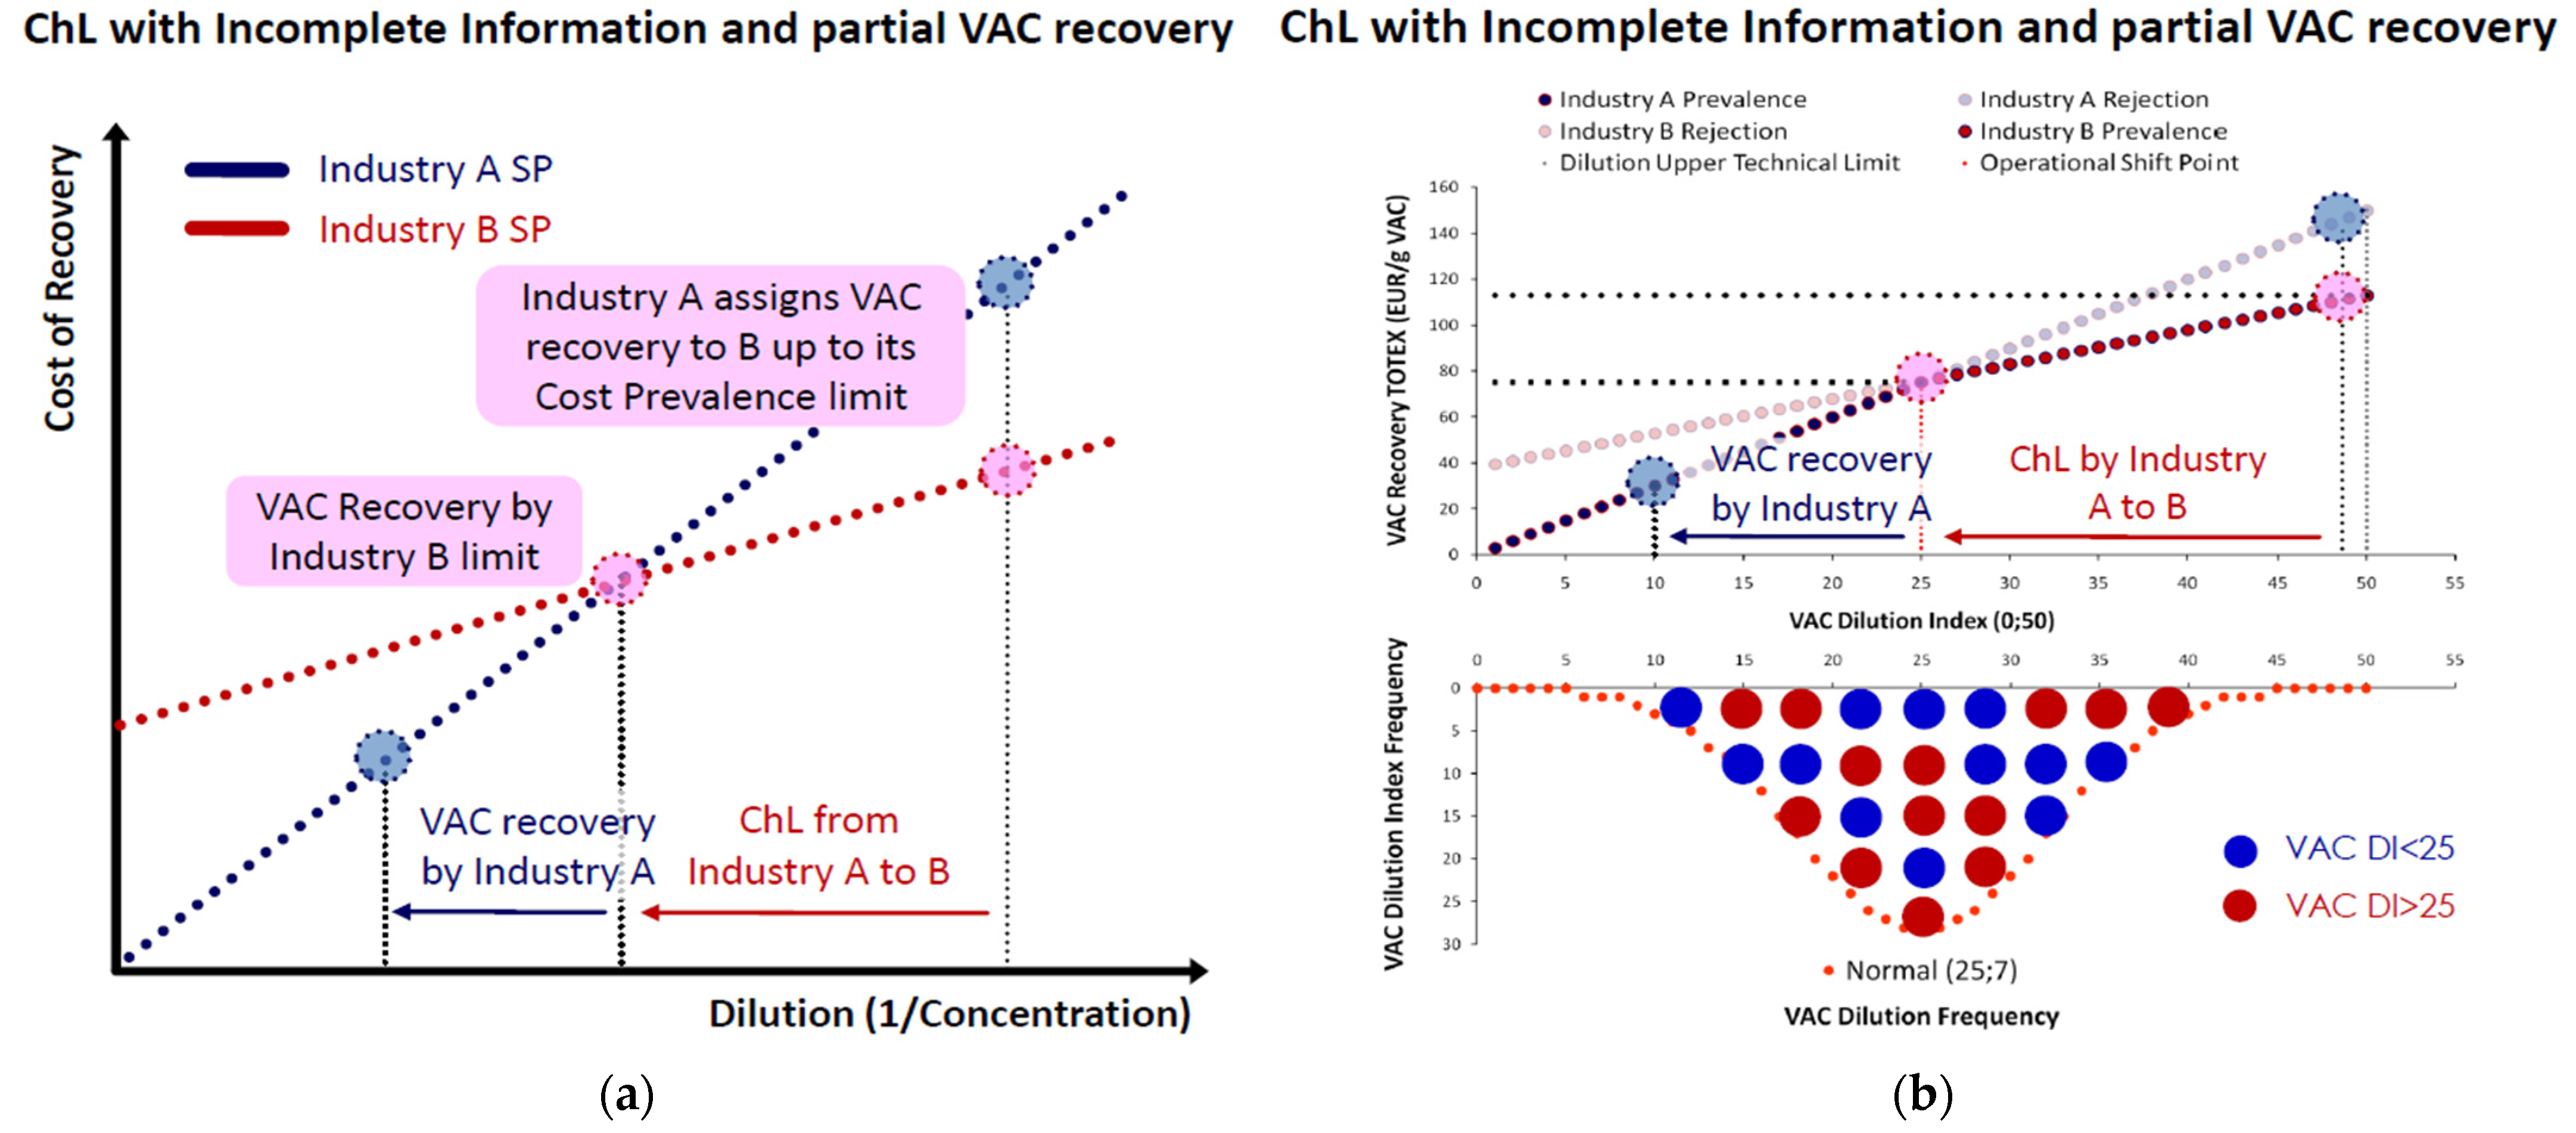
In partial VAC recovery the requested VAC concentration is below 100%. Similarly to Figure A1, Figure A3 presents the case of partial recovery without shift.
Figure A3. Schematic depiction of partial VAC recovery: (a) the intra-industry ChL contract sequence without shift; (b) the optimal re-allocation from a scrambled arrivals’ distribution.
Resources 13 00065 g0a3
Following on from the more complex case of full VAC recovery in Figure A2, Figure A4 presents the case of partial recovery with shift. In this case, we may identify more clearly the possibility of unequal distribution of ChL revenues, as from the total range of requested recovery (e.g., an increase of concentration from 10% to 60%), the highest part could be leased, and only a small fraction could be recovered in-house.
Figure A4. Schematic depiction of partial VAC recovery: (a) the intra-industry ChL contract sequence with shift; (b) the optimal re-allocation from a scrambled arrivals’ distribution.
Resources 13 00065 g0a4
Specifically, regarding Figure A4, we conclude that even if the operational prevalence ranges are equally distributed, the ChL revenues depend on the equilibrium of VAC DI arrivals and deliveries. Except for that aspect, the ChL contract rules are the same as for full recovery. In our example we also assumed a Kullback–Leibler Divergence (DKL) metric equal to zero (DKL = 0), essentially suggesting a fully competitive market (without concentration). As we have also assumed a symmetric Normal distribution with a Mean DI = 25, the wastewater packages are equally distributed at their arrival so that the expected net profitability from two-tier ChL contracts for full VAC recovery is zero. For partial VAC recovery, there is a theoretical probability of asymmetric profitability from two-tier ChL contracts depending on the relation between the distribution of VAC DI arrivals and VAC DI deliveries. This is an issue discussed in Appendix B.2.

Appendix B. Industrial Symbiosis Markets and ChL Micro-Structural Modeling

SP-based ChL contracts fit to a variety of eco-efficiency performance metrics, with the dilution–cost relationship as the underlying index. With resource recovery and ecosystem services’ markets being established in the EU, along with newly identified ChL target groups, the various eco-industrial parks under formation are to be guided towards strategic steps for leveraging CEF instruments. The Basel IV [53] framework on banking compliance comprises a beacon for eco-industrial parks so that massive investments are directed towards establishing environmental infrastructure for recovering a wide range of VAC species.

Appendix B.1. ChL and Industrial Symbiosis Markets

The EU adopted the new Circular Economy Action Plan (CEAP) [71] as part of a series of legislative proposals on energy efficiency, including heat recovery by industrial ecosystems, within the “Fit for 55” package, focused on reducing net GHG emissions by at least 55% by 2030 [72]. These market shifts towards the standardization of environmental performance in mainstream banking practice signify the remarkable progress since the Rio Earth Summit (1992), which established Agenda 21 via carbon trading systems, along with the United Nations Environmental Program’s Financial Initiative (UNEP FI) Principles of Responsible Banking (PRB) [73]. The current challenge is to establish IS markets for a new generation of ChL instruments to back a wide range of recovered VAC species.
As argued in Section 4.2, IS clusters are special scope business conglomerates aiming at natural capital conservation, either via the prevention of virgin resource extraction or pollution prevention and the conservation of the value of ecosystem services [52,66]. In addition to pricing, the depletion of global natural capital, further classified into thermodynamically finite forms [26,27,54,58,60,66] that are transformed into economic goods, has triggered a debate on how such empirical evidence should be translated in mainstream business practice.
As conventional market tools were inadequate to support such a business, the EU is establishing lifecycle analysis methods [61,62] for a wide range of products and services to depict the whole life value-added from resource recovery. Indeed, it is empirically verified that the benefits from resource recovery were not contained only in the direct and visible savings from increased efficiency, but extended in the embodied savings from international trade of water-intensive products, such as agricultural commodities [74,75]. The standardization and imprint of such measured outcomes in corporate and national accounting is expected to restructure patterns and trade networks in terms of comparative advantages, should the pricing of environmental goods be adopted as a universal corporate and national practice. Specifically for IS clusters that are assigned with large volumes of short-lived biodegradable VACs with high sensitivity and low tolerance levels against climate exposure (e.g., biomass energy), ChL schemes become significantly more complex with the utilization of weather derivatives [76] as instruments for hedging operational costs that are coupled to geophysical risks.

Appendix B.2. VAC Supply and Demand Micro-Structure

In this section, we more thoroughly examine the allocation of profits from two-tier ChL agreements deriving from the relation between the distribution of VAC DI arrivals and the distribution of (requested) VAC DI deliveries. Although Figure 5 includes the VAC DI normalization process, providing a macroscopic view of VAC DI arrivals and deliveries distributions, it provides no information on their microscopic formation structure. Specifically, considering the VAC DI levels of the arrivals’ distribution, it is important to consider which VAC DI level in the deliveries’ distribution receives the most assignments, as well as the Sankey structure of the two distributions. These indicative technical issues contain significant economic meaning for policy measures as the properties of these two distributions are identifiers of the relation between the VAC DI inputs and outputs. Below, we present a basic typology of the micro-structure of a range of simulated distributions and their graphical depictions.

Appendix B.2.1. Constrained VAC Recovery
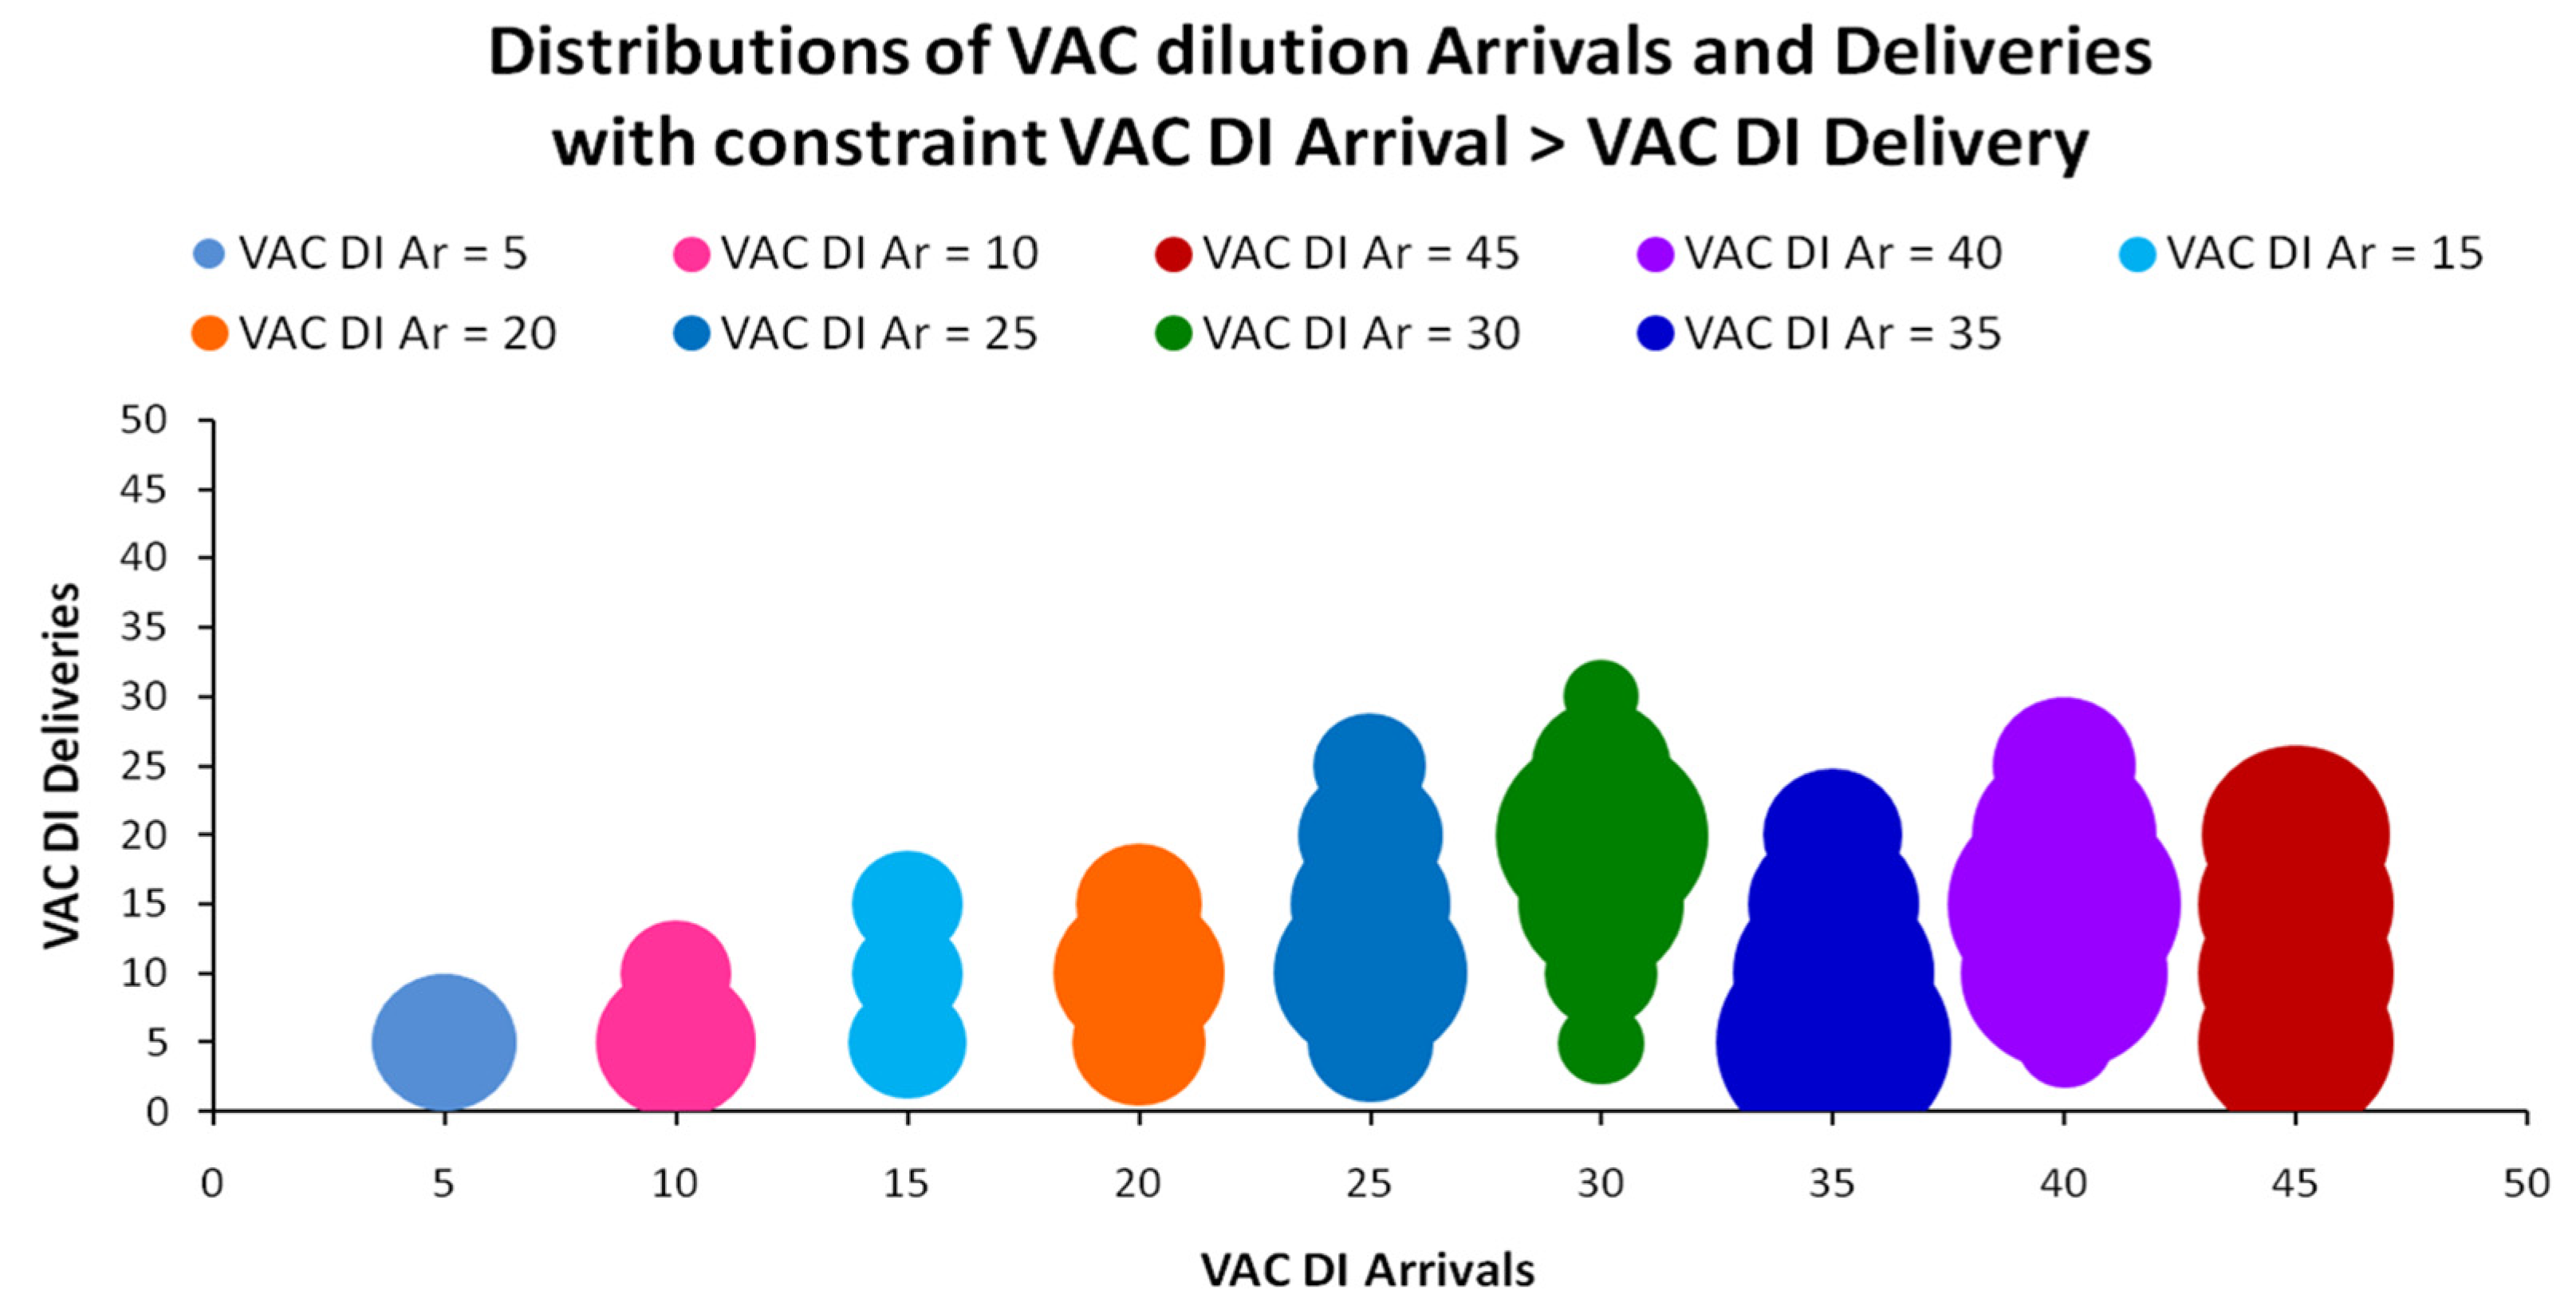
The first type of Sankey micro-structure of the arrivals’ and deliveries’ distributions is under the constraint where each arriving VAC must be delivered at least at the same DI (DIARDIDEL), which means that each VAC amount should be delivered at higher concentration than it was initially assigned. The economic meaning behind this constraint is that the VAC is very likely to have high market value as a final good that, across the recovery process, needs to be upgraded towards maximum purity (concentration). From a market perspective, if the arrivals’ distribution tends to be asymmetric towards higher DI values, a significant potential for ChL on full VAC recovery with shift may exist, as in Figure A2. A numerical simulation of the constrained micro-structure is presented in Figure A5 below.
Figure A5. Numerical depiction of the constrained Sankey structure of VAC arrivals and deliveries with nine indicative distribution shapes.
Resources 13 00065 g0a5
Figure A5 depicts a numerical application on how a positive exponential distribution of arrivals (the frequency increases with the increase in the DI) can turn into a symmetric Normal distribution, as in Figure 5, for N = 500 wastewater packages containing the VAC. This Sankey micro-structure is constrained by the condition DIARDIDELDI, meaning that the VAC contained in each arriving package cannot be delivered at a higher DI value than the one it was received. In Figure A5, the size of the circles’ surface shows at which VAC DI we observe the highest frequencies of arrivals, as well as which DI values of the deliveries’ distribution they populate most.

Appendix B.2.2. Unconstrained VAC Recovery
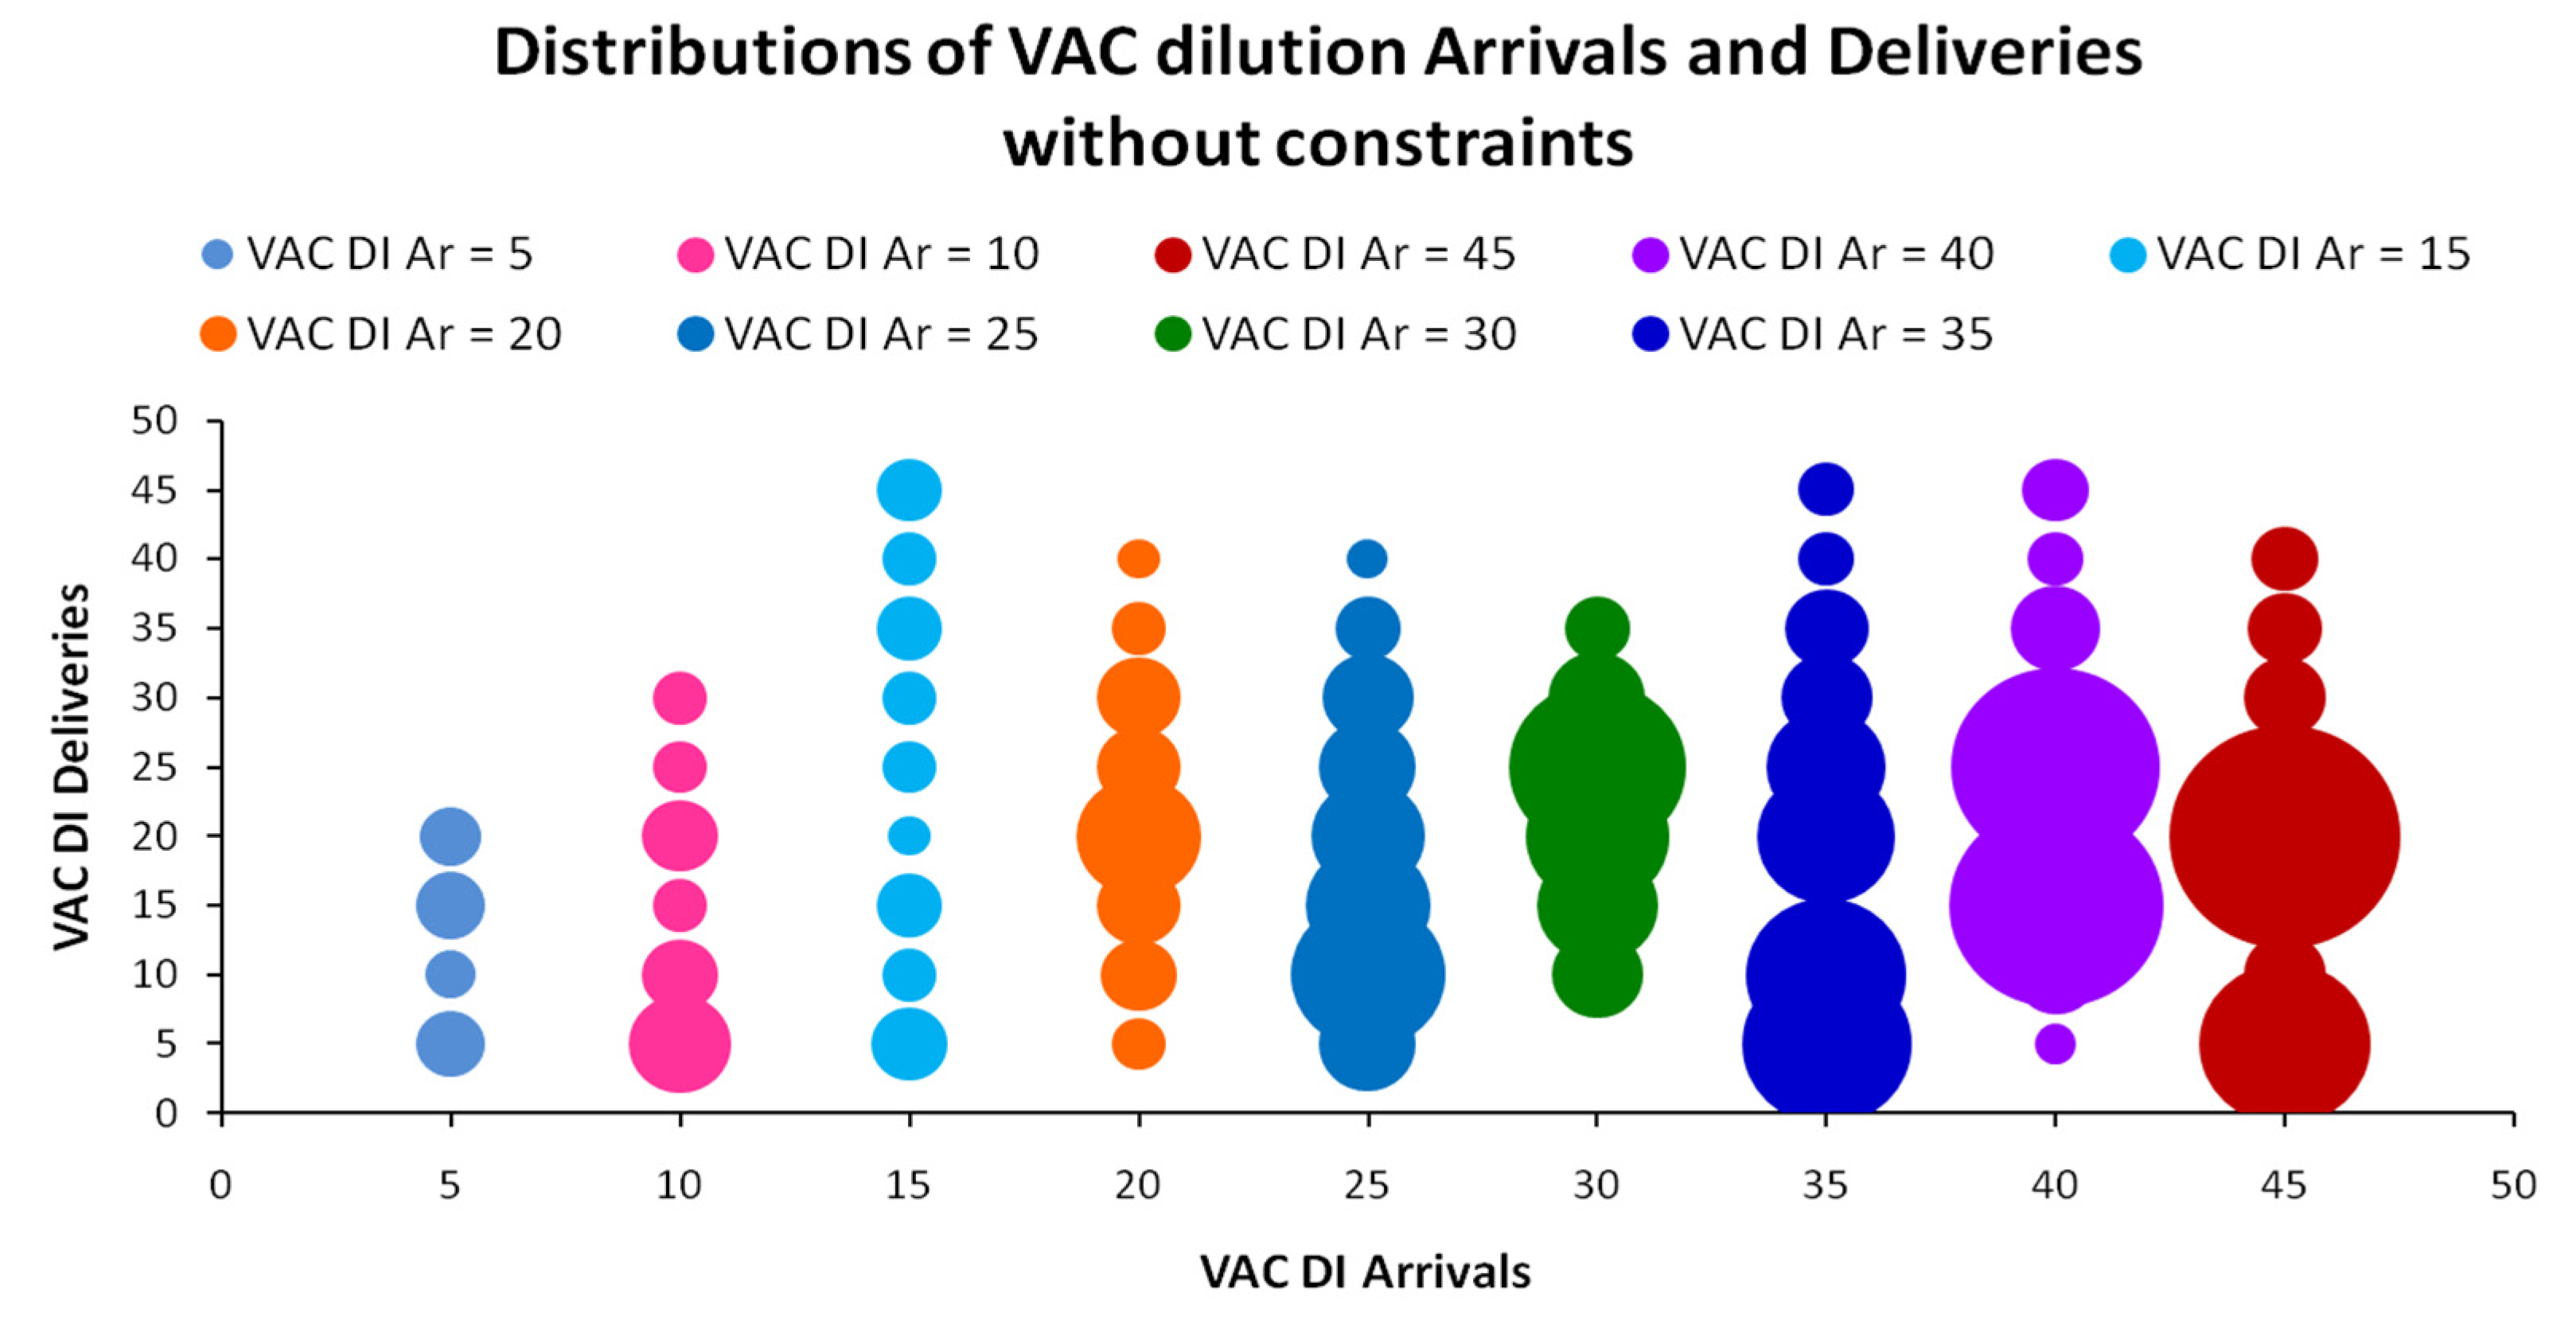
The second type of Sankey micro-structure of the arrivals’ and deliveries’ distributions is unconstrained, and each arriving VAC can be delivered at any DI, irrespective of its initial state. In such a case, each VAC amount could be delivered either at higher or lower concentration than it was initially assigned. Our numerical simulations show how a positive exponential distribution of arrivals turns into a positively skewed Normal distribution of deliveries for N = 500 wastewater packages containing the VAC. In contrast to Figure A5, the industry can change the VAC’s initial DI in each arriving package to any other DI at delivery. This unconstrained micro-structure allows for bidirectional DI changes, meaning that even wastewater packages with VACs at very high concentrations can be further diluted. As argued in Appendix B.3 this case can generate a high complexity and optimization potential via direct exchanges that are ruled by more elaborate ChL agreements, such as Chemical Swaps (ChS).
The economic meaning behind the unconstrained recovery is that the VAC is likely to have high market value as an intermediate good that, across the recovery process, embodies utility as part of a variety of compounds and at a wider range of concentrations. Market wise, for the unconstrained recovery case under incomplete information, the most economic way to deliver the VACs would be to re-allocate the packages between industries so that the sum of squared errors between VAC DI arrivals and deliveries are minimized. As a typical example we may consider that statistically, it is highly probable that a VAC to be delivered at high dilution by Industry B could be already possessed by Industry A and vice versa. So, instead taking the cost to dilute a VAC at high concentration, Industry B could just seek the VAC from Industry A and agree on an exchange. This optimization target would comprise, by itself, an intra-industry incentive for building quick sampling infrastructure at the entry point of the IS cluster to re-allocate, from the beginning the packages being sent to the industries according to their cost-prevalence ranges. A numerical simulation of unconstrained VAC recovery is presented in Figure A6 below.
Figure A6. Numerical depiction of the unconstrained Sankey structure of VAC arrivals and deliveries with nine indicative distribution shapes.
Resources 13 00065 g0a6
From the above, it can be understood that ChL profitability highly depends on the existence of a constraint that reduces a distribution’s spread (information entropy), which is visualized as a higher concentration of values around the mean. The general equation of ChL profitability W for any VAC i processed and recovered by an industry j for any DI d (in ascending order from lowest to highest) is as follows:
W m i j 1 = D I i d | d = 0 n P m i 1 | D I i d I P m i 1 | D I i d O , W , m , d , C R ; i , j Ν +
Equation (A1) suggests that an industry’s profits from ChL agreements are the net sum of VAC recovery inputs (I) (assignments from other industries) and VAC recovery outputs (O) (assignments to other industries) irrespective of the adopted pricing model (MEAN, VAR, COM). From a market perspective, we could argue that constrained VAC recovery provides industries that are cost-prevalent at low DIs with an advantage, as the high demand for VACs at high concentrations (low dilutions) secures them a minimum number of both one-tier and two-tier (full recovery with shift) ChL contracts.

Appendix B.3. Multiple VAC Recovery and Chemical Swaps (Ch.S.)
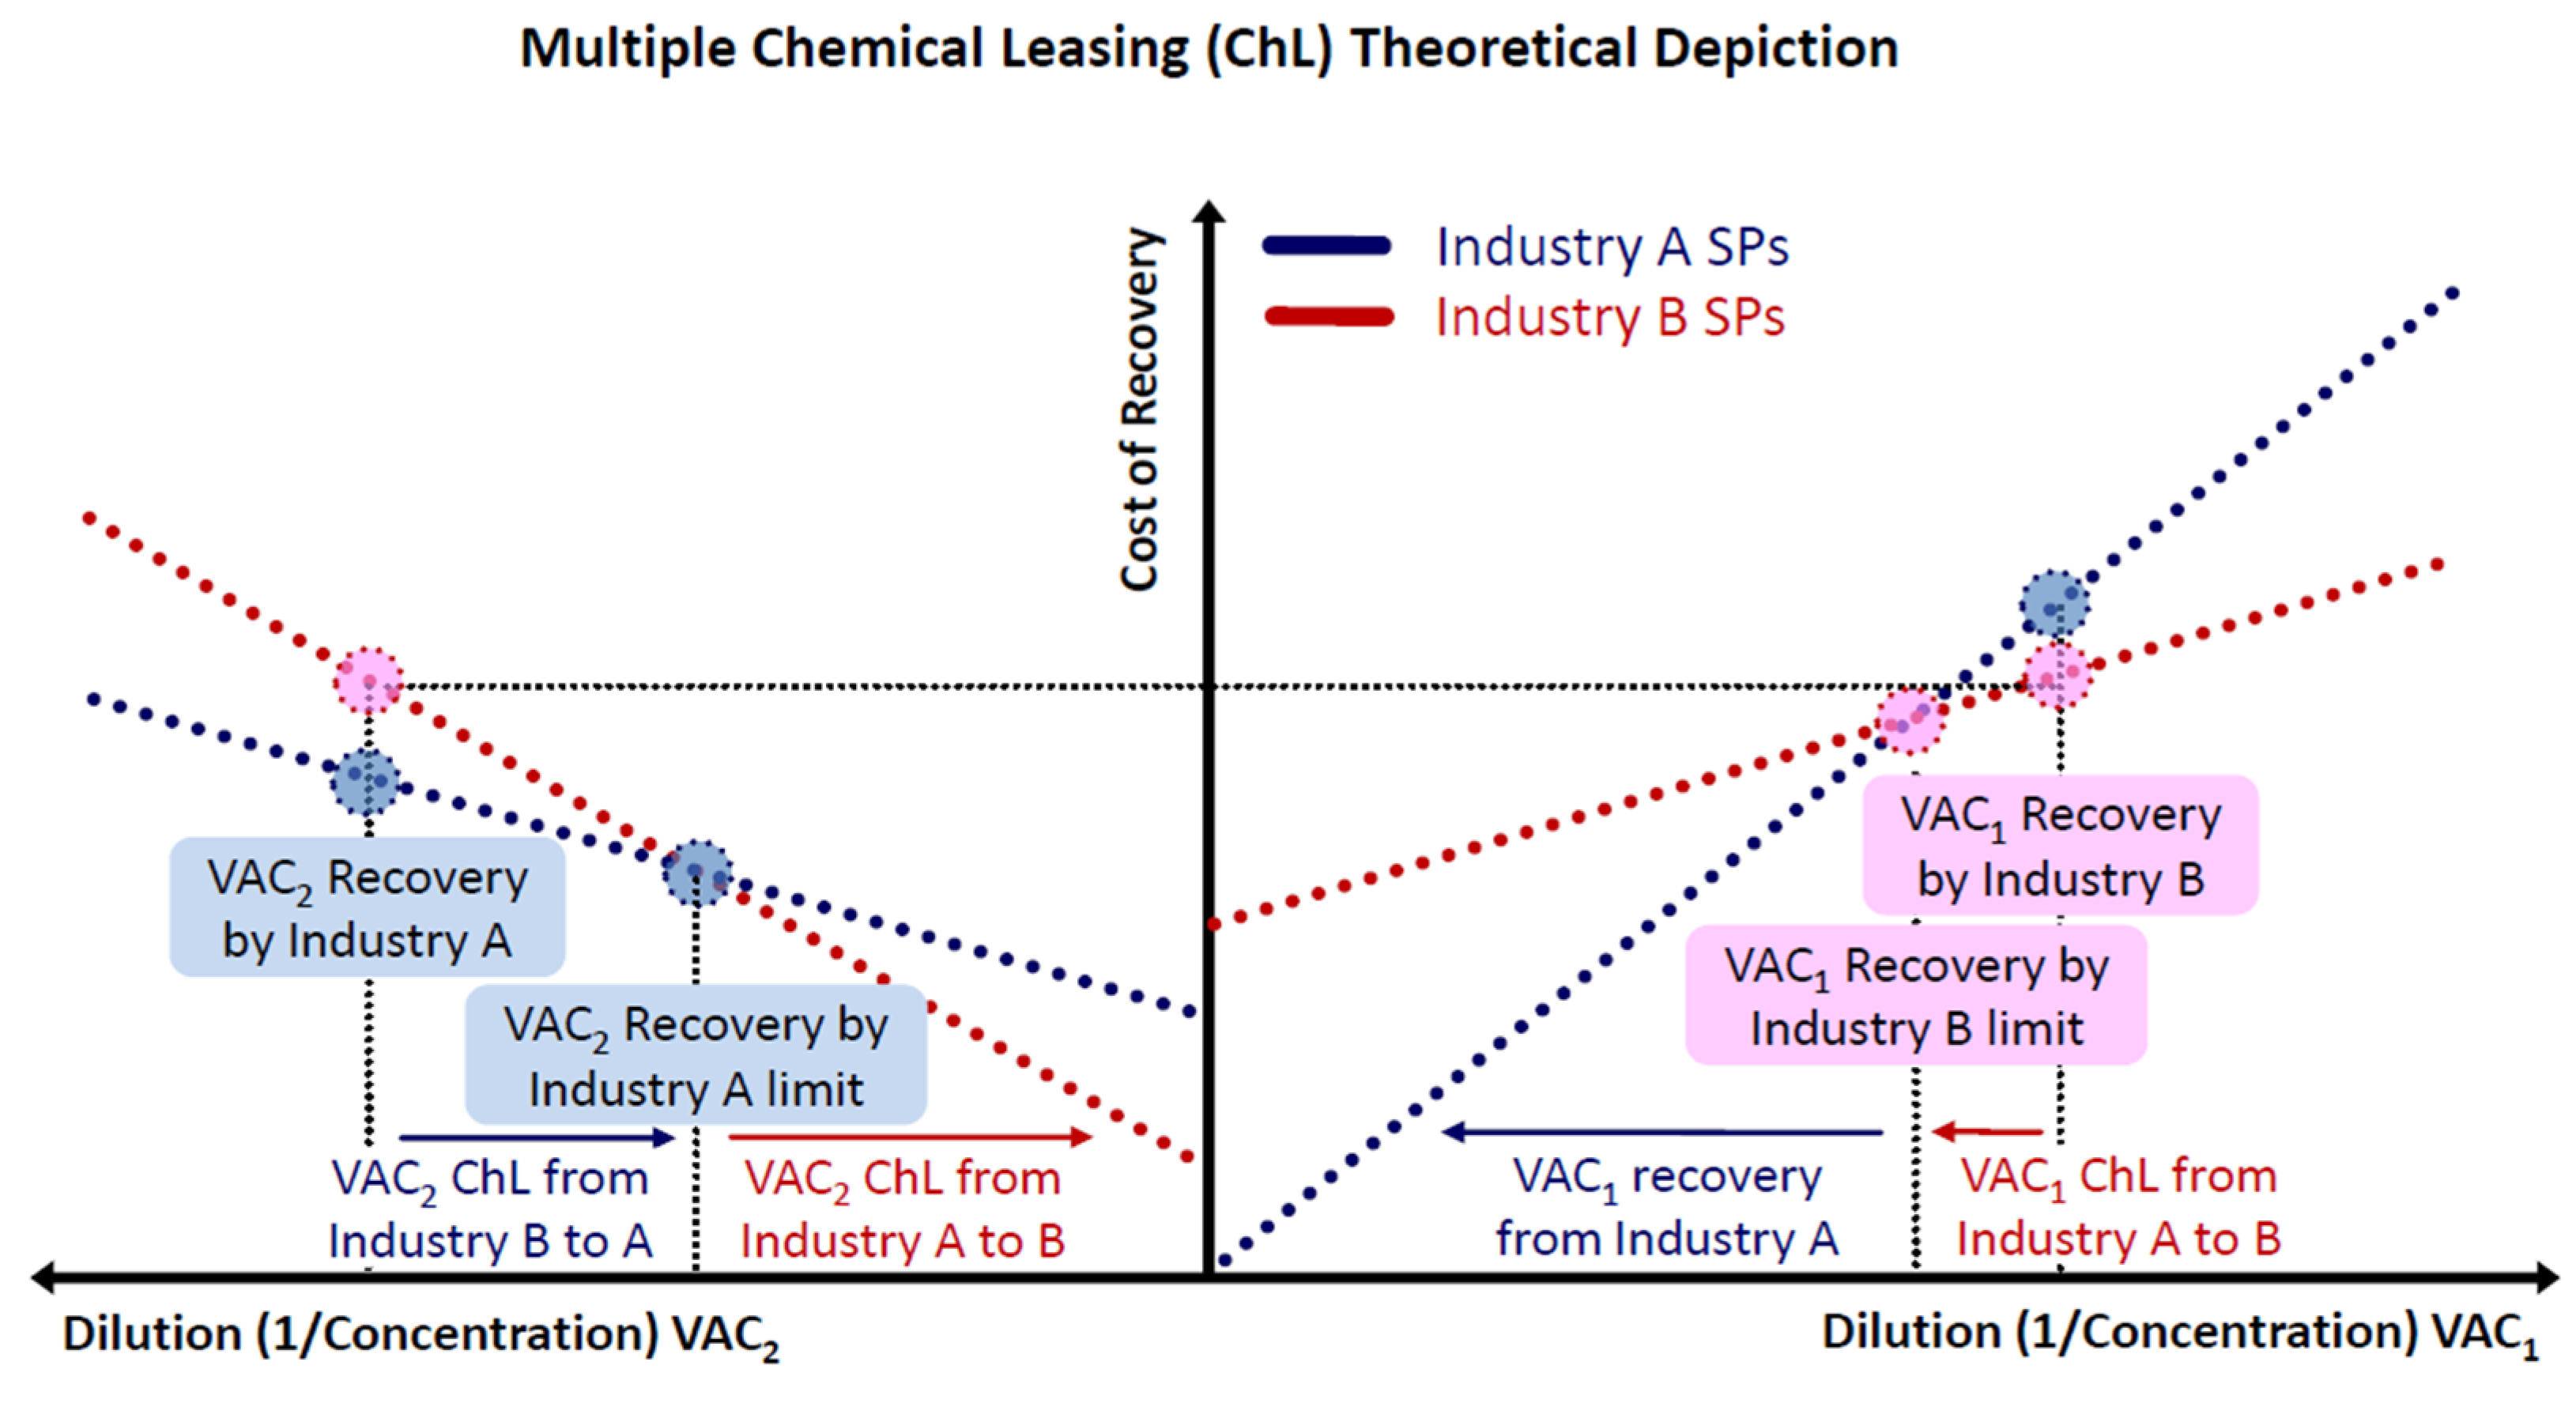
Having examined the rationale, theoretical foundations, operational flexibility, and the pricing variety of ChL contracts for two industries with a focus on the mutual recovery of a single VAC, we may provide a basic view on how the mechanics of multiple-VAC recovery (with at least two different VACs) become increasingly complex. The complexity of a two-tier ChL agreement increases with the addition of just one VAC (excluding purified water, as it is assumed to be a coupled residual of the VAC’s concentration increase process). The case of multiple-VAC recovery introduces Chemical Swapping (Ch.S.) as a special ChL branch that is widely expected to occur for two or more VACs (i ≥ 2). As noted in Appendix B.2.2, ChS agreements are most likely to take place in unconstrained Sankey structures. However, even for unconstrained Sankey structures not all SP patterns satisfy the conditions for ChS; however, their full identification and typology exceeds the scope of this work and will be addressed in a future one. A theoretical depiction of the process of multiple ChL contracts with ChS for two VACs is shown in Figure A7.
Figure A7. Theoretical depiction of coupled recovery with ChL for two VACs and water recovery. At the initial state (right part) of a compound consisting of two VACs under recovery, where Industry A assigns VAC1 to Industry B with shift, after which the shifting point returns to Industry A for full recovery without shift. Across the recovery of VAC1 by Industry B until the shifting point, a residual is produced, containing VAC2. According to the industries’ SPs on VAC2 (left part), Industry B assigns its recovery to Industry A with shift. After the transition point, VAC2 returns to Industry B for full recovery without shift. The final products are two VACs at 100% concentration (DI = 0) and residual water. This case introduces Chemical Swapping (ChS) as a special branch of ChL.
Resources 13 00065 g0a7
In any case, ChS is further verification of the microeconomic theory of trade, as, essentially, each industry borrows the SP of the other to achieve global VAC recovery optimization. If the complexity of ChL agreements increases with a limited number of recovered VACs, as empirical cases also suggest [77], one can assume that for a large number of VAC recoveries, it would skyrocket. Operationally, such a level of complexity with limited resources would require significant R&D inputs [78] to restructure process engineering sequences and attach necessary physical infrastructure (e.g., real-time sensors, sorting systems, flow networks, and information platforms to register all generated ChL/ChS contracts). Additionally, ChS can be identified even in the most common ChL cases, such as the incomplete information case shown in Figure 11. As, according to the Binomial distribution, it is statistically expected that the number of assignments from Industry A to Industry B will be asymptotically equal to the number of assignments from Industry B to Industry A, they essentially engage in a ChS agreement. For more than one VAC (i ≥ 2) and extensive ChS, there exists a sequence of VAC recovery events that defines the IS cluster’s overall resource recovery performance in terms of cost optimization and sustainability [79].

References

  1. European Investment Bank (EIB). EIB Group: Climate Bank Roadmap 2021–2025; European Investment Bank: Luxembourg, 2020; ISBN 978-92-861-4908-5. [Google Scholar] [CrossRef]
  2. Mont, O.; Singhal, O.; Fadeeva, Z. Chemical Management Services in Sweden and Europe: Lessons for the Future. J. Ind. Ecol. 2006, 10, 279–292. [Google Scholar] [CrossRef]
  3. United Nations Industrial Development Organization (UNIDO). Chemical Leasing in Practice: About the Model. Available online: https://chemicalleasing.com/chemical-leasing-in-practice/ (accessed on 5 March 2024).
  4. Karakatsanis, G.; Makropoulos, C. Resource Recovery and the Sherwood Plot. Entropy 2023, 25, 4. [Google Scholar] [CrossRef] [PubMed]
  5. EU Technical Expert Group (TEG) on Sustainable Finance. EU Green Bond Standard Usability Guide. 2020. Available online: https://ec.europa.eu/info/files/200309-sustainable-finance-teg-green-bond-standard-usability-guide_en (accessed on 5 March 2024).
  6. Sherwood, T.K.; Woertz, B.B. Mass Transfer between Phases. Ind. Eng. Chem. 1939, 31, 1034–1041. [Google Scholar] [CrossRef]
  7. National Academies of Sciences, Engineering and Medicine. Separation and Purification: Critical Needs and Opportunities; The National Academies Press: Washington, DC, USA, 1987. [Google Scholar] [CrossRef]
  8. National Academy of Engineering. The Greening of Industrial Ecosystems; The National Academies Press: Washington, DC, USA, 1994. [Google Scholar] [CrossRef]
  9. Walter, N.; Snyder, C. Microeconomic Theory: Basic Principles and Extensions, 10th ed.; Thomson South-Western: Mason, OH, USA, 2007; ISBN 13:978-0-324-42162-0. [Google Scholar]
  10. United Nations Industrial Development Organization (UNIDO). Chemical Leasing: Redefining the Sustainable Management of Chemicals. 2013. Available online: https://www.unido.org/sites/default/files/2013-10/Chemical_Leasing_0.pdf (accessed on 5 March 2024).
  11. Lozano, R.; Carpenter, A.; Satric, V. Fostering green chemistry through a collaborative business model: A Chemical Leasing case study from Serbia. Resour. Conserv. Recycl. 2013, 78, 136–144. [Google Scholar] [CrossRef]
  12. EUROSTAT. Energy Statistics—An Overview (Data Extracted: 16 February 2022; Planned article update: 31 May 2023). Statistics Explained 2022. Available online: https://ec.europa.eu/eurostat/statistics-explained/SEPDF/cache/29046.pdf (accessed on 5 March 2024).
  13. EUROSTAT. Energy Efficiency Statistics (Data Extracted: 16 December 2022; Planned Article Update: 18 December 2023). Statistics Explained 2022. Available online: https://ec.europa.eu/eurostat/statistics-explained/SEPDF/cache/19548.pdf (accessed on 5 March 2024).
  14. Moser, F.; Jakl, T. Chemical leasing—A review of implementation in the past decade. Environ. Sci. Pollut. Res. 2014, 22, 6325–6348. [Google Scholar] [CrossRef]
  15. Joas, R.; Abraham, V.; Joas, A. Chemical Leasing: A Business Model to Drive Resource Efficiency in the Supply Chain. In Factor X: Challenges, Implementation Challenges and Examples for a Sustainable Use of Natural Resources; Lehmann, H., Ed.; Springer International Publishing: Cham, Switzerland, 2018; Volume 32, pp. 395–403, Eco-efficiency in Industry and Science; ISBN 978-3-319-50079-9. [Google Scholar] [CrossRef]
  16. Moser, F.; Karavezyris, V.; Blum, C. Chemical leasing in the context of sustainable chemistry. Environ. Sci. Pollut. Res. 2014, 22, 9. [Google Scholar] [CrossRef]
  17. Lozano, R.; Carpenter, A.; Lozano, F.J. Critical reflections on the Chemical Leasing concept. Resour. Conserv. Recycl. 2014, 86, 53–60. [Google Scholar] [CrossRef]
  18. Weerakkody, M.P.; Edirisinghe, L.G.L.M.; Sivashankar, P. Farmers’ attitude towards chemical leasing for sustainability and environmental protection. Curr. Res. Environ. Sustain. 2022, 4, 100175. [Google Scholar] [CrossRef]
  19. Moser, F.; Jakl, T.; Joas, R.; Dondi, F. Chemical Leasing business models and corporate social responsibility. Environ. Sci. Pollut. Res. 2014, 21, 12445–12456. [Google Scholar] [CrossRef]
  20. United Nations Industrial Development Organization (UNIDO). Chemical Leasing within Industrial and Service Sector Cleaning Operations: A Viable Business Model to Reduce Chemical Use and Negative Environmental Impacts; UNIDO: Vienna, Austria, 2015; Available online: https://chemicalleasing.com/wp-content/uploads/2021/04/9_UNIDO_Sector_study-cleaning_operation.pdf (accessed on 5 March 2024).
  21. Schwager, P.; Dunjic, B.; Kaltenegger, I. Success and failure of the chemical leasing model in addressing sustainability challenges: Evidence from practice. Curr. Opin. Green Sustain. Chem. 2017, 8, 14–17. [Google Scholar] [CrossRef]
  22. Jakl, T.; Schwager, P. Chemical Lasing Goes Global. Selling Services Instead of Barrels: A Win-Win Business Model for Environment and Industry; Springer: Vienna, Austria, 2008; ISBN 978-3-211-73751-4. [Google Scholar]
  23. Keyhani, M.; Abbaspour, A.; Bahadori-Jahromi, A.; Mylona, A.; Janbey, A.; Godfrey, P.; Zhang, H. Whole Life Carbon Assessment of a Typical UK Residential Building Using Different Embodied Carbon Data Sources. Sustainability 2023, 15, 5115. [Google Scholar] [CrossRef]
  24. United Nations (UN). System of Environmental Economic Accounting (SEEA) 2012: Central Framework; United Nations: New York, NY, USA, 2014; ISBN 987-92-1-161563-0. Available online: https://unstats.un.org/unsd/envaccounting/seearev/seea_cf_final_en.pdf (accessed on 5 March 2024).
  25. United Nations; European Commission; International Monetary Fund; Organization for Economic Cooperation & Develop-ment; World Bank. Handbook of Integrated Environmental & Economic Accounting; Studies in Methods, Handbook of National Accounting, Series F, No.61, Rev.1 (ST/ESA/STAT/SER.F/61/Rev.1); United Nations: New York, NY, USA. 2003. Available online: https://unstats.un.org/unsd/environment/seea2003.pdf (accessed on 5 March 2024).
  26. Karakatsanis, G.; Mamassis, N. Entropy, Recycling and Macroeconomics of Water Resources; European Geosciences Union (EGU) General Assembly: Vienna, Austria, 2014. [Google Scholar] [CrossRef]
  27. Karakatsanis, G.; Mamassis, N.; Koutsoyiannis, D.; Efstratiadis, A. Entropy and reliability of water use via a statistical approach of scarcity. In Proceedings of the Facets of Uncertainty: 5th EGU Leonardo Conference-Hydrofractals 2013-STAHY 2013, EGU, IAHS and IUGG, Kos, Greece, 17–19 October 2013. [Google Scholar] [CrossRef]
  28. Dosi, G. Finance, innovation and industrial change. J. Econ. Behav. Organ. 1990, 13, 299–319. [Google Scholar] [CrossRef]
  29. Castelnuovo, E.; Galeotti, M.; Gambarelli, G.; Vergalli, S. Learning by-Doing vs. Learning by Researching in a model of climate change policy analysis. Ecol. Econ. 2005, 54, 261–276. [Google Scholar] [CrossRef]
  30. Greco, M.; Grimaldi, M.; Cricelli, L. An analysis of the open innovation effect on firm performance. Eur. Manag. J. 2016, 34, 1–16. [Google Scholar] [CrossRef]
  31. Ehrenfeld, J.; Gertler, N. Industrial Ecology in Practice: The evolution of interdependence at Kalundborg. J. Ind. Ecol. 1997, 1, 67–79. [Google Scholar] [CrossRef]
  32. Keckler, S.E.; Allen, D.T. Material Reuse Modeling: A Case Study of Water Reuse in an Industrial Park. J. Ind. Ecol. 1998, 2, 79–92. [Google Scholar] [CrossRef]
  33. Hummer, B. Chemical Substitution in the Nepal Carpet Industry. J. Ind. Ecol. 2008, 2, 7–9. [Google Scholar] [CrossRef]
  34. Barile, M.; Weisstein, E.W. Galton Board. From MathWorld—A Wolfram Web Resource. Available online: https://mathworld.wolfram.com/GaltonBoard.html (accessed on 5 March 2024).
  35. Ahmed, J.; Chumley, T.; Cook, S.; Cox, C.; Grant, H.; Petela, N.; Rothrock, B.; Xhafaj, R. Dynamics of the no-slip Galton board (v1). arXiv 2022, arXiv:2208.07790v1. [Google Scholar] [CrossRef]
  36. Liakopoulou, A.; Makropoulos, C.; Nikolopoulos, D.; Monokrousou, K.; Karakatsanis, G. An Urban Water Simulation Model for the Design, Testing and Economic Viability Assessment of Distributed Water Management Systems for a Circular Economy. Environ. Sci. Proc. 2020, 2, 14. [Google Scholar] [CrossRef]
  37. Marin, P. Public-Private Partnerships for Urban Water Utilities: A Review of Experiences in Developing Countries; The World Bank: Washington, DC, USA, 2009; ISBN 978-0-8213-7957-8. Available online: https://openknowledge.worldbank.org/server/api/core/bitstreams/0dea9db2-e7ec-5beb-9a1a-5e7b2d351f59/content (accessed on 5 March 2024).
  38. Makropoulos, C.; Rozos, E.; Tsoukalas, I.; Plevri, A.; Karakatsanis, G.; Karagiannidis, L.; Makri, E.; Lioumis, C.; Noutsopoulos, C.; Mamais, D. Sewer-mining: A water reuse option supporting circular economy, public service provision and entrepreneurship. J. Environ. Manag. 2017, 216, 285–298. [Google Scholar] [CrossRef]
  39. Artola, I.; Domenech, T.; Doranova, A.; Roman, L.; Smith, M. Cooperation Fostering Industrial Symbiosis: Market Potential, Good Practice and Policy Actions: Final Report; European Commission, Directorate-General for Internal Market, Industry, Entrepreneurship and SMEs Publications Office: Luxembourg, 2018; ISBN 978-92-79-74679-6. Available online: https://data.europa.eu/doi/10.2873/346873 (accessed on 5 March 2024).
  40. Gorgels, S.; Muller, P.; Ladher, R.; Booth, J.; Sabah, M.; Priem, M. Annual Report on European SMEs 2021/2022: SMEs and Environmental Sustainability; Publications Office of the European Union: Luxembourg, 2022; ISBN 978-92-9469-296-2. [Google Scholar] [CrossRef]
  41. Institute of Energy for South-East Europe (IENE). Green Bonds and IENE. An IENE Advisory Note (No 2). 2021. Available online: https://www.iene.eu/articlefiles/inline/green%20bonds%20brochure_3.pdf (accessed on 5 March 2024).
  42. European Bank for Reconstruction and Development (EBRD). EBRD Invests in Mytilineos Green Eurobond Issuance. 2021. Available online: https://www.ebrd.com/news/2021/ebrd-invests-in-mytilineos-green-eurobond-issuance.html (accessed on 5 March 2024).
  43. European Bank for Reconstruction and Development (EBRD). EBRD Invests in Debut Issue of Green Bonds by a Greek Bank. 2020. Available online: https://www.ebrd.com/news/2020/ebrd-invests-in-debut-issue-of-green-bonds-by-a-greek-bank-.html (accessed on 5 March 2024).
  44. European Bank for Reconstruction and Development (EBRD). EBRD invests in PPC’s Sustainability-Linked Bond Issue in Greece. 2021. Available online: https://www.ebrd.com/news/2021/ebrd-invests-in-ppcs-sustainabilitylinked-bond-issue-in-greece.html (accessed on 5 March 2024).
  45. European Bank for Reconstruction and Development (EBRD). EBRD to Invest in Lamda’s Green Bond in Greece. 2022. Available online: https://www.ebrd.com/news/2022/ebrd-to-invest-in-lamdas-green-bond-in-greece.html (accessed on 5 March 2024).
  46. European Commission. Proposal for a Directive of the European Parliament and of the Council on Energy Efficiency (Recast); 2021. COM/2021/558. Available online: https://eur-lex.europa.eu/legal-content/EN/TXT/?uri=CELEX:52021PC0558 (accessed on 5 March 2024).
  47. International Energy Agency (IEA). A 10-Point Plan to Reduce the European Union’s Reliance on Russian Natural Gas. 2022. Available online: https://iea.blob.core.windows.net/assets/1af70a5f-9059-47b4-a2dd-1b479918f3cb/A10-PointPlantoReducetheEuropeanUnionsRelianceonRussianNaturalGas.pdf (accessed on 5 March 2024).
  48. Bolton, P.; Despres, M.; Pereira Da Silva Luiz, A.; Samama, F.; Svartzman, R. The Green Swan: Central Banking and Financial Stability in the Age of Climate Change; Bank of International Settlements (BIS): Basel, Switzerland, 2020; ISBN 978-92-9259-326-1. Available online: https://www.bis.org/publ/othp31.pdf; (accessed on 5 March 2024).
  49. Taleb, N.N. The Black Swan: The Impact of the Highly Improbable; Random House Publishing Group: New York, NY, USA, 2007; ISBN 978-1-4000-6351-2. [Google Scholar]
  50. European Central Bank (ECB). ECB Presents Action Plan to Include Climate Change Considerations in Its Monetary Policy Strategy Annex: Detailed Roadmap of Climate Change-Related Actions; Press Release. 2021. Available online: https://www.ecb.europa.eu/press/pr/date/2021/html/ecb.pr210708_1_annex~f84ab35968.en.pdf (accessed on 5 March 2024).
  51. European Banking Authority (EBA). Draft Implementing Standards on Prudential Disclosures on ESG Risks in Accordance with Article 449a CRR. Consultation Paper Draft It Prudential Disclosures ESG Risks EBA/CP/2021/06. 2021. Available online: https://www.eba.europa.eu/sites/default/documents/files/document_library/Publications/Consultations/2021/Consultation%20on%20draft%20ITS%20on%20Pillar%20disclosures%20on%20ESG%20risk/963621/Consultation%20paper%20on%20draft%20ITS%20on%20Pillar%203%20disclosures%20on%20ESG%20risks.pdf (accessed on 5 March 2024).
  52. The Nature Conservancy. Reducing Emissions from Deforestation and Degradation (REDD): A Casebook of On-the-Ground Experience; Conservation International and Wildlife Conservation Society: Arlington, VA, USA, 2010; Available online: https://www.nature.org/media/climatechange/redd-casebook-tnc-ci-wcs.pdf (accessed on 5 March 2024).
  53. Bank for International Settlements (BIS). Climate-Related Financial Risks—Measurement Methodologies; BIS, Basel Committee on Banking Supervision: Basel, Switzerland, 2021; ISBN 978-92-9259-471-8. [Google Scholar]
  54. Stern, N.H. The Economics of Climate Change: The Stern Review; Cambridge University Press: Cambridge, UK, 2006. [Google Scholar]
  55. Bolton, R. Integrating Economic and Environmental Models: Some Preliminary Considerations. Socio-Econ. Plan. Sci. 1989, 23, 25–37. [Google Scholar] [CrossRef]
  56. Bartelmus, P. Accounting for sustainable growth and development. Struct. Change Econ. Dyn. 1992, 3, 241–260. [Google Scholar] [CrossRef]
  57. Vellinga, N.; Withagen, C. On the concept of Green National Income. Oxf. Econ. Pap. 1996, 48, 499–514. [Google Scholar] [CrossRef]
  58. Odum Howard, T. Environmental Accounting: Emergy and Environmental Decision Making; John Wiley & Sons: New York, NY, USA, 1996; ISBN 0-471-11442-1. [Google Scholar]
  59. United Nations Statistics Division. Global Assessment of Environment Statistics and Environmental-Economic Accounting. Committee of Experts on Environmental-Economic Accounting (UNCEEA), Statistical Commission. 2007. Available online: https://unstats.un.org/unsd/statcom/doc07/Analysis_SC.pdf (accessed on 5 March 2024).
  60. Roussis, D.; Karakatsanis, G.; Makropoulos, C. A macroeconomic model of water capital conservation. In Proceedings of the 4th International Conference of Water Economics, Statistics and Finance, Livorno, Italy, 4–5 April 2017. [Google Scholar] [CrossRef]
  61. Zampori, L.; Pant, R. Suggestions for Updating the Product Environmental Footprint (PEF) Method; EUR 29682 EN; Publications Office of the European Union: Luxembourg, 2019; ISBN 978-92-76-00653-4. Available online: https://publications.jrc.ec.europa.eu/repository/handle/JRC115959 (accessed on 5 March 2024).
  62. European Commission. Commission Recommendation (EU) 2021/2279 of 15 December 2021 on the Use of the Environmental Footprint Methods to Measure and Communicate the Life Cycle Environmental Performance of Products and Organisations. 2021, C/2021/9332. Available online: https://eur-lex.europa.eu/legal-content/EN/TXT/?uri=CELEX%3A32021H2279 (accessed on 5 March 2024).
  63. European Commission. Delivering the European Green Deal. 2021. Available online: https://ec.europa.eu/info/strategy/priorities-2019-2024/european-green-deal/delivering-european-green-deal_en (accessed on 5 March 2024).
  64. S&P Dow Jones Indices. Dow Jones Sustainability Indices (DJSI) Methodology; A Division of S&P Global. 2023. Available online: https://www.spglobal.com/spdji/en/documents/methodologies/methodology-dj-sustainability-indices.pdf (accessed on 5 March 2024).
  65. Cohen, J.L.; Newman, C.M. When will a large complex system be stable? J. Theor. Biol. 1985, 113, 153–156. [Google Scholar] [CrossRef]
  66. Karakatsanis, G.; Mamassis, N. Energy, Trophic Dynamics and Ecological Discounting. Land 2023, 12, 1928. [Google Scholar] [CrossRef]
  67. McVittie, A.; Hussain, S.S. The Economics of Ecosystems and Biodiversity Valuation Database Manual. 2013. Available online: https://www.teebweb.org/wp-content/uploads/2014/03/TEEB-Database-and-Valuation-Manual_2013.pdf (accessed on 5 March 2024).
  68. Grafton, R.Q.; Jotzo, F.; Wasson, M. Financing sustainable development: Country Undertakings and Rights for Environmental Sustainability CURES. Ecol. Econ. 2004, 51, 65–78. [Google Scholar] [CrossRef]
  69. Dittrich, M. Green finance in emerging markets. Glob. Solut. J. 2020, 156–167. Available online: https://www.global-solutions-initiative.org/wp-content/uploads/2020/04/GSJ5_Dittrich.pdf (accessed on 5 March 2024).
  70. Kahsay, H.T. Financial Development and Economic Growth Nexus: Evidence from Ethiopia (Johnson Approach to Co-Integration). Int. J. Sci. Res. 2015, 4, 2319–7064. Available online: https://www.ijsr.net/archive/v4i4/SUB153620.pdf (accessed on 5 March 2024).
  71. European Commission. Communication from the Commission to the European Parliament, the Council, the European Economic and Social Committee and the Committee of the Regions: A New Circular Economy Action Plan for a Cleaner and More Competitive Europe. 2020. COM/2020/98 Final. Available online: https://eur-lex.europa.eu/legal-content/EN/TXT/?qid=1583933814386&uri=COM:2020:98:FIN (accessed on 5 March 2024).
  72. Council of Europe. Fit for 55’: Council and Parliament Reach Provisional Deal on EU Emissions Trading System and the Social Climate Fund. 18 December 2022. Available online: https://www.consilium.europa.eu/en/press/press-releases/2022/12/18/fit-for-55-council-and-parliament-reach-provisional-deal-on-eu-emissions-trading-system-and-the-social-climate-fund/ (accessed on 5 March 2024).
  73. United Nations Environmental Program Financial Initiative (UNEP FI). Principles for Responsible Banking (PRB) to Strengthen Climate Ambition to Meet Increased Expectations. Available online: https://www.unepfi.org/industries/banking/principles-for-responsible-banking-to-strengthen-climate-ambition-to-meet-increased-expectations/ (accessed on 5 March 2024).
  74. Chapagain, A.K.; Hoekstra, A.Y.; Savenije, H.H.J. Saving Water through Global Trade. UNESCO-IHE, Institute for Water Education 2005, Research Report Series No 17. Available online: https://ris.utwente.nl/ws/portalfiles/portal/5150405/Vreman-1.868333.pdf (accessed on 5 March 2024).
  75. Karakatsanis, G.; Mamassis, N. Energy and the Macrodynamics of Agrarian Societies. Land 2023, 12, 1603. [Google Scholar] [CrossRef]
  76. Karakatsanis, G.; Roussis, D.; Moustakis, Y.; Gournari, P.; Parara, I.; Dimitriadis, P.; Koutsoyiannis, D. Energy, variability and weather finance engineering. Energy Procedia 2017, 125, 389–397. [Google Scholar] [CrossRef]
  77. Mochaourab, R.; Jorswieck, E.A. Exchange Economy in Two-User Multiple-Input Single-Output Interference Channels (v3). IEEE J. Sel. Top. Signal Process. 2012, 6, 151–164. [Google Scholar] [CrossRef]
  78. Tsur, Y.; Zemel, A. Growth, Scarcity and R&D. AgEcon Search 2002; Discussion Paper 14994. [CrossRef]
  79. Boggia, A.; Massei, G.; Paolotti, L.; Rocchi, L.; Schiavi, F. A model for measuring the environmental sustainability of events. J. Environ. Manag. 2018, 206, 836–845. [Google Scholar] [CrossRef] [PubMed]
Figure 1. The effect of exponents β, γ, and δ on the shape of the SP according to Equation (1): (a) the effect of exponent β on the constant cost coefficient a (upper row); (b) the effect of exponent γ on the variable cost coefficient b (middle row); (c) the effect of exponent δ on the economies of scale (negative, constant, positive) on the recovery cost across increasing dilution (1/m) (lower row). Each row presents the effect of each exponent, assuming ceteris paribus (all other factors remain constant).
Resources 13 00065 g001
Figure 2. Schematic depiction of VAC recovery microeconomic optimization: (a) an SP as a chart of microeconomic optimal dilution–cost points (left) and (b) ChL optimization potential along the SPs of two industries (right) in an Edgeworth Box context.
Resources 13 00065 g002
Figure 3. Schematic depiction of the standard Bilateral ChL model with 1-tier agreement.
Resources 13 00065 g003
Figure 4. Schematic depiction of the generalized Multilateral/Bus ChL model with 2-tier agreements.
Resources 13 00065 g004
Figure 5. Transformation of VAC dilutions into normalized VAC Dilution Index (VAC DI) classes; (a) distribution simulation of VAC arrivals in wastewater by their DI as defined by the assignment of every result in the formula 1/Concentration (with concentration expressed as mg/L) to a linear dilution scale ranging from 1 to 50 (DI∈(0,50)). The simulated distribution is Normal, with Mean = 25 and Standard Deviation = 7. With the same rationale, we simulate the distribution of VAC deliveries after processing and dilution reduction, with Mean = 15 and Standard Deviation = 5; (b) we normalize dilution levels 1/m by assigning them a DI in linear scale, as well as constant and equal intervals. This is necessary to maintain the optical symmetry of normality.
Resources 13 00065 g005
Figure 6. Schematic depiction of a sample of 500 VAC DI arrivals’ Normal distribution with Mean = 25 and Standard Deviation = 7. The distribution is to be transformed by the requested VAC DI deliveries, which is statistically equivalent to the change in the distribution’s parameters.
Resources 13 00065 g006
Figure 7. Schematic depiction of the VAC’s recovery market formation by two industries and total economic benefits from its allocation between them [4].
Resources 13 00065 g007
Figure 8. Integrated view of the VAC dilution frequencies distribution across the market’s SP [4].
Resources 13 00065 g008
Figure 9. Allocation of VAC arrivals by VAC DI level with complete information of industries’ Operational and Cost Prevalence ranges [4].
Resources 13 00065 g009
Figure 10. Full schematic depiction of a simulated VAC market with complete information in which our engineered ChL contract takes place: (a) the resource recovery market consisting of the SPs of the two industries (upper center) [4]; (b) the VAC’s recovery costs, as well the market shares’ allocation, depend on the properties of the distributions describing the dilution levels of the VAC in the arriving wastewater packages (lower center); (c) the formation of the total cost distribution of the VAC’s recovery by Industries A and B at each dilution level depends on the summation of the areas where each industry operates at a lower cost or is cost-prevalent (left); (d) the allocation of the VAC’s recovery total cost per VAC DI between Industries A and B (right).
Resources 13 00065 g010
Figure 11. Allocation of VAC arrivals by DI level with incomplete information of industries’ Operational and Cost Prevalence ranges [4].
Resources 13 00065 g011
Figure 12. Numerical depiction of the symmetric Mean (MEAN) ChL pricing model.
Resources 13 00065 g012
Figure 13. Numerical depiction of the symmetric Variable (VAR) ChL pricing model.
Resources 13 00065 g013
Figure 14. Numerical depiction of the symmetric Composite (COM) ChL pricing model.
Resources 13 00065 g014
Table 1. Assumptions on the implementation and modeling of ChL contracts.
Assumption #Assumption DescriptionAssumption Substantiation
1100% material efficiency of VAC recoveryThere are no material losses across the VAC’s recovery; the requested quantity is exactly delivered
2Homogeneity of wastewater matricesThe composition of each wastewater matrix is the same, differentiating only by VAC dilution
3Common operational range of industriesTechnologically, all industries are equivalent and can recover a VAC at any dilution level (0%→100%)
4Delivered VACs are of the same qualityIndustries recover VACs with no quality differences; the delivered VAC is qualitatively the same
5Industries can process any wastewater quantityIndustries’ capacity can process any amount of wastewater to extract VACs without constraints
6Industries implement full-cost accountingEach industry applies the System of Environmental Economic Accounting (SEEA) [24,25]
7Customers’ cost composition indifferenceCustomers are indifferent on each industry’s prevailing cost factor (constant, variable, environmental, etc.)
8Customers lack industrial alternativesGeographical or other barriers prevent Customers from assigning their wastewater matrices elsewhere
9Recovered VACs are delivered immediatelyWhen the VAC is recovered, all industries deliver it to the customer at the requested time with no delays
Disclaimer/Publisher’s Note: The statements, opinions and data contained in all publications are solely those of the individual author(s) and contributor(s) and not of MDPI and/or the editor(s). MDPI and/or the editor(s) disclaim responsibility for any injury to people or property resulting from any ideas, methods, instructions or products referred to in the content.