
Framework for Assessment of the Economic Vulnerability of Energy-Resource-Exporting Countries


Abstract
1. Introduction
2. Review of Related Frameworks and Methodologies
2.1. Energy-Exporting Countries
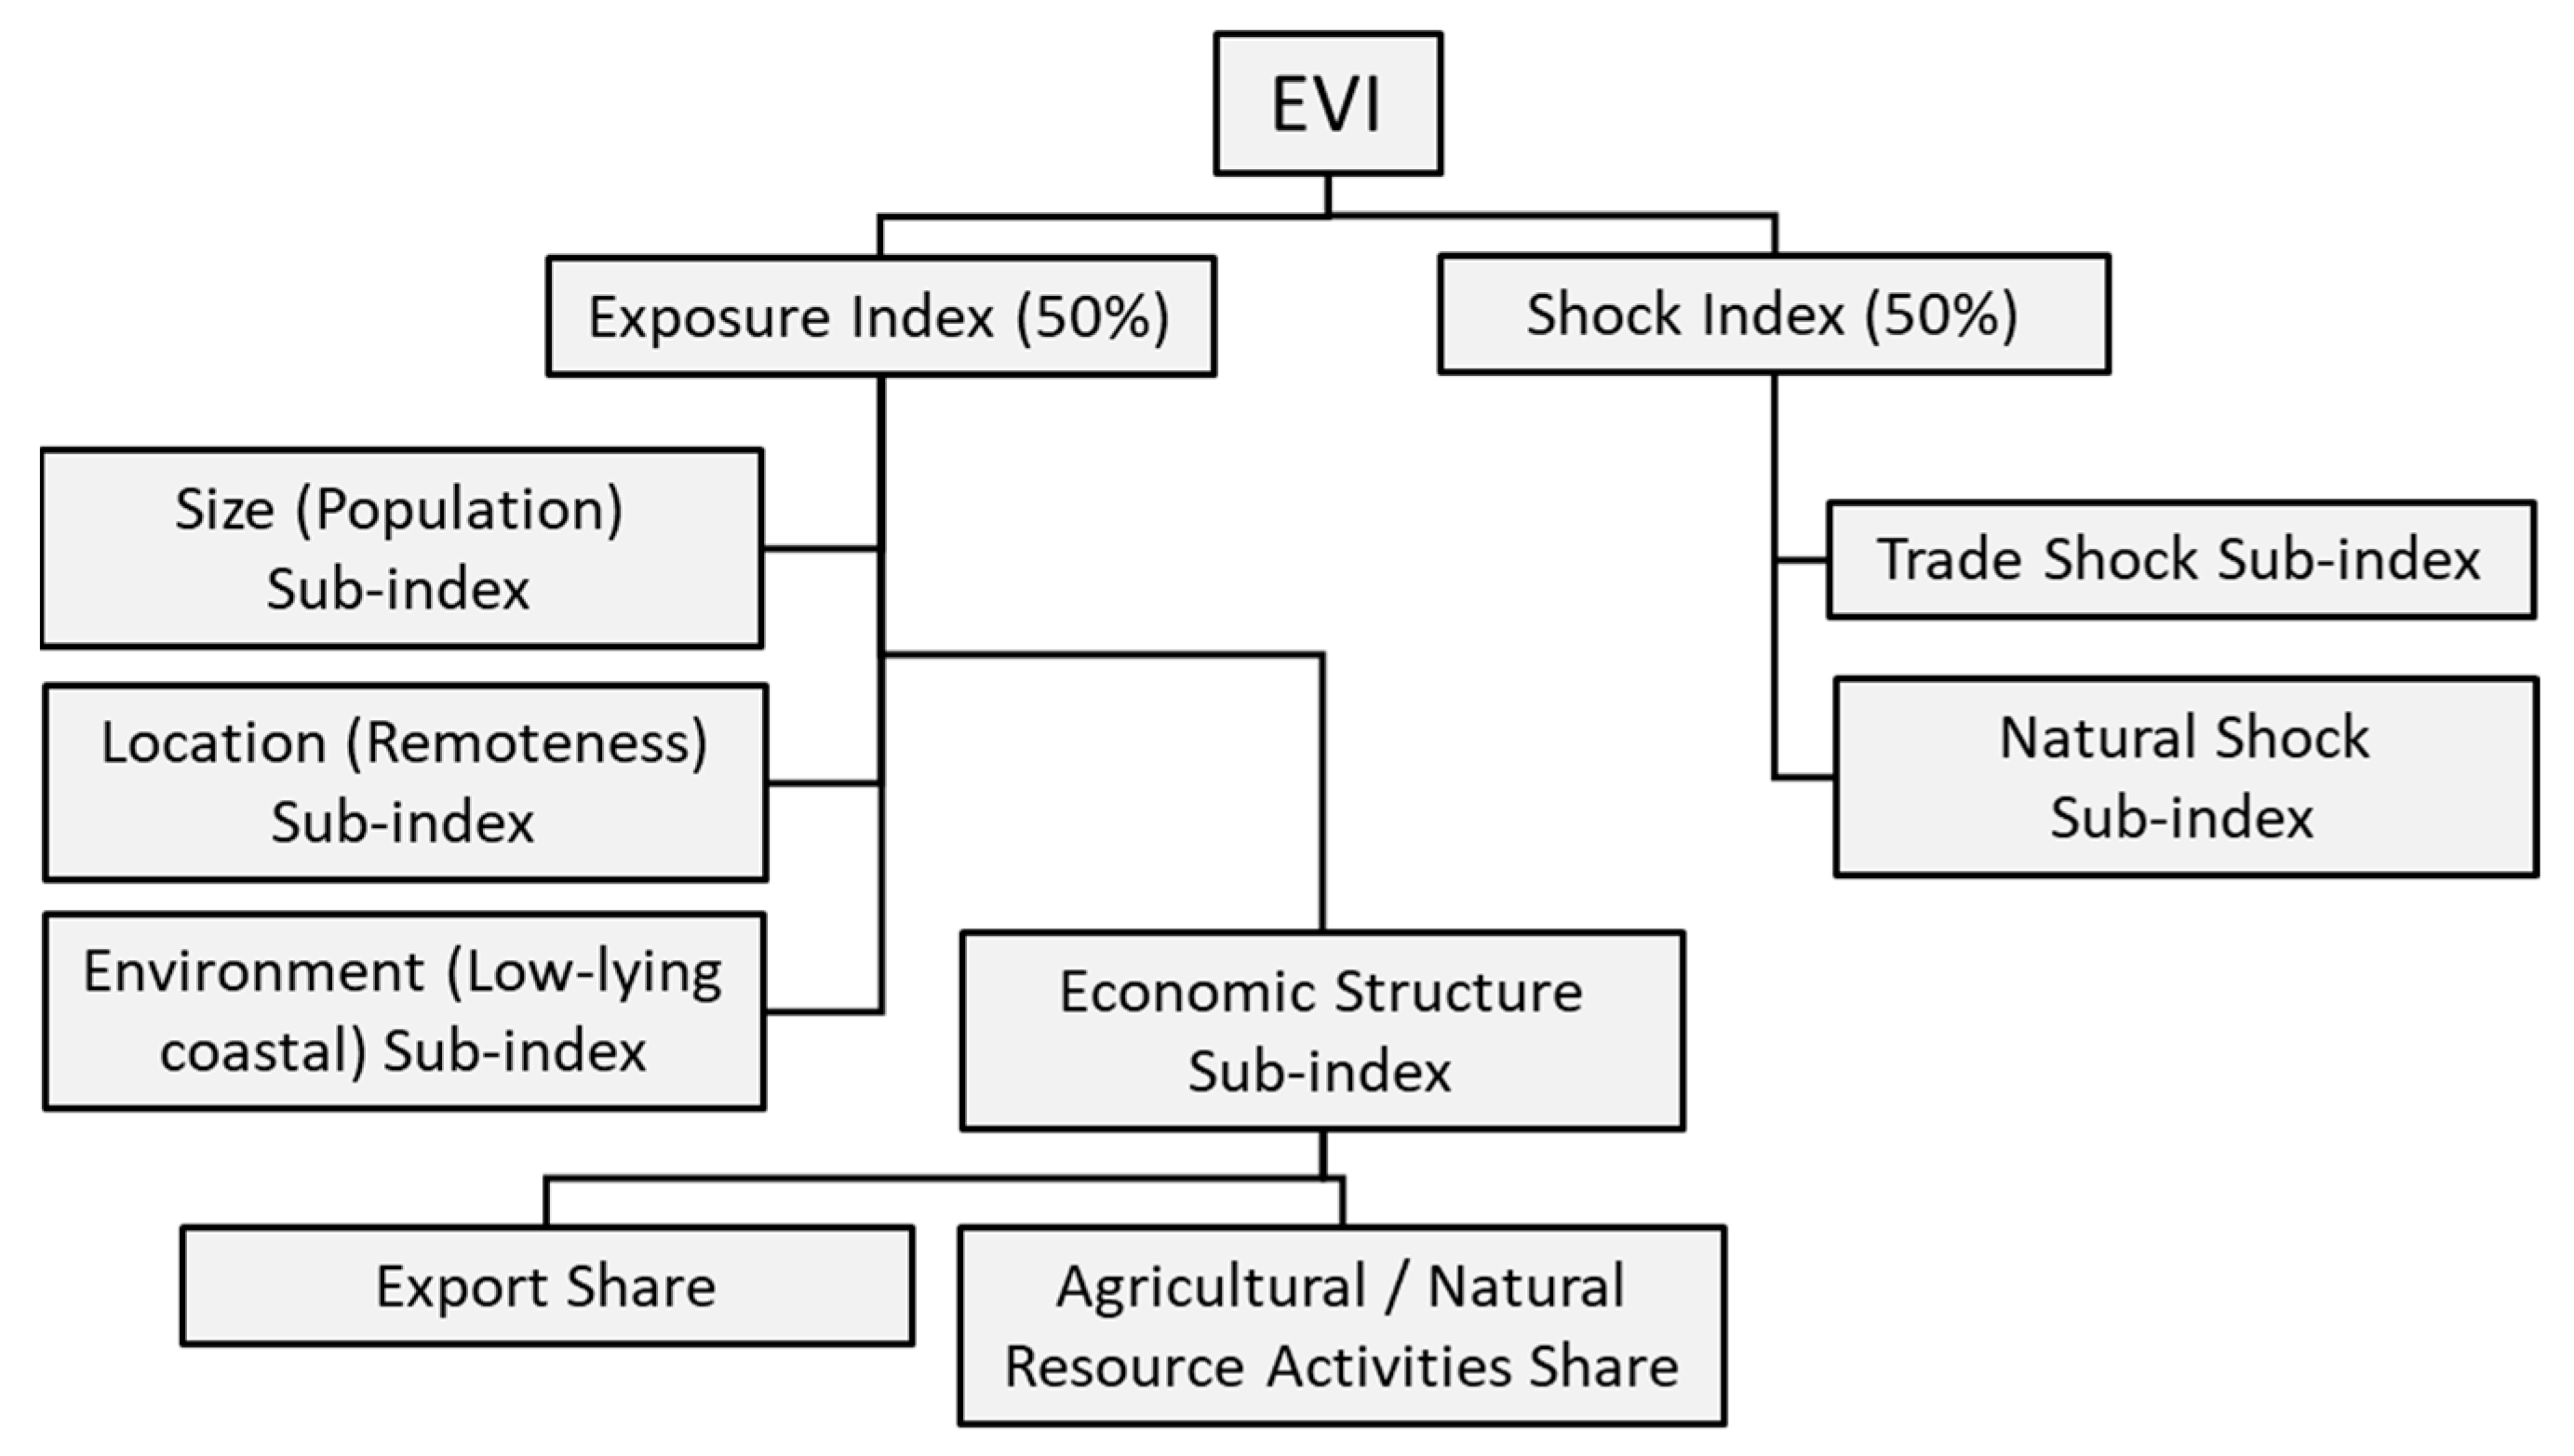
2.2. United Nations Economic Vulnerability Index
2.3. Energy Security Frameworks
2.4. Energy Producing Companies
3. Establishing the Assessment Framework
3.1. Adaption of Indices from Energy Security Frameworks
3.2. Influence of Temporary Supply Disruptions on Exporter Vulnerability
3.3. Nuclear Power and Uranium Exports
3.4. Principles for Selection of Factors
- Factors should be sufficiently distinct so as not to give undue emphasis to related issues. A number of the factors established from the literature review are quite similar in nature, such as energy intensity in various sectors of the customer’s economy. In this case, the most representative factor is selected, to avoid giving disproportionate weight to the importance of a set of similar factors in the final scorecard, which in this example would be total energy intensity of the customer’s economy.
- There should not be any direct dependency relationships between indices. Some factors established from the literature review depend on other factors as inputs such as reserve production ratio and resource estimates. For the purposes of this analysis, one or the other is selected, on the basis of which contributes more directly to the exporter vulnerability framework scorecard.
- Factors must be quantifiable with objective data. The research topic is such that it is realistic for the scorecard to be based on quantitative analysis derived from objective data, which is generally readily available. Expert rating assessments or surveys are not applied for this reason, and descriptive comparisons only figure as explanatory notes.
3.5. Energy Decarbonisation Implications for Fossil Fuel Exports
3.6. Diversity Indices
3.6.1. Comparison of HHI and SWI
3.6.2. Weighting Methods
3.7. Selection of Factors and Formulation of Metrics
- M1—Customer Energy Import Dependence;
- M2—Customer Energy Mix Diversity;
- M3—Export Customer Diversification;
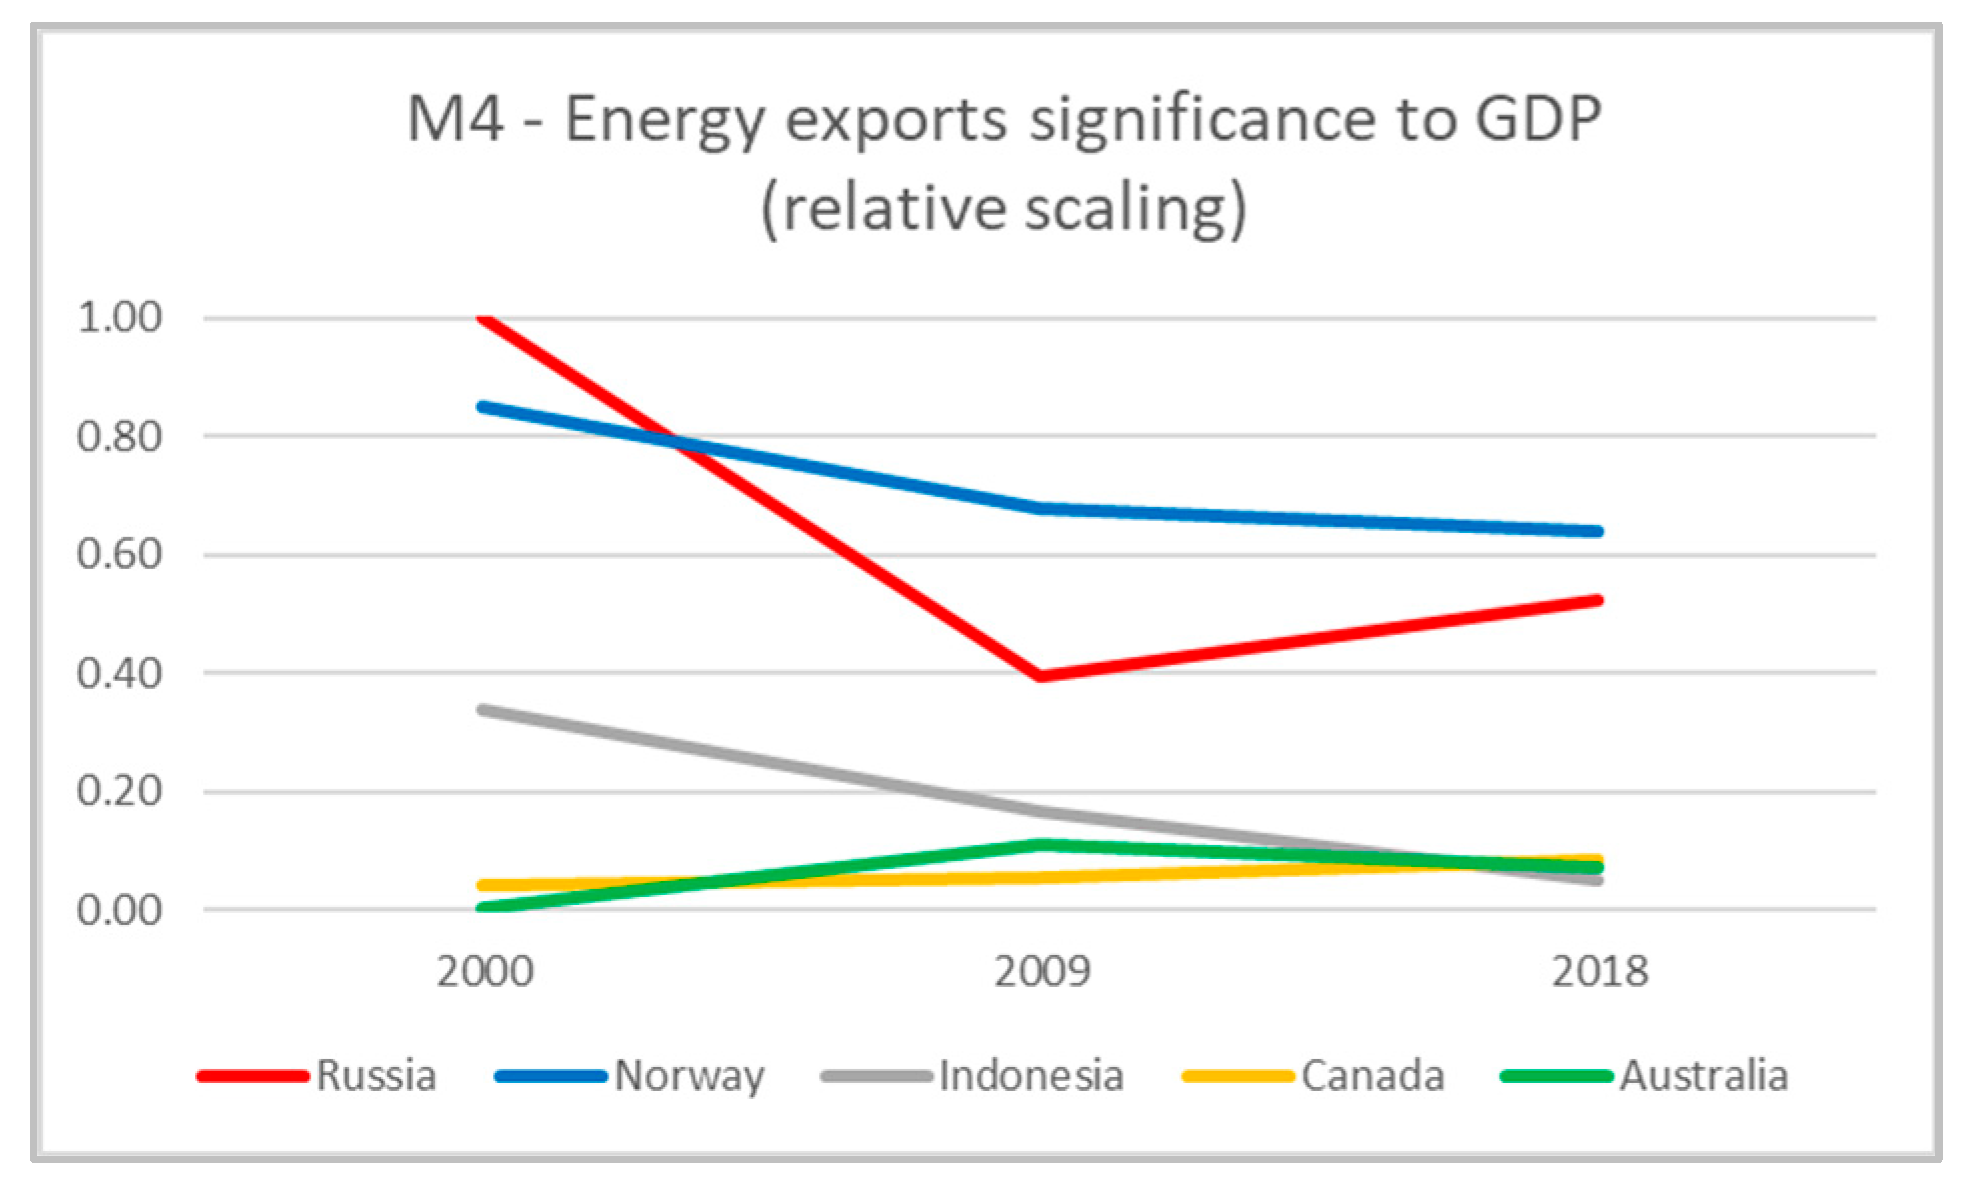
- M4—Energy exports significance to GDP;
- M5—Production to Resource Ratio;
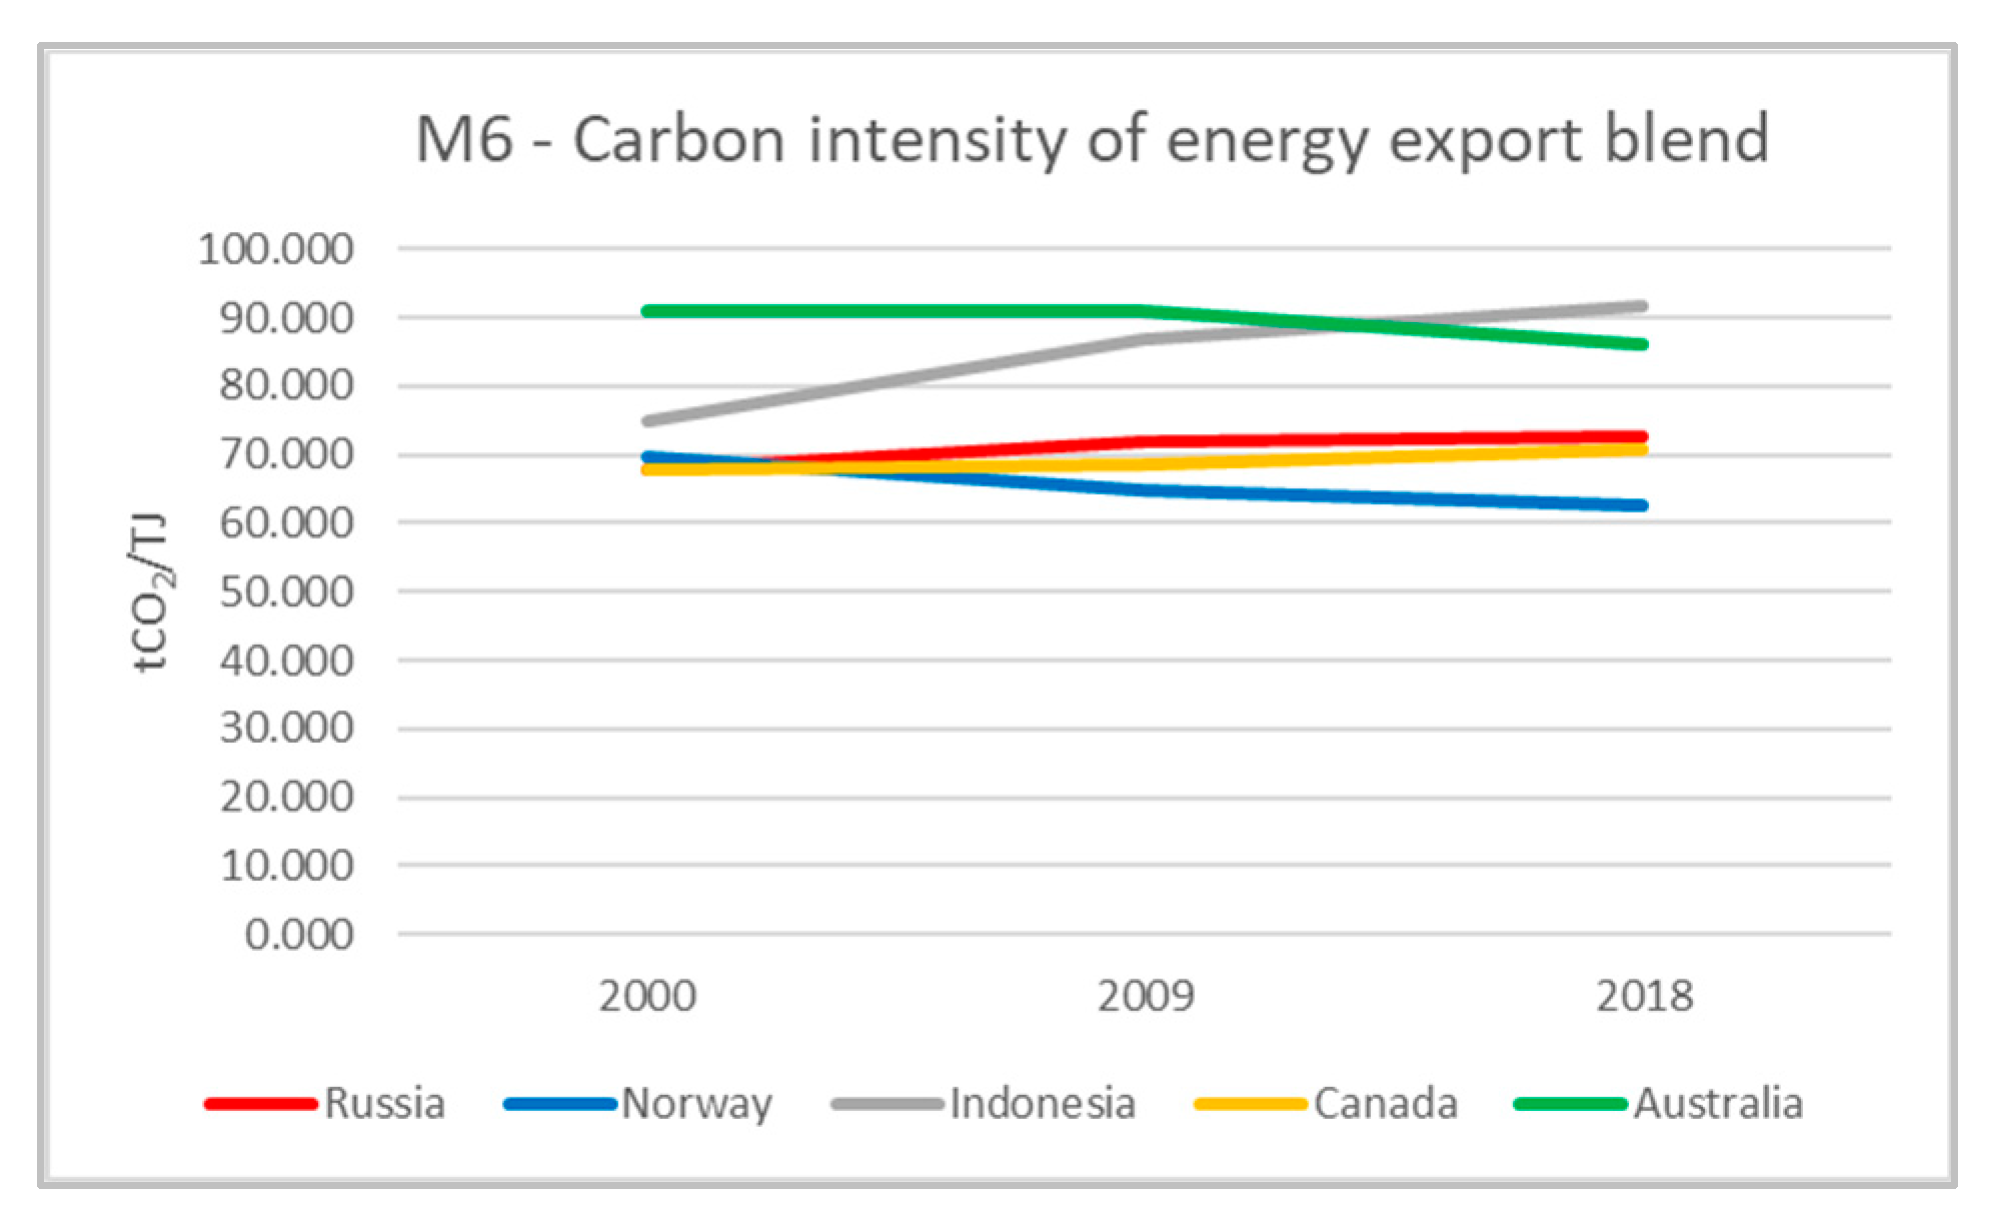
- M6—Carbon intensity of energy export blend.
3.8. Unitary Index or Scorecard of Indices
3.9. Scaling of Metrics in the Scorecard
4. Assessment Framework and Quantitative Metrics
4.1. Customer Energy Import Dependence
4.2. Customer Energy Mix Diversity
4.3. Export Customer Diversification
4.4. Energy Exports Significance to GDP
4.5. Production to Resource Ratio
4.6. Carbon Intensity of Energy Export Blend
5. Case Studies
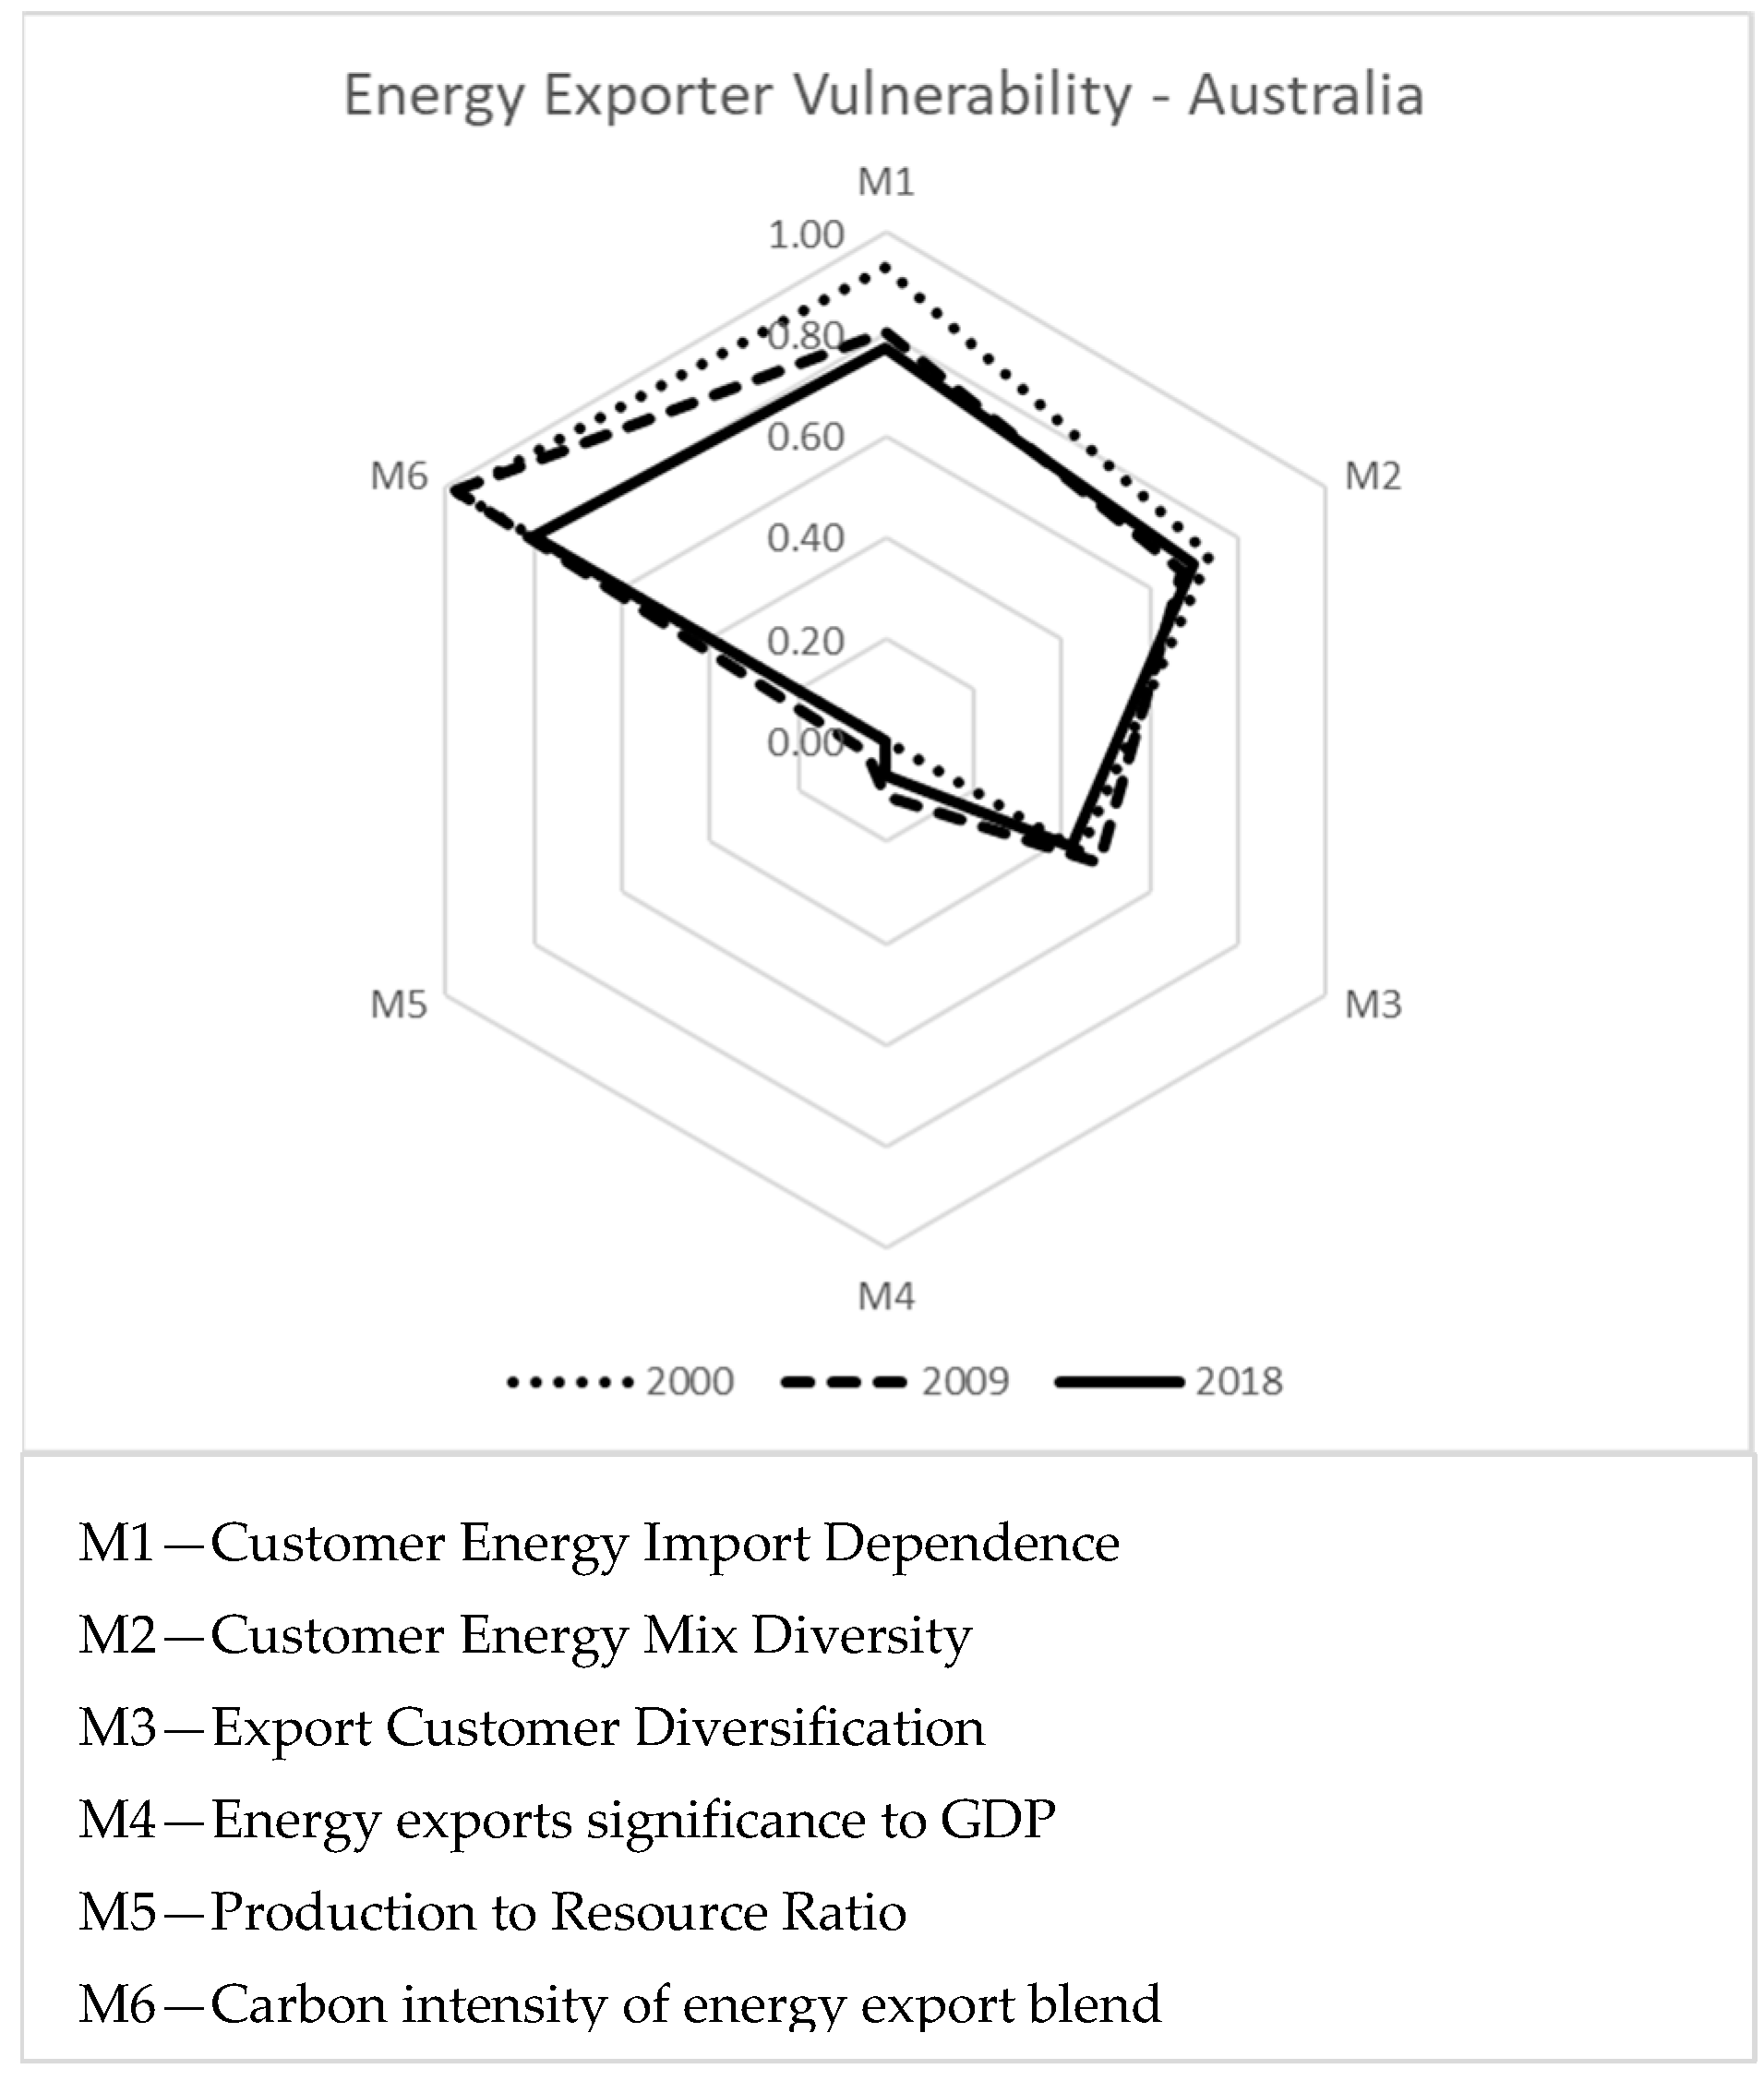
5.1. Australia
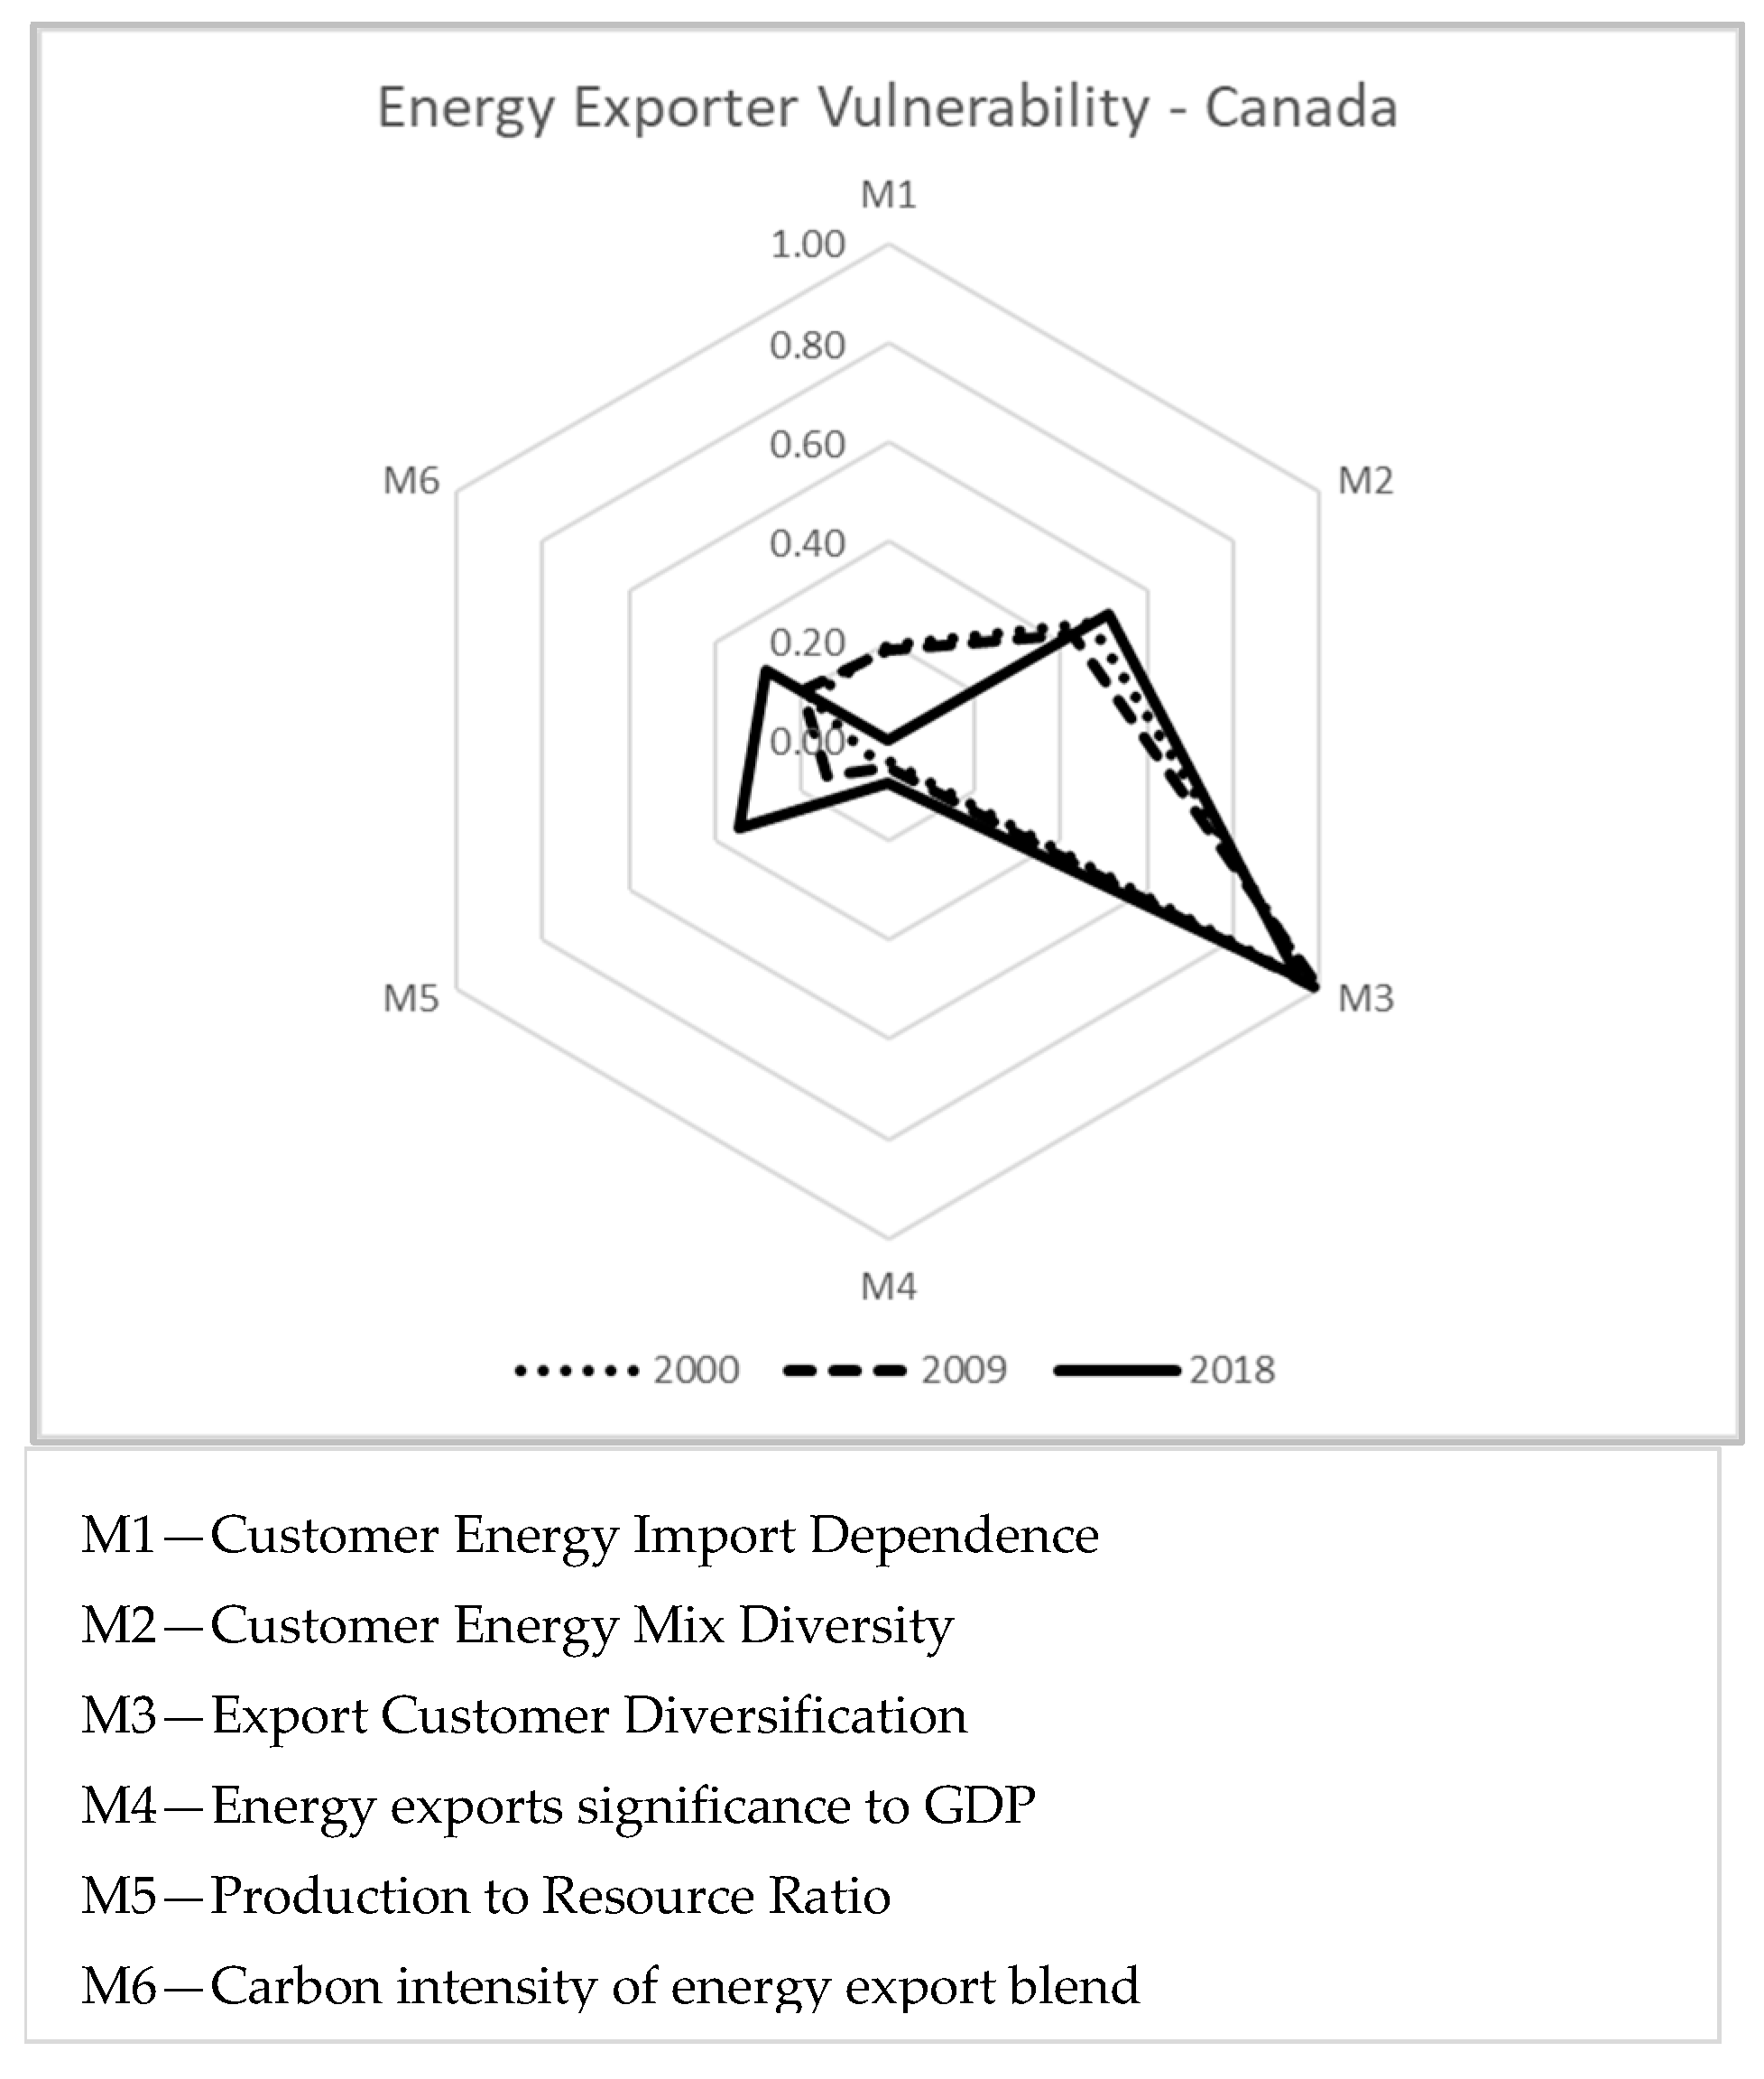
5.2. Canada
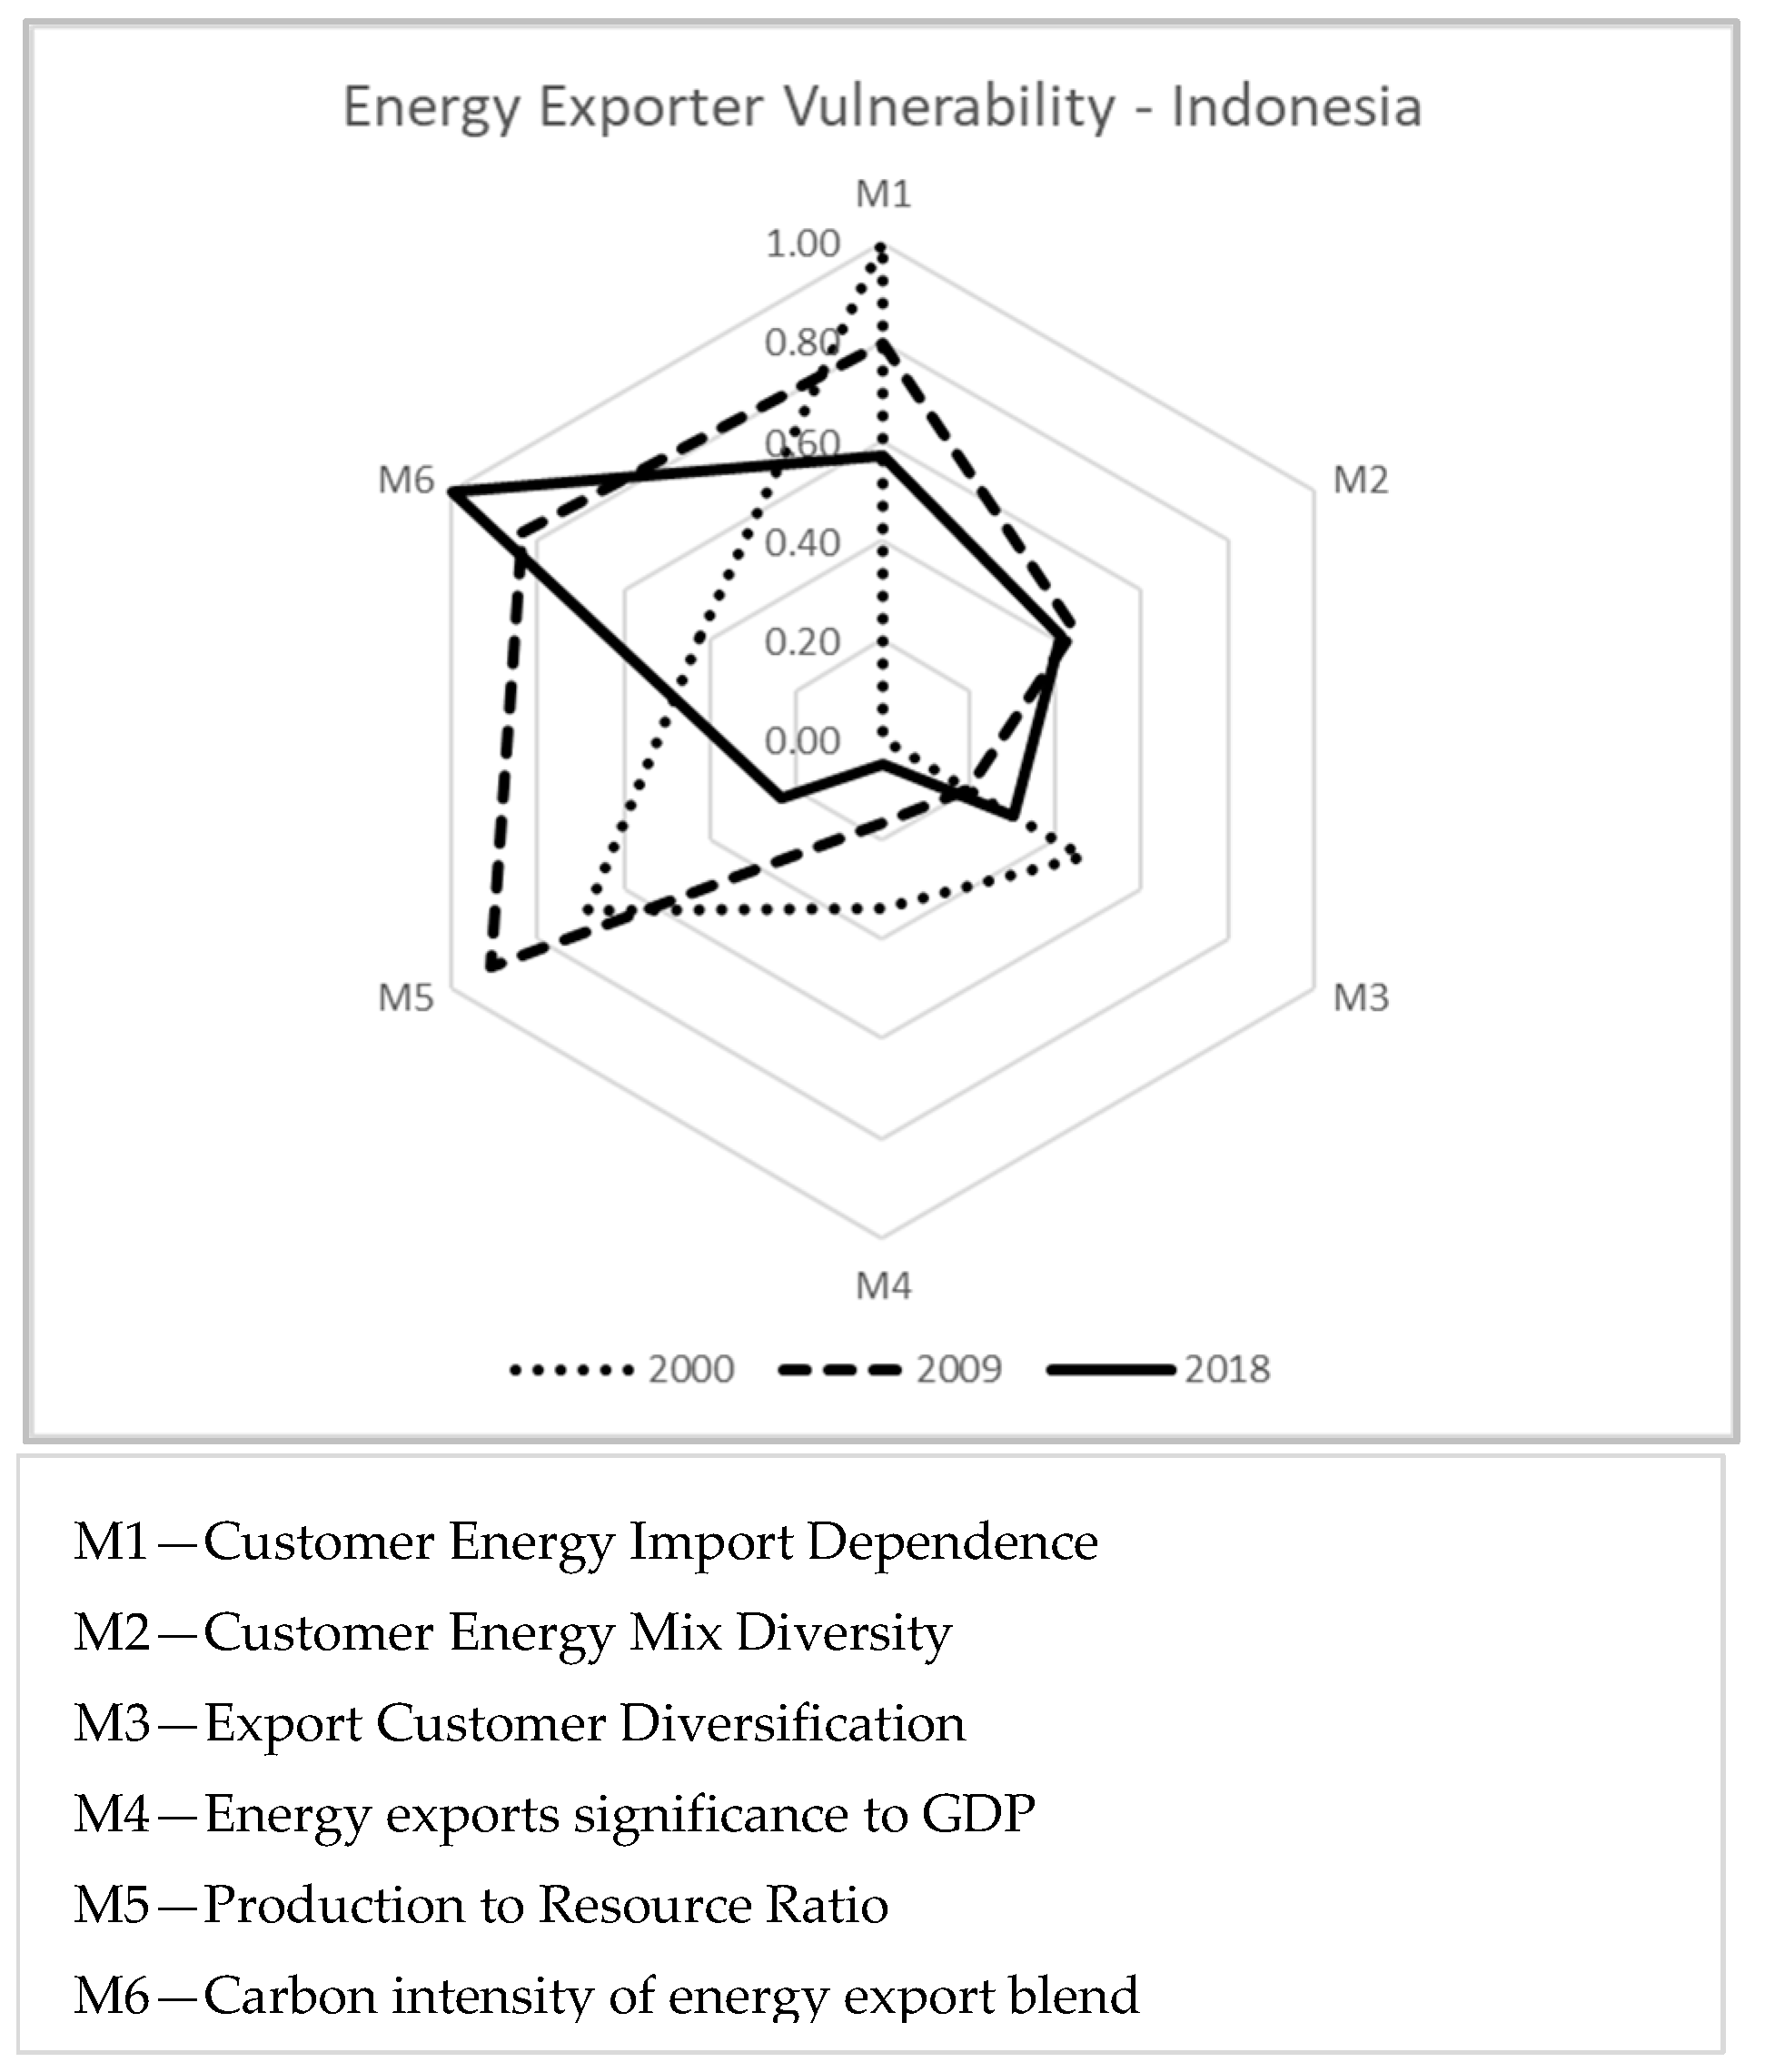
5.3. Indonesia
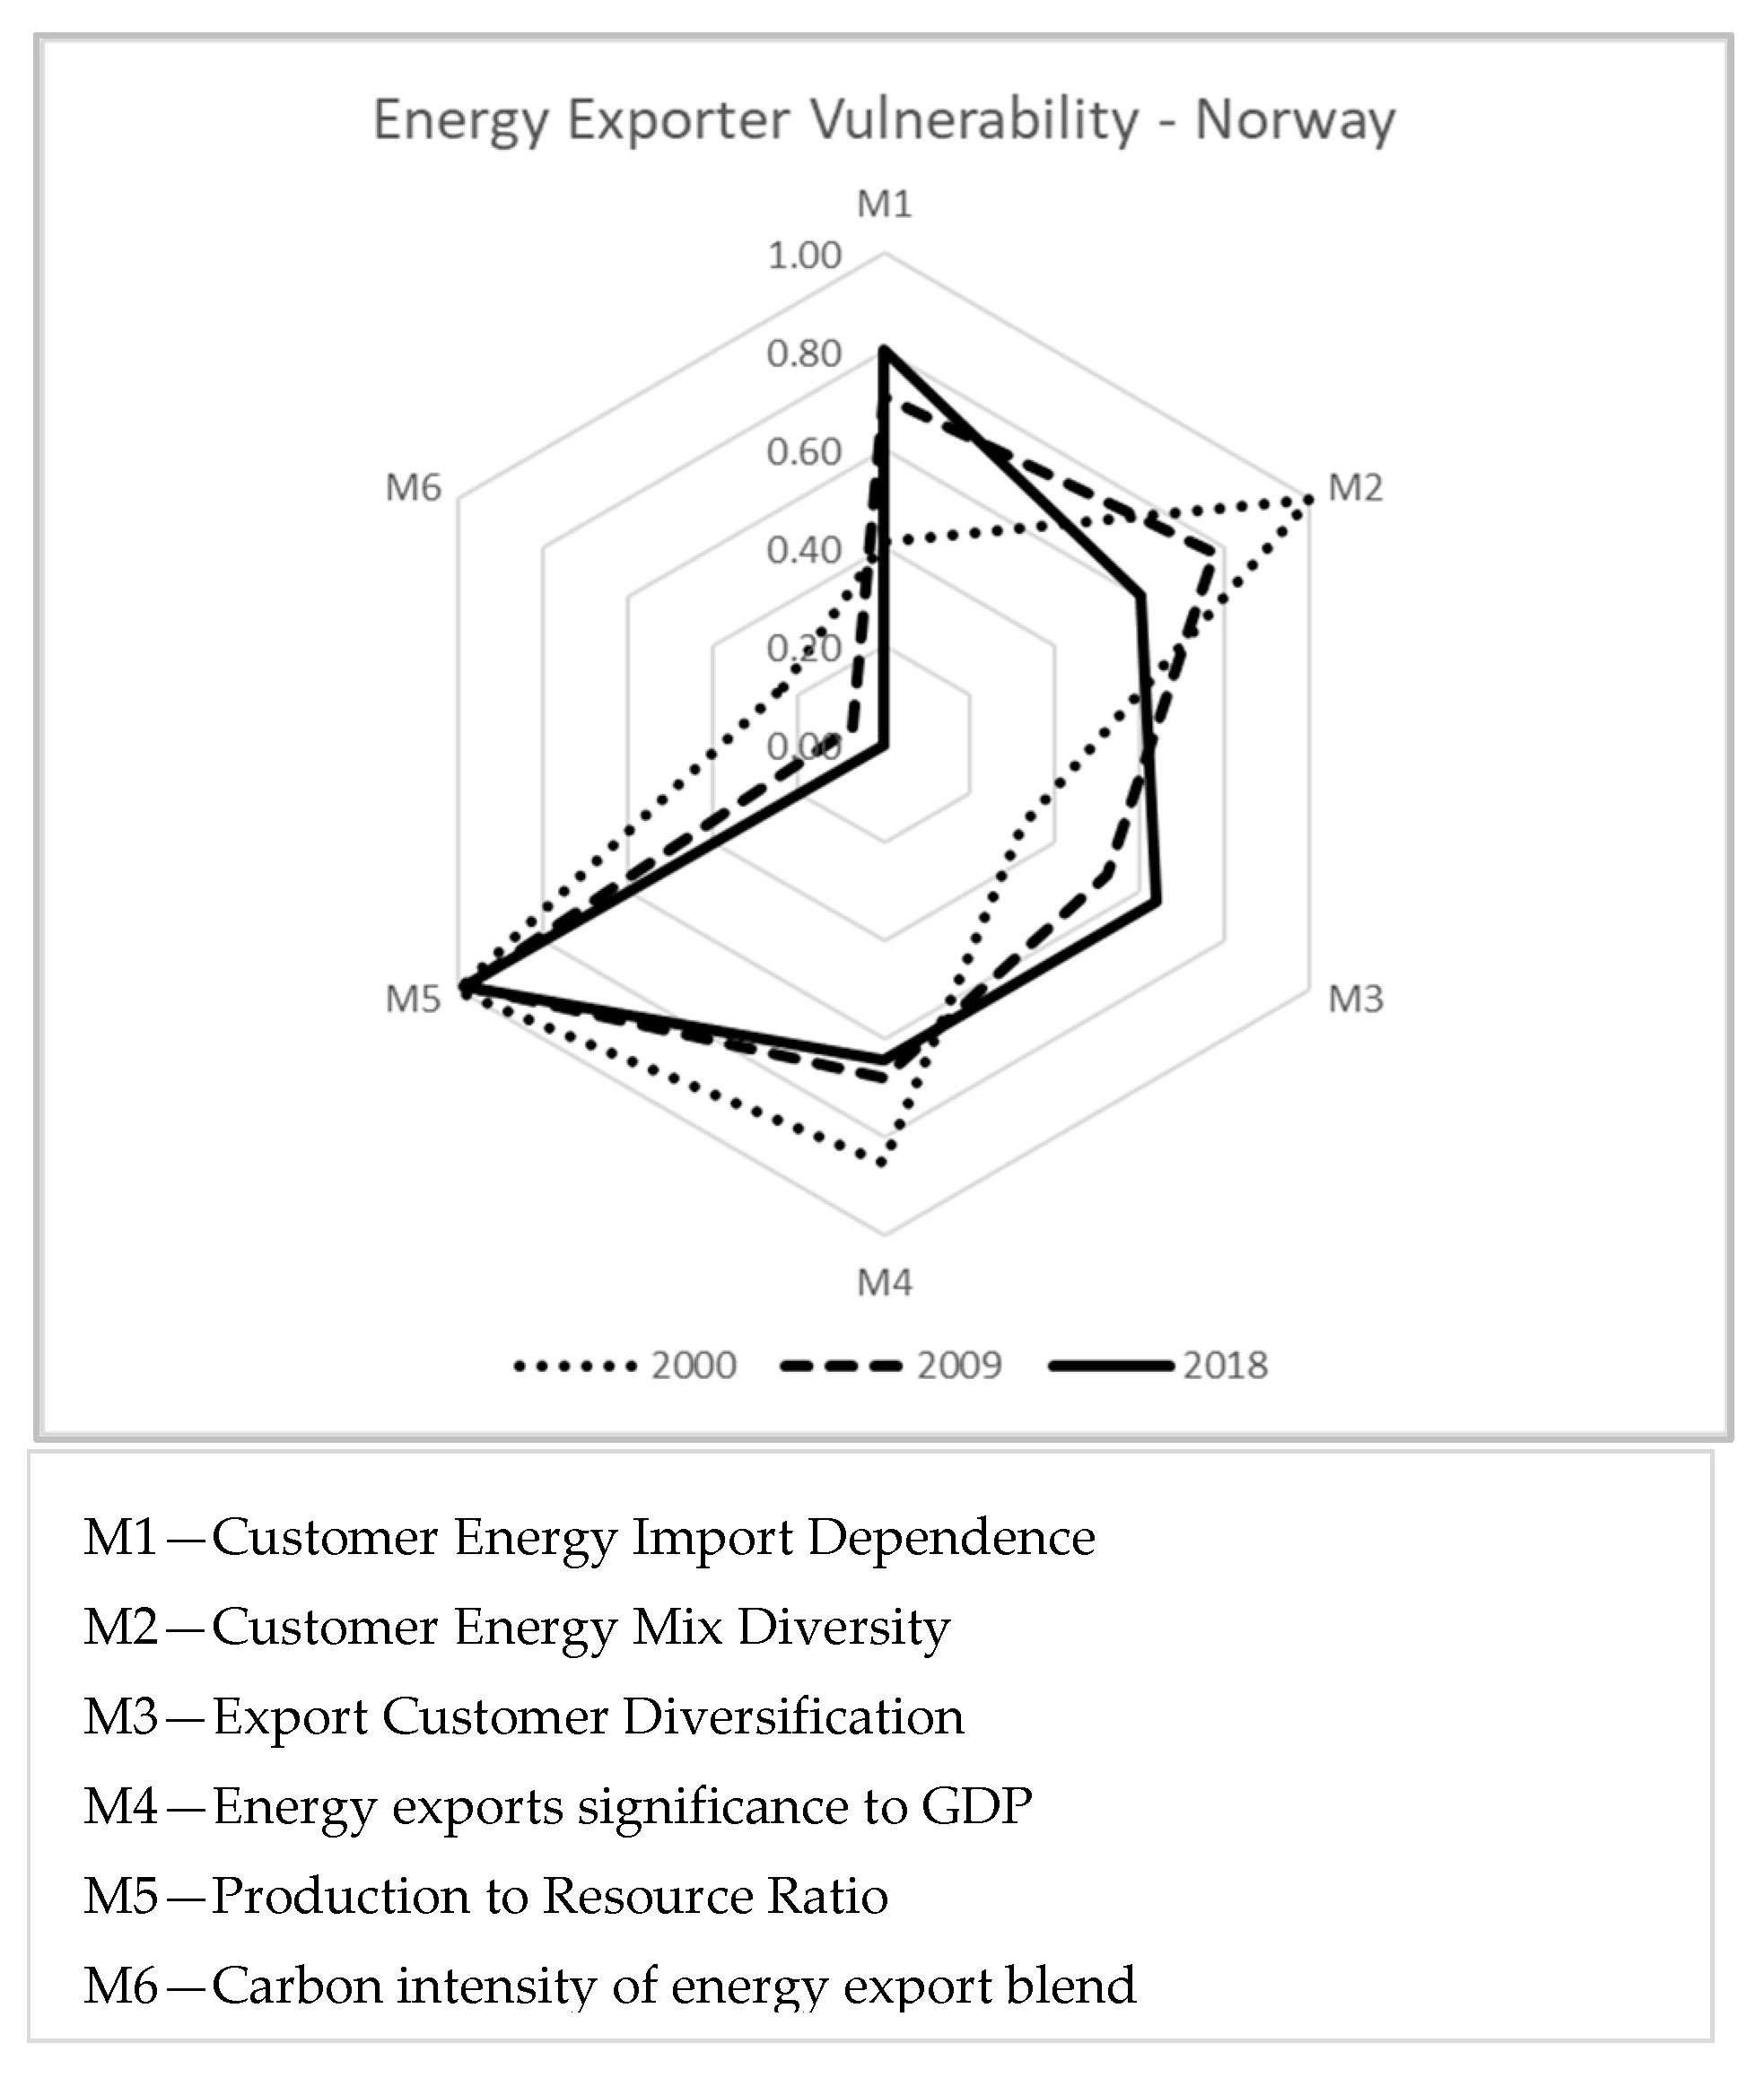
5.4. Norway
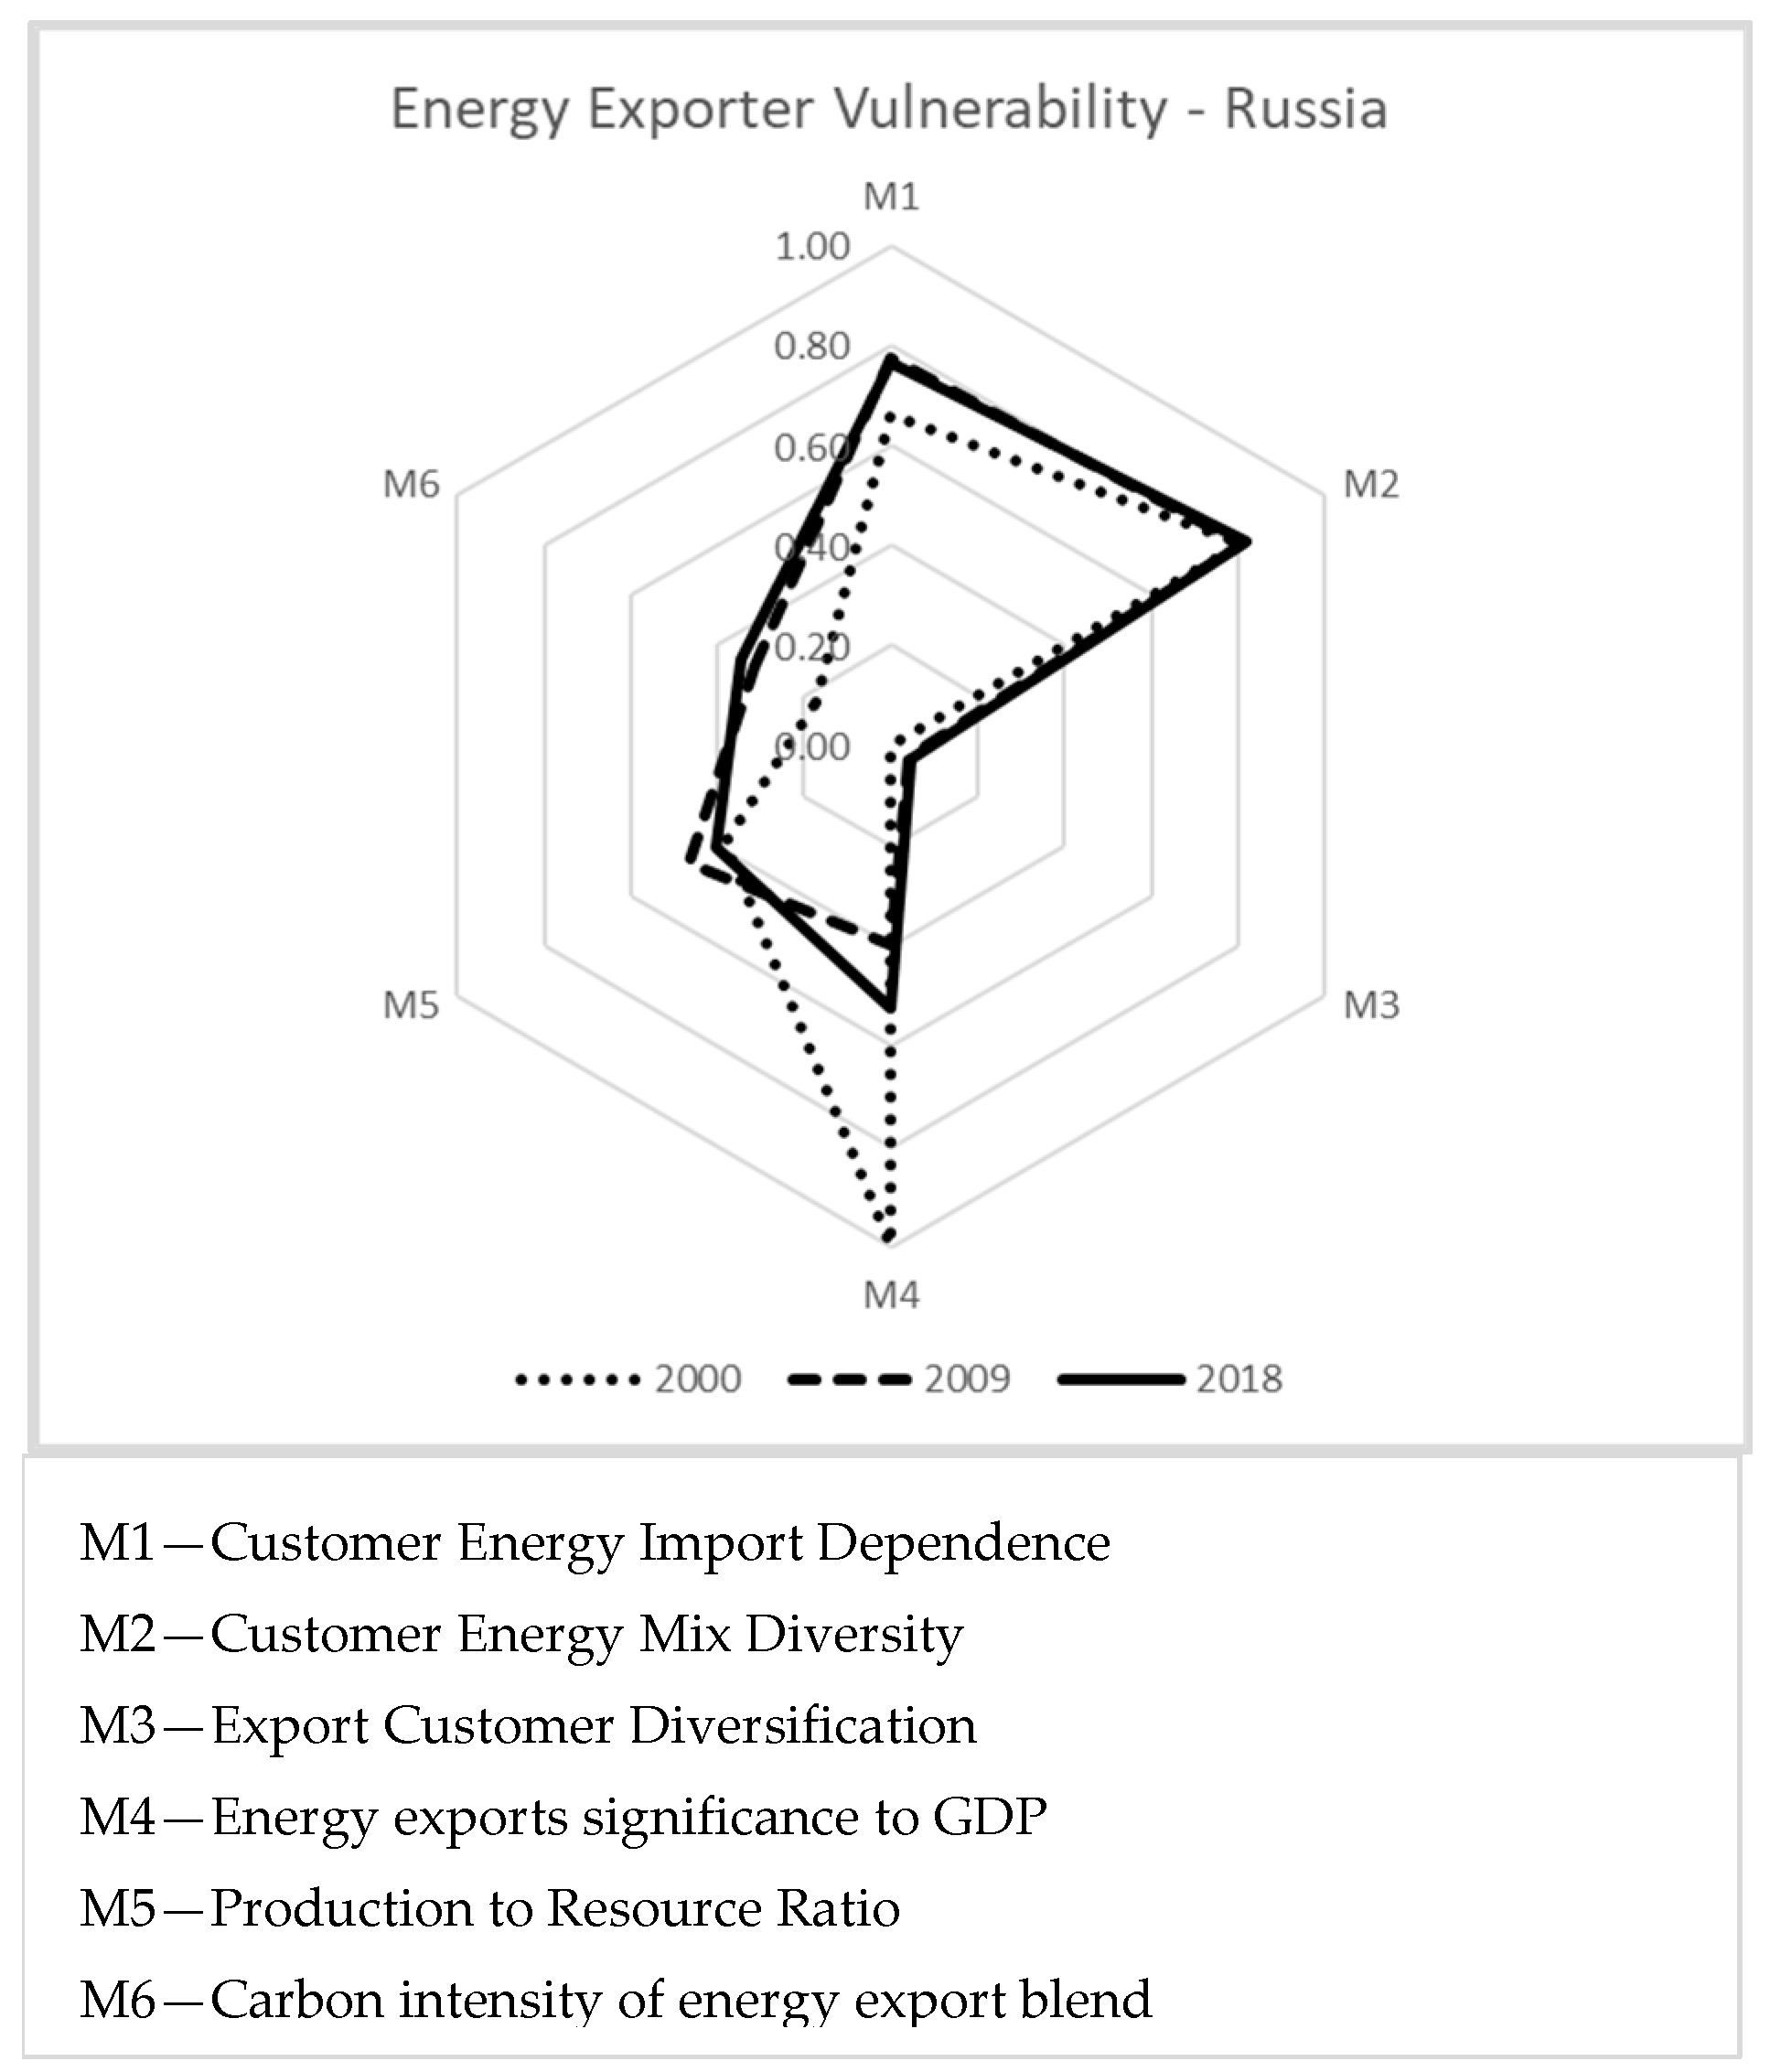
5.5. Russia
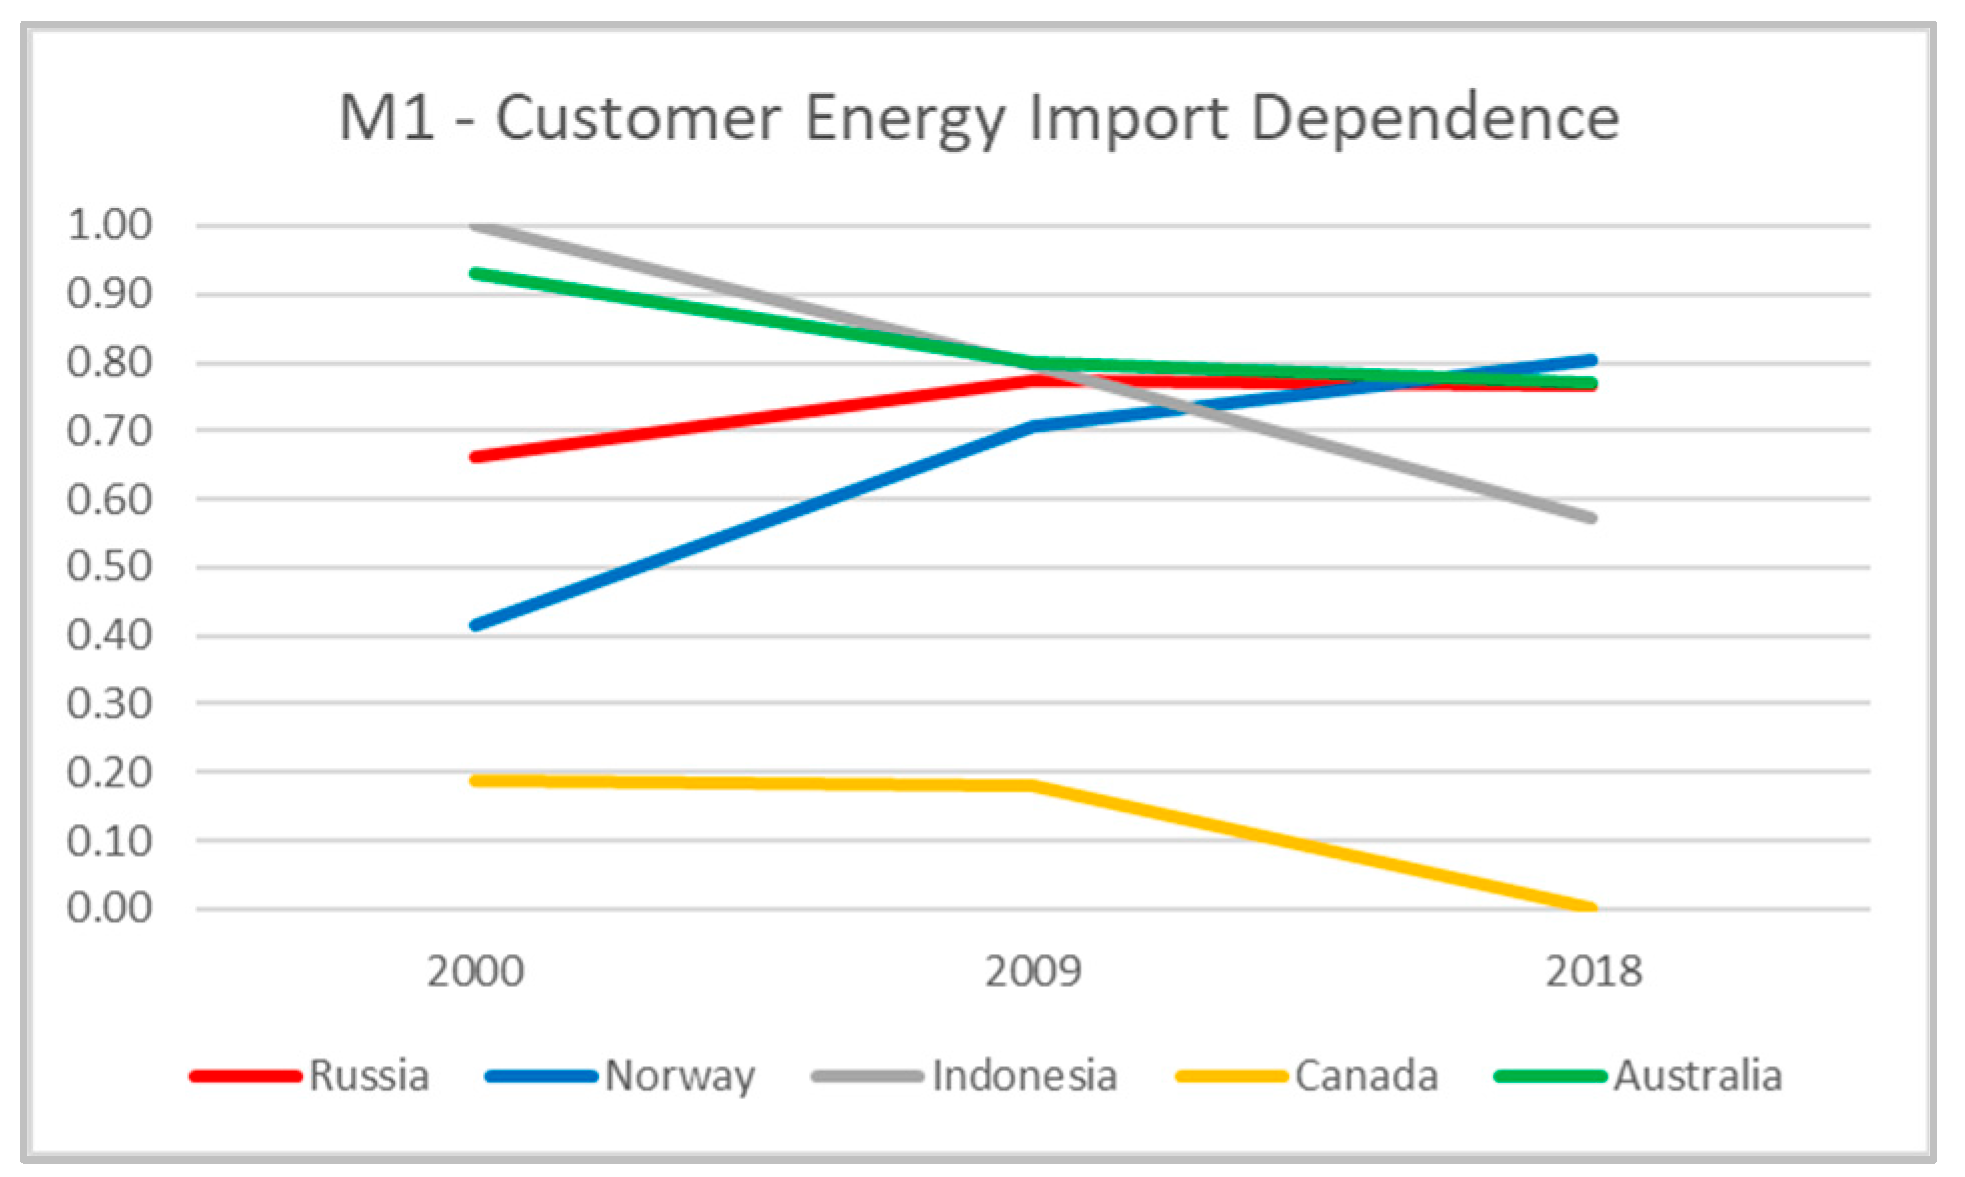
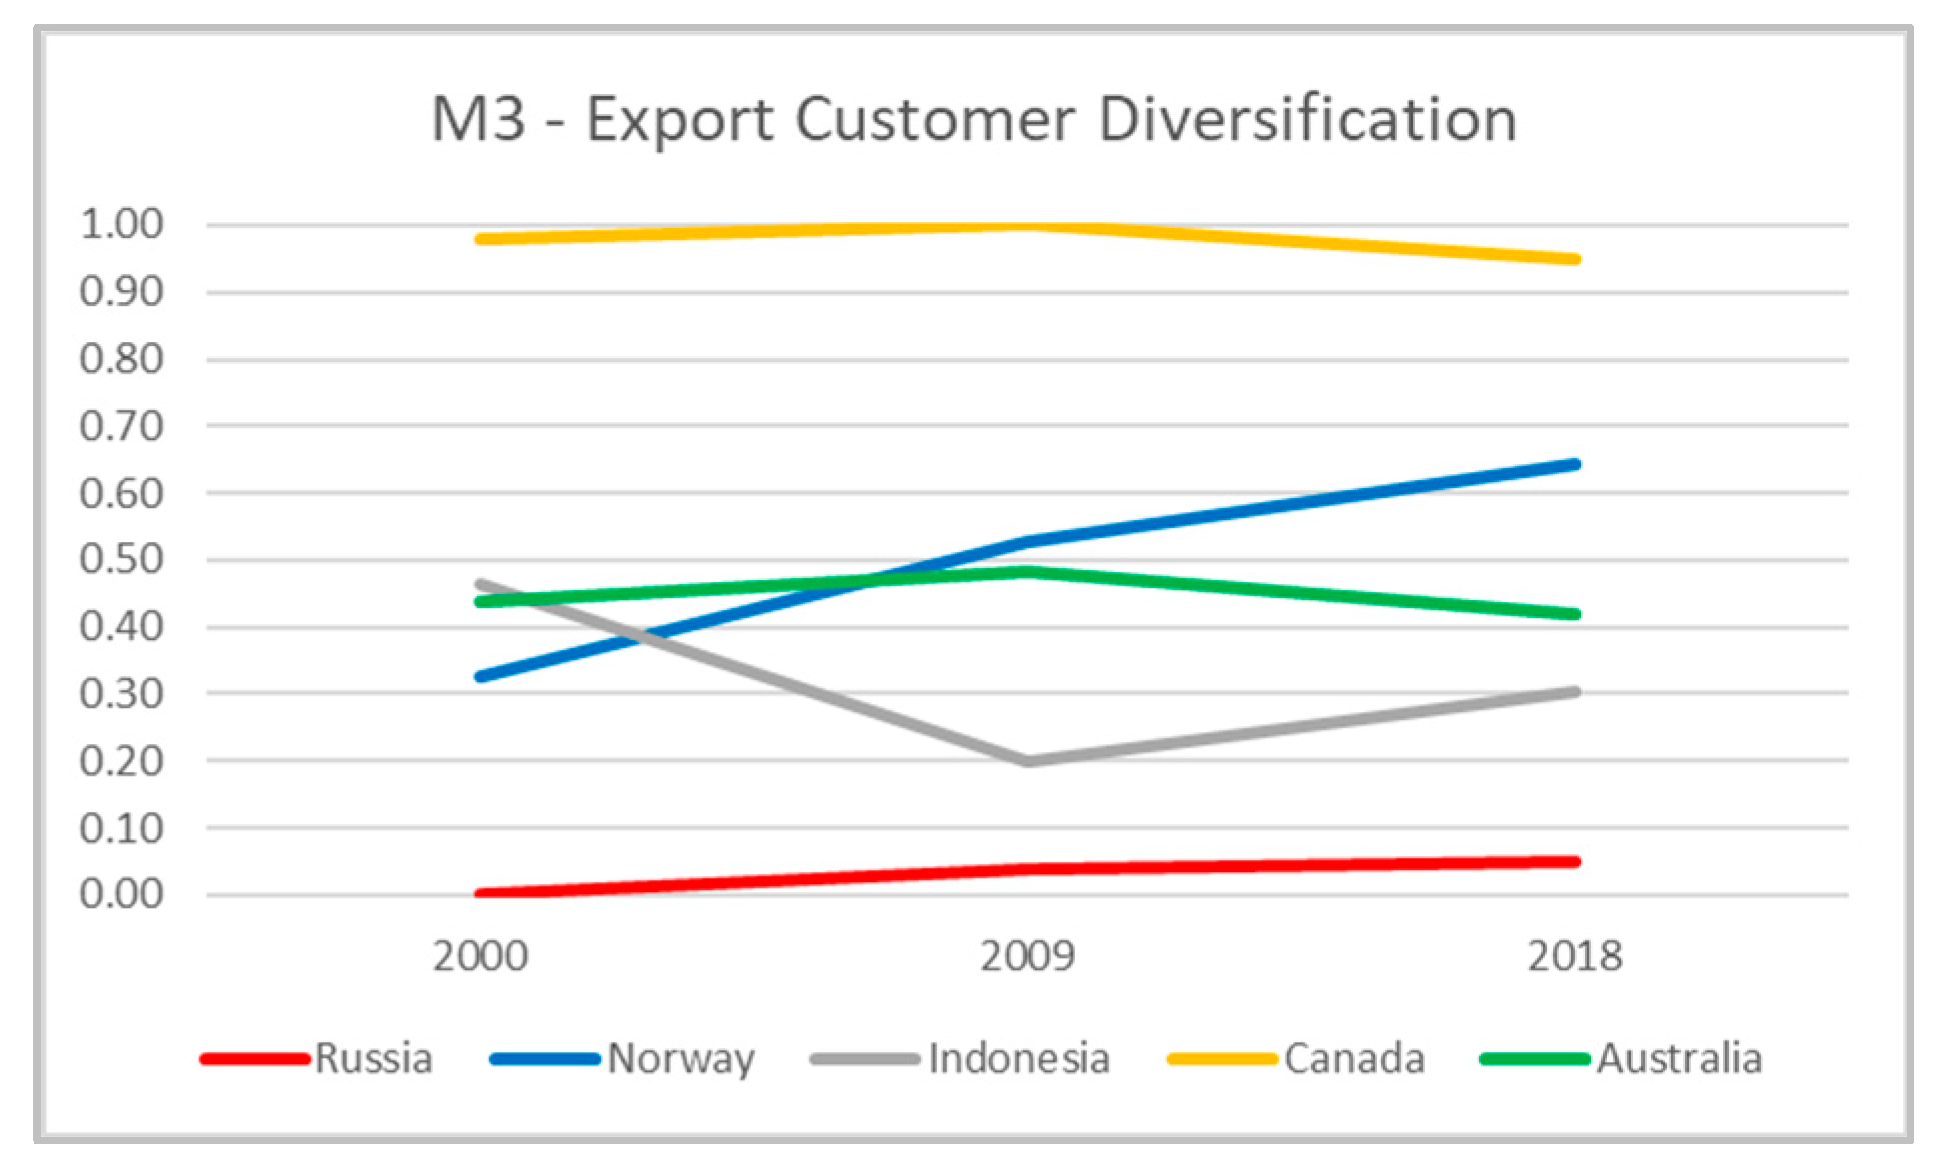
5.6. Metric Comparisons between Countries
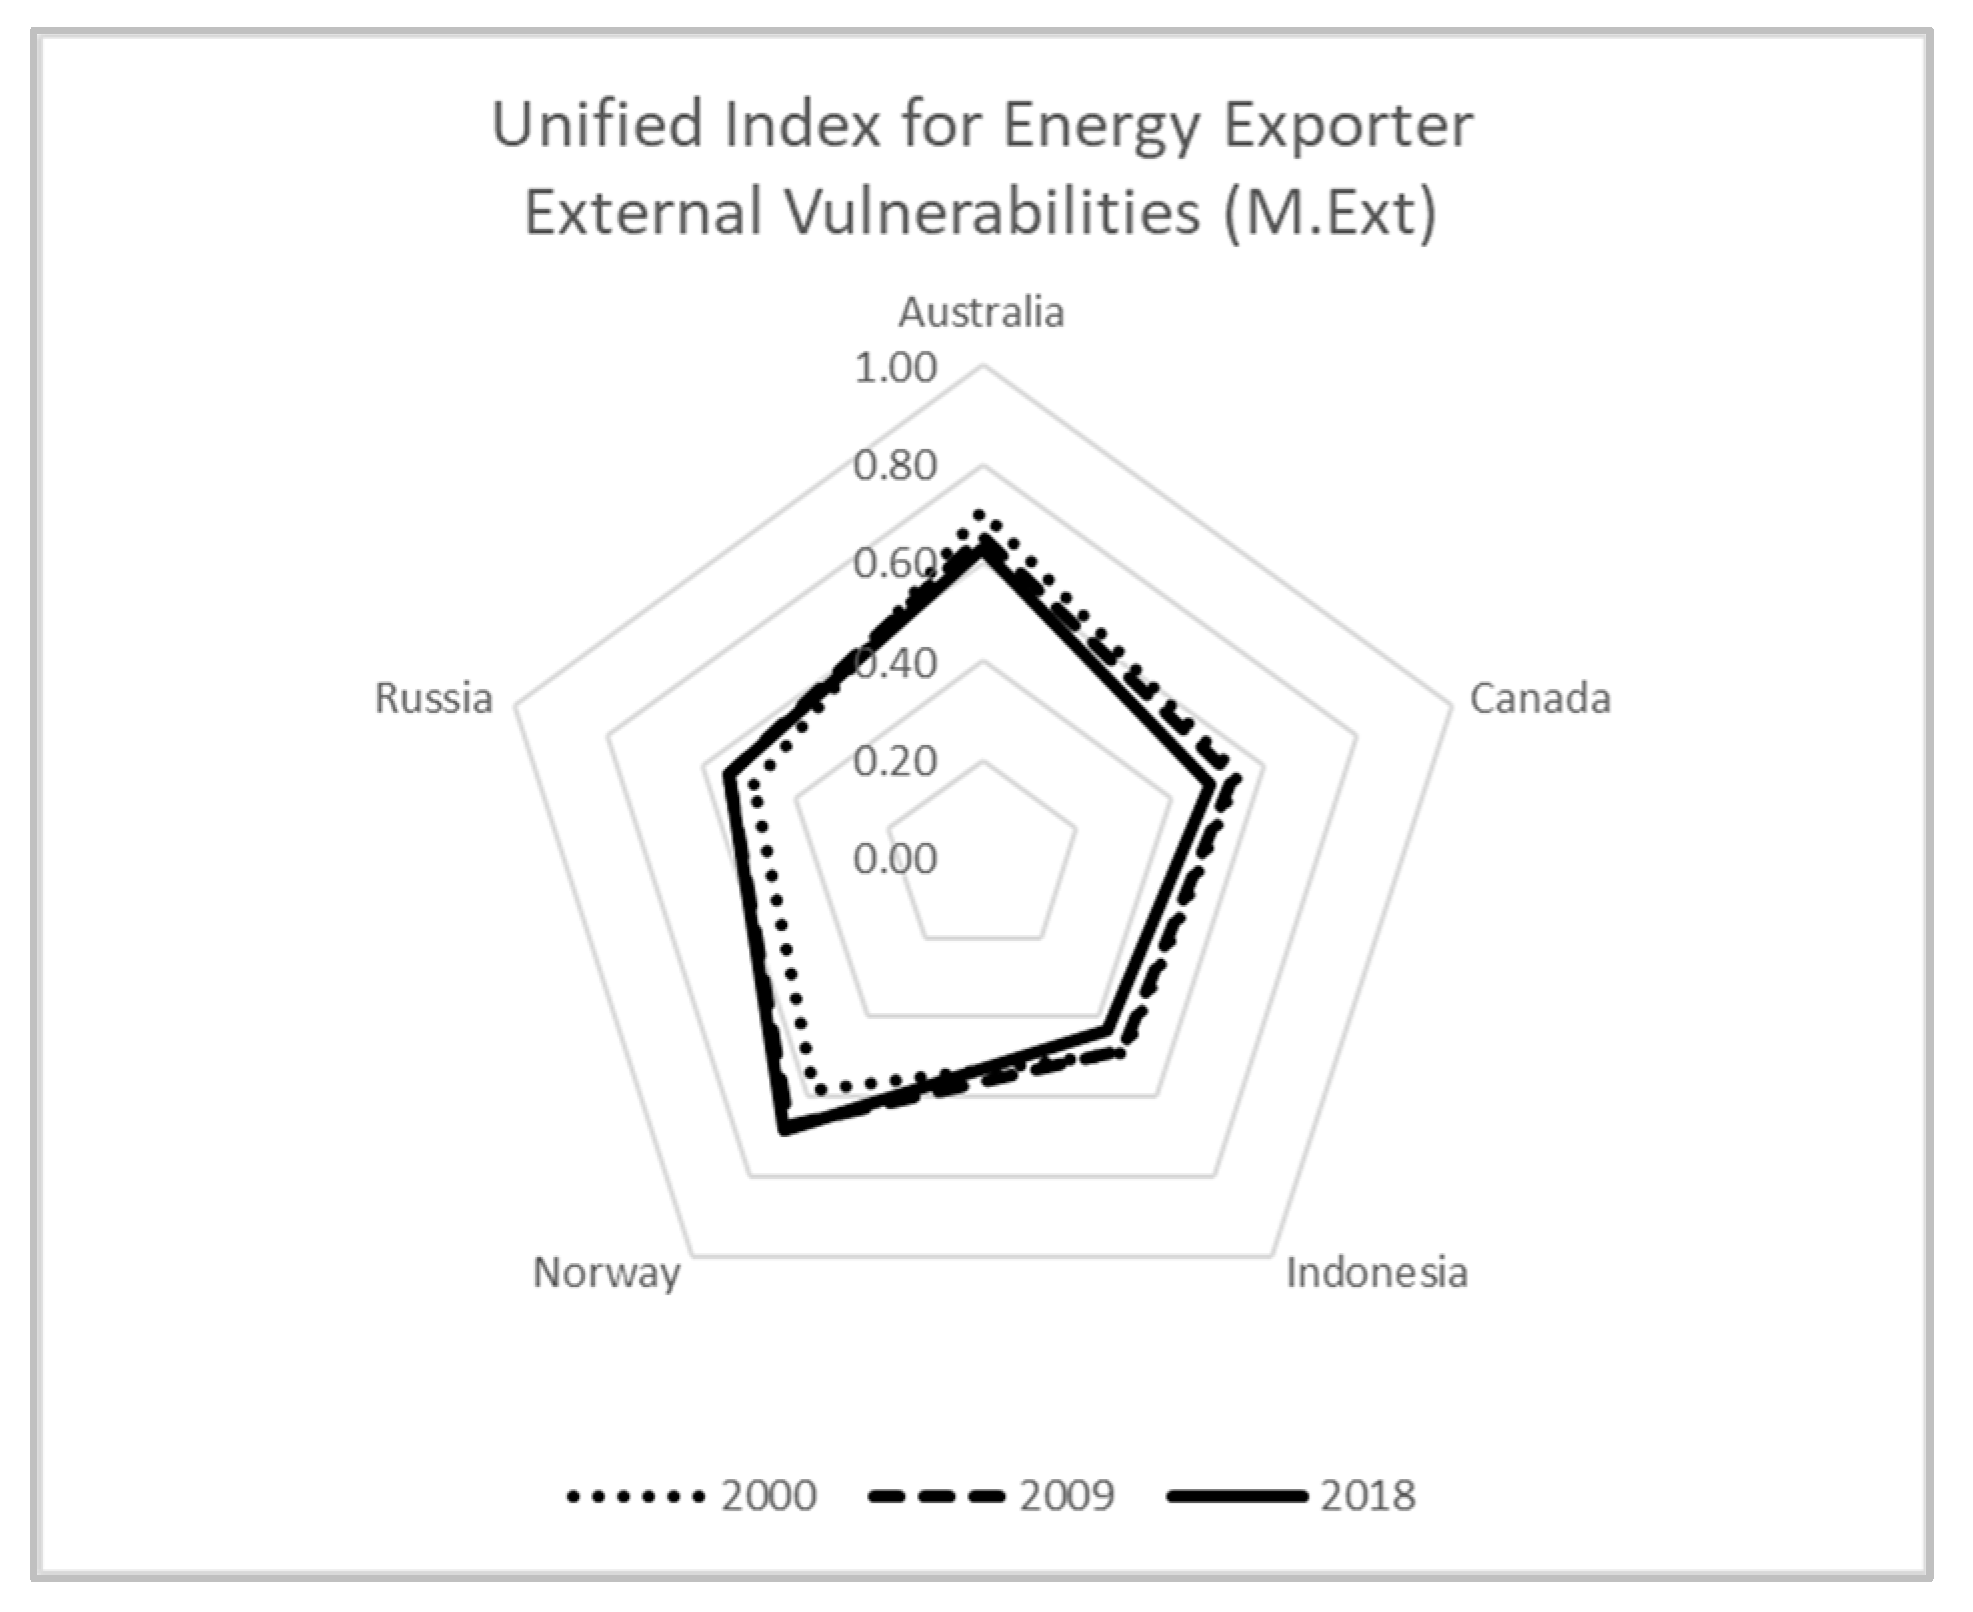
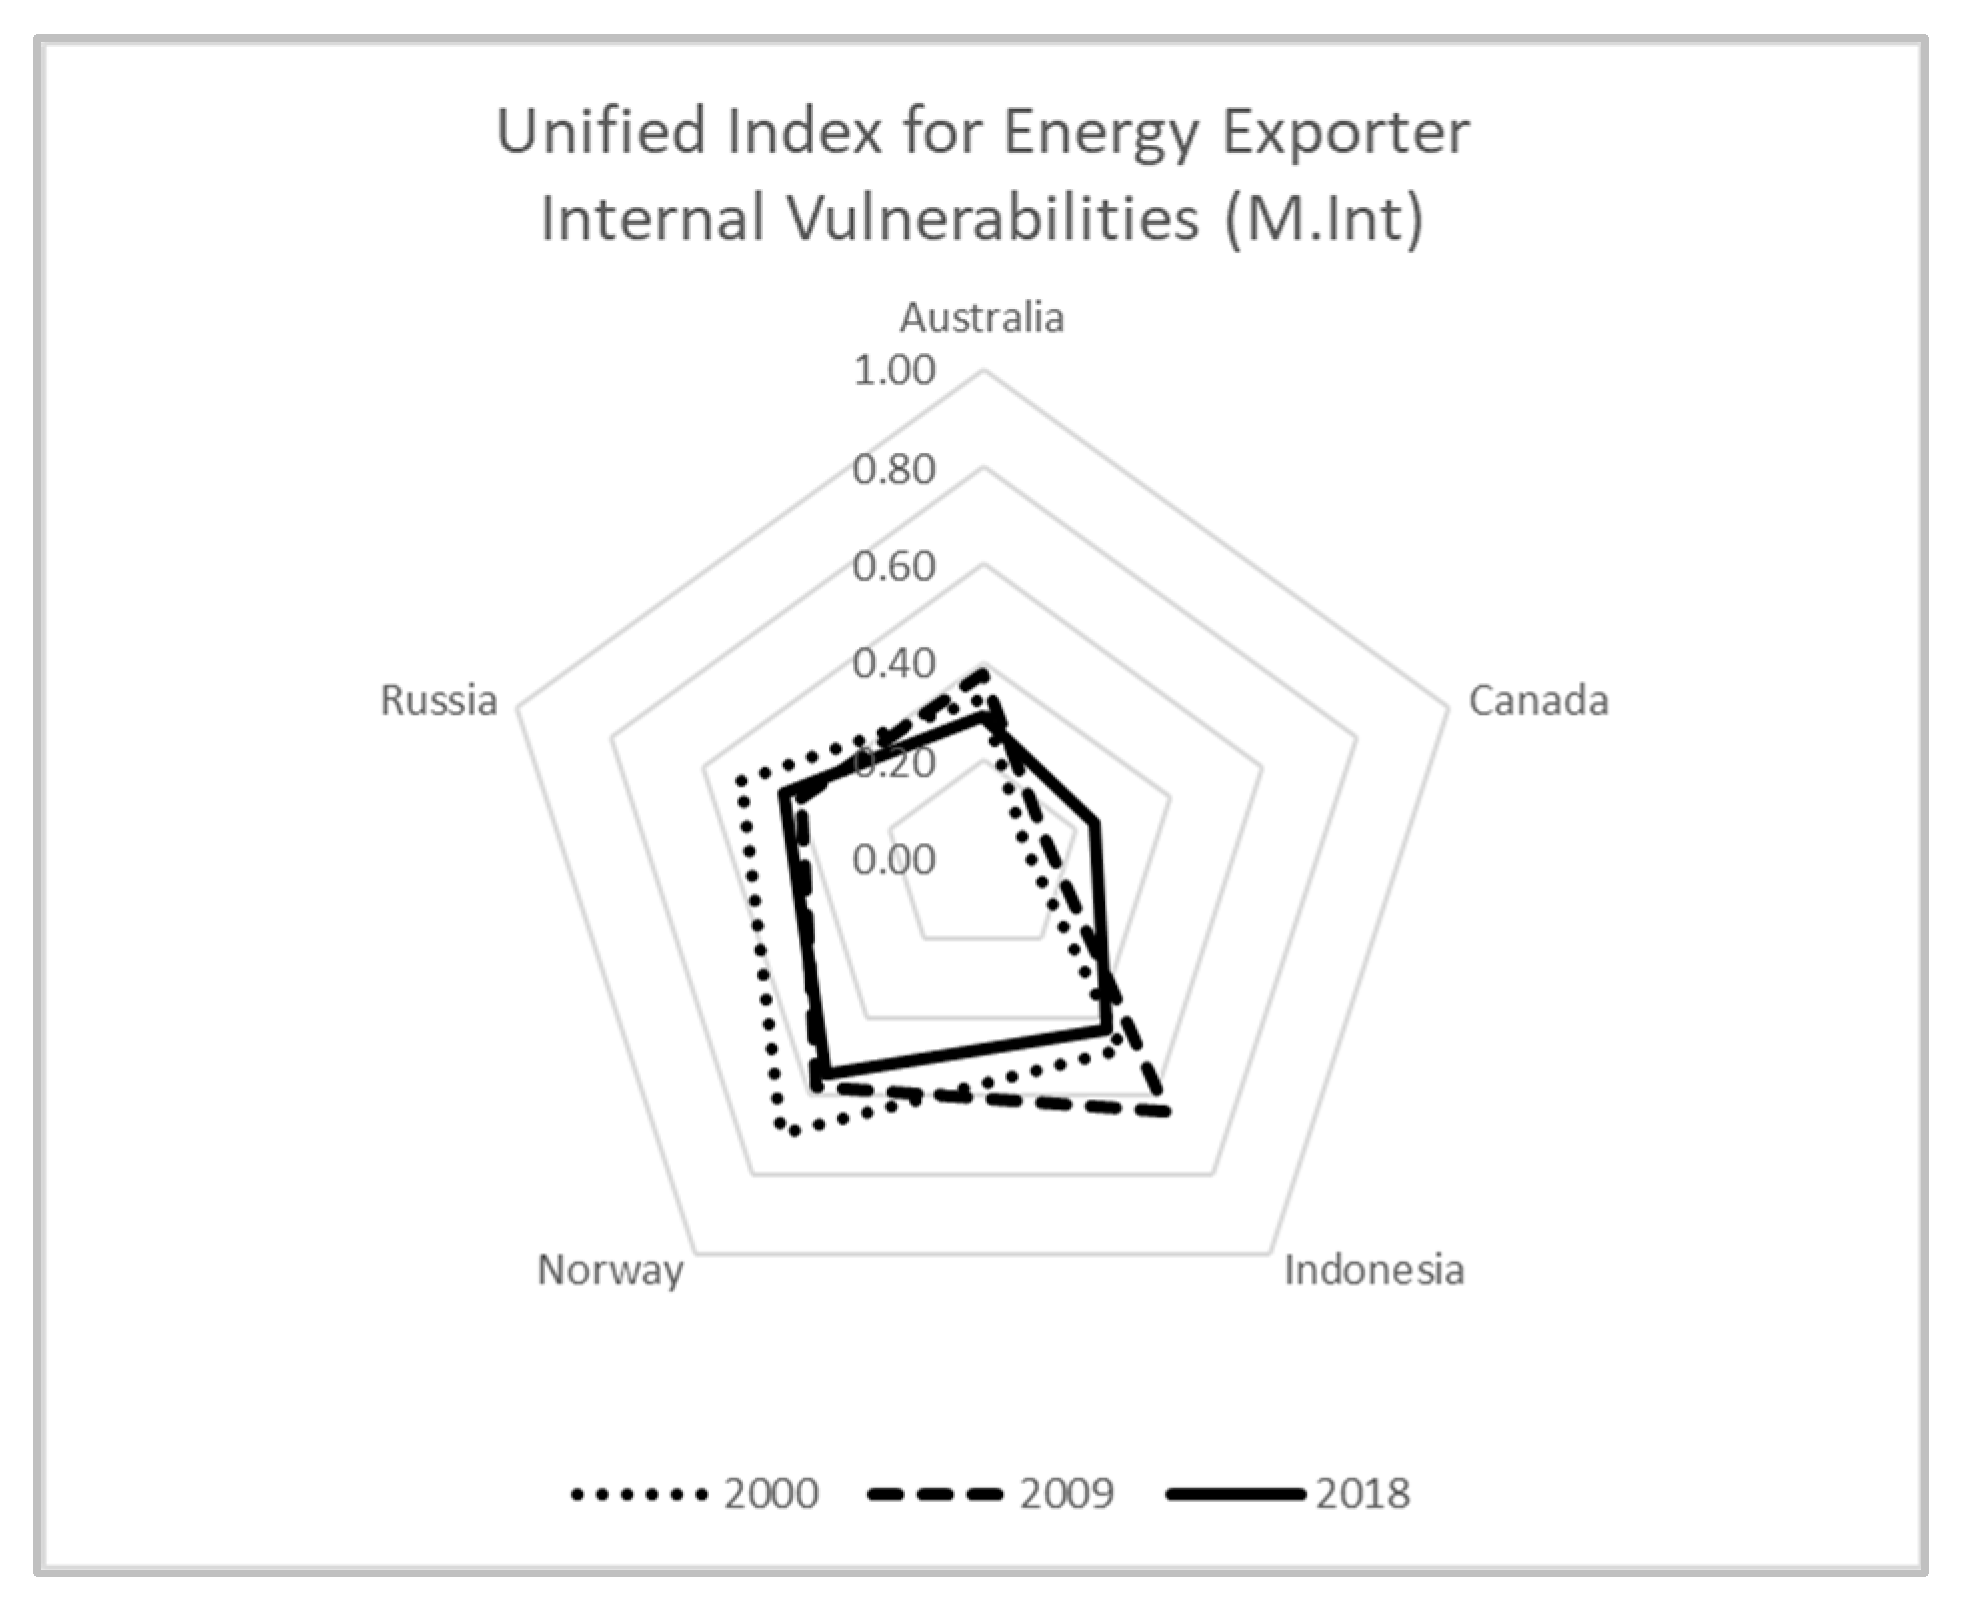
5.7. Unified Metrics

| 2000 | 2009 | 2018 | |
|---|---|---|---|
| Australia | 1.661 | 1.694 | 1.829 |
| Canada | 1.580 | 1.607 | 1.625 |
| Indonesia | 1.600 | 1.675 | 1.703 |
| Norway | 1.908 | 1.856 | 1.854 |
| Russia | 1.412 | 1.498 | 1.517 |
6. Conclusions
6.1. Limitations of the Framework
6.2. Policy Recommendations
Author Contributions
Funding
Data Availability Statement
Conflicts of Interest
References
- BP Statistical Review of World Energy. 2021. Available online: https://www.bp.com/en/global/corporate/energy-economics/statistical-review-of-world-energy.html (accessed on 7 September 2021).
- World Bank Open Data. Available online: https://data.worldbank.org/ (accessed on 7 September 2021).
- Murakami, T.; Motokura, M.; Kutani, I. An Analysis of Major Countries’ Energy Security Policies and Conditions—Quantitative Assessment of Energy Security Policies. IEEJ Energy J. 2011, 6. [Google Scholar]
- Ministry of Economy Trade and Industry Japan. Strategic Energy Plan. 2014. Available online: https://www.enecho.meti.go.jp/en/category/others/basic_plan/ (accessed on 7 September 2021).
- International Energy Agency and Korea Energy Economics Institute. Korea Electricity Security Review. 2021. Available online: https://www.iea.org/reports/korea-electricity-security-review (accessed on 7 September 2021).
- Badea, A.C. Energy Security Indicators EU JRC. Available online: http://www.drustvo-termicara.com/resources/files/7fa5460.pdf (accessed on 7 September 2022).
- International Energy Agency. Energy Balances Sankey. Available online: https://www.iea.org/data-and-statistics (accessed on 7 September 2021).
- Curtis, A.; McLellan, B. The Unique Characteristics of Energy Security for Energy Exporting Countries. In Japan Society of Energy and Resources Conference Proceedings; Japan Society of Energy and Resources: Osaka, Japan, 2018. [Google Scholar]
- Badeeb, R.A.; Lean, H.H.; Clark, J. The evolution of the natural resource curse thesis: A critical literature survey. Resour. Policy 2017, 51, 123–134. [Google Scholar] [CrossRef]
- Total Energies, Annual Report 2018. Available online: https://totalenergies.com/investors/publications-and-regulated-information/regulated-information/annual-financial-reports (accessed on 7 September 2022).
- Total Energies, Annual Report 2015. Available online: https://totalenergies.com/investors/publications-and-regulated-information/regulated-information/annual-financial-reports (accessed on 7 September 2022).
- International Energy Agency. The COVID-19 Crisis and Clean Energy Progress. 2020. Available online: https://www.iea.org/reports/the-covid-19-crisis-and-clean-energy-progress (accessed on 7 September 2021).
- Australian Energy Market Operator. About the National Electricity Market. Available online: https://www.aemo.com.au/energy-systems/electricity/national-electricity-market-nem/about-the-national-electricity-market-nem (accessed on 7 September 2021).
- International Energy Agency. Global EV Outlook 2020 Entering the Decade of Electric Drive? Available online: https://www.iea.org/reports/global-ev-outlook-2020 (accessed on 7 September 2021).
- Bhattacharyya, S.C.; Blake, A. Analysis of oil export dependency of MENA countries: Drivers, trends and prospects. Energy Policy 2010, 38, 1098–1107. [Google Scholar] [CrossRef]
- Dike, J.C. Measuring the security of energy exports demand in OPEC economies. Energy Policy 2013, 60, 594–600. [Google Scholar] [CrossRef]
- Kanchana, K.; McLellan, B.C.; Unesaki, H. Energy dependence with an Asian twist? Examining international energy relations in Southeast Asia. Energy Res. Soc. Sci. 2016, 21, 123–140. [Google Scholar] [CrossRef]
- Gupta, E. Oil vulnerability index of oil-importing countries. Energy Policy 2008, 36, 1195–1211. [Google Scholar] [CrossRef]
- Hansen, S.T.; Moe, E. Renewable energy expansion or the preservation of national energy sovereignty? Norwegian renewable energy policy meets resource nationalism. Polit. Geogr. 2022, 99, 102760. [Google Scholar] [CrossRef]
- Novikau, A. Rethinking demand security: Between national interests and energy exports. Energy Res. Soc. Sci. 2022, 87, 102494. [Google Scholar] [CrossRef]
- Karatayev, M.; Hall, S. Establishing and comparing energy security trends in resource-rich exporting na-tions (Russia and the Caspian Sea region). Resour. Policy 2020, 68, 101746. [Google Scholar] [CrossRef]
- Mayer, A. Fossil fuel dependence and energy insecurity. Energy Sustain. Soc. 2022, 12, 27. [Google Scholar] [CrossRef]
- Simshauser, P.; Nelson, T. Australia’s coal seam gas boom and the LNG entry result. Aust. J. Agric. Resour. Econ. 2015, 59, 602–623. [Google Scholar] [CrossRef]
- United Nations Department of Economic and Social Affairs. EVI Indicators. Department of Economic and Social Affairs. Available online: https://www.un.org/development/desa/dpad/least-developed-country-category/evi-indicators-ldc.html (accessed on 7 September 2021).
- Guillaumont, P. An Economic Vulnerability Index: Its Design and Use for International Development Policy. Oxf. Dev. Stud. 2008, 37, 193–228. [Google Scholar] [CrossRef]
- The World Bank. Gross National Income, GNI Per Capita Data. Available online: https://data.worldbank.org/indicator/ny.gnp.pcap.pp.cd (accessed on 7 September 2021).
- Fondation Pour Les Etudes et Recherches Sur le Developpement International. Human Assets Index. Available online: https://ferdi.fr/en/indicators/human-assets-index-hai (accessed on 7 September 2021).
- Cariolle, J. The Economic Vulnerability Index 2010 Update. Available online: https://www.researchgate.net/publication/261035539_The_Economic_Vulnerability_Index_2010_Update (accessed on 21 January 2019).
- Guillaumont, P. Measuring Structural Economic Vulnerability in Africa: A contribution to the Handbook of Africa and Economics. 2014. Available online: https://shs.hal.science/halshs-01110060 (accessed on 21 January 2018).
- Guillaumont, P. Assessing the Economic Vulnerability of Small Island Developing States and the Least De-veloped Countries. J. Dev. Stud. 2010, 46, 828–854. [Google Scholar] [CrossRef]
- Guillaumont, P.; Wagner, L. Aid and Growth Accelerations: Vulnerability Matters. 2012. Available online: https://www.econstor.eu/bitstream/10419/81057/1/689698038.pdf (accessed on 21 January 2021).
- Briguglio, L. Exposure to external shocks and economic resilience of countries: Evidence from global indicators. J. Econ. Stud. 2016, 43, 1057–1078. [Google Scholar] [CrossRef]
- Briguglio, L.; Cordina, G.; Farrugia, N.; Vella, S. Economic Vulnerability and Resilience: Concepts and Measurements. Oxf. Dev. Stud. 2009, 37, 229–247. [Google Scholar] [CrossRef]
- International Energy Agency. Energy Security and Climate Policy Assessing Interactions. Available online: www.iea.org/w/bookshop/pricing.html (accessed on 1 January 2007).
- Böhringer, C.; Bortolamedi, M. Sense and no(n)-sense of energy security indicators. Ecol. Econ. 2015, 119, 359–371. [Google Scholar] [CrossRef]
- Cherp, A. Defining energy security takes more than asking around. Energy Policy 2012, 48, 841–842. [Google Scholar] [CrossRef]
- Cherp, A.; Jewell, J. The concept of energy security: Beyond the four as. Energy Policy 2014, 75, 415–421. [Google Scholar] [CrossRef]
- Winzer, C. Conceptualizing energy security. Energy Policy 2012, 46, 36–48. [Google Scholar] [CrossRef]
- Chih, C.M.; Wen, M.H. An assessment of Taiwan’s energy policy using multi-dimensional energy security indicators. Renew. Sustain. Energy Rev. 2013, 17, 301–311. [Google Scholar]
- Gnansounou, E. Assessing the energy vulnerability: Case of industrialised countries. Energy Policy 2008, 36, 374–3744. [Google Scholar] [CrossRef]
- International Energy Agency. ENERGY SUPPLY SECURITY 2014 Emergency Response of IEA Countries. Available online: www.iea.org (accessed on 23 July 2020).
- International Atomic Energy Agency. Analyses of Energy Supply Options and Security of Energy Supply in the Baltic States; IAEA-TECDOC-1541; IAEA: Vienna, Austria, 2007. [Google Scholar]
- International Energy Agency. China’s Worldwide Quest for Energy Security. 2000. Available online: https://www.iea.org/reports/chinas-worldwide-quest-for-energy-security (accessed on 30 November 2019).
- Kanchana, K.; Unesaki, H. Assessing Energy Security Using Indicator-Based Analysis: The Case of ASEAN Member Countries. Soc. Sci. 2015, 4, 1269–1315. [Google Scholar] [CrossRef]
- Kisel, E.; Hamburg, A.; Härm, M.; Leppiman, A.; Ots, M. Concept for Energy Security Matrix. Energy Policy 2016, 95, 1–9. [Google Scholar] [CrossRef]
- Gelengul, K. International Energy Security Indicators and Turkey’s Energy Security Risk Score. Int. J. Energy Econ. Policy 2014, 4, 735–743. [Google Scholar]
- Sovacool, B.K.; Mukherjee, I. Conceptualizing and measuring energy security: A synthesized approach. Energy 2011, 36, 5343–5355. [Google Scholar] [CrossRef]
- Sovacool, B.K. The methodological challenges of creating a comprehensive energy security index. Energy Policy 2012, 48, 835–840. [Google Scholar] [CrossRef]
- Sovacool, B.K. Evaluating energy security in the Asia pacific: Towards a more comprehensive approach. Energy Policy 2011, 39, 7472–7479. [Google Scholar] [CrossRef]
- Lee, M.; Park, D.; Saunders, H.D. Asia’s Energy Challenge: Key Issues and Policy Options. 2014. Available online: https://think-asia.org/handle/11540/4407 (accessed on 30 November 2019).
- Löschel, A.; Moslener, U.; Rübbelke, D.T.G. Indicators of energy security in industrialised countries. Energy Policy 2010, 38, 1665–1671. [Google Scholar] [CrossRef]
- Kruyt, B.; van Vuuren, D.P.; de Vries, H.J.M.; Groenen, H. Indicators for energy security. Energy Policy 2009, 37, 2166–2181. [Google Scholar] [CrossRef]
- Martchamadol, J.; Kumar, S. An aggregated energy security performance indicator. Appl Energy 2013, 103, 653–670. [Google Scholar] [CrossRef]
- Martchamadol, J.; Kumar, S. Thailand’s energy security indicators. Renew. Sustain. Energy Rev. 2012, 16, 6103–6122. [Google Scholar] [CrossRef]
- Ministry of Economy Trade and Industry Japan Agency for Natural Resources and Energy, FY2015 Annual Report on Energy (Energy White Paper 2016). 2016. Available online: https://www.enecho.meti.go.jp/en/category/whitepaper/pdf/0517_01.pdf (accessed on 10 February 2017).
- Ministry of Economy Trade and Industry Japan Agency for Natural Resources and Energy, FY2014 Annual Report on Energy (Energy White Paper 2015). 2015. Available online: https://www.enecho.meti.go.jp/en/category/whitepaper/pdf/2015_outline.pdf (accessed on 10 February 2017).
- Portugal-Pereira, J.; Esteban, M. Implications of paradigm shift in Japan’s electricity security of supply: A multi-dimensional indicator assessment. Appl. Energy. 2014, 123, 424–434. [Google Scholar] [CrossRef]
- Scheepers, M.; Seebregts, A.; de Jong, J.; Maters, H. Updates on the Crisis Capability Index and the Sup-ply/Demand Index Quantification for EU-27. 2007. Available online: www.ecn.nlwww.clingendael.nl/ciepclingendaelinternationalenergyprogramme (accessed on 22 July 2017).
- Tongsopit, S.; Kittner, N.; Chang, Y.; Aksornkij, A.; Wangjirani, W. Energy security in ASEAN: A quantitative approach for sustainable energy policy. Energy Policy 2016, 90, 60–72. [Google Scholar] [CrossRef]
- Frondel, M.; Schmidt, C.M. A measure of a nation’s physical energy supply risk. Q. Rev. Econ. Financ. 2014, 54, 208–215. [Google Scholar] [CrossRef]
- Peabody Energy, Annual Report 2014. Available online: https://www.peabodyenergy.com/Investor-Info/Shareholder-Information/Annual-Report (accessed on 23 July 2017).
- Peabody Energy, Annual Report 2013. Available online: https://www.peabodyenergy.com/Investor-Info/Shareholder-Information/Annual-Report (accessed on 23 July 2017).
- Rio Tinto, Annual Report 2015. Available online: https://www.riotinto.com/invest/reports (accessed on 23 July 2017).
- Rio Tinto, Annual Report 2013. Available online: https://www.riotinto.com/invest/reports (accessed on 23 July 2017).
- Shell, Annual Report 2019. Available online: https://reports.shell.com/annual-report/2019/ (accessed on 27 August 2021).
- Shell, Annual Report 2016. Available online: https://reports.shell.com/annual-report/2016/ (accessed on 27 August 2021).
- Yanagisawa, A. Population Decline and Electricity Demand in Japan: Myth and Facts. 2015. Available online: https://eneken.ieej.or.jp/data/6154.pdf (accessed on 7 August 2019).
- Ministry of Economy Trade and Industry Japan, LNG Import Data. April 2017. Available online: www.meti.go.jp/press/2017/04/20170403001/20170403001-1.pdf (accessed on 20 March 2018).
- Japan Customs Agency, LNG Imports—The 4 Ports in Tokyo Bay that Support Japan’s Energy. January 2018. Available online: https://www.customs.go.jp/yokohama/toukei/topics/data/1801lng.pdf (accessed on 15 March 2018).
- Ports.com. Sea Route & Distance. Available online: http://ports.com/sea-route/ (accessed on 15 March 2018).
- World Nuclear Association. Economics of Nuclear Power. Available online: https://world-nuclear.org/information-library/economic-aspects/economics-of-nuclear-power.aspx (accessed on 17 July 2021).
- OECD Nuclear Energy Agency. The Economics of the Nuclear Fuel Cycle. 1994. Available online: https://www.oecd-nea.org/ndd/reports/efc/EFC-complete.pdf (accessed on 17 July 2021).
- Ministry of Economy Trade and Industry Japan, Report on Analysis of Generation Costs. 2015. Available online: https://masireqtesad.ir/wp-content/uploads/2018/09/Report-on-Analysis-of-Generation-Costs.pdf (accessed on 22 July 2017).
- Markets Insider—Commodity Prices (Uranium, Coal). Available online: https://markets.businessinsider.com/commodities (accessed on 17 July 2021).
- World Nuclear Association. Nuclear Power Economics—Uranium Enrichment. Available online: https://www.world-nuclear.org/information-library/nuclear-fuel-cycle/conversion-enrichment-and-fabrication/uranium-enrichment.aspx (accessed on 17 July 2021).
- Massachusetts Institute of Technology. Nuclear Energy Economics and Policy Analysis—The Economics of the Nuclear Fuel Cycle. Available online: https://ocw.mit.edu/courses/nuclear-engineering/22-812j-managing-nuclear-technology-spring-2004/lecture-notes/lec14slides.pdf (accessed on 17 July 2021).
- Intergovernmental Panel on Climate Change. Emissions Factor Database. Available online: https://www.ipcc-nggip.iges.or.jp/EFDB/main.php (accessed on 27 August 2021).
- Juhrich, K. CO2 Emission Factors for Fossil Fuels, Emissions Situation (Section I 2.6). Ger. Environ. Agency 2016, 28, 2016. [Google Scholar]
- Kainou, K. Recommendation of Draft Revised Standard Calorific Value and Carbon Emission Factor for Fossil Fuel Energy Sources in Japan. 2014. Available online: https://www.rieti.go.jp/users/kainou-kazunari/14j047_e.pdf (accessed on 27 August 2021).
- Burck, J.; Hagen, U.; Bals, C.; Hohne, N.; Nascimento, L.; Essop, T. Climate Change Performance Index 2021 Results. Available online: https://ccpi.org/download/the-climate-change-performance-index-2021/ (accessed on 1 September 2021).
- The Climate Action Tracker. Available online: https://climateactiontracker.org/about/ (accessed on 1 September 2021).
- The Climate Transparency Report 2020. Available online: https://www.climate-transparency.org/g20-climate-performance/the-climate-transparency-report-2020#1531904263713-04b62b8d-e708 (accessed on 3 August 2021).
- United Nations Sustainable Development Goals—Take Urgent Action to Combat Climate Change and its Impacts. Available online: https://sdgs.un.org/goals/goal13 (accessed on 5 August 2021).
- Wu, T.Y.; Rai, V. The Full Cost of Electricity—Quantifying Diversity of Electricity Generation in the U.S. Available online: https://energy.utexas.edu/sites/default/files/UTAustin_FCe_Quantifying_Diversity_2018_Feb.pdf (accessed on 23 August 2021).
- Stirling, A. A General Framework for Analysing Diversity in Science, Technology and Society. J. R. Soc. 2007, 4, 707–719. [Google Scholar] [CrossRef]
- Stirling, A. Diversity and Ignorance in Electricity Supply Investment. Energy Policy 1994, 22, 195–216. [Google Scholar] [CrossRef]
- The World Bank. Worldwide Governance Indicators. Available online: https://info.worldbank.org/governance/wgi/ (accessed on 23 July 2021).
- Kaufmann, D.; Kraay, A.; The, M.M.; Bank, W. The Worldwide Governance Indicators Methodology and Analytical Issues. 2010. Available online: https://www.govindicators.org (accessed on 14 March 2021).
- Shell. Tight and Shale Gas Technology. Available online: https://www.shell.com/energy-and-innovation/natural-gas/tight-and-shale-gas/tight-and-shale-gas-technology.html (accessed on 12 August 2021).
- Roarty, M. The Development of Australia’s Coal Seam Gas Resources. Available online: https://www.aph.gov.au/About_Parliament/Parliamentary_Departments/Parliamentary_Library/pubs/BN/2011-2012/CoalSeamGas (accessed on 29 July 2021).
- BP Statistical Review of World Energy 2016. 2016. Available online: http://www.bp.com/statisticalreview?utm_source=PressRelease&utm_medium=Web&utm_content=&utm_campaign=SR2016 (accessed on 22 July 2017).


| Indicators for Energy Trading Exposure (Kanchana et al.) | |
|---|---|
| Sensitivity to external dependence | |
| X1 | share of net energy imports to primary energy mix |
| X2 | share of energy import expenditures to GDP |
| X3 | energy export to energy production ratio |
| X4 | share of energy export revenues to GDP |
| Exposure to geopolitical uncertainty | |
| X5 | diversity of energy trade partners, measured with the Herfindahl-Hirschmann Index (HHI) |
| X6 | political stability of major energy trade partners, assessed using the Gupta method [18] |
| Tolerance and resilience to dependence | |
| X7 | openness to global energy trade |
| X8 | diversity of primary energy mix, measured with the Shannon Wienner Index (SWI) |
| X9 | domestic reserves to production ratio |
| X10 | energy self sufficiency |
| X11 | diversity of energy trade partners, measured using SWI |
| Dimension | Component |
|---|---|
| Availability |
|
| Affordability |
|
| Technology development |
|
| Sustainability |
|
| Regulation and governance |
|
| Indicator | Method/Unit |
|---|---|
| Resource estimates | Tonnes of coal or uranium, PJ of gas, barrels of oil |
| Reserve to production ratio (remaining life of reserves) | Reserve tonnes ÷ production tonnes per year = years of remaining production |
| Diversity indices (energy type, geographical source, supplier) | HHI index (sum of squares of each share), with a weighting factor applied |
| Import dependence (imports relative to total use) | PJ imported LNG per year ÷ PJ of annual total use |
| Political stability | World Bank worldwide governance indicators: “political stability and absence of violence”, “regulatory quality”. |
| Energy price | $ per PJ |
| Share of zero carbon fuels (vulnerability to environmental and societal constraints) | PJ of renewables and nuclear ÷ PJ of total primary energy |
| Market liquidity, measured as own demand as a proportion of amount available on the market | Primary energy PJ demand of fuel ÷ total global trade in that fuel in PJ |
| Energy intensity per capita | PJ of primary energy ÷ population |
| Energy imports portion of GDP | $ cost of imported energy ÷ $ GDP |
| Energy intensity per GDP | PJ of primary energy ÷ $ GDP |
| GDP per capita | $ GDP ÷ population |
| IEA physical unavailability index | PJ gas supplied through pipelines under oil priced indexed contracts ÷ PJ total primary energy |
| Indicator | Method/Unit |
|---|---|
| Total primary energy per capita | PJ of primary energy ÷ population |
| Final energy consumption per capita | PJ of final energy consumption ÷ population |
| Electricity per capita | TWh of electricity produced ÷ population |
| Total primary energy intensity | PJ of primary energy ÷ $ GDP |
| Final energy intensity | PJ of final energy ÷ $ GDP |
| Loss in Transmission | TWh of electricity generated ÷ TWh of electricity used |
| Loss in Transformation | PJ of final energy ÷ PJ of primary energy |
| Reserve production ratio (crude oil) | Barrels reserve ÷ barrels per year production |
| Reserve production ratio (natural gas) | PJ reserve ÷ PJ per year production |
| Reserve production ratio (coal) | Tonnes reserve ÷ tonnes per year production |
| Industrial energy intensity | PJ final energy for industry sector ÷ GDP share from industry sector |
| Agriculture energy intensity | PJ final energy for agriculture sector ÷ GDP share from agriculture sector |
| Commercial energy intensity | PJ final energy for commercial sector ÷ GDP share from commercial sector |
| Household energy per capita | PJ final energy for households ÷ population |
| Household electricity per capita | TWh electricity consumption for households ÷ population |
| Transportation energy intensity | PJ final energy for transportation sector ÷ GDP share from transportation sector |
| Share of capacity of renewable energy per total electricity generation | TWh from renewable sources ÷ total TWh electricity generated |
| Share of non-carbon energy per TPES | PJ of primary energy from renewable and nuclear ÷ PJ of total primary energy supply |
| Share of renewable energy per FEC | PJ of final energy from renewable ÷ PJ of total final energy consumption |
| Net energy import dependency | PJ of imported energy ÷ PJ total primary energy |
| CO2 emissions per capita | Tonnes of CO2 emitted per year ÷ population |
| CO2 emissions per GDP | Tonnes of CO2 emitted per year ÷ $ GDP |
| Household access to electricity | Households with electricity ÷ total households |
| Share of income to pay for electricity | kWh elec consumption × $/kWh elec price ÷ $ GDP per capita |
| Residential energy per household | PJ final energy residential use ÷ total number of households |
| Indicator | Method/Unit |
|---|---|
| Primary energy self sufficiency | PJ from domestic and nuclear ÷ PJ total primary energy |
| Supplier country diversification | HHI index of supplier countries and their shares of supply |
| Reduction of risks at supply route choke points (Straits of Hormuz/Malacca) | PJ of primary energy supply passing designated choke points of ÷ total primary energy |
| Energy type diversification | HHI index of energy types and the shares primary energy supply of each |
| Reliability of the domestic power system | Hours of supply interruption ÷ hours in a year |
| Demand restraint/energy intensity | PJ primary energy ÷ $ GDP |
| Resilience to supply disruptions | Days of stockpiles of each energy type |
| Risk Factor | Peabody [61,62] | Rio Tinto [63,64] | Total [10,11] | Shell [65,66] |
|---|---|---|---|---|
| Customer concentration | ✓ | |||
| Law and regulation changes at operational site host countries | ✓ | ✓ | ✓ | ✓ |
| Community disputes near operational sites | ✓ | |||
| Energy mix changes | ||||
| Customer greenhouse gas emissions reductions policies | ✓ | ✓ | ✓ | ✓ |
| New resource exploration less successful | ✓ | ✓ | ✓ | ✓ |
| Operational resource estimates revised | ✓ | ✓ | ||
| Natural disasters and weather disrupt production | ✓ | ✓ | ✓ | |
| Transport availability and infrastructure difficulties | ✓ | ✓ | ||
| Equipment failure and production reliability | ✓ | ✓ | ✓ | |
| Commercial risks | ✓ | ✓ | ✓ | ✓ |
| Financial risks | ✓ | ✓ | ✓ | ✓ |
| Economic and political stability of operational host countries | ✓ | ✓ | ✓ | ✓ |
| Terrorist attack | ✓ | ✓ | ||
| Influence of pandemics | ✓ | |||
| Demand for electricity | ✓ | |||
| Ongoing technological innovation | ✓ | ✓ | ✓ | |
| Operational health, safety and environmental issues | ✓ | ✓ | ✓ | |
| Customer demographic changes | ✓ | |||
| Physical effects of climate change on operations | ✓ |
| Location | Capacity (t) |
|---|---|
| Sodegaura LNG Terminal | 638,100 |
| Negishi LNG Terminal | 463,050 |
| Ogishima LNG Terminal | 383,400 |
| Yokohama Thermal Power Station LNG Terminal | 70,200 |
| Sodegaura Thermal Power Station LNG Terminal | 533,250 |
| Higashi-Ogishima Thermal Power Station LNG Terminal | 243,000 |
| Futsuu Thermal Power Station LNG Terminal | 499,500 |
| Total | 2,830,500 |
| Supplier Country [68,69] | % of Tokyo Bay Share | Export Terminal | Days Shipping to Tokyo Bay [70] |
|---|---|---|---|
| Australia | 24.5% | Darwin | 14 |
| Malaysia | 23.0% | Bintulu | 13 |
| UAE | 13.4% | Fateh | 32 |
| Brunei | 8.6% | Brunei | 12 |
| Russia | 9.0% | Sakhalin | 5 |
| PNG | 6.5% | Moresby | 14 |
| Qatar | 7.0% | Ras Laffan | 31 |
| Weighted average delivery time | 16.4 | ||
| Others | 7.0% | ||
| Process | Proportion of Total [71,72] |
|---|---|
| Uranium mining | 40–45% |
| Conversion | 8–10% |
| Enrichment | 26–29% |
| Fuel fabrication | 21–24% |
| Factor | Dike [16] | Bhattacharyya [15] | Kanchana [17] | UN EVI [28] | Sovacool and Mukherjee [47] | Kruyt [52] | Martchamadol [53] | Murakami [3] | Frondel [3,60] | Producer Corp [10,11,61,62,63,64,65,66] | Action | Integrated into Metric # |
|---|---|---|---|---|---|---|---|---|---|---|---|---|
| Energy exports as a share of total exports | ✓ | Include | M4 | |||||||||
| Customer diversity | ✓ | ✓ | ✓ | ✓ | Include | M3 | ||||||
| Distance to customer | ✓ | Exclude | ||||||||||
| Total exports as a share of GDP | ✓ | ✓ | ✓ | Include | M4 | |||||||
| Energy price | ✓ | ✓ | Exclude | |||||||||
| Energy export to energy production ratio | ✓ | ✓ | Include | M5 | ||||||||
| Ratio of exports to domestic use | ✓ | Include | M1 | |||||||||
| Domestic energy intensity | ✓ | ✓ | Exclude | |||||||||
| Share of net energy imports to primary energy mix | ✓ | ✓ | ✓ | Include | M1 | |||||||
| Share of energy import expenditures to GDP | ✓ | ✓ | Include | M4 | ||||||||
| Political stability of major energy trade partners | ✓ | ✓ | ✓ | ✓ | Exclude | |||||||
| Openness to global energy trade | ✓ | Exclude | ||||||||||
| Diversity of primary energy mix | ✓ | ✓ | ✓ | ✓ | ✓ | Include | M2 | |||||
| Reserves to production ratio | ✓ | ✓ | ✓ | ✓ | Include | M5 | ||||||
| Dependency/energy self-sufficiency rate | ✓ | ✓ | ✓ | ✓ | Include | M1 | ||||||
| Population | ✓ | ✓ | Exclude | |||||||||
| Location (remoteness) | ✓ | Exclude | ||||||||||
| Environment (low lying coastal) | ✓ | Exclude | ||||||||||
| Agric/Nat Resource share of GDP | ✓ | Include | M4 | |||||||||
| Trade shock risk | ✓ | Exclude | ||||||||||
| Natural shock risk | ✓ | Exclude | ||||||||||
| Access and equity to energy supply | ✓ | Exclude | ||||||||||
| Affordability of energy supplies | ✓ | Exclude | ||||||||||
| Costumer side sustainability issues | ✓ | Include | M6 | |||||||||
| Regulation and governance issues | ✓ | Exclude | ||||||||||
| Resource estimates | ✓ | ✓ | Include | M5 | ||||||||
| Supplier diversity | ✓ | ✓ | ✓ | ✓ | Include | M3 | ||||||
| Supply source geographical diversity | Exclude | |||||||||||
| Share of zero carbon fuels (vulnerability to climate change policies) | ✓ | ✓ | ✓ | Include | M6 | |||||||
| Market liquidity (ratio of own demand to market availability) | ✓ | Exclude | ||||||||||
| Energy intensity per capita | ✓ | ✓ | Exclude | |||||||||
| Energy intensity per GDP | ✓ | ✓ | ✓ | Include | M4 | |||||||
| GDP per capita | ✓ | Exclude | ||||||||||
| Loss in Transmission | ✓ | Exclude | ||||||||||
| Loss in Transformation | ✓ | Exclude | ||||||||||
| CO2 emissions per capita | ✓ | Exclude | ||||||||||
| CO2 emissions per GDP | ✓ | ✓ | Include | M3 | ||||||||
| Household access to electricity | ✓ | Exclude | ||||||||||
| Share of income to pay for electricity | ✓ | Exclude | ||||||||||
| Residential energy per household | ✓ | Exclude | ||||||||||
| Reduction of risks at supply route choke points | ✓ | Exclude | ||||||||||
| Reliability of the domestic power system | ✓ | ✓ | Exclude | |||||||||
| Resilience to supply disruptions | ✓ | Exclude | ||||||||||
| Law/regulation changes in operational site countries | ✓ | Exclude | ||||||||||
| Community disputes near operational sites | ✓ | Exclude | ||||||||||
| Customer greenhouse gas emissions reduction policies | ✓ | ✓ | Include | M3 | ||||||||
| Natural disasters and weather disrupt production | ✓ | Exclude | ||||||||||
| Transport availability and infrastructure difficulties | ✓ | Exclude | ||||||||||
| Equipment failure and production reliability | ✓ | Exclude | ||||||||||
| Commercial risks | ✓ | Exclude | ||||||||||
| Financial risks/price stability | ✓ | ✓ | Exclude | |||||||||
| Terrorist attack | ✓ | Exclude | ||||||||||
| Influence of pandemics | ✓ | Exclude | ||||||||||
| Demand for electricity | ✓ | Include | M1 | |||||||||
| Ongoing technological innovation | ✓ | ✓ | Exclude | |||||||||
| Operational health, safety and environmental issues | ✓ | ✓ | Exclude | |||||||||
| Physical effects of climate change on operations | ✓ | Exclude |
| Energy Type | Emissions Factor (t CO2/TJ) | f, CO2 Emissions Adjustment Factor |
|---|---|---|
| Coal | 96.3 | 1.00 |
| Crude Oil | 73.3 | 0.76 |
| Natural gas | 56.1 | 0.58 |
| Zero-carbon fuels | 0.0 | 0.00 |
| 2000 | 2009 | 2018 | |
|---|---|---|---|
| GDP (Bil USD 2021$) | 415.2 | 927.8 | 1432.9 |
| Total exports (Bil USD 2021$) | 64.5 | 164.0 | 263.0 |
| Gas exports (PJ) | 388 | 756 | 3402 |
| Oil exports (PJ) | 811 | 583 | 458 |
| Coal exports (PJ) | 5084 | 7078 | 10,333 |
| Total energy exports (PJ) | 6283 | 8416 | 14,193 |
| 2000 | 2009 | 2018 | |
|---|---|---|---|
| GDP (Bil USD 2021$) | 744.6 | 1376.5 | 1721.8 |
| Total exports (Bil USD 2021$) | 268.0 | 306.0 | 437.0 |
| Gas exports (PJ) | 3462 | 3294 | 2804 |
| Oil exports (PJ) | 3284 | 4201 | 8212 |
| Coal exports (PJ) | 807 | 728 | 837 |
| Total energy exports | 7553 | 8223 | 11,853 |
| 2000 | 2009 | 2018 | |
|---|---|---|---|
| GDP (Bil USD 2021$) | 165.0 | 539.6 | 1042.0 |
| Total exports (Bil USD 2021$) | 69.8 | 136.0 | 198.0 |
| Gas exports (PJ) | 1449 | 1369 | 991 |
| Oil exports (PJ) | 1625 | 891 | 588 |
| Coal exports (PJ) | 1404 | 5708 | 9880 |
| Total energy exports | 4478 | 7968 | 11,459 |
| 2000 | 2009 | 2018 | |
|---|---|---|---|
| GDP (Bil USD 2021$) | 171.2 | 386.2 | 437.0 |
| Total exports (Bil USD 2021$) | 60.7 | 119.0 | 127.0 |
| Gas exports (PJ) | 1764 | 3598 | 4240 |
| Oil exports (PJ) | 6377 | 3688 | 2657 |
| Coal exports (PJ) | 0 | 0 | 0 |
| Total energy exports | 8141 | 7285 | 6897 |
| 2000 | 2009 | 2018 | |
|---|---|---|---|
| GDP (Bil USD 2021$) | 195.9 | 1223.0 | 1687.0 |
| Total exports (Bil USD 2021$) | 101.0 | 285.0 | 430.0 |
| Gas exports (PJ) | 6556 | 5873 | 8434 |
| Oil exports (PJ) | 8309 | 14,707 | 16,403 |
| Coal exports (PJ) | 1067 | 2875 | 5576 |
| Total energy exports | 15,932 | 23,455 | 30,413 |
| 2000 | 2009 | 2018 | |
|---|---|---|---|
| Australia | 0.70 | 0.65 | 0.63 |
| Canada | 0.55 | 0.54 | 0.49 |
| Indonesia | 0.49 | 0.48 | 0.43 |
| Norway | 0.58 | 0.67 | 0.68 |
| Russia | 0.49 | 0.54 | 0.54 |
| 2000 | 2009 | 2018 | |
|---|---|---|---|
| Australia | 0.32 | 0.38 | 0.29 |
| Canada | 0.09 | 0.13 | 0.24 |
| Indonesia | 0.48 | 0.64 | 0.43 |
| Norway | 0.70 | 0.58 | 0.54 |
| Russia | 0.52 | 0.39 | 0.43 |
| M.V | 2000 | 2009 | 2018 |
|---|---|---|---|
| Australia | 1.49 | 1.48 | 1.44 |
| Canada | 0.95 | 0.99 | 1.03 |
| Indonesia | 1.26 | 1.44 | 1.16 |
| Norway | 1.80 | 1.82 | 1.81 |
| Russia | 1.21 | 1.20 | 1.25 |
Disclaimer/Publisher’s Note: The statements, opinions and data contained in all publications are solely those of the individual author(s) and contributor(s) and not of MDPI and/or the editor(s). MDPI and/or the editor(s) disclaim responsibility for any injury to people or property resulting from any ideas, methods, instructions or products referred to in the content. |
© 2023 by the authors. Licensee MDPI, Basel, Switzerland. This article is an open access article distributed under the terms and conditions of the Creative Commons Attribution (CC BY) license (https://creativecommons.org/licenses/by/4.0/).
Share and Cite
Curtis, A.; McLellan, B. Framework for Assessment of the Economic Vulnerability of Energy-Resource-Exporting Countries. Resources 2023, 12, 27. https://doi.org/10.3390/resources12020027
Curtis A, McLellan B. Framework for Assessment of the Economic Vulnerability of Energy-Resource-Exporting Countries. Resources. 2023; 12(2):27. https://doi.org/10.3390/resources12020027
Chicago/Turabian StyleCurtis, Andrew, and Benjamin McLellan. 2023. "Framework for Assessment of the Economic Vulnerability of Energy-Resource-Exporting Countries" Resources 12, no. 2: 27. https://doi.org/10.3390/resources12020027
APA StyleCurtis, A., & McLellan, B. (2023). Framework for Assessment of the Economic Vulnerability of Energy-Resource-Exporting Countries. Resources, 12(2), 27. https://doi.org/10.3390/resources12020027