1. Introduction
Wetland ecosystems and civilizations have maintained dynamic relationships for millennia. Wetlands are highly productive ecosystems that provide a vast array of ecosystem functions and services to humans [
1,
2,
3,
4]. Reclamation of wetlands, changing climate, fires, and surface and groundwater extraction have made wetlands among the most threatened ecosystems in the world [
5]. Since the turn of the 20th century, a significant proportion of the world’s wetlands (i.e., 64%–71%) has been lost to degradation, with the most substantial large-scale transformation occurring in Asia [
6]. Land use and land cover change have been identified as among the major drivers of wetland loss [
5,
7,
8,
9,
10]. Degradation and conversion of wetlands adversely impact the productivity of land, habitats, and resources, and often the poorest communities are directly dependent on the functions and services of these wetland ecosystems [
1].
Natural wetland ecosystem services, despite their immeasurable value, are estimated to be worth 47.3 trillion USD per year globally as per 2011 values, accounting for 43.5% of the total value of all-natural biomes [
10]. The estimated value of ecosystem services rendered by inland wetlands in Asia amounts to 4.5 trillion USD, representing a substantial proportion of the total value of wetlands [
10]. The potential socioeconomic benefits that can be obtained from wetlands have been overlooked and undervalued because of their exclusion from economic markets and their limited integration into decision-making processes [
11].
Wetlands provide essential sustenance, structural support, cultural significance, and spiritual enrichment for humans worldwide. Moreover, wetlands serve as a crucial source of sustenance for communities, leading to dependence on these ecosystems for their livelihood [
12]. Research has also indicated that wetlands contribute positively to both mental and physical health, promoting overall well-being [
13]. The significant dependence of indigenous communities on wetland ecosystems has been extensively documented globally, particularly in developing countries [
14]. Current literature increasingly advocates for the dissolution of the dichotomy between humans and nature and the establishment of management systems that prioritize the active participation of local communities [
14]. This advocacy is particularly crucial in contexts where ineffective governance, lack of transparency, inadequate regulatory frameworks, and corrupt practices persist [
12,
15]. If wetlands lose their ability to provide crucial ecosystem services because of poor management, then the well-being and livelihoods of communities dependent on them will be impacted [
16].
According to the Indo-Burma Wetland Outlook, Myanmar has a total wetland area of 109,655 km
2, of which inland natural wetlands (including lakes, floodplain wetlands, and swamp forest) account for merely 7563 km
2 or 6.9% of the total wetland area [
17]. A study conducted by Murray et al. (2020) [
18], 2018–2019, shows that a substantial portion of wetland ecosystems in Myanmar, around 44%, face the potential threat of ecosystem collapse. This risk is primarily attributed to factors such as alterations in land use, exploitation of natural resources, the presence of invasive species, and the impacts of climate change. Furthermore, Myanmar has been identified as the predominant region in Asia experiencing significant loss of mangroves, losing wetlands four times faster than the world. Between 1975 and 2005, a substantial reduction of 35% in mangrove coverage was observed, followed by a further decline of 28% from 2000 to 2014 [
19]. At present, Myanmar has a cross-sectoral national wetland committee and a national wetland policy, thereby furthering its commitment to the Ramsar Convention. In addition, the Nationally Determined Contributions (NDCs) of Myanmar spearhead the conservation of coastal wetlands, especially mangroves [
17]. Although current policies and institutional guidance or arrangements implemented in Myanmar are praiseworthy, they are inadequate in ensuring the continued conservation and safeguarding of wetlands in the country. To make matters worse, the ongoing rapid and intense development in Myanmar poses a threat to the conservation of natural resources and biodiversity and the uninterrupted access to crucial ecosystem services [
20].
The Chindwin River Basin (CRB), located in northwestern Myanmar, is recognized for its rich biodiversity, making it a critically significant hotspot within the Indo-Burma region [
21]. The region encompasses a variety of ecosystems, including forests, wetlands, and mountains, supporting a wide array of plant and animal species and contributing significantly to the provision of essential ecosystem services [
22]. Communities inhabiting CRB rely on these ecosystems for sustenance (fuelwood and food) and means of livelihood [
21]. To prioritize the region’s conservation, 51.1% of CRB has been identified as a key biodiversity area (KBA). The Upper Chindwin Basin (UCB) in Myanmar is a crucial habitat for biodiversity and has been officially recognized as a KBA owing to its notable species and diverse ecosystems that are significant to conservation [
23]. This region is also a hotspot for endangered species, including
Batagur trivittata (Burmese roofed turtle),
Puntius manipurensis (Carp),
Schistura kangjupkhulensis (Carp from Kangjupkhul hills),
Schistura reticulate (Carp with reticulated dark brown bars), and
Dipterocarpus retusus (hollong tree) [
23]. KBAs play a vital role in fostering diverse inland wetland ecosystems, encompassing rivers, lakes, and ponds. However, these ecosystems are currently encountering mounting challenges from various development activities, including commercial logging, mining, land reclamation, and agriculture. Note that Myanmar’s gross national income (GNI) per capita stands at 1210 USD per annum, which is significantly lower than the global average of 12,804 USD [
24]. This UCB region is home to the most socioeconomically disadvantaged populace within the country, with most of its inhabitants residing below the extreme poverty threshold of 684 USD per annum [
25]. The limited availability of subsistence alternatives forces communities to engage in such practices as deforestation, overfishing, and unregulated mining, which can potentially endanger the delicate riverine wetland ecosystems. Moreover, an analysis of land use and land cover in the area reveals a significant decrease of 25% in wetland areas from 2000 to 2020. This decline is primarily attributed to the reclamation of land for agricultural and settlement expansion [
26].
Fortunately, in contrast to other countries that prioritize economic development at the expense of their ecological resources, Myanmar can still opt for a trajectory that enables economic growth while safeguarding natural ecosystems and their indispensable services [
20]. The involvement of communities in wetland restoration and management is a valuable approach because these communities often rely on wetlands for their livelihoods and poverty alleviation. Evidently, they possess a superior understanding of the ecosystem owing to their close association with wetlands. This strategy is crucial in conserving wetlands and ensuring their benefits for future generations [
27]. Historically, wetland conservation has been primarily focused on large lakes, specifically Inle Lake, Moeyungyi Wetland Wildlife Sanctuary, and Indawgyi Wildlife Sanctuary; research efforts have likewise predominantly centered on assessing wetland health [
28], evaluating ecosystem services [
21,
29], and analyzing community reliance and attitudes toward these wetlands as protected areas [
30,
31,
32].
Despite the preceding studies, there is still a significant gap in understanding the relationship between community reliance and attitude toward wetlands, particularly in UCB. This situation is noteworthy given the high level of dependence of communities on these wetland ecosystems. Accordingly, establishing a socioeconomic baseline for wetland dependence in the region is imperative to facilitate the development of wetland management and conservation strategies that can effectively safeguard wetland health and sustain the flow of ecosystem services. Therefore, this study explores the relationship between communities and wetland ecosystems in UCB. Such an understanding can aid in developing a self-sufficient and sustainable bottom-up strategy for wetland management in the region, with the potential for reasonable upscaling. The objectives of the current study are as follows: (i) to quantify the dependence of communities on wetlands in UCB, (ii) to determine the communities’ knowledge and attitudes toward wetlands, and (iii) to describe communities’ perceptions of wetland conservation, drivers of change, and management in practice.
2. Study Area Description
Myanmar is situated in the Indo-China peninsula and is the second-largest country in Southeast Asia. Geographically, Myanmar is divided into the Shan Plateau in the east, the central plains (including the Ayeyarwaddy Delta and other river basins), and the western Himalayan ranges (separating India and Myanmar) [
33]. The country exhibits tropical rainforest and monsoon climates characterized by high and continual seasonal precipitation [
34]. Myanmar is susceptible to flood hazards owing to its intricate topography characterized by mountains, high-intensity rainfall, and a significant number of glaciers [
35].
CRB is situated in northwestern Myanmar between 22°06′–26°00′ N latitude and 94°18′–95°42′ E longitude [
25]. The Chindwin River is the primary tributary of the Ayeyarwady and the third-largest river in Myanmar, playing a crucial role in providing sustenance to the people [
35,
36]. CRB has a total area of 114,112 km
2, with approximately 15% of the basin situated within the Indian borders. The basin covers 46 townships and 13 districts, spanning 4 distinct regions in Myanmar, namely, Sagaing, Kachin, Chin, and Magway. The basin’s majority area is covered in forest, accounting for 86% of land use. Other land uses include agriculture, mining, rural areas, and shrubs [
37]. The Chindwin’s primary river channel spans approximately 900 km long and is approximately 350 m wide near Hkamti township, running in a north–south direction. The river exhibits an increase in width downstream of the defile, reaching a maximum width of 1200 m in the vicinity of Monywa. In addition, the river’s flow velocities decrease as it traverses the central flat terrain.
Six million people reside in CRB, with 3.5 million people residing in Myanmar. The study area is the Upper Chindwin Sub-Basin, which comprises a quarter of the entire basin area and is home to a population of over 100,000 individuals residing in the Kachin and Sagaing regions [
38]. On average, UCB receives 1500–4000 mm rainfall. The southeastern part of the basin is located within Myanmar’s arid zone and experiences infrequent and insufficient precipitation. The mean monthly temperature of the basin ranges from 23 °C in the upper region to 28 °C in the lower region near Monywa [
25]. UCB was identified as a KBA, providing abode to 18 globally threatened vertebrate species (i.e., 9 reptiles species, 5 birds species, and 4 mammalian species) and substantial populations of white-winged duck (
Asarcornis scutulata), Indian skimmer (
Rynchops albicollis), Burmese roofed turtle (
Batagur trivitata), and Burmese peacock softshell (
Nilssonia formosa) [
39]. Hkamti township in UCB is home to 38 threatened freshwater species, including the critically endangered
Batagur trivittata (Burmese roof turtle) [
26]. The region’s predominant economic activities are rice farming and fishing, which provide livelihoods for a population of over 36,000 individuals, including 18,201 women. The township suffers from poverty and has low living standards. A total of 60% of the local population’s protein intake comes from fish, and 80% of primary household incomes are derived from nature-based activities [
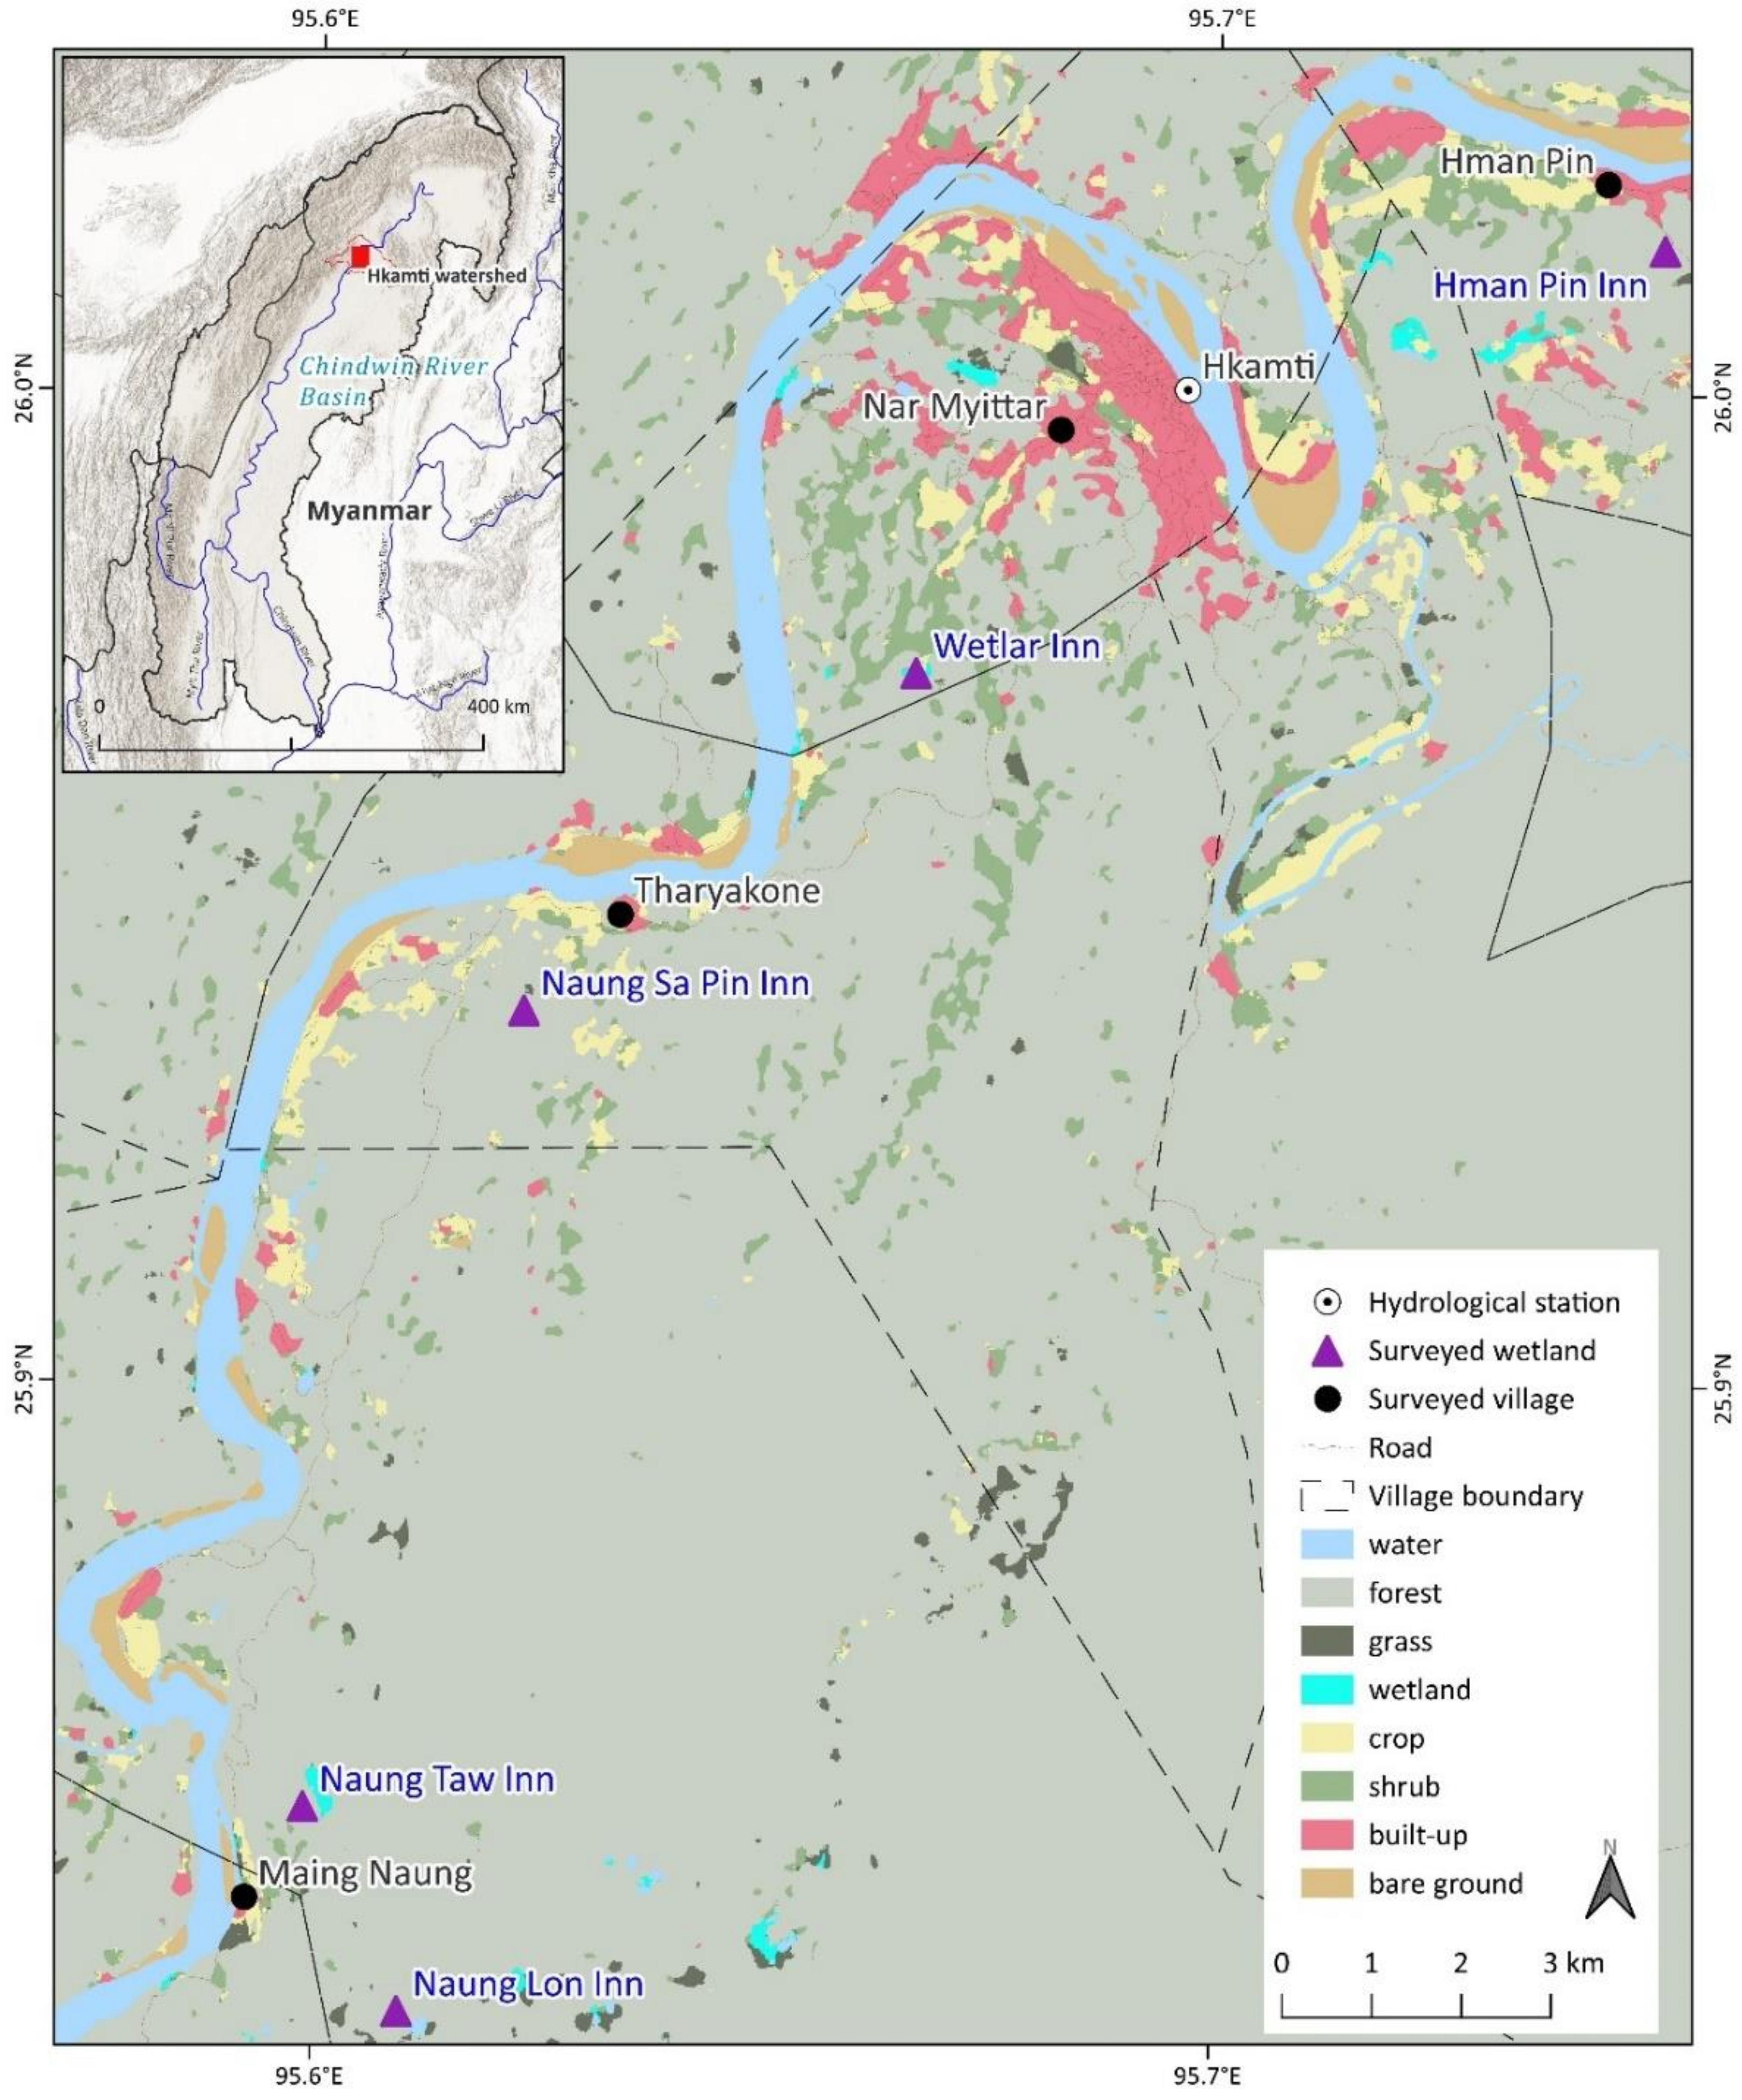
26]. This study was conducted in the upstream and downstream areas of Hkamti township in Sagaing region. Based on a scoping study conducted in 2021, four wetland-dependent villages from Hkamti township in UCB were identified: Nar Myittar, Tharyarkone, Hman Pin, and Maing Naing. These villages were dependent on Wetlar Inn, Naung Sa Pin Inn, Hman Pin Inn, Naung taw Inn, and Naung Lon Inn, respectively (
Figure 1).
3. Methods
This study utilized a mixed methods approach to address problems and the complexity in social science and took advantage of both qualitative and quantitative data by utilizing a questionnaire survey and conducting focus group discussions (FGDs) [
40]. The wetland-dependent communities from the four villages were the primary data source. Questionnaire surveys and focus group discussions were conducted by the author and enumerators in the villages for two weeks during July 2022. Enumerators were provided with training on data collection, ethics, and questionnaire structure prior to data collection. The survey was conducted on 133 households across the 4 villages (representing 22% of the total households). The distribution of samples for the survey is presented in
Table 1.
A single member from each household was selected to participate in the study. Attempts were made to connect with the household head regardless of gender. In the event of their unavailability, any available household member who consented to participate was interviewed. Participants were required to be at least 18 years old and residents of the township. Before data collection, eligible participants were provided with information on the study objectives, and verbal informed consent was obtained from them, ensuring adherence to standard confidentiality and anonymity protocols.
A questionnaire was designed based on the Rapid Wetlands Ecosystem Service Assessment (RAWES) questionnaire to collect data on the community’s dependence on wetlands and their perception of wetland ecosystem services [
41]. The modified questionnaire developed using existing literature and expert knowledge from the region consisted of the following sections: sociodemographic characteristics, socioeconomic assessment, livelihood dependence and practices, knowledge, and attitude toward wetland conservation.
The survey was structured into two main sections: Socioeconomics and Livelihoods, and Attitude, Preferences, and Dependence on Wetlands. Each of these sections consisted of a combination of fixed responses and open-ended questions, resulting in a comprehensive set of 83 questions (
Annex S1 in Supplementary Materials). Fixed-response questions were used to increase the accuracy of the participant’s responses, whereas open-ended questions were employed to encourage the expression of their perspectives. The questionnaire was initially developed in English but subsequently translated into Burmese. Translation was crucial in facilitating effective communication with the participants. The questionnaires underwent a pre-testing phase on a subset of respondents (
n = 10) from Nar Myittar village to ascertain clarity and unambiguity. Responses were subsequently translated into English for further analysis. Additionally, preceding the survey, a focus group discussion was conducted in each village with a limited cohort of approximately 20 representatives with equal participation from different groups including women, youth, elderly, and marginalized communities to understand the community’s needs and preferences concerning wetland preservation and sustainable livelihoods.
An ecosystem services index (ESI) was developed following the RAWES protocol [
41] to visualize the communities’ perceptions of the different types of ecosystem services derived from the wetlands the four surveyed villages are dependent upon during the FGDs (
Annex S2 in Supplementary Materials). The ecosystem services were categorized and summed, after which they were divided by the total number of services within each category (provisioning
n = 11, regulating
n = 12, cultural
n = 6) to obtain a single, comparable ESI [
42]. The ESI is calculated using the mathematical expression presented in Equation (1).
In the equation,
n is the number of services. The potential ESI spans from +1 to −1, which is determined independently for each of the three distinct ecosystem service categories or as an aggregated measure for all ecosystem services. An ESI rating of +1.0 signifies that a wetland offers substantial societal benefits, while conversely, an ESI rating of −1.0 indicates that it imparts considerable adverse impacts [
41].
Univariate statistical methods were utilized to conduct descriptive analysis, in which the continuous and categorical variables were reported in terms of means and frequency distributions, respectively. Chi-squared tests were conducted to assess the potential influence of socio-demographic characteristics on attitudes towards wetlands, their role in natural resources management, and agreement on proposed restoration activities. Significance was determined at the 5% level for all tests. A principal component analysis (PCA) was conducted to investigate the relationship between household characteristics and the proportional contribution of different strategies to the annual income of the household. An evaluation of the data’s suitability for analysis was done prior to PCA. The PCA is a suitable method when KMO (Kaiser–Meyer–Olkin) values are greater than 0.5 and p values for the Bartlett’s test of sphericity are less than 0.001. All analyses were conducted using SPSS version 16 (SPSS Inc., Chicago, IL, USA).
4. Result
4.1. Sociodemographic Characteristics
Most of the participants were males (60.9%), living with an average family size of 6 members (SD = ±3), and had spent an average of 29 years residing in the village (SD = ±17). A total of 19% of the participants had high school or above education level. The Naga ethnic group was the most prevalent in the region, accounting for 49% of the population, while the Shan ethnic group constituted 36%. The respondents had an average annual household income of approximately 2,386,033 Myanmar Kyat (equivalent to around 1136 USD), with a standard deviation of about ±1,192,786 MMK (or 568 USD) (
Table 2).
4.2. Socioeconomic Assessment
A total of 77% of the respondents relied on agriculture as their primary source of income, with 62.4% earning below 200,000 MMK per month (about 95 USD) from their primary livelihood. Meanwhile, 15% of the respondents (n = 20) engaged in other day jobs, including as construction workers, waterways transportation staff, mechanics, traditional physicians, and greengrocers. Half of the participants responding to other sources of primary income reported a monthly income range of 100,000–300,000 MMK, while 25% had income below 100,000 MMK per month (about 47 USD). The remaining 25% reported a monthly income exceeding 300,000 MMK (about 142 USD). Among individuals whose primary source of income is agriculture, a significant proportion (46.6%) used an area of below 1 ha for their cultivation activities and only 3.8% had land holdings above 3 ha. Most of the respondents (66.9%) owned their land and had official tenure, 11.3% owned it through customary rights, and 7.5% rented the land for agriculture. Meanwhile, 53% and 47% of the respondents reported that their primary livelihoods were significantly threatened by floods and pest infestation, respectively.
Most households owned at least one type of livestock, with poultry being the most common followed by pigs. Among households that owned livestock, a significant proportion (40.6%) earned an income of below 100,000 MMK per month, while a mere 0.8% earned income in the range of 200,000–300,000 MMK per month (
Table 3).
The communities depended on groundwater and rainwater for irrigation (29% and 28%, respectively), and only 5% depended on wetlands for irrigation. Despite the importance of water conservation, only 9% of the respondents engaged in any water conservation activity in this area. In addition, 90% of those who participated in the survey did not engage in any soil conservation measures (
Table 4).
4.3. Dependence on Wetland Resources
All respondents engaged in the extraction of wetland resources for subsistence and commercial purposes. The predominant resources extracted from the wetlands were timber, including such species as cadamba (Anthocephalus cadamba Miq.), kanyin (Dipterocarpus turbinatus), tamarind (Tamarindus indica), rambutan (Nephelium lappaceum), Burmese grape (Baccaurea ramiflora), and Lone pine (Pinus latteri); and bamboo (Bambusa polymorpha), which was utilized for construction purposes. Fuelwood, such as kazin (Ficus benjamina), Moe makha (Salix babylonica), cadamba, sakat (Terminalia nitens), rambutan, and katkaw, was collected for cooking purposes. The local population also relied on a variety of fruits, vegetables, and aquatic plants, including water spinach (Ipomaea aquatica), water hyacinth (Eichhornia crassipes), water primrose (Ludwigia hyssopifolia), water lily (Nymphaea nouchali), rosella (Hibiscus sabdariffa), bamboo shoots, and gonemin (Alpinia allughas Rosc), to supplement their diets. Waterfowl and fish were also utilized as sources of protein. Various plant species, such as bar-kyaw pin (Plantago major), than-manaing-kyauk-manaing (Alysicarpus vaginalis), and Galangal (Alpinia allughas), were gathered for their medicinal properties.
Most participants obtained sustenance from wetland food sources for their daily dietary needs (57.9%, n = 77), while a small proportion (6.8%, n = 9) generated income through the sale of bamboo shoots, wetland plants, and vegetables. The findings indicate that the amount of food resources obtained from the wetlands exhibited wide variation, with most respondents (46.6%) reporting a range of 1–5 kg/month. A small proportion of respondents (3%) reported harvesting over 50 kg/month. A few participants (n = 27) engaged in the collection of food resources from the wetlands throughout the year, whereas some (n = 21) were involved seasonally.
A total of 84% of households were dependent on the wetlands for fish. The harvested fish species for consumption were identified to be a maximum of 17 species, including but not limited to snakehead (
Channa striata), featherback (
Notopterus notopterus), walking catfish (
Clarias batrachus), silvery catfish (
Bagrus bajad), boga labeo (
Labeo boga), cylindrical fish (
Otolithoides pama), and koria labeo (
Labio gonius). Only 8.3% of individuals were able to successfully harvest a yield of at least 20 kg/month, while 66.2% of those involved in fishing reported a yield of below 5 kg/month. A significant proportion of the participants (67.7%) prioritized fish consumption, a minor fraction (6.8%) engaged in the commercialization of fish as a means of generating income, and 10% engaged in both activities. This study found that 30.8% of the participants reported engaging in wetland fisheries throughout the year, whereas 41.5% reported engaging in seasonal fisheries (
Table 5).
Fuelwood was identified by the participants as another significant resource obtained from wetlands. A total of 70% (n = 94) of the participants engaged in the collection of fuelwood from the wetlands for subsistence, while only a small proportion (5%) emphasized commercialization. On average, a household can harvest 2544 kg of fuelwood annually from forested wetlands. The highest recorded harvest was in Hman Pin, with a yield of 3843 kg/year, while the lowest was in Nar Myittar, with a yield of 1612 kg/year.
Principal component analysis with a varimax rotation was employed to examine the relationship between socio-demographic factors and the extent to which wetland-based livelihood strategies contribute to annual income. The Kaiser–Meyer–Olkin (
KMO) measure, which assesses the sampling adequacy for factor analysis, exceeded the recommended threshold of 0.5, indicating its suitability for conducting a significant factor analysis (
KMO = 0.574). Additionally, the Bartlett’s test of sphericity yielded a statistically significant result (ꭓ
2 = 148.56,
p = 0.000), further supporting the appropriateness of the factor analysis. Based on the eigenvalue criterion of exceeding 1, it was determined that four components accounted for a cumulative variance of 58.98%. The first component of the analysis revealed a significant negative correlation between income derived from timber and both ethnicity and education level. This relationship accounted for a substantial proportion of the observed variance, specifically 20.8% as indicated in
Table 6. There is a negative correlation between household size, income from fishing, and the area of land owned by the respondent with regards to income derived from timber in component 2. The relationship between the income generated from fish and the gender of the household head is found to be statistically significant, as indicated by component 3. On the other hand, the income derived from fuelwood is positively affected by factors such as years of education and household size.
4.4. Knowledge and Attitude toward Wetland Ecosystem
All participants understood the significance of wetlands. However, 87% (
n = 115) reported an absence of government agency involvement in advocating awareness of wetland conservation. Respondents who acknowledged the government’s involvement in raising awareness were unable to specify the precise nature of the contribution to this effort. In contrast, nearly all respondents (99.2%;
n = 132) agreed that wetlands should be protected and that healthy wetlands are important to support their livelihood practices. They also concurred (98.5%,
n = 131) that local community actions have resulted in the conservation of wetlands in the region, and 97.7% of the respondents agreed to impose penalties for destroying wetlands. Furthermore, they expressed support for the restoration of degraded wetland habitats. In particular, 89.5% (
n = 119) emphasized that restoration effort would be ineffective if communities do not have alternative livelihood options (
Table 7).
Nearly all participants (97%) did not know any existing law or regulation that ensures wetland protection in Myanmar. Furthermore, 87% of the respondents concurred that the government has not adequately endeavored to promote awareness of wetland conservation (
Table 7). The participants indicated the lack of wetland conservation, restoration, and management initiatives and policies in the region. During the FGDs (Focus Group Discussions), it was found that Nar Myittar had no record of any local management system, while Tharyakone and Maing Naung acknowledged the existence of local management in the past, although ineffective owing to non-compliance. The lack of documented customary regulations was identified as the root cause of this inefficacy in the FGDs. The village administration committee in Hman Pin imposed restrictions on fishing practices deemed unsustainable. Nevertheless, these regulations are temporarily eased annually to permit electrofishing as a means of capturing substantial quantities of fish for charitable events.
The results of the chi-square test showed that there was no statistically significant association (
p > 0.05) between gender, household size, and education level and respondents’ attitudes and perception of wetlands conservation. A statistically significant association (ꭓ
2 = 12.134;
p < 0.05) was observed in the awareness of respondents regarding the effectiveness of local efforts in wetlands conservation when considering their primary livelihood. The imposition of penalties on activities that harm wetlands showed a statistically significant correlation (χ
2 = 11.898;
p < 0.05) with the educational level of the respondents (
Table 8). Awareness of wetlands by government initiatives was found to be significantly influenced by the education level of the household respondents (χ
2 = 14.74;
p < 0.01) (
Table 9).
All study participants had access to natural resources, including wetlands, present within the landscape. Approximately 49% of the respondents indicated they contribute to the natural resource management decision-making process in some way. However, 81% of them would like to contribute substantially to the governance of natural resources, even though 90% of them are not currently involved in any community-based management. In addition, 71% of the respondents were aware of government plans and initiatives for the management of natural resources (
Table 10).
The chi-square test showed that fair access to natural resources had a significant association (ꭓ
2 = 25.79;
p < 0.001) with the primary livelihood of the household respondent. Gender and primary livelihood of respondents were found to have a significant association with knowledge pertaining to natural resources management processes in the study area (ꭓ
2 = 10.41;
p < 0.05 for gender and ꭓ
2 = 24.54;
p < 0.05 for primary livelihood). Furthermore, significant associations with gender (ꭓ
2 = 6.95;
p < 0.01) and annual income (ꭓ
2 = 10.60;
p < 0.05) were observed for local communities’ contribution to the natural resources management (
Table 11).
All participants indicated that the formulation of community action plans for wetland management is of utmost importance to guarantee the uninterrupted provision of wetland ecosystem services. A total of 68% of them perceived that afforestation of degraded farmlands near designated wetlands would serve as an effective measure in mitigating erosion. The respondents consistently recognized the importance of reinstating wetland perimeters with indigenous flora and fauna, while simultaneously implementing measures to manage the spread of non-native species.
Respondents’ preferences for certain conservation actions such as control of invasives were observed to be statistically significant by primary livelihood (ꭓ
2 = 19.03;
p < 0.01) whereas afforestation in degraded farmlands was significantly associated with gender of the respondent (ꭓ
2 = 4.3;
p < 0.05) (
Table 12).
4.5. Perception of Wetlands Ecosystem Services
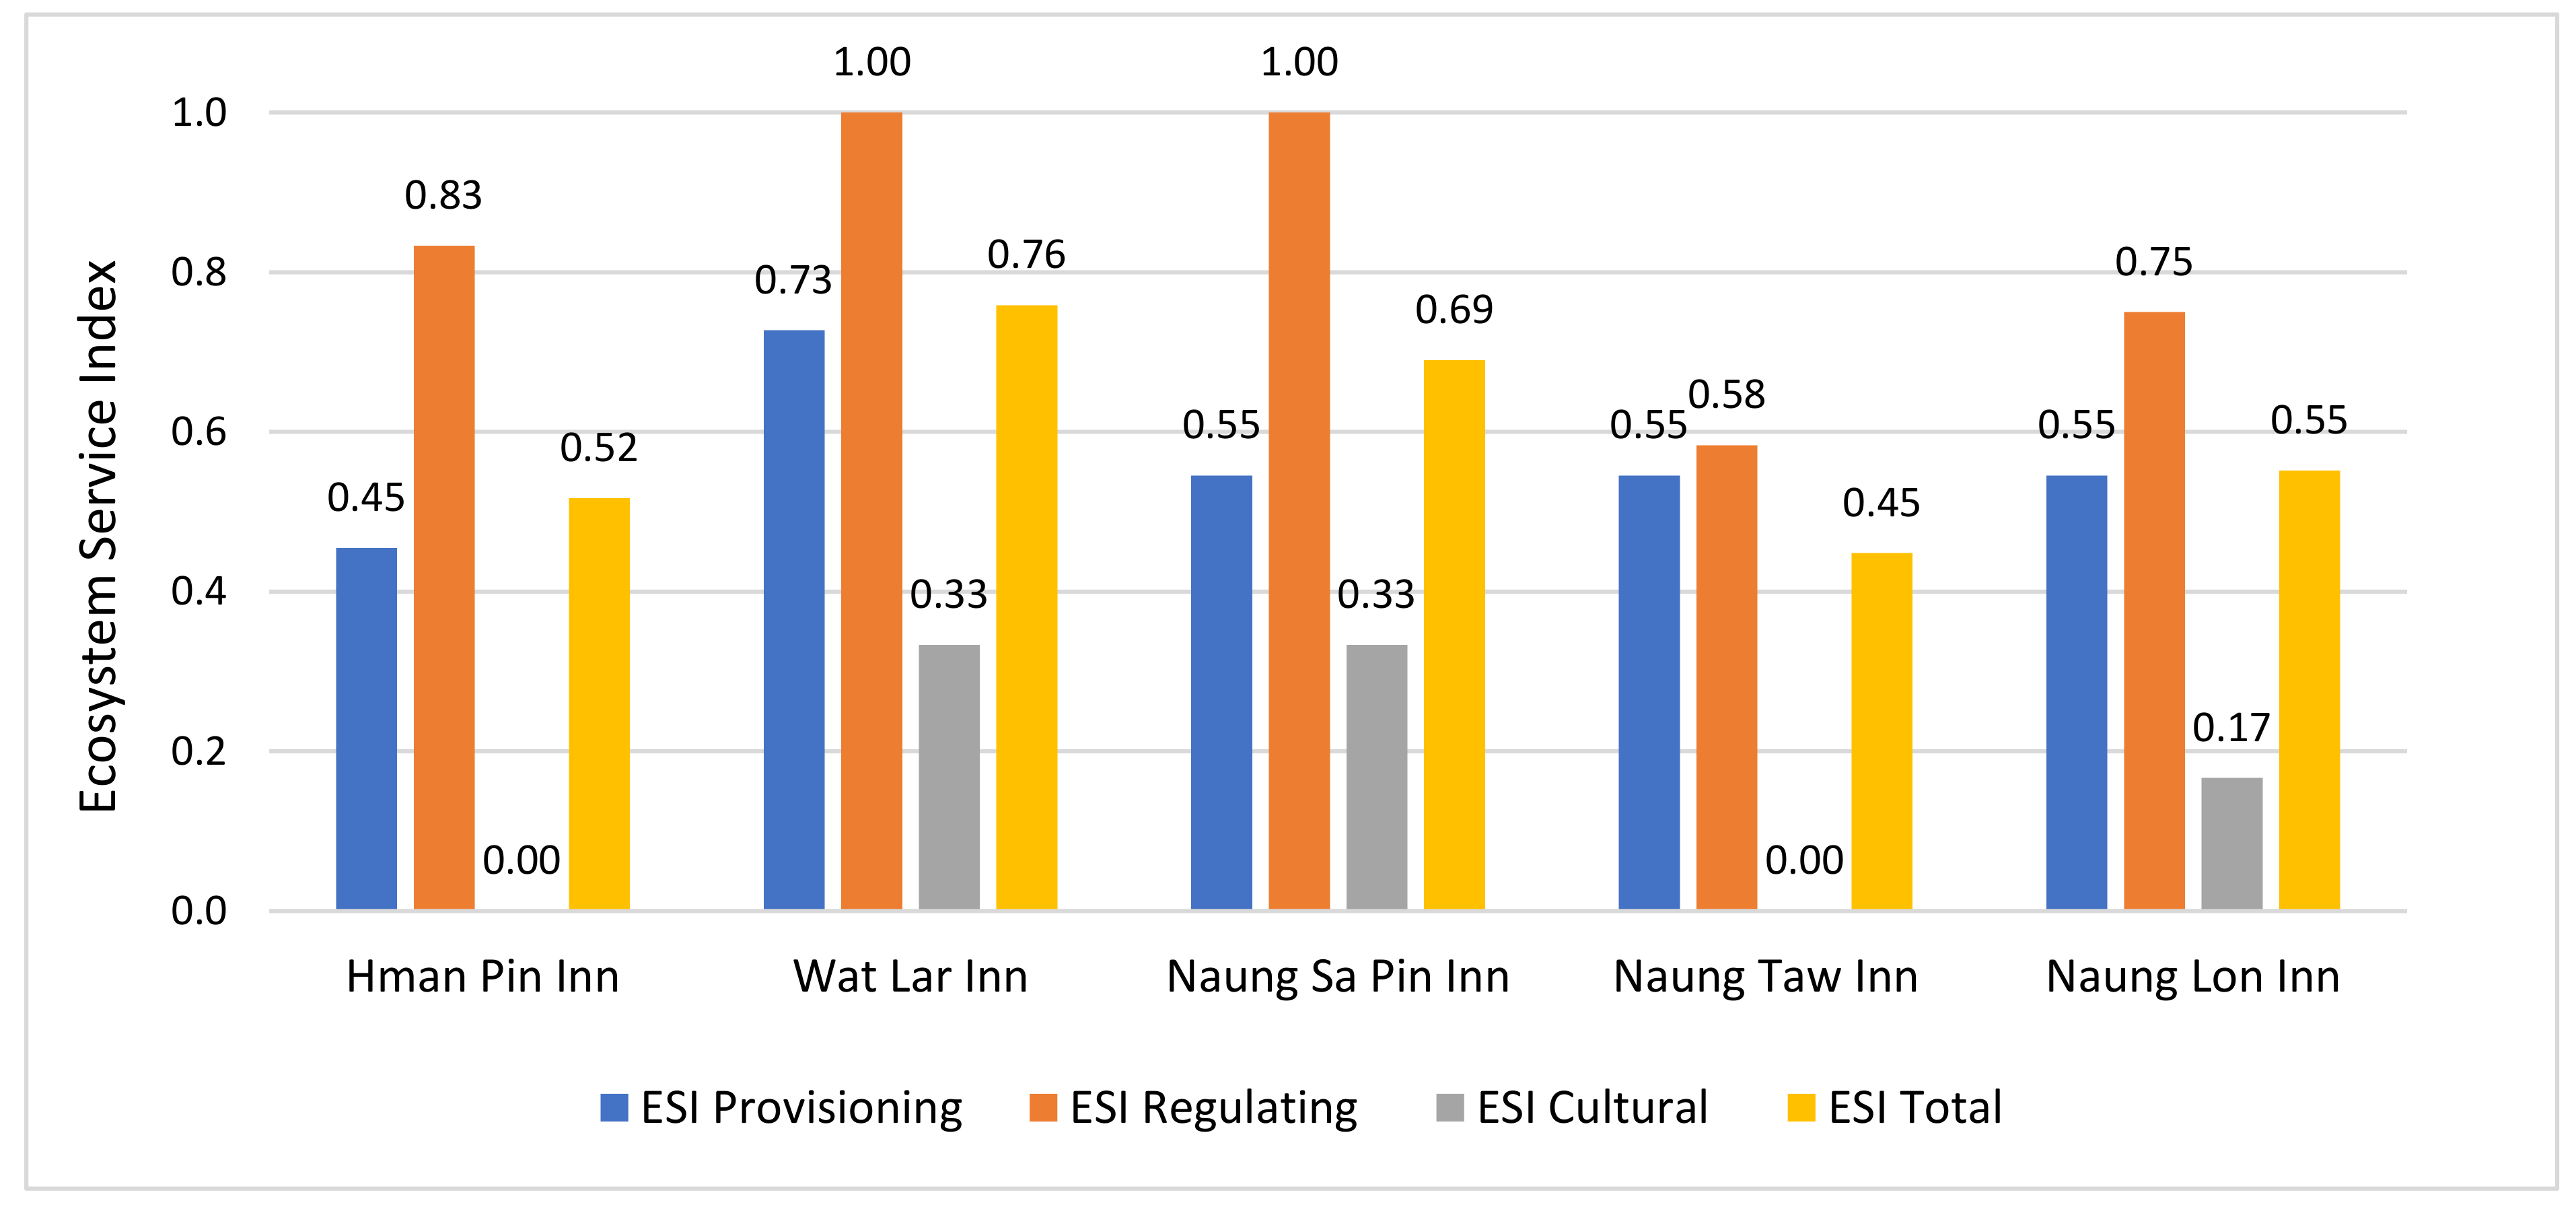
Figure 2 illustrates the perception of ecosystem services that communities obtain from the wetlands surveyed. The present study utilized the rapid ecosystem services assessment to derive the indicator ESI. Based on the findings, it can be observed that Wat Lar Inn exhibits the highest cumulative ESI score, while Naung Sa Pin Inn and Naung Lon Inn follow suit, with respective scores of 0.76, 0.69, and 0.55. The Cultural Ecosystem Services Index (ESI) values were found to be the lowest (ESI Cultural = 0) for both Hman Pin Inn and Naung Taw Inn, indicating a weak association of these communities with this particular set of services. Conversely, the highest values were observed for ESI regulating, with values reaching the maximum value of +1 in two wetlands, namely Wat Lar Inn and Naung Sa Pin. The values obtained for provisioning Ecosystem Service Index (ESI) in the surveyed wetlands varied from 0.45 to 0.73, indicating an intermediate level of recognition regarding the benefits of provisioning services derived from these wetlands.
Regulating services, including water regulation and purification, flood and erosion regulation, and climate regulation, were rated high by local communities. Additional ecosystem services benefits encompass provisioning benefits, primarily consisting of fish, food, fiber, fuel, natural medicines, ornamental resources, and clay minerals. The respondents also identified cultural heritage, social relationships, tourism, and recreation as cultural benefits enjoyed by communities. Two of the surveyed village communities exhibited no recognition of wetland cultural services.
4.6. Drivers of Change
During the FGD, the respondents identified that the most significant impact on wetland services is due to extensive grazing and livestock farming, coupled with unsustainable biological resource utilization practices, such as logging, wood harvesting, extensive fishing, and harvesting of plant and animal products. Furthermore, the clearance of habitats for alternative land use was identified by the communities as a major driver of wetland degradation.
Despite the widespread engagement in agricultural expansion, it was not deemed a substantial threat to the wetland ecosystems, even when it has been reported that wetland areas are utilized for cultivation during the summer season as flooding subsides. This practice may have a negative impact on wetland ecosystems and their ability to function as buffers. Meanwhile, mining was emphasized in the four villages as an existing and potential future threat to wetlands. The wetland inlet in Hman Pin was blocked to facilitate extensive gold mining activities. Despite a halt in mining operations, the obstruction persists, resulting in yearly inundation of rice paddies and leading to wetland fragmentation and shrinkage. The surveyed villages of Myittar, Tharyakone, and Maing Naung experienced a decline in fish stock and diversity, which can be attributed to the activities, including year-long fishing leases and population growth.
5. Discussion
In the present study, we used a mixed method approach following Lamsal et al. [
43], Lamprinakis et al. [
44], and Amo et al. [
45] to capitalize on the respective advantages of qualitative and quantitative data, thereby facilitating a greater understanding of the knowledge, attitude, and perception of communities on wetland ecosystem services. Our study showed that a large proportion of individuals in the communities belong to households with low socioeconomic status, relying primarily on agriculture as their main source of income. According to the survey results, approximately 95% of households have an annual income of below 2850 USD, while 97% of these households consist of 2–10 members. Consequently, the average monthly income per person is below the recently established extreme poverty threshold of 2.15 USD per person per day [
46].
Nearly all community members were dependent on the wetlands in some form for sustenance attributable to the lower income and lack of employment opportunities. The communities also recognized the insufficiency of government agency participation in promoting wetland conservation awareness. In addition, the survey participants expressed their endorsement of the restoration of deteriorated wetland habitats. The communities possess knowledge of the wetland ecosystems and their associated benefits and believe that wetlands are indispensable for their sustenance. Communities within the landscape reap numerous services and benefits from the wetlands, and similar observations have been reported from various wetland-dependent communities globally, especially in South Africa, Uganda, Ethiopia, India, and Nepal [
1,
43,
47,
48,
49].
The findings of the study indicate that the primary factor contributing to increased dependence on wetlands is the lower income levels of households. This conclusion is based on an examination of various socio-economic and demographic factors, including gender, household size, education level, annual income, and primary livelihood. Various factors, including gender, educational attainment, and primary source of income, exerted significant influence on the knowledge, attitudes, and perceptions of wetlands among household respondents. This aligns with the conclusions drawn by Dalu et al. [
16], which indicate that individuals with higher levels of education were more likely to show better knowledge and attitudes towards wetlands. In contrast, gender emerged as a significant determinant in relation to the level of awareness regarding natural resources management and the involvement of communities in this process. The findings indicate that male participants exhibited a higher degree of awareness regarding such initiatives at the village level [
50]. The primary occupation of the household respondent was found to have an impact on their level of knowledge regarding natural resource management and their perception of fairness in accessing these resources [
50].
The Ecosystem Services Index (ESI) was employed as an evaluative metric to gauge the potential of diverse wetland areas in delivering ecosystem services to local communities. It was observed that the local communities attributed higher significance to regulatory services, with provisioning services closely trailing behind in terms of perceived value. These findings are in harmony with prior research conducted in different geographical contexts, which also indicated a tendency among communities to prioritize provisioning and regulatory services over cultural services [
42]. Specifically, regulatory services received the highest number of favorable benefits, followed by provisioning services. However, cultural services were not accorded a high priority in two of the selected wetlands. In the case of four out of the five wetlands examined, provisioning services such as the supply of water for human and livestock consumption were regarded as limited benefits. As per the ESI, the UCB’s wetlands provide numerous services encompassing, but not restricted to, the provisioning of food, fuel, fiber, timber, and medicinal plants, as well as playing significant roles in water and climate regulation and disaster mitigation. Notably, a positive correlation was discerned between higher income levels in the villages of Nar Myittar and Tharyarkone and a greater perception of ecosystem services (as measured by the Ecosystem Services Index total) provided by Wat lar Inn and Naung Sa Pin Inn. Furthermore, these ecosystems hold cultural and social significance for communities in Tharyarkone and Nar Myittar villages, demonstrating the linkage between social and ecological systems. Lamsal et al. [
43] found similar linkages between communities and Ghodaghodi wetland in Nepal.
The Khamti region in the present study reported a decline in fish catch, loss of diversity, and fragmentation of wetlands owing to high dependence on wetland ecosystems for subsistence and the use of unsustainable extraction methods. Similar threats to wetland ecosystems and biodiversity have been documented in Myanmar by various studies [
1,
2,
4,
27,
51,
52]. The significance of community support in mitigating these risks cannot be overstated, particularly because most of the population that inhabit rural regions are heavily dependent on natural resources for sustenance [
53].
The attitude of local communities plays a pivotal role in determining the success of wetland conversation and/or management initiatives. The results indicate that local communities exhibit strong support for participation, primarily owing to their strong association with the wetlands. However, this study highlights a need for further community awareness and training on the wise use of wetlands. Despite the significant ecological and economic values of wetlands and Myanmar’s status as a signatory to the Ramsar Convention, the country has not yet formulated a comprehensive wetland management strategy [
53]. The current situation in Myanmar indicates that government institutions, which are typically designated as legal custodians of wetlands, fail to provide adequate support to local communities in their effort to monitor and manage these vital ecosystems. The findings further indicate that participants were unaware of any conservation and management plans developed for wetlands in the basin. However, 73% were aware of natural resource management plans or initiatives, which were implemented either by government agencies or NGOs.
Murray et al. [
18] highlighted the clear need for localized management systems based on community-centered conservation to strengthen the conservation needs in Myanmar. Garnett et al. [
54] demonstrated that a significant proportion (40%) of ecologically intact landscapes and protected areas are primarily managed by local communities and/or indigenous populations. Armitage et al. [
55] presented principles for governing community-centered conservation with desirable and long-term ecological and social (equitable and just) outcomes. Furthermore, the Conservation of Biodiversity and Protected Area Law of Myanma [
56] provides the framework for local community-protected areas as a formal mechanism to safeguard community rights, promotes the sustainable socioeconomic development of communities, and ensures the sustainability of biodiversity conservation. Meanwhile, planning for the management of wetlands in UCB, prioritizing community needs, and enhancing their leadership role will be the key.
However, taking an integrated landscape approach is also important to restore and maintain the ecological integrity of wetlands in UCB. The reason is that most of the threats emerge owing to the interaction of landscape elements other than wetlands. The approach designed for the management of these wetlands should emphasize specific principles of continuous learning and adaptive management, common concern entry points, participatory and user-friendly monitoring, and enhanced stakeholder capacity [
16,
57] to effectively manage the tradeoffs between conservation and development and adequately address resource pressures [
57].
The survey findings also indicate that the respondents are inclined toward engaging in wetland conservation and restoration efforts, provided that the diversification of livelihood options is considered. Thus, the next step is to develop community-centered wetland management plans based on the previously highlighted principles, with an emphasis on bottom-up community-led strategies addressing the threats to wetlands, enhancing livelihood options, and maintaining the provision of wetlands ecosystem services [
18,
55]. Given the current governance challenges confronting Myanmar, the implementation of these strategies could offer a self-sustaining and cost-effective approach to wetland management in the region, with village committees at the core.
The case of Salween Peace Park in Myanmar provides an exemplary illustration of success, in which the adoption of a community-centric conservation strategy led to the allocation of a vast expanse of area over 5000 km
2 [
18]. The effectiveness of community-based conservation and management strategies relies on the benefits that communities receive from them, and their attitude can also influence their competencies and knowledge [
48]. Brooks et al. [
58] suggested that community-based conservation, which involves the proactive balancing of interventions with community expectations, is instrumental in achieving long-term conservation goals. The significance of community-based management is often regarded as a pivotal factor in the effectiveness of wetland conservation and restoration initiatives [
2].
In conclusion, it is imperative to acknowledge certain constraints inherent to this research. Firstly, the study’s scope was confined by restricted sample size due to COVID-19, exclusively focusing on the assessment of direct wetland utilization values. Additionally, the investigation concentrated solely on tangible wetland resources, thus omitting consideration of intangible resources, such as supportive and cultural significance, biodiversity preservation, and climate regulatory functions.


